
James W. Conroy
Temple University
Valerie J. Bradley
Human Services Research Institute
PDF Version: http://aspe.hhs.gov/daltcp/reports/5yrpenn.pdf (267 PDF pages)
This report was prepared under contracts #130-81-0021 and #130-81-00022 between the U.S. Department of Health and Human Services (HHS), Office of Social Services Policy (now the Office of Disability, Aging and Long-Term Care Policy) and Temple University. For additional information about the study, you may visit the DALTCP home page at http://aspe.hhs.gov/daltcp/home.htm or contact the office at HHS/ASPE/DALTCP, Room 424E, H.H. Humphrey Building, 200 Independence Avenue, SW, Washington, DC 20201. The e-mail address is: webmaster.DALTCP@hhs.gov. The DALTCP Project Officer was Ron Conley.
This project was supported by the U.S. Department of Health and Human Services under two contracts: #130-81-0022 and #130-81-0021. The views expressed herein are those of the authors and do not necessarily reflect the official position of the Office of Human Development Services, the Office of the Assistant Secretary for Planning and Evaluation or the U.S. Department of Health and Human Services.
TABLE OF CONTENTS
- CHAPTER 1: INTRODUCTION
- Background of the Study
- Organization of the Report
- CHAPTER 2: HISTORY
- Introduction
- An Introduction to the Litigation and Court Ordered Reform
- Another Ruling and An Opportunity for Agreement
- Relationships Deteriorate and the Court Asserts its Authority
- Community Placements Pick Up Steam Amidst Legal Confrontations
- Cooperation Prevails but Fiscal Uncertainties Lie Ahead
- Enforcement Mechanism Ordered to be Phased Out Despite Failed Negotiations
- Key Events During the Final Two Years of the Study and Beyond
- CHAPTER 3: IMPLEMENTATION ISSUES
- Year 1 -- Office of the Special Master
- Findings
- Year 2 -- Reaction of the Pennsylvania Department of Public Welfare
- Issues Affecting Complex Decrees
- Findings
- References
- CHAPTER 4: GROWTH AND DEVELOPMENT
- Introduction
- Methods: General
- Methods: Marched Comparison Study
- Results: Matched Comparison Study
- Methods: Longitudinal Study
- Results: Longitudinal Study
- Discussion
- References
- CHAPTER 5: CONSUMER SATISFACTION
- Introduction
- Methods
- Results
- Discussion
- References
- CHAPTER 6: QUALITY OF ENVIRONMENTS
- Introduction
- Methods: Institution to Community
- Results: Institution to Community
- Methods: Within the CLAs
- Results: Within the CLAs
- Discussion
- References
- CHAPTER 7: FAMILY IMPACTS
- Introduction
- Methods
- Results
- Discussion
- References
- CHAPTER 8: NEIGHBOR ATTITUDES
- Introduction
- Methods
- Results: Baseline Survey
- Results: After CLA Openings
- Discussion
- References
- CHAPTER 9: COMPARATIVE ANALYSIS OF THE COSTS OF INSTITUTIONAL AND COMMUNITY SETTINGS
- Study Objectives and Limitations
- Method
- Finding and Discussion
- Policy and Research Implications
- CHAPTER 10: FINAL IMPLEMENTATION ANALYSIS
- Overview
- Competing Claims
- Areas of Potential Impact
- References
- CHAPTER 11: SUMMARY AND RECOMMENDATIONS
- Introduction
- Findings of the Quantitative Studies
- Implementation Issues
- Discussion
- Recommendations
- APPENDICES
- APPENDIX 2-1: Overview of the State, the Region and the Counties
- APPENDIX 4-1: Behavior Development Study
- APPENDIX 5-1: Consumer Interviews Questionnaire
- APPENDIX 7-1: Baseline Family Questionnaire With Distribution of Responses to Each Item
- APPENDIX 7-2: Post Relocation Family Questionnaire
- APPENDIX 8-1: Neighbor Attitudes Questionnaire
- List of Publications
- LIST OF EXHIBITS
- EXHIBIT 2-1: Department of Public Welfare Regions
- EXHIBIT 2-2: Population Trends at Pennhurst Center (1966-1984)
- EXHIBIT 2-3: Major Court Orders
- EXHIBIT 4-1: Population of Public Institutions
- EXHIBIT 4-2: BDS Data Collection
- EXHIBIT 4-3: Adequacy of Matching
- EXHIBIT 4-4: Behavior Changes Among Movers and Stays
- EXHIBIT 4-5: Hours of Service Per Month Report in 1983
- EXHIBIT 4-6: Correlates of Adaptive Behavior Gains Among Movers
- EXHIBIT 4-7: Comparison of Movers’ Characteristics to Those of the Original Population of 1154 People
- EXHIBIT 4-8: Longitudinal Results: Adaptive Behavior
- EXHIBIT 4-9: Adaptive Behavior Growth: 5 Observations, 92 People
- EXHIBIT 4-10: Adaptive Behavior Growth: 4 Observations, 176 People
- EXHIBIT 4-11: Longitudinal Results: Maladaptive Behavior
- EXHIBIT 4-12: Hours of Service Per Month Reported at Pennhurst in 1980 and in CLAs in 1984
- EXHIBIT 5-1: Disposition of the Consumer Interviews Sample
- EXHIBIT 5-2: Acquiescence and Nay-Saying, Pre and Post
- EXHIBIT 5-3: Movers’ Satisfaction with Where They Live
- EXHIBIT 5-4: Summary of Movers’ Reliably Expressed Satisfaction Before and After CLA Placement
- EXHIBIT 5-5: Changes on Smile Scale Items After Relocation
- EXHIBIT 5-6: Summary of Stayers’ Reliably Expressed Satisfaction in 1980 and in 1984
- EXHIBIT 5-7: Changes on Smile Face Scale Items Among Stayers, 1980-1984
- EXHIBIT 6-1: Average Normalization and RMS Scores for Institution and Community by County
- EXHIBIT 6-2: Associations Between Environmental Measures and Individual Growth Within CLAs
- EXHIBIT 6-3: Partial Correlations Between Environmental Measures and Individual Growth Within CLAs, Controlling for 1983 Adaptive Behavior
- EXHIBIT 7-1: Medical Needs as Perceived by Families and by Facility Staff
- EXHIBIT 7-2: Demographic Characteristics of Families
- EXHIBIT 7-3: Initial Attitudes: ATDS Scale
- EXHIBIT 7-4: Agreement with Community Placement
- EXHIBIT 7-5: Expected and Perceived Changes in Family Life
- EXHIBIT 7-6: Change in Relative’s General Happiness
- EXHIBIT 7-7: Agreement with Specific Ideas
- EXHIBIT 8-1: Would Neighbors be “Bothered?”
- EXHIBIT 8-2: Neighbors’ Beliefs About Effects on Property Values
- EXHIBIT 8-3: Attitudes Toward Different Groups
- EXHIBIT 8-4: Neighbor Attitudes Before and After
- EXHIBIT 8-5: Self-Reported Attitude Changes
- EXHIBIT 8-6: Feelings About Real and Imaginary CLA
- EXHIBIT 10-1: Per Capita Allocation of State Funds for Community Services by Region
- EXHIBIT 10-2: Dollars Spend Per Year Per Mentally Retarded Person Served by Region
- EXHIBIT 10-3: Pennsylvania -- Eight Year Total MR/DD Expenditures by Revenue Source: FY 1977-1984
- EXHIBIT 10-4A: CLA Cost Per Diem by Region: 1979 through 1983 in Unadjusted Dollars
- EXHIBIT 10-4B: CLA Cost Per Diem by Region: 1979 through 1983 in FY 80 Dollars
- EXHIBIT 10-5: Rate of Change in Residential Census in State Centers and Mental Retardation Units
- EXHIBIT 10-6: Population in State Institutions and Number of CLA Beds Per 100,000 by Region -- 1977-1978 and 1983-1984
- EXHIBIT 10-7: Number of CLA Beds by Region: 1977-1984
- EXHIBIT 10-8: PLF Beds Per 100,000 for FY 1981-84
- EXHIBIT 10-9: Institutional, CLA & PLF Beds by Region Per 100,000 of Population for FY ‘84
- EXHIBIT 10-10A: Per Diems in State Centers for the Mentally Retarded: 1977-1978 and 1973-1984
- EXHIBIT 10-10B: Per Diems in State Centers for the Mentally Retarded: 1977-1978 and 1983-1984 in FY ’78 Dollars
- EXHIBIT 11-1: Adaptive Behavior Growth
- EXHIBIT 11-2: Agreement with Community Placement
PROJECT STAFF
Temple University
James W. Conroy, Principal Investigator
Celia S. Feinstein, Director of Case Studies, Tracking, and Environmental Assessment
James A. Lemanowicz, Senior Data Analyst
Robert R. Walsh, Director of Client Satisfaction Study
Human Services Research Institute
Valerie J. Bradley, Principal Investigator
John W. Ashbaugh, Director of Cost Study
Mary Ann Allard, Senior Analyst
The Recommended Citation for this publication is:
Conroy, J.W., & Bradley, V.J. (1985). The Pennhurst Longitudinal Study: A report of five years of research and analysis. Philadelphia: Temple University Developmental Disabilities Center. Boston: Human Services Research Institute.
Additional copies of this publication may be obtained postpaid at $15 per copy, check payable to Temple University, from:
Temple University
Developmental Disabilities Center
9th Floor, Ritter Hall Annex
Philadelphia, PA 19122
Attn: Kathy Ann Baus
ACKNOWLEDGMENTS
The Temple and Human Services Research Institute research team would like to recognize the enormous contributions of the National Advisory Council for this study and of the Pennhurst Study Work Group. The five years of commitment from the members of these groups helped immeasurably to enhance and maintain the integrity of the study.
The members of the National Advisory Council were Dr. David Braddock, Dr. Robert Bruininks, Dr. William Datel, Ms. Irene Dixon, Mr. Robert Gettings Dr. Jack Noble, and Dr. Wayne Smith.
The members of the Pennhurst Study Work Group were Mr. Michael Bennett (Pennhurst Implementation Team), Mr. Michael Lottman (Hearing Master), Ms. Carla Morgan (Special Master), Dr. Russell Rice (Regional Commissioner for Mental Retardation, Southeast Region), Ms. Margaret Rubin (Pennsylvania Developmental Disabilities Planning Council), and Ms. Vicki Stillman-Toomey (Director of Pennhurst Implementation Team).
The federal officials in the Department of Health & Human Services who conceived of this project and followed its progress for five years deserve a large part of the credit for its success. Among them were Mr. John McCann, Dr. Ronald W. Conley, Dr. Jack Noble, Mr. William Crunk, Mr. John DeWilde, Mr. Ed Marcus, and in the final years of the study, Ms. Eileen Bradley, Mr. Edward Vreeswyk, and Ms. Ann Schoonmaker,
Several state officials also provided indispensable support, cooperation and assistance: Mr. Gregory Pirmann (Pennhurst Center), Mr. George Kopchik (Pennhurst Center), and Dr. Jennifer Howse (Office of Mental Retardation).
This report is dedicated to the 1154 people who lived at Pennhurst Center on March 17, 1978.
DEPARTMENT OF HEALTH AND HUMAN SERVICES
Office of Human Development Services, Region III
3535 Market Street
Philadelphia, Pennsylvania 19104
March 1, 1985
The Pennhurst Longitudinal Study was a five-year, in-depth review of the effects of the court-ordered deinstitutionalization of Pennhurst residents. Its aim was to provide federal and state officials and others with information to make better policy decisions regarding the processes related to the deinstitutionalization which is underway in many parts of the country. Federal planners, recognizing the significance for clients, families, communities, and states of Judge Broderick's and other similar actions, decided in 1979 to launch this five-year study.
This project was unique in several respects; perhaps most importantly as a joint endeavor among the Region III Office of Human Development Services, the Assistant Secretary for Human Development Services, the Assistant Secretary for Planning and Evaluation, and the Commissioner of the Administration on Developmental Disabilities, as well as the Deputy Secretary for Mental Retardation in the Commonwealth of Pennsylvania.
The study has yielded considerable information which is not only valuable to other researchers, but also instructive to legislators, judges, and federal, state and local program administrators and policy makers. We commend the foresight of the initiators of the project and the dedication of those who completed it. In addition, we acknowledge the thoughtful contributions of the Pennhurst Study Advisory Committee and Work Group.
Eileen Bradley
Regional Administrator
CHAPTER 1: INTRODUCTION
Background of the Study
When United States District Court Judge Raymond Broderick issued his opinion in the Halderman v. Pennhurst State School and Hospital case in 1977, it was considered the most far-reaching legal event in the field of mental disabilities to date. Unlike other federal judges who had primarily focused their attention on the improvement of institutional settings, Broderick ruled that Pennhurst State School and Hospital was incapable of providing constitutionally appropriate care and habilitation. This finding led him to conclude that the residents of Pennhurst, those on the waiting list to the institution, and any other mentally retarded person in the community "at risk" of institutionalization at Pennhurst should be provided services in less restrictive settings in the community.
Following Broderick's ruling and the issuance of his decree in March, 1978, plaintiffs in 20 other states began the process of seeking similar relief. Recognizing the potential national significance of the Pennhurst case, leadership in the Department of Health and Human Services (DHHS) -- specifically in the Office of the Assistant Secretary for Planning and Evaluation (ASPE), and the Region III (Philadelphia) office of Human Development Services (OHDS) -- decided to support a five year longitudinal study which would:
- measure the relative growth of residents in the institution and in the community in order to determine the impact of relocation on mentally retarded persons;
- assess the impact of deinstitutionalization on the families of retarded persons and on the communities in which they live;
- compare the costs of providing services in the institution to those in community settings;
- assess the legal history of the Pennhurst case;
- address significant issues growing out of the implementation of the district court decree.
The main value of the study has been its utility in providing DHHS, state, and court officials with information on which vital short and long term policy decisions can be made. From the initial conception of the project, the Pennhurst Longitudinal Study has been a partnership involving the Commonwealth of Pennsylvania, the court, ASPE, and OHDS Region III. Further, because of the information needs of the Office of the Special Master and the Pennsylvania Office of Mental Retardation, their representatives also participated in the original design and in the ongoing oversight of the project. In addition to direction provided by the DHHS project officers, the Pennhurst Study Work Group was also established to ensure the study's continued relevance. Member of this group include representatives of the Special Master, the Hearing Master, the Office of Mental Retardation, the Pennsylvania Developmental Disabilities Council, and the Region III Developmental Disabilities Office.
Further, in order to ensure the national relevance of materials emerging from the Pennhurst Longitudinal Study, an Advisory Committee was appointed. The Committee is comprised of national experts in the field of mental retardation, a representative of the national organization of state mental retardation commissioners, and others interested in the general area of litigation and deinstitutionalization..
The Longitudinal Study, which is being conducted as a collaborative effort by the Temple University Developmental Disabilities Center in Philadelphia and Human Services Research Institute in Boston, is divided into three major parts:
-
Impact on Clients and Communities (Temple University)
This portion of the study involved monitoring trip developmental progress of the study population, the services they received, the quality of their living environments, and the level of their satisfaction -- both at Pennhurst and after relocation to the community. This segment also included an assessment of the impact of deinstitutionalization on families of clients, both in anticipation of the action to be taken under the decree and following the actual relocation, and the attitudes of others in clients' local communities both before and after deinstitutionalization. Included in this study component were case studies of several Pennhurst residents which provide a more in-depth exploration of the impact of the case on particular individuals.
Briefly, the study population had the following characteristics:
- Average age: 39 years
- Average years institutionalized: 24
- Level of disability: 86% severely or profoundly disabled
- Other disabilities: 40% displayed physical violence toward others; slightly more than 50% non-verbal
- Sex: 64% male
-
Impact on Costs (Human Services Research Institute)
The results of this portion of the study include an assessment of the costs and cost configurations of services provided both at Pennhurst and in community settings. For as many service categories as possible, average cost per unit of service at Pennhurst and in the community were calculated. These service unit costs were applied to the reported units of service received by individual clients. From this, the staff derived estimates of total costs for each relocated client, as a function of how much service the client actually received.
-
History and Implementation Analyses (Human Services Research Institute)
This study area included a continually updated historical account of the implementation of the Pennhurst decree and the events surrounding the litigation for the first three years of the study. In the course of these assessments, the actions and intentions of policy makers were highlighted. Further, the interrelationships among events and key system actors are chronicled and the implications for state and federal policy were explored. In addition, four aspects of implementation were singled out during the course of the study for extensive investigation and analysis.
Organization of the Report
This final report of the results of the Longitudinal Study integrates qualitative, quantitative, and cost findings into one comprehensive report in order to facilitate a review of the varied strands of evidence generated by both Temple University and Human Services Research Institute. The material is organized as follows:
-
Chapter II -- History of the Case
This chapter provides a summary of the six Historical Overviews prepared during the first three years of the Longitudinal Study. It is organized chronologically, with special sections on legal developments, Pennhurst-related developments, and general system developments at each historical stage. The chapter concludes with a brief summary of events for the last two years.
-
Chapter III -- Implementation Issues
This chapter summarizes three of the implementation issues that have been addressed in depth during the course of the project. The first topic is the Special Master mechanism employed by the federal court to monitor and enforce the Pennhurst decree. The second area focuses on the actions and reactions of the state defendants in the case as contracted with those of state defendants in other suits around the country. The third analysis is a multi-state assessment of limitations and constraints to the implementation of court decrees.
-
Chapter IV -- Growth and Development
This chapter describes the results of the systematic assessment of client growth and development among the study population both at Pennhurst State Center and in the community. Chapter IV through Chapter VIII represent the findings from the quantitative studies. Four of the five chapters are introduced by a digest from one of the project's case studies.
-
Chapter V -- Consumer Satisfaction
This chapter presents the results of surveys of clients in the study population to determine their level of satisfaction with their surroundings both in the institution and in the community.
-
Chapter VI -- Quality of Environments
This chapter reports the findings of surveys of client environments both at Pennhurst and in the community.
-
Chapter VII -- Family Attitudes
This chapter concentrates on the responses of families to the process of deinstitutionalization and focuses on changes in their attitudes over time.
-
Chapter VIII -- Neighbor Attitudes
This chapter discusses the results of surveys of neighbors of the clients in the study population both before and after community living arrangements were developed.
-
Chapter IX -- Comparative Cost Analysis
This chapter describes the comparative costs of the provision of services at Pennhurst Center and in the community.
-
Chapter X -- Impact of Court-Ordered Change
This chapter, which is also the fourth and final implementation analysis, explores ten questions regarding the impact of the Pennhurst case on the mental retardation system in Pennsylvania. It draws together quantitative, qualitative, and cost findings in order to shed light on the issues.
-
Chapter XI -- Policy Implications
This final chapter summarizes the larger policy questions that have been uncovered by the study and offers suggestions for future planning and policy development.
Where appropriate, instruments used to collect information are included in the Appendix to the report.
CHAPTER 2: HISTORY
Introduction
As part of the longitudinal evaluation of the Halderman v. Pennhurst case, a series of Historical Overview reports was prepared in order to chronicle key events surrounding the implementation of the court decree and to analyze the roles of various actors in the implementation process, Since 1980, a total of six Overview reports were prepared -- one every six to eight months (in the last two years of the study, the Overviews were replaced by brief updates). The historical analyses describe the major activities surrounding the implementation of the decree, and assess the constraints and limitations on such actions. The reports also characterize the influence that the litigation had on the general service system and, conversely, how general system factors affected the requirements of the decree.
In preparing for each Overview report a number of data gathering activities were conduted. In addition to reviewing relevant legal documents, state reports and regulations, and other materials, staff interviewed a cross section of key actors in the state including county, provider, state, legal and consumer representatives.
Each Overview report corresponded to a specific time period during which certain key events concerning the decree transpired. The first Overview was somewhat different from subsequent reports because it set the stage for ensuing analyses. As such, it served two major functions: (1) to describe the context in which the litigation was brought; and (2) to highlight those activities that took place immediately after Judge Broderick arrived at his decision in December 1977. All other phases in the historical analysis of the Pennhurst case are presented in three parts: legal activities, Pennhurstspecific activities, and general system developments.
An Introduction to the Litigation and Court Ordered Reform
Some of the key background elements reviewed in the first historical account included the following:
-
Overview of the study area -- The history and characteristics of the Southeast Region of Pennsylvania (Philadelphia, Bucks, Delaware, Montgomery and Chester Counties) were described and the history of Pennhurst Center was presented. As map of the Department of Public Welfare regions is included in Exhibit 2-1, and the population trends at Pennhurst State Center are described in Exhibit 2-2. A detailed discussion of the social and economic characteristics of the state, the region, and the five counties is included in the appendix.
-
Legal history of the litigation -- Similar litigation in the field of mental disabilities was reviewed and compared and contrasted with the Pennhurst case; the use of public law litigation as a tool of social reform was also analyzed.
-
Events leading up to the suit -- A brief account of the rationale for the Pennhurst suit was summarized including the early expose of conditions at the state center, the pivotal role of the Pennsylvania Association of Retarded Citizens, attempts by the state to upgrade Pennhurst and create alternatives in the community, and finally the filing of the suit by David Ferleger on May 30, 1974 on behalf of Terri Lee Halderman for both injunctive relief and money damages. The complaint was later amended when PARC intervened in the suit; money damages were dropped from the remedy and the five Southeast Pennsylvania counties as well as the state were named as defendants in the suit.
-
Legal arguments made and the remedies sought -- The plaintiffs argued that both constitutional and statutory law guarantees mentally retarded persons a right to habilitation and a right to receive services in the least restrictive setting. Moreover, the plaintiffs maintained that Pennhurst was incapable of ensuring the rights of mentally retarded persons because of deplorable conditions. The remedy sought was the ultimate closure of the facility and the movement of residents to less restrictive community-based services. The state did not significantly contest the facts presented by the plaintiffs but asserted that the proposed remedy went beyond the powers of the courts. The Judge's attempt to get all parties to agree to a form of relief failed and he proceeded to fashion one of the most complex decrees in the field of mental disabilities litigation.
-
State mental retardation system -- Certain general characteristics of Pennsylvania's mental retardation system were described including such factors as the state/county partnership arrangement, the influence of 1966 MH/MR Act, and the growth of community living arrangements. The influence of these factors on the implementation of the court ordered reforms was assessed.
-
Specific litigation activities within the mental retardation framework -- In addition to the organizational aspects of Pennsylvania's mental retardation system, the court's requirements were reviewed. The responsibilities of the Office of the Special Master (OSM) -- the court's primary enforcement mechanism -- were described, including the way in which the court orders would be monitored, and planning and resource development would be conducted. (A summary of the major orders that make up the decree is included in Exhibit 2-3).
EXHIBIT 2-1. Department of Public Welfare Regions

| Date | Clients on Books | Clients in Residence | Admissions | To “Normalized” Environments* | Transfers | Deaths |
|---|---|---|---|---|---|---|
| SOURCE: J. Gregory, Pirmann, Pennhurst Center, 1985. * Normalized environments include group homes/apartments, family care program, return to family, independent living, etc. | ||||||
| 1966 | 3071 | 2864 | 51 | 57 | 22 | 53 |
| 1967 | 2979 | 2778 | 45 | 43 | 22 | 56 |
| 1968 | 2761 | 2300 | 48 | 77 | 338 | 54 |
| 1969 | 2653 | 2029 | 94 | 184 | 158 | 61 |
| 1970 | 2534 | 1893 | 75 | 237 | 12 | 39 |
| 1971 | 2414 | 1780** | 92 | 169 | 49 | 40 |
| 1972 | 2217 | 1704 | 90 | 63 | 79 | 21*** |
| 1973 | 2047 | 1584 | 89 | 116 | 142 | 28 |
| 1974 | 1718 | 1488 | 75 | 97 | 84 | 23 |
| 1975 | 1619 | 1424 | 81 | 49 | 85 | 20 |
| 1976 | 1545 | 1399 | 46 | 35 | 22 | 17 |
| 1977 | 1448 | 1322 | 20 | 61 | 17 | 16 |
| 1978 | 1257 | 1211 | 1 | 76 | 1 | 26 |
| 1979 | 1170 | 1145 | -- | 43 | 1 | 18 |
| 1980 | 964 | 927 | -- | 38 | 155**** | 17 |
| 1981 | 912 | 857 | -- | 85 | 1 | 12 |
| 1982 | 817 | 669 | -- | 177 | -- | 11 |
| 1983 | 676 | 592 | -- | 69 | -- | 8 |
| 1984 | 576 | 399 | 1 | 180 | 5 | 9 |
| EXHIBIT 2-3. Major Court Orders | |||
|---|---|---|---|
| “Original Order” (March 17, 1978) Judge Broderick’s initial order included the following requirements:
| |||
| Order for the Interim Operation of Pennhurst (March 5, 1979) This order includes the following requirements:
| |||
| “Employee Order” (April 1979) This portion of the decree established an Office of Employee Services as part of the Office of the Special Master. The Office was created in order to provide counseling and guidance to those employees of Pennhurst State Center who lost jobs because of court-mandated deinstitutionalization. The order also included a schedule for the ultimate closure of the institution. This order was nullified by the circuit court on December 13, 1980. | |||
| “Children’s Order” (June 8, 1979) This order requires the following:
| |||
| “Hearing Master Order” (April 24, 1980) This order, which was necessitated by the ruling by the Third Circuit, mandated the following:
This order was subsequently modified to give the Hearing Master responsibility for determining the “voluntariness” of all placements out of Pennhurst pursuant to the Supreme Court stay. | |||
| “Implementation Order” (March 2, 1982) This order included the following directives:
| |||
| “Consolidated Order” (August 26, 1983) This order consolidated and updated the previous orders and added the following provisions:
| |||
| “Final Settlement in Halderman v. Pennhurst” (July 12, 1984) The following are the major points included in the agreement reached between the plaintiffs and the defendants:
| |||
What emerged in this analysis is a picture of an already complex system beset with the usual array of structural and political problems, and faced with meeting the very specific and immediate mandates of a complicated and far-reaching court decree. The weight of the discussion provided a view of both the limitations of judicial intervention in the area of mental retardation and the ways in which litigation can shape the course of reform in this field. It further highlighted the unique position of the Office of the Special Master in an ongoing state statutory, regulatory, and political environment.
In assessing the progress of implementation of the decree during this phase (which concluded in early December 1979), it is safe to say that the major constraint to compliance was the defendants' unwillingness to accept the results of the district court decree. Such resistance was manifest in continue appeals and a hope that Judge Broderick's decision would ultimately be overturned. This posture made it extremely difficult to secure the planning and funding commitments necessary to begin the movement of resident out of Pennhurst in the numbers envisioned in the original order. This singular fact, unlike aspects of litigation in other states where consent decrees have been signed, made the case and its implementation during this period, unique.
Other factors that influenced implementation were primarily derivative of larger system problems that would have constrained any major deinstitutionalization activity. They include the following:
- Restrictions in the state's mental health and mental retardation statute that limited the development of community residences to three person homes;
- A lack of cooperation and participation in resource development from other state funding agencies such as the Bureau of Vocational Rehabilitation and the housing finance agency;
- The absence of any regional planning or funding mechanism in the state mental retardation system capable of consolidating and funding highly specialized and expensive services for more disabled individuals;
- No comprehensive plan for the use of ICF/MR (Title XIX) funds in the community which would free up state funds for the expansion of community-based living arrangements;
- Limited development of back-up resources for the support of severely mentally retarded persons living in the community;
- Turn-over in staff in the community living arrangement (CLA) program at an average rate of once every six-months -- a phenomenon that adds costs and creates instability in the minds of some observers;
- No mechanism in the state to ensure an orderly transfer of state employees from institutional to community-based settings;
- No comprehensive standards for CLAs.
Additionally, there were constraints that were peculiar to the litigation:
-
Given legal doctrine in the field, it is difficult if not impossible to force a state legislature to appropriate funds to implement the decree.
-
Current structural, organizational and political problems surrounding the relationships between the Office of the Special Master and the defendants constrained an easy and mutually trusting relationship.
-
There were no officially recognized county plans to guide the implementation of the decree in the Southeast Region.
-
The nature of the individual planning process on behalf of Pennhurst residents was long and tedious and resulted in numerous delays that purportedly discouraged the participation of some local providers.
-
The addition of Pennhurst case managers at the county level, while accepted in some counties, caused consternation and resistance in other counties.
-
The implementation of the Employee Order was constrained by the inability ot OSM to secure job placements and training resources.
-
The role of OSM with respect to planning caused duplication and confusion and removed accountability from the state and the counties.
Another Ruling and An Opportunity for Agreement
(December 1979-July 1980)
Legal Developments. On December 13, 1979, the United States Court of Appeals for the Third Circuit issued its en banc opinion in the Pennhurst case. In a six to three decision, the court affirmed certain aspects of Broderick's decree and negated others. The three areas that were eliminated included: 1) the requirement that alternative employment be found for all Pennhurst employees; 2) the presumption that Pennhurst would eventually close; and 3) the portion of the decree banning all admissions to Pennhurst. The core of the decision was affirmed, however, since the court supported the community presumption.
With the appeals court decision in hand, there was an opportunity for the parties to negotiate a settlement. The appointment of Dr. Jennifer Howse, former director of the Willowbrook Review Panel in New York, generated optimism among the plaintiffs that agreement could be reached. Given her past position, Dr. Howse was seen as an aggressive and articulate spokesperson for the interests of mentally retarded persons.
Negotiations began early in 1980 and continued for several months. The major area of disagreement among the parties was the ultimate role of Pennhurst. Specifically, discussions focussed on how many persons should be considered part of the class and, therefore, eligible for community placement. After several proposals from both sides, there was still no consensus on the magnitude of placement.
OMR staff maintained that the sticking point was a disagreement regarding the speed of CLA development and client movement, while the plaintiffs asserted that discussions broke down both over the placement schedule and system improvement. Given the high hopes of each side, the inability to reach agreement left the parties with a great deal of bitterness and ill feeling. Each side felt that its position had not been respected and blamed the other for the ultimate failure of the discussions.
During the negotiations, Judge Broderick revised his original order to conform with the changes made by the court of appeals. The changes narrowed the scope of his original order and placed additional emphasis on the individual rather than the collective aspects of the remedy. Included among the changes in his order was the termination of the Office of Employee Services (OES) -- a unit that had been established at Pennhurst to ensure the protection of institutional employees. Upon termination of the OES, the Office of the Special Master (OSM) issued a special report outlining the multiple problems involved in finding alternative employment for Pennhurst employees.
Broderick also created the Hearing Master. The Hearing Master was directed to conduct individual reviews involving contested institutional discharges and where instititutional admissions were being sought on behalf of a class member. In filling this critical position Judge Broderick selected Michael Lottman, an attorney with broad background in the field of mental disabilities.
Finally, Judge Broderick allowed the Parent-Staff Association -- a group of anti-deinstitutionalization parents and Pennhurst employees -- to intervene in the litigation. This move further fragmented the case by introducing a group that was neither supportive of the plaintiffs nor entirely supportive of the defendants. Moreover, the Parent-Staff Association was receiving (and continues to receive) financial support from the American Federation of State, County and Municipal Employees (AFSCME), a powerful union with similar interests in maintaining institutions.
Following the court of appeals decision and the collapse of the negotiations, the defendants, and the Parent-Staff Association had to decide whether or not to pursue the case in the U.S Supreme Court. Each group had different motives for seeking certiorari, and some were reluctant about taking such an important test case to the Supreme Court. In the end, however, all parties sought review.
On June 9, 1980, the Supreme Court agreed to take the Pennhurst case. In granting certiorari, the Court agreed to hear arguments in four areas: the ability to enforce a private right of action either under the Developmental Disabilities (DD) Act or under general or federal civil rights provisions; the ability of the DD Act to support the breadth of the remedy in the Pennhurst case; the ability of the state Mental Health and Mental Retardation Act of 1966 to support the Pennhurst case; and the extent to which federal courts can intervene in state affairs. In addition to granting certiorari, the Court granted a partial stay prohibiting "involuntary" discharges from Pennhurst. Although there were several different interpretations of the Court's partial stay, in the end, Judge Broderick issued an order directing the Hearing Master to schedule a hearing for each Pennhurst resident for whom a community living arrangement had been prepared. The purpose of the hearing was to determine whether or not the transfer of Pennhurst clients to the community was in fact voluntary"
Pennhurst-Related Developments. Shortly after her arrival in Pennsylvania, Dr. Howse created the Pennhurst Implementation Team (PIT). The major responsibilities of the PIT included: serving as a liaison to OSM and other key actors; providing continuity between the policies developed for Pennhurst and the Southeast Region, and statewide policies; and ensuring that any positive benefits growing out of the litigation were expanded statewide. One of the first tasks taken on by the PIT team was the preparation of a staffing study at Pennhurst Center that recommended the addition of 107 direct care staff at a cost of $11 million. The relationship of the PIT to the Master's Office was complicated by the negative feelings surrounding the failed negotiations, and a growing polarization between the state and OSM staff regarding implementation of the court decrees.
One of the key concerns of the PIT and other OMR staff during this time was resource development for the Southeast Region. Though the Commonwealth's proposed implementation order showed 150 community placements for Pennhurst residents and another 100 slots for class members in the community by 1981, only 65 CLA slots were actually projected by OMR for "Phase I" of annual placement activity for Pennhurst residents. "Phase 2" included an unspecified number of placements as a result of the initiation of a community-based ICF/MR program.
Judge Broderick was not satisfied with the projected placements and circulated an implementation plan of his own in the form of a proposed order. The proposed order included movement of 150 Pennhurst residents to the community, the creation of 150 CLA beds for community class members and the movement of 150 out-of-region Pennhurst residents. State defendants criticized the order because it was unrealistic given the existing system capacity.
During this period the attorney for the original plaintiffs, David Ferleger, raised serious questions regarding suspicious deaths at Pennhurst State Center. The Commonwealth responded by commissioning a study by outside consultants regarding medical practices at the institution. The issues of adequacy of medical practices and resident abuse and neglect at Pennhurst were among the key areas to be monitored by OSM staff. Despite a rocky start, OSM monitoring activities and subsequent reports were accepted by Pennhurst staff and ultimately led to certain reforms and policy changes at the institution.
General System Developments. In addition to bringing on new staff to OMR, Dr. Howse also developed a reorganization plan for the office immediately after her arrival. One of the major organizational changes was the creation of a unit to oversee the development of community-based intermediate care facilities for mentally retarded persons (ICF/MRs). The new unit prepared a proposal for the development of small ICF/MRs as part of Pennsylvania's Title XIX plan of compliance. Regional Health Care Financing Administration (HCFA) staff had numerous reservations about the small ICF/MR proposal. Despite the reservations of the Federal Regional Office, OMR staff began to develop a plan to operationalize the ICF/MR program. In the initial planning stages, there was no special focus on the Southeast Region and the community placement requirements of the Pennhurst case.
Relationships Deteriorate and the Court Asserts its Authority
(August 1980-March 1981)
Legal Developments. Up to the Summer of 1980, the Halderman v. Pennhurst case had been characterized by numerous appeals, stalemates and continuing confrontation among the parties. The ensuing period was much the same. The U.S. Supreme Court heard oral argument on the circuit court decision in Pennhurst, Judge Broderick signed an implementation order covering movement of class members into community living arrangements for the ensuing two fiscal years, and two related cases -- Romeo v. Youngberg and In Re Joseph Schmidt -- were decided.
As noted in the previous section, Judge Broderick interpreted the Supreme Court's stay to mean that no one could be moved from Pennhurst unless the transfer was "voluntary." The Parent/Staff Association, the group that originally requested the stay, disagreed with the Judge's interpretation and on November 4, 1980 went again to the Supreme Court to renew its request for stay and to ask that Judge Broderick suspend implementation of the decree. The state but not the counties also joined in the request. The Supreme Court denied the request immediately prior to the oral argument on the Pennhurst case.
On December 8, 1980, the Supreme Court heard arguments on the Pennhurst case. The primary focus of the oral argument on both sides focussed on whether the Developmental Disabilities Act supported the comprehensive remedy ordered by Judge Broderick. The defendants (petitioners) maintained that the Developmental Disabilities Act rested solely on the general spending power granted in Article I, Section 8, of the Constitution. Though the petitioners differed among themselves regarding the extent of federal enforcement authority under the Act, they all maintained that no substantive rights had been conferred by Congress. The plaintiffs (respondents) argued that Congress specified substantive due process and equal protection rights under the Fourteenth Amendment.
A week before the Supreme Court argument, the U.S. Court of Appeals for the Third Circuit rendered an en banc decision in the Romeo v. Youngberg case. The suit, which was originally filed in the federal district court in 1976, involved a profoundly retarded resident of Pennhurst State Center. While confined at Pennhurst, Romeo was injured on over 70 occasions either by injuries that were self-inflicted or the result of attack by other residents. The action was brought on behalf of Romeo by his mother who sought compensatory and punitive damages from the defendants because of violations of the resident's Constitutional rights under the Fourteenth and Eighth Amendments.
The plaintiffs lost in the federal district court but appealed the decision citing irregularities in the trial and in the Judge's instructions to the jury. In its ruling, the circuit court remanded the case back for a new trial noting that the district court, in an effort to distinguish the suit from a malpractice case, adopted a standard that was too rigorous in the context of a civil action. The circuit court proposed alternative jury instructions and requested the lower court to reconsider its earlier exclusion of expert medical testimony. Although Romeo won a favorable judgment in the circuit court, other legal hurdles remained before money damages could be awarded. In the meantime, the state defendants petitioned the U.S. Supreme Court for a writ of certiorari.
Another significant case, In Re Joseph Schmidt, was decided by the Pennsylvania Supreme Court. The case arose when the Allegheny County mental health and mental retardation administrator requested that Joseph Schmidt be committed to Western State Center. The Commonwealth intervened asserting that the Center was not an appropriate residential arrangement as required by the Mental Health and Mental Retardation Act of 1966. The lower court ruled that the responsibility for finding an appropriate placement for Schmidt was at the county level. The county appealed to the state supreme court asking for a clarification of which unit of government, the county or the Commonwealth has the responsibility to develop long term residential care. The state supreme court found that the 1966 Act created a right to care in the least restrictive environment and that the responsibility for such care rested with the Commonwealth.
On March 2, 1981. Judge Broderick signed an implementation order setting a placement schedule for Pennhurst class members. Many of those interviewed for the project were perplexed that Broderick chose this period to issue the order given the imminence of the Supreme Court decision. Several observers speculated that the Judge had become increasingly frustrated by the pace of movement of individuals out of Pennhurst and was concerned that resources that had been allocated for placement would revert to the state general fund.
The Judge ordered that, from March 2, 1981 to June 30, 1981, the Commonwealth develop 61 community living arrangements for Pennhurst residents (not covered by the children's order) and 9 similar arrangements for retarded class members in the Southeast Region. These figures coincided with the state's allocation letters to the counties for 1980-81. For the second year, the Judge ordered 150 Pennhurst and 100 community class members placed -- the identical targets presented by the Commonwealth to the court in May 1980. Broderick justified an additional 100 out-of-region placements by noting that since OKR had placed several hundred persons out of state centers in other regions, the state could therefore find community living arrangements for out-of-region Pennhurst residents.
Pennhurst-Specific Developments. Fiscal concerns preoccupied state an community staff during this time period. Several counties in the Southeast Region used part of their allocation for FY 1980-81 to cover reported short-falls in existing court-ordered placements and other unanticipated fiscal constraints. Certain counties attributed some of the deficit to the court requirements. On the other hand, OSM staff contended that some counties were interpreting certain IHP requirements too literally and providing certain services (nursing, etc.) at greatly increased costs. In order to rectify the budgeting problems, OMR staff prepared both short term and long term solutions: first, they covered the existing deficits through a modification of the 1980-81 allocation; and second, they developed special procedures for monitoring and controlling the use of expansion funds for Pennhurst class members.
At Pennhurst, an $800,000 contract was awarded to the Northeast Emergency Medical Association (NEEMA) to provide medical care for residents. The use of a contract, which included nine physicians and a medical director, was a response to concerns regarding deaths and other medical care issues at the institution.
Other significant developments during this period included the removal of OSM's appropriation from the overall Pennhurst budget and its inclusion as a separate line item in the Governor's 1981-82 proposed budget. As could have been predicted, this action drew the legislature's attention to OSM"s almost $1 million budget.
The activities of the Hearing Master were praised by most observers -even those who did not necessarily agree with his decisions. His approach was viewed as fair and his opinions literate and comprehensive. Up to this point, five of the Hearing Master's rulings had been appealed to Judge Broderick -four regarding community placement from Pennhurst and one regarding an admission to Woodhaven Center. In three of the five cases, the Judge upheld the Hearing Master; the other two required pre-placement visits before a "voluntariness" hearing could be held. The "pre-placement" decisions did not address any of the complex issues raised by the appealing parties -- they merely deferred a decision for a later time.
General System Developments. One of the major events during this period was the release of the Governor's proposed budget which provided $10.2 million in new program funds for OMR -- $2.3 million of which was targeted for new CLAs and $6.05 million for community ICF/MRs. Though the overall budget for the Department of Public Welfare was lean, mental retardation services continued to receive favorable funding increases.
The ICF/MR program -- with a proposed development strategy of 500 beds for FY 81-82 -- continued to encounter resistance by Regional Health Care Financing Administration staff. In order to achieve a resolution, a meeting was held in Washington D.C. with Central HCFA staff. At the meeting, it was suggested that the state prepare a waiver under Section 1115 of the Social Security Act to accomplish its objectives. Although a waiver was developed, OMR staff never submitted the request given the change in administration in January 1981. OMR staff continued to develop plans for the small ICF/MR program including clarifying agency roles and responsibilities, issuing program memoranda that listed the criteria for DPW approval of ICF/MR proposals, and preparing an implementation plan.
OMR staff were determined to use the ICF/MR program to promote small, community-based living arrangements. In a December 1980 memorandum, the size of new ICF/MRs was limited to a maximum of eight beds on non-contiguous sites. The proposed implementation plan called for converting large CLAs to ICF/MRs and developing new facilities to serve only "self-preserving" clients.
Community Placements Pick up Steam Amidst Legal Confrontations
(March 3, 1981-August 31, 1981)
Legal Developments. During this period, the legal theories and theoretical legitimacy of the Pennhurst case, were challenged, the enforcement prerogatives of the Judge were tested, and the responsibilities of the defendants to comply with various aspects of the decree were reinforced.
The major legal event during this period was the decision by the U.S Supreme Court to reverse the Third Circuit Court of Appeals decision in Pennhurst and to remand the case to the lower court for consideration or reconsideration of the remaining Constitutional and state and federal statutory issues (i.e., Section 504. the Eighth and Fourteenth Amendments to the Constitution, the Pennsylvania Mental Retardation Act of 1966, and other sections of the Developmental Disabilities Act). On April 20, 1981, the Supreme Court ruled, in a six to three decision, that Section 6010 of the Developmental Disabilities Assistance and Bill or Rights Act (DD Act) does not create any substantive rights to "appropriate treatment" in the "least restrictive" environment.
Because the Court did not address itself to any of the legal issues considered by Judge Broderick, it provided only partial guidance to the lower courts regarding the future course of the litigation. However, though the Court's decision did not automatically vacate Judge Broderick's decree, it did alter the tone and momentum of the litigation. The defendants, in order to test the implications of the ruling, sought a stay of the decree from Judge Broderick pending the Third Circuit review. As he had on three other occasions, Judge Broderick denied the request.
In spite of the Supreme Court's decision, the Judge responded strongly to the state's withdrawal of funding from the Office of the Special Master. As mentioned in the previous section, the 1981-82 appropriation for the Master was placed in a separate line item of $900,000. Some observers saw this move as an attempt to prod the legislature to cut OSM's funds while Commonwealth representatives maintained that the shift to a line item was intended to clarify the issues for the legislature and to avoid misrepresenting the level of resources for Pennhurst Center.
In its final action on the budget in June the Legislature cut the Master's Office appropriation to $35.000. Following this action. the Commonwealth indicated to the court that it could not pay the court's monthly payment orders. In August 1981. Judge Broderick found the the Department of Public Welfare and Secretary Helen O'Bannon in contempt and assessed a $10,00 per day fine to run each day after September 2, 1981 that the payment orders were not obeyed. Several requests for stays by the Commonwealth were denied and the Commonwealth elected to pay the fines instead of OSM. In the meantime OSM staff "volunteered" their services without pay for a period of three months.
In another assertive action, the Judge issued an order to show cause why the Commonwealth and four counties (Chester County was in compliance) should not be held in civil contempt for failing to obey his March 2nd, 1981 "implementation order." The contempt hearings raised a number of key issues. For example. defendants and plaintiffs were using different definitions of who was placed and who was not. By July 31, 1981, OSM showed that of 90 persons slated for community residences, only 15 had been officially placed, while the Commonwealth's figures showed a total of 81 placed. During the course of the proceedings, the Judge also became concerned about the lack of county attention to the IHP process spelled out in the OSM guidelines.
The final legal event during this phase was the consummation of the first consent agreement since the Pennhurst case was decided in 1977. The plaintiffs and the City and County of Philadelphia agreed to settle placement issues raised in the civil contempt proceedings described above. By signing the agreement, Philadelphia did not admit contempt of the March 2nd Order, but agreed to make its required placements by September 30, 1981. Moreover, the Philadelphia defendants agreed to pay $15,000 in attorney's fees to plaintiffs' counsel for costs incurred during the contempt proceedings and to provide a performance fund as an expression of "good faith."
Pennhurst Specific Developments. For the most part, placements of Pennhurst class members in 1980-81 went more smoothly than in the previous year. By July 31, 1981, almost all residential and day programs had been developed. A number of constraints, however, were cited by the counties including delays in site identification, zoning obstacles, community resistance and client crisis situations.
Escalating costs of programs for class members became an issue during this period. Many of the per diems, according to county staff, fell in the $70.00 to $100.00 range. Some county staff maintained that the per diems were sometimes high because of the complexity of the clients' residential and day program needs. Such costs were not necessarily questioned by county commissioners since most of the programs are 100% state funded. State resources, however, were becoming more limited, especially in light of the 1981-82 budget for the Southeast Region. Since $8 million in new program funds were cut by the legislature, OMR staff had to adjust its funding commitments to the Southeast Region. Although the Commonwealth indicated to county staff that funding would be available to cover its court-ordered requirements, some counties were concerned about future funding for the court orders.
Two other important developments affected the on-going implementation of the Pennhurst Decree. As part of their response to Judge Broderick's March 2, 1981 order, OMR staff proposed to establish a "special management unit" in the Southeast Region with responsibilities for reviewing all TIHPs and IHPs for Pennhurst class members. The unit, to be based at Pennhurst, would include two staff persons -- one of whom was the former case management supervisor for Chester County. OMR staff anticipated that initially the unit would prepare revised IHP guidelines to "streamline" the procedures set out by OSM and would eventually take over responsibility for IHP monitoring from OSM. In addition, OMR staff proposed to use the data collection strategies developed by Temple University as part of the Longitudinal Study, to aid in monitoring individual clients. OSM staff were somewhat skeptical about the proposal since Temple's data was analyzed only on an aggregate basis.
Developments at Pennhurst State Center continued to focus on medical services including the medication reviews conducted by an outside medical consultant. According to Pennhurst staff, the presence of Dr. Ziring increased the level of interest and knowledge among direct care staff regarding medication issues. Meanwhile, a new medical director was hired as part of the NEEMA contract and plans for improved medical services for Pennhurst residents and for those residents making the transition to the community were initiated.
General System Developments. In July 1981, the Pennsylvania Legislature completed work on the state budget and approved a $22 million increase for the Office of Mental Retardation. This increase was $8 million lower than the Office had requested and as such, cut into plans for new programs. To make up the loss, OMR planned to use carry-over funds and dollars freed-up from conversions of existing CLAs to ICF/MRs.
OMR's proposal to develop small ICF/MRs was also completed during this period. Although OMR staff had never intended that the program become a major component in the implementation of the Pennhurst remedy, 112 community ICF/MR beds were included in the FY 1981-82 projections to meet the court-ordered requirements for the Southeast Region. Because of the budget cuts in new programs, OMR staff had to revise their original estimates of the number of ICF/MRs beds that would be developed throughout the state. A total of 225 beds as opposed to 317 beds would be converted to ICF/MRs and 200 new ICF/MR beds instead of 504 beds would be developed statewide. Further because of a ban on new construction, ICF/MRs would be limited to existing housing. As a result, only "self-preserving" clients would be served.
Other general system developments included a statement by OMR Deputy Secretary that Marcy State Center in Western Pennsylvania would be closed by 1982. Based on a feasibility study conducted the year before, OMR staff determined that Marcy residents were among the most appropriate candidates for community placement in the entire state system and that a significant savings would occur if all residents were placed in alternative living arrangements.
Cooperation Prevails but Fiscal Uncertainties Lie Ahead
(September 1, 1981-March 31, 1982)
Legal Developments. In the second court of appeals decision in Pennhurst, Broderick was upheld on the basis of provisions of the state's Mental Health and Mental Retardation Act of 1966. The majority opinion distinctly avoided the more thorny Constitutional issues of and federal statutory questions remanded by the Supreme Court. Instead, the opinion stated that the entire superstructure of Broderick's decree could be supported by state law. The court of appeals ruling, though a victory for plaintiffs, left the remedy somewhat at the mercy of the state legislature and opened up the possibility of significant changes in the 1966 Act.
In the meantime, Judge Broderick congratulated OMR staff for their diligence in carrying out those tasks necessary to ensure rapid compliance with his implementation order. He did not find, however, that the county defendants had pursued implementation with the same zeal. As a result, the Judge found some of the counties in contempt but did not assess fines since compliance had been virtually achieved. The Commonwealth's performance may have influenced the Judge's receptivity to a reduction in the Master's Office and to the transfer of some compliance responsibilities to the Commonwealth.
Though the Commonwealth won kudos from the district court, compliance for fiscal year 1981-82 was somewhat clouded by the lack of state action on out-of-region placements. This issue, coupled with the possibility that in-region placements would not be completed by June 30, 1982, raised the possibility of additional proceedings during the summer.
On the O'Bannon contempt issue, Judge Broderick relieved the Secretary and the Commonwealth of the responsibility to pay the $10,000 daily fines. By early January 1982, the fund had swelled to approximately $1,200,000. The Judge agreed with the state that any further collection of fees would be inequitable since the funds paid by the Commonwealth were already in excess of the amount needed to operate the Master's offices. The Judge used the funds to reimburse OSM personnel for back pay and left the remainder in interest bearing accounts.
The Friend Advocacy program, the future role of the OSM and the transfer of monitoring responsibilities to the Commonwealth were the major issues that surfaced in another round of negotiations among lawyers for the defendants and the plaintiffs. Aside from discussions surrounding the Philadelphia County consent, this was only the second time that some or all of the parties had entered into serious negotiations. There were two major sticking points according to those interviewed: (1) the frequency of Commonwealth monitoring of class members living in the community; and (2) the timing of any transfer of monies from the contempt fines back to the Commonwealth. Although the parties were close to agreement on the first point, there was substantial difference of opinion on the return of fines to the Commonwealth. In the end, the negotiations collapsed. Ironically, shortly after the negotiations broke down, OMR program staff and OSM were able to reach an agreement of the transfer of monitoring.
The final legal event during this time period was the Judge's decision to vacate his order of July 14, 1980 which directed the Hearing Master to hold hearings on every individual being placed out of Pennhurst and to determine whether the placements were "voluntary." With the elimination of voluntariness hearings, the Hearing Master would be limited to cases where "beneficiality" of a placement was challenged by the client or his parents or guardians.
By the close of this period, there were several legal issues left hanging fire. First, the outcome of the Romeo v. Youngberg litigation was not known. Though Romeo differed in character from the Pennhurst suit, it offered the Supreme Court its first opportunity to define the Constitutional rights of institutionalized mentally retarded persons. The decision by the Court would certainly affect any future rulings on the Pennhurst litigation. Second, and somewhat related, it was not clear whether the Supreme Court would grant certiorari in Pennhurst for a second time thereby opening the issue of federal court jurisdiction in the enforcement of state laws.
Also, it was not clear what Judge Broderick would do to structure compliance beyond the end of fiscal year 1981-82. It was thought that the Supreme Court's action in both Romeo and Pennhurst would influence whether he would keep the pressure on the Commonwealth through an implementation order covering future placement.
Pennhurst-Specific Events. As discussed above, OSM and OMR staff were successful in forging agreements regarding the transfer of some compliance responsibilities including the approval of IHPs, monitoring of community facilities housing Pennhurst class members, and case manager training. The agreement included time lines for activities and a stipulation that OSM would remain involved for some period of time and would conduct joint reviews of several TIHPs and IHPs, as well as joint monitoring visits. County staff reaction to the shift was generally positive.
Funding for the remaining placements to be made under the March 2nd Order and possible future orders became increasingly more difficult to obtain during this period. As a result, funding for FY 81-82 placements was to some extent “boot-legged" from other sources. Because of an underestimate in the amount of federal funding accruing to the mental retardation program, a one time only surplus was generated. These funds, which were not part of the community services appropriation, were channeled to the counties through so-called "blue-black" contracts with the state. These agreements included augmented funding for the expansion of community programs under the order. County staff interviewed during this phase were concerned about developing new programs because of potential shortfalls in annualization funds for FY 82-83. Philadelphia and Bucks counties were told by OMR staff that adjustments would have to be made in their Pennhurst placement schedule because of the Governor's new "no growth" budget. Other counties saw that the only way to expand programs for the upcoming fiscal year was to increase the size of facilities.
The size of ICF/MR programs continued to be a point of contestion among certain counties. Delaware County decided against developing ICF/MRs since the state would not accept its proposals for two, 15 bed facilities. Other county staff were concerned about the costs of ICF/MRs given the additional federal requirements. In its December 1981 ICF/MR status report, the state reported a total of 20 sites, with 91 beds in the Southeast Region that would serve Pennhurst class members.
The implementation of out-of-region placements was stalled because the state continued to maintain that placing Pennhurst residents in other parts of the Commonwealth would jeopardize Title XIX "run-down" requirements in state centers and, therefore, federal reimbursements.
General System Developments. Events in the state legislature events occurred during this period signalled a potential change in the Commonwealth's orientation to programs for mentally retarded persons. House Bill 1824, introduced in the General Assembly in September 1981, called for significant changes in the Mental Health and Mental Retardation Act of 1966. The bill grew out of concerns about the spate of individual litigation in county courts of common pleas around the state, the decision in the Schmidt case, and the Third Circuit's action in Pennhurst. Specifically, the legislation was intended to make it clear that the 1966 Act was not an entitlement statute and that there was no presumption in favor of least restrictive settings. As a result of pressure from the Pennsylvania Association for Retarded Citizens and other interested groups, the bill was returned to committee by a vote of 23 to 25.
In other legislative actions, pressure from a variety of disaffected groups including parents of institutionalized persons, providers and some county staff resulted in the passage of Senate Resolution 63 -- a measure calling for an investigation of the Office of Mental Retardation and, in particular, the community programs it funds and supervises. The sponsor of the resolution had publicly criticized the Deputy Secretary of Mental Retardation for her lack of sensitivity to parents of mentally retarded persons.
In the Fall of 1981, an investigator was hired to staff the effort. The investigator, a former county district attorney with no background in mental retardation, spent several months conducting site visits and obtaining information about the mental retardation system. Prior to hearings on the results of the investigation, a preliminary report was prepared. Some of the concerns cited in the report included high turnover among CLA staff, failure to consult parents regarding placement of family members, and limitations on the size of ICF/MRs.
The role of parents of mentally retarded persons in decisions affecting the placement of their adult or minor child was a primary issue in the investigation. In partial anticipation of legislative action on the problem, the Department of Public Welfare issued a policy memorandum regarding parent participation in late 1981. Although the policy provided parents with access to the court of common pleas as a last resort, some parents felt that this option was not sufficient. As a result, a "Parents Rights Bill" was introduced in order to place the burden on the State to prove that the recommended placement was the correct one for the adult client and to force the Commonwealth to pay parents' legal expenses no matter what the outcome of the appeal.
During this time period, state licensing standards for CLA programs were finally published. The standards applied to all community residences 24 hour care was provided to one or more mentally retarded persons. OMR staff anticipated that all CLAs and PLFs would be licensed within one year. In those cases where facilities were found to be deficient, it was the state's intent to provide six month provisional licenses. Some county provider staff were concerned that the new standards might result in significant increases in per diems for those facilities not in compliance.
Enforcement Mechanism Ordered to be Phased Out Despite Failed Negotiations
(April 1982-September 1982)
Legal Deyelopments. During the last phase, developments in the litigation revolved primarily around two actions of the Supreme Court -- one that directly affected the case and one that could indirectly affect the course of the lawsuit. Specifically, the Supreme Court granted certiorari in the Pennhurst case for the second time and also issued an opinion in the Romeo v. Youngberg case. Further, Judge Broderick issued a far-reaching order that will probably result in the disappearance of the Special Master. The remaining legal events mirror those of past periods and include ongoing appeals of almost every facet of the Judge's decree and another intense but failed set of discussions regarding the possible agreement in the case.
The Supreme Court decision in the Romeo case was relevant to the Pennhurst litigation because it was the first time that the Supreme Court considered the substantive constitutional rights of involuntarily committed mentally retarded persons. As such, the opinion suggested some of the reasoning that might be applied by the Court in its second hearing of Pennhurst case. In reviewing the Third Circuit's opinion in Romeo, a majority of the Supreme Court found that involuntarily detained mentally retarded persons have the following constitutionally protected rights: reasonably safe conditions of confinement, freedom from unreasonable bodily restraints, and minimally adequate training as reasonably may be required by these interests.
With respect to a "right to treatment" the Court defined the term narrowly to mean habilitation that would diminish Romeo's dangerous behavior and therefore avoid unconstitutional infringement of his safety and freedom of movement rights. This interpretation was far different from the court of appeals finding that such persons have a right to treatment in the least restrictive fashion and according to accepted medical practice. The Supreme Court also noted that in determining whether an individual's constitutional rights had been violated, his liberty interests must be balanced against relevant state interests. Finally, the Court stated that in ascertaining liability, the Constitution only requires that courts make certain that professional judgment is exercised and that judges should not take sides regarding which of several professionally acceptable choices should have been made.
In June 1982, the Supreme Court once again granted certiorari in Pennhurst. The major foundation of the defendants' request for review was the Eleventh Amendment and the multiple ways in which it shields states from inappropriate instrusion by the federal courts. The nub of the defendants' position was summed up in the following quote from their brief: "Unless it [the Third Circuit] is reversed, the decision will give federal courts a free hand in the management of state programs despite the absence of any federal interest at all."
There was much speculation regarding the reasons why the Court granted certiorari including the possibility that the Court may want to address a much larger issue -- whether federal courts should avoid ruling on Constitutional questions if a state law claim is available. If the Court is interested in clarifying issues regarding OSM, it will have to be in retrospect since, on August 12, 1982, Judge Broderick issued an order requesting that the Special Master develop a plan for phase-down of her operations by the end of the calendar year.
The timing of the Commonwealth's petition for certiorari caught a number of key observers by surprise, including the Secretary of Public Welfare. In mid-May, a series of intense discussions had begun between the Secretary and the President of the Pennsylvania Association of Retarded Citizens (PARC) in an effort to find some common ground that might eventually lead to agreement between the two parties. Several days after the discussions were initiated by the Secretary of DPW, PARC's President presented a proposal specifying seven major steps including foregoing a request for Supreme Court review of the Third Circuit ruling. Soon after the working document was submitted, it was learned that the Commonwealth had already filed the petition. As a result, discussions were terminated and once again the parties were left feeling frustrated and disillusioned with the process.
Despite the continuing inability of the parties in the Pennhurst case to reach a consent agreement, Judge Broderick moved in the Fall of 1982 to phaseout the Special Master -- an action that caused some consternation among the plaintiffs. The Judge's order stated that the dissolution of OSM did not signal a diminution of vigilance on his part. Moreover, the order made no mention of the Hearing Master -- an entity that will almost certainly continue, perhaps even in an expanded capacity.
Certain individual cases were also noteworthy during this period including the April Saures case in Allegheny County. The Saures case was similar to the Schmidt case, ruled on earlier by the Pennsylvania Supreme Court. As in the Schmidt case, the Pennsylvania Commonwealth Court found that the state must pay 100% of the cost of community living arrangements for April Sauers. This ruling further reinforced the interpretations of the State Supreme Court and the Third Circuit regarding the requirements of the Mental Health and Mental Retardation Act of 1966.
Within the Pennhurst class, one group of individuals -- persons who are non-ambulatory -- have been particularly difficult to place. The problem is locating accessible housing that meets fire and life safety standards. One non-ambulatory community-based class member, M.H., has been on the waiting list for sometime for an accessible and appropriate placement. Planning began for M.H. and a site was selected last fall. The site was eventually rejected by the Commonwealth because of life safety problems. When the family was finally notified that M.H. would not be placed, a motion was filed in district court seeking emergency relief for M.H. In the meantime, the county shifted its energies to the placement of ambulatory class members -- a choice that some observers felt was necessitated by the court's placement deadlines.
Pennhurst-Specific Developments. It was evident during this most recent phase that the five county defendants had a sense of urgency in meeting the June 30 1982 deadline for community placements. Although only one county met all of its required placements by June 30, the remaining counties were very close to full compliance. There was concern, however, that in order to meet the deadline certain counties "cut corners." Specifically, it was suggested that trial visits for certain class members were not long enough. This issue was eventually brought to the attention of the Hearing Master and OMR. Counties were notified that all procedural safeguards for class members had to be observed, but certain county staff maintained that short cuts had not been taken; on the contrary, they asserted that a great deal of time had gone into developing appropriate placements. Other complimenting the deadline were not new. Zoning disputes, community resistance and ICF/MR delays all presented obstacles to meeting full compliance with the March 2nd Order.
With respect to the remaining part of the implementation order, the Judge denied the Commonwealth's request to eliminate the 100 "out-of-region" placements. Although the Commonwealth contended that there was inadequate funding to implement the out-of-region placements, Judge Broderick strongly disagreed and pointed to the Marcy and Harrisburg Mental Retardation unit deinstitutionalization efforts as evidence of the state's ability to fund institutional reductions in other regions. He gave the Commonwealth until September 30, 1982 to comply with placement requirements.
Following the Judge's ruling, planning for the out-of-region placements was accelerated. By June 1982, 90 persons had been identified as candidates for movement to a total of 14 counties. There was some concern that the three month time limit would be insufficient to guarantee adequate planning and that the needs of these clients could strain the resources of some of the smaller rural counties. Once the out-of-region placements are made, the question of who and how those placements will be monitored must be addressed.
During this phase, the Special Management Unit (SMU) in the Southeast Region became operational and took over monitoring and IHP reviews from the office of the Special Master. SMU staff agreed to monitor each Pennhurst placement once a year and to monitor the conditions of each class member within 120 days of placement out of Pennhurst. Although there were some concerns with certain aspects of the monitoring process, most of those interviewed were pleased with the SMU's and Temple's efforts.
General System Developments. Funding issues dominated general system developments during this time period. The new 1982-83 budget passed by the legislature contained few surprises for mental retardation except that funding for interim care and CLAs was separated into two line items. Several county staff expressed reservations about this move while provider representatives and others were pleased to see that interim care -- the primary funding source for private licensed facilities (PLFs) -- was clearly visible in the state budget.
Two proposed per them ceilings for ICF/MRs were issued in June 1982. The ceilings were $87.70 for urban areas and $77.27 for non-urban areas. The proposed ceilings created an uproar in the provider community and dismay and frustration in some counties. A number of key areas were at the center of the controversy. They included: the lack of differentiation in the regulations among types of ICF/MRs and the clientele they served; the data used to develop the proposed caps; and the distinction between private and public ICF/MRs in the application of the ceilings. The Commonwealth ultimately postponed the final regulations through the end of the fiscal year or until an acceptable rate methodology had been developed. If applied as proposed, the ceilings could have eliminated many providers already on line to develop ICF/MRs for Pennhurst class members.
Finally, the implementation of the recently enacted licensing regulation for community-based residential facilities created some fiscal problems for certain residential programs. A few of the large PLFs requested increases in their rates because of the upgrading required to meet the standards. However, state and regional OMR staff noted that only a few providers increased per diems and that so far, there was no statewide trend.
Key Events During the Final Two Years of the Study and Beyond
Briefly, some of the major events that shaped the implementation of the federal district court decree during the final study period (1982-1983, 1983-1984, and 1984 to date) include the following:
Termination of the Office of the Special Master. As of the end of December 1982, the Office of the Special Master was officially terminated by the court. Many of the functions previously carried out by OSM were transferred to an entity set up by the Commonwealth defendants. The new monitoring mechanism, the Special Management Unit, has responsibility for review of transitional habilitation plans (TIHPs) and individual habilitation plans (IHPs), on-site monitoring, and supervision of the certified advocates. Monitoring of individual client progress is being carried out by the Temple University Developmental Disabilities Center. The Hearing Master continues to conduct hearings in those cases where there are exceptions to community placement or when reinstitutionalization is proposed.
Order of January 14, 1983. The January 14 order sets out an implementation schedule for the 18 month period ending on June 30, 1984. The order requires the counties and the Commonwealth to provide community living arrangements to 143 residents of Pennhurst, 81 other members of the plaintiffs class living in the Southeast Region, and 50 Pennhurst residents from outside the Southeast Region.
Community Services Waiver Application. As part of their plan of compliance to the court following the January 14, 1982, order, the Commonwealth noted that an application for a Medicaid waiver under the provision of the Omnibus Budget Reconciliation Act of 1981 had been submitted to the Health Care Financing Administration (HCFA) on behalf of Philadelphia and Delaware Counties. Following submission of the plan, applications were also submitted on behalf of Montgomery, Bucks, and Chester Counties. The combined impact of the implementation of the waiver and the judge's order would reduce the population of Pennhurst to 200 by fiscal year 1985-1986. As of early 1985, the waiver applications for the suburban counties had not been approved and the federal audit of the Philadelphia waiver resulted in numerous exceptions.
Supreme Court Arguments. During this period, the Pennhurst case was argued twice in the Supreme Court -- once in February and once in October. The February argument centered primarily around the ability of the district court to order a major reordering of the state mental retardation system ostensibly on the basis of a state law claim. The theoretical assertions revolved around the interpretation of the Eleventh Amendment and the principle of "comity" as they related to the facts in Pennhurst. The argument also addressed the powers of the Office of the Special Master. In June, the Supreme Court announced that they had been unable to reach a decision and that they would rehear the case. The second argument, in October, focused on the same issues, with the exception of the Special Master.
Legislative Task Force. Following a legislative investigation and a special report on the mental retardation system in the state, three legislative task groups were convened to develop revised state legislation. The three groups looked at placement procedures, definitions, and state and county responsibilities, respectively. The task groups included providers, consumers, and county officials in addition to legislators. The reports of the task force groups have been presented to the legislature, but to date no action has been taken.
Consolidated Order. In August 1983, Judge Broderick issued a "consolidated" order which encompasses -- where relevant -- the provisions of all previous orders, and adjusts provisions to reflect changes made over the past year (e.g., the dissolution of the Office of the Special Master). For instance, the responsibilities vested with OSM to develop county plans for class members have not been shifted to the state. OSM's previous monitoring responsibilities at Pennhurst were given to the Special Management Unit. The Hearing Master's responsibilities have been expanded to include jurisdiction over class members who are subject to involuntary commitment in mental health facilities. The Commonwealth and counties have filed exceptions to the order. The state's primary concern is that the Judge has essentially mandated the Special Management Unit as party of the decree and also expanded its powers beyond those to which the state agreed. The new order also requires the Commonwealth to develop and submit plans for class members and non-class members through the end of June 1985.
Commonwealth Plan. In November 1983, the Commonwealth defendants submitted a plan to Judge Broderick in response to the consolidated order. The plan described how placements would be carried out for the ensuing two and a half years. It was in this plan that state officials indicated that Pennhurst Center would be closed and that closure would be accomplished by 1986. The plan called for a small residual population that would be transferred to other institutions.
Supreme Court Decision. In its second opinion in the Pennhurst case, issued on January 23, 1984, the Supreme Court -- in a five-to-four decision held that the sovereign immunity principle of the Eleventh Amendment to the Constitution prohibits a federal district court from ordering Pennsylvania state officials to comply with state law. The ruling reversed the Third Circuit's earlier ruling (which followed the Court's 1981 decision noted above) that affirmed the district court's decree in Pennhurst based on state law grounds alone. The Supreme Court decision significantly altered the traditional jurisdiction of federal courts in state law matters and may force litigators with state as well as federal claims to file in state and federal court respectively. This second Supreme Court ruling in Pennhurst is in keeping with the decision in Romeo v. Youngberg insofar as its emphasis on judicial restraint and its deference to state law and state mental retardation professionals is concerned.
Consent Agreement. On July 12, 1984, ten years after the original lawsuit was filed, the Commonwealth and county defendants and the plaintiffs announced that they had reached consensus on the terms of a consent agreement. The only party not included in the agreement was the Parent Staff Association. The consent agreement included the schedule of placement included in the Commonwealth's November 1983 plan and spelled out ongoing responsibilities for the preparation of Individual Habilitation Plans, the conduct of monitoring and quality assurance, and the maintenance of a placement review forum for those protesting the provisions of an IHP. The agreement also narrowed the definition of the class by eliminating ongoing monitoring for those on the Pennhurst waiting list and those at risk of being institutionalized at Pennhurst.
Hearings on the Consent Agreement. In September 1984, Judge Broderick held a public hearing on the provisions of the consent agreement in order to determine whether there were any objections. The only group that lodged a protest was the Parent Staff Association which continued to maintain that Pennhurst State Center should not be closed. Because of the delay in the approval of the waiver (on which much of the financing for class member placements depended) the Judge postponed his decision on the agreement. After one postponement, the Judge scheduled another hearing in November which was held in his chambers. At that time, the Commonwealth voiced its concern about its ability to carry out the agreement because of the lack of approval of the state's waiver applications. Finally, on December 5, 1984, the Judge held another hearing at which time the Commonwealth announced its intention to comply with the agreement regardless of the disposition of the federal waiver. It is expected that the Judge will soon announce his approval of the consent agreement.
New Role for Pennhurst. In January, 1985, Governor Richard Thornburgh announced that the Pennhurst State Center facility would be converted into a state medical facility for veterans by 1986.
CHAPTER 3: IMPLEMENTATION ISSUES
As part of the qualitative assessment of the conduct of the Pennhurst litigation, four special analyses were conducted. These focussed assessments, termed "implementation analyses," were directed at particular aspects of the environment in which the decree was being carried out. The subject of each analysis was selected jointly by project staff and the Pennhurst Advisory Council. Candidate issues were drawn from the findings of the Historical Overviews described in Chapter III. The implementation analyses have made it possible to go beyond the broader historical analysis of the litigation to a fuller exploration of one or more key element in the use of litigation to bring about social change. The analyses have also allowed staff to examine factors in the implementation of the Pennhurst decree against the backdrop of political, sociological, organizational, and legal theories surrounding social change as discussed in a wide body of literature. Finally, in the last three years of the study, the implementation analyses have expanded to include comparative analyses in other states thereby increasing the relevance of the study and its utility to state and federal policy makers.
The following section describes three of the analyses including the methods used to secure information and the major findings reported. The fourth analyses, which summarizes the impact of the decree, comprises Chapter 10 of the report.
Year 1 -- Office of the Special Master
Nature of the Issue. The use of special masters appointed by the courts to supervise the implementation of broad-based structural reform is a relatively new phenomenon -- particularly in the area of public health and human services. Masters are judicial deputies appointed by the court to assist in the conduct of complex lawsuits. These officers traditionally have been utilized to superintend such things as the complex calculation of damages -, or to aid in corporate reorganization and dissolution. Further, masters have conventionally been used to oversee remedies directed at the private sector. More recently, masters have been used to carry out injunctions against public sector agencies such as school districts in desegration cases and state governments in prison reform cases. The appropriate role and function of masters in litigation directed at reform of large bureaucratic programs is a subject of much debate and controversy. The purpose of the Implementation Analysis for Year 1 was to shed some light on the issue by focussing on the case history of the master appointed to supervise the district court's decree in the Halderman v. Pennhurst State School and Hospital case.
Method and Objectives. In order to provide a comprehensive picture of the Office of the Special Master (OSM) in Pennhurst, the analysis encompassed both the legal context within which the master functions and the larger bureaucratic milieu which is the object of the court's intervention. Because the appointment of the master in Pennhurst is part of a larger legal tradition, OSM was also assessed in light of the experience of other masters in related litigation.
The analysis drew both from the legal literature on complex litigation and compliance mechanisms, and from the political science and public administration literature on implementation and program change. Further, the analysis encompassed interviews and document reviews conducted as part of the preparation of the Historical Overviews for Year 1. Thus, the analysis provided two perspectives -- one that concentrated on the legal expectations and parameters that characterize compliance mechanisms like the Office of the Special Master, and the other directed at system reform and bureaucratic change.
Findings
(1) Lack of Consent
Almost all of the cases in the mental disabilities field have ultimately been settled by consent decrees. A consent disposition has important implications for the efficacy of the compliance mechanism selected, the strategies that it employs and the resources it requires to bring about change. The significance of consent is highlighted in a report by the external Court Monitor appointed by the federal district court in Massachusetts to ensure compliance in five institutional class action suits (Horowitz, 1979):
It may be useful to clarify here the significance of the fact that the decrees were entered by consent of the parties. The spirit of seeking agreement has been fundamental to the success of the litigation to this point. Despite the far-reaching powers of the federal court, there can be no doubt that better and quicker results are achieved when all parties make an effort to cooperate and reach a common ground. (p. 4)
Achievement of a consent decree in institutional litigation does not necessarily guarantee the success of reform or even the spirit of cooperation connoted by a consent disposition. David D. Gregory (1980), Special Master in the Wuori v. Zitnay case in Maine, illustrates this point in a report to the district court:
The State's failure to comply with the Court's (consent] decree remains substantial . . . The State could have made much greater achievements if all State agencies bound by the decree had given their active, informed cooperation. The administrative complexity of carrying out the decree in the absence of just such cooperation has prolonged the time needed for compliance without bring any countervailing benefit to the state. (p. 1)
The fact that Judge Broderick could not persuade the parties in the Pennhurst. case to negotiate a consent decree also had an impact on the remedy adopted by the court. In the absence of consent or of any proposed orders from the defendants that the court could adopt, the character of the initial and subsequent orders has been significantly influenced by the plaintiffs. As a result, the defendants view the orders as instrusive and unrealistic and have little stake in the remedy since they have not participated in its development.
(2) Limited Enforcement Powers
Given documented problems of other court appointed implementation mechanisms in institutional and deinstitutional litigation, the plaintiffs in the Pennhurst case attempted to structure a remedy that embodied comprehensive planning and compliance duties. The master mechanism ordered by Judge Broderick encompasses both broad and individual planning responsibilities, needs assessment activities, monitoring tasks to ensure compliance with basic standards at the institution, and a variety of other responsibilities ranging from the recruitment and training of case managers to the certification of advocates for individual clients.
Notwithstanding the broad powers vested in the Office of the Special Master in Pennhurst, the ability of the Master to enforce compliance with the decree has been hampered because of the limited sanctions available to the court. The only real sanction is the contempt power which, in cases like Pennhurst, is generally regarded as a last resort -- in part because it must be directed at an individual or individuals within the broader bureaucracy implicated in the litigation. By focussing the punishment for non-compliance on one actor, the larger, more complicated wrongdoing is ignored. The ability of the court to enforce a complex decree is further complicated by the court's lack of power to reach through the bureaucracy to the legislature which is ultimately responsible for providing funds for the reform. Though some judges, such as Johnson in Wyatt v. Stickney (1972) have threatened to circumvent the legislature by attaching public lands or taking some other action that would inhibit the legislature's ability to control specific public funds, by and large courts have been unwilling to take the legislature on directly.
The court is thus limited to negative and to some extent blunt powers in enforcing its decrees. It has no bonuses or rewards to hand out to compliant defendants except the ultimate disappearance of the court and the master from the scene once the aims of the decree have been fulfilled. What the court, and therefore the master, are left with is some form of psychological reinforcement or judicial back-patting when the defendants have done well.
(3) Involvement in Individual Cases
The Special Master's compliance functions reflect a broad and deep involvement in the day-to-day implementation of the decree. The Master's responsibilities begin with the condition of the class in the institution, carry through the initiation of individualized habilitation plans, and continue to placement in the community and beyond. Compliance activities entail review and approval of both individual and collective plans for class members. They span such substantive areas as quality assurance, program development, client advocacy, institutional operations, program design, client and family grievances, fiscal auditing. and staff training. In short, OSM"s compliance functions touch on almost every aspect of the traditional delivery system for mentally retarded individuals. Because of the deinstitutionalization thrust of the decree, however, the institutional compliance functions of the Special Master in Pennhurst are relatively limited and focused primarily on life safety, sanitation and other mechanistic aspects of the program at the institution.
The individuated nature of the remedy in Pennhurst is a significant factor in diverting the attention of the Special Master from the broader structural aspects of the decree. Involvement in individual cases siphons off energy and places the master squarely in the middle of debates reflecting conflicts in professional judgment. It creates a sort of schizophrenia in the operation making it difficult to be both detached planner and general system monitor, and also analyst and arbiter of particular cases.
(4) Separate and Countervailing Agency
The establishment of OSM as an agency separate and removed from the bureaucracy to manage the implementation of the Pennhurst decree was directly motivated by the plaintiffs' frustration with past bureaucratic performance. The creation of new agencies to solve old problems is a tactic frequently used in government as evidenced by the establishment of special White House commissions, Congressional task forces, and elite semi-autonomous bureaus reporting directly to agency administrators. The isolation of such enterprises from the ongoing bureaucratic machine, however, has drawbacks. As Pressman and Wildavsky (1979) report in their book Implementation:
The cost of independence from ordinary bureaucratic constraints turns out to be loss of contact with the very political forces necessary to preserve the thrust of the organization. (p. 129)
In the case of the Office of the Special Master, the isolation and separateness of the agency created conflicts and tensions both because of its perceived favored position, and also because it ultimately relied on the bureaucracy to carry out the specifics of implementation. It must guide the course of implementation, but it cannot become the bureaucracy without jeopardizing its autonomous and unique character -- and ultimately its moral and legal authority.
Establishing a working relationship with the bureaucracy in order to accomplish the ends of the litigation has been difficult for OSM. Part of the problem is that OSM staff are perceived as being highly ideological and unbending. The reaction of a bureaucracy to this sort of "cause oriented" group is described by Eugene Bardach (1977) in The Implementation Game:
A not insignificant number of policies and programs originate in the desire to extirpate real or imagined evil. Such policies create implementation opportunities for activists whom many political interests will perceive as "hotheads," "extemists," or "zealots." A couterreformation then sets in. A political coalition emerges to scrutinize, criticize, and in some cases to terrorize the agency charged with assaulting the stipulated evils. (p.93)
In the case of OSM. however, the problem is not so much the actual values of OSM staff -- many of whom previously worked in the system -- but the seemingly rigid values and time tables included in the decree. Nonetheless, the perception of OSM staff by those forced to comply with the decree is not that different from the picture presented by Bardach.
The various structural and political factors have conspired to create a "we-they" mindset in OSM and conversely in the bureaucracy. Polarization of OSM is the result of its continually frustrated attempts to influence, let alone move, the bureaucracy to make those changes necessary to facilitate the deinstitutionalization process. On the other hand, the bureaucracy is increasingly alienated from what it sees as a "foreign" agency with power to direct its actions but totally outside of its control.
(5) Lack of Control Over Policy-Making
Though the Master has a quasi-policy making function in that she suggests proposed orders and devises related "policies," she is not a policy maker in the broadest sense. The sources of broader policies that affect the system are the Governor, the Department of Public Welfare and the legislature. The implementation literature argues strongly that the separation of policy making from the operationalization of a program is fatal to the success of reform. This principle is not directly relevant to OSM's situation, since OSM does not monopolize policy making in the system and is not directly responsible for implementation, but the principle does have some resonance. The need for connectedness and coherence between policy and implementation is as relevant in court ordered change as it is in legislative or bureaucratic change.
(6) Conflicts with the Bureaucracy
OSM seems inextricably drawn into areas traditionally reserved for the bureaucracy because of a perceived failure on the part of mental retardation administrators and the very implementation instrumentalities established by the decree. Though OSM can never become the bureaucracy, the court placed it squarely in the center of the system. As a result, it is difficult to tell where even the most prudent Master would draw the line between his or her authority and bureaucratic turf.
(7) Lack of an Overall Plan
Though the court order does not specify that the Master is responsible for developing an overall plan or task description to guide implementation, several of the parties have expressed the need for such a document. In particular, county personnel -- who are responsible for the bulk of implementation detail -- see a distinct need for such a document. They argue that an overall plan would be particularly useful in spelling out the expectations of the Master including the schedule of implementation and the specific actors designated to carry out particular tasks.
In Judge Broderick's original order, OSM was given the responsibility to develop county plans for the Southeast Region. OSM and others argued that the development of detailed county plans should not be the responsibility of the Master. It is the county administrators who are most familiar with the specific problems at the local level and it should therefore be their responsibility to prepare the plans. Further, if the goal of the litigation is to institute new practices, the counties should adopt plan preparation as an ongoing responsibility. It would appear that almost everyone, including the court, has accepted the inappropriateness of the Master's role in this area. However, no substitute plan requirement was adopted. As a result, there are also no plans to guide the implementation of county responsibilities under the decree.
(8) Compliance v. Planning Duties
The bulk of the activity conducted by the Office of the Special Master falls into the area of compliance. The extent of compliance responsibilities is far broader than the range of general planning duties. It is in part this imbalance between general system functions and compliance detail that explain the drain of OSM resources into individualized crises and particularistic controversies.
(9) Constraints to Compliance
The Master's ability to secure an acceptable level of compliance from the counties is complicated by the nature of state law and the counties' position in the overall mental retardation delivery system. Though counties have the responsibility for carrying out the law at the local level, the bulk of the funding comes from the state as do the policies that govern program content. OSM's ability, therefore, to influence and goad the counties into compliance has distinct limitations.
Further, though OSM can apply pressure to the counties to generate residential and support services for the class, counties are reliant on the private sector to provide needed services. The county system in Pennsylvania is based on purchase of service arrangements with the county administrator and his staff performing only administrative, monitoring and fiduciary functions. Thus the success of deinstitutionalization goals is to a large extent dependent on the service marketplace.
(10) Conflicts with Case Management Functions
OSM's involvement in individual cases may undermine the role of the county case manager. According to some case managers interviewed, continued involvement of OSM in the details of implementation has been aggravating. From their point of view, the Master is seeking "perfection" from a complex and already strained system. Further, the tenacity with which OSM staff have carried out their functions in this area leaves them vulnerable to accusations that they are merely substituting their own judgments for those of county bureaucrats -rather than ensuring overall compliance with systemic norms.
Year 2 -- Reaction of the Pennsylvania Department of Public Welfare
Nature of the Issue. In a departure from conventional right-to-treatment cases, the Pennhurst suit and others like it question the legitimacy of the institution itself. These second generation cases assert the rights of institutionalized mentally retarded persons to equal treatment and freedom from alleged discrimination enforced on them in large custodial facilities. Remedies in these lawsuits became even more complex as they reached into the less walled off and more complicated realms of community-based systems of care. As the second and third offspring of Wyatt have evolved, the interests of more and more groups have been implicated in court actions including institutional employees, parents of institutionalized children, parents of children in the community, community caretakers, and other human service providers and administrators.
The drama and controversy surrounding cases in this field have drawn considerable attention to the legal theories and strategies that characterize the litigation. However, very little attention has been paid to the complicated interaction between the nature of court mandates for reform and the constellation of resource, leadership, organizational, political, and systemic variables that exist within a particular state. Even the impact of seemingly unidimensional right to treatment suits -- one wrong, one remedy -will vary depending on the complexity and internal dymanics of a particular state. As more and more divergent interests become drawn into a decree, the character of the state system becomes key to an understanding of the role of litigation in creating the changes desired by plaintiffs.
Method and Objectives. The response of states to litigation in the area of mental disabilities has been varied and wide-ranging. Even within a particular state, the official position vis-a-vis the court can shift in response to changes in the level of resources, the force of public opinion, a turn-over in political leadership, and pressures of competing constituencies. Some states have readily entered into consent agreements with plaintiffs. Some states, even after consent agreements have been signed, have resisted the court's jurisdiction. Other states have begun to reach the limits of cooperation under consent agreements and are attempting to terminate the court's oversight. Still other states, like Pennsylvania, continue to contest the court's right to intervene in the state system.
The purpose of the Implementation Analysis for Year 2 was to explore the factors that dictate a state's reaction to more complex forms of mental disabilities litigation. By using Pennsylvania as a case example and contrasting it with selected comparison states, it was possible to gain insight into state policy-making, the influence of particular constituencies, the internal constraints that exist within a system, the cohesiveness of state leadership, and the relative openness of a system to external changes. A close examination of externally imposed deinstitutionalization mandates in Pennsylvania and other states also sheds light on the tensions surrounding community placement and the limits of the state's ability to hasten its activates in a politically charged atmosphere.
Specifically, the analysis accomplished the following:
- Provided an assessment of state activities directed at deinstitutionalization generally and in response to the decree in HaIderman v. Pennhurst specifically;
- Highlighted major decisions made and strategies adopted by the state in responding to the plaintiffs and the court;
- Compared and contrasted Pennsylvania's response to the Pennhurst case with the response of other states confronted with roughly similar or related litigation;
- Summarized the major constraints to state implementation of the Pennhurst decree (e.g., resource limitations, employee opposition, system discontinuities, etc.);
- Assessed the behavior of the Commonwealth of Pennsylvania and other states facing litigation based on the theories and case examples presented in the public administration literature;
- Commented on the influence that the decree has had on general state policy in the area of mental retardation.
In order to provide a framework for the analysis, a set of initial hypotheses which seemed likely to explain at least some of a state's reaction to broad-based litigation was developed. The hypotheses can be stated as follows: "A state's reaction to litigation will vary according to --"
- the level of sophistication and development of the existing state mental retardation system;
- the extent of public pressure for reform;
- the explicit or implicit agenda of state officials;
- the nature of the relationship between state program officials and the state's attorney general;
- the orientation of the state's political leadership;
- the extent of previous litigation in the state;
- the judicial strategies employed by the federal judge in contested and uncontested cases;
- the nature of the decree and the monitoring mechanism established; the strategies employed by the plaintiffs;
- the level and distribution of state resources.
In order to gather material for the analysis, several steps were taken. First, information was sought from the Commonwealth's Deputy Attorney General assigned to Pennhurst, the current Deputy Secretary of Mental Retardation, past Deputy Secretaries of Mental Retardation who held their positions during relevant stages of the litigation, plaintiffs' lawyers, county officials, Pennhurst State Center staff, and representatives of consumer organizations.
In addition, two states were selected for in-depth comparisons -- Maine and Michigan. These states were selected for several reasons. First, they both are currently the targets of suits that are roughly similar to Pennhurst. Second, unlike Pennsylvania, they both have entered into consent agreements. Third, Maine and Michigan represent two distinct types of states; Maine is a fairly rural state with characteristics very different from Pennsylvania, and Michigan is an industrial state with characteristics similar to those of Pennsylvania. In each state, key actors were identified including state program officials, institutional administrators, consumer representatives state legal representatives, plaintiffs' lawyers, and local program staff.
Because the issues to be considered in the analysis centered around organizational behavior, project staff also reviewed the public administration literature regarding the response of organizations to externally generated change. Though there is very little written on the response of state organizations to changes embodied in mental disabilities litigation, the general principles and theories advanced in the literature were helpful in describing the phenomena under analysis. Finally, staff reviewed materials from the two comparison states and other states facing similar court mandates including Minnesota, Nebraska, New York, Massachusetts, and the District of Columbia.
Findings. Before proceeding to a summary of the usefulness of the various hypotheses, it should be noted that there were sensible explanations for the state's posture that do not necessarily bear on internal political or systemic factors. Organizational theorists assert that it is perfectly rational for a complex organization to resist competing control over its traditional domains. Though human service organizations tend to have less control over their environments than do organizations in the private sector, their reactions to intrusions in those areas they do control are similar. Further, though it can also be expected that organizations will conform with the law, the law in these cases is by no means settled. In many ways, it was inevitable that one or more states would ultimately test the Constitutional and statutory underpinnings of institutional litigation in this field.
The analysis can be divided into two parts -- factors affecting consent and non-consent, and factors influencing progress in the implementation of court decrees. No one factor can be isolated as necessarily the most prominent and not all of the variables proved useful in explaining the reasons why Pennsylvania's reaction differed from that of Maine and Michigan. A summary of the relevance of the initial variables that formed the hypotheses follows:
-
Level of sophistication and development of the existing state mental retardation system -- This factor did not prove very helpful in explaining the distinction between Pennsylvania on the one hand and Maine and Michigan on the other. Though Maine's system at the time of the suit was not fully developed, certainly the Michigan system could be seen as relatively complex and sophisticated. The more interesting factor that emerged, which is somewhat related, is the extent of shared ideology among key staff in the mental retardation agency in Pennsylvania and their sense of efficacy in creating system change.
-
Extent of public pressure for reform -- Certainly in Michigan the pressure in the press and from the public weighed in favor of expedited negotiations. in Maine, the pressure was more diffuse and in Pennsylvania the pressure was more sporadic. This factor may be a partial explanation for consent but does not necessarily explain progress once the agreement is reached.
-
Explicit or implicit agenda of state officials -- This factor appears to be important both with regard to consent and progress in implementation--a fact that is born out in the comparison states and in the literature. To the extent that state officials see litigation as a means of furthering their programmatic agendas, the chances of consent and progress are heightened.
-
Nature of the relationship between state program officials -- This factor appears to be important in the forging of a consent decree. In the two comparison states, state lawyers were more governed by the program agenda of state agency officials than was the case in Pennsylvania.
-
Orientation of the state's political leadership -- This factor has a somewhat hazy relationship to the events under analysis. If orientation means political party, there appears to be no relationship between party identification, and the inclination to settle. In Pennsylvania, the case now spans two political administrations, and neither showed any inclination to consent. What is clear is that the aims of the Governor play a key role in the decision to consent.
-
Extent of previous litigation in the state -- Though it cannot be directly shown that the cumulative effect of multiple suits in a state will eventually turn state officials against consent decrees, anecdotal information clearly suggests that enthusiasm wanes and wariness increases after prolonged experience with complex consent decrees.
-
Judicial strategies employed by the federal judge in contested and uncontested cases -- This factor requires substantially more exploration in more cases before any real conclusions can be drawn. At least tentatively, it does appear that the judges in Maine and Michigan were more successful at cajoling the parties into consent--and into fairly regular progress--but it is not clear whether the other factors suggested outweigh the judicial influence in all three cases.
-
Nature of the decree and the monitoring mechanisms established -- This factor leads to a circular argument which is not terribly useful in explaining the differences among states. Since the nature of the decree and the compliance mechanism are directly related to whether or not there is consent, the analysis becomes a tautology.
-
Strategies employed by the plaintiffs -- This factor has potential utility for explaining the behavior of state defendants, but the limited amount of information in this analysis is not conclusive. If the defendants' perception of the lawyers themselves are taken into account, then this factor plus the strategies employed did tend to establish expectations among the defendants in Pennsylvania regarding the "implacability" of the plaintiffs' attorneys.
-
Level and distribution of state resources -- This factor is not particularly satisfactory in explaining the decision to consent among the three states -- at least at the time such decisions are made. Michigan's level of funding, if anything, was lower than what was available in Pennsylvania and certainly the economic future of that state was much more precarious. Level of funding may, however, bear on the degree of progress a state is able to make in implementing the decree. Further, the extent to which funding for the decree is obtained at the expense of other parts of the system may ultimately constrain compliance.
Though Pennsylvania is treated in this analysis as an exception to the trend of settlement in mental disabilities cases, the posture of the commonwealth may increasingly become the rule. The question is whether those settled cases, if they were brought now, would result in consent agreements. Of the cases brought recently, more are going to trial, and consent agreements are more aggressively negotiated by the defendants.
Even without a shift in the case law, many state officials are increasingly reluctant to submit control over aspects of the service system to federal court oversight. In part, this reluctance stems from direct experience with other consent decrees and in part it is the result of a growing consensus among such individuals that the price paid for consent is not worth the benefits that may be conferred on the system. One state official among the several states contacted for this analysis was asked whether he would support consent if he had to do it all over again and his answer was a reluctant "no."
Finally, the increasing resistance to federal court intervention is also strongly influenced by the gloomy financial picture emerging at the federal level and in several states. As long as resources were relatively flexible, there was enough "play" in the system to accommodate comprehensive consent agreements. As resources become short, meeting court requirements may be accomplished at the expense of expansion or improvement in other parts of the system. The uncertainty surrounding future cut-backs in federal funds also may mean that many state officials will be loathe to contemplate significant system reform projects.
Another related fiscal issue has to do with the Medicaid program. Those states that have certified a significant number of institutional beds for Title XIX reimbursement may resist court-mandated, deinstitutionalization unless they can be assured that the Title XIX funds will follow the clients into the community. In states where there is an aggressive ICF/MR program in the community, this shift may be accomplished with no substantial loss to the state treasury. However, in states where community programs are funded primarily with state dollars, deinstitutionalization will result in a direct loss of federal funding and a concommitant drain on scarce state funds. The rumored cap on Medicaid may even diminish the ability of those states with community ICF/MR facilities to expand the program given the reluctance of providers to invest funds in the face of an uncertain potential for reimbursement.
Growing fiscal concerns have also resulted in increased attention by state legislatures to the fiscal impact of litigation. Whereas in the past state legislatures were only somewhat involved in the development of litigating strategies, today more and more legislatures are demanding a role in implementation. Their potential resistance to funding complex decrees poses serious problems for implementation and forces the issue of federal court jurisdiction over legislative bodies.
Issues Affecting Complex Decrees
Nature of the Issue. The first two Implementation Analyses concentrated on key actors in the litigation -- the Office of the Special Master in the first year, and the Department of Public Welfare in second year. The topic for Year 3 covered a range of issues -- both as they emerged within the context of the Pennhurst litigation in Pennsylvania and in other comparison states.
The Pennhurst litigation has focussed a spotlight both on the implementation of public law litigation in the field of metal retardation and. also on the stresses and strains afflicting the mental retardation system in general -- particularly in the face of funding cut-backs and increasing concerns regarding the allocation of scarce resources. The Historical Overviews highlighted several issues that bear further assessment and exploration. They included:
- the seeming state legislative "backlash" against both the litigation and the general orientation of the mental retardation system;
- the strong and vigorous opposition to continued deinstitutionalization on the part of unions representing institutional employees;
- the appropriate role of the court, through its Special Master, in the enforcement of complex judicial decrees;
- the schism among parents of retarded citizens regarding the future of institutional care.
Method and Objectives. The Implementation Analysis for Year 3 had several major objectives:
- To highlight the political and legal forces that influence the administration of the mental retardation system in Pennsylvania;
- To analyze each of the four major issues and the relative impact that each has had on the system in the state to date, and in the foreseeable future;
- To compare and contrast the influence of the four major issues across other states where significant litigation is in progress;
- To assess the relative weight of each of the political and legal phenomena as catalysts in the system, and the extent to which they stem from similar or dissimilar motivations and/or circumstances;
- To suggest possible policy directions for addressing concerns raised by each of the factors under analysis.
To gather the information necessary for this analysis, HSRI first identified four comparison states -- Maine, Michigan, Minnesota and Massachusetts. The major characteristic of each state was the presence of litigation directed at some aspect of the mental retardation system. The first two states were included in order to provide continuity with the Implementation Analysis for Year 3. The second two states were selected in order to broaden the base of analysis and because the litigation in those states is longstanding.
Prior to site visits, each state was contacted and pertinent court related and program materials were requested. The names of key system actor were secured and interviews were scheduled. A specialized interview guide was prepared to ensure that all relevant topics were covered. Each site visit lasted approximately two days. Material on the Pennsylvania portion of the analysis was gathered during the five day site visit conducted prior to the preparation of Historical Overview VI.
Findings
(1) Legislative Backlash.
In Pennsylvania, one of the major changes in the political landscape in which the mental retardation system functions is intensified legislative scrutiny. Whereas in the past the legislature had, within reason, relied on the Department of Public Welfare to set the tone and direction for the mental retardation program, insistent complaints from parents and others stimulated the legislature to conduct its own investigation of the management of the system. Late in 1982, the Pennsylvania Senate passed a resolution establishing a five member investigatory committee to review the operations of the Office of Mental Retardation. The committee looked into allegations of mismanagement within the Office of Mental Retardation, and in the community system generally.
The final report of the committee is primarily focussed on community living arrangements in the state. Though the committee finds them to be the most "home like" of all facilities visited, the report concludes that there is a need for "additional planning, preparation, and safeguards," and that it is time to "take stock."
The major recommendation by the Senate Committee was the formation of a Senate Task Force to design needed changes in the Mental Health and Mental Retardation Act of 1966. In making its recommendation, the Committee notes that "the legal base upon which the State's MR system is built may no longer be adequate." In addition to problems in the delivery of services, the Committee also appears to have been strongly influenced by the Pennhurst litigation. In reviewing the actions of both the Third Circuit and the Pennsylvania Supreme Court, the Committee states:
. . . these decisions now interpret the Act to entitle all of the MR population to the above-stated treatment without regard for the availability of funds and services exists. Intervention of the courts has created additional legal and manpower costs; has limited the available choices of professionals, parents and MR clients; has made regional and statewide planning more difficult; and has encouraged a division among Pennsylvania's advocacy groups.
Though attempts to amend the 1966 Act have consistently been unsuccessful, it is possible that the combination of the litigation and the growing dissatisfaction among some parents provide sufficient momentum to those seeking to put the brakes on deinstitutionalization through revisions of the state statute.
In each of the four comparison states, legislative attitudes toward the mental retardation system generally and to related litigation were explored. In all four states, legislators were supportive of services for mentally retarded persons and did not appear to question continued development of community-based services. In Michigan, for example, legislators had appropriated $3 million in new funding to provide services to "underserved" persons in the community. This investment in the face of Michigan's dire financial condition underscores the legislature's continued commitment. In Maine, though there has been no significant increase in state funding for community services this year, legislators remain pleased with the progress being made toward expansion of community services.
In Minnesota, a state which has also been hard hit by the recession, legislators are concerned about how to make the most of shrinking resources, but these hard fiscal realities do not appear to have dampened their enthusiasm for community-based services. In Massachusetts, the legislature is clearly concerned about the conduct of the system, but its criticisms are directed at the state's management of the system rather than at the viability of community programs.
Though legislators in the four states do not seem to share the concerns about the community system expressed by their opposite numbers in Pennsylvania, they all share a certain restiveness about the continued presence of the federal court in the management of state mental retardation programs. In Minnesota, legislators complained that even after the recent stipulation in the Welsh suit that expands reforms to all of the state's institutions, the plaintiffs continue to bring the defendants before the court over various enforcement details. In Massachusetts, the Chairman of the House Ways and Means Committee has formed a special subcommittee on "Federal and Court Consent Decrees." The purpose of the committee is to assess the impact of the court's intervention and to explore the state department's management of the funds provided by the legislature to meet the requirements of the decree.
In Maine and Michigan, the level of hostility is not as prominent but individual legislators are still concerned with the court's continued presence. In Maine, legislators are perhaps more sanguine because the state has already been released from half of the provisions of the decree in the Wuori suit. In Michigan, there is no significant disagreement among legislators regarding the aims of the decree, though individual legislator are unhappy that they were not involved in the negotiations.
(2) Union Influence
In Pennsylvania, the American Federation of State, County and Municipal Employees (AFSCME) is a significant actor in the political environment of the mental retardation system. Actions of the union have taken many forms including the use of litigation to attempt to block institutional closures and institutional phase-downs; financial support for the Parent/Staff Association, a defendant intervenor in the Pennhurst suit; and legislative lobbying, including successful opposition to zoning legislation that would have opened up residential neighborhoods to small group living arrangements for mentally retarded persona.
The intensity of AFSCME's activities definitely increased once the deinstitutionalization character of Judge Broderick's decree became clear. The nature of the litigation in the four comparison states, however, is somewhat different than the Pennhurst case in Pennsylvania. In Massachusetts, for instance, the five class action suits are all directed at institutional improvement and have resulted in at least a doubling of staff to client ratios. In Maine, though the consent agreement required the movement of some residents of the state mental retardation center to the community, the increased staffing standards in the decree offset the need for any lay-offs of state personnel.
In Minnesota, the state AFSCME chapter considered joining the plaintiffs in the Welsh suit in order to press for institutional improvement. Even though the defendants have now signed a stipulation agreement that includes a reduction in institutional census. AFSCME spokespersons do not see any abnormal reductions in force at the institutions. The situation in Michigan comes the closest to the situation in Pennsylvania since the litigation has resulted in the planned closure of a state institution. AFSCME in that state did attempt to intervene in the suit, but the Judge rejected their petition. Since that time, union officials have brought in staff from their national headquarters to try and persuade legislators and others to stem the tide of deinstitutionalization. To date Michigan AFSCME has not been as effective as their counterparts in Pennsylvania though they have been successful at negotiating a 12.5% ceiling on institutional staff lay-offs.
(3) Role of Enforcement Mechanisms
The creation of the Office of the Special Master in Pennsylvania caused a great deal of consternation both because of the extent of its responsibilities and the amount of resources devoted to its operations. Since its inception, OSM has been viewed by the state defendants in particular as an intruder into traditional state prerogatives. In part, OSM's problematic relationships with the defendants had to do with its multiple mandates and the individuated nature of much of its compliance mission. It was also a very large target given its $900,000 budget at the height of its powers.
Again, the situation in the comparison states is very different. For one thing, the litigation in all of the states visited has been settled by consent agreement. As mentioned earlier, the presence of consent has a direct bearing on the nature of the compliance mechanism established by the court. As a result, the court-appointed officers in the four states have responsibilities that are much more removed from the day-to-day operations of the system and the resources at their disposal are much more limited than those allocated to the Office of the Special Master in Pennhurst.
This is not to say that there were no tensions between court officials and state defendants. In Maine, state defendants became upset with the attitude of the court monitor in the Wuori case because of what they asserted was his failure to acknowledge the positive accomplishments of the state in meeting the requirements of the decree. The monitor finally resigned in favor of another individual whose personal style is less confrontational. It should be noted, however, that many of those in the state feel that the initial court-appointed official had the right approach for that phase of the litigation, and that the approach of the recent monitor is consistent with the requirements of the later stages of the litigation.
In Minnesota, though the Welsh case has been active since 1972, it is only recently that the court appointed a monitor. By and large, relationships with the state defendants have been smooth though, as mentioned earlier, the patience of the legislature with the court is beginning to wear thin.
In the other two states, relationships between court compliance officers and state defendants appear to be fairly positive. In Michigan, the monitor has eschewed obvious demonstrations of authority in favor of an "illusion of power." In Massachusetts, most seem to accept the monitor's role and appear to direct most of their attention to the actions of the Judge. Some legislators in particular have been concerned with the Judge's involvement in the system -particularly his decision to subpoena the Chairman of the Senate Ways and Means Committee.
(4) Schism in Parents Groups
The Pennhurst litigation appears to have exacerbated if not created enions among the parents of mentally retarded persons in Pennsylvania. Because of the frank deinstitutionalizatl'on character of the remedy, proinstitution parents were forced to take sides and they ultimately formed a separate organization and became opposing parties in the case. Given the community orientation of the Office of Mental Retardation in Pennsylvania, this polarization may have occurred in any event, but perhaps not as quickly nor as intensely. In order to determine whether the apparent schism in Pennsylvania was repeated in other states -- as the result of litigation and/or state deinstitutionalization policies -- parents group representatives in the four comparison states were interviewed.
In assessing the experience in the other four states, it should be kept in mind that, with the exception of Michigan, litigation had resulted in substantial institutional improvement. In Massachusetts, the five remedies are almost entirely comprised of standards for institutional reform. Parents in that state are somewhat unified, although the father of one of the named plaintiffs remains an independent agent somewhat critical of the state parents group. Unlike the situation in Pennsylvania, it is the community parents in Massachusetts who feel some resentment toward the institutional parents because of the diversion of resources to support state center programs.
In Michigan, the Plymouth suit was originally brought by parents of Plymouth residents who were concerned about institutional conditions. The state ARC eventually joined the suit and more recently the defendants have signed a stipulation to close the facility. Though Plymouth parents felt somewhat left out of the negotiation process and were initially hesitant about the impact of closure, they admit that the viability of the facility is in serious doubt. When asked whether they had ever thought of aligning themselves with the institution's employees to stop closure. A parent spokesperson gave an unequivocal "no" -- especially in light of the abuses attributed to some personnel at Plymouth. Though there is no npen schism between the state association and this local group, there is very little communication or sense of solidarity of purpose.
In Maine, where the litigation has resulted in both institutional improvement and deinstitutionalization, parents interviewed seemed pleased with the results. When the consent was first signed, however, there was concern among some institutional parents regarding the movement of their relatives to the community. According to those interviewed, this resistance to placement was diminished in large part because of the intervention of the state commssioner who personally worked with parents to orient them to the nature of community programs. Though there is no vocal division among parents in Maine, there is also no state parent organization. Recent attempts to resuscitate the dying state ARC failed. The collapse of the ARC, however, appears to have less to do with philosophical differences and more to do with previous mismanagement.
In Minnesota, parents appear to have made a conscious effort to accommodate the sometimes divergent views of institutional and community parents in order to hold the organization together. The litigation in that state does not appear to have exacerbated relationships among parents in part because it has evolved slowly and now includes mandates regarding both institutional improvement and community services.
Interestingly, relationships among parents appeared somewhat more strained in those states -- Massachusetts and Michigan -- where the parents organizations had become plaintiffs in the litigation. Further, all parent group representatives reported a decline in vitality in their organizations ironically because of their past successes. Now that public education has been extended to all handicapped children, for instance, recruitment of the parents of young children has fallen off.
References
Bardach, E. The Implementation Game. Cambridge, MA: The MIT Press, 1977.
Gregory, D.D. Report of the Special Master to the United States District Court for the District of Maine: Community Standards, Appendix of the Court's Decree, April 1980, P. 1.
Horowitz, S.G. Report to the Court: March 12, 1979 - June 1, 1979. Report submitted by the District Court Monitor to the United States District Court, District of Massachusetts, p.4.
Pressman, J. & Wildavsky, A. Implementation (2nd edition). Berkeley, CA: University of California Press, 1979.
Wyatt V. Stickney, 344 F. Supp. 373 and 387 (M.D. Ala. 1972), aff'd sub. nom., Wyatt v. Aderholt, 503 F. 2d. 1305 (5th Cir. 1974).
CHAPTER 4: GROWTH AND DEVELOPMENT
Individual Progress Case Study: Growth in the Community
Robert was delivered prematurely, at 6 1/2 months, in 1961; he weighed just over 3 pounds, and spent two months in an incubator. Due to retrolental fibroplasia at 6 months, Robert became blind. From that point on, Robert was developmentally delayed. He developed a seizure disorder and was not toilet trained until he was 5 years old. His parents enrolled him in a school for the blind, but he was asked to leave within a year, as he had begun to lose bowel control. For the next 3 years, Robert went to another school, where he learned to dress and undress, toilet himself, and speak in simple sentences.
Robert's parents were going through a divorce, and his school was too far away, so his parents institutionalized him at Pennhurst. The early records indicate that Robert began to regress soon after admission. He lost his ability to speak, began having toileting accidents, and began to bite and slap himself and others when he was upset.
Since Robert was under 21 in June 1979 (when Judge Broderick signed the "school-age children's order"), he was slated to be one of the early movers. Because of parental objections, Robert did not move until the summer of 1982, and even then his parents were less than thrilled.
The changes in Robert in the 2 years since his placement have been remarkable. When the Case Studies Coordinator visited Robert in his group home most recently, he seemed very different. His clothes fit properly and were, in fact, quite stylish. His hair was well trimmed and neat, and he was smiling, something that had not been the case in the 12 visits with Robert while he was at Pennhurst. In addition, as staff pointed out, Robert had, no open wounds on his hands, which had been the prime target of self abuse in the past. In place of the open wounds were scars, a reminder of Robert's past behavior.
There had been quite a change in Robert's home, as well. All over the house one could find soft sculpture on the walls to both stimulate and orient Robert in the house. He was also using a cane and, with it, was able to move about the house independent of staff. During the visit, Robert signed "bathroom" to the staff person and proceeded to the bathroom without help. When he returned, staff praised him and Robert, smiling, looked quite pleased with himself. Knowing he had achieved a major accomplishment, Robert approached the staff person and signed the words "please" and "cookie."
Introduction
For more than a century, states have maintained large) segregated, congregate care institutions for people with mental retardation. More recently, residential alternatives closer to home have been developed for such individuals. The Pennhurst Longitudinal Study investigated whether people were better off, in terms of their own individual behavioral development, after making the transition from an institution to a community residence.
The places where people went in the Pennhurst case are called Community Living Arrangements (CLAS). These are very small programs, usually housing only three but almost never more than six residents. CLAs are almost always in regular residential housing stock, and are staffed continuously when the people who live there are present. All residents leave every weekday to go to some variety of day program or work or school. Staff coverage is provided either according to the live-in plus part-time-help model or the shift model, with the preponderance of programs using the shift model. Service providers are private entities, about 90% are non-profit, and they range from very small (one CLA site) to quite large (40 CLA sites).
Beyond this basic CLA model, which has been in place in Pennsylvania since the early 1970s, certain additional programmatic and procedural elements were required by the Federal court for Pennhurst class members. The court mandated case managers with caseloads not to exceed 30, ordered that Individual Habilitation Plans (IHPs) be written in a collaborative way involving all concerned professionals and nonprofessionals, and also that those plans be reviewed and approved by a special unit before implementation, and finally that a special unit be designated to monitor the well being of the people and the services rendered to them.
Similar community service settings have been proliferating rapidly across the country (Janicki, Mayeda, & Epple, 1983). But to the extent that a given state's community service configuration differs from the model described above, the power to generalize from our Pennhurst Study findings to that state is decreased. As an extreme example, our research would probably have little to say about a state in which the community service system that is composed of 15-bed, specially constructed or renovated facilities located in mixed zoning areas.
The deinstitutionalization of Pennhurst Center should be seen in the national context of declining institutional populations and increasing community residential facility populations. Exhibit 4-1 on the next page shows the changes in public institution populations from 1960 to the present. Clearly, there has been a strong trend away from institutional care, but the figure also reveals that as of this writing about 100,000 people still live in public institutions. Whether it would be possible to serve those people in a "better" way, at the same or lower public cost, is an essential question addressed by the Pennhurst Study.
In the sense of Campbell (1967) in his classic article "Reforms as Experiments," the Pennhurst Study was an evaluation of a social experiment. The reform (experiment) in this case was conducted by a Federal court. On March 17, 1978, Judge Raymond J. Broderick of the Federal court for the Eastern District of Pennsylvania ordered that all the people living at Pennhurst (among others) move to alternative CLAs. Evidence and expert testimony had convinced the judge that people would be better off out of Pennhurst Center but no one was really certain. The issue of deinstitutionalization was controversial and provoked broad public concern.
EXHIBIT 4-1. Population of Public Institutions
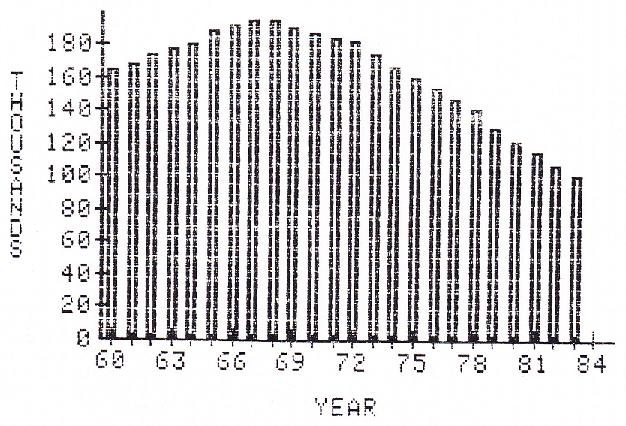
Prior research had established firmly that deinstitutionalization of people with mental illness had in many states been a failure (Bassuk & Gerson, 1978). In the field of mental illness, the decline in institutional populations began in 1955 (long before it began in mental retardation). People in many instances were "released" from mental institutions with no place to go, no backups, no supports, and nothing to do during the day. The bulk of public opinion about deinstitutionalization was formed by that flawed policy. The politicians who voice concern about the homeless, the street people, the vent people are, in the vast majority of cases, talking about people who were released from mental health, not mental retardation, institutions.
Institutions for people with mental health problems were generally not very pleasant places to live during the 1950s (Goffman, 1961). Public and professional outrage over institutional conditions surely lent momentum to the trend toward institutional discharges. Perhaps an even more powerful catalyst was the development of powerful new medications that could ameliorate the effects of many forms of mental illness. The first of these medications was approved for general use by the Food & Drug Administration in, not coincidentally, 1955. It appears that many people were released from facilities with a supply of medications and little else.
In the field of mental retardation, in contrast, the situation is by no means parallel. When a person with serious intellectual impairment is considered for release, it is clear to everyone that the individual will still need round the clock supervision. There are no chemical or other substitutes for creation of a place to live with staff and therapeutic, activities. Thus the Pennhurst Study was not revisiting an old question. The question was, in Pennsylvania, under this court order at this time, with these Pennhurst residents who had mental retardation, would community placement (deinstitutionalization) be beneficial?
In the first section of our quantitative research on this question, we were concerned with behavioral growth and development. This area merited primary attention because several ideological trends and practical program models were converging toward the "reduction of dependency" as the central goal of services. This concept was based, in part, on a growing realization among professionals in the field that all people could grow and learn (Gold, 1973). New behavioral technologies were being used to impart skills such as independent toileting to people who professionals had thought were incapable of learning such skills.
In the Federal standards for reimbursement under Title XIX, Intermediate Care Facilities for the Mentally Retarded, the phrase is was "active treatment." Active treatment implies interventions that are designed to be far more than custodial. The requirement is meant to facilitate gradual but continual increases in independent functioning. The Accreditation Council on Mental Retardation and Developmental Disabilities, formerly a part of the Joint Commission on Accreditation of Hospitals, has supported that notion in conjunction with an emphasis on the developmental model.
The single most influential principle in the field of mental retardation in the past decade has been the principle of normalization. In his original formulation, Wolfensberger (1972) defined normalization as:
"Utilization of means which are as culturally normative as possible in order to establish and/or maintain behaviors and characteristics which are as culturally normative as possible" (page 28).
The definition of normalization has evolved since 1972 but the original formulation held sway through most of the 1970s. The principle strongly implied, through the phrase "in order to," that one of the two central purposes of services was to increase peoples' behavioral repertoires to encompass skills and patterns displayed by average citizens. (the other purpose was to do this in ways that did not degrade people or emphasize their differences from average citizens.) Subsequent treatments of normalization (Wolfensberger & Glenn, 1975) also stressed a "developmental growth orientation" and the "intensity of relevant programming" to foster behavioral development.
The first part of the 1972 definition clearly meant that the principle of normalization was incompatible with segregated, large-scale institutional care because such settings could never be considered "as cultural normative as possible." If people moved from an extremely deviant and non-normative segregated setting to a more normative and valued living arrangement, then normalization predicted that favorable changes in behavior would follow. In specific terms, then, the principle predicted that people moving from Pennhurst to CLAs would display more normative (higher adaptive and lower maladaptive) behaviors.
Thus several standards and philosophies of service highlighted the importance of behavioral outcomes. Because the technology to measure the adaptive behavior of individuals was already well developed in 1978, the question of behavioral benefits of deinstitutionalization became the central focus in the Pennhurst Study.
In 1978 there was an extreme paucity of reported research concerning the behavioral benefits of deinstitutionalization. We knew of only a handful: Aanes & Moen (1976), Brown (1978), Fiorelli & Thurman (published in 1979, but conducted in 1977-1978 at Temple University), Isett & Spreat (1978), and Schroeder & Henes (1978). Each one reported behavioral improvements after community placement, but each study was small, short term, and limited in generalizability. In this area, then, the results of the Pennhurst Study became the most extensive body of knowledge in the country.
More recently, comprehensive reviews of the policy of deinstitutionalization (Willer & Intagliata, 1984) and of research about outcomes (Craig & McCarver, 1984) have been published. The Pennhurst studies figured prominently in both. Because of the availability of these recent reviews, we will not present an extensive literature review here.
In this chapter, there are two studies. The first is a replication of our earlier study (Conroy, Efthimiou, & Lemanowicz, 1982) using the matched comparison design, which tests whether similar people, some who leave Pennhurst and some who stay, display different amounts of behavioral growth over time. But that study concerned 70 of the first people to leave Pennhurst; here, we will report on 191. The second is the longitudinal design. This design, the best scientific approach available to us, measures a person's growth while living at Pennhurst, then measures that same person's growth upon community placement and while living in the community. This enables us to test whether the same person displays more rapid behavioral growth in one setting than the other.
Both of these designs are quasi-experimental; neither is as powerful scientifically as a true experiment. In a true experiment, as noted by Campbell (1967), the reformer (in this case the judge) would have ordered that some number of people, say 100, be chosen by lottery to be deinstitutionalized first. This "random assignment" would enable scientists to generalize what was learned about these first 100, and predict confidently that the remaining 1054 people would have similar outcomes. Although this was not done (and may never be), the combination of the two strong quasi-experimental designs from the Pennhurst Study comes very close to the level of confidence a true experiment would provide.
Because there are two major studies to describe, but both used the same instruments and drew from the same population of subjects, we will begin with a description of general Methods that were applicable to both studies. Then the specific methods and results of each study will be presented, followed by a general discussion of both sets of results.
Methods: General
Subjects: General
The people of primary interest in all aspects of the Pennhurst Study were the 1154 people who lived at Pennhurst Center on the date of Judge Broderick's original Order, which was March 17, 1978. Their ages ranged from nine to 82 years with an average of 39, and they had lived at Pennhurst for an average of 24 years. Sixty-four per cent of the people were male. Thirty-three per cent had some history of seizures, 13% had visual impairments, 4% had hearing impairments, and 18% were unable to walk. Medical problems of a severe, life-threatening nature were reported for only eight individuals, or under 1%.
In terms of level of functioning, 54% were labeled profoundly retarded, 31% severely, 11% moderately, and 4% mildly retarded. For 9%, I.Q. was reported as unmeasurable; for the others, the range was from 3 to 87, with an average of 23. Just over 50% were completely or nearly nonverbal, 47% were less than fully toilet trained, and 40% were reported to threaten or do physical violence toward others. On the Behavior Development Survey, the adaptive behavior scores ranged from 0 to 120, with an average of 51 points; maladaptive behavior scores ranged from 3 to 22, with an average of 17 points.
Instruments: General
The Behavior Development Survey (BDS) contained our measures of individual functioning. Changes over time provided a measure of developmental growth. The behavioral items on the survey were taken from the American Association on Mental Deficiency's Adaptive Behavior Scale (ABS), by the UCLA Neuropsychiatric Research Group at Lanterman State Hospital, on the basis of mathematical criteria and reliability. The resulting shortened research version of the scale contained 32 items on adaptive behavior and 11 items on maladaptive behavior. According to Arndt (1981), the best way to treat these data is as two simple sum scores, one reflecting adaptive behavior and the other maladaptive behavior.
The adaptive behavior sum score has been found to be highly reliable (Conroy, 1980), with test-retest reliability of .96, and interrater reliability of .94. For the maladaptive behavior section, although test-retest reliability is good at about .90, interrater reliability is barely adequate at about .65 to .70 (Isett & Spreat, 1979; Conroy, Efthimiou, & Lemanowicz, 1981). The relatively "noisy" measure of maladaptive behavior implies that it is more difficult to detect changes; they must be quite large to be detected.
For the present study, we extended the instrument by adding items covering individual characteristics, family relationships, friendships, medical status, the individual habilitation plan, program goals, and type and amount of services delivered. The full modified BDS was designed to be a comprehensive tool for monitoring the status, needs, services, and outcomes of individuals in the mental retardation service system. The BDS was designed to be collected by interviewing the direct care and other Personnel who knew the individual best, combined with examination of records where necessary. Each BDS required about 40 minutes with the respondent(s).
Although the behavioral items on the BDS were not changed, the other sections were revised continually during the five years of the study. The 1984 version of the BDS is presented in Appendix 4-1.
Procedures: General
In September 1978 a BDS was completed for every person at Pennhurst by teams of institutional staff members most familiar with the individuals. Each team usually included a direct-care worker, a psychologist, and a nurse. Written instructions were provided, and the Temple University Developmental Disabilities Center's Evaluation & Research team was available on site to answer questions about the form. A total of 1113 forms were completed (41 people had already left Pennhurst). This supplied the baseline data for the entire five year study.
In subsequent years, BDSs were collected by project field staff by direct interviews with interdisciplinary groups of direct care and other staff who knew the individuals best. Records were used to verify the data in the sections on written plan, demographics, health, and services. Exhibit 4-2 below displays the record of BDS data collection for the whole study.
| Year | At Pennhurst | In CLAs |
|---|---|---|
| 1978 | 1113 | 0 |
| 1980 | 713 | 70 |
| 1982 | 0 | 223 |
| 1983 | 618 | 408 |
| 1984 | 0 | 474 |
Data were not collected at Pennhurst in every year because the focus of interest was the effects of community placement. Originally, the study design did not call for any Pennhurst data after 1978. The Temple team added this facet after the study began because it made possible the matched comparison designs.
Methods: Matched Comparison Study
Design
The matched comparison design was implemented by identifying all the people in CLAs for whom baseline BDS data were available; for each one we then tried to find a person who was still at Pennhurst, and who was the same sex and was also very similar in initial adaptive behavior, maladaptive behavior, and age. For both groups ("movers" and "stayers") we compared 1983 BDS data to the 1978 baseline data, investigating whether one group had changed more than the other.
The matched comparison design is quasi-experimental. Specifically, it is a prepost nonequivalent control group design with subjects matched on pretest scores and several other variables. The weaknesses of the design are that no matching can be perfect,-and that no adequate matches may be available for some people, so that we can wind up with biased samples.
Our objectives were to compare the behavioral changes of matched samples of institutionalized and deinstitutionalized people and to identify, in a preliminary way, specific variables that might be associated with individual growth.
Subjects
Prerelocation (1978) and postrelocation (1983) data were available for 340 people who were placed in CLAs under federal court order. Each "mover" was matched as closely as possible with a person who was still at the institution in 1983, and there were 618 such "stayers." Individuals were matched on the bases of (1) gender, (2) chronological age +5 years, (c) prerelocation (1978) Adaptive Behavior total score +5 points, and (d) prerelocation Maladaptive Behavior Total Score +3 points. The matching process located excellent matches for 191 of the 340 movers. Perfect gender matches were found in all cases (134 males, 57 females); means for the two groups on the other matching variables are shown in Exhibit 4-3. No significant differences were found between the movers and stayers on the matching variables (using simple t-tests).
| Variables | Movers | Stayers |
|---|---|---|
| * Vision, hearing, and ambulation are on scales from 1 (extreme impairment) to 4 (no impairment). | ||
| Matching variables | ||
| 1978 Adaptive Behavior | 54.8 | 55.0 |
| 1983 Maladaptive Behavior | 18.3 | 18.1 |
| Age (in 1978) | 38.1 | 37.7 |
| Other variables* | ||
| Vision | 3.6 | 3.5 |
| Hearing | 3.9 | 3.8 |
| Ambulation | 3.4 | 3.4 |
| Years at Pennhurst (in 1978) | 24.3 | 23.8 |
Both the movers and the stayers displayed an average 1978 adaptive behavior score of 55 points (the scale ranges from 0 to 128), which was very close to the overall population's average of 51. In maladaptive behavior, both groups scored about 18 points, again close to the population average of 17 points. The average age for both groups (in 1978) was 38 years, similar to the population average of 39 years.
Group differences were examined on some other variables as well. Secondary conditions, including vision, hearing, and ambulation were compared using simple t-tests; none were significantly different. These results seemed to indicate a lack of "creaming" (i.e., selecting people to leave the institution specifically because of less serious secondary disabilities) in selection of the movers. No difference was found between movers and stayers in the number of years they had lived at the institution. Both groups averaged 24 years, the same as the population.
Thus, although not chosen by lottery, the people in this matched comparison study reflected the characteristics of the population quite well.
Results: Matched Comparison Study
Group Comparisons of Behavioral Change
Several methods of statistical analysis were used in the prior matched comparison of developmental growth (Conroy, et al., 1982); all led to the same conclusion as the simple t-test. Here, we present only the simple t-test because it is the most straightforward. As Exhibit 4-4 shows, the 191 people who were placed in community settings were functioning at a higher level of adaptive behavior in 1983 than were their matched peers who had remained at Pennhurst.
| 1978 | 1983 | Change | |
|---|---|---|---|
| * Higher scores are favorable for both. | |||
| Adaptive Behavior | |||
| Movers | 54.8 | 66.3 | +11.5 |
| Stayers | 55.0 | 55.7 | +0.7 |
| Maladaptive Behavior | |||
| Movers | 18.3 | 18.0 | -0.3 |
| Stayers | 18.1 | 18.2 | +0.1 |
A t-test on the 1983 adaptive behavior total scores of the two groups was significant (t = 3.94, (380), p = .001). The results in maladaptive behavior showed only very slight changes in both groups, and the t-test revealed no significant difference between the movers and stayers in 1983.
This analysis indicated that the deinstitutionalized group had improved in adaptive behavior by more than 11 points over a five year period, while the group which remained at Pennhurst gained less than one point. Neither group changed significantly in maladaptive behavior.
Group Comparison of Service Provided
Service data were collected in 1983 on the BDS for both the movers and the stayers. The amount of developmentally oriented service rendered in the prior month at t he living area was obtained. These services included training (e.g., academic, mobility, social, interaction, community living, etc.), skills development (dressing, eating, hygiene), therapy (physical, occupational, speech, etc.), behavior modification (to reduce maladaptive behavior), and supervised recreation. We also measured time spent at the day program (vocational, educational, etc.). Exhibit 4-5 presents average hours of service per person per month for the two groups.
| Movers | Stayers | |
|---|---|---|
| Services at Living Area | 104.5 | 156.0 |
| Day program | 120.7 | 33.1 |
| TOTAL | 225.2 | 189.1 |
As the table shows, people living at Pennhurst received more service on their living areas each month than their counterparts in the community. However, the movers spent more time at the day program and received more total service. On the average, the movers received 8.0 hours of service per day and the stayers received 6.8 hours of service per day.
Correlates of Adaptive Behavior Gains Among Movers
Because a substantial change in adaptive behavior was found only for the movers, we examined factors correlated with growth among the movers. Change in adaptive behavior was compared by Pearson correlations with 23 variables, including personal characteristics (sex, age, etc.), functioning level, secondary conditions (vision, hearing, ambulation, seizures), medical information, family contact, and service data. The results appear in Exhibit 4-6.
Three variables displayed significant correlations with adaptive behavior gains upon deinstitutionalization. They were year of admission to community living arrangement, ambulation, and beginning adaptive behavior total score.
These results suggested that (1) people who had been in CLAs the longest showed the most overall growth, (2) people who could not walk displayed more growth than those who could, and (3) people who started out with lower levels of adaptive behavior showed larger gains than did people who initially had more skills.
| r | p | |
|---|---|---|
| * Scale of 1 (extreme impairment) to 4 (no impairment). ** Higher scores are favorable. *** 0 = not, 1 = yes. | ||
| Year of admission to community living arrangement | -0.25 | 0.001 |
| Ambulation (1978)* | -0.23 | 0.001 |
| Adaptive behavior total score (1978)** | -0.21 | 0.001 |
| Number of goals in written plan | -0.11 | 0.057 |
| Weeks since case manager last visited | 0.11 | 0.058 |
| Level of retardation (1 = not retarded, 5 = profound) | -0.11 | 0.072 |
| IQ | 0.11 | 0.190 |
| Change of address in past year*** | 0.10 | 0.083 |
| Medical needs* | 0.09 | 0.098 |
| Sex (0 = female, 1 = male) | 0.08 | 0.137 |
| Family contact (1 = weekly, 5 = never) | -0.08 | 0.143 |
| Vision (1978)* | -0.07 | 0.169 |
| Maladaptive behavior total score (1978)** | 0.06 | 0.187 |
| Number of residents at the site | -0.06 | 0.225 |
| Year of admission to Pennhurst | 0.05 | 0.228 |
| Amount of behavior modification used | -0.05 | 0.231 |
| Months since last medical exam | 0.05 | 0.247 |
| Seizure frequency | -0.05 | 0.247 |
| Amount of developmental service received | -0.04 | 0.280 |
| Hearing (1978)* | 0.03 | 0.358 |
| Year of birth | 0.02 | 0.366 |
Methods: Longitudinal Study
Subjects
In 1984, we visited 474 people who left Pennhurst Center under court order at their new homes in CLAs. The information we had collected about these people since 1978 formed the data set for the longitudinal analyses of growth and development. Again, for convenience we will adopt the "movers" and "stayers" terminology.
In mid 1984 there were about 450 Stayers still living at Pennhurst. Ninety-two of the remaining 138 people (the original 1154 minus 474 minus 450) had died, 77 of them while still at Pennhurst and 15 in CLAs; 32 had gone to other congregate care facilities, and the other 14 had returned to the natural family at family choice.
The movers were living in small CLAs. Most, 63%, lived in three person CLAs. Another 1% were living in a CLA by themselves, 19% had just one housemate, 11% were in CLAs with a total of four to six people, and 6% were in settings with a total of seven to 11 people.
Because many past deinstitutionalization activities have resulted in creaming" or selection of only the highest functioning people for placement, an immediate question was how the movers compared to the original population of 1154 people. In prior years of the Pennhurst Study, we had found only trivial differences between Movers and Stayers; people being placed were just about the same as those still awaiting placement in the areas of adaptive and maladaptive behavior, age, level of retardation, and secondary handicaps. As our data set grew in numbers, some of the differences reached statistical significance, but they were still not large in magnitude, as shown in Exhibit 4-7.
| Movers | Population | |
|---|---|---|
| * t-test significance, p 0.01. | ||
| 1978 Adaptive Behavior | 59 | 51* |
| 1978 Maladaptive Behavior | 18 | 17* |
| Age in 1978 | 37 | 39* |
| Years at Pennhurst | 21 | 24* |
| Vision (1 to 4 scale) | 3.7 | 3.5* |
| Hearing (1 to 4 scale) | 3.8 | 3.8 |
| Ambulation (1 to 4 scale) | 3.4 | 3.3 |
The statistically significant differences meant that the people placed in CLAs by 1984 were slightly higher in adaptive behavior, had slightly fewer maladaptive behaviors, were about two years younger and had spent three fewer years at Pennhurst, and were slightly less likely to have a visual impairment, than the average person who lived at Pennhurst in 1978. These differences suggest that, strictly speaking, our findings for the people placed so far will not necessarily hold true for those to be placed in the future. However, the differences are small, and we think it is very likely that future placements will have outcomes very similar to those we have observed.
Design
The longitudinal approach is, in this case, really a family of analyses of the form called "interrupted time series" by Campbell (1967). We observed the behavior of people repeatedly, both before and after they moved to CLAs. The move to the CLA is the "interruption" in the time series. If significant changes are observed right at the time of the "interruption," then those changes are unlikely to be coincidental.
The strength of the design is enhanced by using all possible time series configurations available in the data set. We have done so. We collected BDS data (as previously displayed in Exhibit 4-1) in 1978, 1980, 1982, 1983, and 1984. For some individuals, we collected a BDS in all five years; these were people who were still at Pennhurst in September 1980, and went to CLAs in late 1980 or by the middle of 1981, so that we saw them in CLAs in 1982 (we only collected data for people after they had been out for six months or more). For other people, who moved in 1983, the 1982 CLA data point did not exist; for them, there were just four observations. When all of the permutations are examined simultaneously, we can see whether the results are consistent across all the ways of analyzing behavior change.
Results: Longitudinal Study
Adaptive Behavior
The overall results of the family of longitudinal analyses for adaptive behavior are presented in Exhibit 4-8 in numeric form. We will summarize the findings and then provide more detail on two of the clearest and most meaningful analyses. The overall questions are, again, did people change behaviorally upon deinstitutionalization, and did that pattern of change continue after placement?
| Design | Year | (N) | ||||||||
|---|---|---|---|---|---|---|---|---|---|---|
| 1978 (PC) | 1980 (PC) | 1982 (CLA) | 1983 (CLA) | 1984 (CLA) | ||||||
| * Entries connected by asterisks were significantly different by paired t-tests at p 0.001. | ||||||||||
| 1. | 51.4 | 51.6 | ***** | 59.9 | ***** | 65.2 | 65.1 | (92) | ||
| 2. | 53.0 | 53.6 | ****************************** | 63.8 | 65.1 | (176) | ||||
| 3. | 60.8 | ****************************** | 69.1 | ***** | 73.8 | 74.4 | (163) | |||
| 4. | 52.4 | 53.0 | **************************************************** | 64.8 | (200) | |||||
| 5. | 60.5 | ******************************************************** | 71.3 | 72.2 | (326) | |||||
| 6. | 59.3 | ****************************************************************************** | 70.7 | (383) | ||||||
Exhibit 4-8 indicates the five years of data collection across the top. The subheading "PC" means that the data in those columns were collected at Pennhurst Center, and the "CLA" subheading means the data were from CLAs. Overall, the table shows that significant gains never occurred within Pennhurst, always occurred upon CLA placement, and sometimes gains continued even after placement. Notably, none of the designs revealed significant growth among people in CLAs between 1983 and 1984.
In design 1, which included all five data points, the right hand column shows that N = 92, which means that there were 92 people who were at Pennhurst in 1978 and 1980, and then moved to a CLA in time for us to visit them in 1982 and 1983 and 1984. The asterisks show where significant increases in adaptive behavior occurred: for this design, significant increases were observed from 1980 to 1982 (initial CLA placement) and from 1982 to 1983 (advances continued after placement). The gains appeared to level off after 1983. Exhibit 4-9 presents these findings visually. Exhibit 4-9 also shows what is evident from all the designs in Exhibit 4-8: there was no statistically significant growth in this measure of adaptive behavior among these individuals while they were living at Pennhurst. The second longitudinal design included everyone for whom we had baseline 1978 data, who were still at Pennhurst in 1980, and who went to a CLA between 1980 and late 1982. There were 176 people in this category, and, as can be seen in Exhibit 4-10, they also made large gains in adaptive behavior upon community placement. The gain from 1983 to 1984, within the CLAs, was not statistically significant in this analysis.
Design 3 revealed the large initial gains, and also showed a continuation of growth within the community settings. Designs 4,5, and 6 further confirmed the lack of growth within Pennhurst and the sudden gains upon placement.
In sum, the adaptive behavior data showed clear and large gains among people who went to CLAs. After placement they were doing more things independently or with less help. Because this could have been the result of the change in environmental demands between the institution and the CLAs, it was important to test for continued growth after placement. In two of the longitudinal analyses (designs 1 and 3 in Exhibit 4-8), such continued growth was observed. In the first of those analyses, the post-placement growth rate was just as rapid as the large gains upon placement. These adaptive behavior findings, especially among people who had been institutionalized an average of 24 years, seemed to us to tell a very positive story about human potential that had laid dormant among these people with mental retardation.
EXHIBIT 4-9. Adaptive Behavior Growth: 5 Observations, 92 People
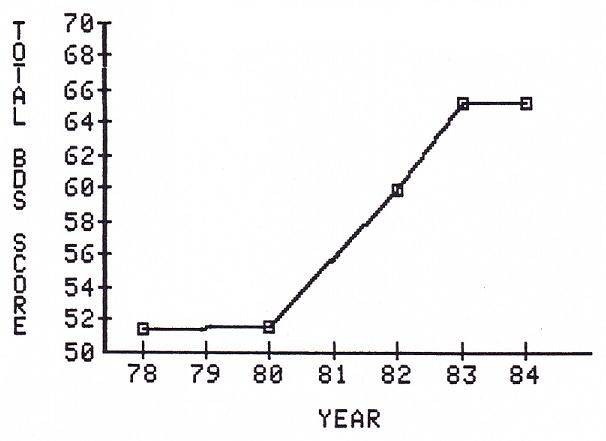
EXHIBIT 4-10. Adaptive Behavior Growth: 4 Observations, 176 People
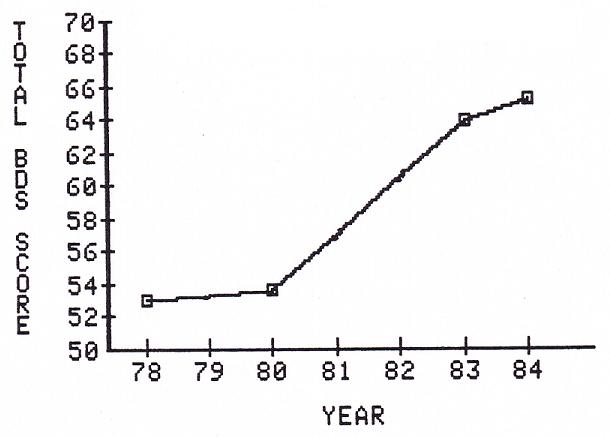
Maladaptive Behavior
The results of the longitudinal analyses of changes in our measure of maladaptive behavior were that there was no significant change when people went to CLAs. The data are presented in Exhibit 4-11.
| Design | Year | N | ||||||||
|---|---|---|---|---|---|---|---|---|---|---|
| 1978 (PC) | 1980 (PC) | 1982 (CLA) | 1983 (CLA) | 1984 (CLA) | ||||||
| * Entries connected by asterisks were significantly different by paired t-tests at p 0.05. | ||||||||||
| 1. | 17.2 | 17.0 | 17.2 | 17.7 | 17.8 | 93 | ||||
| 2. | 17.2 | 17.3 | 17.6 | 17.7 | 179 | |||||
| 3. | 17.9 | 18.1 | ***** | 18.6 | 18.6 | 165 | ||||
| 4. | 17.3 | 17.3 | 17.6 | 203 | ||||||
| 5. | 18.1 | 18.3 | 18.5 | 326 | ||||||
| 6. | 18.0 | 18.2 | 386 | |||||||
Exhibit 4-11 represents over 5 years of trying to detect any change on this scale, and the only one noted was statistically weak and was within-CLA rather than a change upon placement. It is possible that there was no improvement in the maladaptive behavior area among these people over the years. But it is equally possible that our scale was not sensitive or reliable enough to detect genuine changes.
As noted previously, the maladaptive behavior scale suffers from a lack of interrater reliability. Different respondents do not agree very well on what constitutes, for example, "Rebelliousness." This makes it difficult to attain statistical significance; the "signal" (behavioral change) must be very "loud" (large in magnitude) to be heard over the "noise" (random error of measurement). Indeed, it is at least suggestive that all of the rows in Exhibit 4-11 show increased scores after CLA placement, and thereafter maintainance or further increases; even though the trends do not reach statistical significance, we suspect that changes may be taking place.
In summary, however, we are not statistically scientifically able to report any significant benefits of deinstitutionalization in the area of reduction of maladaptive behaviors.
Longitudinal Changes in Service Delivery Patterns
The services section of the BDS was developed only after 1978, so there were no baseline data on services rendered to the population. In 1980, at Pennhurst, we did collect services information, and also in the community in subsequent years. This enabled longitudinal analysis of changes in the amount and pattern of services rendered to people. This time, we were asking the question "Is this person receiving more or less or different services in the community than s/he formerly received at Pennhurst?"
This is different from the matched comparison analysis, which asked whether two groups of similar people were receiving different services in 1983. In the longitudinal approach, we ask whether a person in the community in 1984 is receiving more or less or different services than that same person previously received at Pennhurst in 1980.
The results were much like those of the matched comparison. The summary figures are given in Exhibit 4-12.
| 1980 (PC) | 1984 (CLA) | |
|---|---|---|
| Services at Living Area | 139 | 95 |
| Day program | 48 | 119 |
| TOTAL | 187 | 214 |
The decrease in hours of service per month delivered via the residential program was significant (t=5.17, (206), p.001), meaning that the community service system delivered fewer hours of developmentally oriented programming, at the place where the person slept, than did the institution.
The community system delivered more than twice the amount of day programming, away from the place where the person slept, than the institution (t=19.6, (205), p.001). When the two forms of service were combined into a total index, the 1984 community service system was delivering a larger quantity of service to these people than they had previously received at Pennhurst in 1980 (t=4.15, (205), p.001).
As an exploration of an urgent contemporary issue in service delivery, we tested whether the 207 people in our data set who had been at Pennhurst in 1980 and were in CLAs in 1984 had shown any change in the number of medications administered to them on a daily basis, other than topical ointments and vitamins. At Pennhurst in 1980, these people had received an average of 2.1 medications each day; in 1984 in CLAs, they received an average of 1.7. The decrease was significant (t=3.22, (206), p.001).
Discussion
The overall results of five years of investigation into the behavioral consequences of deinstitutionalization are clear: in terms of adaptive behavior, the average person who left Pennhurst is better off. The average person is now about 11 points higher on our 128 point scale of adaptive behavior than s/he was while at Pennhurst. Matched people still living at Pennhurst did not show significant improvements. Moreover, the dramatic and sudden increases in adaptive behavior after CLA placement did not stop and level off; for at least a year after placement, the average person continued to display significant developmental growth.
The evidence suggests, however, that gains begin to level off at some point, usually a year or more after placement. It seems to us that the lack of significant growth from 1983 to 1984 demands attention and continued study. We will continue this investigation with support from the Commonwealth of Pennsylvania.
We should reiterate here however, that during the course of the study we did detect favorable behavior changes among the people living at Pennhurst. When all the people at Pennhurst are included in the analysis, we do attain statistical significance, as reported by Lemanowicz, Conroy, & Feinstein (1984). These gains amounted to just over 1 point in adaptive behavior and under 1 point in maladaptive behavior. This finding is mentioned here because it suggests that, unlike the situation at Pennhurst at the time of the trial in 1977, people have not been regressing while residing at the institution. At the trial, evidence indicated that the average person at Pennhurst had lost skills during his/her time there. In more recent years, then, that situation has changed. Any visitor can tell in a brief tour that Pennhurst has improved over the years, and it may be that our findings of growth are quantitative reflections of that fact.
Nevertheless, the results of the two designs presented here do establish the quantitative superiority of CLA settings in fostering adaptive behavior expression and growth. People who have gone to CLAs have gained literally 10 times as much as the people who still await placement.
The limitations of the two designs should be kept in mind, and, even more important, our caution about generalization of these results to other areas or states is very important. To the extent that a community service system is similar to the Pennsylvania model, such generalization is warranted with moderate caution. But for systems unlike the one implemented for the Pennhurst class members, it would be extremely hazardous to assume that our findings will apply.
In addition to the elementary finding that people are better off in terms of behavior, we also noted that the pattern and amount of developmentally oriented services rendered had changed. The patterns were that the institution delivered more service at the living area, while the community system delivered more service at the day program, and more service overall (6.8 versus 8.0 hours per day for Pennhurst and CLAs respectively). Thus we conclude that the people who have left Pennhurst are also better off in terms of the amount of developmentally-oriented service rendered to them. We hope that further evaluative studies will address the quality and consequences of various kinds of day program.
We also examined medication use, and found that the average person who had been placed was receiving fewer daily medications than previously at Pennhurst. This would usually be regarded as a favorable outcome, because there has been a great deal of concern in the field of mental retardation about overuse and misuse of many kinds of medications, particularly those used for behavior control, and particularly when they may have serious and permanent side effects such as tardive dyskinesia. (We should also note that, from 1980 to 1983, since the reorganization of medical services at Pennhurst under the auspices of a private corporation, the average person at Pennhurst is also receiving fewer medications.)
Other than the essential findings that people are better off in terms of behavior and services, we believe the most important outcome of our years of work in this area is that we have developed a technology for quantitative monitoring of the well being of people in dispersed, decentralized community service systems. Many observers have suggested, over the years, that the difficulties in monitoring community services would be enormous compared to the ease of monitoring all the people in one place at an institution. This has been offered as a major argument against deinstitutionalization.
In fact, quantitative monitoring is not a difficult process at all, nor does it need to be terribly costly. The Temple part of the team has embarked on a long term partnership with the Pennsylvania Office of Mental Retardation to continue monitoring the Pennhurst class members when the Federal funds for this study expire, and to expand that monitoring as rapidly as possible to other people in community settings. Although our once a year monitoring visits are no substitute for frequent case manager visits, active family participation, fiscal controls, and alert neighbors, the quantitative information about individual growth (or regression), individual services, family opinions, and environments yields a rich basis for individual corrective actions and for systematic analysis and planning.
References
Aanes, D., & Moen, M. (1976). Adaptive behavior changes of group home residents. Mental Retardation, 14, 36-40.
Arndt, S. (1981). A general measure of adaptive behavior. American Journal of Mental Deficiency, 85, 554-556.
Bassuk, E.L., & Gerson, S. (1978). Deinstitutionalization and mental health services. Scientific American, 238, 46-53.
Brown, M. (1978). Evaluation report: Post-institutional placement project. New York: New York University Institute of Rehabilitation Medicine.
Campbell, D.T. (1967). Reforms as experiments. American Psychologist, 24, 409-429.
Conroy, J. (1980). Reliability of the Behavior Development Survey (Technical Report 80-1-1). Philadelphia: Temple University Developmental Disabilities Center.
Conroy, J., Efthimiou, J., & Lemanowicz, J. (1981). Reliability of the Behavior Development Survey: Maladaptive behavior section (Pennhurst Study Brief Report No. 11). Philadelphia: Temple University Developmental Disabilities Center.
Conroy, J., Efthimiou, J., & Lemanowicz, J. (1982). A matched comparison of the developmental growth of institutionalized and deinstitutionalized mentally retarded clients. American Journal of Mental Deficiency, 86, 581-587.
Conroy, J., Feinstein, C., & Lemanowicz, J. (1981). Medical needs of clients: Perceptions of relatives and of staff (Pennhurst Study Brief Report No. 6). Philadelphia: Temple University Developmental Disabilities Center.
Craig, E.M., & McCarvar, R.B. (1984). Community placement and adjustment of deinstitutionalized clients: Issues and findings. In: N. Ellis & N. Bray (Eds.), International review of research in mental retardation, Volume 12. Orlando: Academic Press.
Fiorelli, J., & Thurman, S.K. (1979). Client behavior in more and less normalized residential settings. Education and Training of the Mentally Retarded, 14, 85-94.
Goffman, E. (1961). Asylums. New York: Doubleday-Anchor.
Gold, M.W. (1973). Research on the vocational habilitation of the retarded: The present, the future. In N.R. Ellis (Ed.), International review of research in mental retardation, Volume 6. New York: Academic Press.
Isett, R., & Spreat, S. (1979). Test-retest and interrater reliability of the AAMD Adaptive Behavior Scale. American Journal of Mental Deficiency, 84, 93-95.
Isett, R., & Spreat, S. (1978). Progress accountability and deinstitutionalization. Technical report 78-3-3. Philadephia: Temple University/Woodhaven Center.
Lemanowicz, J.A., Conroy, J.W., & Feinstein, C.S. (1984). A quantitative overview of Pennhurst Center: 1978 to 1983 (Pennhurst Study Brief Report #16). Philadelphia: Temple University Developmental Disabilities Center.
Schroeder, S.R., & Henes, C. (1978). Assessment of progress of institutionalized and deinstitutionalized retarded adults: A matched-control comparison. Mental Retardation, 16, 147-148.
Willer, B., & Intagliata, J. (1984). An overview of the social policy of deinstitutionalization. In: N. Ellis & N. Bray (Eds.), International review of research in mental retardation, Volume 12. Orlando: Academic Press.
Wolfensberger, W. (1972). The principle of normalization in human services. Toronto: National Institute on Mental Retardation.
Wolfensberger, W., & Glenn, L. (1975). Program analysis of services 3: A method for the quantitative evaluation of human services. Toronto: National Institute on Mental Retardation.
CHAPTER 5: CONSUMER SATISFACTION
Consumer Interview Case Study: If I Were a Rich Man
Steve moved to the community after having lived at Pennhurst for 27 years. While Steve reported having been very happy at Pennhurst, he is even happier in his new group home. When he was asked what he liked about the group home, he talked about how good the staff were to him and how they had put a bell in his bedroom so that if he needed help during the night he could just ring and the staff person would come (Steve is non-ambulatory). Steve also talked about how good he felt having been able to visit his Aunt Sue when she was in the hospital.
When asked if he missed Pennhurst or any of the people, Stave said no. After thinking for a moment he said that he does miss a few of his friends, but not very much. When he was at a Speaking for Ourselves meeting be saw a few of his friends from Pennhurst who were now also living in group homes. Steve explained that Speaking for Ourselves is a place where you talk about a lot of things, like Pennhurst closing, and if you have a problem or something is bothering you they try to help you figure it out.
When asked what he would wish for if he had one wish, Steve responded, "I wish for people to live with me who are nice and kind to me like these people."
Bruce would like to stay in his group home. He moved there about 6 months ago, after having lived at Pennhurst for 28 years. He likes living in the community, because he gets to see his sister and her family and he works and earns money. (Bruce works on a pressing machine that steams and presses cardboard.)
When asked how his group home differs from Pennhurst, Bruce said, "Pennhurst was alright, I grew up in that place. We have different hours of getting up and going to sleep here. We have Saturdays and Sundays to ourselves. This is more home; there is no big crowd, just a few people." When asked what he would wish for if he had one wish, Bruce replied, "I wish I was a millionaire."
Introduction
Among the many ways that the well-being of people with mental retardation may be assessed, one that stands out in importance and in difficulty is to ask the people themselves. In the Pennhurst Study, we were determined to address the feelings of the people themselves to the maximum extent possible.
It seemed particularly important to avoid the common error of assuming that only parents and professionals can make valid judgments about whether a person with mental retardation is better off. As Seltzer (1980) pointed out, "A critical, yet often ignored, aspect of retarded persons' community adjustment is their perceptions about their environments and the psychological sense of well being or discomfort derived from their living environments." However, Sigelman, et al. (1979) stated that, despite a trend toward allowing and encouraging people with mental retardation to speak for themselves, “...virtually nothing is known about the reliability and validity of information gained through survey research" (p. 1) with them.
It was clear at the outset that the methodological difficulties were considerable. For example, because we knew that nearly half of the people living at Pennhurst Center were nearly or completely nonverbal, we knew that the views of the people who were able to speak would not necessarily represent the views of those who were unable to speak.
In addition to this problem of representativeness, prior studies had suggested that some people with mental retardation had difficulty in expressing themselves in a consistent fashion. Despite these problems, it was decided that the effort to measure changes in individual satisfaction after movement from the institution to small community based living arrangements was demanded by the nature of the study.
The consumer interviews part of the study, then, addressed two objectives. First, it was designed to ascertain whether people who moved from Pennhurst into community living arrangements (CLAs) were pleased with the change, and whether there was any change in their self-expressed satisfaction and happiness. Second, because of questions about the reliability and validity of such interviews, the study was also intended to shed new light on the methodological problems inherent in soliciting direct consumer input.
Moreover, the study was, unexpectedly, able to investigate changes over time in the self-expressed satisfaction and happiness of people who remained at Pennhurst during the years in which the population of the facility dropped from 1154 to 450.
Methods
Consent Procedures
At the outset, it was determined that this phase of the study required extremely careful attention to the rights and privacy of the individuals themselves, because this was practically the only part of the effort that demanded direct contact. Certainly, if an individual said that s/he was not willing to be interviewed, then no interview would be done. But there were others who might have an important viewpoint regarding the advisability of the person's participation as well: program staff and families. We considered all of these parties. The only people we interviewed were those (a) who appeared, from prior data, to be capable of responding to verbal interview, (b) for whom staff judged there would be no significant risk to the person, (c) for whom written informed consent was obtained (either from families, or, in the case of people who had no family but were capable of giving their own informed consent, from the people themselves), and (d) who agreed on their own behalf when approached by our interviewers.
Our extreme caution in safeguarding rights and privacy in this part of the study grew at least partly from the knowledge that, in past years, people living in institutional settings have been part of studies that would never have been approved if the subjects had not been labeled mentally retarded.
Design
Interviews were designed to be administered to a sample of people still at Pennhurst in 1980, and then again after as each person was placed into a community living arrangement (CLA). The "pre" interviews at Pennhurst and the post" interviews in community settings asked the same standardized questions about resident satisfaction with the living situation, activities and services received, and general self-reported aspects of "happiness."
This simple pre-post consumer interviews design had not been implemented previously in any study of deinstitutionalization known to us. Even the pioneering work of Edgerton (1967), and Edgerton & Bercovici (1976) was based on interviews that began only after people had moved into community living. In related work, Birenbaum & Seiffer (1976) and Birenbaum & Re (1979) followed and interviewed adults for four years, and utilized a standardized questionnaire, but again the study began only after placement into community settings.
In our design, we waited about six months after each person's placement, and then conducted the post-placement interview. The first post-placement interview occurred in early 1981, the last in mid-1984.
We expected, on the basis of prior literature, that the people with the most functional skills (especially verbal) would probably be among the first to move to CLAs. Because the people in this part of the Pennhurst Study had verbal skills, we thought that, by the end of the study, most would be in CLAs. In fact, when the study was finished, only about half of the people in our Consumer Interview sample had left Pennhurst. (For convenience, this group will be referred to as "movers.")
This presented an opportunity to reinterview the people who were still at Pennhurst in 1984 ("stayers") and to check for changes in their self-reported satisfaction and happiness. This was not viewed as a control group, because there was no matching or random assignment, but rather as a convenient but non-equivalent group for whom the results would also be of interest. As institutional populations decrease during moves toward closure, it is important to know how such a situation affects the people who still live in those facilities. The results of interviews with the two groups, movers and stayers, were not intended to be compared to one another; they were two separate studies, each with its own set of policy implications.
Subjects
The sample of people interviewed in this part of the Pennhurst Study was not representative of the 1154 people who lived at Pennhurst in 1978, nor was it representative of all the people who moved to CLAs. Again, this was because the interview method itself biased the sample by excluding all people who were not able to communicate verbally (or by signing). Nevertheless, every effort was made to select a sample of people that would reflect the diverse elements of the verbal portion of the Pennhurst population.
Subject selection took place in Spring of 1980, after all design and instrument development was completed. The first stage of selection was to decide which people would be eligible for inclusion. Naturally, the people who had already left Pennhurst could not be included. It was also decided for economic reasons that, of the people still at Pennhurst, only the people who were originally from the greater Philadelphia area (the five southeastern counties of Pennsylvania) would be candidates.
Using this decision rule, there were 713 candidates for inclusion in the consumer interviews. These were all the people who lived at Pennhurst in May 1980, and who came from the Southeast Region of Pennsylvania. We then examined Behavior Development Survey data (collected at Pennhurst in 1978) to identify all the people who were reported to possess moderate or good verbal skills. There were 287 such individuals.
From these 287, we wished to select a representative sample. In the view of the Temple team, the best such sample would have been simple random. However, a consultant retained as an outside methodological reviewer by the government required a stratified sample of 60 people, with approximately 15 from each labeling category for level of retardation: mild, moderate, 'severe, and profound.
In our first stage of probabilistic selection, we oversampled from each of the four categories. By simple random selection, about 25 were taken from the moderate, severe, and profound categories; all 19 people labeled mild were taken. In all, 92 people were selected at this stage. The oversampling was in anticipation of losses due to our strict consent procedures.
Because we were only able to secure complete consent and valid interviews with 35 of these 92 people, a second stage of sample selection was initiated, by similar rules, in which 51 additional people were drawn. In all, then, we drew 143 candidates for interviews in this part of the study. By the completion of the baseline surveys, we had interviewed 56 people who lived at Pennhurst in the summer of 1980. The disposition of the sample is displayed in Exhibit 5-1.
Exhibit 5-1 shows that the people we interviewed were not representative of all the people at Pennhurst, nor even of all verbal people. People with fewer functional abilities were underrepresented from either point of view.
| Reported Level of Retardation | ||||
|---|---|---|---|---|
| Mild | Moderate | Severe | Profound | |
| The universe of 713 | 21 (3%) | 55 (8%) | 197 (28%) | 440 (62%) |
| The 287 verbal people | 19 (7%) | 52 (18%) | 136 (47%) | 80 (28%) |
| The 143 drawn in sample | 19 (13%) | 45 (30%) | 43 (30%) | 36 (25%) |
| The 56 completed baseline interviews | 12 (21%) | 15 (27%) | 22 (39%) | 7 (13%) |
| The 30 Movers | 7 (23%) | 8 (27%) | 12 (43%) | 2 (7%) |
| The 26 Stayers | 5 (19%) | 7 (27%) | 9 (35%) | 5 (19%) |
The table also shows that, between stayers and movers, the differences in level of retardation were small but noticeable; again, these two groups were not treated as controls or comparisons.
Because of the way subjects were selected in this part of the Pennhurst Study, the consumer interviews should be viewed as (a) a case study of changes in the self-reported well-being of a specific group of deinstitutionalized people, (b) a case study of changes in the self-reported well-being of a specific group of people living in an institution as it phases down, and (c) an exploration of reliability and validity issues in direct consumer surveys.
Instruments
An extensive search for prior work in this area was initiated in 1979. The study team obtained copies of instruments used before, analyzed all available literature, and telephoned many of the researchers who had conducted such work. A draft instrument was developed from this groundwork in 1979. It was pilot tested and revised. In Spring of 1980 it was tested again, this time comparing telephone interviews to face-to-face interviews (Conroy & Beyer, 1979). The third revision was piloted during Summer 1980, and an entire new section was added to assess respondents' ability to label their own feelings accurately.
In the process of instrument development, the weight of prior research demanded primary attention to reliability. Sigelman, Winer, Schoenrock & Hromas (1978) focused on the problems of responsiveness, reliability or consistency, and response bias. The difficulties they noted were considerable; the suggestion they offered was that any such interview effort should include alternative format questions and checks for consistency. Winer, Sigelman, Schoenrock, Spanhel, & Hromas (1978) compared responsiveness to Yes-No, Either-Or, Multiple-Choice, and Open-Ended questions. The Yes-No format appeared to yield the highest proportion of responses and also the highest consistency. Yet Sigelman, Budd, Spanhel, & Schoenrock (1981) suggested that Yes-No questions were problematic because of a common tendency to say "Yes" to all questions, regardless of content; this was called the acquiescence phenomenon.
Our interview was designed with these studies in mind. It contained, in its final form, 12 Yes-No, 3 Either-Or, 4 Open-Ended, and an entire separate section of 7 Multiple-Choice (Likert scale) items with five facial drawings (big smile, small smile, neutral, small frown, big frown) to assist in labeling the way people felt about various issues. The questionnaire is included as Appendix 5-1.
An important facet of the interview instrument was the fact that there were six pairs of redundant questions. They were designed specifically as checks for consistency on the most important questions. For example, we asked, "Do you like living here?" (a Yes-No question), and later in the interview we asked "Would you like to leave here and live somewhere else?" (another Yes-No), and also "Which [face] is most like how you feel about living here?" (a Multiple-choice item with visual aids). These check items were intended to give the most weight to consistent responses.
Procedures
Interviews were generally scheduled by contacting the residential staff and then the individuals themselves. Appointments were made by telephone. The interview data were collected directly on the form in Appendix 5-1. Researchers at Temple edited the forms and entered the data directly onto mainframe disk storage, and conducted analyses using the Statistical Package for the Social Sciences (SPSS).
Results
Internal Consistency: Acquiescence and Nay-Saying
The problem of acquiescence was first noted by Rosen, Floor, & Zistein (1974) in connection with interviews of people with mental retardation. More recently, it was investigated by Sigelman, Budd, Spanhel, & Schoenrock (1981). Their article, titled "When in doubt, say Yes," concluded that many people with retardation were likely to say "Yes" to any question that was not clear, concrete, and immediate. They speculated that this was part of a general tendency to avoid responses that "normal people might interpret as negative, resistive, or rebellious. In related work, Sigelman, et al., (1979) found a smaller number of people who acted in the opposite way, saying "No" to all questions - a phenomenon called nay-saying.
In their samples, Sigelman and colleagues found an acquiescence rate of 44% on Yes-No items, and a nay-saying rate of 4%. Because of their work, we included check questions for five of the Yes-No questions. They are shown in Exhibit 5-2, along with the results as to consistency.
Exhibit 5-2 shows, in the column headed "Acq," the number of people who displayed acquiescence on each item pair. This means that they said "Yes" to the Yes-No question, but then contradicted that answer on the check question. The column headed "Nay" works the same way for people who said "No" and later contradicted that answer.
| Question | # of Responses | # Acq. | # Nay |
|---|---|---|---|
| YES-NO VERSUS YES-NO | |||
| Q3: Do you want to keep on living here? | Pre: 55 Post: 53 | 16 8 | 0 0 |
| Q16: If you could, would you like to leave here and live somewhere else? | |||
| YES-NO VERSUS SCALE | |||
| Q1: Do you like living here? | Pre: 48 Post: 46 | 6 1 | 6 0 |
| Q7B: Which face is most like how you feel about living here? | |||
| Q13: Do you like your day program? | Pre: 46 Post: 42 | 4 1 | 2 0 |
| Q10B: Which face is most like how you feel about your day program? | |||
| Q2: Do you like the people who work here? | Pre: 48 Post: 45 | 6 2 | 1 1 |
| Q11B: Which face is most like how you feel about the staff? | |||
| YES-NO VERSUS EITHER-OR | |||
| Q2: Do you like the people who work here? | Pre: 54 Post: 53 | 3 1 | 5 1 |
| Q7: Are people here mean or nice? | |||
| OVERALL | Pre: 251 Post: 239 | 35 13 | 14 2 |
There is a lot of information in Exhibit 5-2, but there are really just three main points. First, our overall rate of acquiescence in the baseline interviews at Pennhurst was 35 occurrences out of 251 possible occurrences, or 14%. This was much less than the rate of 44% reported by Sigelman et al. (1981). Second, our baseline rate of nay-saying was 6%, about the same as the Sigelman et al. rate of 4%. Third, our rates of inconsistent responses declined sharply in the post interviews; the rate of acquiescence in the post-test was 5% and the nay-saying rate was 1%. This decline was statistically significant (even by the relatively conservative nonparametric Wilcoxon T test, p.001). Further investigations revealed that significant declines in inconsistencies occurred among the movers and among the stayers.
Internal Consistency: Recency
Spanhel, Sigelman, Schoenrock, Winer, & Hromas (1978) reported that 28% of the responses of institutionalized children to Either-Or items were inconsistent because of "recency." For example, when asked "Are you big or small?" and later "Are you small or big?," 19% of the children chose the most recently heard option both times (small the first time and big the second time), and another 9% chose the first option offered both times. Our questionnaire contained one pair of questions to check recency:
Q8: Are you usually happy or sad?
Q15: Are you usually sad or happy?
In the baseline interviews, 53 people responded to both items. Among Item, 3 people chose the first option on both questions, and 8 people chose the second option on both questions, for a combined "recency" inconsistency rate of 21%. This was somewhat less than in the prior work of Spanhel et al., probably partly because of our screening procedures and partly because Spanhel et al. were dealing exclusively with children. In our second round of interviews, there were 54 people who responded to both questions. None of them chose the first option on both questions, and nine chose the second item on both questions (17%). This was not significantly different from the baseline recency rate.
Changes in Satisfaction: The Movers
Of the 56 people interviewed at Pennhurst in the 1980 baseline, 30 had moved to community living arrangements (CLAs) and had been reinterviewed there by 1984 (movers). This section presents our findings for these movers.
In the baseline, 18 of the 30 movers had said "Yes" in answer to the question "Do you like living here?" However, as shown in the upper part of Exhibit 5-3, four of those 18 later contradicted themselves on the check question by indicating that they felt "Sad" or "Very Sad" about living there. In the table, these four can be seen in the "Yes" column (one sad and three very sad). The people who were consistent in their responses are marked with an asterisk; those who contradicted themselves are marked with parentheses.
| PRE: At Pennhurst | Q1: Do You Like Living Here? | |||
|---|---|---|---|---|
| Yes | In Between | No | ||
| Q7B: Which face is most like how you feel about living here? | Very Happy | 9* | 0 | (1) |
| Happy | 3* | 0 | (2) | |
| Neutral | 2 | 3* | 1 | |
| Sad | (1) | 0 | 0* | |
| Very Sad | (3) | 1 | 1* | |
| (3 people did not respond) | ||||
| POST: In Community Living Arrangements | Q1: Do You Like Living Here? | |||
| Yes | In Between | No | ||
| Q7B: Which face is most like how you feel about living here? | Very Happy | 21* | 1 | (0) |
| Happy | 1* | 0 | (0) | |
| Neutral | 1 | 1* | 1 | |
| Sad | (0) | 0 | 0* | |
| Very Sad | (0) | 0 | 0* | |
| (4 people did not respond) | ||||
The table revealed that these verbal individuals had increased in their self-reported level of satisfaction with their living arrangements, but the data in the table must be interpreted carefully. In the baseline, at Pennhurst, 12 people, or 40% of the sample, reliably expressed satisfaction with living there; conversely, one person (3%) was reliably dissatisfied. Later, in CLAs, 22 people, or 73% of the sample, reliably expressed satisfaction, and no one was consistently dissatisfied. By this measure, satisfaction had almost doubled. On the facial picture scale item, the increase in expressed was tested both with the parametric t-test (t=4.30, (24), p.001) and with the nonparametric Wilcoxon T (p.001).
A condensed presentation of the responses of the movers to the check question described above, and to the five other sets of check questions, is given in Exhibit 5-4.
| Before | After | Change | ||
|---|---|---|---|---|
| Satisfaction with Living Arrangement (Q1 and Q7B) | Satisfied | 40% | 73% | +33% |
| Dissatisfied | 3% | 0% | -3% | |
| Desire to Move (Q3 and Q16) | Satisfied | 43 | 63 | +20 |
| Dissatisfied | 17 | 7 | -10 | |
| General Happiness (QB and Q15) | Satisfied | 67 | 67 | 0 |
| Dissatisfied | 3 | 0 | -3 | |
| Satisfaction with Staff (Q2 and Q7) | Satisfied | 60 | 80 | +20 |
| Dissatisfied | 0 | 0 | 0 | |
| Satisfaction with Staff (Q2 and Q11B) | Satisfied | 53 | 63 | +10 |
| Dissatisfied | 7 | 0 | -7 | |
| Satisfaction with Day Program (Q13 and Q10B) | Satisfied | 53 | 53 | 0 |
| Dissatisfied | 0 | 7 | +7 |
The figures in Exhibit 5-4 reflect only the consistent responses, and all the percentages are taken as fractions of the entire 30 people in the movers group. We have already discussed the first change in the table, Living Arrangement. The second change was in Desire to Move, which decreased; at baseline 17% wanted to move and after relocation it was 7% (Wilcoxon T, p.01). On the General Happiness questions (Are you usually happy or sad), the table shows that there was no change. About two thirds reliably said they were usually happy, both while they were at Pennhurst, and later in the CLAs. On both sets of check questions about staff, the proportion of people who reliably reported positive feelings increased after CLA placement (Wilcoxon T, p.05). Finally, there were no significant changes in satisfaction with the day programs; although not statistically significant, it is worth noting that this was the only area in which there was increased dissatisfaction; two people reliably expressed dissatisfaction with their community based day programs.
Thus, in four of the six areas of satisfaction in which the consistency and reliability of responses could be checked, satisfaction increased; in the other two areas, satisfaction was unchanged.
There were also a number of questions for which there were no check questions. There were no significant changes from pre to post relocation for "Do you have any real good friends?" or "Do you ever see anyone in your family?" or "Do you make any money?" A significant increase was noted for "Do you have a girlfriend/boyfriend?" from 10 people saying "Yes" in the baseline to 17 saying "Yes" after relocation to CLAs.
The smile face Likert scale items were of special interest, and further analyses of change were undertaken. The special interest arose from prior reports of failure of this question format (Winer, et al., 1978) because too few people could respond to it at all; yet, if it could work, the data from a five point scale might be more useful than simple Yes-No answers. As has already been noted, in our sample, the smile face format worked fairly well; response rates did not drop Much below those of the Yes-No and Either-Or formats. It was therefore possible to treat the seven smile face items as ordinal scales, calculating average scores on each one before and after relocation, and to use routine statistical tests of significance of change. For each item, a score of 1 meant the "big frown" face, and a "5" meant the "big smile." Thus higher scores were more positive. The results are presented in Exhibit 5-5.
| Which fact is most like how …” | Mean Score Before | Mean Score After | Significance of t (T) |
|---|---|---|---|
| Q7B you feel about living here? | 3.4 | 4.7 | 0.001 (0.001) |
| Q8B the staff feel about you? | 3.5 | 4.3 | 0.021 (0.028) |
| Q9B the other residents feel about you? | 3.4 | 4.0 | 0.076 (0.096) |
| Q10B you feel about your day program? | 3.9 | 3.9 | 1.00 (1.00) |
| Q11B you feel about the staff? | 3.8 | 4.3 | 0.109 (0.140) |
| Q12B you feel about the other residents? | 3.3 | 4.3 | 0.021 (0.026) |
| Q13B you feel about yourself? | 4.1 | 4.3 | 0.484 (0.469) |
| OVERALL SCALE | 25.5 | 30.0 | 0.001 (0.003) |
The test of significance of change from before relocation to after was the simple paired t-test. The sample size was often less than 30 because not everyone answered every question; therefore we also ran the nonparametric Wilcoxon T tests. Significances of the Wilcoxons are shown in the Parentheses. The t and the Wilcoxon were nearly identical in each case.
The largest and most significant change was in how people felt about where they lived, which became more positive in the CLAs. Significant changes were also noted in people's beliefs about how staff felt about them, and how people felt about the other residents. When all seven Likert items were added up to form a single satisfaction scale, the change on this "overall scale" was also significant. Results on the overall scale showed that the movers were more satisfied in three of these seven areas, and also overall, after they moved into the CLAs.
Changes in Satisfaction: The Stayers
For the 26 people we interviewed in 1980 at Pennhurst who were still living at Pennhurst in 1984, it was of interest to find out whether they had changed in any areas of satisfaction/happiness. Certainly, the four years had been eventful ones in the history of Pennhurst. The population declined from about 1000 to about 450 in those years, some buildings had closed, some staff had been furloughed, and it had been announced by the Department of Public Welfare that Pennhurst definitely would close. For these reasons, we conducted reinterviews with the 26 people in the Summer of 1984.
Exhibit 5-6 shows a summary of the changes in satisfaction among Stayers on the items for which we had check questions.
| 1980 | 1984 | Change | ||
|---|---|---|---|---|
| Satisfaction with Living Arrangement (Q1 and Q7B) | Satisfied | 42% | 35% | -7% |
| Dissatisfied | 12% | 27% | +15% | |
| Desire to Move (Q3 and Q16) | Satisfied | 35 | 27 | -8 |
| Dissatisfied | 27 | 35 | +8 | |
| General Happiness (Q8 and Q15) | Satisfied | 50 | 58 | +8 |
| Dissatisfied | 8 | 15 | +7 | |
| Satisfaction with Staff (Q2 and Q7) | Satisfied | 65 | 69 | +4 |
| Dissatisfied | 4 | 0 | -4 | |
| Satisfaction with Staff (Q2 and Q11B) | Satisfied | 38 | 50 | +12 |
| Dissatisfied | 12 | 0 | -12 | |
| Satisfaction with Day Program (Q13 and Q10B) | Satisfied | 38 | 58 | +20 |
| Dissatisfied | 4 | 4 | 0 |
The data in Exhibit 5-6 indicate, if anything, a slight decrease in satisfaction with the living situation, as evidenced by the consistent responses to the first two pairs of check questions, on which satisfaction decreased slightly and dissatisfaction increased slightly. General happiness appeared to increase for some, and decrease just as much for others. Changes regarding satisfaction with staff were all in a positive direction. The largest change was an increase in satisfaction with the day program. Statistical tests, however, showed that none of these changes were significant.
The unchecked items regarding good friends, girlfriends and boyfriends, family contact, and making money were also examined for change from 1980 to 1984. There were no significant changes in these areas.
| Which fact is most like how …” | Mean Score Before | Mean Score After | Significance of t (T) |
|---|---|---|---|
| Q7B you feel about living here? | 3.7 | 2.9 | 0.074 (0.075) |
| Q8B the staff feel about you? | 3.4 | 3.6 | 0.709 (0.638) |
| Q9B the other residents feel about you? | 3.9 | 4.0 | 0.774 (0.790) |
| Q10B you feel about your day program? | 3.7 | 4.5 | 0.111 (0.139) |
| Q11B you feel about the staff? | 3.6 | 4.2 | 0.276 (0.272) |
| Q12B you feel about the other residents? | 3.7 | 3.6 | 0.822 (0.875) |
| Q13B you feel about yourself? | 3.5 | 4.0 | 0.394 (0.394) |
| OVERALL SCALE | 26.8 | 26.9 | 0.940 (0.638) |
As we did for the Movers, we treated the face scale items as ordinal data and computed averages and tests of change over time. The results of this analysis for the stayers are presented in Exhibit 5-7.
Remarkably, non of the changes reached even the .05 level of statistics significance. The decreased satisfaction with the living situation came close, as did the rise in satisfaction with the day program. But strictly speaking, we cannot infer that there were any real changes in these measures of satisfaction.
Discussion
The central question of the Pennhurst Longitudinal Study for the Temple University part of the effort was "Are people better off?" In the consumer interviews section of the study, the answer seems to be that the people (in our sample of verbal people) who have moved to CLAs are, in fact, better off. They are better off in terms of their own verbally expressed satisfaction with various areas of their lives, particularly with the place where they live.
In our explorations of reliability, we found generally higher consistency than in prior work, but we certainly agree with the body of work by Sigelman and colleagues that it is essential to include check questions in this kind of work. Hence asking questions in several ways, and in several formats, is important. Answers given to varied formats must be compared, and then the presentation of the results should give weight to the consistent, reliable responses. We believe that the extra effort required to perform quality interview work with people with mental retardation is amply justified.
This study revealed no strong preference as to the best question formats to use with people with mental retardation. Probably because of our preselection of people with verbal skills, nearly everyone was able to respond to all the formats (Yes-No, Either-Or, Multiple choice, Open-ended) most of the time.
Our surprising finding of sharply reduced inconsistency rates on the second interview was of considerable, although subsidiary, interest. Many explanations for the phenomenon are possible, including the idea that the first interview may have been the first time the people were asked for their opinions in a formal way by a stranger, and that, with even a little practice, they became more able to respond in such a situation. Another concerns the possibility of increased trust of, and rapport with, our interviewer. Similarly, it is possible that our interviewer gained in skill in probing answers by the time of the second interviews. If any of these explanations were the case, they could pose a threat to the validity of the increased satisfaction findings since improved ability to respond to interviews, or improved openness, or improved interviewer technique could all be potential explanations for the changes in satisfaction. However, both the movers and the stayers displayed sharp reductions in contradictions, but only one group showed the increases in satisfaction, so there does not seem to be a direct threat to validity in this area.
Finally, the stayers in this sample did not change significantly in their self-expressed satisfaction. There was a suggestion of increased satisfaction with the day program; one would hope that the decreased population of the Pennhurst Center has enabled more people to attend day programs, and to receive more individual attention when they do.
Originally, we did not expect to be able to investigate changes among the stayers, which could help to illuminate the effects of institutional phase-downs, but the opportunity to do so was welcome. We hope that similar work will continue here and elsewhere, so that the feelings of people who have lived in facilities for decades are taken into account as those facilities are phased down.
References
Birenbaum, A. & Re, M.A. (1979). Resettling mentally retarded adults in the community -- almost 4 years later American Journal of Mental Deficiency, 83, 323-329.
Birenbaum, A. & Seiffer, S. (1976). Resettling retarded adults in a managed community. New York: Praeger Special Studies.
Conroy, J. & Beyer, F. (1979). A comparison of two interview methods with mentally retarded persons: Personal and telephone. Philadelphia: Temple University Developmental Disabilities Center.
Edgerton, R.B. (1969). Cloak of competence. Berkeley: University of California Press.
Edgerton, R.B. & Bercovici, S.M. (1976). The cloak of competence: Years later. American Journal of Mental Deficiency, 80, 485-497.
Rosen, M., Floor, L., & Zistein, L. (1974). Investigating the phenomenon of acquiescence in the mentally handicapped: I -- Theoretical model, test development, and normative data. British Journal of Mental Subnormality, 20, 58-68.
Seltzer, G. (1980). Residential satisfaction and community adjustment. Paper presented at the American Association on Mental Deficiency, San Francisco, May 1980.
Sigelman, C.K., Budd, E.C., Spanhel, C.L., Shoenrock, C.J. (1981). When in doubt, say year: Acquiescence in interviews with mentally retarded persons. Mental Retardation,19, 53-58.
Sigelman, C.K., Schoenrock, C.J., Spanhel, C.L., Hromas, S.G., Winer, J.L., Budd, E.C., & Martin, P.W. (1980). Surveying mentally retarded persons: responsiveness and response validity in three samples. American Journal of Mental Deficiency, 84, 479-486.
Sigelman, C.K., Schoenrock, C.J., Winer, J.L., Spanhel, C.L., Hromas, S.G., Martin, P.W., Budd, E.C. & Bensberg, G.J. (1979). Issues in interviewing mentally retarded persons: An empirical study. Lubbock, Texas: Research & Training Center in Mental Retardation, Texas Tech University.
Sigelman, C.K., Winer, J.L., Schoenrock, C.J., Hromas, C.L. (1978). Performance of the mentally retarded in interviews: Responsiveness to questions. Lubbock, Texas: Research & Training Center in Mental Retardation, Texas Tech University.
Spanhel, C.L., Sigelman, C.K., Schoenrock, C.J., Winer, J.L., Hromas, S.G. (1978). The feasibility of interviewing the mentally retarded: responsiveness, reliability, and response bias. Lubbock, Texas: Research & Training Center in Mental Retardation, Texas Tech University.
Winer, J.L., Sigelman, C.K., Schoenrock, C.J., Spanhel, C.L, Hromas, S.G. (1978). The performance of mentally retarded children on repeated and alternative format interview questions. Lubbock, Texas: Research & Training Center in Mental Retardation, Texas Tech University.
CHAPTER 6: QUALITY OF ENVIRONMENTS
Assessment of Environments Case Study: Access to Generic Resources
Joan left Pennhurst in June 1980, after having lived there since May 1969. Joan has Down's Syndrome and is legally blind. At years of age, Joan had eye surgery which revealed a congenital cataract in her "good eye." As she got older, her eyes began to atrophy, as did the muscles around them. Joan had significant instances of self-abusive behavior while at Pennhurst. Her self-abusive behaviors consisted of face-slapping, mainly around her eyes. In addition, Joan has been known to spit at and pinch others.
Joan's move to the community in the summer of 1980 was fairly uneventful. She moved into her new home in the suburbs with 2 other women, one of whom had lived at Pennhurst and the other of whom had lived at another state-operated mental retardation facility. Joan seemed to adjust to her new home fairly well. She learned new skills at a steady pace, yet her inappropriate behaviors remained the same.
Over the next two years, Joan's self-abusive behaviors increased steadily, especially face-slapping to the area around her eyes. The community doctor believed there was no medical problem and did not deem it necessary to bring Joan into his office for a visit.
In December of 1982 a new project director took over Joan's program. When she assessed Joan's behavior problems, she made several changes, including bringing in a new house team leader and getting a new behaviorist and general practitioner. Joan's parents were quite upset with the regression their daughter was experiencing, and contacted staff on a daily basis. The project director met with the Harris's and suggested that Joan's problems with self-abuse may have been due to irritation in or around her eyes. When the project director suggested an evaluation at Wills Eye Hospital, Mr. and Mrs. Harris were hesitant, as they believed that Pennhurst had exhausted all options with regard to Joan's vision or lack thereof. After some coaxing, the Harris's consented to an evaluation at Wills. The evaluation concluded that, due to the atrophy of Joan's eyes and the muscles surrounding them, her upper and lower eyelids had grown inward, causing her irritation and pain. The opthamologist suggested that Joan should be considered for prostheses to alleviate the irritation.
In February 1983, after numerous fittings and close communication with one of the only occularists in the city, Joan received her prostheses. Over the past year Joan's behavior has improved considerably. The incidence of self-abuse has decreased appreciably, and when Joan does slap herself it is never around her eye area. Joan seems very happy with her new eyes, and, most important, she is no longer in pain.
Introduction
In this part of the Pennhurst Study, we address the question of whether people are "better off" in terms of the qualities of the places in which they live. We have consistently used the phrase "qualities" of environments to emphasize the fact that there is no generally accepted measure of quality; instead, there are many measures of environmental quality in use, and we have used several.
In the first part of this chapter, we describe the methods and results of our investigation of differences between Pennhurst and the CLAs in terms of normalization and individualization. In the second part, we present a summary of our efforts to identify and measure aspects of community residential settings that are correlated with developmental progress among the people living in them.
Methods: Institution to Community
Instruments
Four dimensions of the environmental program quality of the service setting were measured at the institution: (1) PASS-3 (Program Analysis of Service Systems; Wolfensberger & Glenn, 1975), a widely used measure of normalization; (2) selected portions of the Accreditation Council Standards for Mental Retardation & Developmental Disabilities (ACMRDD), chosen by ACMRDD field experts to measure physical and (3) programmatic aspects of the environment; and (4) the Resident Management Survey (King, Raynes, & Tizard, 1971; Balla, 1976), which measured the extent to which treatment was institution-oriented versus individual-oriented, or, in other terms, the degree of individualization versus regimentation.
PASS-3 may be thought of as a quantification of the normalization ideology. It is the oldest and most widely used instrument for that purpose. As it is usually applied, about six to 15 person days are needed for a complete 50-item rating. Because our resources would not permit that level of effort for each of hundreds of CLAs, it seemed that PASS could not be included among our environmental measures. After considerable literature review and nationwide contact with experts, a solution was found. Flynn & Heal (1981) had developed a shortened version of PASS-3. They identified an 18-item subset that was correlated at r=.965 with the full 50-item PASS-3 scale. We concluded that the 18-item short form, administered by highly experienced raters, would be ideal for this study.
The ACMRDD standards consisted of 807 Yes-No items. In August 1979 the project engaged Mr. Terry Perl, former head of the Survey Procedures Committee of ACMRDD, and Mr. William Snauffer, director of a corporation that employed experienced ACMRDD field surveyors, as consultants. The purpose o the consultation was to reduce the ACMRDD standards to two subsets, focused on physical standards and program standards. From the full 807 standards, 323 were selected as core items representing physical and programmatic aspects of environments. The core item checklist was pilot-tested at a residential school in Maryland. Two survey teams of four members each performed independent evaluations in order to assess inter-team reliability. The consultants then selected 41 items concerning the physical environment and 106 for programming that were most readily applicable to both institutional and community programs.
After the institutional assessments were conducted, and the data analyzed, it was decided that use of the modified physical and program standards of ACMRDD be terminated. Our attempts to identify any relationship between individual growth within the institution and either ACMRDD environmental score had met with no success. After trying simple correlations, partial correlations controlling for individual characteristics, and multiple regression of various forms, we had not been able to detect a relationship. Moreover, ACMRDD central office staff and at least one board member took strong exception to this experimental study of the standards. Among the public objections were the contention that the standards should not be considered as a scale, that the institutional cottage sampling was inadequate, that the specific items selected and the way they were selected were questionable, and that one of our methods of statistical analysis was misleading. Our repeated offer to provide the data tape for ACMRDD to conduct its own search for a relationship between growth and the ACMRDD characteristics of the living area received no response. In this atmosphere, and because the ACMRDD standards were extremely labor-intensive and expensive to collect, we decided to abandon all efforts to validate the utility of those standards.
The Resident Management Survey (RMS) was designed to differentiate institution-oriented from individual-oriented care practices. King, et al. (1971) used this scale to compare care practices in institutions (size 121-1650), voluntary homes (50-93), and hostels or group homes (12-41). They found that the instrument was a sensitive measure of individualized versus regimented treatment, with the group homes being the most individualized and the institutions the least. McCormick, Balla, and Zigler (1975) later replicated these findings and extended them cross-culturally. More recently, the instrument was adapted for wide use in conjunction with the Individualized Data Base at UCLA. Because of its wide use, prior findings, and the theoretical importance of the RMS in comparing institutions to community settings, it was included.
Sample
At the institution. In October 1978 there were 45 living areas at Pennhurst. The first principle of our approach was that we should not do one environmental rating for the whole institution since there was likely to be considerable variation among living areas. We could not, however, rate every living area. Therefore, it was necessary to crosstabulate the characteristics of the people in the living areas (using our 1978 Pennhurst behavioral and demographic data) and look for natural clusters of similar living areas. When this analysis was performed, Pennhurst fell into 10 clusters of living areas. We then randomly selected one living area to represent each cluster. We wanted to be able to assign a normalization score, two ACMRDD scores, and an RMS score to each individual's living area as accurately as possible.
In the community. With respect to environmental ratings in the community, sampling was not possible. We had no data at the beginning of the study to even test the clustering idea. Therefore, each CLA was rated along all environmental dimensions.
We decided to add three other environmental quality instruments before we began the community phase of data collection: the Life Safety Codes Instrument, Characteristics of the Treatment Environment (CTE), and Characteristics of the Physical Environment (CPE).
The Life Safety Codes Instrument was developed by the Evaluation & Research Group at Temple University's Developmental Disabilities Center. It recorded adherence to life safety codes, emergency procedures, staff preparation for emergencies, and so forth. This instrument also contained selected items from the standards for intermediate care facilities.
Characteristics of the Treatment Environment (Jackson,1969) was developed to measure the degree to which autonomy and activity are encouraged in the residential setting. It was revised in 1977 (Silverstein, McClain, Hubbell and Brownlee, 1977). Silverstein et. al. identified 10 items from Jackson's original scale that produced the highest item-factor correlations with the scale's two factors: autonomy and activity. This instrument was designed to be collected by interview with appropriate CLA staff.
Characteristics of the Physical Environment was developed by the Developmental Disabilities Project on Residential Services and Community Adjustment at the University of Minnesota (1981). This instrument measured the degree to which the environment was home-like. Each of five rooms was assessed on a five-point scale with "1" indicating a very home-like environment and "5' indicating a very non-home-like environment. This instrument was designed to be completed by the site reviewer after direct observation of the residence.
Procedures
At the Institution. For Normalization and RMS ratings, it was desirable to locate a number of people highly familiar with PASS-3, because normalization assessment in the field presupposed intensive training. We were supplied with a list of 18 persons who were not only familiar with PASS-3, but were qualified as PASS-3 Team Leaders or Assistant Team Leaders. A training workshop was held in September 1979. The 18-item short form of PASS-3 (which we will henceforth call the Normalization Instrument, because it is not actually PASS-3) and the RMS were presented and explained. The normalization and RMS assessments in the institution were performed by two-person teams in September 1979. The interrater agreement appeared to be sufficiently high (Flynn & Heal, 1981) to justify later reduction of field team size in the community to one rater per site. This was seen to be cost effective, as well as less intrusive.
The condensed ACMRDD surveys were performed by a team of three qualified and experienced surveyors. For the Physical Standards section, the surveyors performed an on-site inspection to complete their checklist of 41 items. For the Program Standards section, the Principal Investigator was asked to draw a small simple random sample of three to six individuals in each selected living area. The surveyors assessed the individual records of each individual thus drawn, visited each unit, interviewed staff, and completed their 106-item Program Standards checklist for each individual.
The institutional environmental data were coded and keypunched and entered into the computer record of each person at Pennhurst. Each individual was given a normalization score, an RMS score, an ACMRDD physical standards score, and an ACMRDD program standards score.
In the Community. At the second training session, held in early 1982, site reviewers were retrained in Normalization and the RMS, and were trained in the use of the three new environmental instruments (CTE, CPE, Life Safety Codes). The three new instruments added approximately 1/2 hour to the review.
In March 1982, data collection began in the community. As of that time, approximately 200 people had been relocated from Pennhurst to the community. One site reviewer went to each site where a former Pennhurst resident lived; each reviewer collected the Normalization Scale, the RMS, the CTE, the CPE, and the Life Safety Codes instruments (in addition to a Behavior Development Survey for each individual). Once the data were collected, they were entered onto the record of each individual, thus enabling comparison between institutional and community scores on the environmental instruments.
Results: Institution to Community
Within Pennhurst
In 1980, the Behavior Development Survey was collected for all 713 individuals who remained at Pennhurst, and whose county of origin was one of the five counties in the Southeast. Region of Pennsylvania (Bucks, Cheater, Delaware, Montgomery, and Philadelphia). Comparison of those BDS scores to the ones collected in 1978, revealed that people had gained an average of 1.24 points in adaptive behavior.
The environmental variables were tested for relationship to the amount of behavioral growth displayed by the people in the Pennhurst living areas. In one approach, we examined simple correlations, in a second approach we used partial correlations controlling for 1978 adaptive behavior, and in a third we used several forms of multiple regression. In the regression analyses, we forced individual characteristics to enter the equation first, because the nature of the question we were asking was whether environmental variables could account for individual growth above and beyond the growth that was accounted for by unchangeable individual characteristics (e.g., sex, age, or level of retardation).
Above and beyond the growth that could be explained by unchangeable individual characteristics, we identified a few programmatic variables that showed suggestions of statistical significance, depending on the choice of statistical technique. The analyses suggested that, individual characteristics being equal, greater time in day program could make a difference in growth, as could individualized treatment (as measured by the RMS) and fewer medications daily. In addition, other forms of analysis implied some effects of compliance with the ICF standards, smaller living areas, more staff, and residential continuity. However, regardless of the statistical procedures used, these programmatic variables could not account for very much of the variation in growth among the people living at Pennhurst. Compared to unchangeable individual characteristics, these program and environmental variables appeared to be relatively weak in predicting, or explaining, variations in individual growth.
1982 Community Data
The results of the first round of data collection in the community are summarized in Exhibit 6-1, which gives the average Normalization scores and RMS scores for individuals from the five counties while they were residing at Pennhurst and once they had moved to the community.
| County | N | Normalization | RMS | ||
|---|---|---|---|---|---|
| Pennhurst | CLA | Pennhurst | CLA | ||
| 1 | 14 | -239 | 152 | 54 | 66 |
| 2 | 22 | -237 | 163 | 55 | 66 |
| 3 | 29 | -247 | 110 | 60 | 64 |
| 4 | 34 | -226 | 177 | 58 | 64 |
| 5 | 58 | -226 | 207 | 58 | 65 |
| Average scores | -232 | 172 | 58 | 65 | |
| Average change | 404 | 7 | |||
The people who had moved into CLAs had clearly experienced a large increase in the degree of normalization (from -232 to +172), and a significant increase in the degree of individualization (from 58 to 65), as measured by our short version of PASS-3 and by the RMS. The conclusion from these measures was that people who had moved to CLAs were better off in terms of these two environmental qualities.
The county tabulation shows, in addition, that there were significant variations among Normalization scores received by CLA programs in different counties; however there was practically no variation among RMS scores in CLAs in different counties. This illustrates why the RMS was eliminated from the CLA data collection process; all CLAs were at or very near the top of the scale.
Methods: Within the CLAs
Instruments
For the second round of community data collection, the environmental assessment package was revised. We decided to keep the normalization measure derived from PASS-3, because the questions it addressed were basic and essential, and were not addressed by the other environmental measures. The Resident Management Survey was dropped in 1983, after the institution to community changes had been assessed. The RMS was replaced with the Group Home Management Schedule (Pratt,1969), another measure of individualization versus regimentation, but designed to be more sensitive to the less obvious variations among community programs.
The Characteristics of the Treatment Environment was also dropped in 1983 for the same reason the RMS was eliminated: almost all CLAs received the highest possible score. The study team decided that replacement of this instrument was unnecessary because our normalization scale covered the same or similar areas.
The Characteristics of the Physical Environment was replaced by the Physical Quality Instrument (PQI) (taken from a modification of the MEAP Rating Scale created by Seltzer, 1982, and further modified by our group). The Physical Quality Instrument was found to be a more thorough measure of the pleasantness of the residential site. This instrument also assessed the physical quality of the neighborhood in which the homes were located. As with the CPE, the PQI was completed by the site reviewer after the site review, including a tour of every room.
Procedures
Since approximately 100 additional individuals had been relocated from Pennhurst to the community, it was necessary to recruit additional site reviewers to complete the environmental assessments. We recruited 10 more individuals who had been PASS trained through the Commonwealth of Pennsylvania's PASS training program. At a four day training session held late in 1983, site reviewers were retrained in the Normalization Scale, and were trained in the use of the three other environmental instruments (GHMS, PQI, Life Safety Codes). The three instruments took approximately 1/2 hour to administer, the same as in the previous year.
Data collection occurred late in 1983 and early in 1984. One site reviewer went to each site where a former Pennhurst resident lived; each reviewer collected the BDS, the normalization scale, the GHMS, the Life Safety Codes Instrument, and the PQI.
Results: Within the CLAs
One of the original aims of the Pennhurst Study was to explore the differences in environmental qualities between institution and community, and we did so. Equally important was the question of what environmental qualities in community programs would "make a difference." That is, it was important for policy makers and program operators alike to know how programs could best be designed to foster individual growth and development. We therefore used the Pennhurst Study data set to investigate whether any of our environmental quality measures were associated with individual growth and development among people living in CLAs.
The analysis presented here was based on the data collected for all people in CLAs in 1983 and 1984. This was the most recent information available, and it also included the largest number of people. We further selected people who were living at exactly the same CLA, with the same street address, in 1983 and 1984, in order to eliminate people who had changed environments, even if they only moved to an apartment across the hall. This assured us that the physical environment, at least, was relatively constant. There were 320 people in the study's data base who met these criteria.
The index of individual growth and development was the change in adaptive behavior from 1983 to 1984 as measured by the Behavior Development Survey. The 320 individuals in the analyses had gained an average of 2.0 points between 1983 and 1984; actual changes ranged from a 45 point loss to a 34 point gain.
Literally hundreds of variables were available to test for association with growth, but our interest in this analysis was in the environmental variables. The first analysis was a simple Pearson correlation. The variables selected were the following environmental measures: number of other residents living at the site, hours of developmental service, hours of day programming, Group Home Management Schedule score, Physical Quality score, Normalization Score, Characteristics of the Treatment Environment score and total staff hours.
Of all the variables entered into the Pearson correlation, shown in Exhibit 6-2, the only significant correlation was between adaptive behavior growth and the Group Home Management Schedule score (r=-.20, 314 df,p=.001). This suggested that individuals living in more regimented settings gained more in the area of adaptive behavior. This was a paradoxical finding, because the prevailing wisdom indicated that more regimentation would inhibit growth.
| Simple Correlation with 1983-1984 Gains in Adaptive Behavior Score | |
|---|---|
| Number of residents | -0.09 |
| Hours of developmentally-oriented service per day | 0.05 |
| Hours of day program per day | 0.00 |
| Group Home Management Schedule | -0.20* |
| Physical Quality Instrument | -0.06 |
| Normalization Instrument | 0.04 |
| Total staff hours per week | -0.06 |
| Characteristics of the Treatment Environment | -0.10 |
It is a well established fact that much of the variance in gain scores, no matter what the context, can be accounted for by initial scores (Cronbach & Furby, 1970). In our case, the 1983 adaptive behavior scores were significantly correlated with the gain scores (r=-.24, (318), p.001). The negative correlation meant that people who started out with lower scores were likely to gain the most, and people who started out with higher scores were likely to gain the least.
We also know that many environmental measures are correlated with the level of functioning of the people living in the environments; for example, the Group Home Management Schedule measures the degree to which the environment fosters expression of individual choices, as opposed to having blanket rules and regimentation for all. But obviously there would tend to be less evidence of individual freedom of choice among people with profound mental retardation than among people with mild mental retardation. Hence such a measure might yield higher scores for settings with higher functioning people.
If the environmental measures are correlated with initial adaptive behavior, and initial adaptive behavior is negatively correlated with gain scores, then possible relationships between the environmental variables and gain may be masked if we rely solely on simple Pearson correlations. It is useful to try to remove this confounding influence from the analysis. One mathematical way of doing so is to use partial correlations. A partial correlation gives a measure of the relationship between two variables while adjusting for the effects of one or more additional variable. (As an example, suppose it is found that there is no correlation between the number of firefighters and the speed of putting a fire out. Should the mayor cut the number of firefighters? No, because partial correlation shows a strong relationship between the number of firefighters and the speed of extinguishing, when we adjust for the size of the fire.)
| Simple Correlation with 1983 Adaptive Behavior | Partial Correlation with Gain in Adaptive Behavior | |
|---|---|---|
| * p0.05; ** p0.001 | ||
| Number of residents | -0.14* | -0.13* |
| Hours of developmentally-oriented service per day | -0.04 | 0.04 |
| Hours of day program per day | 0.20** | 0.05 |
| Group Home Management Schedule | 0.43** | -0.12* |
| Physical Quality Instrument | 0.02 | -0.05 |
| Normalization Instrument | 0.31** | 0.12* |
| Total staff hours per week | -0.47** | -0.20** |
| Characteristics of the Treatment Environment | 0.47** | 0.00 |
To see how strongly our environmental measures were influenced by the level of functioning of the people in the settings, we computed the correlations of each of the environmental measures with initial (1983) adaptive behavior. Positive correlations were found with the amount of day programming, the Group Home Management Schedule, the normalization scale, and the Characteristics of the Treatment Environment. Negative correlations were found with the number of other residents and the total number of staff hours per week. The simple correlations are shown at the left of Exhibit 6-3.
The simple correlations in Exhibit 6-3 indicated that some of what the environmental variables were measuring was the functional level of the people living in the environments. This is not a desirable property for a measure of environmental quality. The data specifically showed that higher functioning individuals: (a) were in smaller settings, (b) were in settings that required fewer total staff hours, (c) received more day programming, and (d) lived in less regimented settings where normalization, autonomy and activity were encouraged.
Exhibit 6-3 also presents the results of the partial correlation analysis. When the confounding effect of the relationship between the environmental measures and the adaptive behavior of the people in the setting was removed, four partial correlations between environmental measures and adaptive behavior gain were significant: number of residents (r=-.13, (308), p=.019), Group Home Management Schedule score (r=.12, (308), p=.030), Normalization score r=.12, (308), p=.032), and staff hours per week (r=.20, (308), p=.001).
These partial correlations suggested that, when controlling for differences in initial adaptive behavior scores, the people who tended to make larger gains within the CLAs were those who lived: (a) in smaller CLAs; (b) in more regimented CLAs; (c) in CLAs with higher normalization scores; and (d) in CLAs in which fewer total staff hours per week were expended.
Findings (b) and (d) were puzzling, so both were explored further. Both the Group Home Management Schedule and the total number of staff hours were correlated with the size of the CLA, and possibly both were acting through size to product misleading partial correlations. However, partial correlations of the Group Home Management Schedule and staff hours with growth, controlling for initial adaptive behavior and size, were still significant, and about the same magnitude.
We stress, however, that none of these partial correlations were overwhelmingly large; instead, they indicated significant, but weak, relationships. It should also be noted that these results do not represent a model of growth, since a series of partial correlations was used. These relationships may not lead to the same conclusions as multivariate techniques, and moreover the methods used here assume that the variables are all related in simple linear fashion. The validity of that assumption merits further investigation before drawing final conclusions about the nature of quality in services for people with mental retardation.
Discussion
These five years of work on measurement of environmental qualities has been intriguing and rewarding, but has not produced any final list of things that "really matter" nor has it resolved all of the problems of measurement in this arena. At the time of this writing, however, the support of our entire behavioral and environmental assessment process has been taken over by the Commonwealth of Pennsylvania as a monitoring system. Hence although the five years of Federal funding are over, work in this crucial area will continue into the foreseeable future.
A few things did emerge that were very clear. One is that when people moved from Pennhurst into CLAs in Pennsylvania under this Federal court order, they went into settings that were much "better" in terms of our measures of normalization and individualization.
In fact, the change was so extreme that our measure of individualization (the RMS) ceased to be of value after people moved to CLAs. Practically all of the CLAs attained the highest possible score on that scale. This implies that institutional environments and small community environments are so different that it may be an error to try to use the same set of of standards for both. That could result in unrealistic demands for large institutional settings and unnecessarily low expectations from community programs. It is possible that we would be wiser to start from scratch in developing standards for community programs, rather than trying to tinker with and adapt the existing institution-oriented standards.
Another is that many so-called "environmental" measures are highly sensitive to the characteristics of the people living in the setting being rated. We hope that this will further impel the effort to develop standards and measures that are independent of the functional level of the people being served. Even our normalization measure, which definitely should be independent of individual functional level, was not. This need for "functional-level-free" measures of environmental quality is similar to the need for measures of individual intelligence that are free of "culture-bias."
We were not able to discern relationships between aspects of one of the most widely used set of program standards in the nation (ACMRDD) and individual growth and development within the institution in this study. That does not mean that a relationship does not exist, and we hope that others will investigate this issue in a rigorous scientific manner. It seems to us extremely important that programmatic standards should be shown to be associated with continual increases in the independent functioning of the people served. These comments apply also to the multitude of other standards and licensing instruments that are used at national, state, and local levels; we urge a great deal more scrutiny of validity (particularly predictive validity vis-a-vis growth).
During the research process, we were constantly reminded that growth is not the only criterion of a good environment. Our measures of Physical Quality and Life Safety, for example, were completely unrelated to people's functional level or their growth. Yet not one of our site reviewers would suggest dropping those measures. There is clearly a place for standards of comfort, safety, and other areas that may have nothing to do with individual development. Of course, they too must be demonstrably reliable.
We constantly tested the reliability of our environmental instruments. One concern involved our Normalization Scale, because preliminary analyses showed that the Normalization Score of a given CLA could change a large amount from one year to the next. Although such phenomena may be genuine, they may also arise from a lack of one or more kinds of reliability. (We must emphasize that this concern about reliability was only about our normalization measure as we applied it with single site reviewers -- our work did not use the full PASS-3 scale.) Our work will continue in this area.
Over the years, our impressions from service providers have led us to the conclusion that skepticism about the reliability of environmental measures and standards is a major problem. It seems understandable that the agencies object to any review in which the result depends on the orientation of the reviewer who is sent out that year. To the extent that they believe that luck is involved, providers will gradually become cynical and resentful. That is certainly not a desirable product of the quality assurance process. We therefore call for far greater attention to the interrater reliability of the existing standards, licensing, and environmental quality measures. Data collection instruments may need to be revised or replaced, and reviewer training may need to be intensified. We see considerable promise in the use of videotaped site reviews to train surveyors and to test their scoring accuracy.
We have continually perceived the quiet presence of a significant question about the entire issue of environmental measures and program standards. In simple terms, that question is to what extent is it feasible to measure qualities of the environment in a brief visit to a residential program? Some researchers have suggested that literally nothing useful can be learned about the quality of a program in less than several weeks of direct presence and observation. Because that is not likely to be practical for large systems of very small community residences, we must continue to face the question of how well we can measure things in brief visits, and whether we can establish that the things measured make a real difference in the lives of the people served.
Our investigation of environmental correlates of growth in community settings led to some provocative, if not conclusive, analyses. The data suggested that, adjusting for initial adaptive behavior, people in smaller settings tended to display more growth. People in more normalized settings tended to display more growth. The analysis suggested, however, that people in settings that were more regimented (as measured by the Group Home Management Schedule) did slightly better. Such a finding, although it could be accurate, is certainly not in line with the general trend of current professional theories in the field. We hope that others will investigate the possibility that a certain amount of structure is necessary and beneficial (although that amount varies according to the level of functioning of the people served), and that below this amount, less growth will occur. The question for scientific study is: how much "restrictiveness" is proper for which kinds of people?
References
Balla, D. (1976). Relationship of institution to quality of care: A review of the literature. American Journal of Mental Deficiency, 81, 117-124.
Cronbach, L., & Furby, L. (1970). How should we measure change -- Or should we? Psychological Bulleting, 74, 68-80.
Flynn, R.J., & Heal, L.W. (1981). A short form of PASS 3: A study of its structure, interrater reliability, and validity for assessing normalization. Evaluation Review, 5, 357-376.
Jackson, J. (1969). Factors of the treatment environment. Archives of General Psychiatry, 21, 39-45.
McCormick, M., Balla, D., & Zigler, E. (1975). Resident care practices in institutions for retarded persons. American Journal of Mental Deficiency, 80, 1-17.
King, R., Raynes, N., & Tizard, J. (1971). Patterns of residential care: Sociological studies in institutions for handicapped children. London: Routledge and Kegan Paul.
Rotegard, L., Bruininks, R., & Hill, B. (1981). Environmental characteristics of residential facilities for mentally retarded people. Minneapolis: University of Minnesota, Developmental Disabilities Project on Residential Services and Community Adjustment, Project Report #15.
Silverstein, A.B., McClain, R.E., Hubbell, M. & Browniee, L. (1977). Characteristics of the treatment environment: A factor-analytic study. Educational and Psychological Measurement, 37, 367-371.
Wolfenberger, W., & Glenn, L. (1975). Program Analysis of service systems 3: A method for the quantative evaluation of human services. Toronto: National Institute on Mental Retardation.
CHAPTER 7: FAMILY IMPACTS
Family Impacts Case Study: A Case of Guilt
Susan left Pennhurst in 1974, before the Pennhurst litigation began; therefore by current definition she is not a class member. She was included in the case studies as part of a comparison group of individuals who had been living in the community when the litigation started.
Since Susan moved to the community she has lived in 2 different homes. As a result of Susan's ambulation problems, the provider felt it would be better for Susan to live in a ranch-style home. Susan's ambulation problems were caused by chronic phlebitis, which has required hospital care on several occasions.
While Susan was at Pennhurst, she had little or no contact with her family. When she moved to the community, however, family visits increased dramatically. She has been visiting with her family in South Carolina at least 3-4 times a year over the past 10 years. Upon examination of records at Pennhurst and at the group home, it was quite clear that Susan's family (aunts and cousins) felt a great deal of guilt around her living at Pennhurst, yet they were unable to care for her themselves. It seems that, to alleviate their own guilt, they have become a doting family. In fact, they are perpetuating the myth of the sick, helpless, eternal child in Susan. Over the past few years gifts to Susan have been gifts that encourage dependence rather than foster independence. One year they gave her a single bed with bed rails. More recently, they gave her an ejection chair so that she wouldn't have to struggle to get up; she pushes a button and is lifted to an upright position. Staff and the provider agency have been unsuccessful in discouraging such gifts.
While increased family contact is certainly a desired outcome, it should never occur at the expense of the individuals who are struggling so hard, in many cases, to achieve their independence. Certainly, in this case, Susan is getting mixed messages from her family and from staff and others around her.
Introduction
When Judge Broderick ordered Pennhurst closed it was obvious that the decision would have an impact on the lives and attitudes of families, as well as on the people themselves. Therefore, part of the Pennhurst Longitudinal Study has been an assessment of the impact of the court orders on families.
Strangely, no prior study of family reactions to and feelings about alternatives to institutional care included family contact before and after deinstitutionalization. The opportunity to do both was presented by the court decree plus the federal support of the Longitudinal Study. This study therefore became the first to examine changes in family feelings after relocation of a relative. Literature (described below) had already established firmly that most families of people living in institutions were opposed to community placement. The question we were able to address was, if people were placed anyway, how would family behaviors and opinions change?
Families of people in public institutions have been found to be very satisfied with the facilities, and opposed to changes such as community placement. One of the earliest reports of such satisfaction was from Klaber (1969). Surveying parents of people in institutions in Connecticut, he found more than three fourths of them were convinced that the facilities delivered excellent care. Later, Brockmeier (1975) reported similar levels of satisfaction, coupled with skepticism about community-based care, among families of people in Nebraska institutions. In Texas, Payne (1976) discovered the same situation. Overwhelming satisfaction was also reported by Willer, Intagliata, & Atkinson (1979) in New York state. Meyer (1980) found that over 70% of families were satisfied with an institution in Pennsylvania, and were against the idea of community placement. Our own initial findings in the Pennhurst Study were released in 1980, and showed the same pattern. Atthowe & Vitello (1982) detected similar feelings among families in New Jersey. In their survey, 54% expected no more than custodial care, and 91% said the institutional care was adequate or better.
Payne (1976) also identified a "deinstitutional backlash," a loosely knit countermovement of various local and state-wide associations of parents organized in support of institutions as opposed to community living arrangements (CLAs). While many families of people in institutions see group homes or community living arrangements (CLAs) as a viable way to care for some people, most prefer the institution for their own relatives (Atthowe & Vitello, 1982; Frohboese & Sales, 1980; Payne, 1976). Similarly, Ferrara (1979) documented that parents of children with mental retardation were much more supportive of normalization activities for children with mental retardation in the abstract than they were for their own children.
Many families believe that there are individuals with mental retardation who will never be able to achieve the level of independence they think is necessary for community living. Further, many families think it is damaging for professionals to create expectations that their children will achieve such independence (National Association for Retarded Citizens [NARC], 1977).
Families generally believe the decision to institutionalize their relatives was permanent and final. Atthowe and Vitello (1982) found that 84% of families believed that their child would stay institutionalized for life. Stedman (1977) suggested that deinstitutionalization of a relative with mental retardation forces the family to question whether institutionalization had been appropriate in the first place. To those families who institutionalized their children, deinstitutionalization represents a "painful revisitation" of the original decision (Willer et al., 1979).
Families also fear the implications of the concept of least restrictive alternative; they fear that their children will not be protected properly in small community settings (NARC, 1977). As Willer, et al. (1979) said:
In this instance, the individual is moved from a very secure situation where someone else, the state, is responsible for his safety and future. Alternative settings are, by definition, less restrictive, and the family is faced with the belief that increased risk of harm or abuse may occur. (p. 13)
Frohboese and Sales (1980) documented that families believed the state institution to be the least restrictive alternative feasible for their relatives. They perceived greater freedom of movement, independence, and safety within the institution.
Perhaps the greatest concern families have about deinstitutionalization is the permanence of the community settings (Frohboese & Sales, 1980). The question of permanence, in turn, is linked to funding and the duration amount, source, and intent of that funding. An analysis of funding history and current practices reveals that funding for institutions has continued for nearly 100 years, and federal assistance has grown significantly in the past decade. In contrast, funding for CLAs has come primarily from states and/or short-term federal demonstrations. Recent federal funding initiatives for community programs have not yet been tested fully (Braddock, Howes, & Hemp, 1984). For a family whose concern is that their relative be housed, fed, and clothed in the year 2020, institutional funding may appear to be a safer bet than CLA support.
Thus, a reasonably large array of research in many states shows that most families oppose community placement of their institutionalized relatives. The focus of the Pennhurst Longitudinal Study was to test whether attitudes of Pennhurst families fit this pattern, and then to take the unprecedented next step: test for changes among the same families after community placement of their relatives.
Methods
Respondents
There were 713 people residing at Pennhurst in May 1980 who originally came from the five southeastern counties of Pennsylvania. Of these residents, 630 had known relatives. Questionnaires were mailed to each of these 630 families for the Baseline Survey. After two mailings and extensive telephone follow-up, responses were received from 472 families (75%). One-fourth of the non-respondents were telephoned and asked a subset of the survey questions; it was determined that the 472 respondents were representative of the population of 630. (That is, the non-respondents did not differ from respondents in their answers to 19 key survey items, as measured by t-tests. Hence the sample was judged to be free of non-respondent bias.)
After the Baseline Survey, we telephoned the families of each of the next 134 people who moved to CLAs; only the families of people who had already been in a CIA for six months were telephoned for the Post-Relocation Survey. The telephone interviews were conducted between January 1981 and February.1984 in four waves.
In the first wave, conducted in early 1981, the 22 families of people who had been in CLAs for six months or more were interviewed. The second wave added 43 more families in mid-1982. In the third wave, in early 1983, there were 54 families of recently placed people, and in the final wave, in late 1983, we spoke with another 15 families. At the end of the Longitudinal Study, then, we had spoken with 134 families of people who had moved to CLAs. In all cases, we had spoken with families who had completed the baseline mail survey form and whose relatives had experienced the CLA setting for at least six, but less than 12, months.
Instruments
Two questionnaires -- one for the baseline survey and one for the post-relocation survey -- were developed for the family impacts study. The aims of these instruments were to assess initial attitudes toward deinstitutionalization, to measure changes in those attitudes after relocation of the relatives, and to identify demographic variables, such as education, sex, and race, which might possibly relate to attitudes.
Barnes, Krochalk, and Hutchinson (1976) conducted a comprehensive community residential care system study that included a mail survey of families/guardians of individuals with mental retardation. Their survey questionnaire assessed characteristics of the person with retardation, services needed to keep the person living at home, positions on philosophical issues, and the types of facilities preferred for out-of-home placement. Although no item from their questionnaire was used in ours, the Barnes, et al. instrument served as a model for development of the first draft of our questionnaire.
The first draft of the baseline survey was prepared in September, 1979. Two national experts in this field were consulted, and their reviews and recommendations for modification were received in December, 1979. At about the same time, the survey was pretested on nine family contacts whose relatives had moved recently from Pennhurst into the community. This group was selected because they had recently been in the same situation as the population of the study but would not be eligible for the before-and-after study. The pilot test provided feedback which led to improvements in the questionnaire.
Additional criticism and feedback was obtained from several psychologists, and a certified advocate from the Office of the Special Master for Pennhurst, and necessary modifications were made. The revised instrument was submitted to the Office of Management and Budget in February, 1980. In March, that agency requested additional changes. The final form of the instrument was approved in April, 1980. This baseline questionnaire is included as Appendix 7-1.
The Post-Relocation questionnaire was designed to measure changes in families' attitudes six months after relocation of their relatives with mental retardation. This post-questionnaire was simply a subset of the items on the baseline questionnaire. We also asked an open-ended question, intended to gather any perceptions, attitudes, or feelings not covered in the survey. This post-relocation questionnaire is included in Appendix 7-2.
The instruments contained many questions that addressed the attitudes of the respondent toward deinstitutionalization. The validity of single items can be questioned, because errors and misinterpretations can bias any particular response. This problem is reduced when many similar items are combined into a scale. Therefore the Attitudes Toward Deinstutionalization Scale (ATDS), a simple additive scale composed of 25 items, was constructed. It was well-structured and internally consistent (Cronbach's Alpha = .94). This scale ranged from 1 to 5; the higher the numerical value of the score, the greater the resistance toward deinstitutionalization. The items contained in this simple additive scale are marked with asterisks in Appendix 7-1.
Procedures
The overall design of the family impacts portion of the Longitudinal Study was pre-post. Families of Pennhurst residents were surveyed by mail in June 1980, before their relatives left the institution. As each resident left Pennhurst, his/her family was interviewed by telephone, approximately six months after the relocation; the six-month delay was intended to permit enough time for each family to develop familiarity with the CLA, and for transitional or temporary relocation phenomena to fade.
The decision to use telephone contact for the post-relocation questionnaire was reached only after careful consideration with government officials, consultants, and the project Advisory Committee. It was possible that the change in methods (pre = mail, post = phone) could influence the results. On the other hand, too small an "N" could call the entire family study into question. Not knowing how many people would actually move, and judging the minimum acceptable prepost sample size to be 100, we chose telephone follow-up because it assured collection of data from virtually 100% of the families of people who moved. By mail, we could only be confident of reaching about 70%. As it turned out, there were 136 families of people who moved and met our criteria for this part of the study. If we had done the post-relocation survey by mail, we might have obtained only 95 completed prepost interviews, rather than the 134 we actually received.
Results
Baseline Study
The central and most striking finding of the baseline family study was the overwhelming opposition of the families to the idea of community placement. When asked the question, "If your relative were to be selected for movement from Pennhurst to the community, how likely would you be to agree with this decision?", the responses were as follows:
| Very likely to agree | 9% |
| Somewhat likely to agree | 5% |
| Unsure | 14% |
| Somewhat unlikely to agree | 9% |
| Very unlikely to agree | 63% |
Thus, 72% of the families of the people still living at Pennhurst in 1980 would have disagreed with any proposal for community placement of their relatives.
In addition, the families were very satisfied with services their relatives were receiving at Pennhurst. In answer to the question, "Overall, how satisfied are you with the services your relative has received from Pennhurst?" the following responses were given:
| Very satisfied | 54% |
| Somewhat satisfied | 29% |
| Neutral | 11% |
| Somewhat dissatisfied | 5% |
| Very dissatisfied | 2% |
Together, these two questions revealed a clear pattern of satisfaction with the institution, coupled with strong opposition to community placement. This was the primary finding of the baseline study.
Attitudes Related to Opposition. We were also interested in some of the reasons for these initial feelings of the families, and in some related opinions. Analysis revealed that families who were older, and whose relatives at Pennhurst were older, were more opposed to community placement. More educated families were more opposed, and white as opposed to non-white families were more opposed.
An attitude that appeared to be related to feelings about community placement was that 75% of families believed, strongly or somewhat strongly, that their relatives had no potential for further educational or psychological development. Moreover, a family's opinion in this area was not related to the relative's adaptive behavior, IQ, or level of retardation. The fact that it was not related suggested that this pessimistic attitude among the families was not necessarily grounded in empirical observation or rational thinking.
Three of the best known philosophical trends in service delivery in the 1970s and 1980s have been "normalization," the "least restrictive alternative," and "deinstitutionalization." Families were asked for their degree of agreement/disagreement with these ideas and the results showed that they were not in accord with these concepts. In fact, 32% agreed (strongly or somewhat) with "normalization," 36% agreed with "least restrictive alternative," and only 19% agreed with "deinstitutionalization." This lack of agreement suggested that there was a general pattern of suspicion and distrust of "new" ideas that might lead to change in the situation of the institutionalized relatives.
There were other opinions that were relevant to opposition to deinstitutionalization. For example, only 15% of families agreed (strongly or somewhat) that funding for community living arrangements was secure and permanent, and 61% disagreed. Permanence seemed to be a central issue for families, and they were clearly not confident of the permanence and security offered by the new CLA concept. Similarly, only 18% of families agreed that all needed services would be available in the community, and only 20% agreed that CLA staff would be sufficiently knowledgeable and skillful to handle all situations that might arise with their relatives.
One of the strongest predictors of a family's opposition to community placement was the family's perception of the intensity of the relative's need for medical care. If the family believed that the relative had great need for attention from doctors or nurses, then that family was likely to oppose community placement. A questionnaire item on medical needs was put into both the family survey and the Behavior Development Survey (BDS), which was our primary instrument for collection of information about individuals:
1 = would not survive without 24-hour medical care
2 = has life-threatening condition that requires very rapid access to medical care
3 = needs visiting nurse and/or regular visits to the doctor
4 = generally has no serious medical needs
In 1978 we collected the BDS for each person living at Pennhurst, from staff, including nurses, and from facility records. We were therefore able to compare the responses from the families to the responses from the facility. The comparison revealed that the facility responses and the family responses did not agree very much at all. Exhibit 7-1 presents the results from both sources.
| Families | Facility Responses | |||||
|---|---|---|---|---|---|---|
| High Need 1 | 2 | 3 | Low Need 4 | Total | ||
| High Need | 1 | 5 | 7 | 43 | **57** | 112 |
| 2 | 2 | 3 | 20 | 21 | 46 | |
| 3 | 0 | 5 | 50 | 62 | 117 | |
| Low Need | 4 | 1 | 2 | 41 | 96 | 140 |
| TOTAL | 8 | 17 | 154 | 236 | 415 | |
The meaning of this table is simply that the families perceived much more intense medical needs among their relatives at Pennhurst than did the staff who were providing direct care. The entry in the table marked by asterisks is the most extreme case of this disparity in perceptions; it represents the fact that there were 57 people about whom the family reported that the person would not survive without 24-hour medical care, but about whom staff reported that there were no serious medical needs.
Post-Relocation Study
Representativeness of the sample. The 134 people in the Post-Relocation study were generally very similar to the average Pennhurst person, except in age. The 134 were five years younger on the average, and were admitted to Pennhurst about five years later than the average. In both adaptive and maladaptive behavior, the 134 people were not significantly different from the average of the Pennhurst population. The distribution of level of retardation labels was about the same for our sample and the population, as well. In both groups, 86% of the people were labeled severely or profoundly retarded.
Characteristics of the 134 family respondents. The 134 family respondents interviewed in the post-relocation study were not very different from the population of 472 families with regard to education, race, sex, and relationship, as Exhibit 7-2 shows.
| Population of 472 Families | Sample of 134 | |
|---|---|---|
| Education: High school of more | 55% | 51% |
| Race: Non-white | 18% | 16% |
| Sex: Male | 63% | 51% |
| Relationship: Parent | 68% | 72% |
EXHIBIT 7-3. Initial Attitudes: ATDS Scale
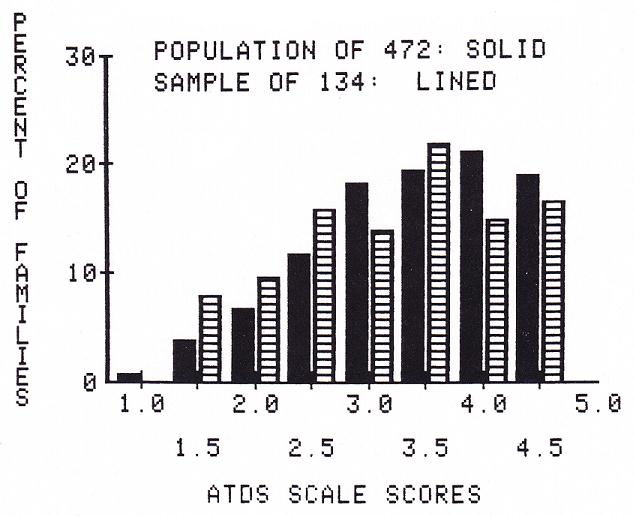
Furthermore, in analyzing the responses of the 134 family sample to the 25-item scale assessing attitudes toward deinstitutionalization, we found that this group did not differ in initial attitudes from the average Pennhurst family (472), as Exhibit 7-3 shows. This bar graph showed what the statistics also revealed: the 134 families were, to begin with, just as opposed to community placement as was the average Pennhurst family.
Because the 134 families initially were not different from the average Pennhurst family, we believe that the findings about attitude changes contained here are generalizable to the entire set of Pennhurst families. That is, what we have observed for 134 families will probably hold for the remaining hundreds of families.
General Pre-Post Changes
Satisfaction. The 134 families in this study were very satisfied with Pennhurst, but are now just as satisfied with the CLAs. The question we asked was, "Overall, how satisfied are you with the services your relative is receiving from (Pennhurst/the CLA)?" The responses were on a 5-point scale from "very satisfied" (1) to "very dissatisfied" (5).
The average baseline survey response of the 134 (in 1980, while their relatives were still at Pennhurst) was 1.7, which was identical to the average for all 472 families. After movement of the 134 relatives to CLAs, their families gave an average response of 1.5, which indicated that they were just as satisfied with the CLAs as they had been with Pennhurst. This was remarkable because the families had been so opposed to placement, and generally had not expected to be pleased by community services.
Family visits to relative. Families' visits to their relatives hardly changed. Initially, 42% of the 134 reported visiting their relatives at least once a month (similar to the 472, at 44%). After relocation, the figure was 52%, and, though this change was statistically significant, the substantive change was very small. Similarly, 13% of the 134 families reported that their relative came home for a visit at least once a month (much like the 472 at 11%), but this figure changed only 'to 15% after relocation of the relative to a CLA. Thus we found no confirmation of the notion that visits to or from the family would become more frequent upon deinstitutionalization.
Perception of medical needs. We obtained the families' perceptions of their relatives' medical needs from 126 of the 134 families in the pre-post study. In general, families perceived serious medical needs among their relatives in 1980, before relocation, and also after relocation. Families continued, for the most part, to view their relatives as being in need of frequent attention from doctors and nurses. On a scale of I to 4, families averaged 2.8 both before and after relocation.
Changes in Attitudes Toward Deinstitutionalization
Overall change. Our general measure of attitudes was the 25-item ATDS, described previously. This overall scale ranged from I (in favor of deinstitutionalization) to 5 (opposed). The average score of the 134 families before relocation was 3.5; the average score after relocation was 2.4. This change was highly significant (t = 12.94, = (114), p .001). The families were much more positively disposed toward the complex of concepts related to deinstitutionalization after the relocation of their relatives had taken place.
Changes in particular attitudes. The most direct questions about the idea of community placement were measured on 5-point agreement scales. The questions were:
Baseline: If your relative were to be selected for movement from Pennhurst to the community, how likely would you be to agree with this decision?
Post Relocation: Overall since your relative was selected for movement from Pennhurst to the Community, how do you feel about that move?
From pre to post, the changes were dramatic, as shown in Exhibit 7-4.
EXHIBIT 7-4. Agreement with Community Placement
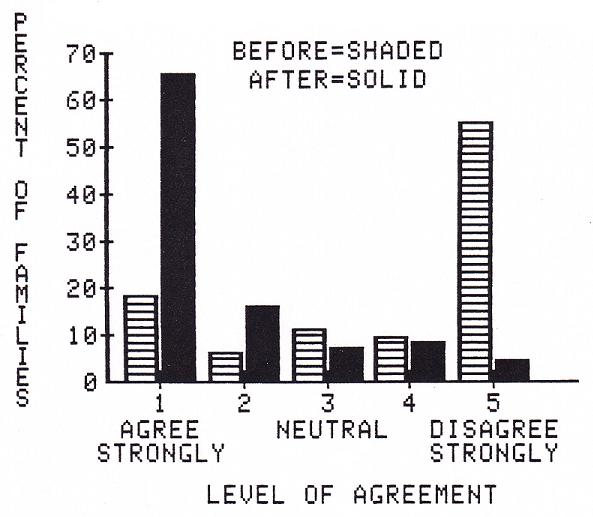
The figure shows visually what the data revealed statistically: these 134 families had drastically changed their positions. Before relocation, 55% of the families were strongly opposed to community placement, and afterward, only 4% were still strongly opposed (the bars at the extreme right of the figure). Conversely, the bars at the left of the figure show that, before placement, only 19% agreed strongly with placement, and afterward, fully 66% strongly agreed.
Treating the same data statistically, as a pair of 5 point scales, the average score of the families before relocation was 3.8, indicating strong opposition. Afterward the average was a very positive 1.7, and the change was highly significant (t = 13.7, (130), p .001).
Other Changes
There were a number of other areas in which potential changes from before to after relocation were of interest. In Question 13, we asked whether families believed changes would occur in 14 areas of their lives; after relocation, we asked whether changes had occurred in the same 14 areas.
Of the 14 items within Question 13, the 12 that showed significant pre-post changes are shown in Exhibit 7-5. Each item was on a scale ranging from 1 (large change for the better) to 5 (large change for the worse). For the 134 pre, the means indicate expectations; for the 134 post, the means reflect actual changes.
| 134 Pre (Expected) | 134 Post (Actual) | |
|---|---|---|
| * All changes were significant at the 0.001 level. | ||
| a. Your own social life | 3.5 | 2.8 |
| b. Your job | 3.5 | 2.9 |
| d. Family recreation activities | 3.4 | 2.8 |
| e. Your time alone | 3.5 | 3.0 |
| f. Your time with your spouse | 3.4 | 2.9 |
| h. Family vacation | 3.5 | 2.9 |
| i. Your general happiness | 3.7 | 2.1 |
| j. Your relative’s relationships with other people | 3.6 | 1.9 |
| k. Your relative’s general happiness | 3.6 | 1.7 |
| l. Your relative’s relationship with you | 3.1 | 2.5 |
| m. Your relative’s relationship with your spouse | 3.3 | 2.7 |
| n. Your relative’s relationship with brothers and sisters | 3.1 | 2.6 |
The initial (expected) responses of the 134 families clustered about 3.5 at baseline, which meant they were basically pessimistic about expected changes. Their expectations were exceeded on each of the items shown in Exhibit 7-5. (The two areas in which changes were not significant were "Your spouse's job" and "Your time with your children living at home.") In many areas, the change from pre to post was from negative expectations to an actual observation of no change (e.g., "Your job" went from 3.5 to 2.9, and 2.9 is essentially no change).
In some areas, however, the differences were from negative expectations to post-relocation reports of distinctly positive observations. For example, the largest change reported by the families was in their relatives' general happiness, followed by changes in their relatives' relationships with other people and in the family respondents' own general happiness.
As a concrete example of the magnitude of these differences between expectations and actual experiences, we present the pre and post data for the Relative's General Happiness in greater detail in Exhibit 7-6. (We select this item because of its special interest for families who want to know whether people are perceived to be happier in community settings.)
| Pre (Expected) | Post (Actual) | |||||
|---|---|---|---|---|---|---|
| Much Better 1. | 2. | 3. | 4. | Much Worse 5. | ||
| Much Better | 1. | 19 | 0 | 2 | 0 | 0 |
| 2. | 4 | 1 | 0 | 0 | 0 | |
| 3. | 7 | 3 | 5 | 0 | 0 | |
| 4. | 10 | 3 | 2 | 0 | 0 | |
| Much Worse | 5. | 20 | 10 | 11 | 4 | 0 |
Examining the diagonal from upper left to lower right on Exhibit 7-6, we see that there were 25 families (19 + 1 + 5) whose expectations matched their actual experience. For example, the 19 expected a large change for the better in their relatives' general happiness, and then reported seeing exactly that. Above the diagonal are the families whose expectations were disappointed. There were only two who expected a large change for the better, but saw no change. All the other families, (i.e., those below the diagonal), perceived that the happiness of their relatives had improved beyond their expectations. In fact, at the extreme lower left of the table, 20 families expected a large change for the worse, but actually saw a large change for the better.
| 134 Pre (Expected) | 134 Post* (Actual) | |
|---|---|---|
| * The significance of the prepost change for the 134 was p 0.001 by paired t-test for all items. | ||
| 14. Relative will not progress beyond present level | 2.0 | 2.9 |
| 17. CLA personnel are knowledgeable and skillful | 3.5 | 1.9 |
| 18. CLA funding is secure | 3.8 | 2.7 |
| 19. All needed services are available in community | 3.8 | 1.8 |
| 20. Community placement does not add to family financial burden | 2.8 | 1.7 |
| 21. Normalization | 3.1 | 1.9 |
| 22. Least restrictive alternative | 2.9 | 1.6 |
| 23. Deinstitutionalization | 3.6 | 1.9 |
In another part of the survey (Questions 14 to 23), we posed a series of 10 specific statements concerning deinstitutionalization, and asked for responses from 1 (strongly agree) to 5 (strongly disagree). All items changed in a positive direction, and 8 were statistically significant. These 8 are presented in Exhibit 7-7.
These results followed one general pattern: the 134 families became significantly more positive about each area after their relatives moved to CLAs (note that on Question 14, agreement implied a negative attitude).
Two items in Exhibit 7-7 were of particular interest. Item 14 was important because it concerned the developmental model, (i.e., the belief that all people can grow and learn). This concept is one of the cornerstones of the new ideology in mental retardation services. The families initially tended toward rejection of the developmental model, and at post-test changed only to neutrality. Both in the institution and the community, then, it appeared that families were not responsive to this relatively new philosophy.
The second item of special interest from Exhibit 7-7, Item 18, concerned the security of CLA funding, a very important issue for families. The families initially tended to disagree somewhat that funding for CLAs was secure and permanent. After relocation, the 134 families changed their opinion, but only to approximate neutrality. Their anxieties on this issue were reduced, but by no means eliminated.
Qualitative Results
At the conclusion of the structured interview, we asked an open-ended question: "Is there anything else you would like us to know about your relative's recent move from Pennhurst?" Interviewers were instructed to take comments verbatim, and not to ask additional questions.
Upon analysis of these responses, the predominant tone indicated that the majority of the respondents expressed very positive feelings about the CLAs and the quality of service therein. A significant majority had not expected such services and were quite overwhelmed by the superior quality of the facilities. The general feeling was that the relatives had shown progress toward development of skills for independent living. Many respondents attributed this growth to the personalized attention and interest of the staff, which was greatly facilitated by the small size of the facility and a high staff-to-client ratio.
The respondents also reported that they enjoyed their visits to the CLAs. They had found visits to Pennhurst "scary" and were intimidated by converging crowds of other people who lived there. Other respondents felt the CLA setting was conducive to bringing younger siblings for visits. Previously, parents had not wanted to expose other children to the large, hospital-like, impersonal environment of Pennhurst. In addition, most respondents indicated that their relatives appeared happier at the CLAs. They enjoyed the small family and home-like environment and individual attention.
Though the general tone indicated a positive attitude toward community living, there were some objections to the move from Pennhurst. Some respondents felt it was "not safe" and "rather dangerous" for "these people" to "walk around alone." The implication was that persons with mental retardation need to be protected from the "normal" world; that they should not be free to walk around, since they are vulnerable. Given the level of functioning of these former Pennhurst residents (86% were labeled severely or profoundly retarded, and nearly half were non-verbal), this belief was understandable. One respondent opposed the move because CLAs did not have the advantage of having all the necessary facilities (medical, recreational, educational) on the premises and another respondent objected on the grounds that the court decision to move the relative to a CLA was a violation of parental rights.
In addition, there were many expressions of concern about the security of funding for the CLAs from both the respondents who approved the move and those who did not. A number of respondents feared they might have to assume financial responsibilities for which they had no resources. Also, there was some apprehension about the effect of staff turnover. One respondent felt that the staff could not possibly be permanent since they would want to "live their own lives,” and feared that this would be emotionally damaging to his/her relative.
The retrospective evaluation of Pennhurst from these 134 families was that it was too large and crowded a place to offer adequate care and growth opportunities for the people who lived there. It was felt to be a place where repetitive, institutional behaviors prevailed due not only to the large numbers of persons housed, but also to the chronic shortage of direct care and professional staff.
Although the CLAs were seen as addressing the needs of the clients more favorably than Pennhurst, there was strong concern that they would not have the permanence of a large institution like Pennhurst. This appeared to us to be the central counterpoint to the general extreme satisfaction expressed in the open-ended comments, and this paralleled the quantitative results of the survey.
Discussion
The most striking result of the family survey was the overwhelmingly positive change in attitudes among the families of the people who left Pennhurst and went to live in community based settings. Also of significant interest were the attitudes which did not change. In this discussion, we will comment on both.
Before proceeding, it is important to stress the caveat that the Pennhurst results did not arise from families of individuals deinstitutionalized at random. We cannot be certain that the "sample" of 134 families were representative of the "population" of 630 families in every way, although we found that they were so in nearly every way we could measure. Although cautions against perfectly confident generalization to the population, or to facilities in other states, must be applied to the Pennhurst results, we believe that some general policy implications can be drawn.
The attitudes expressed by the families in the baseline study were consistent with the results obtained by Atthowe and Vitello (1982), Brockmeier (1975), Klaber (1969), Meyer (1980), Payne (1976), and Willer, et al. (1979). A large number of the families in our study disagreed strongly with deinstitutionalization, and a substantial number disagreed strongly with the principles of normalization and least restrictive alternative. The families in our study seemed to agree with families in other studies that the institution was the most appropriate environment for their relatives, and were generally very satisfied with Pennhurst. Our findings brought to mind Klaber's (1969) comments:
The parents…were convinced of the excellence of the facilities in which their children were placed…The praise lavished on the institutions was so extravagant as to suggest severe distortions of reality in this area.
Most of the families in the baseline study (75%) also believed that their relatives had reached the highest level of development possible. Evidently, families did not accept the idea that everyone, even persons with severe or profound mental retardation, can grow and develop (e.g., Gold, 1973). The families in the Baseline Study also believed their relatives had serious medical needs (although this belief was not confirmed by comparison to reports from Pennhurst staff).
These two attitudes, pessimism about future development and perception of serious medical needs, may be related. They could both have arisen from the advice given to the families, decades ago, by professionals. When the families in this study admitted their relatives to Pennhurst, an average of more than 20 years ago, there were no alternatives, and the professional with the most authority in these matters was usually a physician. The message most often given, we speculate, was on the order of 'IS/He will never be able to learn, and will always need medical care." These attitudes are not eradicated even today. Among both families and professionals, we would suggest vigorous efforts to provide the most up to date information; particularly for families of people who may move out of institutions. Any educational interventions should stress the idea that people can grow and learn, and should address medical concerns directly.
Families in the baseline study also were greatly concerned about the security of funding for community placements. They did not believe the funding for community alternatives was secure and permanent -- unlike the funding for institutions -- and felt they could not depend on the community service system to provide services for their relatives.
Six months after the relocation of their relatives, the 134 families in the Post-Relocation Study were more than satisfied with the community placement of their relatives. Many expressed astonishment over their own changes since the baseline survey. The families reported unexpected changes for the better in their lives, and in the lives of their relatives, especially with regard to the happiness of their relatives, their relatives' relationships with other people, and their own happiness. In addition, families' fears about the quality of CLA staff and about the availability of services in the community seem to have been allayed somewhat, although by no means complete y. An examination of the beliefs and attitudes which did not change is also revealing. For example, even after the relocation, families still believed their relatives had serious medical needs. Families also did not completely accept the developmental model (i.e., the idea that their relative would continue to grow and learn). Attitudes became more positive, but only to the point of neutrality, not to outright acceptance. In light of the increase the families had seen in their relatives' developmental abilities -- especially as reported in the open-ended comments -- this finding was difficult to interpret. In essence, most families were saying that they had recently witnessed large improvements, but they doubted that more was possible.
Families also expressed continued concern about the security of funding for community services. Their belief that funding was secure improved significantly, but only to the point of approximate neutrality. Their anxieties were reduced, but not eliminated. This appeared to us to be the central remaining issue among these families, who otherwise were generally surprised and pleased by the change from care in a large segregated public institution to small, more integrated settings in regular neighborhoods.
No matter how much families may prefer the services in the community, if they believe those services can be cut off for lack of funding next year -- or, more important, in ten or fifteen years -- families will not support community living. We believe this issue must be addressed on a federal level since the federal government has provided more fiscal support to institutions than to community service systems (Braddock, Howes, & Hemp, 1984). This has engendered a disincentive for states to develop community services.
Two final implications of our five years of research with families do not arise directly from data, but rather from years of impressions. The first is that any deinstitutionalization plan or effort should provide a formal forum through which families can express their feelings, especially their fears and their reasons for opposition. Although this need not guarantee that families have the power to veto community placement, impressions from formal family hearings in the Pennhurst arena strongly imply that many, perhaps most, families will become willing to "give it a try" after a formal and structured hearing designed to treat their concerns with dignity.
The second is that, in our experience with surveying these families, we have come to the conclusion that any monitoring or quality assurance system should include annual surveys of families. Particularly when conducted by a third party, such surveys can reveal information that families would not express otherwise. Many dissatisfactions go untold because families fear that state, county, or private providers will resent such statements and that the consequences might fall on the relatives. Our surveys in this area have been welcomed by families, they are very inexpensive to conduct, and they can help to raise red flags that would not reach official attention in any other way. In years to come, our surveys of families will continue as part of our permanent monitoring of Pennhurst class members (and others in the Commonwealth).
References
Atthowe, J.M., Jr., & Vitello, S.J. (1982). Deinstitutionalization: Family reaction and involvement. Unpublished manuscript, College of Medicine and Dentistry of New Jersey, Rutgers Medical School.
Barnes, D., Krochalk, P., & Hutchison, J. (1976). Comprehensive Community Residential Care System Study. Los Angeles: Exceptional Children’s Foundation.
Braddock, D., Howes, R., & Hemp, R. (1984). A summary of mental retardation and developmental disabilities expenditures in the United States: FY 1977-1984 (Preliminary working data). Chicago: University of Illinois at Chicago, Institute for the Study of Developmental Disabilities.
Brockmeier, W.E. (1975). Attitudes and opinions of relatives of institutionalized mentally retarded individuals toward institutional and non-institutional care and training. Lincoln: University of Nebraska, doctoral dissertation. Dissertation Abstracts International, 35, 5163A.
Conroy, J.W., Feinstein, C.S., Lemanowicz, J.A., & Kopatsis, M. In press.
Ferrara, D.M. (1979). Attitudes of parents of mentally retarded children toward normalization activities. American Journal of Mental Deficiency, 84, 145-51.
Frohboese, R., &. Sales, B.D. (1980). Parental opposition to deinstitutionalization. Law and Human Behavior, 4, 1-87.
Gold, M.W. (1973). Research on the vocational habilitation of the retarded: The present, the future. In N.R. Ellis (Ed.), International review of research in mental retardation, Volume VI. New York: Academic Press.
Klaber, M.M. (1969). The retarded and institutions for the retarded -- A preliminary research report. In S.B. Sarason and J. Doris (Eds.), Psychological problems in mental deficiency. New York: Harper & Row.
Meyer, R.J. (1980). Attitudes of parents of institutionalized mentally retarded individuals toward deinstitutionalization. American Journal of Mental Deficiency, 85(2), 184-187.
National Association for Retarded Citizens (1977). The parent/professional partnership: The partnership -- How to make it work. New York: NARC.
Payne, J.E. (1976). The deinstitutional backlash. Mental Retardation, 3, 43-45.
Stedman, D.J. (1977). Introduction. In J.L. Paul, D.J. Stedman, & G. Neugeld (Eds.), Deinstitutionalization: Program policy developments. Syracuse, NY: Syracuse University Press.
Willer, B.W., Intagliata, J.C., & Atkinson, A.C. (1979). Crisis for families of mentally retarded persons including the crisis of deinstitutionalization. British Journal of Mental Subnormality, Vol. 2, p. 2.
CHAPTER 8: NEIGHBOR ATTITUDES
Introduction
When a group home or community living arrangement (CLA) for people with mental retardation opens in a neighborhood, how do neighbors react? How many even know about it, and do their attitudes toward people with mental retardation change in any way? How do these attitudes compare to feelings about people with other kinds of differences? We have been exploring these questions in southeastern Pennsylvania for five years, as part of the Pennhurst Longitudinal Study, and some of the most interesting findings are reported in this chapter.
Attitudes about unfamiliar groups of people are generally characterized as stereotypes. As noted by Triandis (1971) and others, the strength of the stereotype is inversely related to knowledge about the group. The more one knows about a person or group, the less likely one is to develop stereotypes about them.
In most of this century, the practice of segregated institutional care has meant that people with severe or profound mental retardation rarely have been seen in public places. Despite the fact that institutional populations have been declining since 1967 (Lakin, 1979), and despite the literature and experience that demonstrate that people with severe degrees of retardation can live and grow in less segregated community settings (e.g., Bradley & Conroy, 1983), the public's knowledge about mental retardation is limited (Budoff, Siperstein, & Conant, 1979; Gottwald, 1970; Hollinger & Jones, 1970; Latimer, 1970). Therefore it is likely that public attitudes toward people with mental retardation are based on stereotypes. The question of whether these public attitudes can change, then, should be viewed from the perspective of theories on stereotypical attitudes.
Budoff et al. also implied an important function of attitudes, called the knowledge function. The knowledge function is related to the nee s o persons to maintain an-organized, stable, and meaningful structure of the world. These attitudes change when the existing attitude is insufficient for dealing with situations, whether because of new information or because of a new environment of some kind. This viewpoint is related to the situation of a group home opening in a neighborhood, in that stereotypes may prove to be of little value when a citizen directly encounters a new neighbor with mental retardation.
Researchers have assumed that knowledge about and contact with people with mental retardation affects attitudes toward such people, and that change of either knowledge or contact would change those attitudes. Much of the research on attitude change has been done in school settings rather than in the community (i.e., structured rather than unstructured contact), and previous studies of attitudes vary in their conclusions. Most of the studies indicating a relationship between contact and attitudes were concerned with contact that was structured in some way. Begab (1969), for example, found that increasing knowledge about retardation only effected a positive change in attitudes when education was coupled with direct contact with people with mental retardation.
There have been few studies which examined attitude change in communities where community living arrangements opened. Baker, Seltzer, and Seltzer (1974), and Sandler and Robinson (1981) examined the effects of preparing communities for the opening of a residence and suggested that preparation is likely to raise opposition, perhaps to the point of preventing the opening of the home. Mamula and Newman (1973) and O'Connor (1976) reported that, after initial opposition, communities tended to accept the residence. If opposition prevents homes from opening, however, there can be no opportunity for attitudes to become more positive. Sigelman (1976) suggested that a Machiavellian approach (i.e., establishment of homes without informing neighbors and without measuring attitudes) "has the advantage of preventing moves to block the home's opening" and that such an approach "may be no less effective in the long run than more elaborate strategies involving advance attitude sampling" (p. 26).
Because community acceptance has been portrayed in the media as a crucial issue in the opening and success of group homes and other community programs, the Pennhurst Longitudinal Study included an examination of the attitudes of members of the communities into which the people from Pennhurst moved. The situation offered the opportunity to conduct the first "before-and-after" interview study of neighbors. There was no preparation of neighborhoods; the only "intervention" was the actual opening of the community living arrangement (CLA).
The plan called for the assessment of neighbor attitudes toward people with mental retardation before and after CLAs opened in nearby houses or apartments. In addition, an exploration of the factors related to attitudes, and of factors related to changes in attitudes over time, was planned. The general research questions were: (1) What were the patterns of attitudes among the general public toward people with mental retardation living in their neighborhoods? (2) What factors and characteristics were associated with those attitudes, that is, were some kinds of neighbors more accepting than others? (3) Were there changes in attitudes after the CLAs entered the neighborhoods? and (4) Would there be any consistent pattern to, or predictors of, changes in attitudes?
Methods
Subjects
The locations of eight prospective CLA sites were obtained, and a one quarter to one half mile radius (depending on population density) was drawn around each. In each circle, 45 households were selected by a simple random selection procedure from crisscross telephone directories. A probabilistic, representative sample of the adults in those households was accomplished a procedure developed by Kish (1965). A table determined which household member was to be the interview subject, based on the number and kind of potentially eligible respondents in the household. In this table, the one selected would be varied from one interview to the next. No substitution was allowed. In this way, we achieved samples in each neighborhood that were close approximations to simple random samples (i.e., every person within the neighborhood had about the same chance of being interviewed).
There were 362 neighbors who were interviewed in the initial round. Their average age was 48 years. They were 87% white and 54% female, and 80% had a high school education or more. They had lived at their current addresses for an average of 16 years.
Design
This study of neighbor attitudes was designed to be the first to assess attitudes before and after opening of a CLA nearby. Initially, we intended to interview neighbors six months before the CLA entered the neighborhood, and then again six months after the opening. After completing that design, however, the research team determined to interview the neighbors again about a year later. The reason was that we had detected significant changes in attitudes at six months after CLA opening, and others (Mamula and Newman, 1973; O'Connor, 1976) had suggested, but had not quantitatively demonstrated, that such short term changes would vanish by about a year to a year and a half.
The national advisory committee for the study agreed that this was a worthwhile design modification, as did the government project officers. We therefore conducted a total of three waves of interviews with the original sample of neighbors.
Instruments
Because we did not want to inform respondents that a CLA was about to open in their neighborhoods, we could not ask the most direct questions -- such as "How do you feel about the group home that's going to open on your block next month?" Such questions would have destroyed the integrity of the study by giving information to many neighbors who otherwise might not have had it. More importantly, it could have engendered active opposition as suggested by Sigelman (1976). It was necessary to aim instead for general attitudes about people with mental retardation. No completely suitable instrument was found in the literature so a new instrument was developed.
We began by assembling 350 items from a dozen previously used scales. About two thirds of the items were immediately revised or rewritten to remove archaic language or to suit the conditions in Pennsylvania. We also wrote about 50 new items for our specific pre-post needs, then sorted all 400 into categories: (1) tolerance toward people with mental retardation in everyday settings; (2) knowledge about mental retardation; (3) general attitudes toward people with mental retardation; (4) frequency and locations of contact; and (5) fears and stereotypes. The research group then began to eliminate items within each category, keeping only the ones that appeared to be the most clear and concise ways to ask about each content area. After several cycles of review, we settled on a draft set of 50 items.
The draft interview contained many questions about attitudes toward people with mental retardation. We added items about people with physical disabilities, people of a different race, and people with mental illness. Again, these other questions were added to prevent respondents from coming away with the impression that they had been interviewed solely about mental retardation, or about new CLAs. We wished to avoid alerting the neighbors because of the possibility of resistance and because of experimenter effects. By alerting neighbors in a way that normally would not occur, we possibly could have altered their natural pattern of response to the eventual opening of the CLA. The extra questions also enabled comparisons of attitudes among the various groups, to give some idea of the magnitude and direction of the attitudes.
Following selection and refinement of items, the instrument was pretested. One of the most significant results of the pretest was the labeling of all questions about mental retardation with "mild" or "severe." This was done because nearly three-fourths of pretest respondents said, on at least one question, "It depends on how severe . . ." or a similar qualifier.
Following final review, the questionnaire contained 46 substantive items about various groups, and 34 concerned people with mental retardation. The instrument was submitted to the federal office of Management and Budget, and was approved by May 1980. At this final stage, it was designed to take approximately 15 minutes to administer. No mention of Pennhurst or the prospective CLA was contained in the interview.
After the baseline interviews, the form was shortened somewhat, and a few new items were added. After CLA opening, it was of interest to ask people whether they knew of any such programs in their neighborhoods, and if so, how long they had been in existence. The questionnaire is in Appendix 8-1
In order to provide a sensitive and reliable measure of general attitudes toward people with mental retardation, a scale was constructed from questionnaire items (ATTSCALE). All items were weighted equally, and a simple additive scale was constructed. Item selection was based on Cronbach's Alpha, a measure of one kind of reliability called internal consistency. By removing five questionnaire items (of the 18 chosen initially as candidates for a general attitudes scale on face validity grounds), Cronbach's Alpha attained a value of .78. This was a very acceptable value because Alpha provides a conservative estimate of reliability.
In addition, the interview included nine True-False items that were designed to be combined into a single scale of knowledge about mental retardation. It was intended to permit analysis of variations in attitudes, and in attitude change, according to how much people understood about mental retardation.
Procedures
Data collection was initiated with an introductory letter, followed by telephone screening and interviewing. The first interviews were conducted six months prior to the opening of the CLAs, in May-June 1980, and yielded 364 interviews. The second wave (an average of six months post opening) was conducted in the Spring of 1981, and yielded 287 interviews, 79% of the original sample. The third wave was conducted in the Spring of 1982, an average of about 20 months after CLA opening, and produced 252 interviews, 69% of the original sample.
Respondents who moved out of the boundaries of the CLA sample circle were not reinterviewed, and in one sample site the CLA did not open. The 34 sets of interviews from that neighborhood have been included only in the baseline results. The final data set, on which most of the results presented here are based, consisted of the remaining 218 respondents from whom all three interviews were obtained.
Results: Baseline Survey
Specific Attitude Items
Respondents were asked how much they would be bothered if two to five people with mental retardation moved into the neighborhood. As a comparison, and to avoid sensitizing respondents, respondents were also asked how much they would be bothered if members of other groups moved into the neighborhood. The results are presented in Exhibit 8-1.
| Question: How much would it bother you if 2 to 5 people who are […GROUP…] moved into your neighborhood? Would if bother you a lot, some, very little, or not at all? | ||||
|---|---|---|---|---|
| Group | A Lot | Some | Little | Not at All |
| Physically disabled | 2.5% | 27.5% | 11.9% | 80.6% |
| Mildly mentally retarded | 6.1 | 9.7 | 15.5 | 68.7 |
| Severely mentally retarded | 14.0 | 16.8 | 18.5 | 50.7 |
| Mentally ill | 16.4 | 25.6 | 15.8 | 42.1 |
| Of a different race from your own | 4.7 | 12.2 | 16.3 | 66.9 |
On this question, responses concerning people with mild mental retardation were most like those about people of a different race. Responses about people with severe mental retardation were most like those about people with mental illness. Also, responses showed sharply different levels of "bother" for mild versus severe mental retardation.
Respondents also were asked how much they thought the value of their property would be affected if two to five members of the same groups moved into the neighborhood. These results are presented in Exhibit 8-2.
| Question: How much do you think the value of your house would change if 2 to 5 people who are […GROUP…] moved into your neighborhood? | ||||
|---|---|---|---|---|
| Group | A Lot | Some | Little | Not at All |
| Physically disabled | 7.2% | 12.6% | 15.9% | 64.3% |
| Mildly mentally retarded | 7.3 | 13.6 | 18.2 | 60.9 |
| Severely mentally retarded | 13.3 | 17.5 | 19.0 | 50.2 |
| Mentally ill | 15.5 | 21.0 | 18.6 | 44.8 |
| Of a different race from your own | 12.4 | 25.6 | 14.4 | 47.6 |
On the property values question, again, feelings about people with mild mental retardation were less intense than feelings about neighbors with severe mental retardation. This time, however, responses about people with mild retardation were most like those about people with a physical disability; responses about people with severe mental retardation were similar to those for people with mental illness and people of a different race.
EXHIBIT 8-3. Attitudes Toward Different Groups
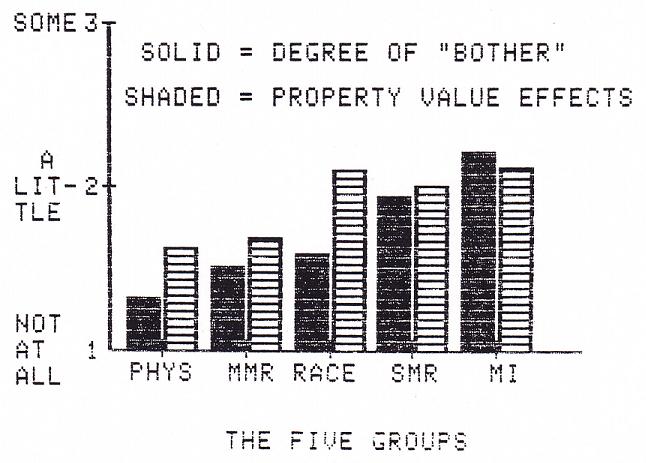
Comparison of the "bother" question to the property values question revealed an intriguing pattern. Exhibit 8-3 on the next page is structured to show the comparison as a bar graph, in which each bar represents the average value of the baseline responses to both questions.
The labels for the 5 groups in the figure have these meanings:
PHYS = People with Physical Disabilities
MMR = People with Mild Mental Retardation
RACE = People of a different Race than the respondent
SMR = People with Severe Mental Retardation
MI People with Mental Illness
In answer to either question (would you be bothered or would property values be affected), respondents could say:
[1 = Not at all] [2 = A little] [3 = Some] [4 = A lot]
These responses were treated as 4 point scales. The bar graph shows that, on the "bother" dimension, respondents said they would be bothered very little by new neighbors with physical disabilities, with mild mental retardation, or of a different race. They would be bothered much more by neighbors with severe mental retardation or mental illness.
The pattern for property value effects was different. Relatively 'mild' effects were projected for people with physical disabilities and for people with mild mental retardation. "Major" effects were projected for people of a different race, people with severe mental retardation, and people with mental illness. (Dividing the responses into minor and major effects is based on t-tests of differences among the mean scores for the five categories. The bars for property values in Exhibit 8-3 for PHYS and MMR were statistically indistinguishable from one another; the bars for RACE, SMR, and MI were also indistinguishable from one another. However the first two were statistically smaller than the latter three.)
An interesting facet of the bar graph data was that respondents were quite consistent for SMR and MI (they would be bothered considerably and property values would be affected considerably), they were fairly consistent for PHYS and MMR (they would not be bothered much, and property values would only be affected slightly), but they were not consistent for RACE. Here the respondents claimed that they would be bothered very little by new neighbors of a different race, yet they projected major property value impacts.
Factors Related to General Attitudes
The next step in analysis of the baseline data was an investigation of the factors that were related to the general attitudes of the neighbors toward people with mental retardation. As previously noted, we had composed such a scale by combining 13 items (ATTSCALE). The factors that might be related to this scale of general attitudes fell into two categories: unchangeable factors, such as the age and sex of the respondent, and changeable factors, or things that could conceivably be changed by social policy or experiences, such as knowledge about mental retardation or contact with people who have mental retardation.
Unchangeable factors. The baseline survey produced an array of demographic and descriptive data on the characteristics of each respondent. These characteristics were tested for relationship to general attitudes toward people with mental retardation via simple Pearson correlations and analyses of variance. The characteristics examined were age, sex, ethnicity (white/other), education, income, type of dwelling, length of time at this address, length of time in neighborhood, marital status, and number of children in the household. The three characteristics which were related significantly to attitudes (ATTSCALE) were age (r=.18, p=.002), ethnicity (binary variable, r=.13, p=.023), and sex (binary variable, r=.10, p=.038). Using these three variables together in multiple regression, age explained 7.8% of the variation in ATTSCALE, followed by ethnicity (3.4%) and sex (1.0%). Younger respondents, non-white respondents, and females had more positive attitudes. Altogether, these three variables explained 12.2% of the variation in our measure of attitudes toward people with mental retardation.
Changeable factors. The survey included nine true/false items about people with mental retardation. A scale of 0 to 9, based simply on the number of correct answers, was calculated for each respondent and was used as a general index of knowledge about retardation, people with retardation, and programs/services. Knowledge was found to be a strong predictor of attitudes (r=.46, p.001). We ran a multiple regression in which the three unchangeable factors above were forced to enter the equation first, 'and together they accounted for 12.2% of the variation in the general attitudes measured by ATTSCALE; after them, knowledge accounted for an additional 18.2% of the variation.
There were two measures of contact with persons with mental retardation -- one measured overall frequency of contact, and the other item measured contact in given settings (e.g., school, work, neighborhood, shopping). Among the contact variables, only "contact in neighborhood" (a simple Yes or No item) predicted attitudes (r=.30, p.001). Again using multiple regression, and entering the unchangeable characteristics of the respondents first, contact accounted for an additional 2.9% of the variance in ATTSCALE.
Both of these findings about the changeable variables suggested that general attitudes of citizens toward people with mental retardation were subject to change, either by increasing knowledge or by increasing contact.
Results: After CLA Openings
Changes in Attitudes
We divided the sample into two groups: (1) those who knew, at the time of the second interview six months after CLA opening (Time 2), that the CLA had opened, and (2) those who did not know, at Time 2, that the CLA had opened. The analyses of interest concerned only those who were aware of the existence of the CLA.
Only 28% of the respondents in our sample were aware that a CLA had moved into their neighborhoods by Time 2.
Among these neighbors who were aware of the CLA, attitudes became significantly less positive from six months before to six months after, and then became significantly more positive again by 20 months after CLA opening. Attitudes were not significantly different between Time 1 and Time 3, which indicated simply that general attitudes had returned to their original levels after a temporary negative swing. This pattern is illustrated in Exhibit 8-4 on the next page. Statistically, the average ATTSCALE score six months be ore was higher than the average score six months after (paired t=1.80, (56), p.001). The ATTSCALE scores six months after were significantly lower than at 20 months after (t=2.06, (56), p=.044). Scores at six months before and 20 months after were statistically indistinguishable.
Even by the time of the second interview, at six months after CLA opening, there was evidence that neighbors' attitudes were moving in a positive direction. Six months after opening, we asked the people who were aware of the CLA how they had felt when they had first heard about it, as well as how they felt about it at the time of the interview. The results are presented graphically in Exhibit 8-5 on the next page. Looking at the two bars on the right of the figure, the open bar represents the 7% of respondents who recalled being strongly in favor of the CLA when they first learned of its existence. The shaded bar represents the 20% who were strongly in favor "now." The entire figure shows the pattern of change -- there is a shift from the left to the right. Treating the responses as 5 point scales produces the same result from the statistical perspective. The average response "when first learned about CLA" was 3.09, and the average "now" was 3.64 (t=5.28, (132), p.001).
EXHIBIT 8-4. Neighbor Attitudes Before and After
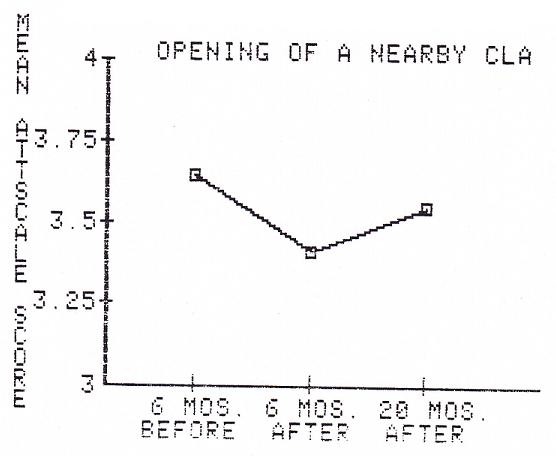
EXHIBIT 8-5. Self-Reported Attitude Changes
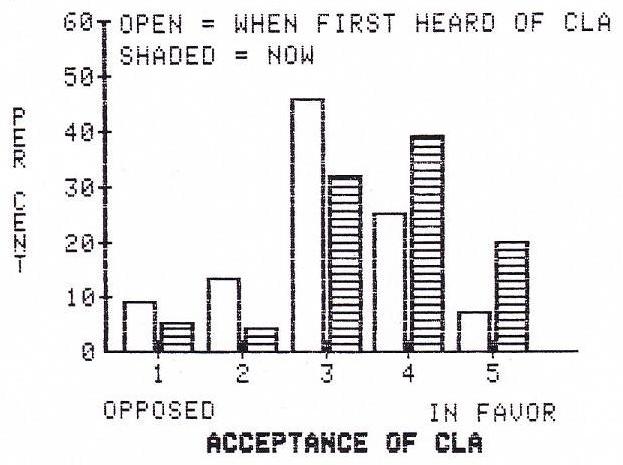
In sum, the respondents clearly recalled having been more opposed to having a CLA in their neighborhoods when they first heard about it than they were at the time of our second interview. This suggested that neighbor attitudes were already becoming more positive by the time of our six month post-opening interviews (and this was part of the rationale for the decision to conduct a third wave of interviews). This also suggested that, at one or two or three months after CLA opening, neighbor attitudes may have been considerably more negative than indicated by our six month results.
Contact in the Neighborhood
We explored whether contact with people with mental retardation in the neighborhood increased after the CLAs opened, and whether increased contact was associated with positive changes in attitudes. None of the contact variables showed a statistically significant increase, overall, for the sample of neighbors in this study. For the respondents who had said "No" in the first interview to "In the past six months, have you had any personal contact ... in the neighborhood," and who said "Yes" at 20 months after opening, we could discern no significant changes in general attitudes. This group of respondents followed the general pattern of temporary negative reactions followed by a return to the original level.
Real versus Hypothetical CLAs
We examined whether attitudes toward real CLAs were different from attitudes toward hypothetical CLAs. At the time of the third interview, about 20 months after the CLAs had opened, 68 of our respondents said they were aware of the CLAs' existence and 144 said they knew of no CLA in their neighborhoods (a few others did not answer this question). For the 68 who were aware, we then asked "How do you feel about that group home now?" and for the unaware 144, we asked "Imagine that a group home were located in your neighborhood...How would you feel?" These questions enabled us to compare the attitudes of people toward real CLAs to attitudes toward imaginary CLAs. The results are presented as the bar graph of Exhibit 8-6 on the next page. The striking aspect of this figure is the large difference on the right side; relatively few people (about 10%) were willing to express strong support for imaginary CLAs, perhaps partly because they were not sure what a CLA was or how it might affect the neighborhood. In contrast, the respondents who were aware of real CLAs that had been in their neighborhoods for an average of 20 months were more definite; 26% expressed strong support.
Discussion
This study of neighbor attitudes was the first to interview neighbors before and after group homes/CLAs opened in their neighborhoods. We were most interested in the question of changes over time, that is, whether neighbors would become more accepting or rejecting toward people with mental retardation after a CLA moved into the community. We also wanted to find out whether any such changes were short term or long term. In addition, some important subsidiary issues included the relation between contact and attitudes and the differences between some peoples' feelings about imaginary CLAs in their communities and other peoples' feelings about real CLAs. Our findings on these issues may prove useful to policy makers and planners, as well as to those who are involved more directly with implementing and operating small community based residences.
In general, members of communities do seem to accept their neighbors with mental retardation. Six months after the opening of the CLAs in our study, only about 28% of neighbors were aware of it. The attitudes of these neighbors became less positive from pre-opening to six months post-opening, but, by 20 months post-opening, attitudes had returned to baseline levels. In other words, for the neighbors who were aware, negative reactions were only temporary.
EXHIBIT 8-6. Feelings About Real and Imaginary CLA
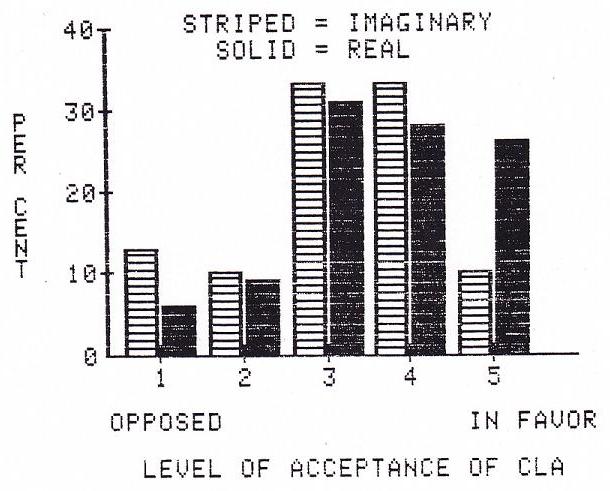
From our baseline data, we could conclude that the neighborhoods which would be more accepting are those where the population is younger and includes more non-white people and more females. However, these three variables combined only predicted 12.2% of the variance in our attitudes scale, and, therefore, we would not recommend that they be given much weight in choosing sites for CLAs.
The responses to the questions about how much citizens would be "bothered" by various groups of new neighbors, and about how such neighbors might affect property values, are interesting. For people with mild mental retardation, respondents reported that they would be "bothered" very little, and they expected no major impacts on property values. For people with severe mental retardation, however, the responses were quite different. Possibly this was because of a public perception that severely retarded people are immediately recognizable in a neighborhood, and might therefore have a far greater impact on property values than people with mild retardation. Citizens on the average believed that small groups of people with severe mental retardation, of a different race, or with mental illness, all posed about the same level of threat to property values, and the threat was considerable. About the first and third groups, citizens were even willing to admit that they themselves would be bothered by such people; for people of a different race, however, respondents appeared to be saying "I don't mind, but most people do, so property values would be affected." The possibility of public hypocrisy in this regard should not be overlooked.
The questions about real and imaginary CLAs reveal that, for the average citizen, the idea of a CLA in the neighborhood is more threatening than the reality. In our study, people who were aware of CLAs were significantly more positive than were people who did not know of any CLAs in their neighborhoods.
The data on imaginary and real CLAs also suggests to us that, if there are no CLAs already in a neighborhood, then only about 10% to 20% of neighbors will be opposed to allowing one to open. If one is already in the neighborhood, then opposition will be even less, and strong support may be available. This finding might be related to a common tendency for community residences to accumulate in a given neighborhood -- the "CLA ghetto" phenomenon. The more there are, the easier it is to open a new one -- up to a certain point, at least.
The 10% to 20% figure implies that only a small proportion of citizens would be opposed to a CLA -- unless something is done to raise opposition to the CLA, especially before the CLA opens. One possible scenario -- one that Sigelman (1976) has found -- is that even a small number of community members who are strongly opposed can influence general community sentiment, to the extent that the CLA does not open. Sigelman reported that "Although only two neighbors initially opposed the [proposed hostel] program, community sentiment reversed due to the efforts of one intense critic, to the point that almost all of the people who had originally accepted the proposal signed a petition against it" (p. 28). Similarly, one of the eight sites we chose for our study of community attitudes did not open because of community opposition. It is worth repeating that our respondents who knew of the CLA reported feeling more favorable toward the CLA over time; but neighbors can not grow to accept or welcome CLAs if the CLAs are prevented from opening.
It also seems that unstructured contact with people with mental retardation has little measurable effect on attitudes. "Contact in the neighborhood," the only significant contact variable at baseline, predicted only 2.9% of the variance in attitudes beyond that predicted by the characteristics of the respondents themselves. Post-opening, an increase in contact in the neighborhood had no effect on attitudes, regardless of whether the respondent was aware of the CLA. Given the possible problems with giving community members "advance notice" (i.e., time to raise opposition and prevent the opening of the CLA), and given the possible positive effects of structured contact reported by other researchers (e.g., Aloia, Beaver, & Pettus, 1978; Ballard, Corman, Gottlieb, & Kaufman, 1977; Leyser & Gottlieb, 1980; Marlowe, 1979; Voeltz, 1980), structured contact, or structured contact plus education, after the CIA has opened, may influence attitudes favorably without allowing prevention of the opening of the CLA. We suggest this as an area for future research, and such research need not be exclusively quantitative -- for example, the case studies and anecdotal reports of Robert and Martha Perske (Perske & Perske, 1980) are also of tremendous value.
Our results suggest, to us, that future research should include further examination of the effects of structured contact with the CLA residents after the CLA has opened. We also interpret our results as supporting Sigelman's notion of a Machiavellian approach to the opening of CLAs. Neighbors do seem to become more favorable over time, and, as previously noted, attitudes cannot improve if the CLA never opens.
References
Aloia, G.F., Beaver, R.J., & Pettus, W.F. (1978). Increasing initial interactions among integrated EMR students and their nonretarded peers in a game-playing situation. American Journal of Mental Deficiency, 82, 573-579.
Baker, B.L., Seltzer, G.B., & Seltzer, M.M. (1974). As close as possible. Boston: Little, Brown, & Co.
Ballard, M., Corman, L., Gottlieb, J., & Kaufman, M.J. (1977). Improving the social status of mainstreamed retarded children. Journal of Educational Psychology, 69, 605-611.
Begab, M.J. (1969). The effect of differences in curricula and experiences on social work student attitudes and knowledge about mental retardation. Dissertation Abstracts, 29, 4111-4112.
Bradley, V.J., & Conroy, J.W. (1983). Third year comprehensive report of the Pennhurst Longitudinal Study. Philadelphia: Temple University Developmental Disabilities Center. [http://aspe.hhs.gov/daltcp/reports/3yrpenn.htm]
Budoff, M., Siperstein, G., & Conant, S. (1979). Childrens knowledge of mental retardation. Education and Training of the Mentally Retarded, 14, 277-281.
Gottwald, H. (1970). Public awareness about mental retardation. Arlington, VA: The Council for Exceptional Children.
Hollinger, C.S., & Jones, R.L. (1970). Community attitudes toward slow learners and mental retardates: Whats in a name? Mental Retardation, 8, 19-23.
Kish, L. (1965). Survey sampling. New York: John Wiley & Sons.
Lakin, C. (1978). Demographic studies of residential facilities for the mentally retarded: An historical overview of methodologies and findings, Project Report #3. Minneapolis: Developmental Disabilities Project on Residential Services and Community Adjustment, University of Minnesota.
Latimer, R. (1970). Current attitudes toward the mentally retarded. Mental Retardation, 8, 30-32.
Leyser, V., & Gottlieb, J. (1980). Improving the social status of rejected pupils. Exceptional Children, 46, 459-461.
Mamula, R.A., & Newman, N. (1973). Community placement of the mentally retarded: A handbook for community agencies and social work practitioners. Springfield, IL: Charles C. Thomas.
Marlowe, M. (1979). The games analysis intervention: A procedure to increase the peer acceptance and social adjustment of a retarded child. Education and Training of the Mentally Retarded, 14, 262-268.
O’Connor, G. (1976). Home is a good place: A national perspective of community residential facilities for developmentally disabled persons. Washington, DC: American Association on Mental Deficiency.
Perske, R., & Perske, M. (1980). New life in the neighborhood: How persons with retardation or other disabilities can help make a good community better. Nashville: Parthenon Press.
Sandler, A., & Robinson, R. (1981). Public attitudes and community acceptance of mentally retarded persons: A review. Education and Training of the Mentally Retarded, April, 97-103.
Sigelman, C.K. (1976). A Machiavelli for planners: Community attitudes and selection of a group home site. Mental Retardation, 14, 26-29.
Triandis, H.C. (1971). Attitude formation and change. New York: Wiley.
Voeltz, L.M. (1980). Children’s attitudes toward handicapped peers. American Journal of Mental Deficiency, 84, 455-464.
CHAPTER 9: COMPARATIVE ANALYSIS OF THE COSTS OF INSTITUTIONAL AND COMMUNITY SETTINGS
Study Objectives and Limitations
The purpose of this component of the Longitudinal Study was to identify and compare the costs of residential, day program, case management, habilitation, behavioral, medical, and other services in an institutional and in a community setting, and to explain the differences in program costs within and across these settings. This study area was intended to surmount many of the limitations found in previous studies by employing a more comprehensive and rigorous design, including more exacting cost-finding procedures in conjunction with more refined program performance measures (i.e., measures of program outputs and outcomes).
A limitation inherent in the study was that the unit costs of the Pennhurst Mental Retardation Center programs and of the community-based residential and day programs were not necessarily representative of state mental retardation center costs and community-based program costs in other parts of the state let alone other parts of the country. In fact, the institutional and community-based day programs serving Pennhurst class members were generally on the "resource rich" as opposed to "resource poor" end of the spectrum, and had at least the potential of directing more resources to their clients than did programs in most other parts of the state and country.
The Center for Residential and Community Services at the University of Minnesota, based on its 1982 mail survey of 279 state institutions and mental retardation units in public mental hospitals, reported an average facility per them nationwide in fiscal year 1981-82 of $92.85 or $33,890 per annum; in Pennsylvania, the average per them was reported to be $107.64 or $39,289 per annum. The per them rate at the Pennhurst Center was somewhat higher at $123.00 per day or $44,899 per year.
The mean cost per client of the sample (N=73) of community living arrangements (CLAs) serving Pennhurst class members in fiscal year 1981-82 was $33,237. This is higher than the mean per client costs of all community living arrangements in the Southeast Region of $22,951, much higher than the mean per capita costs of all Pennsylvania CLAs of $17,856, and a great deal higher than the estimated average for small community residential facilities in other parts of the country, $14,242.
The mean cost per capita of the sample (N=16) of community sheltered workshops and work activity centers serving Pennhurst class members was $7,800 in fiscal year 1980-81. This was more than twice the state average of $3,386 per year. The mean cost per capita of the sample (N=3) of adult day programs serving Pennhurst class members was even higher at $9,644 per year. The estimated cost per capita of work activity centers and adult day care programs in the United States was an estimated $3,928 in Fiscal Year 1980-81.
Given this limitation, the more generalizable and important findings may be those explaining differences in program costs rather than those indicating the absolute magnitude of these differences.
Method
The cost study was confined to those programs at the Pennhurst Mental Retardation Center and in the five-county Pennhurst Service area (Bucks, Chester, Delaware, Montgomery, and Philadelphia) serving members of the plaintiff class. Plaintiff class members included persons at the Pennhurst Center or on the Pennhurst waiting list at the time the lawsuit was brought to the Center, and all those persons at risk of being admitted to the Center. The cost data covered the period July 1, 1981 -- through June 30, 1982.
The types of programs costed include residential, adult day (i.e., sheltered workshops, work activity centers, pre-vocational and adult day care), case management services, and specialized support services (specifically behavioral therapy, speech and hearing, and occupational therapy). Residential programs were narrowly defined to include services provided by residential care staff (including nurses) and their immediate supervisors. Some smaller community residential providers may have had only a single program, larger residential providers may have had a number of different programs. Each program consisted of one or more sites (apartments or home) and served clients reasonably homegneneous in terms of adaptive skills.
The study encompassed 42 living areas (residential programs) at the Pennhurst Center, and 102 residential programs in the community. The study covered four adult day programs at the Pennhurst Center and 35 adult day programs in the community. The study covered the specialized support programs in three of the five counties (n = 3) and at the Pennhurst Center (n = 1). The study covered the case management program at the Pennhurst Center (n = 1), the case management programs at each of the base service units in the five counties (n = 5), and the case management teams mandated by the court to serve members of the plaintiff class in each of the five counties (n = 5). Finally, the study examined the medical program and transportation program at the Pennhurst Center and the few medical programs and transportation programs in the surrounding communities for which cost information could be obtained.
Most of the program cost data, output data, and organizational data were obtained through reports on file at the Pennhurst Center and in each of the five surrounding county mental health and mental retardation (MH/MR) offices). Information on program cost data, output data, and other variables in part explaining variations in program costs were obtained in structured interviews conducted by the principal investigators with a purposive sample of 82 direct care staff at the Pennhurst Center, 17 community living arrangement staff, and 20 day program staff, with the mental retardation coordinator, case management supervisor, and Core team director in each of five counties, and with dozens of Pennhurst, county and state administrative staff.
Three types of unit cost measures were employed in comparing program costs: (1) cost per client day, (2) cost per hour of of direct care staff time, and (3) cost per hour of selected developmental services. The comparative analysis of the residential and day programs was structured to match (control for) the different types of programs in the community and in the Pennhurst settings in terms of the scope of services provided and types of clients served. The programs were classified into two groups according to the mean age of their clients: (1) adults age 22 and over, and (2) children age 21 and under. Each of these groups was divided into four subgroups according to mean adaptive behavior scores of their clients: (1) 0-25, (2) 26-50, (3) 51-80, and (4) 81-128. A ninth group included persons of all ages and adaptive levels but with overriding medical needs.
The client data necessary to make these classifications were obtained by Temple University using the Behavior Development Survey (BDS). The BDS is a short version of the AAMD Adaptive Behavior Scale. It was developed by the UCLA Neuropsychiatric Research Group at Lanterman State Hospital by selecting the most reliable and valid behavioral items from the full scale. The Temple Evaluation and Research Group extended the instrument by adding items covering client characteristics, family relationships, medical status, the individual habilitation plan, program goals, and type and amount of services delivered.
The community residential programs were also classified by facility type (i.e., those housing four to eight clients in group homes, those housing three or fewer clients in apartments, those housing three or fewer clients in small homes, and those where more or less than 24 hour supervision was required).
Explanations for differences found between the unit costs of programs at the Pennhurst Center and the unit costs of programs in the community were examined in terms of relative prices paid for program resources (e.g., staff, facility, etc.), level of resources employed (e.g., staff/client ratios), mix of resources employed (e.g., with or without nurses), and organizational variables (e.g., hours of service provided clients, the level of staff assistance provided clients, program size, and client mix). Regression analyses were used to explain the relative power of variables such as those cited above to explain unit cost differences among programs within Pennhurst and within the community.
The cost finding procedure was designed to capture as fully as possible the resources expended directly and indirectly, in the course of delivering services to clients. Generally, the total operating costs reported for programs were augmented by the costs of goods and services of benefit to the clients but not appearing on the books such as state and county charges for general administrative support, for the amortization of capital improvement costs, for insurance, and so forth. Deducted were those costs for goods and services of no perceptible benefit to clients such as research and development expenses, an litigation fees. Next were isolated those costs traceable directly to the residential day, and other client programs using the reports of expenditure by activity. Then the cost of the indirect activities were allocated among these residential, day, and other client programs in proportion to the direct costs of the programs in order to arrive at "loaded" costs for these programs.
Finding and Discussion
Residential Programs
Comparison of residential program costs per client day at the Pennhurst Center and in the community. On average, community programs were found to cost less per client day than Pennhurst Center programs serving groups of like clients in terms of adaptive behavior, age, and medical need. Also, the community programs showed a much larger range in cost per client day, $19.64 to $252.66, than did the Pennhurst programs, $99.74 to $208.94.
Minimally supervised apartments were the least costly type of arrangement on average at $54.64 per day. Group home programs cost a little more per client day at $59.80 . Apartment programs and small home programs showed the highest average cost per client day at $74.84 and $121.93 respectively. In all cases, programs for children cost more, on average, per client day than like programs for adults.
Comparison of residential program costs per hour of direct service worker and supervisor time at the Pennhurst Center and in the community. Measured in terms of the cost per hour of direct staff time, a measure more indicative of staff level of effort than the cost per client day measure, the economic advantage of community residential programs over the Pennhurst Center programs increased dramatically. While the average community-based residential program cost 70% as much as the average Pennhurst program in terms of cost per client day, the average community-based residential program cost only 40% as much as the average Pennhurst program when measured in terms of cost per hour of direct staff time.
Comparison of residential program costs per hour of selected development services and nursing services at the Pennhurst Center and in the community. Along with nursing care, the following types of developmental services were selected to form this measure: cognitive and academic training, mobility training, sensorimotor training, social interaction training, recreation therapy, family life/sex education, community living skills training, dressing skills training, eating skills development, hygiene and grooming, supervised recreation, and supervised recreational trips. The average cost per hour of selected developmental/nursing service in the community residential programs was 42-93% of that in the Pennhurst residential programs, depending on the average adaptive skill levels of the program clients.
Factors explaining differences in the cost per client day in residential programs. Client age was the only client variable shown to have any significant predictive value (p=.05) in terms of the cost per client day in Pennhurst residential programs. It explained 40.4% of the variation in the cost per client day with programs serving older clients having higher per diems.
Client factors that explain differences in the cost per client day among residential programs set in the community. Unlike the Pennhurst Center, in the community programs, age was one of the two client variables not shown to have statistical significance as a predictor (p=.05) of the cost per client day -- the other was client maladaptive behavior scores. Alone, the mean adaptive behavior scores of residents accounted for 13% of the variation in cost per client day, and medical need accounted for 3.0% of the variation. Together, as part of the overall regression equation, these variables accounted for 23.8% of the variation in the cost per client day of community residential programs.
The limited ability to predict program cost per client day based on these client variables may indicate that to some extent clients are fit to program models as much if not more than program models are fit to clients. Some programs may be structured to provide intensive service, while others may be geared to provide less intensive service for the same types of clients. There is some support among our findings for this line of reasoning. The correlation was found to be negligible between the mean number of hours of service provided to clients per week and the mean adaptive behavior scores of these clients (r=0,03, n=155), mean maladaptive behavior scores of these clients (r=0.02, n=155), and mean medical needs of these clients (r=0.17, n=155). Similarly, there appeared to be no significant relationship between the level of assistance staff provided to program clients and the adaptive behaviors (r=0.08, n=16), maladaptive behaviors (r-0.18, n=16), and level of medical need (r=-.01, n=16) of these clients. Even the hours of direct staff time per client showed no significant relationship to the hours of developmental/nursing service that clients actually received.
Organizational factors that explain differences in the cost per client day among residential programs in the community. Six organizational variables were entered into the final regression. Surprisingly, differences in the average salaries paid to residential program workers and supervisors bore no significant relationship to the program cost per client day. In fact, the correlation between these variables was negative (r=-.031) (n=47).
In contrast, the "number of direct care staff per client" variable alone explained 47.6% of the variation in the program cost per client day. For each additional full-time direct care staff member per client, the added per them cost was $32.54 in Fiscal Year 1981-82. This is to be expected as direct staff costs amount to such a high percent of community residential programs. Together with the other organizational variables, this variable accounted for 62.6% of the variation in program costs per client day (f=.0000).
The remaining four organizational variables alone accounted for 32% of the variation in the cost per client day of community residential programs (f=0.001). The most statistically significant of these last four organizational variables as a predictor of the cost per client day of community residential programs was the type of facility (small home, apartments, group homes) which explained 10.2% of the variation in community residential program per diems.
The second organizational variable shown to be a statistically significant predictor of the cost per client day was the number of clients served by the program (i.e., program size). This variable was negatively correlated with program per diems and accounted for 11.9% of their variation. Interestingly, the findings, though not at all conclusive, suggest that given a particular type of facility, the greater the number of residents, the lower the cost; however, the marginal cost advantage associated with a larger number of residents may not hold beyond 10.
The generally higher cost per client day in smaller programs (one to four residents) likely reflects non-economies of scale. Non-economies of scale occur when residential programs are so small that fractions of inputs, particularly staff time and facilities, cannot be secured. It is difficult for example to rent one third of an apartment, or to hire a staff person at less than half time. On the other hand, to rent excess space, or to hire a full-time staff person where only a part-time staff person is required, leaves the program with excess capacity. Of course, too few staff or too little space are not programmatically acceptable alternatives.
“Whether the program was in its initial year of operation,” was the third statistically significant predictor accounting for 13.8% of the variation in community residential program per diems. At the start, the residential program sponsors must expend resources to organize, staff, equip and supply the residential facilities before arrangements can be made for clients to move in. These one-time costs and delays in reaching full occupancy combine to explain why the per client costs of new programs are extraordinarily high. Not surprisingly then, programs in their first year of operation reported costs per client significantly higher than the other programs.
According to this latter regression equation: in Fiscal Year 1981-82:
-
Programs housed in small homes could be expected to cost $21.91 per day more than the average community residential program.
-
For each additional resident, the program cost per client day could be expected to decrease by $3.36
-
A program in its first year of operation could be expected to cost an average of $8.73 more per day than programs in existence for more than one year.
The size of the provider measured in terms of the total number of residential slots across all programs, was not found to be a statistically significant predictor of the program costs per client day.
Factors that explain differences between the costs per client day of residential programs set at the Pennhurst Center and set in the community. There are a number of apparent explanations for the finding that the costs per client day of residential programs, on average, were higher in Fiscal Year 1981-82 at the Pennhurst Center than the costs per client day of comparable residential programs in the community. These explanations relate to the relative prices paid for program resources, to the levels of resources employed, to the types of resources employed, to the types of clients served, and to other less tangible differences.
-
Relative prices of resources. Personnel service costs include the costs of staff salaries and wages, fringe benefits, staff development, and other miscellaneous costs relating to personnel. Approximately 78% of the residential and day program expenditures at the Pennhurst Center, and 0 (n=122) of the expenditures of residential programs in the community were devoted to personnel services.
Pennhurst Center residential workers, super-visors, and nurses were paid an average of 30% more than their community counterparts. Fringe benefits including paid absences (e.g., holiday, vacation, sick leave, disability leave, and personal leave) for staff at the Pennhurst Center amounted to 63% of base salaries. Fringe benefits including paid absenc6s in community programs amounted to only 36.1% of base salaries, less than half the rate of Pennhurst employees.
If the salaries and fringe benefit levels of direct service staff positions in the Pennhurst residential programs were reduced to the salary and fringe benefit levels of the same positions in the community residential programs, the mean resident per them at Pennhurst would have been reduced by more than 9% from $128.08 to $116.22. Assuming that the average difference in the salaries of community and Pennhurst program staff of 30% is also reflective of the difference in the average salaries of community and Pennhurst support staff in Fiscal Year 1981-82, the mean resident per them would have been reduced by about 27% or approximately $35 per day to $91.00 per day -- a per them rate equivalent to that averaged in the community residential programs.
-
Level of resources employed. Measured in terms of the hours of direct staff time per client, community residential programs assigned slightly more direct staff resources on average to each client than did Pennhurst residential programs in Fiscal Year 1981-82. Community residential programs spent an average of 1,902 hours of direct staff time per client, 84 hours more than the 1,753 hours of direct staff time per client at the Pennhurst Center. This accounted for some of the difference in the average cost per hour of direct staff time in the Pennhurst residential programs and community residential programs.
-
Mix of resources employed. There are several explanations for the differences in program costs related to how resources are employed in providing services to clients at the Pennhurst Center and in the community, specifically:
-
The use of in-house versus out-of-house resources -- specialization of labor--In the community residential programs, the residential workers were expected not only to supervise and train residents, but oftentimes to act as the resident's guardian helping them to manage their personal funds and related affairs, to buy and prepare food, to help clean the residence, to do the laundry, and to help administer client medications. At the Pennhurst Center, the residential workers were not expected to perform these additional functions; they were accomplished by other specialists.
In private industry the specialization of function such as occurs at the Pennhurst Center can be cost advantageous. Specialized workers often demand less pay than workers who are more broadly skilled, and their rate of production can markedly increase as they become proficient in their area of specialization.
However, the opposite seemed to be the case in the delivery of residential services. Specialists at Pennhurst demanded higher salaries and fringe benefits than the generalists in the community residential programs, and the community program workers were able to make more productive use of their time through job expansion rather than job specialization.
Many of the same goods and services (e.g., recreation, security, library, religion) that were produced by the Pennhurst Center were bought by or on behalf of residents in community programs or were publicly available at no charge. The cost advantage here was to the community programs given that the costs of these goods and services was largely fixed, likely to be comparable to the costs at the Pennhurst Center and could be spread over a greater number of persons in the community than at the Pennhurst Center.
-
The medical model versus development model of care -- Simply put, the medical model tends to view the relationship between staff and residents in terms of doctor and patient and emphasizes diagnoses and prognoses, and treatment services. While the Pennhurst Center in Fiscal Year 1981-82 had moved in favor of the development model, the staffing pattern was still a vestige of the medical model with a significant complement of higher-paid doctors, nurses, and other medical support staff relative to community programs.
-
Day Programs
The per diem cost of the work activity center and sheltered workshop programs at the Pennhurst Center ($30.05) was only slightly more than the mean per them costs of work activity center and sheltered workshop programs set in the community ($27.99). The mean cost of the community adult day care programs, $37.75 per day, was equivalent to the cost of the adult day care programs at the Pennhurst Center, $37.29 per day.
The average cost per hour of direct staff time in the Pennhurst Center day programs was $19.48, 80% less than the average community day program cost of $24.54. For sheltered workshop and work activity center programs, the cost per hour of direct service worker and supervisor time at the Pennhurst Center, $19.77, was less than 70% of that of the community sheltered workshop and work activity center programs, $28.78. Conversely, in the case of adult day care programs, the cost per hour of direct service worker and supervisor time in the community ($9.73) was just over 50% of that at the Pennhurst Center ($18.72).
The average salary of Pennhurst day program service workers and supervisors in Fiscal Year 1981-82 was 28% higher than the salary enjoyed by their counterparts in the community programs (n=24), and the average fringe benefits rate (including paid absences) was double that of the community day programs (63% versus 36.1%). In addition, the community-based work activity centers/sheltered workshop programs were able to provide 532 (n-21) direct staff hours per client versus 340 at the Pennhurst work activity center/sheltered workshop program.
However, this difference was not manifest in the relative costs per hour of direct staff time. The cost per hour of direct staff time in community work activity centers/ sheltered workshops was $28.78, over 45% higher than the $19.77 cost per hour of direct staff time at the Pennhurst work activity center/sheltered workshop program. This appears to be due to the fact that unlike the Pennhurst Center program, many of the community work activity centers and sheltered workshops supported drivers, food service workers, business development, and other support staff. Indirect staff salaries and wages amounted to 36.5% of direct staff salaries and wages in the community work activity center and sheltered workshop programs; whereas, in the Pennhurst work activity center and sheltered workshop programs, indirect staff salaries and wages amounted to only 18.6% of direct staff salaries and wages.
Habilitative and Behavior Management Programs
The manner in which these services were made available differed at the Pennhurst Center and in the surrounding communities. The main differences were that at the Pennhurst Center when these services were provided centrally and directly by a cadre of full-time professional staff. In the community, they were provided at residential and day programs scattered throughout a five-county area, by county Core teams comprised largely of consulting professionals. There are a number of activities comprising each type of habilitative or behavioral service, some related less directly to particular clients and some related more directly. At one end of the continuum are meetings, coordination and planning activities among professionals centered on groups of clients. At the other end are face-to-face services to individual clients. In between is the time spent monitoring client records, documenting individual client programs for implementation, training small groups of staff on the use of various service techniques, and consulting with residential and other staff on how to implement a particular therapeutic program for a client. The more narrow the band of activities recognized as "direct" service (i.e., the fewer professional hours counted as "service hours"), the higher the cost per hour of service.
If one uses the broadest, most encompassing definition of service (i.e., including all but strictly administrative activities as part of a professional's "service hours"), then the Pennhurst Center showed the lowest average cost per hour at $23.64. However, when general and client-specific program planning and coordinative activities are excluded as well, two of the three community Core teams become less costly per hour than the Pennhurst Professional Services.
Case Management Programs
In the community, the case management functions for develop-mentally disabled clients in the Southeast Region are shared by the court-mandated Pennhurst case management team, and the regular case management system, located either in the county office or in base service units (usually part of community mental health centers). The Pennhurst case management teams were established in each county as part of the court-order to place residents from the Pennhurst Center in the community. The mean total caseload for each Pennhurst case manager (including persons residing in both community and institutional residences), was 30. The mean total caseload for each regular case manager based in county offices was nearly three times higher at 85, and the mean total caseload for case managers in base service units was still higher at 107. The Pennhurst caseloads ranged from as few as 28 in Philadelphia to as many as 38 in Delaware county; the base service unit caseloads ranged from 68 in Chester County to 143 in Delaware county.
The mean cost per case in the base service units in fiscal year 1981-82 was $299, little more than 25% of the $1,159 mean cost per case of the Pennhurst case management teams. The cost per case at the Pennhurst Center was $1,050 during fiscal year 1981-82, about 10% less than the mean cost per case of the Pennhurst case management team but more than triple the mean cost per case of the base service units.
As indicated earlier the individualized nature of the case management function in general, and the variations in the way case management was carried out at Pennhurst Center and in the surrounding communities complicated attempts to arrive at standardized units of activity for purposes of comparing the costs of the case management programs between the Pennhurst Center and in the community, and even among programs within the community. The only unit of cost which could be used was the cost per case -- a measure providing no indication of the amount of services received by the clients. One can be reasonably sure that the level of effort per case was greater, and necessarily so, on behalf of clients in transition from the institutional setting (Pennhurst Center) than on behalf of those not in transition (e.g., most base service unit clients). How much greater could not be ascertained
Medical Programs
A straightforward comparative analysis of the medical program costs at the Pennhurst Center and in the community was not possible since (1) the nature and intensity of the medical services offered at the Pennhurst Center and in the community differed in major respects, and (2) the costs of services provided by the multiplicity of private practitioners in the community serving members of the plaintiff class could not be obtained. To arrive at reasonably precise and valid cost comparisons would have required far more extensive cost finding efforts than were warranted under this project. However, cost estimates could be obtained for Pennhurst medical services, and charges (under Medicaid) could be obtained for other community medical services.
For purposes of this analysis, medical programs are defined to include five major types of services or activities: medical program administration, general medical services, infirmary care, emergency treatment, and acute inpatient care.
Medical program administration. This category includes planning, coordination, quality assurance and enhancement activities. The Pennhurst Center's medical program was administered under contract to the NEEMA Medical Services Incorporated. The estimated cost of this management and administrative support in Fiscal Year 1981-82 was $249,792, or $308 per resident.
There is no comparable administrative unit in the community dedicated to the medical care of mentally retarded persons. Clients are expected to take advantage of existing medical services.
General medical services. This includes the services of primary care physicians. The physicians are engaged in preventive medicine as well as in the provision of medical treatment. At the Pennhurst Center, physicians engage in a number of prevention activities, prescribe and oversee the nurses' administration of client medications, and treat general client illnesses both on the wards and in the infirmary. Most all diagnostic and laboratory services are contracted out to private hospitals and laboratories. The estimated cost of the preventive medicine in Fiscal Year 1981-82 was $128,343 or $158 per resident. The estimated cost of general medical treatment was $1,755,818 or $2,264 per resident. The reported cost of the diagnostic and laboratory services was $244,941 or $302. The total annual cost of general resident services per resident there was $2,624.
In the community, preventive medicine is quite limited. Medications are administered to community-based clients by community living arrangement or day program staff or they are self administered under the supervision. The medications are prescribed by a licensed physician.
With the exception of some clients in Bucks County, the choice of a physician for each client is made by the community living arrangement staff with the informed consent of parent or guardian. Charges for the services of these physicians are generally reimbursed under Medicaid. Assuming that the utilization of physician services by Pennhurst class members residing in the community was not appreciably different than the utilization of physician services by other severely disabled Medicaid recipients in fiscal year 198182, the physician utilization rate and related charges in the community were far less per client than at the Pennhurst Center. According to Medicaid Utilization and Expenditure Reports for 1982, persons eligible for Medicaid for reason of severe disability in Pennsylvania made an average of 2.54 visits to community physicians each month with an average charge of $11 per visit. The average annual cost per patient for physician services was $336.54. This contrasts sharply with the estimated cost of $2,322 per resident for physician services (not counting laboratory services) at the Pennhurst Center. It should be noted that under the Title XIX (Medicaid) program the fees allowed the physicians for these services are generally lower than actual costs with the difference between actual costs and allowable Medicaid charges made up by other private payers.
The Pennhurst infirmary includes all nursing and other routine services involved in attending to the needs of inpatients. The average cost per client day at the infirmary in Fiscal Year 1981-82 was $187.
Convalescent and other infirmary-like care in the community is made available through special staff assignments, the use of temporary staff, the use of nurse consultants obtained through county CORE teams, and in some cases through ad hoc arrangements with nursing homes. The reimbursement ceiling under Medicaid for intermediate care facilities and for skilled nursing facilities in Pennsylvania in Fiscal Year 1981-82 ranged from $36.58 to $48.02 and $48.85 to $63.11 respectively. In terms of nursing home care, at least, private nursing homes represented a more economic alternative than the Pennhurst infirmary.
On the other hand, the Pennhurst medical program made use of four private hospitals for acute patient care. These hospitals and their allowed charges under Medicaid ranged from $295 to $517 per day in Fiscal Year 1981-82. Thus, there appeared to be an economic advantage to having an infirmary at the Pennhurst Center at least insofar as it precluded the unnecessary private hospitalization or prolonged hospitalization of clients.
The provision of emergency treatment demands the ability to respond effectively to medical emergencies on a 24-hour-a-day basis. The Pennhurst Center boasts a medical emergency response system capable of producing a physician at a client's side within three minutes. The best emergency response systems in communities are able to responsed in no less than ten minutes. Counting only the "extra" cost of contracted physician coverage on nights and weekends as the effective cost of the emergency treatment program at the Pennhurst Center, the costs came to $4,160 per emergency.
In neighboring Phoenixville, ambulance services are provided to residents at an average cost of $25 per trip. Treatment is provided in the Phoenixville Hospital emergency room. Clearly, the costs of providing emergency coverage for mentally retarded clients in the community is less than at the Pennhurst Center. The higher costs per patient at the Pennhurst Center was a function of:
- the special coverage required in weekends and evenings;
- the use of physicians directly as opposed to paramedics or medical technicians as intermediaries;
- the infrequent and random occurrence of medical emergencies. In the community, emergency teams are more fully utilized (i.e., operate near capacity) given the much greater number of emergencies occurring in the larger Phoenixville community.
Policy and Research Implications
This study brings to the fore a number of key policy considerations and suggests areas for further research. First, it points to some "out-of-pocket" savings inherent with smaller community-based programs as opposed to larger institutional programs. Clients in community-based residential programs are able to take advantage of generic services available to the general public such as public transportation, religious services, recreational facilities, library services and police and fire protection. For the most part these services are paid largely through public taxes along with some private donations and user fees, and the cost is spread over a much larger number of persons than is possible in the institution.
Second, the findings suggest that in the provision of residential services there may be no economic advantage associated with the specialization of labor in larger organizations such as the Pennhurst Center that normally would be expected. In fact, the opposite may be true. Smaller community programs, wherein staff generalists perform not only client supervisory and training functions, but guardianship, food service, housekeeping, laundry, and other such functions are more economical than larger institutional programs employing a cadre of in-house residential support specialists. The apparent economic advantage is made even greater by the relatively low salaries and fringe benefits paid to the residential generalists in the community programs as compared to the salaries and fringe benefits paid to the residential specialists at the Pennhurst Center.
Third, this study echoes the findings of comparative cost studies of community and institutional-based programs in other areas of the country. These studies, as well as the Pennhurst cost study, show that the employees of state institutions generally command higher salaries and more ample fringe benefits than do their counterparts in community-based programs. In fact, at least in the Pennhurst area, these differences accounted for most of the difference between the costs of Pennhurst and community residential and day programs.
Presently, secondary wage earners and entry level wage earners appear to be the mainstay of the residential program work force in the community. Clearly if, either as a by product of growth and maturation of the community services network or as a matter of policy, community program salaries and fringe benefits increase, the cost advantage of community programs will shrink considerably.
Fourth, the community residential programs showed a greater cost advantage over programs at Pennhurst when measured in terms of the cost per hour of direct care staff time rather than in terms of the cost per client day. Thus advocates for community residential programs might be well advised to argue in terms of these latter measures, measures more indicative of the level of effort being expended on behalf of clients, than in terms of the cost per client day measure. Community residential programs are probably better sold on the basis that you "get more direct staff time for your money" rather than arguing simply that "they are cheaper" than programs in institutional settings.
Fifth, the results indicate that institutional settings can house a variety of residential programs and day programs as can community settings, and that these programs vary widely in cost. It also illustrates that while the cost of community and residential day programs, on average, are below those of the institutional programs, many community programs can in fact be more costly than programs serving similar individuals in an institutional setting.
Sixth, the four client variables -- adaptive behavior, maladaptive behavior, age and medical need, believed to be indicative of client service need and of the intensity of staff support required, were found to explain only 23.8% of the variation in program costs per diem. This finding and like findings of earlier studies, suggest that a relatively small percent of the variation in program cost seems to be explainable in terms of client-specific variables. What may well be confounding these attempts has been the diversity of programs (and associated costs) established to serve clients, even clients who are alike in terms of key behavioral and functional indices of service need. One has to accept the possibility that the way programs are designed may be less a matter of the type of client to be served and more a matter of what is in the mind's eye of program officials. Moreover, one must be open to the possibility that the amount of time spent by staff in service to clients may be more a function of dynamic factors such as program leadership, staff training, and the proclivities of individual staff than a function of either the types of clients served or the organizational structure.
It may be time to end our seeming preoccupation with the analysis of existing program costs at least in so far as they are being used in a normative sense to inform program planning and budgeting decisions. A more useful approach to providing program cost information in support of policy-and budget-making, might be more prescriptive than descriptive in nature. One would first establish program models appropriate to different types of clients and estimate the costs of these models. Such models, built around prescriptive as opposed to normative program designs and costs, if nothing else, would upgrade the economic arguments for and against programs from an actuarial, value-less basis to a criterion, value-centered basis--that is from economic arguments blindly accepting of existing programs and practice and the costs thereof, to economic arguments predicated on the costs of programs shown to be of benefit to clients or at least to meet generally accepted standards of practice.
Indeed, the continued emphasis on normative, as opposed to prescriptive, cost analyses and funding arguments could well lead to the widespread underfunding of community programs just as institutional programs have been underfunded for so many years. Already community program advocates are finding themselves caught in the backwater of such simplistic and shortsighted arguments advanced in earlier years. Officials in a number of states report that they are effectively prohibited from establishing community programs at a higher per them rate than that of the state institutions as they are still being held to their earlier claims that "community programs are less expensive than institutional programs."
These prescriptive program models can be constructed through expert opinion, or given the considerable research that has occurred over the past decade, empirically. Using such models, policy makers will be able to more systematically explore the long term impact of funding decisions on system costs and client outcomes addressing such questions as:
-
What is the projected growth of the developmentally disabled population and what are the cost and budget implications of this growth?
-
What are the expected long term costs of closing a given institution for mentally retarded persons in the state?
-
What are the expected costs/effects of the gradual shifting of Title XIX funding from programs in institutions to programs in the community?
Seventh, the study suggests several areas where research is needed to better inform those policy makers in a position to shape the future of the developmental disabilities service system:
-
Research is needed to assess the extent to which residential and day program size, staff remuneration, and staff tenure affect the morale, communication and related (presumed) productivity of staff.
-
Research is needed to assess the costs/benefits of alternative medical service models, within institutional and community settings.
-
Research is needed to assess the relative stability of residential programs and the effects of facility changes, program changes, and staff changes on client development, on the sense of well being among clients, and on family support for community programs.
CHAPTER 10: FINAL IMPLEMENTATION ANALYSIS
Overview
The following discussion represents the last in a series of analyses of the implementation of the Halderman v. Pennhurst (1977) litigation in the Commonwealth of Pennsylvania. As a component of the multi-part Longitudinal Study of the Court-Ordered Deinstitutionalization of Pennhurst, the purpose of the implementation analyses over the past four years has been to concentrate attention on particular issues or constellations of issues that have grown out of the complex relationships and interactions that characterize the Pennhurst case and similar lawsuits in other states. To date, these special studies have focused on the role of the special master in complex litigation (Year 1), the differential responses of Pennsylvania and two comparison states to broad scale litigation in mental disabilities (Year 2), and, most recently, the influence of families, unions, legislators, and court-appointed compliance officials on the implementation of comprehensive decrees (Years 3-4).
Project Objectives
Because this is the final year of the longitudinal study, the Implementation Analysis for Year 5 serves as a vehicle for summing up the overall impact of the litigation on various levels of the service system in the state. Specifically, the objectives of this overview are as follows:
- To shed light on the influence that the Pennhurst litigation has had on the mental retardation system in the state;
- To identify both positive and negative consequences that the litigation may have had on clients, county programs, and the conduct of state services generally;
- To assess the extent to which the aims of the litigation coincide with the aims of the state's mental retardation policy makers;
- To speculate on the possible ways that the Iitigation may have altered the flow of resources to mental retardation programs in the state;
- To determine the extent to which the aims of the litigation in Pennhurst have been achieved and to contrast these findings with those in other states;
- To reflect on the policy implications of the findings in Pennsylvania against the back drop of implementation in other parts of the country.
Method
In order to provide a context for this final assessment that is sufficiently rich to yield insights into the issues posed, project staff conducted a variety of data gathering activities. First, staff designed topic guides for each of the categories of key informants interviewed in Pennsylvania including county administrators and staff, lawyers, service providers, and state officials. Additionally, a specially tailored topic list was designed to guide conversations with representatives of national organizations in the field of developmental disabilities. In order to gain an understanding of some of the potential systemic effects that the litigation may have had in the state, project staff developed a list of questions for the Department of Public Welfare that included requests for data comparing fiscal and service development and utilization trends in the Southeast Region with the rest of the state. Further, project staff canvassed each county in the state to secure comparative data on the magnitude of waiting lists for community residences since the court order was issued. These inquiries were valuable because they also elicited information on the perceptions of out-of-region mental retardation personnel regarding deinstitutionalization at Pennhurst and the impact of the litigation on other parts of the state. Finally, project staff reviewed the quantitative studies conducted by Temple University on client progress, residential environments, and parental attitudes.
The analysis is organized into three parts. The first section discusses the competing claims associated with public law litigation in the field of mental disabilities made by plaintiffs on the one hand and by defendants on the other. Claims include the legal, philosophical and programmatic assertions made by the various parties regarding the advisability and utility of the litigation. Using such claims as a basis for the analysis, the second section introduces ten key questions regarding the impact of the lawsuit in the state and explores each of these questions using data from both the qualitative and quantitative studies. The influence of the litigation is analyzed with respect to each of the following: client well-being, allocation of resources, conditions at Pennhurst State Center, and state policy. The final section draws together the themes in the analysis and posits possible policy directions at the state and national level based on the findings of the analysis.
Competing Claims
History
Opinions about the advisability of using the federal courts to secure the rights of mentally disabled persons have diverged since the first major right to treatment lawsuit, Wyatt v. Stickney, was filed in 1970. This landmark case was ushered in amidst increasing frustration and outrage over conditions in public facilities for mentally ill and mentally retarded persons. The case was also brought during an era of increasing sensitivity to the civil liberties of disadvantaged groups within the population including handicapped individuals as well as minority groups. Further, the use of litigation to bring about reforms in social institutions was still somewhat new and was limited primarily to racial discrimination and reapportionment. The historic education discrimination case, Brown v. Board of Education (1954), was decided only 16 years earlier, and Baker v. Carr (1962), the redistricting case, was only six years old. The use of class action litigation to bring about complex or multi-step restructuring of social systems was even newer and at that time was limited primarily to employment discrimination based on race. This is all by way of saying that Wyatt v. Stickney was on the crest of a wave that was to carry over well into the late 1970s, but the entailments of long-term judicial management of social reform were only dimly perceived.
Many state administrators greeted the advent of litigation to improve conditions for mentally retarded with cautious acceptance. At a conference in 1972 on "The Rights of the Mentally Handicapped" attended by state mental retardation officials and members of the emerging mental disabilities bar, one state administrator made the following statement:
Personally, I feel these are exciting times. I do not really look on lawsuits with fear or resentment. I do not look on the unrest that we are facing today, whether we be professionals or parents, legislators or private citizens, as totally frustrating and depressing. But, I look on it as a challenge in this country to change the system that applies to human beings. I think the basis of all the trouble is that we have a 1930 era delivery system trying to provide services in the 1970's, and, in most cases, we are not, at this point, even heading in the right direction. We have an opportunity, for the first time, to come up with a step by step plan on where we are going in human services. (Ray, 1972, p. 31).
Lawyers at this same conference were equally positive about the possibilities for reform inherent in public law litigation. Thomas Gilhool (1972) -- who had successfully secured a favorable consent decree for the plaintiffs in the Pennsylvania right to education suit (Pennsylvania Association for Retarded Citizens v. the Commonwealth of Pennsylvania, 1972) and who would subsequently represent the PARC plaintiffs in the Pennhurst case set out the following list of objectives for litigation:
(1) the first is to achieve certain end objectives, in the Pennsylvania case a zero reject system of education; (2) the second is to create new forums, new places where citizens may assert their rights; (3) the third is to raise in court new facts and the need for more appropriate public responses and, thereby, sensitize the general citizenry, the legislature and other social institutions; and (4) to permit citizens through a petition for redress to express themselves. (p. 48)
This is not to say that those who were present at the beginnings of the movement were naive or unaware of the potential problems that the use of litigation might encounter. Judge David Bazelon (1972) (author of the landmark right to treatment decision, Rouse v. Cameron) made the following observation regarding the problems of implementation:
I have become too sensitized to the many problems in the enforcement of such a right to remain silent. It would be a great mistake to ignore the impact of the Wyatt decision, and to leave undone the reforms it requires. It would also be a great mistake to think that Wyatt is the end of the road. We have not even set foot on the path of grappling with the fundamental problems. (p. 15)
Bruce Ennis (1972), a lawyer with the New York Civil Liberties Union, also struck a somewhat prophetic chord when he noted the following:
Every single standard which we developed in the Wyatt case was generated not by us but by professional people who had an enormous input . . . Other lawsuits are pending right now. . and hundreds more are going to be filed. . . If we do not continue to get . . . help from professionals, then the lawyers are going to have to do something that they are not equipped to do. (p.88)
As time wore on and the momentum of litigation sped up, some administrators faced with the day to day job of implementing court decrees and responding to mounting reporting requirements began to question the merits of using litigation to bring about reform in the system of care for mentally disabled persons. One of the initial concerns, which was not limited to administrators but legal reformers as well, was the seemingly endless cost of improving conditions in institutions. By the mid-seventies, for instance, compliance with the Willowbrook decree had already cost upwards of $20 million at the state institution alone. Added to anxieties about the perversion of fiscal priorities, administrators also began to voice concerns about the administrative burdens placed on state officials by litigation and the diversion of scarce resources away from ongoing system responsibilities. A state offical summarized the negative effects as follows:
The most visible effect is the diversion of professional activities from the raison d'etre--patient care. Treatment resources, although expanding, are occasionally scarce and generally expensive in any economic sense. At times, litigation has forced a majority of clinicians and top management in specific facilities (and occasionally entire Divisions or Departments) to concentrate exclusively on documentation, historical record searches, and other demands of Discovery, in lieu of patient contact or supervision. . . (Marsh, 1972, p. 39)
Questions regarding the equitability of public law remedies began to be posed, especially as the availability of resources became more constrained in the late 1970s. The issue became whether the creation of a special "class" of mentally disabled persons singled out for favored -- albeit remedial -- treatment had the effect of taking resources away from similarly situated and equally needy non-class members. As long as resources were relatively plentiful, distinctions between class and non-class members were not as readily drawn. In fact, many argued, and continue to argue, that the presence of litigation in a state serves as a catalyst for reform and enrichment of services for all mentally disabled persons. However, in an era of cutbacks, or at least minimum system expansion, the provision of resources to fulfill the requirements of a consent decree can become a bone of contention among those who feel left out. As one of the defendants' experts noted in the second round of the Wyatt case, "There is a finite amount of resources and a finite amount of time available to use those resources, and many needs. Each dollar that we spend for one person is an hour or dollar subtracted from another" (Rosenberg and Friedman, 1979, p. 822).
During the mid to late 1970s, litigation strategies changed as lawyers and plaintiffs became more sophisticated about the strengths and shortcomings of the lawsuit as a tool for system change. Instead of focusing on the improvement of institutional conditions -- an approach that appeared to be only partially successful, mental disabilities attorneys shifted the focus of their remedies to the promotion of deinstitutionalization and the expansion of community resources. The change in emphasis can be seen in the pleadings in the Pennhurst litigation, and in the consent decrees in the Wuori v. Zitnay (1978) case in Maine and in Michigan Association for Retarded Citizens et al. v.Donald Smith (1978) (See: Bradle', Allard and Epstein, 1982). In many ways, this change in course pressed the courts even deeper into the fabric of the mental disabilities system as those seeking reform sought to redress structural rather than discrete wrongs. This point is borne out in the following assertion by David Ferleger (1979), lawyer for the original plaintiffs in the Pennhurst case:
Judicial outrage at the abysmal life of people in particular institutions has caused courts to mandate reform under whatever theory was expeditious in the circumstances. A weak patchwork suitable for only short-term use has been the product. Pennhurst provides a basis for a stronger and more coherent doctrine. The right to habilitation merges in Pennhurst with the constitutional principle of the "least restrictive alternative." This new approach, if combined with emphasis on the constitutional rights to freedom from harm and nondiscriminatory habilitation, makes possible a direct attack on the very concept of institutionalization as a method of providing services to retarded people. (pp. 732-733)
Impact of Increasing Complexity
However, as remedies began requiring affirmative system restructuring rather than merely barring wrongdoing, proponents of broad based litigation began to encounter what Rosenberg and Friedman (1979) referred to as the "dissolution of expert consensus" (p. 823). Ironically, one of the first places this dissolution occurred was in the rehearings surrounding the Wyatt case now referred to as Wyatt II. In the second round of this landmark case, experts testifying for the defendants argued that severely and profoundly mentally retarded persons living at the state institution, Partlow, should be maintained in a so-called "enriched" environment without active habilitation and training. The assertion of the defendants' experts that class members remaining at Partlow could not benefit from active habilitation was at odds with the testimony of plaintiffs' witnesses in Wyatt and other cases, and signalled the beginning of a sometimes vitriolic professional debate in federal courtrooms around the country.
As the issues addressed in this "second generation" of cases became more complex, the problems of accountability and implementation also became more multifarious. As long as the problem to be ameliorated was limited to an institutional setting, then accountability for implementation was relatively easy to affix. However, when the objective extended to the creation of an alternative community system, accountability became much more diffuse, and those named as defendants were not always the only actors whose support was necessary to ensure compliance. For instance, federal judges have been extremely reluctant to hold representatives of the legislative branch of state government accountable for the implementation of decrees even though such support is crucial to the provision of financing for resource development.
Another group whose cooperation is crucial to compliance is the federal government. Cooperation in this context means funding as well as policy support. As noted by one observer in the late 1970s:
Whether states are responding to court orders or to some other impetus for reform, a major constraint to comprehensive planning is conflicting policy among the variety of federal social and health programs. To date, no one federal program is directly relevant to deinstitutionalization, yet many have some bearing on mentally disabled persons living in the community or in institutions. (Bradley, 1978, p. 70)
Even within the executive branch of state government, named defendants have not always been able to get the cooperation of other state officials not named in the lawsuit including representatives of Medicaid, welfare, housing, and social services programs. Without access to the resources controlled by these other agencies, some defendants have maintained that their ability to carry out court mandates is constrained. To summarize, the further the lawsuit ranges from the concept of a specific wrong and a specific malefactor, the more difficult it is to design remedies that encompass the full range of actions and actors needed to secure system reform.
Varying Expectations
In the mental disabilities field at large, then, claims made by critics about the detrimental impact of public law litigation can be categorized as follows:
-
Inequities -- Class action litigation creates a special class of individuals whose problems are artificially elevated above those of others similarly situated, and diverts resources from general system needs to those of one favored group.
-
Usurpation of bureaucratic prerogatives -- Litigation places significant paperwork burdens on defendants and takes away time from other responsibilities and obligations.
-
Misplaced accountability -- Broad-based litigation does not always single out those public officials whose commitment to compliance is most crucial to success.
-
Negative impact on clients -- The so-called "second generation" cases that have concentrated on deinstitutionalization may be forcing the inappropriate placement of profoundly disabled persons into inadequately prepared community living arrangements.
-
Reduction of community consensus-- The forced choices precipitated by litigation (e.g., to close institutions, to expand the number of small community living arrangements, etc.) tend to coalesce opposition among otherwise unorganized interests including various groups such as pro-institutional parents, unionized employees, unconvinced legislators, and cautious professionals.
The assertions made by those who are skeptical of litigation clearly run counter to the expectations of plaintiffs and their representatives. The assumptions made by those bringing lawsuits over the past several years can be paraphrased as follows:
-
Gains beyond the class -- The reforms mandated by federal courts are not just limited to the specified class, but have a catalytic effect on the system at large.
-
Cure for bureaucratic paralysis -- Judicial intervention is necessitated in many instances by financial, political, or other factors that constrain public officials from carrying out broad scale reform.
-
Remedies for past wrongs -- Litigation rectifies abuses suffered by class members by improving and altering the service context in which the class members reside and learn.
-
Improvement in class member outcomes -- Recent remedies in public law litigation place a priority on care in the least restrictive environment which -- in combination with intensive habilitation techniques -- results in improved learning and adaptation.
-
Protection of client rights -- Litigation establishes compliance oversight procedures and structures that protect the constitutional and statutory rights of class members.
These general claims and assumptions about litigation have currency in the Pennhurst context with some modification. A concern about possible inequities in the system has certainly been voiced by individuals throughout the system. The assertion that the litigation has forced an artificial infusion of funding into the Southeast Region of the state at the expense of the other three regions has been made by numerous key informants. Further, some informants within the Southeast Region have speculated that resources coming into the area have gone primarily to class members and that non-class members are now waiting in line for services.
Since the creation of the Office of the Special Master in 1978, the state and county defendants have complained that the court has created a shadow bureaucracy and has invaded policy areas previously reserved to the state. Specifically, some state and county interviewees have pointed to the individual habilitation plan guidelines, the Pennhurst compliance procedures, the Hearing Master process, and individual client monitoring activities as examples of the court's interference with state regulatory and policy-making authority.
The plaintiffs in Pennhurst, in an attempt to ensure that all of those officials who were needed to carry out the remedy were named in lawsuit, included the county representatives from the Southeast Region as defendants as well as regional and state mental retardation officials. However, as implementation of the decree proceeded, it became clear that the cooperation of a variety of other entities not named in the decree was crucial to the defendants' plans. Ironically, one of the most critical and sometimes reluctant actors has been the federal government -- ironic because the United States Department of Justice was an intervenor on the plaintiff's side of the litigation. Cooperation by federal Health Care Financing Administration (HCFA) officials was sought both to secure approval of plans for the development of small intermediate care facilities and the staters community services waiver under Title XIX. In both cases, HCFA officials raised questions about implementation of the two initiatives.
Also, within the state's own Department of Public Welfare, the policies of the Office of Medical Assistance have not always been completely consistent with the aims of the Office of Mental Retardation. For instance, the rates set by the Office of Medical Assistance for the nascent ICF/MR system were lower than OMR staff anticipated and ultimately compromised the development activity because of a lack of confidence among providers. Thus, even though the Secretary of Public Welfare was a defendant, the the Deputy Secretary of Medical Assistance was not and therefore appears to have felt free to follow his own organizational imperatives rather than those of the court.
Critics of the litigation in Pennsylvania tend not, as a rule, to denigrate the notion of least restrictive care or to question the benefits of community-based care for class members. There are exceptions, however -- notably representatives of the Pennhurst Parent-Staff Association who have expressed serious concerns about the viability of community living arrangements and the level of supervision and oversight that class members are likely to receive in these small group settings. This view is also shared by a minority of county and provider interviewees.
Finally, many of those interviewed have expressed concern about the extent of polarization that has presumably been provoked by the presence of the litigation. This polarization, or backlash against deinstitutionalization has been noted among parents of retarded persons in the state, members of the state legislature, and representatives of state employee unions. The assumption is that the plaintiffs, because of their uncompromising stand on the phase down of Pennhurst State Center, have charged the political environment and invited a negative response from a variety of groups that otherwise would have remained unorganized or at least at bay had the litigation not been brought. The weight of this argument, however, is somewhat diluted by the fact that the state defendants themselves closed one institution and the mental retardation units at two other facilities.
There are also claims about the impact of the litigation that are peculiar to the Pennhurst case. Specifically, critics assert that services for class members have been much more expensive than those for non-class members. Further, some observers have noted that during the initial phases of implementation of the decree, Pennhurst Center was the major beneficiary of the litigation, not community services. Finally, key informants on the state level have noted that the presence of the litigation and its focus on Pennhurst has retarded deinstitutionalization at other facilities around the state.
In the plaintiffs view, the litigation has not taken funding away from other non-class members, but in fact has enriched the system in general. They also argue that the complexity of procedures in the decree was necessitated by the defendants' inability to reduce significantly the population at Pennhurst. They further note that the defendants should have anticipated the problems encountered with HCFA and their own internal approval and review processes. With respect to the impact on clients, the plaintiffs have always maintained that community living arrangements have the proven capability to facilitate the growth and development of class members. Finally, with respect to the issue of polarization, the plaintiffs respond that the defendants' unwillingness to enter into a consent agreement was clear encouragement to the opposition.
Areas of Potential Impact
The purpose of this assessment is to first organize the general and particular claims that have been made about the impact of the Pennhurst litigation into a set of analysis questions, and second to look for answers to these questions in data collected through key informant interviews, document reviews, cost analyses, and in the quantitative studies conducted by the Temple University Developmental Disabilities Center.
Based on the preceding discussion of the influence of the Pennhurst case as viewed by the various parties to the lawsuit, eleven questions have been developed which will guide this section. The questions are organized into six general areas of inquiry: What Has Happened to Clients? What Has Happened to Funding? What Has Happened to Costs? What Has Happened to the Service System? What Has Happened to Pennhurst? and, What Has Happened to State Policy?
What Has Happened to Clients?
Have class members placed out of Pennhurst as a result of the decree fared better in small group settings than they fared at the institution?
What Has Happened to Funding?
Has the concentration of resources on Pennhurst class members come at the expense of funding for programs in other areas of the state?
Has litigation influenced the state's utilization of alternative funding sources, most specifically Title XIX?
What Has Happened to Costs?
Is caring for Pennhurst class members in the community more expensive than caring for other class members? more expensive than the cost of care at Pennhurst State Center?
What Has Happened to the Service System?
Has the movement of class members out of Pennhurst constrained more balanced deinstitutionalization across the state?
Has the decree hastened the expansion of community living arrangements in the Southeast Region of Pennsylvania compared to other areas of the state?
Has the concentration of resources on Pennhurst class members increased waiting lists for community living arrangements around the state? increased waiting lists of non-class members in the Southeast Region?
Has the litigation affected the general pattern of resource allocation in the state?
Has the Pennhurst litigation over extended the capacity of community services providers?
What Has Happened at Pennhurst?
Because of the court's scrutiny, are the resources devoted to Pennhurst State Center greater per resident than in other centers in the state?
What Has Happened to State Policy?
Has the litigation resulted in changes in statewide policy in the area of mental retardation?
What Has Happened to Class Members?
Have class members placed out of Pennhurst as a result of the litigation fared better than they fared in the institution?
When Judge Broderick ordered community placement for all Pennhurst residents on March 17, 1978, there were 1,154 persons at the facility. At this time, there are 410 persons at Pennhurst. Of those placed in CLAs, approximately 460 have been placed in the Southeast Region and the remaining 170 were placed in elsewhere in the state. There are many ways of assessing what happened to class members. For instance, since the beginning of the study, 77 persons died at Pennhurst and 15 individuals died following placement in the community (these two groups may not be comparable since those placed initially were not necessarily those with the most complex physical disabilities). The facility deaths during this period are slightly less than the national public institutional norm of 15 deaths per 1,000 residents per year. With respect to the deaths in the community, only two persons died within six months of transfer out of the institution which suggests a minimum trauma associated with the move to a new residence. Two of the deaths in the community were the result of accidents (one class member was struck by a car, another by a train), while one of the institutional deaths involved a resident who was hit by a car on the grounds of the facility. The remaining deaths at both sites were the result of illness.
The Temple University quantitative studies provide numerous ways of assessing the well-being of class members including information derived from class members themselves, from family members, from trained observers, from periodic monitoring and from surveys of client functioning as measured on objective behavioral scales. From the client's perspective, Temple has collected data on the level of satisfaction with service surroundings from 56 individuals who resided at Pennhurst when the study began. This group should not be considered representative of all class members since the respondents had to be capable of some form of responsive expression. Of the 56, approximately 30 persons have subsequently been placed in community living arrangements. The initial satisfaction inquiry showed that the 56 Pennhurst residents were happy in their surroundings at the institution. Subsequent interviews with those placed in the community showed that they were even happier in their new homes.
The perceptions of families regarding the well-being of their relatives have been particularly interesting and are documented in Temple's surveys of Pennhurst parents. Initial family responses were collected from 472 family members (or 75% of those surveyed) through a mailed questionnaire to families of residents at Pennhurst in June 1980. The most striking result of this first round was the negative attitude of the majority of families toward deinstitutionalization and specifically, the movement of their own relative from Pennhurst State Center. Many families evidently believed that the institution represented the least restrictive environment possible for their relatives. About 75% of the families felt that their relatives had no further potential for educational or psychological development. Family members were also very concerned about the medical needs of their relatives. The majority of families appeared to perceive the institution as a haven of security and permanence. Conversely, there was concern that funding for community alternatives was not secure and permanent.
Six month follow-ups were conducted by telephone with the families of 134 class members who moved to CLAs between mid-1980 and late 1983. The 134 families, while very satisfied with Pennhurst, were considerably more satisfied with community living arrangements. Further, only five families, post-relocation, strongly disagreed with the community placement, and 82% agreed strongly or somewhat strongly. Over 80% of families perceive a change for the better in their relatives' general happiness (another 15% reported no change). Thus, although these 134 relatives were initially unsure or negative about community living arrangements, their responses to the survey showed clearly that they came to view community living as beneficial to their family member once the placement was made.
Two significant attitudes that also changed, but to a much smaller extent than satisfaction and happiness, were those associated with potential for growth and feeling of permanence. First, these families continued for the most part to believe that the retarded person had little or no capacity to grow and change. Second, families reduced only very slightly their anxiety about the security and stability of community living arrangements. Though the results show some lessening of concern, their fears are by no means eliminated.
Another way of viewing the well-being of clients is from the qualitative material gained through the Temple case studies. Twenty clients were observed through this process. According to the Temple researchers, with the exception of one client, the other 19 persons appear to be doing well. These cases, which were selected primarily from among Pennhurst residents who later moved to the community, have been observed at regular intervals since soon after the study began. Interestingly, the one individual whose situation is not entirely satisfactory is not a class member, but someone who was released from Pennhurst in 1974 -- four years before the Judge's order and without the same case management and monitoring oversight mandated in the decree for the Pennhurst class.
Another source of information about client well-being is the client monitoring procedure mandated by the court and currently being carried out by the Special Management Unit and Temple University. Interviews with Special Management Unit staff, Temple researchers and also with the Hearing Master (who observes some of the more dramatic problems encountered by class members because of his unique position in the system) suggest that the movement of Pennhurst residents has not happened without incident. A few individuals have had problems securing medical care, some have strayed into mental hospitals, and a limited number have been forced to change their living arrangement because of inadequate program resources or other contract or financial problems within the community agency.
The consensus among those interviewed is that individual class member problems have tended to involve either persons not covered by the case management and monitoring requirements (e.g., individuals moved out of Pennhurst before the decree and/or who surfaced because of a change in residential status), class members whose service provider was either inappropriate or incapable for financial or other reasons to provide an adequate level of care, or persons moved out-of-region. However, in spite of the problems that have arisen, most of those canvassed including staff from counties outside the region, would agree that class members as a group are doing well.
The final basis for assessing class member well-being is through the client tracking and behavioral assessment activities carried out by Temple researchers. Collection of information about client learning and behavior began in 1978 when a modified version of the American Association on Mental Deficiency Adaptive Behavior Scale -- the Behavior Development Survey (BDS) -- was administered to residents at Pennhurst. Though the study was not operational in 1978, this information was collected by Temple at the request of the Office of the Special Master. In 1980, the same data were collected on the first 70 individuals who moved out of Pennhurst into the community and on 713 Pennhurst residents whose county of origin was in the Southeast Region. The results showed that persons who remained at Pennhurst gained an average of 1.24 points in adaptive behavior and made negligible gains in reducing maladaptive behavior. The 70 community-based class members, during the same period of time, had gained an average of 8.2 points in adaptive behavior, but showed no change in maladaptive behavior.
By 1982, Temple was able to collect BDS data on 157 former residents of Pennhurst. Between the 1978 baseline assessment and the data point in 1982, class members gained an average of 9.2 points in adaptive behavior and negligible amounts in maladaptive behavior. In 1984, the community cohort had grown to almost 400 and the assessments that year showed an average gain of 11.5 points in adaptive behavior over 1978 and a 0.5 point gain in maladaptive behavior. Persons who remained at Pennhurst were assessed in 1980 and again in 1983. During this time, those for whom 1978 baseline data were available gained an average of 1.08 in adaptive behavior and .87 in maladaptive behavior.
In order to determine how Pennhurst class members were doing relative to other retarded persons living in the community, BDS data was gathered at two points in time -- 1981 and 1982 for class members and non class members in the CLAs of Philadelphia. A matched comparison of behavioral changes in the two groups was conducted. The class members improved significantly in adaptive behavior while living in the CLAs in 1981-1982 (gain of 4.0 points), while non class members did not gain significantly; class members did not change in maladaptive behavior, but non class members regressed somewhat (losing 1.0 points). Class members also received a total of about 10% more hours of developmentally oriented service per month than matched non class members (224 hours versus 204 hours per month). This analysis suggests that, once they are in CLAs, class members continue to develop behaviorally, and their progress (and services rendered to them) exceeds that of otherwise very similar non class members.
The picture that emerges from these various perspectives indicates that for most of those individuals who came out of Pennhurst since the court order and who are living in the Southeast Region, the litigation has improved their life chances and increased their capacities to deal with their environment and their needs. For individuals who were moved to other regions, the picture is also positive and in some instances better. PASS scores for instance were higher for class member residences out-of-region than in region (98 vs. 61). The physical quality of the residences was also rated higher (61 vs. 57). The class member scores for maladaptive and adaptive behavior were virtually the same in 1984. With respect to growth since 1977-1978, class members in the Southeast Region did slightly better (12.3 points compared to 8.4), but the out-of-region clients started out the period with slightly higher adaptive behavior scores.
Some anecdotal information and material presented to the Hearing Master suggests, however, that some problems have arisen in out-of-region placements -- particularly with respect to medical care and entanglements with the mental health system. Other anecdotal information gained from several individuals interviewed by phone in the other three state regions, volunteered very positive observations about the adjustment of class members placed out of the Southeast Region.
Since there are still 410 individuals remaining at Pennhurst, an obvious question is whether their characteristics are sufficiently similar to those who have left to ensure like outcomes. The information available on those who remain at Pennhurst suggests that they are somewhat more disabled as a group than the original 1154 that formed that study population in 1978. Of the initial cohort at Pennhurst, 4% were mildly retarded, 10% moderately retarded, 30% severely retarded, and 56% profoundly retarded. At the last data point, in the Summer of 1983, 5% were mildly retarded, 5% were moderately retarded, 21% severely retarded, and 69% in the profound range. With respect to individuals with severe behavioral and medical problems there does not appear to be a higher proportion of such persons left at Pennhurst compared to the relative numbers residing in the community.
Interestingly, 10% of those remaining at Pennhurst State Center are still in the mild and moderate range. According to those interviewed at Pennhurst, some of these individuals are reluctant to leave Pennhurst since they consider Pennhurst their home.
It does appear, based on the general information on level of disability, that those left at Pennhurst are somewhat more disabled and that some “creaming" has gone on in the placement process. However, it should be kept in mind that 80% of those placed out so far have severe and profound disabilities. Given this fact, it is difficult to imagine that these last 410 individuals will, as a group, have radically different careers when they are moved into the community, assuming that the same level of financial and programmatic support is available.
What Has Happened to Funding?
Has the concentration of resources on Pennhurst class members come at the expense of funding for programs in other areas of the state where resources have not expanded at the same rate?
Many of those interviewed both within the Southeast Region of the state and in the rest of the state are convinced that the litigation has diverted scarce resources to class members coming out of Pennhurst at the expense of community-based clients and individuals ready to leave the state's other institutions. One way of assessing whether or not these concerns are legitimate is to examine changes in the state's allocation for community mental retardation services among the four regions of the state. Exhibit 10-1 shows the changes in the amount of money the state allocated to the four regions between fiscal year 1980-1981 and 1983-84. Amounts are calculated based on funding per capita in the region.
This chart clearly shows that the amount of money allocated to the Southeast Region during the three years for which data were available grew at a much faster rate than the allocations to the other three regions. Specifically, funding per capita in the Southeast Region adjusted for inflation) grew 33% compared to 19% in the Northeast Region, 83% in the Central Region and 6% in the Western Region of the state.
EXHIBIT 10-1. Per Capita Allocation of State Funds for Community Services by Region
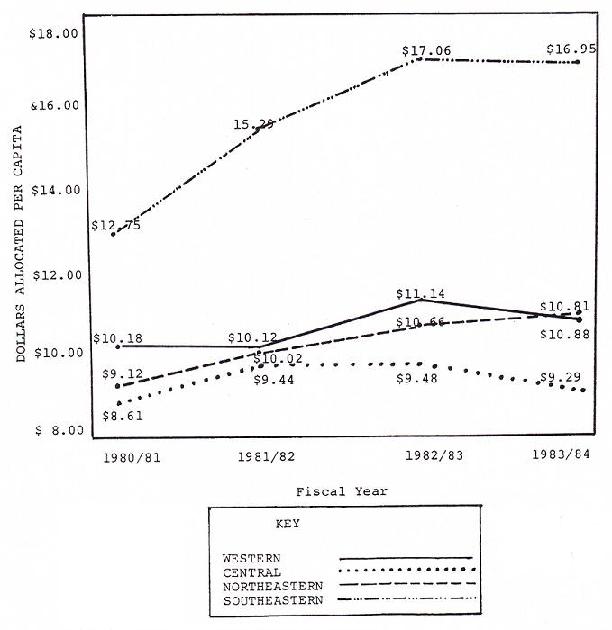
SOURCE: Office of Mental Retardation, Department of Public Welfare, Harrisburg, PA.
Another way of viewing the same phenomenon is to chart the growth in the amount of money allocated per mentally retarded person served in each region. Exhibit 10-2 plots these changes. The chart shows that greatest change in the amount of funding expended per client served occurred in the Western Region where the per client figure grew by 27%. This is in contrast to a 5% increase in the Southeast Region and only 1% in the Central Region, and a 5% decrease in the Northeast Region.
Unfortunately, the Department of Public Welfare did not keep records on funds allocated solely for mental retardation services prior to 1980-1981. In the years preceding, DPW figures include support for mental health as well as mental retardation services. Thus it is only possible to speculate on the impact of the litigation on funding trends before and immediately after the court order in 1978. While the implementation of deinstitutionalization at Pennhurst may have been a stimulus for the increase in the fortunes of the Southeast Region, such increases may also have been part of trends that had their beginning prior to the Judge's decree.
Further, though the Southeast Region was first in the rate of growth in the mental retardation allocation per capita, the allocation per mentally retarded person in the region was a distant second. It should also be noted that the Southeast and Central Regions lost population (1% and 2% decreases respectively) during this period which may explain the high per capita allocation compared to the lower per client served ratio.
Another question is whether or not the overall state expenditure for mental retardation services -- including community as well as institutional programs -- also increased in the Southeast Region during this period of time. Unfortunately, we were unable to collect this information since the state does not assign institutional costs to regions based on actual utilization. However, given that the rate of institutionalization per 100,000 is substantially higher in the Western Region than it is the Southeast (and has been during the past three years), the overall allocation picture must be somewhat more balanced, at least between these two regions. This should be especially true given the fact that funds for the placement of individuals out of Pennhurst have in part been deducted from the Pennhurst budget.
EXHIBIT 10-2. Dollars Spent Per Year Per Mentally Retarded Person Served by Region
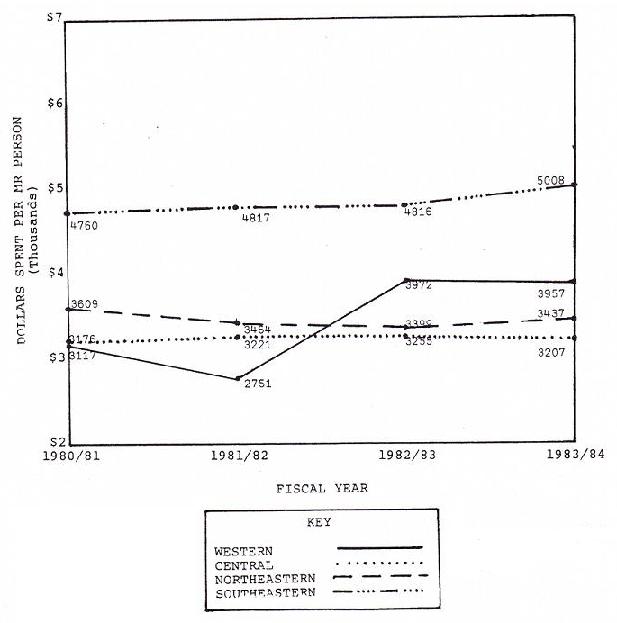
SOURCE: Office of Mental Retardation, Department of Public Welfare, Harrisburg, PA.
It is of course impossible to know whether the increases in the amounts of money allocated to the Southeast Region in fact came out of funding that would have gone to other regions in the state. For one thing, as noted above, some of the funding available for the support of Pennhurst class members in the community has come out of the Pennhurst budget. Further, the period during which implementation of the decree took place was one of financial austerity in the state and a time therefore when expansion of services was no longer the norm. The extent to which the Southeast Region received more than its "share" during this period will be further explored in the section on changes in the system.
Has the litigation influenced the state's utilization of alternative funding sources, most specifically Title XIX?
The major source of federal income that had not been tapped for the development of community resources prior to the Judge's order was Medicaid funding for intermediate care facilities for mentally retarded persons (ICF/MRs). Pennsylvania was not one of the states, like Minnesota, that took advantage of Title XIX funding to refinance and expand community residential arrangements during the 1970s. In fact, the community services system in the state is supported 85.8% by state funds compared to the institutional system which receives only 55.3% of its support from the state (See Exhibit 10-3).
According to those interviewed early in the project, state mental retardation staff were concerned that the ICF/MR model was too medically oriented and that it artificially constrained the operation of small group living arrangements with unnecessary regulations. In addition, state medical assistance officials were concerned about the impact of a community ICF/MR initiative on the overall Medicaid budget even though the infusion of federal funds would conceivably offset state mental retardation funds for community living arrangements.
The plaintiffs argued on numerous occasions that use of the ICF/MR program -- especially for small group living arrangements -- would increase the general pool of funding available to implement the court decree. In April 1980, The Department of Public Welfare submitted a plan requesting an extension of the July 1982 deadline for compliance with ICF/MR life safety and other requirements in the state's institutions. As part of their proposal to bring existing state centers into compliance, the Department presented an overview of a proposed "15 beds or less" program. Regional HCFA staff stated that the proposal lacked detail and cited numerous issues that had to be resolved. Negotiations between the Department and HCFA carried on into 1981 when the state was finally given to understand that their proposals for small ICF/MRs would not encounter any further objections.
EXHIBIT 10-3. Pennsylvania -- Eight Year Total MR/DD Expenditures by Revenue Source: FY 1977-1984
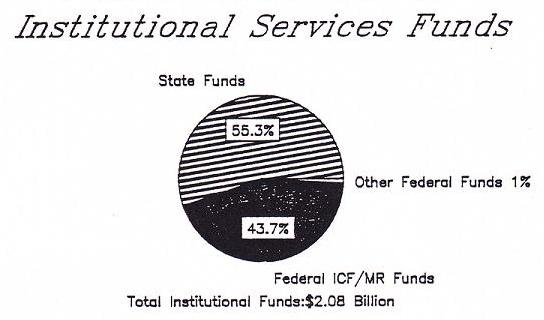
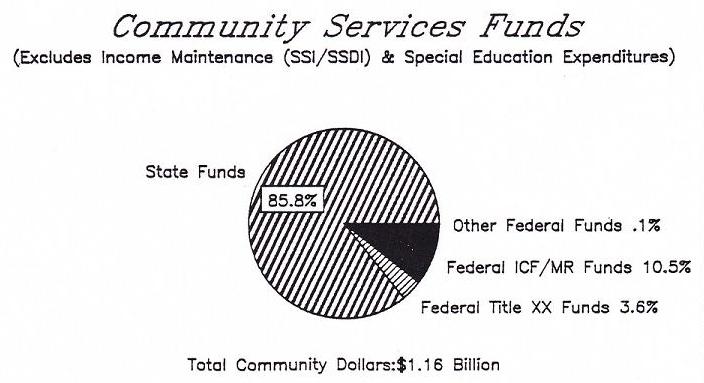
SOURCE: Braddock, Howes, & Hemp, Expenditure Analysis Project, ISDD, U of IL at Chicago, 1984.
The Office of Mental Retardation developed a strategy for ICF/MR development that was primarily focused on the conversion of existing community residences -- specifically, CLAs over three beds and some private licensed facilities (PLFs) over 15 and under 15 beds. Funding generated from the conversions was then to be reinvested in expanded services. Agreements were worked out with the Department of Health regarding surveys and certification and discussions were begun with the Office of Medical Assistance regarding rates of reimbursement.
It was also anticipated that some new ICF/MRs would be developed. New facilities, however, would be limited to under 16 beds and no new construction was allowed. The restriction on new construction meant that the development of ICF/MRs for physically handicapped, non-ambulatory clients would be extremely difficult since most existing structures would not meet Chapter 10 life safety requirements. In order to explain the new program to potential and current providers, the Office of Mental Retardation held workshops around the state and generated a fair amount of cautious interest.
The development of small ICF/MRs began to run into problems in 1982 when it became known that a reimbursement cap of $100 was being proposed by the Office of Medical Assistance. Several providers were convinced that the level of reimbursement was insufficient to cover the costs of care and began to have second thoughts about moving into the ICF/MR program. They pointed to the fact that this rate was less than the average costs for CLAs in the region. Additionally, zoning battles in the Philadelphia area all but halted the development of ICF/MRs in that county.
Though the level of reimbursement was eventually adjusted and the rate determination responsibility transferred to the Office of Mental Retardation in 1983, the momentum for the program definitely subsided. Further, the state placed a limit on the number of small ICF/MR beds at 500. By 1983-1984, the following ICF/MR beds had been certified in the community:
| 16 or more | 15 or less | Total | |
|---|---|---|---|
| Western | 754 | 78 | 832 |
| Northeast | 247 | 34 | 281 |
| Southeast | 361 | 113 | 474 |
| Central | 111 | 126 | 237 |
| 1,473 | 351 | 1,824 |
The above table showing the status of ICF/MR development indicates that the growth of small facilities did not even reach the 500 bed cutoff and that the largest impact was on the conversion of larger private licensed facilities. Though the Southeast Region does have 113 certified small ICF/MR beds and 361 larger facility beds, it is still a distant second to the Western Region. This is in part explained by the fact that in Philadelphia, the largest area in the Southeast Region, no small ICF/MRs were developed.
Given what we know about the limited community ICF/MR program in the state, it does not seem to have been significantly influenced by the litigation but rather by more general fiscal concerns and the necessity to "run down" the census at state facilities. It may be that the initial impetus came in part from court pressure, but the conduct of the program seemed to have only a passing connection with the implementation of the Judge's placement orders in the Southeast Region.
The presence of the litigation may, however, have played a more significant role in the state's posture vis-a-vis utilization of the Medicaid community services waiver. Until the end of 1982, the state's plans for the waiver only included pilot activities in Allegheny and Philadelphia Counties. However, in January 1983, Judge Broderick issued a second "implementation order" mandating the provision of community living arrangements for 143 residents of Pennhurst, 81 other members of the plaintiff class residing in the Southeast Region, and 50 Pennhurst residents from outside the Southeast Region by the end of June 1984.
In response to the Judge's order, the Commonwealth submitted a plan for placements over the next year and a half. The plan noted that the state was considering a Title XIX community services waiver application from Delaware County in addition to the one already prepared for Philadelphia. The plan also noted that the Commonwealth defendants were "seriously considering" applications for waivers in the remaining three counties. Following submission of the plan, the suburban counties were notified that they had eight weeks to prepare the requisite fiscal information in order to allow for submission of the full waiver application by the end of June 1983. Meeting the deadline was important in order to ensure retroactive payments for the period prior to the end of the fiscal year.
Funds for the Title XIX services proposed under the waiver are scheduled to come in large part from savings at Pennhurst Center as a result of the decrease in population projected for the ensuing three years. Some additional state money would be required to cover services not eligible for waiver reimbursement such as household furnishings and other non-service costs. In some counties, the amount of money saved by moving one client would in turn generate funds to cover the costs of community based clients who are also included in both the waiver applications and the Judge's January 14, 1983, Order.
Most of those contacted during the latest round of key informant interviews agreed that the move by the Department of Public Welfare to take advantage of the waiver was in large part because of the pressure for placements under the Judge's order. A change in the leadership of the Department -- and a shift in attitude regarding the use of federal Medicaid funding -- early in 1983 is also credited with influencing the decision to pursue a broader waiver proposal.
Unfortunately for Pennsylvania, the pressure created by the litigation appears to carry very little weight with the Health Care Financing Administration which has still not approved the bulk of the waiver applications for the Southeast Region (Philadelphia was approved last May). Initially, two issues are in contention: 1) the Medicaid cost savings that would result from the phase down of beds at Pennhurst and the expansion of beds in the community are not sufficient (i.e., HCFA maintains that the community costs must be 80% of the institutional costs); and 2) the inclusion of additional community class members is not acceptable.
More recently, HCFA has justified its prolonged deliberations regarding approval of the suburban county waivers on deficiencies found in the federal review of the implementation of the waiver in Philadelphia. The most significant problem appears to be the so-called "beneficiary of choice" issue which requires that each potential recipient of waiver services be given the option of rejecting the proposed placement. Since Pennhurst class members do not have the option of remaining at the institution indefinitely, operationalizing this federal requirement has been difficult for the state. HCFA staff, according to state informants, do not consider the court order to be a legitimate constraint. This also holds true in other areas where the conflict between the federal court requirements and HCFA regulations resulted in a finding of deficiency (e.g, federal plan of care requirements versus transitional habilitation plan requirements). In fact, HCFA has requested that the state take any reference to court-ordered procedures out of the guidelines for the waiver program. Numerous negotiating sessions between the state and HCFA officials have not as yet resulted in a resolution of any of these issues.
Thus, though one can argue that the litigation has had an impact on the state's utilization of alternative funding mechanisms, the ability of the state to carry out its initiatives has arguably been constrained by another actor technically outside of the litigation -- the federal government. Problems in ensuring accountability among multiple actors for the implementation of complex decrees were noted earlier.
What Has Happened to Costs?
Is caring for Pennhurst class members in the community more expensive than caring for non-class members? Is it more expensive than the cost of care at Pennhurst State Center?
Since the Longitudinal Study began, key informants interviewed both at the local and state level have maintained that the cost of community care for class members is substantially inflated over the cost of caring for non-class members. The reasons cited include the counties' weakened bargaining position with providers in contract negotiations because of the court pressure for placement. From the provider's side, the reason for increased budget requests is their concern about the level of disability of those coming out of Pennhurst and the need to build all conceivable contingencies into their proposed budgets.
HSRI's cost analysis shows that the relative cost of services provided under the court order compared to the cost of services to non-class members elsewhere in the Southeast Region is on the average higher. It is also clear that the cost of CLAs in the Southeast Region is generally much higher than the cost in other regions. Exhibit 10-4A shows the per them cost by region (in adjusted and unadjusted dollars) and the growth in costs over the past four years. As the graphs indicate, the per them cost of CLAs in the Southeast Region, $69.76, is substantially higher than per diems in the other three regions which all cluster around $40. Growth in the unadjusted per them cost of CLAs in the Southeast Region during the years covered approached 35% which was matched only by a growth rate of 17% in the Northeast Region.
The comparisons become more interesting when you chart changes using constant dollars. As Exhibit 10-4B shows, in the four years in question, the per them rate actually went down statewide by 5%, while the rate in the Southeast Region went up by 8%. The substantial difference may be explained by both the level of disability of persons served in CLAs in the Southeast Region as well as by the cost of living in that part of the state.
EXHIBIT 10-4A. CLA Cost Per Diem by Region: 1979 through 1983 in Unadjusted Dollars
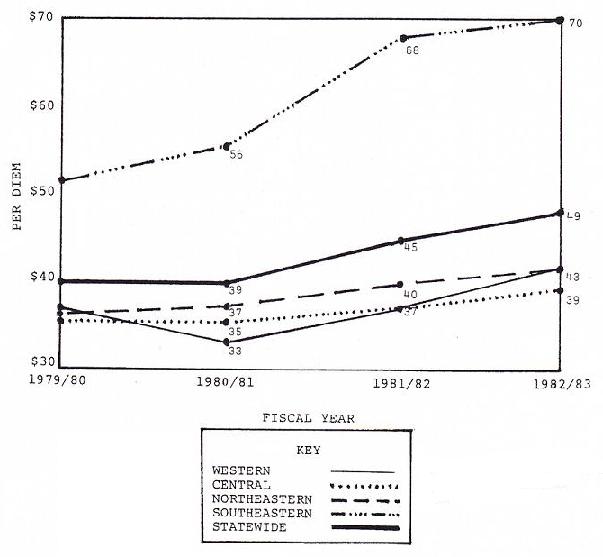
SOURCE: Office of Mental Retardation, Department of Public Welfare, Harrisburg, PA.
EXHIBIT 10-4B. CLA Cost Per Diem by Region: 1979 through 1983 in FY ’80 Dollars
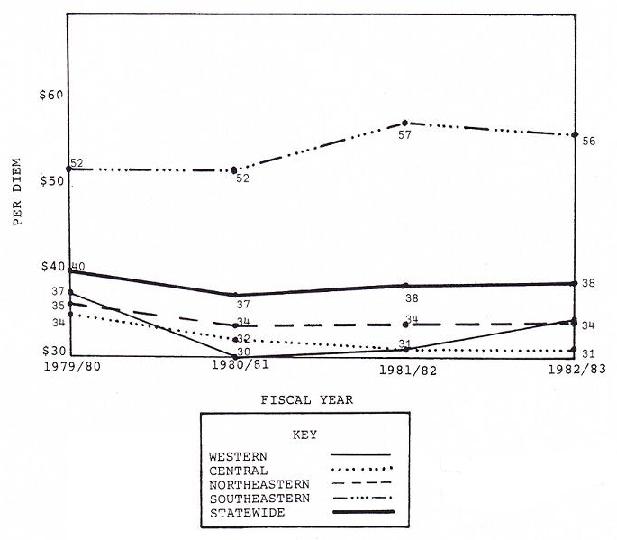
SOURCE: Office of Mental Retardation, Department of Public Welfare, Harrisburg, PA.
With respect to cost comparisons, the cost of caring for Pennhurst class .members, based on 1981-1982 figures, is higher in Pennhurst State Center than it is in the community. Further, the level of service provided for each dollar spent is higher in the community than the level of service provided in Pennhurst. These figures are based on an assessment of virtually all relevant service costs including room and board, administration, medical care, specialized services (i.e., occupational therapy, speech and hearing, and behavioral services), and case management.
The contention among key informants that implementation of community placements for Pennhurst class members has created a class of community services that is more expensive than the norm for such services in the Southeast Region is undoubtedly true. It is also clear, however, that the care of class members in the community is less costly than at Pennhurst.
What Has Happened to the Service System?
Has the movement of class members out of Pennhurst constrained more balanced deinstitutionalization across the state?
Another contention made by several key informants -- especially those at the state level -- is that concentration on Pennhurst has constrained deinstitutionalization in other parts of the state and meant that many higher functioning clients remain in institutions in favor of the more disabled Pennhurst class members. There are several ways of approaching this question. First, Exhibit 10-5 shows the changes in the resident populations of state centers and mental retardation units from 1977-1978 to the present. The Table shows that the overall reduction in institutional population roughly between the time that the Judge issued his initial decree and the present time was approximately 33%, and the median reduction was 15.5%. However, during this period, the state closed Marcy Center (238 persons) , the Mental Retardation Unit at Harrisburg State Hospital (65 persons), and Cresson Center (120 persons). During this same period, Pennhurst Center reduced its census by 775 or by 54%. Interestingly, Polk State Center in the Western Region, a facility often paired with Pennhurst State Center because of its age and size, declined by 42% or by 847 persons -- 72 more than the reduction at Pennhurst.
| Facility | 1977/78 | 1983/84 | % Change |
|---|---|---|---|
| SOURCE: Office of Mental Retardation, Department of Public Welfare, Harrisburg, PA. * These people were integrated into the general population at the Philadelphia State Hospital or other State Hospitals. | |||
| Allentown MR Unit | 37 | 41 | +11% |
| Clark Summit MR Unit | 51 | 42 | -20% |
| Cresson Altoona | 367 | 135 | -63% |
| Ebensburg | 855 | 614 | -28% |
| Embreville | 302 | 298 | -1% |
| Hamburg | 703 | 433 | -38% |
| Harrisburg MR Unit | 65 | -- | -100% |
| Laurelton | 376 | 354 | -3% |
| Marcy | 238 | -- | -100% |
| Mayview MR Unit | 120 | 115 | -4% |
| Pennhurst | 1,367 | 632 | -54% |
| Polk | 2,001 | 1,154 | -42% |
| Selings Grove | 1,274 | 1,022 | -20% |
| Somerset MR Unit | 108 | 107 | -2% |
| Torrance MR Unit | 89 | 89 | No Change |
| Wernersville MR Unit | 47 | 45 | -4% |
| Western | 540 | 520 | -4% |
| White Haven | 816 | 544 | -33% |
| Wood Haven | 268 | 267 | -4% |
| Wood Haven Extension | 91* | 91 | No Change |
| TOTALS | 9,716 | 6,513 | MEAN = -25% MEDIAN = -12 |
Another way of viewing deinstitutionalization is to assess the decline in institutional population by region. Exhibit 10-6 shows the rates of institutional utilization among residents of the four regions in 1977-1978 and 1983-1984 compared to the rates of utilization of community-based CLAs. The greatest decline in institutional population during this period, 39%, was in the Northeast Region which went from 83 residents per 100,000 to 50 persons per 100,000. The second greatest decline was in the Western Region which went from 95 residents per 100,000 to 65 residents per 100,000 -- a 32% decrease. The Southeast Region was next with a decrease from 68 to 50 residents per 100,000, or 26%; and the Central Region showed the smallest decline with a reduction of 18% or 68 to 50 per 100,000.
These figures suggest that as of this writing, the state has pursued a more or less balanced approach to the reduction of state center beds in each region of the state. In fact the pattern in the last six years amounts to an equalization of rates of institutionalization among the regions. Specifically, the discrepancy of 30 residents per 100,000 between the highest and lowest region narrowed to 15 residents per 100,000 in the last fiscal year. On the other hand, a truly balanced policy would have concentrated even more resources on the Western Region given its higher residential population.
While it is obvious that the litigation affected the reduction of the population at Pennhurst, it is not clear that it significantly constrained deinstitutionalization elsewhere given the rates of decline in the other three regions. In fact the one place where deinstitutionalization may have been unevenly carried out is in the Southeast Region where the placement of individuals out of other institutions in the area was slowed because of the priority put on the placement of Pennhurst residents into the five county area.
EXHIBIT 10-6. Population in State Institutions and Number of CLA Beds Per 100,000 by Region -- 1977-1978 and 1983-1984
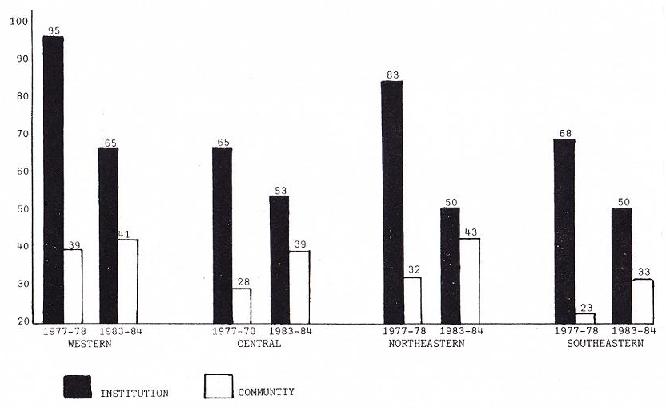
Other factors such as the need to reduce institutional populations in order to meet Medicaid compliance requirements and maintain federal reimbursement were also at play during this time period and figured in the planning for institutional reductions around the state. More recently, the state announced that it will close Pennhurst State Center in the next two years, an action that may very well place the Southeast Region significantly ahead of other regions in the pace of deinstitutionalization. More importantly, it may place even more constraints on placements of non-class members out of other institutions within the region.
Has the decree hastened the expansion of community living arrangements in the Southeast Region of Pennsylvania compared to other areas of the state?
One of the questions posed to all key informants during the last round of interviews was whether or not the decree hastened the development of community resources in the Southeast Region. The answer in almost all instances was a resounding yes. The data, however, show a less clear picture.
So far in the analysis, we have shown that the allocation of resources per capita to the Southeast Region clearly grew at a higher rate than allocations to other regions, and though the allocation per client served did not grow at the same rate, it was already significantly higher than in the other regions. It is also clear that the costs of providing community living arrangement services in the Southeast Region are the highest in the state. The remaining question is, did all of this money result is a significantly expanded system?
Exhibit 10-6 shows that the Southeast Region, in 1977-1978, had the lowest number of CLA beds per 100,000 population and still has the lowest number of beds. All three of the other regions started out the period with a higher bed ratio and finished the period with a higher ratio. It is true that the rate of increase during this period is greatest in the Southeast Region which experienced a 43% increase -- the Northeast was next with 36%, the Central Region grew 27%, and the Western Region only 5%.
Exhibit 10-7 provides a slightly different slant on the question by showing the growth in the absolute number of CLAs in each region over the six year time period. This chart shows that in actual numbers of CLA beds as well as in beds per capita, the Southeast Region is by no means the leader, but is a somewhat distant second to the Western Region.
The problem encountered in analyzing this proposition is that the Southeast Region started out the study period behind the other regions in CLA development and ended the period in a similar, although somewhat more favorable position. The 43% increase does outpace the other regions but is not that much ahead of the 36% gain in CLA beds per capita in the Northeast. Why is it then that so many interviewees noted the dramatic gains in the Southeast Region? One reason is that it feels as though resource development has speeded up in the region because of the amount of effort involved in implementing the court order including preparation of expanded IHPs, development of new case management mechanisms, preparation of plans to meet placement schedules, and all of the other details of compliance.
Another explanation is that the development of resources for more seriously disabled individuals with long histories of institutionalization has in fact speeded up over the previous pace. Data on the clients being served in the CLA system statewide prior to the court decree showed that persons with severe and profound disabilities were in the minority. Given the levels of disability among Pennhurst class members, the movement of 460 persons into the five county area clearly required a speed up in the development of a special class of resources -- residential and day habilitation services capable of meeting the multiple needs of this previously institutionalized population. Unfortunately the state was unable to provide data showing the trends in the level of disability of CLA residents over time in the four regions so we are not able objectively to verify that the Southeast Region is serving more disabled clients.
EXHIBIT 10-7. Number of CLA Beds by Region: 1977-1984
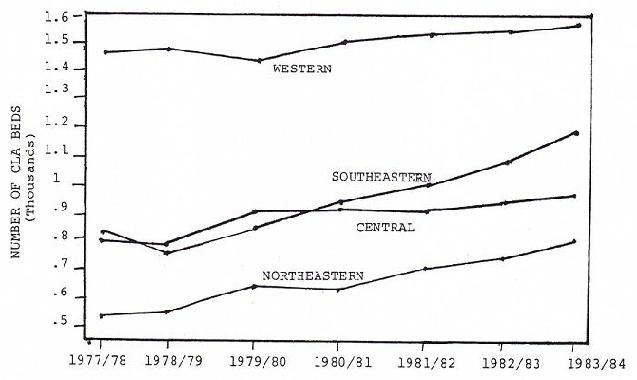
SOURCE: Office of Mental Retardation, Department of Public Welfare, Harrisburg, PA.
Has the concentration of resources on Pennhurst class members increased waiting lists for community living arrangements around the state? Has it increased waiting lists of non-class members in the Southeast Region?
As noted earlier, project staff canvassed all county mental retardation programs by phone to ascertain whether the presumed focus of resources on Pennhurst had limited the ability of county programs to meet the needs of non-class members for residential services. The measurement that we chose was waiting lists for CLAs in 1977-1978 and 1983-1984. The results are not entirely clear for a variety of reasons. First, many counties did not keep waiting lists as early as 1977-1978 since the CLA program was still quite new. Second, because the maintenance of a waiting list is not required by the state, the nature of the waiting list varies from county to county. For instance, some counties include persons in institutions on waiting lists for community placement and others do not. Some counties only include those individuals whose need for residential services constitutes an "emergency," whereas other counties include individuals whose need is likely to occur in the future.
Some of the information collected, however, is useful in providing general insights into the distribution of need around the state. For instance, anecdotal information provided by those canvassed suggests that counties vary widely in both their perception of need and their level of resources. Some counties stated that their waiting lists had declined over the period because of recent CLA development. Others noted that the waiting list had stabilized, but that those that were currently waiting for services were more disabled than six years ago. Others noted that their waiting lists were increasing and felt they would continue to increase into the foreseeable future.
Many of those contacted had experienced a period of virtually no growth in services especially during the past few years. These same individuals were most likely to blame the Pennhurst litigation for a part of their ills. Other respondents had experienced some growth in CLAs -- particularly those that benefited from the dispersal at Marcy Center in the Western Region. Still others noted that the growth in family resource services had reduced the demand for CLAs in their areas. Almost all of those contacted, however, seemed to agree that, the litigation to one side, persons moving out of institutions were receiving the lion's share of resources while those waiting for services in the community were losing out.
Waiting list information for the current period is somewhat more reliable than in earlier years since most counties have now routinized the process. Keeping in mind the differences in criteria for waiting list inclusion, the aggregate numbers still raise some interesting questions. The following chart shows the current waiting lists by county.
| Total # | # Per 100,000 | |
|---|---|---|
| Southeast Region | 3,038 | 82 |
| Northeast Region | 174 | 9 |
| Central Region | 695 | 27 |
| Western Region | 552 | 15 |
The magnitude of the figures for the Southeast Region is particularly startling given the fact that only four of the five counties are represented (Delaware did not provide any information). That the Northeast Region has the lowest waiting list is not too surprising since it has the highest number o CLA 8 per 100,000. Figures for the other two regions also make some intuitive sense because of their resource levels and growth patterns. But these same factors certainly can not explain the incredible discrepancy between the figures for the Southeast Region and the remainder of the state.
Aside from some possible quirk in demographics among the four regions (e.g., more aging families with retarded offspring in the Southeast Region, etc.), and the fact that the Southeast Region has the lowest number of CLA beds per 100,000, the magnitude of the waiting list in the Southeast Region by comparison to the rest of the state has likely been influenced by the litigation. The impact of the court-mandated placements, however, is more subtle than merely creating waiting list demand for CLA slots preempted by Pennhurst class members -- the number on the list is far too high. Even if you subtract all of the 460 people placed out of Pennhurst into the Southeast Region on the theory that all 460 of those slots would have gone to other disabled individuals, there are still more than 2,500 people waiting for services, more than 1800 more than the next closest region. What appears to have happened is that the litigation and the ongoing publicity surrounding the implementation of community living arrangements for class members has raised the expectations among many families regarding possible placement for their family member.
In order to validate this speculation, county personnel in the Southeast Region were recontacted and asked whether they could explain the volume of the waiting lists in their region compared to the other regions in the state. County respondents offered several possible factors that may be responsible for the disparity including the density of population, the lower number of CLA beds per capita, and the urban character of the area. All agreed, however, that the the litigation played a role in increasing demand because of the publicity surrounding the case and the increased visibility of community services. Further, because resources had been diverted to serve those coming out of Pennhurst, community clients who otherwise might have been served were now on the waiting list.
Has the litigation affected the general pattern of resource allocation in the state?
So far in the analysis, we have just been discussing two types of residential arrangements -- small community living arrangements (usually three persons or fewer), and state institutions. In Pennsylvania, there is another type of residential category called private licensed facility (PLF) which can range anywhere from nine beds to 600 beds. PLFs provide programming that is roughly similar to CLAs, but they are considered by some to be more institutional in character given the large size of some of the facilities. On the average, PLFs are less expensive than CLAs and also tend to serve more children. Though PLF& are not as heavily utilized as institutions or CLAs, they are none the less a key ingredient in the mental retardation and complete the picture of resource distribution among the regions.
Exhibit 10-8 shows the growth in the number of PLF beds by region over the past four years. This exhibit shows that the Southeast Region is a significantly heavier user of PLF beds than any other region and continued to be over the course of the four year period for which data are available. It also appears that the rate of growth in PLF beds in the Southeast Region was greater than in other regions -- a fact which could only be very indirectly related to the litigation since virtually no class members were moved into PLFs.
EXHIBIT 10-8. PLF Beds Per 100,000 for FY 1981-84
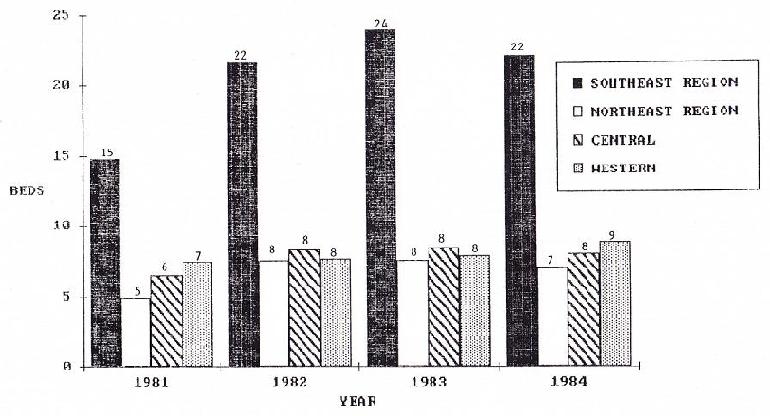
SOURCE: Office of Mental Retardation, Department of Public Welfare, Harrisburg, PA.
The wide discrepancy between the Southeast and the other three regions can in part be explained by the presence of the two largest PLFs in the state -- Elwyn Institute and the Wood School.
Exhibit 10-9 shows that complete picture of residential bed use among the four regions -- institutions, CLAs, and PLFs. Summing across type of residence, the number of beds per 100,000 by region is as follows:
| Region | Total Residential Beds Per 100,000 |
|---|---|
| Southeast | 105 |
| Northeast | 100 |
| Central | 100 |
| Western | 115 |
Thus, in terms of total resources, the Southeast Region is second to the Western Region. The picture that emerges of the Southeast Region is relatively low institution use, very high PLF use, and moderate CLA use. Without the litigation, this picture would have been even more heavily skewed toward dependence on institutions and larger PLFs.
Has the Pennhurst litigation overextended the capacity of community services providers?
This is a difficult proposition to address given the lack of any systematic survey of providers in the Southeast Region and in the rest of the state where Pennhurst class members have been placed. The task of assessing system impact was originally part of the Longitudinal Study, but was discontinued because of funding cutbacks and the slowness of deinstitutionalization in the early phases of the project. There are, however, strands of information from other parts of the study that can help to shed some light on the issue.
EXHIBIT 10-9. Institutional, CLA & PLF Beds by Region Per 100,000 of Population of FY ‘84
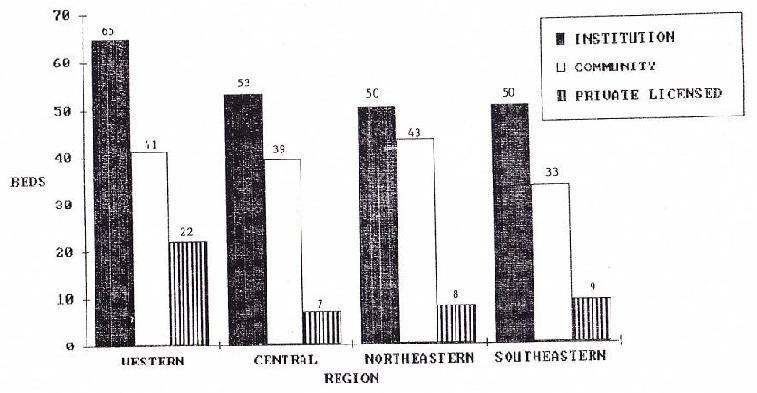
SOURCE: Office of Mental Retardation, Department of Public Welfare, Harrisburg, PA.
First, the data on client progress pre and post relocation from Pennhurst now clearly show that class members moved to the community have made gains that are significantly greater than those made by individuals who remain at Pennhurst. With improvements at three data points in the community, the Temple researchers can now say with some confidence that the growth they are observing is truly growth and not merely the opportunity to exercise skills that were dormant in the institution (e.g., the opportunity to cook a meal -- one of the items on the Behavior Development Survey -- is not available in the institution but is in the CLA). This documented progress would tend to support the contention that providers have not been overwhelmed but, to the contrary, have successfully met the needs of those persons that have been placed.
Another source of information about provider capacity comes from the key informant interviews. Questions about the ability of the system to absorb "more difficult" clients have been asked throughout the study period. In the initial few years, there was a great deal of concern expressed regarding provider capacity both by providers themselves and county staff. County personnel noted that it was difficult at first to get responses to their requests for proposals to serve class members. Providers were concerned that there would not be enough funding to cover the multiple needs of former Pennhurst class members. In a study conducted by Government Studies and Systems in 1980, a random sample of providers in the Southeast Region was interviewed to determine their perceptions and characteristics. One of the interesting findings at that time was that many of the providers coming forward to serve Pennhurst class members were new organizations that had not traditionally provided services in the county. One of the observations in the analysis was a caution about the sophistication and stability of these new agencies, especially given the difficulties presented by formerly institutionalized individuals.
More recent interviews, and the last round in particular, showed little if any of the anxiety about provider capability apparent in the initial phases of the study. In fact, there was a certain amount of pride among many of the key informants regarding the accomplishments of the community system and its ability to cope with the needs of persons with severe and profound disabilities. Conversely, staff in one county program still have reservations about the ability of small group living arrangements to serve all persons regardless of handicap and have plans to move their remaining class members to a large private licensed facility.
In order to gain a firsthand impression of service quality in the community, project staff also met with several site reviewers who are collecting data for the Temple/Special Management Unit monitoring system. The monitors noted several evolving problems they had recently become aware of through their contact with agencies providing services to class members in the community. The points raised are summarized below:
-
Training in the concepts of the Program Analysis of Service Systems (PAS3) (Wolfensberger and Glenn, 1973) has been eliminated from the curriculum for residential care staff and, as a result, staff are not as conversant with the principles of normalization.
-
Turnover in some of the residences means that staff are not always familiar with the individual problems of some of the residents.
-
The two areas where some agencies are having difficulty are medication administration and behavior management.
-
As agencies have grown, the level of bureaucracy and routine has increased, which to some extent diminishes the spontaneity and degree of "normalness" of the setting.
-
Agency administration has been strained in some instances (e.g., one agency had four directors in three months).
All of the site reviewers agreed, however, that the procedures instituted by the Pennhurst decree improve the conditions for class members compared to non-class members. As an example, they noted the requirement for periodic medical evaluations.
The reviewers suggested that many of these problems were the result of rapid growth which in turn placed stress both on program management and on direct care staff. They also concluded that some of the problems they were seeing may be the inevitable result of a shift from a small number of agencies and residences to a much more complex provider system with the same demands as any large organization for more bureaucratic procedures and structures.
Anecdotal information gathered during phone interviews with county staff in the other three regions of the state show a mixture of anxiety and gratification about the placement of Pennhurst class members. Many of those canvassed sound much like county staff in the Southeast Region in the early phases of Pennhurst deinstitutionalization. Respondents noted problems in securing medical support and the fact that their case managers were not as equipped to handle the transition as the Pennhurst case managers whose cases were significantly smaller. Others noted that the documentation requirements were onerous and took time away from their other responsibilities. On the other hand, some county personnel noted that caring for returning residents of Pennhurst had helped to increase provider confidence. Some mentioned a sense of pride that they had brought all of their local citizens home from Pennhurst and that these individuals were doing surprisingly well in the community.
In general, the problems and stresses in the system reported both by in-region and out-of-region interviewees have to do with a variety of ancillary services. one area is medical care. In a recent case brought before the Hearing Master, an out-of-region class member was eventually sent back to Pennhurst for medical evaluation and treatment. None of the medical resources in the community where he had been placed responded to his medical needs let alone diagnosed his problem (which turned out to be malnutrition caused by scar tissue in the esophagus and a broken hip). Another problem seems to be the relationship between the mental health and mental retardation system. In several cases that have come before the Hearing Master, Pennhurst class members have found their way into mental hospitals and, in at least one instance, given inappropriate levels and types of psychotropic medications. The issue of drug administration in community living arrangements has also come up in selected cases reviewed by the Hearing Master and a concern for the inappropriate administration and/or utilization of particular drugs is echoed in some of his decisions.
Another way of viewing the capacity of providers to deal with seriously disabled clients has to do with their stability and viability over time. Such stability is particularly important to the well-being of such individuals given their level of vulnerability and need for lifelong supervision. One county is attempting to ensure such stability by limiting contracts for program expansion to large agencies with known track records for program management and program development. By narrowing the field in this way, the county is maximizing the system's continuity. But on the other hand it is also locking out small specialty providers and new agencies willing to experiment and innovate.
Most recently, key informants in the state have noted a small but increasing phenomenon -- providers going out of business. An estimate provided by one state interviewee indicates that about 20 providers have gone out of business (or are no longer providing services in the Southeast Region) since 1977-1978. It was not known how many beds were lost nor the extent to which this figure differed from rates in other regions. Explanations for the turnover included the impact of delayed payments on small agencies, county dissatisfaction with service quality, lack of administrative capabilities, and misappropriation of funds. As noted earlier, some of these problems may be the direct result of rapid growth and are to be expected in any industry undergoing such major change.
The Temple data also shed light on the issue of stability. A recent sub-study (Conroy, Feinstein, & Weiss, 1984) of community residences serving the study population from 1980 to 1984 showed that of 269 home4s, only 53.2% or 143 remained at the same site and were operated by the same provider. Nineteen more homes were still at the same site but operated by a different provider, bringing the total of homes physically at the same location to 60.2%. The remaining 107 homes were no longer at the same address. It is not clear whether homes in this latter group were still operated by the same provider. Though these data are only fragmentary, they do raise a concern regarding both the stability of residential arrangements and the impact of moving from one home to another on the severely disabled residents.
The tentative analysis of this proposition, therefore, suggests that by and large providers have been successful in dealing with Pennhurst class members, particularly in light of the data on client growth and development and the change in attitudes among key informants in the Southeast Region. However, problems still remain with the provision of generic services especially medical care and mental health care in some areas. Further, the need to bureaucratize functions in a larger system may unduly "institutionalize" the provision of community services. Finally, the issue of financial stability -- always an issue with parents -- remains a serious concern and one that should be probed further.
What Has Happened at Pennhurst?
Because of the court's scrutiny, have resources devoted to Pennhurst State Center been greater per resident than in other centers in the state?
As noted earlier, the intent of the plaintiffs was to establish a system of services for Pennhurst class members in the community. Advocates for the class eschewed the type of institutional improvement remedies installed elsewhere because of the ultimate cost and because of a conviction that the institution could not provide a constitutionally acceptable level of habilitation. Therefore the remedy sought only included mandates regarding the protection of rights (e.g., regarding the administration of medications, use of seclusion and restraints, etc.) and the establishment of a narrow range of improvements in care (e.g., provision of adaptive equipment, etc.). The initial theory was that since the institution was to be closed in a relatively short period of time, the development of more elaborate improvements would not be necessary.
In fact Pennhurst State Center is still open six years after the decree and will be open for at least another two years based on the defendant's plan for closure. Further, the decree, certainly until recently, has placed the institution in a somewhat favorable position vis-a-vis maintenance and, in some instances, enrichment of services
For instance, in the first few years following Judge Broderick's original order, Pennhurst avoided the cutbacks in staff complement that were experienced by other centers in the state. Those interviewed at the time suggested that the reason was that the institution was in the public spotlight and that on more than one occasion plaintiffs' lawyers had gone to the Judge to head off possible layoffs. Also during this time, Pennhurst signed a contract with the Northeast Emergency Medical Association to provide medical care at the institution. The consummation of the contract -- which was unique in the state -- came after some so-called "suspicious" deaths at Pennhurst which were attributed to incompetent medical personnel by the lawyer for the original plaintiffs. That contract, which at the time was for approximately $1,000,000, greatly improved medical care at the facility and contributed to an escalating per them rate.
Exhibit 10-10A and Exhibit 10-10B show the growth in medical assistance per them rates at state centers for mentally retarded persons between 1977-1978 and 1983-1984 in adjusted and unadjusted dollars. The bar graphs indicate that Pennhurst perdiems are the second highest in the state. At the beginning of the period, the center's perdiems were slightly below the median of $72.52, and are now projected to be $21.00 over the median of $139. Like many per diems for state centers in 1983-1984, the most recent figure is a decrease over the previous year's figure of $185. Thus, though the per them at Pennhurst Center continued to grow rapidly following the litigation, it is now beginning to decline in spite of the fact that there are fewer residences to carry the fixed overhead.
Most recently, however, the picture at Pennhurst has begun to change. As the population decline has sped up and the state's intention to close the facility has been made public, staffing conditions at Pennhurst have shifted. First, several mid-level professional and other staff have left the facility to take permanent jobs elsewhere. Administrative personnel have been cut back. Some direct care staff are also moving into vacancies in other institutions, and the superintendent has been using part-time personnel (usually drawn from the ranks of former Pennhurst employees) to fill in the gaps on the units.
Informants in other states contacted for the earlier comparative analyses, cited problems in maintaining the level of care in an institution that is on its way to closure. The loss of key personnel and the lowering of employee morale were noted as two key factors. Conversations with Pennhurst staff indicate that they are very aware of the potential problems and have tried in a variety of ways to head off morale and other problems including promoting a newsletter that allows staff to air their grievances and that also gives the administration an opportunity to squelch counterproductive rumors and conjecture about layoffs and unit consolidation.
EXHIBIT 10-10A. Per Diems in State Centers for the Mentally Retarded: 1977-1978 and 1973-1984
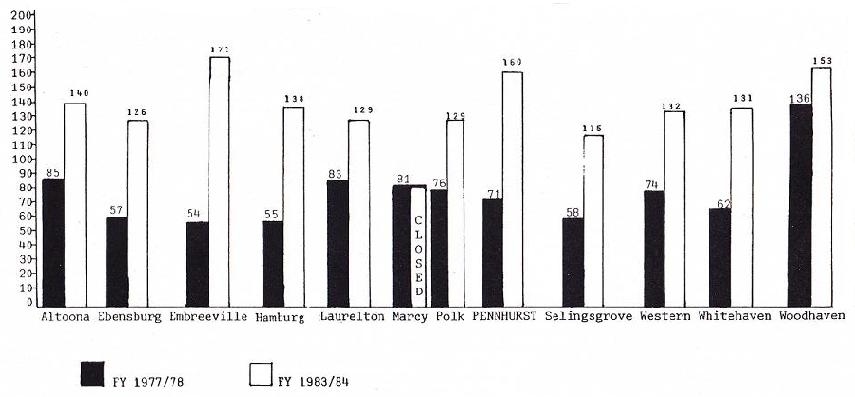
SOURCE: Office of Mental Retardation, Department of Public Welfare, Harrisburg, PA.
EXHIBIT 10-10B. Per Diems in State Centers for the Mentally Retarded: 1977-1978 and 1983-1984 in FY ’78 Dollars
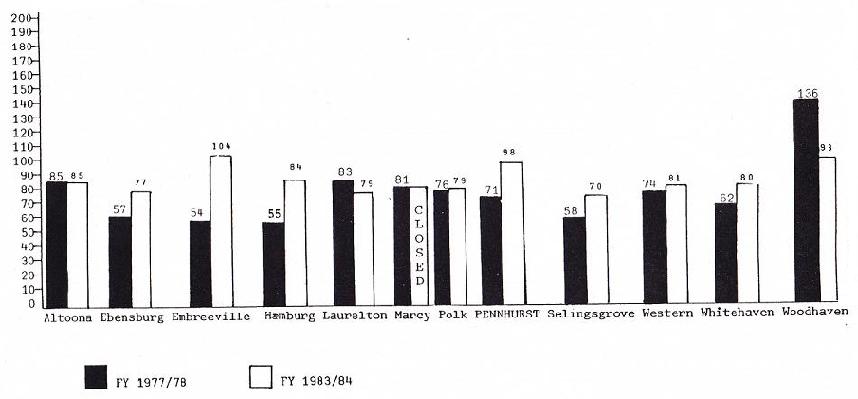
SOURCE: Office of Mental Retardation, Department of Public Welfare, Harrisburg, PA.
The administration at Pennhurst is somewhat sensitive about plaintiff concerns regarding monitoring during the phase down of the facility. Since the Office of the Special Master was disbanded, regular third party monitoring has ceased, though third party monitoring in the community was taken over by Temple University. State staff maintain that monitoring at Pennhurst is now the responsibility of the facility as well as the Pennhurst Implementation Team (PIT). In response to concerns about the adequacy of such monitoring, Pennhurst staff point to their previous performance (e.g., the uncovering of 69 separate instances of abuse by Pennhurst administrators compared to the relatively low level of complaints uncovered by OSM). In a letter written to the project director, Pennhurst administrators (Kopchick and Pirmann, 1984) further note:
In our estimation, the best protection for our clients is guaranteed by the provision of competent management staff, and those resources identified by that staff as necessary to successfully operate the facility over the next two years. The Commonwealth has provided those competent managers and, so far, they haven't skimped on resources. Certainly, these will not be easy years and the loss of key staff, especially therapists, poses a problem, but we are doing what we can to maintain our level of services. We can't rationally ask or expect people to hang on here and pass up new employment opportunities elsewhere but we are going to do what we can (and whatever is needed), by hook or by crook, to insure that no client suffers.
Further, in response to concerns about the potential deterioration of morale at Pennhurst, staff mentioned that a surprise visit had been paid to the facility by the Residential Services Committee of the Pennsylvania Association for Retarded Citizens in order to check out concerns expressed by the Hearing Master. The result, according to Pennhurst spokespersons was that the PARC monitors were impressed with the good morale and the high quality of interaction that they witnessed during their tour.
The answer to the question about conditions at Pennhurst as a result of the litigation is, therefore, somewhat complex. During the first phase of the litigation, Pennhurst was insulated from the effects of the state's financial austerity policy. In fact during this time it actually enriched its services particularly with respect to medical care. However, it would appear that in the next and more than likely the final phase, conditions at the institution will change in spite of the best efforts of an able facility management team. In part, this is because of the inevitable departure of specialist staff (e.g., physical therapists, etc.) to other jobs and in part because of the unpredictable character of the phase down because of delays in the approval of the community Medicaid waivers. The former means a less rigorous level of programming and the latter make-s it difficult to predict budget and staffing requirements.
What Has Happened to State Policy?
Has the litigation resulted in changes in statewide policy in the area of mental retardation.
One of the clear tests of the impact of broad scale litigation is the extent to which any of the reforms it embodies are ultimately institutionalized in ongoing public policy. In terms of this proposition, there are several areas of the decree that are potential candidates for statewide implementation. The first, and perhaps most important, has to do with quality assurance and monitoring. This function, which was previously carried out by the Office of the Special Master, is now being conducted by the Commonwealth through the Special Management Unit. The activity involves the review of transitional habilitation plans (TIHPs) and individual habilitation plans (IHPs), individual client monitoring at scheduled intervals and in response to complaints, the collection of level of functioning information, and the assessment of the living environment (the latter two activities are carried out by the Temple Developmental Disabilities Center under contract with the Commonwealth).
Key informants interviewed in the Southeast Region are basically positive about the monitoring although some county officials were concerned about the accuracy of the data being collected and others questioned whether the state had a legitimate role in monitoring services. These individuals pointed to the provisions of the Mental Health and Mental Retardation Act of 1966 and noted that such functions were left primarily to the counties to perform.
Issues of statutory construction to one side, it does appear that quality assurance and monitoring -- in roughly the form currently mandated by the decree -- will become an integral part of the state mental retardation system. Evidence of the commitment can be seen in a $400,000 line item in the 1984-1985 state budget for quality assurance. According to state officials interviewed, this funding will be used to extend the Temple monitoring, to install a quality assurance unit in each of the other three regions (although not as extensive as the Special Management Unit) and to expand case management resources for individuals coming out of institutions in other parts of the state.
Another area where the decree appears to have had some influence is with respect to IHP procedures. The procedures developed by the Office of the Special Master were subsequently revised by the Special Management Unit during the period of transition. It now appears that some version of those procedures will be used statewide.
The most striking policy change can be seen in the state's decision announced in the Fall of 1983 to close Pennhurst. It is hard to know whether to attribute this decision to the litigation since the state staff always maintained that they wanted to substantially reduce the census at Pennhurst. However, most of those interviewed were clear that without the presence of the litigation as a political shield against union, parental and legislative opposition, it would have been extremely difficult to carry out such a policy. The state maintains that it was in fact the waiver that ultimately made it financially possible to close the facility, but without the census reduction that had already taken place based on the Judge's orders, there would not have been enough cash savings to reinvest in the community.
The real proof of the permanency of some of the court-ordered procedures lies in the settlement agreement which clearly requires the maintenance of the TIHP and IHP provisions, case management protections, and the third party monitoring of client progress and client environments. Though the consent agreement narrows the definition of the class somewhat (i.e., by eliminating those who were on the waiting list for Pennhurst), it still maintains the Special Management Unit and other entities established to protect the rights of class members. The continued presence of these procedures, at least in the Southeast Region, provides a model for the rest of the state.
Conclusion
The above analysis begins to fill in the picture of the effects of the Halderman v. Pennhurst litigation on clients, their families, service costs and funding, the service system, the institution, and on state policy. The following summarizes findings in each general area of inquiry:
What Has Happened To Clients?
The quantitative studies conducted by Temple indicate that class members have improved in terms of growth and learning once they make the transition to the community. Further, family members tend to see community programs as beneficial once their relative is placed, although they still maintain concerns about the stability of living arrangements. Clients themselves express positive feelings about living in the community. Some of the cases that have come before the Hearing Master, however, suggest that problems have developed for some class members including problems with medical care and with the mental health system.
What Has Happened to Funding
Because data on funding by region was not available before 1980-1981, it is difficult to determine whether funding for the Pennhurst decree came at the expense of programs in other parts of the state. What is clear is that the Southeast Region has significantly higher per them rates for community living arrangments than other regions and has a higher growth rate in CLA beds, but the region is a distant second in CLA beds per capita. With respect to federal funding, the litigation was only a partial stimulus to the development of small ICF/MRs in the community. Other factors, such as the need to "run-down" the census at institutions statewide, seem to have been greater motivations. The litigation does appear to have been a spur to the application for the community services waiver under Title XIX.
What Has Happened to Costs
Though the cost of serving class members in the community is more expensive than serving non-class members both in the region and around the state, class member costs in the community are still less than they are at Pennhurst State Center. Further, the value of services in the community (i.e., the amount of service provided for the dollar spent) is greater than at Pennhurst.
What Has Happened to the Service System?
The litigation does not appear to have constrained deinstitutionalization in other parts of the state. It certainly has, however, hastened the development of community services in the Southeast Region. The litigation also appears to have contributed to increases of waiting lists in the Southeast Region (but not in other parts of the state) because of publicity surrounding the lawsuit and the concentration of resources on class members. Finally, the litigation has certainly forced providers in the Southeast Region to develop a level of skill and capacity beyond what they would have under normal circumstances. Some providers, however, are beginning to show the strain of rapid expansion.
What Has Happened at Pennhurst?
In the initial stages of the litigation, Pennhurst was insulated by the litigation from cut-backs made at other institutions. However, now that closure has been announced, conditions have changed and the enrichment experienced during the period after the decree will almost certainly begin to recede.
What Has Happened to State Policy?
The litigation does appear to have had a permanent impact on state policy -- especially in the areas of quality assurance, case management, and individual client planning.
The policy implications of these findings will be discussed in the final chapter.
References
Baker v. Carr, 369 U.S. 186 (1962.)
Bazelon, D.L. The Judicial Process -- A Tool for Reform. In: National Association of Coordinators of State Programs for the Mentally Retarded, Inc., The Rights of the Mentally Handicapped: Proceedings from a Bi-Regional Conference. San Francisco, CA, June 14-16, 1972.
Braddock, D., Howes, R. & Hemp, R. A Summary of Mental Retardation and Developmental Disabilities Expenditures in the United States: FY 1977-1984, Public Policy Monograph Series Monograph #3. Institute for the Study of Developmental Disabilities. Chicago, IL, 1984.
Bradley, V.J. Deinstitutionalization of Developmentally Disabled Persons: A Conceptual Analysis and Guide. Baltimore: University Park Press, 1978.
Bradley, V.J., Allard, M.A., & Epstein, S. Implementation Analysis: Department of Public Welfare. Longitudinal Study of Court-Ordered Deinstitutionalization of Pennhurst. Human Services Research Institute, 1982.
Brown v. Board of Education, 347 U.S. 483 (1984).
Conroy, J., Feinstein, C. and Weiss, M. Brief Report #18. Temple University, Philadelphia, PA, September 1984.
Ennis, B. National Council on the Rights of the Mentally Imnpaired. In: National Association of Coordinators of State Programs for the Mentally Retarded, Inc., The Rights of the Mentally Handicapped: Proceedings from a Bi-Regional Conference. San Francisco, CA, June 14-16, 1972.
Ferleger, D. & Boyd, P. Anti-institutionalization: The Promise of the Pennhurst Case. Stanford Law Review. 1979, 31(4), 717-752.
Gilhool, T. A Commentary on the Pennsylvania Right to Education Suit. In: National Association of Coordinators of State Programs for the Mentally Retarded, Inc., The Rights of the Mentally Handicapped: Proceedings from a Bi-Regional Conference. San Francisco, CA, June 14-16, 1972.
Government Studies and Systems. Provider Actions: Preliminary Report. Longitudinal Study of Court-Ordered Deinstitutionalization of Pennhurst, April 10, 1980.
Halderman v. Pennhurst State School and Hospital, 446 F. Supp. 1295 (E.D. Pa. 1977).
Kopchick, G. & Pirmann, G. Letter to Valerie J. Bradley, August 1, 1984.
Marsh, G.R. Comments. In: J. Rubin (ed.), Litigation and the Mentally Disabled. Rutgers, NJ: Disability and Health Economics Research Bureau of Economic Research, 1977.
Michigan Association for Retarded Citizens et al. v. Donald Smith (C.A. No. 78-70384 [D. Mich.] 1978).
Ray, D.B. Yesterday, Today, Tomorrow: A State Program Officials View. In: National Association of Coordinators of State Programs for the Mentally Retarded, Inc., The Rights of the Mentally Handicapped: Proceedings from a Bi-Regional Conference. San Francisco, CA, June 14-16, 1972.
Rosenberg, N.S. & Friedman, P.R. Developmental Disability Law: A Look Into the Future. Stanford Law Review, 1979, 31(4), 817-829.
Wuori v. Zitnay, No. 75-80-SD (D. Maine, July 14, 1978).
Wyatt v. Stickney, 377 F. Supp. 373 and 387 (M.D. Ala 1972), affd sub. nom., Wyatt v. Aderhold, 503 F.2d. 1305 (5th Cir. 1974).
CHAPTER 11: SUMMARY AND RECOMMENDATIONS
Introduction
One purpose of the Longitudinal Study was to explore the use of class action litigation as a tool for the reordering of services to persons with mental retardation. A second and distinct purpose was to assess the implementation of an extensive deinstitutionalization activity, however initiated. In some ways, the qualitative policy analyses were a vehicle for fulfilling the first purpose while the quantitative studies carried out the second and equally important objective. After five years of analysis -- an almost unprecedented length of time in social science research -- the two purposes have meshed and intertwined as the qualities of the litigation have interacted with the process of deinstitutionalization.
In many ways, the richness of the study can be attributed almost entirely to the presence of the court decree -- not just because the decree required the state to move mentally retarded people out of Pennhurst State Center into the community but because the litigation placed a spotlight on the system and speeded up the process of change. The spotlight of the lawsuit also made the process more self-conscious and apparent. All of this made it possible for the researchers to observe phenomena that otherwise would have been obscured by time and a multitude of confounding and contradictory factors. Like time-lapse photography, the litigation exposed the change process to the naked eye and made it possible to see both the strengths and weaknesses of community-based care in strong relief.
While it is difficult to bring the complex themes together in a short space, this concluding chapter integrates the work of the two research teams -- staff of the Human Services Research Institute who chronicled the general history of the case, examined a number of specific implementation issues, and conducted the major analyses of comparative costs; and analysts from the Temple University Developmental Disabilities Center/University Affiliated Facility who studied the human impacts of moving residents from Pennhurst Center to community settings under the Pennhurst court order.
In the first part of the chapter, we provide a summary of what we have learned. These findings are summarized as a prelude to the second part of the chapter in which we apply these findings, to the extent scientifically permissible, to specific recommendations for federal, state, and local action.
Findings of the Quantitative Studies
The Human Impacts of the Deinstitutionalization of Pennhurst
The part of the Pennhurst Study that was conducted by the Temple University Developmental Disabilities Center/UAF was designed to answer just one major question: are people better off? That question has been approached in several ways, because well-being has many facets.
Before presenting a summary of the findings about the aspects of well-being that we have measured, a brief description of the kinds of people who lived at Pennhurst, and of the kinds of community programs that later became their new homes is helpful. Without knowing the characteristics of the people and the system we studied, the reader cannot judge whether the results o deinstitutionalization for other people in other systems will be similar.
There were 1154 people who lived at Pennhurst Center on March 17, 1978. Their average age was 39 years, they had lived at Pennhurst for an average of 24 years, and 64% were male; 33% had a history of seizures, 13% had visual impairments, 4% had hearing impairments, and 18% were unable to walk. Life-threatening medical conditions were reported for fewer than 1%. Just over 50% were nonverbal, 47% were less than fully toilet trained, and 40% were reported to display physical violence toward others. Among the people at Pennhurst, 86% were labeled severely or profoundly retarded.
The community service system was composed of residences called community living arrangements (CLAs). They were very small, with the vast majority serving three individuals. They were almost always located in regular homes and were staffed continuously when the residents were home. All were operated by private providers under contract with county mental retardation programs. Counties received 100% state support for the residence and 90% support for day programs. Every person left the CLA on weekdays to attend a day program.
Individual Behavioral Development. Continual behavioral growth toward independence is a central goal of services for people with mental retardation. We have found, by every scientific design and test available, that people who went to CLAs are better off in this regard. They have made more progress than similar people still at Pennhurst, and more than they themselves made while at Pennhurst. These people have become more able to do things for themselves rather than having things done for them. "Adaptive behavior" is a general term for this facet of independent functioning. The following graph shows the increase in adaptive behavior for 176 people who were living at Pennhurst in 1978 and 1980, and then in CLAs in 1983 and 1984.
EXHIBIT 11-1. Adaptive Behavior Growth
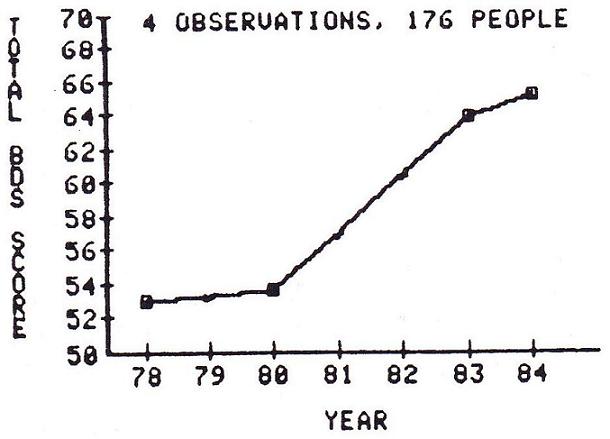
The Behavior Development Survey, or BDS, our general measure of adaptive behavior, could range from 0 to 128 points. From 1978 to 1980, while living at Pennhurst, these people showed no significant increase in adaptive behavior. When they moved to CLAs they became sharply less dependent, and, considering the results of all our analyses, they generally continued to grow and learn after moving, at least for another year.
The final year of data, however, contains the suggestion that the rapid rates of behavioral progress have begun to level off. Evidence thus far is not sufficient to determine the cause; it could be that the system and its service providers simply could not sustain the high level of enthusiasm associated with such an unprecedented deinstitutionalization effort forever, or it might be related to the removal of the special independent court master, or perhaps real progress is still occurring but it is now in areas that our behavioral instrument addresses only slightly (such as self image or comfort in integrated settings or specific vocationally oriented skills). In any case, progress has not stopped or reversed, it merely appears to have slowed.
We also find that the people who seem to make the greatest gains in adaptive behavior tend to be those who start out lowest. That is, the people with the most severe impairments turn out to be among those who benefit the most from community placement.
The adaptive behavior growth displayed by people who have moved to CLAs under this court order is literally ten times greater than the growth displayed by matched people who are still at Pennhurst. People at Pennhurst are not regressing -- they are showing developmental gains, but at a far slower rate than people who move to community placements.
Services Rendered. Do people receive the services they need after community placement? In the Pennhurst situation, there is a change in service patterns when people move to CLAs. The people who have moved to CLAs (movers) receive fewer hours of developmentally oriented service hours at the places where they live; about 104 hours per month compared to about 156 hours among people still at Pennhurst (stayers), but more day program service (about 121 hours per month compared to the stayers' 33 hours). Adding the two kinds of service, the movers receive more total hours of service (225 hours per month) than the stayers (189 hours per month). Hence we conclude that, on an overall index of amount of service, the movers are better off.
The evidence on medical services suggest that people in CLAs are, for the most part, using the Medicaid and Medicare services systems effectively, and we have observed few cases of people lacking regular checkups or other needed services. Moreover, we have seen no change in general indicators of individual health following placement.
We also find that the number of daily prescription medications to each person declines after community placement, and has also declined among the stayers. For both groups, then, we would infer that they are better off in terms of the risk of overuse of medications.
Consumer Interviews -- Satisfaction. In this part of the study, we interviewed a sample of people before and after they left Pennhurst. The sample is not representative of all the people who lived at Pennhurst, the majority of whom could not respond to a verbal interview. Nevertheless, we have learned a great deal by talking to people directly, both about their own feelings, and about the methodology of conducting direct interviews' with consumers.
We interviewed a sample of 56 verbal people in 1980, while they were still at Pennhurst. We included check questions for each of the important questions, so that we could eliminate contradictory and inconsistent responses from the statistics. The 56 people were generally happy and satisfied with all aspects of Pennhurst. We found that 39% reliably said they wanted to stay at Pennhurst, and only 23% reliably said they would like to go live somewhere else. (The remaining 38% of the people were inconsistent or did not answer these questions.)
Thirty of the original 56 people have now moved and have been reinterviewed in their new community homes. Their responses show that they are significantly happier than they were at Pennhurst in most aspects of their lives. Twelve of these 30 people reliably expressed happiness about living at Pennhurst in 1980; now, 22 reliably say they are happy living in the CLA. The proportion of people who reliably want to keep on living in the CLA is up to 63% (from the 39% at the institution). There has been no decrease in any area of satisfaction or happiness.
Among the other 26 people who are still at Pennhurst awaiting placement, our 1984 reinterviews show no changes at all in satisfaction or happiness from 1980.
We have noticed a sharp increase in consistent answers from the first to the second interviews, both among movers and stayers. Having considered many possible explanations, we tend to favor the idea that these people, who had seldom been asked their opinions about important things, were at first unprepared and perhaps somewhat nervous. But the inter-view, which was indeed an unusual event in their lives, may have been the subject of much thought afterward. By the time of the second interview, they had actually clarified their own opinions about what they liked and how they wanted to live. This suggests that consumer input, if we will ask for it and listen to it, may become progressively more useful.
Qualities of Environments. We have found that the CLAs are considerably higher on scales of normalization and individualization than were the living areas at Pennhurst. We therefore conclude that people are better off in terms of these two environmental qualities after moving from the institution to a CLA.
In our work on measuring environmental qualities within community residences (including physical comfort, 18 aspects of normalization, individualization, life safety, encouragement of autonomy and activity, size and staffing patterns), we have tried to shed light on what environmental qualities "make a difference" for individual growth and development. Our preliminary findings indicate that the degree of normalization of a community setting makes a difference, with people in more normalized settings making more progress. We also find evidence that size makes a difference, with people in smaller settings doing slightly better (even though the size of the settings only ranges from I to 8 people). The data also hint that, controlling for differences in the level of functioning of the people in the community settings, more regimentation may be associated with more growth. This tentative finding demands more investigation. In another analysis, we see a suggestion that settings with "too many" staff may produce less growth among the people living there -- but we need long and careful scrutiny of what might constitute "too many" before saying any more.
Findings of equal or greater importance have arisen from unexpected quarters. All of the programmatically oriented measures we have used are rather highly correlated with the adaptive behavior of the occupants. This means that programs serving people with more serious disabilities will automatically receive lower ratings on these measures. That is not a desirable property for any set of environmental scales or standards.
Another unexpected finding of our work is that none of the environmental scales that were available for use in this study offered adequate reliability data, not even those that were in use on a national level. Moreover, during the course of the work, we came to suspect serious reliability problems with many of the environmental instruments we used. The Pennhurst Study was not designed to do large scale reliability checks of program standards and scales, but that is certainly an area for immediate and important work.
Family Impacts
We now know from national studies that most families of people living in public institutions vigorously oppose the idea of community placement. The families of the people living at Pennhurst Center are no exception. The unique contribution of the Pennhurst study is that this is the first time families have been interviewed before and after community placement of their relatives.
We found, in 1980, that 83% of the families of people living at Pennhurst expressed satisfaction with the institution, and 72% said they were unlikely to agree with any decision to move their relatives to CLAs. We also found that opposition to the CLA idea was not related to the relative's level of retardation. Moreover, families who had visited a CLA opposed them just as much as those who had not. In addition, we found that most families did not believe that their relatives were capable of learning any new skills, and we found strong evidence that many of the families had an exaggerated perception of the level of medical attention needed by their relatives.
In any case, we could comprehend the reluctance of the families to accept the CLA concept on the grounds of one fact alone: their relatives had already lived at Pennhurst Center for an average of 24 years. Change after so long is difficult for anyone.
The family of each person who went to a CLA has been reinterviewed six to families have been interviewed in 12 months after the move. A total of 134 this "before and after" fashion. The changes in feelings about community residential care are dramatic. The graph below illustrates the magnitude of our findings. On the left side, the graph shows the increase in the proportion strongly favoring community placement, from less than 20% before to over 60% afterward. Conversely, on the right, we see that after placement, less than 5% of families strongly oppose the CIA option.
EXHIBIT 11-2. Agreement with Community Placement
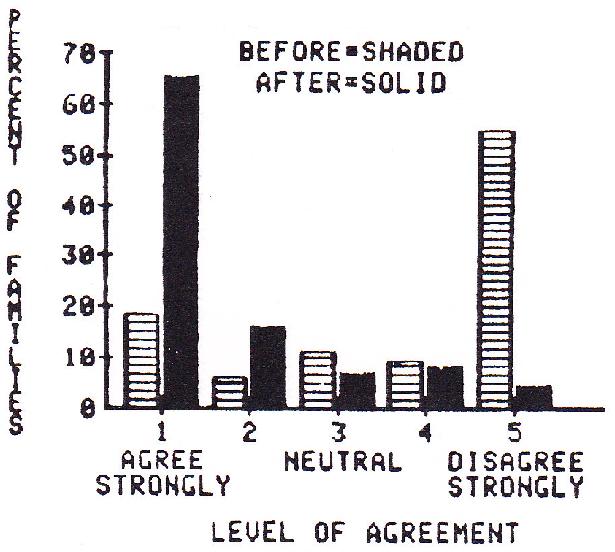
Survey results show that the families also perceive their relatives to be much happier after the move. There are significant and positive changes in practically every item on our survey.
In the areas of the relative's potential for growth and the perception of the relative's medical needs, however, the before-to-after changes are relatively small. We are continuing to watch these attitudes in Pennsylvania to see whether they will gradually change over years of community living.
Our data also show no substantial increase in family visits after community placement. It seems that the families who visited frequently at Pennhurst continue to do so in CLAs and vice versa.
In a nutshell, we have found that initial family opposition changes drastically to surprised and enthusiastic support of the CLA option, tempered by continued concern about permanence. Our perception of the single most important finding of our work with families, other than their delight with the new mode of care, is their continued and unabated concern for permanence. Few of the families are convinced and confident that the CLA model offers a sufficient "guarantee" that their relatives will have a safe and pleasant place to live for their entire lives.
Neighbor Attitudes. The long duration of the Pennhurst Study has enabled us to investigate neighbor attitudes in a way that has not been done before -interviews with neighbors of CLAs before and after the CLAs open.
We interviewed neighbors of eight planned CLAs about six months before they opened. This was before anyone in the neighborhoods knew of the planned CLA. We asked the neighbors how much they would be "bothered" if small groups of various kinds of people moved into a house in the area. The respondents said they would be bothered very little by new neighbors with physical disabilities, or with mild mental retardation, or of a different race. They admitted that they would be bothered a lot more by people with mental illness or severe mental retardation.
The potential effect on property values was a strong concern about new neighbors with mental illness, with severe mental retardation, and of a different race. This concern was much less intense about people with mild mental retardation.
In all, it appears from our data that only about 10% to 20% of neighbors would be opposed, on their own, to a small group home for people with mental retardation, depending on the level of retardation of the people. However, this situation can probably be changed by vocal leadership, even from a small number of strong opponents.
The same neighbors were reinterviewd about six months after the group homes opened, and then again at about 20 months after opening. We found that only 28% of neighbors were aware that a group home had moved in at all. Among the cognizant neighbors, there was a small but significant negative shift in their general attitudes about people with mental retardation -- but this shift was visible only at six months after opening, and had vanished by the time of the 20 month interview. Thus we found a small and temporary negative reaction among neighbors of new group homes.
This temporary negative reaction is further documented by the fact that neighbors who knew about the group home told us that they had been much more negative when they first heard about it than they were now.
Finally, it appears that the opposition of average citizens to imagined group homes in their neighborhoods is considerably stronger than the actual opposition among neighbors of real group homes. This presents program implementers with a fascinating double bind: if a program opens in a community, opposition will decrease, but if the opposition is strong enough, the program will never open.
Synopsis and Cautions. The five years of the Pennhurst Study have led to the conclusion that, on the average, the people deinstitutionalized under the Pennhurst court order are better off in every way measured. This is an uncommon, but welcome, situation in social science. More often, evaluative results are mixed and one must balance gains in one area against losses in another. For the people who have moved from Pennhurst to small community residences, results are not mixed. They are conclusive.
Scientifically, this is not the end of the story. How do we know that deinstitutionalizations elsewhere would produce similar results? The answer is that we do not. Scientific conclusions are stated in probablistic terms. The more a deinstitutionalization process resembles the one we have observed, the more likely it is that similar results will be seen. Any who wish to know if their efforts will obtain similar outcomes must understand the nature of the service system we have studied here, and be able to relate it to the nature of the system in their own area. To the extent that the placement process and the community service system are different, the results of deinstitutionalization may be different.
Similarly, to the extent that people in other community placement efforts are unlike the people in our study, the results of deinstitutionalization may be different from ours. Our study concerned people with very serious intellectual and other impairments. One must draw a careful distinction between the group we have studied and the people who were "deinstitutionalized" from facilities for people with mental illness (not retardation) in prior years. Some of those people were discharged with little more than a supply of medications to support them, and went on to join the ranks of the homeless who may be seen on streets and warm air vents in major cities. That was emphatically neither the kind of person nor the kind of process observed in the Pennhurst Study.
Though cautions against careless generalization are important, it is also scientifically important to stress that, in the Pennhurst deinstitutionalization, the measurable improvements in the lives of the people have been very great. Such gains make it clear that such outcomes are possible given similar circumstances.
It is also important to note that we have observed an unusual community placement process, in that 81% of the people who have moved to CLAs are labeled severely or profoundly mentally retarded. That simple fact definitively invalidates the notion that community care for people with severe or profound mental retardation cannot work.
The Costs of Serving People at Pennhurst and in Community Programs
The Human Services Research Institute completed an extensive and direct collection of cost information for 42 living areas at Pennhurst and 102 community residences, four adult day programs at Pennhurst and 35 in the community, specialized support programs at Pennhurst and in three of the five counties, case management at Pennhurst and in each of the five counties, and also for medical and transportation services. In addition, data on staff activity patterns were collected for all areas by direct structured interviews.
Three unit cost measures were employed: (1) cost per person per day, (2) cost per hour of direct care staff time, and (3) cost per hour of selected specialized developmental service. For all three unit cost measures, the community residential programs were found to have a wider range of costs that were lower on the average. The greatest unit cost differential was in the cost per hour of direct care staff time, for which CLAs expended on average only about 40% of the amount expended at Pennhurst.
Of equal importance was the finding that the largest part of the difference between CLA and Pennhurst residential program costs could be traced directly to differences in staff salaries and benefits. At Pennhurst, the employees were state civil service workers, and were almost entirely unionized; they earned an average of 30% more than their community counterparts, who were employees of private corporations and almost entirely non-unionized. The Pennhurst employees also enjoyed an overall fringe benefit rate of 63% of salaries, double the rate of community workers.
For day programs, the community settings showed somewhat lower costs per person day, but considerably higher costs per hour of direct care staff time. The community day programs showed much higher costs for indirect functions, such as drivers and food service workers. For specialized support programs such as behavior management, the relative costs in institution and community were higher or lower depending on what services t programs were defined to include. In the remaining program areas (case management, medical, and transportation), the cost finding procedures were not exact enough nor the number of programs large enough to yield definitive findings.
Our general conclusions must be tempered by the fact that we have studied a system under somewhat unusual conditions. The court order is one unusual condition, but it is also important to note that the cost environment in general is not typical of the country. Pennhurst Center itself has become very costly during the years after the court order; in fiscal 1981-1982, the Pennhurst per them cost was $123, compared to a Pennsylvania institutional average of $108 and a national average of $93. The surrounding CLAs are also high in cost, with an average per them of $91 for the people who formerly lived at Pennhurst, and $63 for people who were never at Pennhurst. Both of these rates are more than the state average of $49, and more than the national average of $39.
One might say that what has been compared here is a relatively expensive public institution affected in some part by a federal court order and a relatively expensive private system of community living arrangements and day programs also affected to some degree by a federal court order. The general conclusions below are offered as the findings that we think are most likely to be generalizable to other areas and situtations, but the less a system resembles the Pennhurst situation) the less likely that the cost conclusion will be applicable.
First, the analyses indicate that the community based programs now serving the people who formerly lived at Pennhurst are less costly on average than those at the institution in terms of most cost measures. The cost differential can be traced almost entirely to differences in salaries and fringe benefits between the state employees at Pennhurst and the private employees in the community programs.
Second, we believe our findings of generally higher salaries and fringe benefits for employees of state institutions than for employees of community residential and day programs hold true in most states. This suggests that our findings of generally lower costs for community programs is probably true for many other areas of the country.
Third, because most of the savings arise from what seems to be marked pay differences, we conclude that the savings may be temporary. Over the long run unionization and other such forces may lead to a more equitable situation and thus reduce and/or eliminate the cost differential.
Fourth, the cost differentials were larger when cast in terms of the cost per hour of direct care staff time than in terms of cost per person day. Therefore advocates wishing to promote community programs are probably best advised to cast their arguments in terms of "getting more direct care staff time for the dollar" than the overly simplified "community programs are cheaper" rationale.
Fifth, some "out-of-pocket" savings that were documented are inherent in smaller community based programs. People living in community based programs can utilize the same generic services (e.g., religious, library, fire safety) offered to every other citizen, and the cost is spread over a much larger number of people.
Sixth, the data indicate that there may be no economic advantage associated with the specialization of labor in large institutions like Pennhurst. Normally, specialization is expected to enhance efficiency and productivity, but, in this kind of human service organization, the opposite may be true. Employees of community programs appear to be generalists, handling many kinds of activities that at Pennhurst are assumed by personnel who are hired and trained to do nothing but that function (e.g., guardianship, food service, housekeeping, laundry). Community residential program staff even go so far as to implement physical, occupational, speech, and behavioral therapies designed by consultants at low cost.
Seventh, the relationships found between the characteristics of individuals and the costs of the community programs serving them revealed relatively weak relationships. This seems to indicate that people are often being fit into programs, rather than programs being designed specifically to meet individual needs. This is contradictory to one of the implicit aims of small, more individually tailored residential and day programs.
Implementation Issues
The Human Services Research Institute conducted four implementation analyses: the role of the Special Master, the response of the defendants to the litigation compared to the reaction of other states, factors affecting the implementation of court decrees in Pennsylvania and in four other states (Maine, Michigan, Minnesota and Massachusetts), and the impact of the Pennhurst case on the mental retardation system in Pennsylvania.
Office of the Special Master
In order to provide a comprehensive picture of the Office of the Special Master (OSM) in Pennhurst, this analysis encompassed both the legal context within which the Master functioned and the larger political and organizational milieu that were the object of the court's intervention. The Office was also assessed in light of the experience of other masters and monitors in related litigation. The analysis drew both from the legal literature on complex litigation and compliance mechanisms, and from political science and public administration literature on implementation and program change. The assessment also included structured key informant interviews with officials in Pennsylvania and in other states. There were six factors that explained the character of OSM as well as its strengths and weaknesses as a vehicle for bringing about change.
Lack of Consent. The fact that Judge Broderick could not persuade the parties in the Pennhurst case to negotiate a consent decree had an impact on the remedy. In the absence of consent or of any proposed orders from the defendants, the character of the initial decree and of subsequent orders was significantly influenced by the plaintiffs. As a result, the defendants viewed OSM as intrusive since they had little stake in the remedy that OSM was empowered to implement.
Limited enforcement powers. Given the problems of other court appointed monitors in institutional and deinstitutional litigation, the plaintiffs in the Pennhurst case recommended a remedy that embodied comprehensive programmatic and compliance duties. The ability of the Master, however, to enforce compliance with the decree was hampered because of the limited sanctions available to the court. The only real sanction is the contempt power which, in cases like Pennhurst, is generally regarded as a last resort -- in part because it must be directed at an individual or individuals. The court has no bonuses or rewards to hand out to compliant defendants except the ultimate disappearance of the court and the master from the scene once the aims of the decree have been fulfilled.
Involvement in individual cases. The Special Master's compliance functions reflected a broad and deep involvement in the day-to-day implementation of the decree. The Master's responsibilities began with class members in the institution, carried through the initiation of individualized habilitation plans, and continued through placement in the community. In short, OSM's compliance functions touched on almost every aspect of the traditional delivery system for mentally retarded individuals.
The client-specific nature of the remedy in Pennhurst was a significant factor in diverting the attention of the Special Master from the broader structural aspects of the decree. Involvement in individual cases siphoned off energy and placed the master squarely in the middle of debates reflecting conflicts in professional judgment.
Separate and countervailing agency. The establishment of OSM as an agency separate and removed from state and local government was directly motivated by the plaintiffs' frustration with the defendants' past performance. Such isolation from the ongoing system, however, has drawbacks. In the case of the Office of the Special Master, the isolation and separateness of the agency created conflicts and tensions because of its perceived favored position and because it ultimately had to rely on state and local government to carry out the specifics of implementation. Establishing a working relationship with the defendants was difficult for OSM. Part of the problem was that OSM staff were perceived as being highly ideological. Though in fact many of the Master's staff had worked in the system, their separation from the system, and the rigid court-ordered procedures and time tables included in the decree conspired to create a picture of OSM staff as zealots.
These various structural and political factors created a "we-they" mindset in OSM and among the defendants. The feelings at OSM were the result of its continually frustrated attempts to influence implementation. The attitudes of the defendants were the result of their increasing alienation from what they saw as a "foreign" agency with power to direct their actions yet totally outside of their control.
Lack of control over policy making. Though the Master had a quasi policy making function in that she suggested proposed orders and devised related rules (e.g., individual habilitation plan guidelines), she was not a policy maker in the strictest sense. The sources of broader policies that affected the system were the Governor, the Department of Public Welfare and the legislature. The separation of policy making from operations weakens the viability of any complicated activity. The need for connectedness and coherence between policy and implementation is as relevant in court-ordered change as it is in legislative or bureaucratic change.
Lack of an overall plan. The court order did not specify that the Master was responsible for developing an overall plan to guide implementation. OSM was given the responsibility to develop separate county plans that included the specific clients to be served, the resources necessary, and the types of services that would be required. OSM and others argued that the development of such plans should be left to county program staff. However, county staff in particular voiced the need for an overall plan that spelled out the expectations of the Master including the schedule of implementation and specific actors designated to carry out particular tasks.
State Response to Litigation
The response of states to litigation has been varied and wide-ranging. Even within a particular state, the official position can shift in response to changes in the level of resources, the force of public opinion, a turnover in political leadership, and pressures of competing constituencies. Some states readily entered into consent agreements with plaintiffs. Some states, even after consent agreements were signed, resisted the court's jurisdiction. Still other states, like Pennsylvania, continued to contest the court's right to intervene in the state system. The purpose of this implementation was to explore the factors that dictated Pennsylvania's reaction as well as those of other states facing complex litigation.
The analysis was based on key informant interviews in Pennsylvania, Maine and Michigan as well as on a review of the legal literature and the literature on legal theory. The analysis aimed at factors affecting consent and non-consent, and factors influencing progress in the implementation of court decrees. It should be noted that no one factor can be isolated as necessarily the most prominent given the complexity of court-ordered change.
Factors associated with consent and degree of implementation. Ten potential hypotheses were developed in order to explain state reactions.
-
Level of sophistication and development of the existing state mental retardation system -- This factor did not prove very helpful in explaining the distinction between Pennsylvania on the one hand and Maine and Michigan on the other. Though Maine's system at the time of the suit was not fully developed, the Michigan system was clearly mature and sophisticated.
-
Extent of public pressure for reform -- In Michigan, the pressure in the press and from the public facilitated consent. In Maine, the pressure was unfocused and in Pennsylvania the pressure was more sporadic. This factor may be a partial explanation for consent but does not necessarily explain progress once the agreement is reached.
-
Explicit or implicit agenda of state officials -- This factor appeared to be important both with regard to consent and progress in implementation -- a fact that is born out in the comparison states and in the literature. To the extent that state officials see litigation as a means of furthering their programmatic agendas -- which Pennsylvania did not -- the chances of consent and progress are heightened.
-
Orientation of the state's political leadership -- This factor has a somewhat vague relationship to the events analyzed. If orientation means political party, there appears to be no relationship between party identification, and inclination to settle. In Pennsylvania, the case spanned two administrations, and neither settled the case.
-
Nature of the relationship between state program officials and state lawyers -- This factor appeared to be important in forging a consent decree. In the two comparison states, state lawyers were more influenced by the agenda of state mental retardation program officials than was the case in Pennsylvania.
-
Extent of previous litigation in the state -- Though it cannot be directly shown that the cumulative effect of multiple suits in a state will eventually turn state officials against consent decrees, anecdotal information clearly suggests that enthusiasm wanes and wariness increases after prolonged experience with complex consent decrees.
-
Judicial strategies employed by the federal judge in contested and uncontested cases -- This factor requires more exploration. At least tentatively, it does appear that judges in Maine and Michigan were more successful at cajoling the parties into consent and into fairly regular progress. Other factors, however, may have influenced the behavior of the parties.
-
Nature of the decree and the monitoring mechanisms established --This factor lead to a circular argument that was not useful in explaining the differences among states. Since the nature of the decree and the compliance mechanism are directly related to whether or not there is consent, the analysis becomes a tautology.
-
Strategies employed by the plaintiffs -- This factor has potential utility for explaining the behavior of state defendants, but the limited amount of information in this analysis is not conclusive. If the defendants' perception of the lawyers themselves are taken into account, then this factor plus the strategies employed tended to create the opinion among the defendants in Pennsylvania that the plaintiffs' lawyers were implacable.
-
Level and distribution of state resources -- This factor was not particularly satisfactory in explaining the decision to consent among the three states -- at least at the time such decisions are made. Michigan's level of funding was lower than what was available in Pennsylvania and the economic picture was more precarious. Level of funding may, however, bear on the decree of progress a state is able to make in implementing the decree.
Other factors. Though Pennsylvania was treated as an exception to the trend of settlement in mental retardation cases, the response of the Commonwealth may increasingly become the rule. The question is whether settled cases, if they were brought now, would result in consent agreements. Of the cases brought recently, more are going to trial, and consent agreements are more aggressively negotiated by the defendants. Many state officials are increasingly reluctant to submit control over aspects of the service system to federal court oversight. In part, this reluctance stems from direct experience with other consent decrees and in part from a feeling that the price paid for consent is not worth the benefits.
Further, resistance to federal court intervention was strongly influenced by the gloomy financial picture that emerged at the federal level and in several states. As long as resources were relatively flexible, there was enough "play" in the system to accommodate comprehensive consent agreements. As resources became short, meeting court requirements was seen as coming at the expense of the rest of the system.
Another related fiscal issue had to do with the Medicaid program. Those states that certified a significant number of institutional beds for Title XIX reimbursement may resist court-mandated deinstitutionalization unless they can be assured that the Title XIX funds will follow the clients into the community. In states where community programs are funded primarily with state dollars, deinstitutionalization will result in a direct loss of federal funding and a concomitant drain on scarce state funds.
Factors Affecting Complex Decrees
The purpose of the third implementation analysis was to ascertain whether those factors that had emerged in Pennsylvania as major influences on the implementation of the decree were present in four other states that were operating under a major lawsuit -- Maine, Michigan, Minnesota and Massachusetts. The four factors were: the nature of the compliance mechanism, union opposition, legislative backlash, and parental resistance. In order to gather information for the analysis, key informants in Pennsylvania as well as in the four comparison states were interviewed, relevant court and state policy documents were reviewed, and the legal literature was explored.
Legislative backlash. As implementation of the court decree in Pennsylvania began, the legislature also intensified its scrutiny of the mental retardation system. Though in the past the legislature had, within reason, relied on the Department of Public Welfare to set the tone and direction for the mental retardation program, insistent complaints from parents and others stimulated the legislature to conduct its own investigation of the management of the system. Late in 1982, the Pennsylvania Senate passed a resolution establishing a five member investigation committee to review the operations of the Office of Mental Retardation. The committee looked into allegations of mismanagement within the Office of Mental Retardation, and in the community system in general. Though the work of the committee did not result in any change in state policy or state personnel, it did draw attention to a crack in the legislative consensus regarding community programs.
In each of the four comparison states, legislators were supportive of services for mentally retarded persons and did not appear to question continued development of community-based services. These legislators, however, all shared a certain restiveness about the continued presence of the federal court in the management of state mental retardation programs.
Union influence. In Pennsylvania, the American Federation of State, County and Municipal Employees (AFSCME) is a significant actor in the political arena in the state. Actions taken by the union in opposition to deinstitutionalization have included the use of litigation to attempt to block institutional closures and institutional phase-downs; financial support for the Parent/Staff Association, a defendant intervenor in the Pennhurst suit; and legislative lobbying, including successful opposition to zoning legislation that would have opened up residential neighborhoods to small group living arrangements for mentally retarded persons.
The nature of the litigation in the four comparison states was different in that the remedies were not solely oriented to deinstitutionalization. As a result, union opposition was muted. In three of the states, the unions benefited because the remedies resulted in substantial institutional improvement. In one state, where the institution was ultimately closed, the union did not oppose the phase out since conditions at the facility and abuse among the staff had been highlighted in the media.
Role of enforcement mechanisms. The creation of the Office of the Special Master in Pennsylvania, as noted in the first implementation analysis, caused a great deal of consternation both because of the extent of its responsibilities and the amount of resources devoted to its operations. The situation in the four comparison states, however, was very different. For one thing, the litigation in all of the states visited was settled by consent agreement. As a result, the court-appointed officers in the four states had responsibilities that were much more removed from the day-to-day operations of the system and the resources at their disposal were also more limited.
Given the numerous factors that influence the ability of a court appointed official to affect change, it is difficult to point to any one variable as more predictive of outcome than any other. All in all, those court monitors and masters that were most widely accepted by key system actors tended to avoid center stage and to limit their activities to more narrow compliance issues. However, those court officials that inserted themselves into the process clearly expedited implementation of the decrees -- particularly in the early stages. This may suggest that different orientations and personal styles are required in different types of litigation and in different phases of a particular case.
Parental opposition. The Pennhurst litigation appears to have exacerbated if not created tensions among the parents of mentally retarded persons in Pennsylvania. Because of the frank deinstitutionalization character of the remedy, pro-institution parents were forced to take sides and they ultimately formed a separate organization and became opposing parties in the case. Given the community orientation of the Office of Mental Retardation in Pennsylvania, this polarization may have occurred in any event, but perhaps not as quickly nor as intensely.
One of the factors in Pennsylvania and in the four comparison states that appears to have a positive influence on the attitudes of parents toward broad scale litigation is the presence of an escape valve in the decree -- either the ability to return a class member to an institution when necessary or the ability of parents to influence the nature and timing of placement. The Pennhurst decree, included no such escape valve (until the establishment of the Hearing Master) and the polarization of parents may have been one by-product. Family involvement also plays a role in parental attitudes especially when personal contact is made with families to reassure them and to explain the process. Overall, it is clear that parents are concerned about permanence and stability regardless of the nature of the suit. In deinstitutionalization cases, however, these feelings and perceptions become a major key to parental acceptance.
Impact on the State Mental Retardation System
The final implementation analysis assessed the short-term and long-term LMpact of the litigation on the mental retardation system in Pennsylvania. In addition to a look at what has happened to clients and to costs -- two areas covered earlier -- the analysis focused on the impact on funding, the service system, Pennhurst State Center., and on state policy.
Funding. Because data on funding by region was not available before 1980-1981, it was difficult to determine whether funding for the Pennhurst decree came at the expense of programs in other parts of the state. What is clear is that the Southeast Region of Pennsylvania has significantly higher per them rates for community living arrangements than other regions and has a higher growth rate in CLA beds, but the region is a distant second in CLA beds per capita. With respect to federal funding, the litigation was only a partial stimulus to the development of small ICF/MRs in the community . Other factors, such as the need to "run-down" the census at institutions statewide, seem to have been greater motivations. The litigation does appear to have been a spur to the application for the community services waiver under Title XIX.
The service system. The litigation does not appear to have constrained deinstitutionalization in other parts of the state. It certainly has, however, hastened the development of community services in the Southeast Region. The litigation also appears to have contributed to increases in waiting lists in the Southeast Region (but not in other parts of the state) because of publicity surrounding the lawsuit and concentration of resources on class members. Finally, the litigation has certainly forced providers in the Southeast Region to develop a level of skill and capacity beyond what they would have under normal circumstances. Some providers, however, are beginning to show the strain of rapid expansion and long-term stability is a concern in some instances.
Pennhurst State Center. In the initial stages of the litigation, Pennhurst was insulated by the litigation from cutbacks made at other institutions. However now that closure has been announced, conditions have changed and the enrichment experienced during the period after the decree will almost certainly begin to recede.
State Policy. The litigation does appear to have had a permanent impact on state policy -- especially in the areas of quality assurance, case management and individual client planning.
Discussion
Based on the implementation analyses and the six historical overviews prepared during the course of the study, there are some general observations that can be made about litigation and the process of deinstitutionalization. First, it is clear that making family members a significant part of the deinstitutionalization process is crucial to a smooth and successful transition to the community. The court-mandated Hearing Master process showed poignantly the need that family members have to voice their anxieties, concerns, and hopes for their relatives. Persons interviewed in the state acknowledged that allowing families to advocate for the interests of their relatives resulted in stronger more responsive placements for class members. in many instances, the hearing process was the first time that some parents had been able to face professionals as equals and to have their views treated with respect.
Second, community based agencies can develop the capacity to serve more disabled persons and can expand to serve increased numbers of mentally retarded persons. This achievement however, may also bring with it changes in the character of the community system. For one thing, the more the system expands, the more bureaucratic it becomes. Further, expansion also may tend to force out smaller providers that do not have the financial and administrative capacity to grow rapidly. Thus, though capacity is enhanced, some of the more attractive qualities of the burgeoning community system (e.g., sense of mission, spontaneity, etc.) may be jeopardized.
Third, mental retardation program officials cannot carry out the complex transition from institutional services to community-based care without a variety of financial supports within the state (e.g., from state Medicaid officials, income maintenance personnel, and vocational rehabilitation officials) and at the federal level.
State officials need federal support to carry out comprehensive deinstitutionalization activities. The Pennhurst case in particular provided the most dramatic example of the potential benefits of a state and federal partnership to accomplish responsible deinstitutionalization and the most disappointing outcome of attempts to forge such a partnership. Specifically, the state's plans for the conversion and development of small ICF/MRs were delayed and constrained by complexities in the federal regulations. The state's proposal to use the community services waiver under Title XIX to close Pennhurst and to place residents in community alternatives has still not been approved by the Health Care Financing Administration after months of negotiations and resubmissions. Without the approval of the waiver, the schedule proposed by the state for the closure of Pennhurst will be severely affected.
Fourth, it is obvious from five years of observation that the system infrastructure including quality assurance, monitoring, advocacy, case management, and individualized planning is crucial to the viability of residential and day services for persons with mental retardation.
Fifth, leadership in the Pennhurst case, as in nearly any field of human endeavor, critically influenced the way events unfolded. In this case, certain leaders appear to have exerted a dominant influence on the way the service system evolved and the capacity that was developed. The attorney who filed the lawsuit in 1974 and the attorneys for the Pennsylvania Association for Retarded Citizens were powerful forces for reform. Without their ten year commitment to this case, the dramatic improvements in peoples' lives that were documented in this study might have taken longer to achieve.
The remedy crafted by the federal district court judge made it possible to show that better lives for mentally retarded persons could be secured in the community. Further Pennsylvania's Deputy Secretary for Mental Retardation since 1980 brought experience from the Willowbrook litigation in New York State to bear on implementation of the Pennhurst decree. Her commitment to community programs has been reflected in policy and fiscal priorities, and it is largely as a result of her voice within state government that the Department of Public Welfare announced the eventual closure of Pennhurst Center. Finally, the persons serving as Special Master and Hearing Master brought unique expertise and force of personality to their respective roles. Together, they had a direct influence on the quality of the court protections and procedures developed pursuant to the decree.
Based on the Longitudinal Study's more recent qualitative and quantitative findings, what can we predict about the future of the mental retardation system as the court's presence recedes? As the study concludes, qualitative as well as quantitative findings indicate that the system established by the court is slowly-reverting to a state of entropy as the energy and drama that surrounded the case begins to dissipate. The services that were created for class members, although still distinguishable in quality and intensity from the rest of the system, are increasingly subject to the same external pressures and strains as the rest of the system.
Clearly no reform effort, whether brought about through litigation or other means, can maintain momentum and a sense of renewal indefinitely. Complex systems will only tolerate change for discrete periods of time before organizational forces begin to blunt the edges of such change and accommodate the reform into the larger political, social and administrative context. Thus, on the one hand it appears that the intensity of reform cannot be sustained given the organizational needs for stability and predictability. However, the Pennhurst experience shows that when the impetus for reform diminished, the system had moved to a distinctly higher plateau.
Recommendations
Both the quantitative and qualitative results of the Pennhurst Longitudinal Study provide guidance to future policy making at the federal as well as state and local levels, and also should be useful to local private service providers, the courts, advocacy groups, and others concerned with the development and improvement of programs for developmentally disabled persons. The recommendations that we feel flow from our work are presented in the following areas: Funding and Fiscal Policy, the Design and Administration of Community Service Systems, Capacity Building, the Role of Courts, and Quality Assurance and Monitoring.
Before presenting our final recommendations, however, there is one general statement that should be made that grows out of both the quantitative and qualitative studies -- there is an overriding need for the development of a coherent policy on deinstitutionalization at the federal level. Though the General Accounting Office made a similarly strong recommendation in 1977, the results of the Pennhurst study suggest that, though some steps have been taken in the interim, federal policies still remain contradictory and place severe constraints on those states attempting to develop more responsive and cost effective community-based systems of care. If adopted, many of the recommendations below -- particularly those aimed at the Title XIX program, would provide a consistent and purposeful federal agenda for the improvement of the lives of persons with mental retardation.
Funding and Fiscal Policy
-
The sum of our quantitative and qualitative work leads us to a strong recommendation at the federal level regarding the use of Title XIX Medicaid funds for Intermediate Care Facilities for people with Mental Retardation or ICF/MRs: access to ICF/MR reimbursement for institutional and community settings should be at least equalized.
Our data are powerful enough to suggest increased federal incentives for non-institutional care. However, such statements may not even be necessary. The data on individual growth, services, environmental qualities, family reactions, and public costs combine to suggest that, if ease of access and reimbursement rates were equal, state officials would quickly see the payoffs of shifting to community-based service systems. Some advocates argue that Title XIX funding should be dramatically reduced in institutions in favor of community programs. We leave that balance to the political process and stand with our inference that ease of access and reimbursement rates should be made at least equal.
-
The regulations for small ICF/MRs were not suited to the design of the Pennsylvania community system, and impeded the successful utilization of the program. For a state with a system like Pennsylvanias, with a large number of relatively small service providers, the need for large capital outlays for construction or renovation eliminated many of these agencies at the outset. The medically-oriented character of the regulations was also a disincentive in that conversion of existing CLAs was likely to result in a more hospital-like and less normal atmosphere. Therefore, Fe recommend a liberalization of existing regulations to preserve the home-like character of small facilities and to ease access to the .program among small providers.
-
The potential availability of federal funding under the Home and Community Based Waiver Program M 97-35, Section 2176) became a major affirmative factor in the final settlement of the Pennhurst lawsuit. Yet the most recent revisions of the suburban county waiver applications, designed specifically to facilitate the closure of Pennhurst and the creation of less costly alternatives in the community have been rejected by the federal Health Care Financing Administration (HCFA). If Pennsylvania cannot secure federal approval to transfer Title XIX funding from Pennhurst as class members move to the community, we think that placements of those remaining at Pennhurst will slow or stop. Despite a commitment to close Pennhurst by June 30, 1986, the Commonwealth will be very hard-pressed to find the money needed to fund the 100% state funded CLAs. We strongly recommend that administration of the community services waiver be made consistent with the original congressional intent to provide cost-effective alternatives to long-term institutional care. Further, HCFA should give special consideration and impetus to uses of the waiver program in those states, like Pennsylvania, that are pursuing significant restructuring of all or a portion of the service system.
-
Based on our cost study and our knowledge of other states, it is clear that federal Title XIX reimbursement is essential for any continuation of the trend away from segregated care for people with mental retardation. Our work on qualities of environments, in turn, suggests that the current ICF/MR standards are largely inappropriate for very small community-based programs. To state officials we recommend that, in the absence of signficant revisions in the ICF/MR program recommended in #2 above, efforts should be made to avoid attempts at restructuring small group homes to fit the medically oriented standards of the ICF/MR program. The design and structure of community-based service systems should not be unduly influenced by carryovers from the service model that is being supplanted. Thus, we recommend a deemphasis of the so-called "4 to 15 beds" ICF/MR program in favor of the more flexible waiver program.
-
As community services become more mature and represent a more significant part of the total mental retardation system, the issue of staff salaries and parity between state and community staff will have to be faced. If the aim of the community system is to provide a stable living environment for mentally retarded persons with a range of disabilities, then community staff should be paid at a level that will ensure the recruitment and retention of qualified personnel.
-
Because our cost analyses showed that community-based care was less expensive than Pennhurst, but that nearly all of the difference was caused by lower wages and benefits for community program employees, we recommend that administrators and advocates at all levels avoid the claim that tax dollars can be "saved" by switching to community-based services. If the above recommendation is implemented, costs for serving similar individuals in the two settings will become nearly equivalent. However, for people and systems similar to the ones we have studied, we predict that the value (i.e., the amount and quality of service rendered versus the amount spent) will still favor community-based care. We therefore recommend substitution of this latter point in place of the primitive and misleading 11saving money" argument in policy debates.
The Design and Administration of Community Service Systems
The quantitative and qualitative research in Pennsylvania leads to several clear implications for the organization of service systems. Most are relevant to state officials and local program implementers, although some of the implications are also aimed at the federal level.
-
As noted in the introduction to this section, a clear federal policy on deinstitutionalization is imperative to facilitate the orderly development and expansion of community-based care. Such a policy should apply across agencies and departments and should influence system design issues in income maintenance, housing construction and rent subsidy, medical services, long-term care, and social services.
-
The choice of funding streams is overwhelmingly important to the design and character of community service systems. For Pennsylvania's system of very small community living arrangements (CLAs), the ICF/MR "four to 15 beds" program had several serious drawbacks. Nearly all of Pennsylvania's CLAs served just three people, and court cases in the state had established that settings with "three or fewer unrelated individuals" required no zoning variance in order to operate. To operate programs of four to 15 beds, however, many providers for the first time were forced to ask for zoning variances. Many facilities never opened because of neighbor opposition. We therefore recommend that the lower limit on ICF/MR beds be eliminated in order to stimulate the development of smaller, more normal living arrangements.
-
The interviews associated with qualitative analyses strongly indicate that state mental retardation program officials cannot carry out complex system change without the cooperation of other state generic agencies including Medicaid, income maintenance, social services, housing, vocational rehabilitation and labor. We recommend that cooperation with other agencies in the form of cooperative agreements, should be secured as early in the planning for deinstitutionalization as possible. Issues to be dealt with include the participation of mental retardation officials in the certification of community programs for Title XIX, input into the rate-setting process, availability of responsive day programs, use of state construction funding, state supplementation of SSI benefits, and use of social services block grant funding.
-
The qualitative analyses further indicate that inter- and intra-agency planning at the state level is crucial to the success of any comprehensive deinstitutionalization activity. There must be a commitment to such planning at the highest level of the state's human services agency in order to ensure a commitment of staff and resources to the process. Further, inter- and intra-agency planning should have a direct connection to funding sources and the development of community capacity.
-
Our qualitative analyses show that deinstitutionalization of a state facility usually implicates communities beyond a particular service area. Therefore, we recommend that regional planning be initiated to ensure an equitable allocation and maximization of scarce resources such as specialized medical care and behavioral expertise.
-
Our observations of the-process of deinstitutionalization in the Pennhurst case leads to our recommendation that implementation is best managed by a team of individuals who report directly to the state mental retardation program official and who are freed from other agency obligations. The Pennhurst Implementation Team, which functioned in this fashion, proved invaluable to the success of the process.
-
Our study of the feelings of families in the deinstitutionalization process leads us to recommend that any good community or institutional service system should provide a clear and meaningful role for the families of people (particularly adults) with mental retardation. This sounds elementary, but it is far from easy to achieve. The courts have been in turmoil about the rights of the parents of adults who live in settings supported by public money. Are the parents automatically to be accorded the status of legal guardian? Must every adult with mental retardation be taken to court to be judged incompetent before a guardian can be appointed? Should parents or other family members have the power to veto community placement?
In the Pennhurst situation, family veto power would have precluded community placement for 72% of the people at Pennhurst, and would thereby have prevented the vast improvements in well-being that we have measured. We must therefore recommend to state legislators, state officials, and local program providers that total control of the lives of adults under public care should not be ceded to parents or other family members. Rather, the design of service systems should clearly and formally assign a valued role in shared decision making to families, on an equal footing with professionals and others involved in care. This idea is already embodied in most processes of "individual habilitation plan" development under the court order.
In addition, recognizing their special role, families should have a special appeal process available to them. Comparable to "due process" hearings required by laws governing education of children with handicaps, such hearings should be prepared to deal especially with concerns about medical care, the possibility of continued growth and development, and security and permanence of any residential placement. In the Pennhurst case, a court-appointed Hearing Master conducted proceedings in which the concerns of families were treated with dignity. Most observers agree that the hearings had a strong positive impact on the confidence and peace of mind of the families.
-
Our experience with the consumer interviews indicates that local service systems will benefit from structurally increased opportunities for consumer participation. This goes beyond encouraging consumer participation in the development of the individual habilitation plan toward regular surveys and genuine support for consumer groups, conferences, and membership on planning and advisory bodies. We strongly suggest that program administrators and providers make it a policy to solicit and support the voices of consumers. Our data even suggest that the quality and clarity of consumer input may increase sharply over time.
-
The Pennhurst Study has not settled several important questions about system organization, among which are the optimal size of community residences, the reliability and validity of licensing and inspection procedures, the merits of the shift versus live-in staff system, public versus private service provision, and profit versus nonprofit providers. These questions about the characteristics of community services that work best could not be addressed in the Pennhurst work because we were only studying one system. Comparative studies of systems in several states are necessary to get at these issues scientifically, and we suggest that such studies are needed. Only the federal government can support this kind of interstate research.
-
Both quantitative and qualitative data indicate that case management is a critical function in any community service system. In the Pennhurst case, Judge Broderick issued an order that 30 case managers be hired and assigned to serve about 900 people, resulting in caseloads averaging 30. The quantitative data hint, and our years of discussions with knowledgable key actors strongly suggest, that case managers must have sensible caseloads to be functional at all. We do not have sufficient comparative data to pin down the optimal number, but the prevailing opinion in our study area strongly suggests caseloads of less than 50.
-
Even with the court scrutiny in Pennhurst, case management is a fragile function. in recent years, vacancies in case management positions have gone unfilled for long periods in many counties, sometimes because of hiring freezes, and sometimes for reasons that are not clear. State and local officials should, if they believe in the value of reliable case management, work to obtain valued status for these positions in civil service hierarchies and salary levels.
-
The court, through its Special Master, also mandated a specific format and an independent review process for individual habilitation plans. Qualitative findings indicate early complaints among service providers that the format and the review process were overly rigorous, cumbersome, and slow. Quantitative data, on the other hand, suggest that higher quality plans resulted, and people with this court protection may have received more careful attention and may have displayed more behavioral progress than those without it. On balance, the research team recommends that state officials should implement simple and consistent formats for individual plans, and either state or local administrators should create a mechanism for periodic independent expert review of such plans.
-
The Pennhurst Study data have been utilized extensively over the years by Pennsylvania, the counties, individual service providers, and the plaintiffs in the case. The data have been used for long-range and short-range planning, for selecting individuals with certain characteristics for placement in certain settings, for reporting requirements, and even for projection of costs to serve specific individuals in community settings. We infer from this demand for data that, at least in our area, the existing information systems are primitive at best. The systems that do exist are old in design, often borrowed from mental health or medical applications, and do not contain the kinds of data that would be most useful for planning and evaluating community systems. Most of our experience in other states reveals similar situations. We therefore recommend that individualized data base construction should be an integral part of service system design and that leadership in this area should come from the state program level.
Capacity Building
Apart from the structure of community service systems, there are a number of issues that involve gradual processes of strengthening and enhancing services. Building the capacity to perform certain functions will require leadership, technical assistance, training, and confident attitudes among the principal actors. In our years of observing the Pennhurst situtation, we have noted a number of key elements in capacity building that may be useful in other states and localities.
-
The Office of the Special Master appointed by the court took on a significant role in capacity building, including recruiting and training case managers, giving technical assistance to service providers, sponsoring workshops, and making public appearances designed to enhance the image of people with mental retardation. This role was, in our view, a positive one, and we infer that activities designed to build capacity in the local service delivery systems are appropriate for court enforcement mechanisms. The role of compliance monitors can thus evolve beyond that of watchdog toward the active facilitation of exemplary programs and new technologies.
-
In Pennsylvania there was widespread skepticism about the capacity of community systems to provide adequate care for people with severe or profound impairments. In the Pennhurst case, we have seen that the most effective way to build capacity and the belief that it can be done is to move those with the most serious disabilities to the community first. The court ordered that special preference for early placement be given to children. Although there were only 61 children at Pennhurst, they had extreme degrees of mental retardation and other handicaps. Because the system was forced to cope, people learned early that very disabled individuals were appropriate for, and able to, benefit from less segregated and smaller settings. We recommend that deinstitutionalization activities include a means for moving some portion of more disabled institutional residents into the community in the first wave of placements.
-
Our field experience focused primarily on residential settings, but our strong suspicion from a variety of sources in the study, including the consumers themselves, is that the next issue that needs major attention is the availability and quality of day programs. We have had the opportunity to study a system in transition from a total institutional model to a dispersed community residential model. The data show that Pennsylvania's community residential model has overwhelming advantages, but the data also lead to the inference that day programs are not very different from decades-old workshop and adult day care models in other parts of the state and the nation. We suggest that, at least in Pennsylvania, the issue of residential settings has been resolved in favor of the community, but that day services should be the next target for capacity building through technical assistance and innovative demonstration programs.
-
The quantitative data on neighbor attitudes suggest another implication for capacity building. As we interpret the data, the strategy of "just moving in" appears to have merit. That is, when planning a new community residential setting, if it is legally possible to avoid going to formal hearings and systematically notifying the prospective neighbors, it may be best on balance to do so. Our interviews with neighbors indicated that few neighbors would be opposed in the absence of outside influences such as vocal opposition at hearings or unfavorable media attention. Moreover, the average reaction is negative, but small and short-lived. Finally, citizen opposition to potential community living arrangements in their neighborhoods seems to be much stronger than opposition to actual residences. Hence it may be better to avoid direct confrontation with neighbors initially in order to foster the capacity of neighborhoods to assimilate and accept new neighbors with mental retardation over time.
-
All of our analyses suggest that, in order to ensure the stability of community placements for more disabled individuals, residential and day program providers must have access to backup services including behavioral and crisis intervention as well as specialized medical assistance.
-
Our observations of the Pennsylvania system lead us to conclude that growth in community services -- especially when accomplished in a short period of time -- will alter the character of the local delivery system. Specifically, service agencies will inevitably become more bureaucratic and small providers may have difficulty in making the transition to a more complex system. In order to protect the flexibility inherent in a system with multiple providers, public mental retardation officials should take steps to guard against too much centralization and uniformity. Such steps should include timely reimbursement schedules to ensure the cash flow of the small provider as well as the creation of service guidelines that maximize flexibility in the provision of services at the provider level.
-
While some degree of staff turnover in community residential programs may be inevitable and to some extent desirable, our qualitative analyses suggest that too much turnover weakens parental and family confidence and threatens the stability and well-being of clients. We therefore recommend that steps be taken to improve working conditions (e.g., regularize hours, enrich staff/client ratios), improve compensation, and better equip direct service staff to cope with the needs of more seriously disabled people.
The Role of the Courts
Because this was a study of deinstitutionalization that was ordered by a federal court, we have paid close attention to legal issues. Several issues related to the use of litigation to bring about system change have arisen that seem to us to have implications for federal policy, and also in some cases for states and advocates.
-
Our analyses of compliance mechanisms in Pennsylvania and in other states suggest that, to the extent feasible, court monitors and masters should not be given responsibilities that mix both programmatic (e.g., traditional state policy functions) and enforcement duties in order to minimize the conflict between the court-appointed official and the state defendants, and to maximize the degree of "ownership" of court-mandated reforms by state and local program officials.
-
Based on our comparative analysis of litigation in Pennsylvania and other states, compliance entities such as special masters, should be not be involved day-to-day planning activities (e.g., assessment of clients, determination of specific programmatic resources, identification of providers, etc.), but should devote their energies to broad system planning including the establishment of a schedule for key compliance events and the various roles that system participants will play. Involvement in the specifics of planning relieves program authorities from responsibility and disassociates the plan from the ongoing mental retardation system. The most constructive role that compliance entities can play is to ensure that plans are implemented according to a precise schedule and that resources and funding are attached to each critical milestone.
-
The experience with the Office of the Special Master in Pennsylvania strongly indicates that funding levels for compliance masters and monitors should be kept at a modest level in orders to minimize controversy and to maintain the focus on enforcement and compliance rather than on the compliance mechanism itself.
-
In the case of Pennhurst, despite the fact that the lawsuit clearly polarized groups who might otherwise have been allies, it seems to us that the results over 600 people moved to vastly enhanced living conditions in six years would not have been achieved by any other method. Thus, we suggest that litigation can be a force for the reform of service systems. However, our comparative analyses in other states also suggest that litigation -- when aimed primarily at institutional improvement -can hamper the orderly transition to community services.
-
At the federal level, we suspect that the role of the courts is declining. The U.S. Department of Justice has apparently altered its position on the Pennhurst case after eight years, and failed to support the plaintiffs' arguments in the most recent Supreme Court hearing. Moreover, the Justice Department appears in general to be more reluctant to join in actions against public agencies or conditions that may threaten the civil rights of people with handicaps. In addition, our legal analyses suggest that the current Supreme Court is not likely to affirm additional constitutional and statutory rights for people with mental retardation. We therefore suggest that in the future advocates will concentrate their efforts in state courts, in administrative forums and in the pursuit of regulatory and statutory reform.
-
The Pennhurst court order was just that, an order, and as such was one of only two in the field of broad scale litigation in mental retardation. The fact that it was not a consent decree seems to us to have made the situation more adversarial than other cases analyzed. The absence of a consent decree also contributed to the degree of power and resources that the court conferred on the Office of the Special Master.
-
We infer that consent decrees, where feasible, are more effective tools of reform since they represent a joint statement of purpose by the plaintiffs and defendants. Federal, state, and local officials, as well as advocates, providers, and families, are all interested in the question of whether litigation results in the creation of a privileged class of people who received special attention and resources. In the Pennhurst case, this definitely did happen. Even our quantitative data showed more service rendered to, and more behavioral growth among, the class members than among otherwise similar people. Whether this is just seems to us to be a question of whether the wrongs being redressed were serious enough to justify a strong remedy. Given the long history of failed attempts to improve conditions at Pennhurst, the evidence presented at the trial, and the systemic benefits that accrued to others as a result of the litigation, the remedy in this case appears warranted.
-
Another concern related to the impact of litigation is whether others are deprived of resources that they would otherwise have enjoyed. In Pennsylvania, there is very little evidence to support the assertion that the litigation drew resources away from other areas of the state. There are, however, a few strands of evidence suggesting that non-class members in the Southeast Region might have been affected. Waiting lists for CLAs in the Southest Region, although unreliable and poorly maintained, seem to have increased at a higher rate compared to the rest of the state. Reports from some knowledgeable informants also indicate that it has been very difficult for non-class members' families to find day programs in recent years. We cannot, of course, be sure that either of these phenomena was caused directly by the court order. On the other hand, the court order materially benefited other clients in the system when the special requirements for individual plans and monitoring for class members were extended to non-class members who lived with a class member, or whowere served by an agency that also served class members. In other states analyzed, the conclusions are similar. In Maine, for example, the litigation appears to have benefited the entire system because it became the basis for implementation of broad statewide reforms. Thus, litigation can engender discrimination among equally needy groups, but does not necessarily create special class status at the direct expense of others.
Quality Assurance and Monitoring
The Pennhurst Study has helped Pennsylvania to implement a new quantitatively-oriented monitoring system. The instruments and techniques developed by Temple University for collecting individual, family, and environmental information are now part of the formal ongoing monitoring system in Pennsylvania. These instruments and techniques differ from most prior forms of monitoring in that they are centered on people rather than the programs through the collection of quantitative information about the well-being of every person in the service system. We believe the quality assurance implications presented below are among the most important arising from the Pennhurst Study.
-
One major argument against the idea of decentralized, integrated service systems like the community living arrangement system in Pennsylvania has been that such dispersed systems are very difficult and costly to monitor. Our experience strongly contradicts that argument. The Temple University monitoring mechanism comprises one part of a comprehensive monitoring system for community settings that provides intense and frequent scrutiny from several levels for a reasonable cost. We conclude that it is in fact feasible, cost-effective, and desirable to create individually oriented and quantitative monitoring systems for community service systems. We recommend that the policies governing existing and future community service systems require such systematic monitoring over and above minimal licensing reviews performed for basic health and safety issues.
-
We conclude that the quantitative monitoring function should be centralized as much as possible. For one thing, only then can comparisons be made across local jurisdictional boundaries. For another, this is one area in which the payoff from minimizing duplicative and contradictory inspections is clear and immediate. Another is that using some variety of third party as a monitoring entity can have several important advantages, among them the minimal appearance of conflict of interest, a perception of objectivitiy, and the participation of pure fact finders who are not part of an enforcement agency.
-
Another aspect of quality assurance that we highly recommend is the inclusion of systematic surveys of families and consumers themselves. Both are extremely low in resource demands and can produce information that could be acquired in no other way. It is good policy to try regularly to identify families and consumers with serious complaints, which they may be afraid to voice to service providers, in order to prevent deterioration of conditions and to serve as an early warning system.
-
We think it is extremely urgent that all users of standards, licensing, or any kind of environmental measures pay close attention to two issues that we have faced continually: independence and reliability. Here we use the term independence to mean that any environmental measure of "quality" should be independent of the functional level of the people living in the environment. Not one of the program-oriented environmental ratings used in the Pennhurst Study is free of this kind of bias and we suspect that many measures suffer from this shortcoming. This means that a program serving people with more intense needs will automatically receive lower quality ratings. Like the need for measures of intelligence that are free of "culture bias," there is a need for measures of program quality that are free of "functional level bias." Examination of existing measures and standards should begin immediately, and a national level attempt to develop independent measures should be a high priority.
-
The second issue, reliability, means that a program's ratings on any standards or environmental measures should not be influenced by the biases of the site reviewer. If the measures are unreliable in this sense, then service providers will inevitably realize it after just a few reviews, and are likely to become cynical and treat the entire procedure as a game devoid of meaning. We are not aware of any national level or state level monitoring, licensing, standards, or program audit instruments for which adequate reliability data have been made available. Not only should the users of these instruments test for reliability, but they should also take action where necessary by changing the instruments and/or intensifying rater training. In other words, it is time to apply some elementary rules of scientific procedure to the assessment of program quality.
-
Finally, it seems to us that many of the environmental measures, standards, and licensing/inspection tools or program audits that have been developed have contained the assumption, either explicit or implicit, that a program that does well on this review will render good services and produce good outcomes among the people it serves. Perhaps we are past the time when this "outcome assumption" is needed for environmental measures. Many aspects of the living situation are related to basic rights, others involve simple sound management, others involve comfort and safety, and not all need to produce growth and development. We have worked very hard to test the "outcome assumption" for a variety of environmental measures, and have found only relatively weak correlations and hints of association. We are beginning to consider the idea that, because outcomes themselves are known to be reliably and economically measurable, perhaps new approaches to environmental measures and standards will abandon the "outcome assumption." Measures and standards should instead focus on simple, observable, reliable facets of the setting without making the "outcome assumption," but rather require (or even collect) outcome and service data for every individual in the setting. In fact, that is the direction this research team would recommend for the future.
-
Recently, we have observed changes in court-ordered services that are characterized by a decline in staff commitment and understanding of the ideology that brought about the creation of community services. Instead, some staff increasingly regard their jobs as a set of tasks unrelated to the larger aims of normalization and habilitation. As a result, we strongly suggest that the expansion of services should be accompanied by a redoubled effort to communicate program values and ideology in order to ensure that service approaches do not become over-bureaucratic, routine, and standard. Without the continued orientation of staff to the norms that generated the development of institutional alternatives, system administrators and providers run the risk of recreating custodial care in the community.
APPENDIX 2-1: OVERVIEW OF THE STATE, THE REGION AND THE COUNTIES
I. THE COMMONWEALTH
The Commonwealth of Pennsylvania, a Mid-Atlantic state, is bounded on the north by Lake Erie and New York State; on the east by the Delaware River, and the states of New York and New Jersey; on the south by Delaware, Maryland and West Virginia; and on the west by West Virginia and Ohio. The state covers a total area of 45,000 square miles.
Pennsylvania was originally called the “Keystone State” because of its central location among the thirteen colonies. The nickname persists due to the state’s development as an important economic center along the eastern seaboard. Pennsylvania is the nation’s fourth most populous state with a population of almost 12 million12 million persons. It has a population density of 260 persons per square mile and a per capita income of $7,000. The two largest cities in the state are Philadelphia (population 1,800,000) in the southeast, and Pittsburgh (population 460,000) in the west.
Mining, manufacturing, farming and tourism are the major contributors to the state’s economy. Pennsylvania produces nearly all the country’s hard coal and one-fourth of its steel. Steel and iron manufacturing are the largest single industries in the state. The steel industry is concentrated mainly in the western part of the state, with other centers at Bethlehem (Northhampton County, near northern Bucks County), and in the Harrisburg-Carlysle area. In 1970, Pennsylvania had over 17,000 manufacturing enterprises employing about 1½ million workers (34% of the states labor force). The total production of such enterprises was valued in excess of $42 billion.
Despite the emphasis on manufacturing and the steady growth of cities and towns, large areas of the state are still rural and many counties are primarily agricultural. In 1976, Pennsylvania had the largest rural population in the United States. Pennsylvania ranks high in its production of grains, truck crops, tobacco, fruit and livestock. In the Southeast Region, the land is fertile and well-farmed. The state’s richest soil is found in and around Lancaster County (which adjoins Chester County to the west). In 1977, it was estimated that the size of the average farm was 140 acres and had an average value of about $161,000. This indicates that agriculture is primarily a family rather than corporate business in the state.
Though the Democrats outrank Republicans in part registration in the state, the Governor and two U.S. Senators are Republicans. The state legislature is currently controlled by the Democrats. Historically the State House has been occupied by Democrats or moderate Republicans. On the county level, however, elected local commissioners in many areas of the state have been predominately Republican. This political difference, according to some of those interviewed in the state, has contributed to conflicts between local government and Harrisburg, the state’s capital.
II. THE REGION
The five counties in the Southeast Region make up what is know as the Delaware Valley or Tri-State Area. These five counties--Montgomery, Chester, Delaware, Bucks, and Philadelphia--also comprise the Philadelphia Standard Metropolitan Statistical Area. The overall Tri-State Area encompasses the Southeast Region of Pennsylvania, five neighboring New Jersey counties and one Delaware State county. The Area is a major center for shipping, transit, manufacturing and industry.
The four Pennsylvania counties surround Philadelphia rely on a mixture of farming and industry to support their local economies. Each of the counties encompasses suburban communities whose residents commute to center city Philadelphia to work. Philadelphia, a city/county, is the state’s largest metropolitan area and is surrounded by some of the state’s richest and most fertile farmland. In general, the Southeast Region’s central local (close to other states and with access to port facilities) has encouraged the development of manufacturing and industry.
There are three different forms of local government in the five county area. Bucks, Chester, and Montgomery Counties share a county commissioner form of government. The commission is made up of three representatives--one from the minority and two from the majority party in the last election. In the primary, the Republican and Democratic parties select two candidates who then vie for the three available seats in the general election. Delaware County, in contrast, is one of six counties administered by “home rule,” and Philadelphia has a combination city/county governmental structure.
The Southeast Region includes a total of 42 community living arrangement providers authorized to serve 820 mentally retarded individuals in small group residences. There are proportionately more CLA providers in this region compared to other regions in the state. The number of actual residences, however, is small than a comparable region in the western part of the state. Additionally, there are 22 private licensed facilities serving mentally retarded persons in the area.
III. THE COUNTIES
A. Philadelphia City/County
Philadelphia City and County cover the same geographical area, with borders on the Delaware River and the Counties of Bucks, Delaware and Montgomery. Covering an area of 127 square miles, Philadelphia ranks fourth in size among cities in the United States. It is also the fourth largest city in terms of population with a total of 1,800,000 residents. The population, which has declined slightly in the last decade, is entirely urban, with about 14,000 persons per square mile. Among the five counties in the Southeast Region, Philadelphia has the lowest per capita income--approximately $6,200. The mediate age in the city is 32.6 years.
Philadelphia’s strategic location on the Mid Atlantic has made it a major manufacturing, distributing and transportation center. It is the most heavily industralized county in the state, with nearly 16% of Pennsylvania’s manufacturing workers, and one out of five plants. The two largest industries are apparel and food-processing. The total available labor force numbers about 800,000, of which 200,000 are employed in manufacturing.
Philadelphia is also a center of higher education in the state with 32 colleges, universities, professional schools and seminaries. In 1977, 253,000 students attended Philadelphia’s public, private and parochial schools.
The city is governed by a mayor/council form of government with the Mayor, who is a Democrat, serving as the executive officer. The city council is comprised of 17 members and is currently controlled by the Democrats. Unlike its neighboring counties in the Southeast Region, Philadelphia has traditionally had a Democratic administration. There are also three elected county commissioners whose primary responsibility is the supervision of elections.
Philadelphia has 18 community living arrangement providers authorized to serve approximately 280 persons. There are also five private licensed mental retardation facilities in operation in the county.
B. Chester County
Chester County lies in the southeast corner of the state, bounded on the south by the State of Delaware and Maryland; to the east and north by Delaware and Montgomery Counties; and to the west by Lancaster, Berks, and York Counties. Most of the area is farmland, but the eastern portion of the county has recently become a residential area reflecting the western spread of metropolitan Philadelphia past Delaware county. The total land area is 760 square miles, making it the largest of the five counties in the Southeast Region.
Traditionally an agricultural county, Chester has grown at a slower rate than the rest of the state, although in the recent past, suburban development has hastened population increases. In 1976, the county had just under 300,000 residents; the projection for 1985 is 385,000. Population density, however, is still less than 400 persons per square mile. Currently, 45% of Chester is classified as urban and 55% rural. The median age is 27 years, and the per capita income is $7,000. Chester has a larger concentration of families with incomes over $10,000 than any other county in the Southeast Region. Of the 85,000 dwelling units in the county, 70% are owner-occupied.
Historically, agricultural and horticultural products have been important to the county’s economy. Chester County is known as the “mushroom capital of the world.” Mushrooms, as well as greenhouse products, roses and dairy products, continue to provide a major source of income. The county’s largest industry, in terms of employment, is the production of primary metals. However, the chemical industry and food-processing are experiencing substantial growth. The county’s estimated available workforce is 137,500.
Chester County has three county Commissioners--two Republicans and one Democrat. The area has 12 independent school districts that provide education from kindergarten to 12th grade. The student-teacher ratio is about the same in Chester as it is in other Southeastern counties. During the 76-77 school year, there were 61,000 students. The county also has 34 private schools, 22 parochial schools and four colleges. An “Educational Service Center” provides special education and vocational education for exceptional children in various parts of the county.
Among the 12 hospitals (with a total of 4,830 beds) in the county are Pennhurst State Center and the Devereaux Foundation. There are four community living arrangement providers in Chester County authorized to serve 105 retarded individuals. The county also has seven private licensed facilities.
C. Delaware County
Delaware County is in the far southeastern tip of the state. It is bounded on the north by Montgomery County; on the east by Philadelphia; on the south by the Delaware River and the State of Delaware; and on the west by Chester County. It encompasses 182 square miles and is the third smallest county in Pennsylvania (Philadelphia is the smallest).
Though one of the smallest counties, Delaware is the fourth largest in the state in terms of population. Once very rural, it is now about 97% urban. Its population, 584,000 persons, makes it one of the most developed counties in the state although resident growth is beginning to decline. Population density is about 3,100 persons per square mile.
Households and families number an estimated 191,000 and 152,000 respectively. Over half the households have incomes over $10,000 which ranks Delaware close to Chester and Montgomery Counties in terms of affluence. The per capita income is $7,500--$300 higher than the state average.
Despite its population density, Delaware still derives an important part of its income from agriculture--particularly truck farming and horticultural products such as mushrooms and cut flowers. However, in terms of employment and value of production, manufacturing is the leading industry. There are 470 plants employing 40,000 employees, with a total product value of $43 million. The largest industries are transportation equipment, non-electrical machinery, and petroleum refining.
In terms of government, Delaware County differs from the other four counties in the region in that it is a Home Rule County comprised of an elected county executive and five councilpersons. The five council members function in a part-time capacity.
Delaware County has 15 school districts and county public school systems. In the 77-78, 88,000 students were enrolled. There are, in addition, 58 parachial schools, 27 private schools and three vocational-technical schools. About 60% of the county’s students graduate from high school, and 52% go on to college. There are also 14 colleges and universities in the area including Pennsylvania State University and Villanova University.
There are four community living arrangement providers in Delaware authorized to serve 103 persons. There are also four private licensed facilities offering residential services to mentally retarded persons within the county.
D. Montgomery County
Montgomery is the most central of the five counties and is surrounded by Bucks County to the northeast, Berks County to the northwest, Philadelphia and Delaware Counties to the south, and Chester to the southwest. It is the only one of the five that does not share a border with another state.
The population of Montgomery County is 640,000 spread over an area of 480 square miles. Municipal population densities range from 11,000 per square mile in Jenkintown (near Philadelphia) to only 145 per square mile in Upper Hanover (in the northwest corner of the county). Of the total area, between 80% and 85% is classified as urban. The eastern portion of the county is the most heavily developed and is made up of the compact commuter suburbs of Philadelphia. However, this area represents little more than a quarter of the county’s entire area. County planning maps indicate that the rest of the county is relatively undeveloped and sparsely populated. Despite the fact that so much of the county is relatively undeveloped, Montgomery County is the state’s third most populous county, and is said to be the wealthiest.
Of the county’s 16,000 registered businesses, 1200 are manufacturing establishments which employ about 90,000 workers. Also included are 1500 construction companies, 4,000 retail outlets, and 4,000 service establishments. Most of the industry in the county is concentrated along the Schuylkill River, the Pennsylvania Turnpike, and the North Penn area. Montgomery County is more diversified with respect to trade and industry than the other counties in the region. In terms of exports, the county ranks with Philadelphia in numbers of exporters, and is fourth in the state with respect to the value of its exports.
Like Chester and Bucks, Montgomery County is governed by three elected County Commissioners. Currently, there are two Republicans and one Democratic in office.
The county is divided into 23 school districts, with 200 public schools. In addition, there are 134 private and parochial schools located in the area. Ten community living arrangement providers authorized to serve 238 persons, plus three private licensed facilities are in operation in Montgomery County.
E. Bucks County
Bucks County is the furthest north of the five counties in the region. Lying on the eastern edge of Pennsylvania, Bucks shares its eastern border with New Jersey across the Delaware River. To the south, Bucks borders on Philadelphia; to the west, it shares a border with Montgomery, Lehigh and Northhampton Counties.
Bucks covers an area of 620 square miles and has a population of between 450,000 and 500,000 persons--76% of which is urban. Northern Bucks County is far enough away from the metropolitan Philadelphia area to be relatively unaffected by population spill-overs in recent years. Nevertheless, the county as a whole has experienced an 18% population increase over the last ten years. Population density averages between 600 and 700 persons per square mile.
There are an estimated 123,000 families and/or households in the county. In 1975, the per capita income was lower than most of the other counties in the region. The income ranges are wide, however, and encompass some very wealthy households. There are now about 154,000 housing units in the county which reflects a 27% increase over the last ten years.
Industry in the county is relatively diverse. Manufacturing employs about 62,000 workers or 38% of the total workforce. Retail and wholesale trade employs about a quarter of the workforce. However, the biggest growth is in the area of professional services (over 100% increase in the last few years) and also in transportation, utilities and communications (70% to 75% increase). Bucks, like Chester and Montgomery, has two Republican Commissioners and on Democrat commissioner.
The county is divided into 14 separate school districts. Six community living arrangement providers authorized to serve 94 residents, and three licensed private facilities are available for mentally retarded residents in Bucks County.
This brief picture of the counties in the Southeastern Region of Pennsylvania gives the indication of a reasonably prosperous and diverse area. It shows an area with significant higher education and other training resources. Further, with the exception of Philadelphia, it indicates an area growing in population and industry. It also reflects a region that is relatively well-endowed with resources for mentally retarded persons. All of these characteristics, in fact, may help to explain why the plaintiffs chose to focus the litigation on Pennhurst and the Southeastern Region rather than on another, less developed part of the Commonwealth.
IV. THE STATE MENTAL RETARDATION SYSTEM
There are several characteristics of Pennsylvania state government and of the mental retardation system that distinguish the Commonwealth from other states and that should be noted prior to the discussion of the litigation. They include the following:
-
The general human services system in the state is directed by an umbrella agency, the Department of Public Welfare (DPW), which has responsibility for social services, juvenile justice, child welfare AFDC, Medicaid, mental health, and mental retardation.
-
The Department of Public Welfare manages the human services system through a complex organizational system that includes regional offices, county welfare departments, and county mental health and mental retardation programs throughout the state.
-
The major state statute governing the states mental retardation program is the Mental Health and Mental Retardation Act of 1966. It is said to be the first statewide statute to mandate community-based mental disabilities programs in the country.
-
The mental health and mental retardation system in the state is a county/state partnership with the state providing 100% funding for residential programs, and 90% funding for all other services; the counties contribute the remaining 10% for other than residential programs.
-
The mental health and mental retardation program at the county level is managed by a county administrator appointed by the county commissioners.
-
Advocacy groups made up of parents of mentally retarded persons in the state have, in the last decade, been very successful in securing and elevating the mental retardation program to a status comparable to that of mental health in the Department of Public Welfare.
-
Significant strides have been made in the Commonwealth in the last eight years in the development of small community living arrangements (CLAs). Though growth has levelled off recently, the program now encompasses 1256 such facilities.
-
Though the Commonwealth has expended large sums of money on the development of community living arrangements, the majority of the funding in the mental retardation system still goes for the support of state institutions.
APPENDIX 4-1: BEHAVIOR DEVELOPMENT SURVEY1
PERSON’S NAME _____________________________________________________________________
[OPTIONAL]
BSU NUMBER _______________ - _________________________
Card # _____
Current or Prior Institutional Case Number _________________________
SITE CODE (leave blank) _________________________
************************************************************************************************************************
RESIDENTIAL PROVIDER AGENCY ______________________________________________________
RESIDENTIAL FACILITY LOCATION -- OR -- INSTITUTIONAL COTTAGE NAME
STREET (or Cottage) __________________________________________________________________
APT. COMPLEX NAME ________________________________________________ APT. #__________
CITY, TOWN______________________________________ STATE______________ ZIP___________
************************************************************************************************************************
RESPONDENT’S NAME________________________________________________________________
JOB TITLE________________________________________ WORK PHONE______________________
INTERVIEWER’S NAME________________________________________________________________
************************************************************************************************************************
PARENTS, NEXT OF KIN, OR PRIMARY CORRESPONDENTS
NAME(S)____________________________________________________________________________
ADDRESS: STREET_______________________________________________ APT. #___________
CITY___________________________________ STATE____________ ZIP__________
TELEPHONE (_____)__________-____________________
************************************************************************************************************************
Temple University Developmental Disabilities Program/UAP
Evaluation and Research Group: November 1984
TODAYS DATEMONTH______/YEAR_______
PERSON’S DATE OF BIRTH MONTH______/YEAR_______
DATE OF ADMISSION TO CURRENT RESIDENTIAL PLACEMENT MONTH______/YEAR_______
TYPE OF CURRENT RESIDENTIAL PLACEMENT (Enter code number) _______
- Public Institution (e.g., Pennhurst, Embre e ville, Woodhaven)
- Private Licensed Facility
- Community Living Arrangement (CLA) Group home or apartment
- Community living arrangement (CLA) Minimal supervision
- ICF-MR, 4 to 15 beds
- Foster family placement
- With family or in own home
- Domiciliary care/board & care home
- Other _________________________
HISTORY
WHERE DID THIS PERSON LIVE IMMEDIATELY BEFORE COMING TO THIS SETTING? _______
- Pennhurst Center
- Woodhaven Center
- Embreeville Center
- Other state center _________________________
- Private Licensed Facility
- Other CLA
- Home
- Small ICF
- Other _________________________
IS THIS PERSON A PENNHURST CLASS MEMBER? _______
- YES
- NO
- DONT KNOW
COUNTY OF RESIDENCE (IF INSTITUTION, GIVE COUNTY OF ORIGIN) _______
- Bucks
- Chester
- Delaware
- Montgomery
- Philadelphia
- Other PA County (_________________________)
- Out of State Residence (State: _________________________)
LEVEL OF RETARDATION _______
- NOT RETARDED
- MILDLY RETARDED
- MODERATELY RETARDED
- SEVERELY RETARDED
- PROFOUNDLY RETARDED
IQ _______
- 70 or above
- 55 - 69
- 40 - 54
- 25 - 39
- 1 - 24
- Unmeasureable
SEX _______
- Male
- Female
RACE _______
- White
- Black
- Other
ADAPTIVE BEHAVIOR
VISION (Enter number) With glasses - - if used _______
4. No difficulty in seeing
3. Some difficulty in seeing
2. Great difficulty in seeing
1. No vision at all
HEARING (Enter number) With hearing aid - - if used _______
4. No difficulty in hearing
3. Some difficulty in hearing
2. Great difficulty in hearing
1. No hearing at all
AMBULATION (Enter number) _______
4. Walks with no difficulty
3. Limps or walks unsteadily
2. Walks only with help
1. Unable to walk
WALKING AND RUNNING (Check ALL that apply) With cane, crutches, brace, walker -- if used
_______ a. Walks alone
_______ b. Walks up and down stairs alone
_______ c. Walks down stairs by alternating feet
_______ d. Runs without falling often
_______ e. Hops, skips or jumps
_______ NONE OF THE ABOVE
SPEECH (Not including signing) _______
5. Speech easily understood
4. Speech somewhat difficult to understand
3. Speech very difficult to understand
2. Speech is not understandable but makes sounds
1. Makes no sounds
VOCABULARY (including signing) _______
5. Talks about action when describing pictures
4. Names people or objects when describing pictures
3. Uses names of familiar objects
2. Asks for at least ten things by their appropriate names
1. Is nearly non verbal
BODY BALANCE _______
6. Stands on tiptoe for ten seconds if asked
5. Stands on one foot for two seconds if asked
4. Stands without support
3. Stands with support
2. Sits without support
1. Can do none of the above
USE OF TABLE UTENSILS _______
7. Uses knife and fork correctly and neatly
6. Uses table knife for cutting or spreading
5. Feeds self with spoon and fork -- neatly
4. Feeds self with spoon and fork -- considerable spilling
3. Feeds self with spoon -- neatly
2. Feeds self with spoon -- considerable spilling
1. Feeds self with fingers or must be fed
EATING IN PUBLIC _______
4. Orders complete meals in restaurants
3. Orders simple meals like hamburgers or hot dogs
2. Orders soft drinks at soda fountain or canteen
1. Does not order food at public eating places
DRINKING _______
4. Drinks without spilling, holding glass in one hand
3. Drinks from cup or glass unassisted -- neatly
2. Drinks from cup or glass -- considerable spilling
1. Does not drink from cup or glass
TOILET TRAINING _______
5. Never has toilet accidents
4. Never has toilet accidents during the day
3. Occasionally has toilet accidents during the day
2. Frequently has toilet accidents during the day
1. Is not toilet trained at all
SELF-CARE AT TOILET (check ALL statements that apply)
_______ a. Lowers pants at the toilet without help
_______ b. Sits on toilet seat without help
_______ c. Uses toilet tissue appropriately
_______ d. Flushes toilet after use
_______ e. Puts on clothes without help
_______ f. Washes hands without help
_______ NONE OF THE ABOVE
WASHING HANDS AND FACE
_______ a. Washes hands with soap
_______ b. Washes face with soap
_______ c. Washes hands and face with water
_______ d. Dries hands and face
_______ NONE OF THE ABOVE
BATHING _______
7. Prepares and completes bathing unaided
6. Washes and dries self completely without prompting or helping
5. Washes and dries self reasonably well with prompting
4. Washes and dries self with help
3. Attempts to soap and wash self
2. Cooperates when being washed and dried by others
1. Makes no attempt to wash or dry self
CARE OF CLOTHING (Check all statements that apply )
_______ a. Cleans shoes when needed
_______ b. Puts clothes in drawer or chest neatly
_______ c. Puts soiled clothes in proper place for laundering/washing without being reminded
_______ d. Hands up clothes without being reminded
_______ NONE OF THE ABOVE
DRESSING _______
6. Completely dresses self
5. Completely dresses self with verbal prompting only
4. Dresses self by pulling or putting on all clothes with verbal prompting and by fastening (zipping, buttoning, snapping) them with help
3. Dresses self with help in pulling or putting on most clothes and fastening them
2. Cooperates when dressed by extending arms or legs
1. Must be dressed completely
SHOES (Check ALL statements that apply)
_______ a. Puts on shoes correctly without assistance
_______ b. Ties shoe laces without assistance
_______ c. . Unties shoe laces without assistance
_______ d. Removes shoes without assistance
_______ NONE OF THE ABOVE
SENSE OF DIRECTION _______
4. Goes several blocks from grounds, or from home, without getting lost
3. Goes around grounds or a couple of blocks from home without getting lost
2. Goes around cottage, ward, or home
1. Gets lost whenever s/he leaves own living area
MONEY HANDLING _______
5. Uses banking facilities independently
4. Makes change correctly but does not use banking facilities OR uses banking facilities but does not make change correctly
3. Adds coins of various denominations up to one dollar
2. Uses money but does not make change correctly
1. Does not use money
PURCHASING _______
6. Chooses and buys all own clothing without help
5. Chooses and buys some of own clothing without help
4. Makes minor purchases without help (candy, soft drinks, etc.)
3. Does shopping with slight supervision
2. Does shopping with close supervision
1. Does no shopping
WRITING _______
6. Writes sensible and understandable letters
5. Writes short notes and memos
4. Writes or prints forty words
3. Writes or prints ten words
2. Writes or prints own name
1. Cannot write or print any words
PRE VERBAL EXPRESSION (Check ALL statements that apply) _______
_______ a. Is able to say (sign) at least a few words (if yes, ender 6 on line)
_______ b. Nods head or smiles to express happiness
_______ c. Indicates hunger
_______ d. Indicates wants by pointing or vocal noises
_______ e. Expresses pleasure or anger by vocal noises
_______ f. Chuckles or laughs when happy
_______ NONE OF THE ABOVE
SENTENCES _______
4. Sometimes uses complex sentences containing because, but, etc.
3. Asks questions using words such as why, how, what, etc.
2. Speaks in simple sentences
1. Is non-verbal or nearly non-verbal
READING _______
6. Reads books suitable for children nine years or older
5. Reads books suitable for children seven years old
4. Reads simple stories or comics
3. Recognizes ten or more words by sight
2. Recognizes various signs, ONE WAY, NO PARKING, WOMEN, MEN
1. Recognizes no words or signs
COMPLEX INSTRUCTIONS (Check ALL statements that apply)
_______ a. Understands instructions containing prepositions e.g., on, in, behind, etc.
_______ b. Understands instructions referring to the order in which things must be done, e.g., first do. . .then do. . .
_______ c. Understands instructions requiring a decision, If. . ., do this; but if not, do. . .
_______ NONE OF THE ABOVE
NUMBERS _______
6. Does simple addition and/or subtraction
5. Counts ten or more objects
4. Mechanically counts to ten
3. Counts two objects by saying one. . .two. . .
2. Discriminates between one and many or a lot
1. Has no understanding of numbers
TIME (Check AL L statements that apply)
_______ a. Tells time by clock or watch correctly
_______ b. Understands time intervals, e.g., there is one hour between 3:30 and 4:30
_______ c. Understands time equivalents, e.g., 9:15 is the same as quarter past nine
_______ d. Associates time on clock with various actions and events
_______ NONE OF THE ABOVE
ROOM CLEANING _______
3. Cleans room well, e.g., sweeping, dusting, and tidying
2. Cleans room but not thoroughly
1. Does not clean room at all
FOOD PREPARATION _______
4. Prepares an adequate complete meal (may use canned or frozen foods)
3. Mixes and cooks simple food, e.g., fries eggs, makes pancakes, cooks TV dinners, etc.
2. Prepares simple foods requiring no mixing or cooking, e.g., sandwiches, cold cereal, etc.
1. Does not prepare food at all
TABLE CLEARING _______
3. Clears table of breakable dishes and glassware
2. Clears table of unbreakable dishes and silverware
1. Does not clear table at all
JOB COMPLEXITY _______
3. Competitive employment or goes to workshop
2. In pre-vocational training, in school, or retired
1. Performs no work
INITIATIVE _______
4. Initiates most of his own activities, e.g., tasks, games, etc.
3. Asks if there is something for his to do or explores surroundings, e.g., home, yard, etc.
2. Will engage in activities only if assigned or directed
1. Will not engage in assigned activities, e.g., putting away toys, etc.
ATTENTION _______
5. Will pay attention to purposeful activities for more than fifteen minutes, e.g., playing games, reading, cleaning up
4. Will pay attention to purposeful activities for at least fifteen minutes
3. Will pay attention to purposeful activities for at least ten minutes
2. Will pay attention to purposeful activities for at least five minutes
1. Will not pay attention to purposeful activities for as long as five minutes
PERSONAL BELONGINGS _______
4. Very dependable -- always takes care of personal belongings
3. Usually dependable -- usually takes care of personal belongings
2. Unreliable -- seldom takes care of personal belongings
1. Not responsible at all -- does not take care of personal belongings
AWARENESS OF OTHERS (Check all statements that apply)
_______ a. Recognizes own family
_______ b. Recognizes people other than family (if b is checked, check a)
_______ c. Has information about others, e.g., job, address, relation to self
_______ d. Knows the names of people close to him, e.g., classmates, neighbors
_______ e. Knows the names of people not regularly encountered
_______ NONE OF THE ABOVE
INTERACTION WITH OTHER S _______
4. Interacts with others in group games
3. Interacts with others for at least a short period of time, e.g., showing or offering toys, clothing or objects
2. Interacts with other imitatively with little interaction
1. Does not respond to others in a socially acceptable manner
PARTICPATES IN GROUP ACTIVITIES _______
4. Initiates group activities at least some of the time (leader and organizer)
3. Participates in group activities spontaneously and eagerly (active participant)
2. Participates in group activities if encouraged to do so (passive participant)
1. Does not participate in group activities
MALADAPTIVE BEHAVIOR
(Enter code number)
4. Never observed
3. Not observed within the last 4 weeks
2. Occasionally (5 times or less per week) within the last 4 weeks
1. Frequently (more than 5 times per week) within the last 4 weeks
Threatens or does physical violence to others _______
Damages own or other’s property _______
Disrupts other’s activities _______
Uses profane or hostile language _______
Is rebellious, e.g., ignores regulations, resists following instructions _______
Runs away or attempts to run away _______
Is untrustworthy, e.g., takes other’s property, lies or cheats _______
Displays stereotyped behavior, e.g., rocks body back and forth, has hands in motion _______
Removes or tears off own clothing inappropriately _______
Injures self _______
Is hyperactive, e.g., will not sit still for any length of time _______
Displays sexual behavior (heterosexual or homosexual) that is socially unacceptable, e.g., forcible advances, public masturbation, public exposure, etc. _______
Requires restraint or time-out _______
Is withdrawn, e.g., extreme inactivity, extreme shyness, extreme unresponsiveness _______
RESTRAINTS
Does this persons program include any of the following?
0. No
1. Yes, in written plan
2. Yes, but not in written plan
Time out or exclusion over 5 minutes _______
Overcorrection (restoring situation to better than normal state) _______
Mechanical restrain (muffs, mitts, any form of binding) _______
Physical restraint (restriction of movement by another person) _______
Isolation (in room with door closed) _______
Chemical restraint (any medication given in emergencies or pro to control behavior) _______
FAMILY/ADVOCATE INFORMATION
In the past year, how often has the family contacted the person or program staff by phone? _______
6. No family
5. Never
4. Twice a year or less
3. About every three months
2. About once a month
1. About once a week or more
How often did family members visit the person (in past year)? _______
6. No family
5. Never
4. Twice a year or less
3. About every three months
2. About once a month
1. About once a week or more
How often did this person visit with the family at their home or on outings (in past year)? _______
6. No family
5. Never
4. Twice a year or less
3. About every three months
2. About once a month
1. About once a week or more
How often did the Friend-Advocate make contact by phone or visit (in past year)? NOTE: An Advocate is neither a family member nor a person whose job involves direct contact with the individual. Leave blank if person self-advocates. _______
6. No Friend-Advocate
5. Never
4. Twice a year or less
3. About every three months
2. About once a month
1. About once a week or more
RESIDENCE INFORMATION
How many other people live at this person’s residence? _______
0. None
1. One
2. Two
3. 3-5
4. 6-10
5. 11-15
6. 16-20
7. 21-25
8. 26-30
9. More than 30
How many times has this person moved residences in the pay year? Include any change of address. Enter number 0 to 9. _______
MEDICAL INFORMATION
MEDICAL NEEDS: In general, how urgent is this person’s need for medical care? (Enter code number) _______
4. Generally has no serious medical needs
3. Needs visiting nursing and/or regular visits to the doctor
2. Has life-threatening condition that requires very rapid access to medical care
1. Would not survive without 24 hr. medical personnel
If this person has a life threatening medical condition, name it. ____________________________
SEIZURE FREQUENCY (Enter code number) _______
8. Continuous intermittent seizures
7. Approximately one per day
6. Approximately one per week
5. Approximately one per month
4. 7-10 seizures per year
3. One-six seizures per year
2. Has documented history of seizures, no seizures currently
1. Does not have seizures
CURRENT MEDICATION: How many different prescribed medications (other than vitamins or topical ointment) are administered daily? (Enter number. If none, enter 0. If greater than nine, enter 9.) What is the medication(s) and its dosage? _______
| Name | Dosage | Times Per Day |
|---|---|---|
Is there a record (log) maintained at residence of all medications and their administration for this person? _______
1. Yes
2. No
9. Not applicable -- no meds
NEXT 4 ITEMS:
00 -- This month
98 -- Never
99 -- N/A
_______ _______ How many months since general medical checkup?
_______ _______ How many months since blood levels were checkup? (Enter 99 if not applicable. Blood levels are important for seizure meds and lithium, questionable at best for psychotropics.)
_______ _______ How many months since exam by a gynecologist? (Enter 99 if male)
_______ _______ How many months since exam by a dentist?
_______ _______ How many days in past 4 weeks has this person required hospital care (inpatient, outpatient, emergency room)? (Enter number of days, 00-28)
_______ _______ How many days in past 4 weeks have this persons normal activities been restricted because of health problems? (Enter number of days, 0. 0-29)
What kind of medical coverage is most often used for this person? _______
- Medicaid (M.A.) blue card
- Medicaid (M.A.) green card
- Medicaid (M.A.) pink card
- Medicaid card turned in for HMO membership
- Medicare
- Private insurance (Blue Cross Blue Shield, etc.)
- Individuals or familys money pays for medical care
- CLA funds pay for medical care
PHYSICAL AIDS:
4. Needs, but does not have
3. Needs and has, but does not or cannot use
2. Needs, has, and uses
1. Has no need
Glasses _______
Wheelchair, walker, braces, or cane _______
Hearing aid _______
Helmet _______
INDIVIDUAL HABILITATION PLAN
Is there a written program plan for this person? _______
- Yes, TIHP as required by Pennhurst court order
- Yes, IHP as required by Pennhurst court order
- Yes, LMP, IPP, APR, or similar written program plan
- No
Is there a copy of the written program plan at the person’s residence? _______
1. Yes
2. No
9. Not applicable, no plan
MONTH_______ /YEAR_______ What is the approval date on the written plan (for Pennhurst class members, use REVIEW DATE of IHP or TIHP)?
_______ _______ How many goals or objectives are present in the written program plan? (Enter number of goals, 01 to 99; blank if not applicable)
_______ _______ How many weeks since the Case Manager visited this person at the residence? (Enter number of weeks, 01 to 97, enter 98 if never)
Is the name and phone number of this person’s Case Manager readily available to staff of the residence?
1. Yes
2. No
9. Dont know
PROGRAM GOALS
What are the 5 most important goal areas in this persons current Plan? (USE GOAL CODES -- EACH MAY BE USED ONLY ONCE)
1. _______ _______
2. _______ _______
3. _______ _______
4. _______ _______
5. _______ _______
COSTS
Per Day_______ _______ _______ How much is paid for this persons residential placement? This figure should not include any portion of the persons SSI or other public assistance money. Accept per day, per week, per month, per year. Convert to per day and round to 3 digits.
_______ Per_______
Per Month_______ _______ _______ How much per month does this person receive in SSI or other assistance payments? Round to 3 digits.
LIST OF POSSIBLE GOAL AREAS
GOALS CONCERNING INDEPENDENT LIVING AND SELF CARE SKILLS
01. Dressing
02. Toileting
03. Domestic activities (house cleaning, bedmaking, care of belongings, clothes washing, etc.)
04. Eating (self feeding, use of utensils, table manners, table setting and cleaning, eating in restaurants, food preparation, etc.)
05. Bathing and/or washing
06. Grooming and other hygiene (toothbrushing, hair care, shaving, cosmetics, etc.)
07. Understanding and use of numbers
08. Use of money and purchasing
09. Telling time
10. Handling emergencies (fire precaution, first aid, telephone assistance, etc.)
11. Obtaining generic community services (how to obtain medical religious, psychological, social welfare, and other generic services)
12. Mobility/travel (getting around home, neighborhood, use of public transportation, etc.)
13. Personal health care (recognizing signs of illness, use of medications, nutrition, following doctors orders, attending to menstruation, etc.)
14. Use of telephone
GOALS CONCERNING DEVELOPMENT OF SENSORY, MOTOR, AND COMMUNICATION SKILLS
20. Vision (using glasses, correction of other eye problems, etc.)
21. Hearing (using hearing aid, correction of other ear problems, etc.)
22. Ambulation (using physical aids when necessary, correction of other motor or orthopedic problems, muscular strength and control, body balance, gait, running, etc.)
23. Arm use and hand eye coordination (ability to grasp, to manipulate objects, to use fine motor skills, correction of other motor or orthopedic problems, using physical apparatus to aid in muscular strength and control, etc.)
24. Use of verbal language
25. Use of non-verbal communication (signing, gestures, making needs known, expression of feelings, etc.)
26. Use of written language (reading, writing, understanding of meaning of written signs, etc.)
27. Sensory awareness (sensory stimulation, sensory integration, etc.)
GOALS CONCERNING REDUCTION OF BEHAVIOR PROBLEMS
30. Reduction of physical violence towards others
31. Reduction of hostility of threatening behavior
32. Reduction of property damage
33. Reduction of behaviors that disrupt others activities
34. Reduction of rebelliousness, residence to rules, instructions, duties orders, etc.
35. Reduction of running away or attempting to run away
36. Reduction of theft, stealing, shoplifting
37. Reduction of lying, cheating, borrowing without permission
38. Reduction of physical violence to self
39. Reduction of stereotyped behavior, odd or repetitive mannerisms, eccentric habits or bizarre oral habits
40. Reduction of inappropriate verbalization or vocalization (profanity, talking too loudly, laughing inappropriately, unpleasant noises, etc.)
41. Reduction of inappropriate interpersonal manners (too familiar with strangers, violation of others rights and/or personal space, annoying others, etc.)
42. Reduction of clothing problems (refuses to wear or removes inappropriately, tears or damages, etc.)
43. Reduction of withdrawal (extreme shyness, extreme unresponsiveness)
44. Reduction of hyperactivity
45. Reduction of any kind of inappropriate sexual behaviors
46. Reduction of psychological disturbance
47. Reduction of other behavior problems (describe ____________________________)
GOALS CONCERNING DEVELOPMENT OF SOCIAL SKILLS
50. Awareness of others
51. One to one interaction (including conversation techniques, appropriate behavior, etc.)
52. Group interaction
53. Family interaction (with parents, siblings, other relatives and/or offspring)
54. Manners, customs, politeness, etiquette (proper behavior in any social setting)
55. Civic and legal duties (laws, respect for rights of others)
56. Sexual interaction
57. Awareness of property and ownership (learning when it is appropriate to share, and when if is appropriate to borrow)
58. Improve attention span
59. Improve self concept, self esteem
GOALS CONCERNING WORKING
60. Learn the concept of working for pay
61. Improve motivation to work
62. Learn specific job skills
63. Achieve a new or better work placement (may be structured activities center, workshop, job station in industry, competive employment, etc.)
64. Learn job-seeking skills (may include learning where to look for jobs, promptness, appropriate dress, interviewing techniques, filling out applications, etc.)
65. Learn how people are expected to relate to employers and co-workers
GOALS CONCERNING EDUCATION
70. Learn appropriate classroom behavior (sitting still, being quiet, paying attention, performing assigned activities, etc.)
71. Improve motivation to participate and learn in school
72. Be transferred to a more appropriate or more advanced or more normalizing school placement
73. Achieve mastery of specific academic skill(s) -- reading, writing, arithmetic, etc.
GOALS CONCERNING USE OF LEISURE TIME
80. Learn to use television appropriately (more selectively, less often, at proper times, etc.)
81. Develop hobby(s) -- arts, crafts, music, leisure reading, games, collecting, etc.
82. Develop skills in sports/athletic activities (regular exercise, jogging, baseball, basketball, horseback riding, tennis, bowling, swimming, etc.)
83. Learn to use community resources more independently (parks, pools, movies, theatres, museums, churches, etc.)
84. Learn to plan excursions (day trips, vacations, etc.)
DEVELOPMENTAL SERVICES IN THE PAST 4 WEEKS (EXCLUDING DAY PROGRAM)
| FORMALLY STRUCTURED AND SCHEDULED SKILLS TRAINING PROGRAMS Specific programs providing education and training in essential activities of self-help, social interaction, and independent living | EXACT # IN PAST 28 DAYS | DURATION 1 -- 1 min. 2 -- 5 min. 3 -- 15 min. 4 -- 30 min. 5 -- 1 hr. 6 -- 2 hrs. 7 -- 3 hrs. 8 -- 4 hrs. 9 -- 5 or more hrs. |
|---|---|---|
| A. Social Interaction Training -- e.g., interpersonal skills, manners | A _______ _______ | _______ |
| B. Dressing Skills Development -- Teaching, not just helping | B _______ _______ | _______ |
| C. Eating Skills Development -- including food preparation | C _______ _______ | _______ |
| D. Hygiene and Grooming Skills Development -- including toileting | D _______ _______ | _______ |
| E. Family Life and Sex Education | E _______ _______ | _______ |
| F. Community Living Skills Training -- e.g., money handling, domestic activity, obtaining generic community services, shopping | F _______ _______ | _______ |
| G. Recreation Therapy -- Provided or supervised by a recreational therapist | G _______ _______ | _______ |
| H. Supervision/Training in Group or Individual Recreational Activities -- (sports, hobbies, use of TV, etc.) include trips, movies, camping | H _______ _______ | _______ |
| I. Cognitive/Academic Skills Training -- Reading, arithmetic, etc. | I _______ _______ | _______ |
| J. Physical Therapy -- Services of Physical Therapies | J _______ _______ | _______ |
| K. Mobility Training -- Movement skills, skills to get around house and community (e.g., public transportation), include positioning | K _______ _______ | _______ |
| L. Occupational Therapy -- Services of an Occupational Therapies | L _______ _______ | _______ |
| M. Sensorimotor Skills Training -- e.g., eye-hand coordination training | M _______ _______ | _______ |
| N. Speech and Hearing Therapy -- Services to improve reception/perception of speech and language | N _______ _______ | _______ |
| O. Nursing Care -- Nursing care other than administration of routine medications | O _______ _______ | _______ |
| P. Psychotherapy -- Intensive psychological therapy performed by a trained therapist | P _______ _______ | _______ |
| Q. Behavior Modification -- To reduce maladaptive behavior. Enter rough # minutes on an average day. | _______ _______ _______ | _______ |
DAY PROGRAMS AWAY FROM THE HOME OR LIVING AREA
01. Adult Day Care -- Program of activities focusing on the basic tasks of everyday living rather than work (no wages paid)
02. Pre Vocational -- Program of work, related training (no wages paid) e.g., learning to count, sorting, etc.
03. Work Activities Training -- Program of work or work-related training (wages are paid, less than 50% of minimum wage)
04. Sheltered Employment -- Program of work or work-related training (wages are paid, more than 50% of minimum wage)
05. Competitive Employment
EDUCATION
20. Public school, regular class in regular school
21. Public school, special class in regular school
22. Public school, special school
23. Private school, paid for by school system
24. Private school, paid for by other than school system
25. Formal infant stimulation or pre-school development training program, not provided at residential setting
26. Public School, homebound
OTHER
30. DAY ACTIVITIES AT THE RESIDENCE
80. OTHER AWAY FROM RESIDENCE
90. NO DAY PROGRAM
DESCRIPTION OF PERSON’S CURRENT DAY PROGRAM(S)
A. What Type? (Enter code from list above) If Two Day Programs, Record The One Where Most Time Is Spent _______
B. How Many Days Per Week Does Persons Go To Day Program? (Enter Number, 1 to 7) If Two Day Programs, Record Total Days _______
C. How Many Hours Per Day? (Enter Number, 1 to 9) If Two Day Programs record average, Exclude travel time _______
What is name and location of day program?____________________________
How does this person normally travel to the day program? _______
- Walks or bicycles
- Uses public transportation, escorted
- Uses public transportation, independently
- Residence provides transportation
- Day program provides transportation
- County provides transportation (e.g., paratransit)
- Other
INTERVIEW WITH INDIVIDUAL (To be completed in private)
Are you usually happy here? (Enter code number) _______
- Yes
- No
How much do you like living here? _______
- Not at all
- A little
- Pretty much
- A lot
Do you like the people who work here? _______
1. Not at all
2. A little
3. Pretty much
4. A lot
COMMENTS (Record Verbatim)
Are you usually sad living here? _______
- Yes
- No
Is there anything else you’d like to tell me about living here? (Record responses verbatim) Leave box blank _______
STAFF
How many full time staff work at this living area or residents -- DIRECT CARE ONLY, NOT INCLUDING THERAPISTS AND OTHER PROFESSIONALS? _______
In an average week, how many hours are worked by these full time staff? _______
How many part time staff work at this living area or residence -- DIRECT CARE ONLY, NOT INCLUDING THERAPISTS AND OTHER PROFESSIONALS? _______
In an average week, how many hours are worked by these part time staff? _______
| SITE REVIEW SCORES | ||
|---|---|---|
| GHMS | PQ (cont.) | PASS |
| _______ #1 | _______ #9 | _______ #1 DJ |
| _______ #2 | _______ #10 | _______ #2 SISA |
| _______ #3 | _______ #11 | _______ #3 AAARR |
| _______ #4 | LS | _______ #4 AAP |
| _______ #5 | _______ #1 | _______ #5 MC |
| _______ #6 | _______ #2 | _______ #6 DO |
| _______ #7 | _______ #3 | _______ #7 IND |
| _______ #8 | _______ _______ #4 | _______ #8 INT |
| _______ #9 | _______ _______ #5 | IMPR. |
| _______ #10 | _______ #6 | _________ _________ #1 |
| _______ #11 | _______ #7 | _________ _________ #2 |
| PQ | _______ #8 | _________ _________ #3 |
| _______ #1 | _______ #9 | _________ _________ #4 |
| _______ #2 | _______ #10 | _________ _________ #5 |
| _______ #3 | _______ #11 | _________ _________ #6 |
| _______ _______ _______ _________ _________ #4 | ||
| _______ _______ _______ _________ _________ #5 | ||
| _______ _______ _______ _________ _________ #6 | ||
| _______ _______ _______ _________ #7 | ||
| _______ _______ _______ _________ _________ #8 | ||
APPENDIX 5-1: CONSUMER INTERVIEWS QUESTIONNAIRE1
INSTITUTE FOR SUREVEY RESEARCH
TEMPLE UNIVERSITY
--Of The Commonwealth System Of Higher Education--
1601 NORTH BROAD STREET
PHILADELPHIA, PENNSYLVANIA 19122
STUDY #540-350-01
OMB No.:
A SURVEY OF RESIDENTS OF PENNHURST AND COMMUNITY LIVING ARRANGEMENT PROGRAMS
Date: _______ _______ _______ _______
Time Interview began: _______ A.M. _______ P.M.
Time Interview ended: _______ A.M. _______ P.M.
RESPONDENT’S NAME __________________________________________________________________
ADDRESS: ______________________________________________________________________
TELEPHONE NUMBER: ____________________________
TO BE COMPLETED BY OFFICE BEFORE FIELD USE
Pennhurst Resident Number: _________________________
Base Service Unit Number: _________________________
Cottage or Agency Name: _________________________ Cottage Code: _______
Sex: M F Age: _______
VERBAL CONSENT FORM (READ TO R)
Hello, I am (YOUR NAME) working for Temple University, a school in Philadelphia. What is your name? _________________________. Please let me know if you cant hear anything I say. We are talking to a lot of people (here at Pennhurst/in homes like this one). I wa nt to ask you some questions about your life and what you do every day. No one but us and the people I work for at Temple will ever find out what you say. Our talk will be kept secret and confidential. We think it’s important to find out about you and your feelings. If you don’t want to talk to me, you don’t have to, and you can stop any time. Will you talk with me?
_______ YES_______ NO
(RECORD ANY RESPONSE GIVEN IN ADDITION TO YES/NO)
INTERVIEW’S NAME: _________________________ID#: _______
1. Do you like living here? _______
1. Yes
2. In between, sort of, a little, etc.
3. No
8. Don't Know
9. No Answer
1a. Have you ever lived anywhere else? (Have you always lived here?) _______
1. Parents (Yes )
2. Other Institute (Yes)
3. No
4. CLA or group home (Yes)
8. Don't Know
9. No Answer
2. Do you like the people who work here? _______
1. Yes
2. Some, most, not all, etc.
3. No
8. Don't Know
9. No Answer
3. Do you want to keep on living here? _______
1. Yes
2. Sort of, unsure
3. No
8. Don't Know
9. No Answer
4. Do you have any real good friends? I mean people you like a lot. (If no, skip to Q. 5) _______
1. Yes
2. Unsure
3. No
8. Don't Know
9. No Answer
4a. How many? _______
1. A lot (5 or more)
2. A few (3 - 5)
3. A Couple (1 or 2)
5. Do you have a girlfriend/boyfriend? _______
1. Yes
2. Sort of, maybe, etc.
3. No
8. Don't Know
9. No Answer
6. Do you ever see anyone in your family? I mean mother, father, brothers, sisters ? _______
1. Yes
2. Some times
3. No
8. Don't Know
9. No Answer
7. Are people here mean or nice ? _______
1. Mean
2. Both, some of each , etc.
3. N ice
8. Don't Know
9. No Answer
8. Are you usually happy or sad ? _______
1. Happy
2. In Between
3. Sad
8. Don't Know
9. No Answer
9. Are you sick a lot of the time ? _______
1. Yes
2. In Between
3. No
8. Don't Know
9. No Answer
10. If you had one wish, what would you wish for? ____________________________
11. Where do you go during the day? (PROBE FOR AS MUCH DETAIL AS POSSIBLE) ____________________________
12. Do you learn a lot there ? _______
1. Yes
2. Some, sometimes
3. No
8. Don't Know
9. No Answer
13. Do you like it there ? _______
1. Yes
2. In between, sort of, a little, etc.
3. No
8. Don't Know
9. No Answer
14. Do you make any money? (IF CLIENT NOT WORKING, PROBE FOR SOURCE) _______
1. Yes
2. Not much, a little, etc.
3. No
8. Don't Know
9. No Answer
15. Are you usually sad or happy ? _______
1. Happy
2. In Between
3. Sad
8. Don't Know
9. No Answer
16. If you could, would you like to leave here and live somewhere else ? (If no, skip to Q. 19) _______
1. Yes
2. In between, not sure
3. No
8. Don't Know
9. No Answer
17. What kind of place would you like to go to ? ____________________________
18. Are you ever unhappy ? _______
1. Yes , most of the time
2. In between, some of the time
3. No never, not usually
8. Don't Know
9. No Answer
19. Is there anything else youd like to tell me? ____________________________
20. Would you like to go back to Pennhurst ? _______
1. Yes -- go back
2. In between, not sure
3. No -- stay here
8. Don't Know
9. No Answer
21. Are there any other comments or observations that you may have? ____________________________
EMOTION LABELING INTERVIEW SCORE SHEET
1) Show the one page glass and tap sequence. Ask Tell me what is happening here, Tell me the story of what happened to the glass.
1 point Perceives a single object and perceives a sequence -- The glass is getting (got) full of water .
0 points Ambivalent -- Empty, Full, Full, Full pointing to the pictures
-1 point Does not perceive a single object or a sequence. -- They got water. This one got water and this one didnt.
2) Show the picture of the girl with the flower. Ask Tell me the story of this picture. How does the girl feel?
2 points Perceives both action and emotion -- She colored the picture and shes proud/ happy/satisfied
1 points Perceives emotion -- Shes happy, She likes the picture.
-1 point Incorrectly, labels emotion -- Shes mad/sad, She stole it.
3) Show the picture of the boy and the bicycle. Ask Tell me the story of this picture. How does the boy feel?
2 points Perceives both action and emotion -- His bike got a flat and he is sad/mad.
1 point Perceives emotion -- hes sad, hes mad
-1 point Incorrectly labels emotion -- He is happy, He is glad
4) Show all 3 pictures of the Boy Fishing Set (3-5 second each). Ask Look at all these pictures and tell me the story of what happens. How does the boy feel?
2 points Perceives the set of pictures as representing a single person (perceives a sequence) and correctly lables emotions. -- The boy goes (went) fishing and caught some and is real happy
1 point Correctly labels emotion -- The boy is Happy/Glad
-1 point Incorrectly labels emotion -- The boy is sad, the boy is bad
5) Show all 3 pictures of the boy getting spanked Set (3-5 seconds each). Ask Look at all these pictures and tell me the story of what happens. How does the boy feel?
2 points Perceives the set of pictures as representing a single person (perceives sequence) and correctly labels emotions. -- The boy (was bad) and got spanked and is sad/mad/hurt
1 point Correctly label emotions -- The boy is sad or mad or hurt
-1 point Incorrectly labels emotions -- The boy is happy or glad
6) Place all 3 separate smile button faces on desk face up and arrange. Then place all 3 photographs face up on the desk. Ask please match the photographs with the drawings
1 point All are matched correctly
-1 point Any incorrect matches
Show the five “Smile button faces”. Leave them within respondents reach. Ask:
7) Which one is most like how you feel about living hear?
Most happy 5 4 3 2 1 Least Happy
8) Which one is most like how the staff feel about you?
Most happy 5 4 3 2 1 Least Happy
9) Which one is most like how the other residents feel about you?
Most happy 5 4 3 2 1 Least Happy
10) Which one is most how you feel about the workshop?
Most happy 5 4 3 2 1 Least Happy
11) Which one is most like how you feel about the staff?
Most happy 5 4 3 2 1 Least Happy
12) Which one is most like how you feel about the other residents
Most happy 5 4 3 2 1 Least Happy

APPENDIX 7-1: BASELINE FAMILY QUESTIONNAIRE WITH DISTRIBUTION OF RESPONSES TO EACH ITEM1
OMB No.: 085-R-0370
EXPIRES: April, 1982
Family Impact Survey for Pennhurst Study
This is a survey of families with a relative who is a Pennhurst resident. We are interested in how you feel you will be affected by the movement of your relative into the community. We would also like to know how you feel your relative will be affected.
You may feel you cannot give an exact answer to every question, or you may be unsure of how you felt when recalling past events. In such cases, please give us your best estimate and then go on to the next question.
Even if there are some questions you cannot answer, please return the questionnaire in the enclosed postage-paid envelope.
Please answer by putting an “X” in the box that best fits your answer, or by filling in the blank.
EXAMPLE 1:
Have you ever been interviewed in a survey?
_______ Yes___X ___ No
EXAMPLE 2:
What is todays date?
___January ______ 31 ______ 1980 ___
(month) (day) (year)
1. Pennhurst Residents Full Name: _____________________________________
2. Pennhurst Resident's Age (IN YEARS):
| _______ (age) | MEDIAN = 36.1 years |
3. Pennhurst Residents Sex:
| _______ Male | 63.3% |
| _______ Female | 36.7% |
4. What is your relationship to the above Pennhurst resident? (CHECK ONE)
| _______ Father | 16.7% |
| _______ Mother | 47.0% |
| _______ Other (PLEASE SPECIFY): _________________________ | 36.3% |
(FOR THE REMAINDER OF THE QUESTIONNAIRE, WE WILL REFER TO THE PENNHURST RESIDENT AS YOUR RELATIVE, REGARDLESS OF WHETHER [HE/SHE] IS YOUR CHILD, BROTHER, SISTER, ETC. THIS IS DONE TO MAKE THE QUESTIONNAIRE APPROPRIATE FOR THE MAJORITY OF THE PEOPLE PILLING IT OUT. IF THERE ARE ANY QUESTIONS, PLEASE CALL MR. DAN KEATING AT 787-1356.)
5. At what age did your re lative enter Pennhurst?
| _______ (age) | MEDIAN = 11.5 years |
6. Overall, how satisfied are you with the services your relative has received from Pennhurst? (CHECK ONE)
| _______ Very satisfied | 53.7% |
| _______ Somewhat satisfied | 28.7% |
| _______ Neutral | 10.8% |
| _______ Somewhat dissatisfied | 4.8% |
| _______ Very dissatisfied | 1.9% |
7. Did your relative ever live anywhere besides Pennhurst or at home with (parents/other relatives)?
| _______ Yes | 36.4% |
| _______ No | 63.6% |
If YES, please list the types of residence, for example, foster family, group home, other hospital, private school, etc._____________________________________
8. Before entering Pennhurst, did your relative participate in any of the following? (PLEASE CHECK ALL THAT APPLY)
| _______ Preschool Activities (for example, Infant stimulation program, Head Start, Get Set, Social Needs, Day Care) How many years? _______ | Y = 15.3% N = 84.7% |
| _______ Public of private school education How many years? _______ | Y = 26.1% N = 73.9% |
| _______ Post-school activities (for example, vocational training, sheltered workshop employment) How many years? _______ | Y = 4.0% N = 96.0% |
9. How often were you able to visit your relative at Pennhurst during the last 5 years? (CHECK ONE)
| _______ Weekly | 10.0% |
| _______ Bi-Weekly | 3.3% |
| _______ Monthly | 30.9% |
| _______ Three to four times a year | 24.7% |
| _______ Once a year | 10.3% |
| _______ Less than once a year | 17.9% |
| _______ Never | 2.8% |
10. How often did your relative return here for a visit from Pennhurst during the last 5 years? (CHECK ONE)
| _______ Weekly | 0.7% |
| _______ Bi-Weekly | 0.9% |
| _______ Monthly | 8.8% |
| _______ Three to four times a year | 16.2% |
| _______ Once a year | 8.8% |
| _______ Less than once a year | 34.0% |
| _______ Never | 30.6% |
11. How urgent do you consider your relatives need for medical care? (CHECK ONE)
| _______ Would not survive without 24-hour medical personnel | 26.3% |
| _______ Has life-threatening condition that requires very rapid access to medical care | 11.3% |
| _______ Needs visiting nurse and/or regular visits to the doctor | 27.4% |
| _______ Generally has no serious medical needs | 35.0% |
12. If your relative were to be selected for movement from Pennhurst to the community, how likely would you be to agree with this decision? (CHECK ONE)
| _______ Very likely to agree | 8.9% |
| _______ Somewhat likely to agree | 5.0% |
| _______ Unsure | 14.5% |
| _______ Somewhat unlikely to agree | 8.7% |
| _______ Very unlikely to agree | 63.0% |
13. Have you ever been to a Community Living Arrangement (a group home in the community with 2 to 10 residents)?
| _______ Yes | 22.2% |
| _______ No | 77.8% |
14. Mentally retarded individuals may require a lot of care and attention. We are interested in how you think different aspects of your familys life may change if your relative was placed in the community?
Below is a scale from 1 to 5, where 1 means you think things will change for the worse, and 5 means you think things will change for the better if your relative is placed in the community.
(FOR EACH ITEM, PLEASE CHECK THE BOX WHICH MOST CLOSELY REPRESENTS HOW YOU THINK THAT ITEM WILL CHANGE IF YOUR RELATIVE IS MOVED FROM PENNHURST TO THE COMMUNITY.)
| Change for the Worse | No Change | Change for the Better | Not Applicable | |||
|---|---|---|---|---|---|---|
| 1 | 2 | 3 | 4 | 5 | 0 | |
| a. Your own social life | 29.7% | 4.4% | 47.9% | 0.5% | 3.5% | 14.0% |
| b. Your job | 15.8% | 2.5% | 37.5% | 0.7% | 1.2% | 42.2% |
| c. Your spouses job | 11.1% | 0.5% | 31.1% | 0.5% | 1.0% | 55.8% |
| d. Family recreation activities at home | 20.6% | 5.8% | 49.8% | 1.0% | 2.2% | 20.6% |
| e. Your time alone | 25.5% | 7.0% | 48.2% | 1.0% | 3.6% | 14.7% |
| f. Your time with your spouse | 16.0% | 4.0% | 15.6% | 0.3% | 1.8% | 42.4% |
| g. Your time with your children living at home | 10.9% | 3.5% | 35.9% | 0.3% | 2.8% | 46.7% |
| h. Family vacations | 19.6% | 4.6% | 47.4% | 0.7% | 1.7% | 25.9% |
| i. Your own general happiness | 41.0% | 9.5% | 31.3% | 2.2% | 9.0% | 7.0% |
| j. Your mentally retarded relatives relationship with other people | 42.4% | 6.4% | 31.1% | 2.7% | 9.8% | 7.6% |
| k. Your mentally retarded relatives general happiness | 48.8% | 8.9% | 22.5% | 2.4% | 11.5% | 5.7% |
| l. Your mentally retarded relatives relationship with you | 22.2% | 6.4% | 51.3% | 1.2% | 10.3% | 8.6% |
| m. Your mentally retarded relatives relationship with your spouse | 17.4% | 2.8% | 36.3% | 0.5% | 4.8% | 38.3% |
| n. Your mentally retarded relatives relationship with (his/her) brothers and sisters | 19.5% | 3.4% | 47.1% | 1.7% | 8.3% | 20.0% |
Please indicate how strongly you agree or disagree with the following statements. (CHECK ONE BOX FOR EACH QUESTION BELOW.)
| Strongly Agree | Somewhat Agree | Neither Agree Nor Disagree | Somewhat Disagree | Strongly Disagree | |
|---|---|---|---|---|---|
| 1 | 2 | 3 | 4 | 5 | |
| 15. I believe that my relative has reached (his/her) highest level of educational and psychological development and will not progress much beyond the level (he/she) is at now. | 60.1% | 15.2% | 11.3% | 6.4% | 6.4% |
| 16. When my relative lives away from home, I prefer that (he/she) remain in the same place for (his/her) entire lifetime. | 61.7% | 14.8% | 15.7% | 5.1% | 2.7% |
| 17. When my relative lives away from home, I prefer that (he/she) move from a more protected residential setting to a more open setting as (he/she) achieves greater self-help skills. | 12.9% | 12.5% | 16.5% | 10.4% | 47.8% |
| 18. Persons who work in community living arrangements are knowledgeable and skillful enough to handle all situations which may arise with regard to your mentally retarded relative. | 9.2% | 11.7% | 22.8% | 19.8% | 36.6% |
| 19. I believe that funding for community living arrangements is secure and permanent. | 8.8% | 6.0% | 23.9% | 16.9% | 44.3% |
| 20. I believe that all services needed by my relative would be available to (him/her) in the community. | 8.4% | 10.0% | 15.5% | 16.4% | 49.8% |
| 21. I believe that my family will not have to assume added financial burdens for the care of our relative if (he/she) were to leave Pennhurst. | 24.9% | 13.3% | 22.6% | 12.6% | 26.7% |
| 22. Normalization means that, as much as possible, mentally retarded persons are given normal opportunities for living, working and school. In thinking about what your relative will need in the future, how much do you agree with this? | 14.4% | 18.1% | 18.4% | 12.8% | 36.3% |
| 23. The Least Restrictive Alternative says that mentally retarded persons should be allowed to live in places which are as much like normal homes as possible. In thinking about what your relative will need in the future, how much do you agree with this? | 16.3% | 19.7% | 11.1% | 15.6% | 37.3% |
| 24. Deinstitutionalization is the moving of mentally retarded persons from the institution into places in the community. In thinking about what your relative will need in the future, how much do you agree with this? | 8.6% | 10.7% | 9.3% | 15.0% | 56.5% |
25. How familiar are you with the recent court decisions (Brodericks decision and the Circuit Court appeal decision) in the Halderman vs. Pennhurst case? (CHECK ONE)
| _______ Very familiar | 25.4% | |
| _______ Somewhat familiar | 49.0% | |
| _______ Not familiar | º (SKIP TO Q. 28) | 15.1% |
| _______ Need more information | 10.6% |
26. Please describe how you felt about Brodericks decision when you first heard about it. (CHECK ONE)
| _______ Agreed completely | 3.6% |
| _______ Agreed somewhat | 6.3% |
| _______ Neutral | 4.8% |
| _______ Disagreed somewhat | 18.5% |
| _______ Disagreed completely | 66.9% |
27. Please describe how you feel about the decision now. (CHECK ONE)
| _______ Agreed completely | 4.8% |
| _______ Agreed somewhat | 10.8% |
| _______ Neutral | 4.2% |
| _______ Disagreed somewhat | 18.9% |
| _______ Disagreed completely | 61.4% |
These are events which make us all feel tense, confused, frustrated and angry. This general feeling may be described as stress . How much stress did you feel when each of the following events happened in your life and the life of your mentally retarded relative?
(FOR EACH EVENT, PLEASE CHECK THE BOX INDICATING HOW STRESSFUL THE EVENT WAS TO YOU. IF THE EVEN DID NOT OCCUR, PLEASE CHECK THE SPACE MARKED “DID NOT OCCUR.”)
| Did Not Occur | Very Stressful | Somewhat Stressful | Not At All Stressful | |||
|---|---|---|---|---|---|---|
| 1 | 2 | 3 | 4 | 5 | ||
| 28. Diagnosis: When you were officially told by a specialist that your relative was mentally retarded. | 16.1% | 69.3% | 2.3% | 10.4% | 0.2% | 1.7% |
| 29. When your mentally retarded relative reached the age at which you would normally expect a child to begin walking. | 22.5% | 39.6% | 2.9% | 19.5% | 0.9% | 14.4% |
| 30. When your relative began walking. | 25.2% | 21.6% | 3.3% | 20.4% | 1.3% | 28.2% |
| 31. When your mentally retarded relative reached the age at which you would normally expect a child to begin talking. | 24.0% | 44.6% | 2.9% | 19.8% | 2.0% | 6.7% |
| 32. When your relative became toilet trained. | 40.0% | 19.2% | 2.7% | 14.5% | 3.4% | 18.9% |
| 33. When your mentally retarded relatives younger brother or sister began to act at a higher level. | 44.7% | 24.7% | 3.4% | 13.2% | 0.8% | 13.2% |
| 34. Beginning of educational placement either in public or private school. | 55.3% | 23.7% | 2.1% | 10.0% | 1.8% | 7.2% |
| 35. Placement of the mentally retarded relative into an institution outside the home. | 6.3% | 72.2% | 1.2% | 13.5% | 1.2% | 5.6% |
| 36. When a medical (e.g., seizure) or behavioral (e.g., tantrum) crisis specific to your relative was identified. | 22.5% | 57.0% | 4.2% | 11.9% | 1.0% | 3.5% |
| 37. Onset of puberty for your mentally retarded relative. | 26.2% | 27.0% | 2.9% | 16.8% | 4.2% | 22.8% |
| 38. Successful completion of an educational program. | 70.6% | 7.0% | 0.8% | 6.8% | 1.8% | 13.1% |
| 39. Mentally retarded relatives 21st birthday. | 17.3% | 24.7% | 1.5% | 19.1% | 3.3% | 34.1% |
| 40. Initial discussion about movement of your relative from Pennhurst Center. | 8.0% | 66.4% | 2.8% | 15.3% | 1.4% | 5.9% |
| 41. Discussion about guardianship proceedings. | 41.8% | 30.2% | 1.7% | 15.8% | 0.4% | 9.9% |
42. If your relative were to leave Pennhurst, which of the following kinds of services do you think will be more important? (CHECK UP TO THREE)
| _______ Academic (basic reading, writing and use of numbers) | 6.8% |
| _______ Behavioral (therapy, behavior modification, eliminating program behaviors) | 48.3% |
| _______ Medical (check-ups, surgery, physical therapy, dental, nursing) | 72.0% |
| _______ Recreation (trips, hobbies, sports, arts, crafts) | 30.9% |
| _______ Self-care (grooming, hygiene, dressing, nutrition) | 65.7% |
| _______ Speech (evaluation, therapy, training) | 30.5% |
| _______ Work and work-training (preparation and training for work) | 15.6% |
| _______ Other ( DESCRIBE ): _________________________ | 8.3% |
43. If your relative were to leave Pennhurst, what size facility would you prefer him or her to live in if living away from home? (CHECK ONE)
| _______ Alone or with a roommate | 15.1% |
| _______ 3 to 5 residents | 36.1% |
| _______ 6 to 10 residents | 22.8% |
| _______ 11 to 15 residents | 7.9% |
| _______ 16 to 25 residents | 4.1% |
| _______ Over 25 residents | 13.8% |
44. If your relative were to leave Pennhurst, how much supervision and/or care do you think (he/she) would require? (CHECK ONE)
| _______ None | 0.7% |
| _______ Weekly visits to make sure everything is all right | 1.6% |
| _______ Daily check-up visits to make sure everything is all right | 3.4% |
| _______ Daily visits, plus occasional minimal assistance | 1.6% |
| _______ Someone on duty at residence during waking hours providing help in normal daily activities | 8.8% |
| _______ Someone on duty 24 hours to help with daily activities | 83.9% |
45. If your relative were to leave Pennhurst, which of the following situations would you prefer for (him/her)? (CHECK ONE)
| _______ To live with persons who function at a similar level and have similar handicaps | 55.7% |
| _______ To live with persons who function at a higher level and/or have no handicaps at all | 21.1% |
| _______ To live with persons who function at a lower level with somewhat more severe handicaps | 0.9% |
| _______ To live with a mixed group of persons, some of whom have more severe handicaps and some of whom have less severe handicaps | 22.0% |
46. In addition to your immediate family (those living in the same household with you), how many relatives (parents, brothers, sisters, sons, daughters, aunts, uncles, etc.) do you talk with, either on the phone or in person? (RECORD AS MANY AS APPLY)
| # of Relatives | |
|---|---|
| a. on a daily basis? | |
| b. on a weekly basis? | |
| c. on a monthly basis? | |
| d. on a yearly basis? |
47. Would you say that the emotional support you have received from family members as it relates to your mentally retarded relative has been: (CHECK ONE)
| _______ extremely supportive -- that is, you could not have done without it, | 31.5% |
| _______ somewhat supportive, | 28.5% |
| _______ mildly supportive, | 16.8% |
| _______ not supportive at all, or | 20.3% |
| _______ it made things worse? | 2.8% |
48. Now we would like to know which, if any, of the following people have provided you with information, emotional support, or other types of assistance (for example, babysitting, transportation, etc.) with regard to your mentally retarded relative. (CHECK ONE BOX ON EACH LINE BELOW)
| Frequency of Assistance | ||||||
| Not Applicable | Daily | Weekly | Monthly | Yearly | No Assistance | |
| a. Friends? | 19.6% | 3.1% | 5.8% | 9.7% | 5.6% | 56.2% |
| b. Neighbors? | 22.7% | 1.8% | 2.8% | 4.1% | 4.6% | 63.8% |
| c. Co-workers? | 31.6% | 1.5% | 2.0% | 2.3% | 1.0% | 61.4% |
| d. Other parents? | 25.3% | 2.0% | 2.0% | 5.7% | 3.3% | 61.5% |
| e. Priest, Minister, or Rabbi? | 23.5% | 0.5% | 1.8% | 3.6% | 5.2% | 64.9% |
| f. Doctors? | 23.6% | 0.7% | 1.8% | 8.8% | 8.0% | 57.5% |
| g. Other ( PLEASE SPECIFY): _________________________ | 59.2% | 7.7% | 5.2% | 8.5% | 5.7% | 13.7% |
49. How we would like to as a few questions about yourself. How important is your religion to you? (CHECK ONE)
| _______ Extremely important | 38.5% |
| _______ Very important | 33.3% |
| _______ Somewhat important | 18.0% |
| _______ Slightly important | 5.6% |
| _______ Not important | 4.5% |
50. How frequently do you attend religious services? (CHECK ONE)
| _______ Once or more a week | 46.4% |
| _______ Two to three times a month | 12.0% |
| _______ Once a month | 5.9% |
| _______ A few times a year or less | 27.8% |
| _______ Never | 7.9% |
51. What is the highest grade of school you have completed? (CHECK ONE)
| _______ No formal schooling | 0.4% |
| _______ Elementary or Grade School (Grades 1 to 8) | 21.5% |
| _______ Some High School (Grades 9 to 11) | 24.0% |
| _______ High School or equivalent | 29.8% |
| _______ Some College (1 to 3 years) | 11.8% |
| _______ College degree | 3.8% |
| _______ Some graduate school or degree | 6.9% |
| _______ Other (PLEASE SPECIFY): Technical School | 1.8% |
52. What is the highest grade of school your spouse has completed? (CHECK ONE)
| _______ No formal schooling | 2.2% |
| _______ Elementary or Grade School (Grades 1 to 8) | 22.5% |
| _______ Some High School (Grades 9 to 11) | 16.8% |
| _______ High School or equivalent | 35.0% |
| _______ Some College (1 to 3 years) | 8.3% |
| _______ College degree | 7.2% |
| _______ Some graduate school or degree | 7.9% |
| _______ Other (PLEASE SPECIFY): _________________________ | |
| _______ Not applicable |
53. What is your racial background?
| _______ American Indian or Alaskan Native | 0.9% |
| _______ Asian or Pacific Islander | 0.4% |
| _______ Black, not of Hispanic Origin | 16.5% |
| _______ Hispanic | 0.4% |
| _______ White, not of Hispanic Origin | 81.7% |
(IF YOU ARE NOT THE MOTHER OR FATHER OF THE PENNHURST RESIDENT, PLEASE SKIP TO Q. 55)
54. We would like to know how many other children you have, their sex, age, and whether or not they are mentally retarded.
(IF MORE SPACE IS NEEDED, PLEASE WRITE AT THE BOTTOM OF THIS PAGE)
| AGE | SEX | MENTALLY RETARDED | |
|---|---|---|---|
| _______ | _______ | _______ Yes | _______ No |
| _______ | _______ | _______ Yes | _______ No |
| _______ | _______ | _______ Yes | _______ No |
| _______ | _______ | _______ Yes | _______ No |
| _______ | _______ | _______ Yes | _______ No |
55. Finally, we would like to know approximately how much total income, before taxes, you and your spouse received in the last year. Please include any pensions, retirement plans, etc. (CHECK ONE)
| _______ Under $5,000 | 33.9% |
| _______ $5,000 - $9,999 | 27.0% |
| _______ $10,000 - $14,999 | 17.2% |
| _______ $15,000 - $19,999 | 7.5% |
| _______ $20,000 - $24,999 | 4.7% |
| _______ Over $25,000 | 9.7% |
THANK YOU VERY MUCH FOR YOUR TIME AND COOPERATION. PLEASE MAIL THIS QUESTIONNAIRE BACK TO US TODAY IN THE POSTAGE-PAID ENVELOPE PROVIDED, EVEN IF YOU HAVE NOT BEEN ABLE TO FILL IN EVERY QUESTION.
APPENDIX 7-2: POST RELOCATION FAMILY QUESTIONNAIRE1
INSTITUTE FOR SURVEY RESEARCH
TEMPLE UNIVERSITY
-- Of The Commonwealth System Of Higher Education --
1601 NORTH BROAD STREET
PHILADELPHIA, PENNSYLVANIA 19122
STUDY #518-296-01
FAMILY IMPACT SURVEY FOR PENNHURST STUDY
FIRST TELEPHONE FOLLOW-UP
Time Interview began: _______ A.M. _______ P.M.
Time Interview ended: _______ A.M. _______ P.M.
CASE NUMBER: _______
RESPONDENT’S NAME: _____________________________________
ADDRESS: _____________________________________
_____________________________________
TELEPHONE NUMBER: (215)_____________________________________
(READ IF R IS SOMEONE OTHER THAN THE RESPONDENT)
INTRODUCTION: Hello, I am (YOUR NAME) calling for the Institute for Survey Research of Temple University. A letter was sent to your house about the survey we are conducting about your relatives move from Pennhurst.
(CHECK IF APPROPRIATE)
R requests a copy of letter _______
INTERVIEWER’S NAME: _____________________________________ ID#: _______
FAMILY IMPACT SURVEY FOR PENNHURST STUDY
FIRST FOLLOW-UP
(READ INTRODUCTION)
THIS IS A SURVEY OF FAMILIES WITH A RELATIVE WHO IS A FORMER PENNHURST RESIDENT. WE ARE INTERESTED IN HOW YOU FEEL YOU HAVE BEEN AFFECTED BY THE MOVEMENT OF YOUR RELATIVE FROM PENNHURST. WE WOULD ALSO LIKE TO KNOW HOW YOU FEEL YOUR RELATIVE HAS BEEN AFFECTED.
YOU MAY FEEL YOU CANNOT GIVE AN EXACT ANSWER TO EVERY QUESTION, OR YOU MAY BE UNSURE OF HOW YOU FELT WHEN RECALLING PAST EVENTS. IN SUCH CASES, PLEASE GIVE US YOUR BEST ESTIMATE AND THEN WE WILL GO ON TO THE NEXT QUESTION.
IF THERE IS A QUESTION YOU CANNOT ANSWER, PLEASE INDICATE THAT YOU CANNOT ANSWER AND WE WILL GO ON TO THE NEXT QUESTION.
1. I'd like to verify that your relatives name is: (NAME OF FORMER PENNHURST RESIDENT) .
(IF NAME IS CORRECT, CONTINUE. IF NAME IS INCORRECT, DISCONTINUE AND CALL ISR.)
2. What is your relationship to (FIRST NAME) ?
_______ Father
_______ Mother
_______ Other (PLEASE SPECIFY): _____________________________________
(IF SAME PERSON WHO RESPONDED LAST TIME, CONTINUE. IF SAME PERSON NOT AVAILABLE, ARRANGE TO CALL BACK. IF SAME PERSON IS DECEASED, INTERVIEW SPOUSE ONLY .)
3. When did your relative leave Pennhurst? DATE: _____________________________________
4. Where did your relative go from Pennhurst?
_______ Community living arrangement
_______ Private school
_______ Foster family
_______ Natural family
_______ Other institution
_______ Nursing home
_______ Other (PLEASE SPECIFY): _____________________________________
5. Is your relative still living in that setting?
_______ Yes
_______ No
_______ Don’t know
(IF NO, GO TO QUESTION 6. IF YES, GO TO QUESTION 8.)
6. Where is your relative now?
_______ Community living arrangement
_______ Private school
_______ Foster family
_______ Natural family
_______ Other institution
_______ Nursing home
_______ Other (PLEASE SPECIFY): _____________________________________
7. Was the move from the original placement to the current placement a move within the same agency?
_______ Yes
_______ No
_______ Don’t know
8. Overall, how satisfied are you with the services your relative is receiving now: (CHECK ONE)
_______ very satisfied,
_______ somewhat satisfied,
_______ neutral,
_______ somewhat dissatisfied, or
_______ very dissatisfied?
9. How often were you able to visit your relative in the last year: (CHECK ONE)
_______ weekly,
_______ monthly,
_______ three to four times a year,
_______ once a year, or
_______ less than once a year?
10. How often did your relative return home for a visit during the last year: (CHECK ONE)
_______ weekly,
_______ monthly,
_______ three to four times a year,
_______ once a year, or
_______ less than once a year?
11. How urgent do you consider your relatives need for medical care: (CHECK ONE)
_______ would not survive without 24-hour medical personnel,
_______ has life-threatening condition that requires very rapid access to medical care,
_______ needs visiting nurse and/or regular visits to the doctor, or
_______ generally has no serious medical needs?
12. Overall, since your relative was selected for movement from Pennhurst into the community, how do you feel about that move? (CHECK ONE)
_______ very comfortable,
_______ somewhat comfortable,
_______ neutral,
_______ somewhat uncomfortable, or
_______ very uncomfortable?
13. We are interested in how you think different aspects of your familys life may have changed since your relative has moved from Pennhurst.
Wed like you to imagine a scale from 1 to 5 where 1 means things have changed for the worse, 5 means you think things have changed for the better, and 3 means there has been no change.
| Change for the Worse | No Change | Change for the Better | Not Applicable | |||
|---|---|---|---|---|---|---|
| 1 | 2 | 3 | 4 | 5 | 0 | |
| a. Your own social life | ||||||
| b. Your job | ||||||
| c. Your spouses job | ||||||
| d. Family recreation activities at home | ||||||
| e. Your time alone | ||||||
| f. Your time with your spouse | ||||||
| g. Your time with your children living at home | ||||||
| h. Family vacation | ||||||
| i. Your own general happiness | ||||||
| j. Your mentally retarded relatives relationship with other people | ||||||
| k. Your mentally retarded relatives general happiness | ||||||
| l. Your mentally retarded relatives relationship with you | ||||||
| m. Your mentally retarded relatives relationship with your spouse | ||||||
| n. Your mentally retarded relatives relationship with (his/her) brothers and sisters |
Now I’m going to read a list of statements. For each statement, please tell me whether you strongly agree, somewhat agree, neither agree not disagree, somewhat disagree or strongly disagree.
(CIRCLE RESPONSE CODE FOR 14 BELOW AND REPEAT PROCEDURE FOR ITEMS 15-23)
(FOR ITEMS 17 AND 21, READ ALTERNATIVES)
Now would you say you strongly agree, somewhat agree, neither agree nor disagree, somewhat disagree, or strongly disagree with the statement: (READ 14)
| Strongly Agree | Somewhat Agree | Neither Agree Nor Disagree | Somewhat Disagree | Strongly Disagree | |
|---|---|---|---|---|---|
| 14. I believe that my relative has reached (his/her) highest level of educational and psychological development and will not progress much beyond the level (he/she) is at now. | 1 | 2 | 3 | 4 | 5 |
| 15. When my relative lives away from home, I prefer that (he/she) remain in the same place for (his/her) entire lifetime. | 1 | 2 | 3 | 4 | 5 |
| 16. When my relative live away from home, I prefer that (he/she) move from a more protected residential setting to a more open setting as (he/she) achieves greater self-help skills. | 1 | 2 | 3 | 4 | 5 |
| (READ ALTERNATIVES) 17. Persons who work in community living arrangements are knowledgeable and skillful enough to handle all situations which may arise with regard to your mentally retarded relative. | 1 | 2 | 3 | 4 | 5 |
| 18. I believe that funding for community living arrangements is secure and permanent. | 1 | 2 | 3 | 4 | 5 |
| 19. I believe that all services needed by my relative are available to (him/her) in the community. | 1 | 2 | 3 | 4 | 5 |
| 20. I believe that my family has not had to assume added financial burdens for the care of our relative since (he/she) has left Pennhurst. | 1 | 2 | 3 | 4 | 5 |
| (READ ALTERNATIVES) 21. Normalization means that, as much as possible, mentally retarded persons are given normal opportunities for living, working, and school. In thinking about what your relative will need in the future, how much do you agree with this? | 1 | 2 | 3 | 4 | 5 |
| 22. The Least Restrictive Alternative says that mentally retarded persons should be allowed to live in places which are as much like normal homes as possible. In thinking about what your relative will need in the future, how much do you agree with this? | 1 | 2 | 3 | 4 | 5 |
| 23. Deinstitutionalization is the moving of mentally retarded persons from the institution into places in the community. In thinking about what your relative will need in the future, how much do you agree with this? | 1 | 2 | 3 | 4 | 5 |
24. Please describe how you feel about Judge Brodericks original decision in the Halderman versus Pennhurst case. Do you: (CHECK ONE)
_______ agree completely,
_______ agree somewhat,
_______ neutral,
_______ disagree somewhat, or
_______ disagree completely?
25. Since your relative has left Pennhurst, which of the following kinds of services do you think are still needed: (CHECK ALL THAT APPLY)
_______ Academic (basic reading, writing and use of numbers)
_______ Behavioral (therapy, behavior modification, eliminating problem behaviors)
_______ Medical (check-ups, surgery, physical therapy, dental, nursing)
_______ Recreation (trips, hobbies, sports, arts, crafts)
_______ Self-care (grooming, hygiene, dressing, nutrition)
_______ Speech (evaluation, therapy, training)
_______ Work and work-training (preparation and training for work)
_______ Other? (DESCRIBE): _____________________________________
26. Finally, we would like to know approximately how much total income, before taxes, you and your spouse received in the last year. Please include any pensions, retirement plans, etc. Was it:
_______ Under $5,000
_______ $5,000 - $9,999
_______ $10,000 - $14,999
_______ $15,000 - $19,999
_______ $20,000 - $24,999
_______ Over $25,000?
APPENDIX 8-1: NEIGHBOR ATTITUDES QUESTIONNAIRE 1
INSTITUTE FOR SUREVEY RESEARCH
TEMPLE UNIVERSITY
--Of The Commonwealth System Of Higher Education--
1601 NORTH BROAD STREET
PHILADELPHIA, PENNSYLVANIA 19122
STUDY #540-350-02 OMB No.: 085-R-0370
SPRING 1981 EXPRIES: April, 1982
REINTERVIEW FOR
A TELEPHONE SURVEY OF COMMUNITY ATTITUDES
Time Interview began: _______ A.M. _______ P.M.
Time Interview ended: _______ A.M. _______ P.M.
Date: ___________________________
CASE NUMBER: _______
RESPONDENT’S NAME : _____________________________________
ADDRESS: _____________________________________
TELEPHONE NUMBER: (215) _____________________________________
(READ IF R IS SOMEONE OTHER THAN THE SCREENING INFORMANT)
INTRODUCTION: Hello, I am (YOUR NAME), calling for the Institute for Survey Research of Temple University. A letter was sent to your house about the survey we are conducting about community attitudes. All answers to questions are completely confidential. Individuals or families will in no way be identified.
(CHECK IF APPROPRIATE)
R requests a copy of letter _______
INTERVIEWS NAME: _____________________________________
1. Overall, would you say that your neighborhood is:
1. very tight knit,
2. fairly tight knit,
3. slightly tight knit, or
4. not at all tight knit?
9. Don't Know, No Answer (DO NOT READ)
2. Now Ill be asking a series of questions about different kinds of people as neighbors. How much would it bother you if two to five people who are physically disabled moved into your neighborhood? Would it bother you a lot, some, very little, or not at all?
(CIRCLE RESPONSE CODE FOR a. BELOW AND REPEAT FOR b.-e.)
| A Lot | Some | Very Little | Not At All | |
|---|---|---|---|---|
| a. Who are physically disabled? | 4 | 3 | 2 | 1 |
| b. Who are mildly mentally retarded? | 4 | 3 | 2 | 1 |
| c. Who are severely mentally retarded? | 4 | 3 | 2 | 1 |
| d. Who are mentally ill? | 4 | 3 | 2 | 1 |
| e. Of a different race from your own? | 4 | 3 | 2 | 1 |
3. Now Ill be asking a different question about the same kinds of people. How much do you think the value of your house would change if two to five people who are physically disabled moved into your neighborhood?
(CIRCLE RESPONSE CODE FOR a. BELOW AND REPEAT FOR b.-e.)
| A Lot | Some | Very Little | Not At All | |
|---|---|---|---|---|
| a. Who are physically disabled? | 4 | 3 | 2 | 1 |
| b. Who are mildly mentally retarded? | 4 | 3 | 2 | 1 |
| c. Who are severely mentally retarded? | 4 | 3 | 2 | 1 |
| d. Who are mentally ill? | 4 | 3 | 2 | 1 |
| e. Of a different race from your own? | 4 | 3 | 2 | 1 |
4. Overall, how often would you say you have contact with mentally retarded people? Would you say:
4. nearly every day (daily),
3. once or twice a week (weekly),
2. less than once a week (monthly), or
1. less often?
9. Dont Know, No Answer (DO NOT READ)
5. Now there are some questions about severely mentally ill people . These people find it difficult to function and take care of themselves on a day-to-day basis. To the best of your knowledge, are the following statements true or false?
| True | False | No Idea, Dont Know | |
|---|---|---|---|
| a. Severe mental illness is always inherited. | 1 | 2 | 9 |
| b. Severe mental illness is always permanent. | 1 | 2 | 9 |
| c. Severely mentally ill people have to live in institutions. | 1 | 2 | 9 |
Now there are some questions about severely mentally retarded people. These people find if difficult to communicate and take care of themselves without help.
6. To the best of your knowledge, are the following statements true or false?
(CIRCLE RESPONSES FOR ITEMS a.-l.)
| True | False | No Idea, Dont Know | |
|---|---|---|---|
| a. A severely retarded person can learn. | 1 | 2 | 9 |
| b. Severely retarded people can make friends with other people. | 1 | 2 | 9 |
| c. Severely retarded people are more loose about sex than nonretarded people. | 1 | 2 | 9 |
| d. Severe mental retardation is always inherited. | 1 | 2 | 9 |
| e. Severely retarded people have to live in institutions. | 1 | 2 | 9 |
| f. Severely retarded people can hold taxpaying jobs. | 1 | 2 | 9 |
| g. Severely retarded people usually require constant medical care. | 1 | 2 | 9 |
| h. Severely retarded people are bigger and stronger than normal people. | 1 | 2 | 9 |
| i. Severe mental retardation is always permanent. | 1 | 2 | 9 |
7. Now Im going to read a list of statements about different people. For each statement, please tell me whether you strongly agree, agree, neither agree nor disagree, disagree, or strongly disagree.
(CIRCLE RESPONSE CODE FOR a. BELOW AND REPEAT PROCEDURE FOR ITEMS b.-m.)
(FOR Q. c. AND Q. f., READ ALTERNATIVE RESPONSES)
How would you say you strongly agree, agree, neither agree nor disagree, disagree, or strongly disagree with the statement:
a. “There is good reason to fear severely retarded people.”
| Strongly Agree | Agree | Neither Agree Nor Disagree | Disagree | Strongly Disagree | (DO NOT READ) | |
|---|---|---|---|---|---|---|
| No Idea, Dont Know | ||||||
| a. There is good reason to fear severely retarded people. | 5 | 4 | 3 | 2 | 1 | 9 |
| b. Most people feel uncomfortable when they are around physically disabled people. | 5 | 4 | 3 | 2 | 1 | 9 |
| c. Severely retarded people should not marry. | 5 | 4 | 3 | 2 | 1 | 9 |
8. How sure are you that you would be able to recognize a mentally retarded person if you saw him or her on the street? Would you say that you would be:
3. very sure,
2. fairly sure, or
1. not at all sure?
9. Dont know (DO NOT READ)
9. Now we have a few questions about yourself. Are you currently,
1. married,
2. widowed,
3. divorced,
4. separated, or
5. have you never married?
10. What is the highest grade of school you have completed?
| Didn't attend school | 0 |
| Grammer School | 1 2 3 4 5 6 7 8 |
| High School | 9 10 11 12 |
| College or higher | 13 14 15 16 17+ |
Now I am going to ask you a few questions concerning your feelings about group homes for retarded people. A group home is a house or apartment where a small number of retarded people live with supervisory staff.
11. Are there any group homes for retarded people in your neighborhood?
1. Yes
2. No
9. Dont k now (SKIP TO Q. 16)
6. Refused
12. For about how many months has the newest group home in your neighborhood been operating?
NUMBER OF MONTHS_______
9. No idea
13. When did you first hear about the operation of that group home? (PROBE FOR MONTH AND YEAR)
MONTH _______ YEAR _______
14. Thinking back to the time when you first heard about it, how did you feel about having a group home in your neighborhood? Would you say you were:
5. strongly in favor,
4. somewhat in favor,
3. without an opinion,
2. mildly opposed, or
1. strongly opposed?
15. And how do you feel about that group home now ? Would you say that you are:
5. strongly in favor,
4. somewhat in favor,
3. without an opinion,
2. mildly opposed, or
1. strongly opposed?
(ALL SKIP TO Q. 17)
16. Imagine that a group home was located in your neighborhood, thinking about your feelings, would you be:
5. strongly in favor,
4. somewhat in favor,
3. without an opinion,
2. mildly opposed, or
1. strongly opposed?
17. Finally, we would like to know approximately how much total income your household received from all sources in 1980--that is, including Social Security benefits, pension, earnings, etc. Was it:
1. under $3,000
2. $3,000 - $4,999
3. $5,000 - $9,999
4. $10,000 - $14,999
5. $15,000 - $19,999
6. $20,000 - $25,000, or
7. over $25,000?
8. Refused
9. Dont know
THANK YOU VERY MUCH FOR YOUR PARTICIPATION. I’VE ENJOYED TALKING TO YOU. GOODBYE.
18. RECORD ANY OBSERVATIONS ABOUT THE INTERVIEW. (BE SURE TO NOTE ANY REFERENCES TO THE PENNHURST DECISION AND/OR OTHER SURVEYS.) ____________________________
LIST OF PUBLICATIONS
| REPORTS OF THE PENNHURST LONGITUDINAL STUDY TEMPLE UNIVERSITY | |||
|---|---|---|---|
| CODE NO. | TITLE (Authors) | DATE | PRICE |
| PC-79-2 | Report on Assessment of Institutional Environments (Conroy) | 10/79 | $6.00 |
| PC-80-2 | Attitudes Toward the Mentally Retarded in Selected Communities: Technical Report of Preliminary Findings (Institute for Survey Research) | 11/80 | $6.00 |
| PC-80-3 | Family Impacts Baseline: A Survey of the Families of the Residents of Pennhurst (Keating, Conroy, Walker) | 12/80 | $8.00 |
| PC-80-4 | A Report on Client Progress at Pennhurst (Lemanowicz, Feinstein, Efthimiou, Conroy) | 02/81 | $4.00 |
| PC-81-1 | Preliminary Analysis of Client Progress, Pre and Post Relocation: A Matched Comparison Study (Conroy, Efthimiou, Lemanowicz) | 02/81 | $4.00 |
| PC-81-2 | Year 02 Client Satisfaction Report (Baseline): Interviews with 56 Pennhurst Clients (Walsh, Conroy) | 07/81 | $6.00 |
| PC-81-4 | Models of Change in Attitudes Toward Mentally Retarded Persons (Walbridge, Whaley, Conroy) | 08/81 | $6.00 |
| PC-81-5 | Changes in Community Attitudes: Technical Report (Walbridge, Conroy) | 10/81 | $6.00 |
| PC-82-1 | Family Impacts: Prepost Attitudes of 119 Families of Clients Deinstitutionalized June 1980 to May 1982 (Latib, Conroy) | 08/82 | $6.00 |
| PC-83-1 | The Pennhurst Longitudinal Study: Third Year Comprehensive Report (Bradley, Conroy) [ http://aspe.hhs.gov/daltcp/reports/3yrpenn.htm] | 10/82 | $12.00 |
| PC-83-3 | Temple University and Human Services Research Institute. Pennhurst Longitudinal Study, 1979 to 1983: Fourth Year Summary | 11/83 | $6.00 |
| BRIEF REPORTS | |||
|---|---|---|---|
| CODE | TITLE (Authors) | DATE | PRICE |
| BR-1 | Development of Former Pennhurst Residents Who Are Now in CLAs in Montgomery County (Conroy, Lemanowicz, Sokol, Pollack) | 10/16/80 | $2.00 |
| BR-2 | Reliability of the Behavior Development Survey: Services Received by Clients (Lemanowicz, Feinstein, Conroy) | 11/18/80 | $2.00 |
| BR-3 | Matched Comparison Study of Adaptive Behavior Growth Among Deinstitutionalized Clients (Conroy, Efthimiou, Lemanowicz) | 11/10/80 | $2.00 |
| BR-4 | Trends in Residential Service Patterns in Southeast Pennsylvania (Efthimiou, Conroy) | 11/21/80 | $2.00 |
| BR-5 | Trends in Discharges and Releases From Pennhurst (Conroy, Pollack) | 12/11/80 | $2.00 |
| BR-6 | Medical Needs of Clients: Perceptions of Relatives and of Staff (Conroy, Feinstein Lemanowicz) | 02/17/81 | $2.00 |
| BR-7 | Summary of Services Reported at Pennhurst Center (Lemanowicz) | 03/04/81 | $2.00 |
| BR-8 | Developmental Growth Among the Residents of Pennhurst: What Factors Are Related to Growth (Conroy, Lemanowicz) | 03/24/81 | $2.00 |
| BR-9 | Update of the Status of the Pennhurst Deinstitutionalization, March 1, 1981 (Feinstein) | 03/30/81 | $2.00 |
| BR-10 | Survey of Families of Clients Deinstitutionalized Fro the Date of the Court Order to April 30,1980 (Conroy) | 07/31/81 | $2.00 |
| BR-11 | Reliability of the Behavior Development Survey Maladaptive Behavior Section (Conroy, Efthimiou, Lemanowicz) | 08/05/81 | $2.00 |
| BR-12 | Update of the Status of the Pennhurst Deinstitutionalization (Feinstein, Conroy) | 08/31/82 | $2.00 |
| BR-13 | Progress of Clients in CLAs: Class Members Compared to Others (Feinstein, Lemanowicz, Conroy) | 09/19/81 | $2.00 |
| BR-14 | The Pattern of Discharges from Pennhurst Under Court Order, March 1978 to August 1981 (Lemanowicz, Efthimiou) | 09/30/81 | $2.00 |
| BR-15 | The Progress of Phila. CLA Residents from 1981 to 1982: A Matched Comparison of Class and Non-Class Members (Lemanowicz, Kilkenny) | 03/10/93 | $2.00 |
| BR-16 | A Quantitative Overview of Pennhurst Center: 1978 to 1983 (Lemanowicz, Conroy, Feinstein) | $2.00 | |
| BR-17 | Increase in IQ Among Pennhurst Plaintiff Class (Baus, Conroy, Hess) | $2.00 | |
| BR-18 | Stability of CLAs in SE Pennsylvania, 1980-84 (Conroy, Feinstein, Weiss) | $2.00 | |
| ORDER FORM | ||||
|---|---|---|---|---|
| Please enclose check payable to TEMPLE UNIVERSITY with order form and mail to: Kathy Ann Baus, Developmental Disabilities Center, Ritter Hall Annex -- 9th Floor, Temple University, Philadelphia, PA 19122. Note :
| ||||
| QUANTITY | CODE NO. | PRICE | TOTAL | Name______________________________________ |
| _________ | _________ | ______ | ______ | Organization_________________________________ |
| _________ | _________ | ______ | ______ | Address____________________________________ |
| _________ | _________ | ______ | ______ | ___________________________________________ |
| _________ | _________ | ______ | ______ | City________________________ State___________ |
| _________ | _________ | ______ | ______ | Zip Code___________________ |
| _________ | _________ | ______ | ______ | |
| _________ | _________ | ______ | ______ | |
| TOTAL ENCLOSED = | $_____________ | |||
| HUMAN SERVICES RESEARCH INSTITUTE | |||
|---|---|---|---|
| CODE NO. | TITLE (Authors) | DATE | PRICE* |
| * Prices include printing and postage. | |||
| HOI | Longitudinal Study of the Court-Ordered Deinstitutionalization of Pennhurst -- Historical Overview I (Pre-litigation through December 13, 1979) | 04/07/80 | $18.00 |
| IAOSM | Longitudinal Study of the Court-Ordered Deinstitutionalization of Pennhurst -- Implementation Analysis: Office of the Special Master | 12/10/80 | $10.00 |
| HOII | Longitudinal Study of the Court-Ordered Deinstitutionalization of Pennhurst -- Historical Overview II and Legislative Analysis (December 1979 to July 1980) | 01/15/81 | $10.00 |
| HOIII | Longitudinal Study of the Court-Ordered Deinstitutionalization of Pennhurst -- Historical Overview III | 07/15/81 | $14.00 |
| HOIV | Longitudinal Study of the Court-Ordered Deinstitutionalization of Pennhurst -- Historical Overview IV (March 3, 1981 to August 31, 1981) | 12/21/81 | $18.00 |
| IADPW | Longitudinal Study of the Court-Ordered Deinstitutionalization of Pennhurst -- Implementation Analysis: Department of Public Welfare | 03/05/82 | $10.00 |
| HOV | Longitudinal Study of the Court-Ordered Deinstitutionalization of Pennhurst -- Historical Overview V (September 1, 1981 to March 31, 1982) | 07/13/82 | $14.00 |
| HOVI | Longitudinal Study of the Court-Ordered Deinstitutionalization of Pennhurst -- Historical Overview VI (April 1, 1982 to September 30, 1982) | 01/21/83 | $10.00 |
| IAIII | Longitudinal Study of the Court-Ordered Deinstitutionalization of Pennhurst -- Implementation Analysis #3: Issues Affecting Complex Litigation | 08/15/83 | $10.00 |
| BU83 | Longitudinal Study of the Court-Ordered Deinstitutionalization of Pennhurst -- Brief Update (October 1, 1982 to June 30, 1983) | 08/15/83 | $5.00 |
| COMPAN | Longitudinal Study of the Court-Ordered Deinstitutionalization of Pennhurst -- Comparative Analysis of the Costs of Residential and Day Services Within Institutional and Community Settings | 12/15/83 | $10.00 |
| COANAL | Longitudinal Study of the Court-Ordered Deinstitutionalization of Pennhurst -- Comparative Analysis of the Costs of Residential, Day and Other Programs Within Institutional and Community Settings/Final Report | 08/15/84 | $15.00 |
| IAIV | Longitudinal Study of the Court-Ordered Deinstitutionalization of Pennhurst -- Implementation Analysis #4 -- Impact of the Decree in Pennsylvania | 03/01/85 | $10.00 |
| REPORTS OF THE PENNHURST LONGITUDINAL STUDY | ||||
|---|---|---|---|---|
| Please enclose check payable to Human Services Research Institute with order form and mail to Emily Cravedi; Publications Coordinator, Human Services Research Institute, 120 Milk Street -- 8th Floor, Boston, MA 02109. Note:
THANK YOU VERY MUCH FOR YOUR INTEREST. | ||||
The Pennhurst Longitudinal Study is concerned with the Federal Court order of March 17, 1978, to relocate the 1155 residents of Pennhurst to small community-based settings, i.e., “group home” or “group apartments.” The study is concerned with the policy issues of national scope that have been raised by the case, with the cost of care, with the impact on the service delivery system, and with the impacts upon the clients, their families, and the receiving communities. Human Services Research Institute (HSRI) is primarily concerned with the former issues. HSRI’s work falls into three major areas:
| ||||
| ORDER FORM | ||||
| QUANTITY | CODE NO. | PRICE | TOTAL | Name______________________________________ |
| _________ | _________ | ______ | ______ | Organization_________________________________ |
| _________ | _________ | ______ | ______ | Address____________________________________ |
| _________ | _________ | ______ | ______ | ___________________________________________ |
| _________ | _________ | ______ | ______ | City________________________ State___________ |
| _________ | _________ | ______ | ______ | Zip Code___________________ |
| _________ | _________ | ______ | ______ | |
| _________ | _________ | ______ | ______ | |
| TOTAL ENCLOSED = | $_____________ | |||
PUBLISHED MATERIALS
Bradley, V.J. (1985). Implementation of Court and Consent Decrees. In R. Bruininks and C. Lakin (Eds.), Living and Learning in the Least Restrictive Environment, (pp. 81-96).
Conroy, J., Efthimiou, J., and Lemanowicz, J. (1981). A matched comparison of the developmental growth of institutionalized and deinstitutionalized mentally retarded clients. American Journal of Mental Deficiency, 86, 581-587.
Latib, A., Conroy, J., and Hess, C. (1984). Family attitudes toward deinstitutionalization. In N. Ellis and N. Bray (Eds.), International Review of Research in Mental Retardation, Vol. 12. (pp. 67-93). Orlando: Academic Press.
Sokol-Kessler, L., Conroy, J., Feinstein, C., Lemanowicz, J., and McGurrin, M. (1983). Developmental progress in institutional and community settings. The Journal of the Association for the Severely Handicapped, 8 (Fall), 43-48.
Conroy, J. (1985). Reactions to deinstitutionalization among parents of mentally retarded persons. In R. Bruininks and C. Lakin (Eds.), Living and Learning in the Least Restrictive Environment, (pp. 141-152), Baltimore: Paul H. Brookes.
Jones, P., Conroy, J., Feinstein, C., and Lemanowicz, J. (1985). A matched comparison study of cost-effectiveness: Institutionalized and deinstitutionalized people. The Journal of the Association for Persons with Severe Handicaps, 9 (4) (Winter).
NOTES
-
This appendix is a recreation of the questions asked on the survey. It is not an exact replica of the form itself. A copy of the survey is available in the PDF version of this report at http://aspe.hhs.gov/daltcp/reports/5yrpenn.pdf.