
ASPE Issue Brief
Growth In Medicare Spending Per Beneficiary Continues To Hit Historic Lows
January 7, 2013
By:
Richard Kronick and Rosa Po
Summary
Medicare spending per beneficiary grew just 0.4% per capita in fiscal year 2012, continuing a pattern of very low growth in 2010 and 2011. Together with historically low projections of per capita growth from both the Congressional Budget Office and the Centers for Medicare and Medicaid Services (CMS) Office of the Actuary, these statistics show that the Affordable Care Act has helped to set Medicare on a more sustainable path to keep its commitment to seniors and persons with disabilities today and well into the future. The success in reducing the rate of spending growth has been achieved without any reduction in benefits for beneficiaries. To the contrary, Medicare beneficiaries have gained access to additional benefits, such as increased coverage of preventive services and lower cost-sharing for prescription drugs.
Expenditures per Medicare beneficiary increased by only 0.4% in fiscal year 2012, substantially below the 3.4% increase in per capita GDP (Exhibit 1).1 The very slow growth in Medicare spending in fiscal year 2012 follows slow growth in 2010 and 2011. In 2010, spending grew at only 1.8% per beneficiary, and in 2011 at 3.6 %. Over the three year period from 2010-2012, Medicare spending per beneficiary grew an average of 1.9% annually, or more than 1 percentage point more slowly than the average annual growth of 3.2% in per capita GDP (that is, at GDP-1.3).
Exhibit 1. Annual Increase in Medicare Spending Per Beneficiary and GDP Per Capita
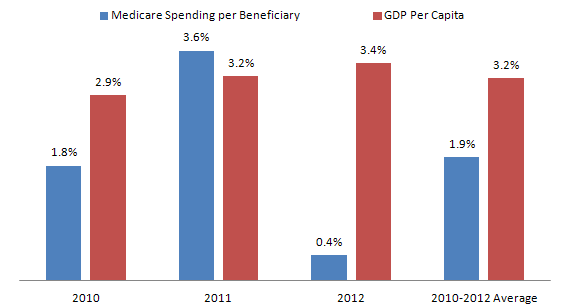
Note: 2010 and 2011 statistics are calculated on a calendar year incurred-basis. 2012 statistics are calculated on a fiscal year cash-basis, because calendar year incurred-basis data are not yet available.
Source: Medicare spending for 2010 and 2011 from the CMS National Health Expenditures data published in Health Affairs, January 2013; Medicare spending for FY 2012 from Office of the Actuary, CMS; GDP per capita for 2010 and 2011 from the CMS National Health Expenditures data published in Health Affairs, January 2013; GDP per capita for FY 12 calculated from BEA and Census data.
Further, both the Congressional Budget Office (CBO) and the CMS Office of the Actuary (OACT) project Medicare spending per beneficiary will grow at approximately the rate of growth of per capita GDP over the next decade, even assuming that the Medicare physician payment system is adjusted to avoid large formula-driven cuts in payment rates to physicians2. For 2013-2022, CBO projects growth of GDP minus 0.3 percentage points assuming an adjustment to the physician payment formula, and OACT projections covering the 2012-2021 period are similar (Exhibit 2). In contrast, in the four decades from 1970 to 2010, Medicare spending per beneficiary grew at approximately GDP plus 2.7 percentage points.3
Exhibit 2. Projected and Historicval Annual Growth Rates of Medicare Spending Per Beneficiary In Excess of GDP
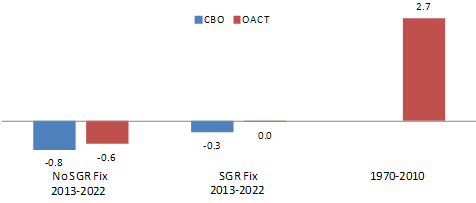
Source: Medicare Spending Per Beneficiary from 1970-2010 from OACT data on incurred costs; GDP per capita for 1970-2010 from BEA historical data; 10 year future projections and SGR fix data from OACT projections of incurred costs and CBO projections. CBO's SGR fix assumes resetting the SGR Target at 2011 Spending Levels and using GDP +1% in Target. OACT’s SGR fix assumes that payment rates will increase at 1% per year.
The slow growth in spending per beneficiary from 2010 to 2012 combined with the projections of spending growth at GDP+0 for 2012-2022 is unprecedented in the history of the Medicare program. If sustained, the slower growth would improve Medicare’s ability to meet its commitments to seniors and persons with disabilities in future generations.
The Affordable Care Act is an important factor contributing to slow growth in spending per beneficiary in 2011 and 2012, and is the primary cause of the projections of continued slow growth over the next decade. The Affordable Care Act restrains the rate of growth of payments to Medicare Advantage plans, restrains the rate of growth in unit payments to hospitals and other providers, promotes value-based payment systems, and makes major investments to reduce fraud and abuse. The CBO estimated that these provisions of the Affordable Care Act would reduce Medicare spending by $3 billion in 2011, and $10 billion in 2012, with comparable OACT estimates of $6.5 billion in 2011 and $13.5 billion in 2012, or approximately a 1% reduction in spending per beneficiary in 2011, and more than a 2% reduction in 2012. Both the CBO and OACT estimate that the Affordable Care Act will reduce the rate of growth of spending per beneficiary by approximately 1 percentage point per year over the ten year budget window.4,5
In addition, the Affordable Care Act provides CMS the flexibility to implement a wide range of innovations designed to transform the delivery system by paying for value not volume. These innovations include fostering the growth of Accountable Care Organizations, Primary Care Medical Homes, bundled payments for acute and post-acute care, reducing the frequency of readmissions, reducing hospital acquired infections, and reducing fraudulent activity. These innovations are in the early stages of development, but they have the potential for reducing expenditure growth below projected levels.
The economic recession may have contributed to the 2010-2012 decrease in per beneficiary spending growth as consumers used less care due to its cost. However, as almost all Medicare beneficiaries have supplemental coverage and thus face relatively low out-of-pocket costs, it seems unlikely that consumer behavior alone is responsible for the slow growth in Medicare spending.6,7
Another relatively small contributor to slowing growth trends for Medicare costs per beneficiary is demographics. As the baby boomers become eligible for Medicare benefits, the average age of Medicare beneficiaries will decline somewhat over the coming decade. The changing age structure of Medicare beneficiaries will cause expenditures per beneficiary to grow by approximately 0.2% per year more slowly over the next decade then they would if the age structure were constant.8 This marginal difference does not account for the very large difference between projected annual spending growth over the next decade of approximately GDP+0 and the historical experience of GDP+2.7.9
While the Affordable Care Act has made important progress in reducing Medicare spending per beneficiary, there is still work to be done. The President’s budget for Fiscal Year 2013 includes a number of policies to make Medicare a smarter purchaser of care, promote value and reduce overpayments and fraud.10
The aging of the US population will put strain on the financing of the Medicare program. Although growth in spending per beneficiary is projected at or below the rate of GDP per capita, the number of Medicare beneficiaries is projected to grow at approximately 3% annually. As a result, aggregate Medicare spending will account for a growing share of GDP over the next decade. As shown in Exhibit 3, most of the increase in Medicare spending as a fraction of GDP from 2013 to 2035 is projected to result from the effects of aging and growth in the number of beneficiaries, with very little of it a result of excess growth in expenditures per beneficiary. Further reducing per beneficiary cost growth below the projected level of GDP+0 is an important component of responding to fiscal pressure. But recent reductions in the growth of Medicare per beneficiary spending and projections for the next decade offer strong evidence that we have made great progress. Moreover, the Affordable Care Act provides a platform for the development of innovations in the delivery of and payment for health care, with the potential for significant improvements in both the quality of health care and its cost-efficiency. Such innovations would not only improve health care for Medicare beneficiaries in the future but also for the population at large.
Exhibit 3. Culmulative Contribution of Aging and Excess Cost Growth to Medicare Spending Under OACT’s Alternative Scenario, 2013-2035
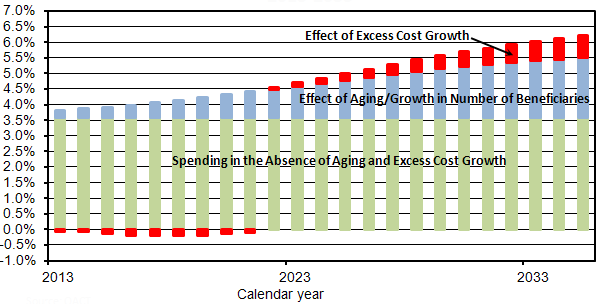
Source: Office of the Actuary, CMS Note: Analysis assumes that physician payment rates increase at 1% per year from 2013-2035, and does not reflect the 0% update in the American Taxpayers Relief Act of 2012.
Appendix:
OACT projections and historical spending per Medicare beneficiary data available at:
- http://content.healthaffairs.org/content/32/1/87.full.pdf+html
- http://www.cms.gov/Research-Statistics-Data-and-Systems/Statistics-Trends-and-Reports/ReportsTrustFunds/Downloads/TR2012.pdf
- http://www.cms.gov/Research-Statistics-Data-and-Systems/Statistics-Trends-and-Reports/NationalHealthExpendData/Downloads/Proj2011PDF.pdf
OACT SGR projections available at:
OACT projections of spending per Medicare beneficiary for prior law baseline available at:
CBO projections of spending per Medicare beneficiary data available at:
CBO SGR projections available at:
CBO projections of spending per Medicare beneficiary for ACA repeal available at:
GDP per capita data available at:
- http://content.healthaffairs.org/content/early/2012/06/11/hlthaff.2012.0404.full.pdf+html
- http://www.census.gov/popest/data/national/totals/2011/index.html
- http://www.bea.gov/national/
Endnotes:
1 Office of the Actuary, CMS adjusted figure for spending growth in fiscal year 2012. The unadjusted growth rate was -5.5%. However, due to anomalies in the payment cycle, only 11 months of payments to Medicare Advantage plans were made in fiscal year 2012, while 13 months of MA payments were made in fiscal year 2011. OACT adjusted these spending amounts to include 12 months of MA payments in each year, leading to the estimate of 0.4% per beneficiary growth in spending from 2011 to 2012. Estimated spending for calendar year 2012 is not yet available. All other spending estimates in this brief are presented on a calendar year basis.
2 The analysis assumes that payments rates increase at 1% per year from 2013-2035, and does not reflect the 0% update in the American Taxpayers Relief Act of 2012.
3 Medicare Spending Per Beneficiary from 1970-2010 from OACT data on incurred costs; GDP per capita for 1970-2010 from BEA historical data
4 Congressional Budget Office, “Letter to the Honorable Nancy Pelosi” (2010), available at http://www.cbo.gov/sites/default/files/private/cbofiles/ftpdocs/113xx/doc11379/a...
5 CMS Office of the Actuary, “Estimated Financial Effects of the ‘Patient Protection and Affordable Care Act,’ as Amended” (2010), available at http://www.cms.gov/Research-Statistics-Data-and-Systems/Research/Actuari...
6 Chapin White and Paul B. Ginsburg. “Slower Growth in Medicare Spending — Is This the New Normal?” N Engl J Med 2012; 366:1073-1075.
7 Steven Sheingold, Adele Shartzer and Dan Ly. “Variation and Trends in Medigap Premiums” ASPE Report 2011, available at: variation-and-trends-medigap-premiums
8 Estimate provided by the Office of the Actuary, CMS
9 A number of factors contribute to the difference between the past and projected future rates of growth in Medicare expenditures per beneficiary. As noted, the Affordable Care Act will permanently reduce the rate of growth in payment rates for most categories of providers. Other factors affecting the comparison include the lower rates of general and medical-specific inflation expected to prevail in the future and the replacement of virtually all prior cost-based reimbursements with prospective payment systems.
10 President’s Budget for Fiscal Year 2013 available at: http://www.whitehouse.gov/omb/budget