
U.S. Department of Health and Human Services
Effects of Medicare's Hospital Prospective Payment System (PPS) on Disabled Medicare Beneficiaries
Korbin Liu, Sc.D., The Urban Institute
Kenneth G. Manton, Ph.D., Duke University
February 1988
This report was prepared under contract #18-C-98641 between the U.S. Department of Health and Human Services (HHS), Office of Social Services Policy (now known as the Office of Disability, Aging and Long-Term Care Policy) and the Urban Institute. Funds were also provided by the Health Care Financing Administration. For additional information about the study, you may visit the DALTCP home page at http://aspe.hhs.gov/daltcp/home.htm or contact the office at HHS/ASPE/DALTCP, Room 424E, H.H. Humphrey Building, 200 Independence Avenue, SW, Washington, DC 20201. The e-mail address is: webmaster.DALTCP@hhs.gov. The DALTCP Project Officer was Floyd Brown.
Conclusions in this report are solely those of the authors, and do not necessarily reflect the view of the Urban Institute, Duke University, or the Department of Health and Human Services
ACKNOWLEDGMENTS
We wish to thank many people who helped us throughout the course of this project. Mary Harahan, who first recognized the unique opportunity offered by the 1982 and 1984 NLTCS to study PPS effects on disabled beneficiaries, catalyzed the research leading to this report. Our project officers, Floyd Brown and Herb Silverman, along with Tony Hausner, ensured the timely availability of data sets and provided helpful suggestions on technical and substantive issues. Paul Eggers, Jim Vertrees, Bob Clark and Judy Sangl read earlier drafts of this report and provided many insightful comments and suggestions. While we benefited from the collective knowledge of the individuals noted, and others, we are solely responsible for the results and conclusions reported.
EXECUTIVE SUMMARY
Medicare's prospective payment system (PPS) reimburses hospitals on a casemix adjusted, flat-rate basis. This method of payment provides incentives for hospitals to serve patients as efficiently as possible, possibly by reducing length of stay and increasing use of skilled nursing facility (SNF) and home health (HHA) care. While increased SNF and HHA use might be viewed as an intended consequence of PPS, there has been concern that PPS induced changes in the duration and location of care would affect quality of care received by Medicare beneficiaries. Moreover, a particular concern was that the frail and disabled elderly would be disproportionately affected by the utilization changes resulting from the introduction of PPS.
Purpose
Several studies have examined PPS effects on the total Medicare population. The purpose of this study was to examine the effects of PPS on the subgroup of Medicare beneficiaries who were functionally disabled. The specific aims of this study were to measure changes in Medicare service use and to evaluate the effects of these changes on quality of care in terms of hospital readmission and mortality.
To focus on disabled persons, Medicare service use patterns of the samples of disabled Medicare beneficiaries in the 1982 and 1984 National Long Term Care Surveys (NLTCS) were analyzed. With Medicare Part A bills for the NLTCS samples of approximately 6,000 persons in 1982 and 1984, this study compared utilization patterns in one-year periods pre-PPS (1982-83) and post-PPS (1984-85). Service use measures that were analyzed were hospital admissions, Medicare hospital length of stay (LOS), SNF and HHA use. In this study, hospital readmission and mortality were viewed as indicators of quality of care. A multivariate clustering methodology was employed to identify relatively homogeneous subgroups of disabled Medicare beneficiaries so that utilization changes could be compared for medically and functionally similar cases as well as for the total disabled population.
Findings
Hospital LOS. The study found that expected reductions in lengths of hospital stays occurred under PPS, although this reduction was not uniform for all admissions and appeared to be concentrated in subgroups of the disabled population. For example, while persons who were "mildly disabled" experienced reductions in LOS (10.8 days to 8.2 days), persons who had "heart and lung" problems experienced virtually no changes in hospital LOS (10.5 days to 10.6 days).
Post Acute SNF Use. The study found virtually no changes in Medicare SNF use after PPS was implemented. In fact, a slight decline in hospital episodes resulting in SNF admissions (5.2% to 4.7%) was observed.
Post Acute HHA Use. Different from PPS effects on SNF use, the study found an increase in hospital episodes resulting in the use of HHA services (12.6% to 15.6%). In addition, HHA use without prior hospital stay increased from 13.6% to 21.5%.
Outcomes. In terms of outcomes of hospital use related to quality of care, no difference in overall readmissions or mortality pre- and post-PPS were found. For example, the proportions of hospital episodes resulting in readmission within the one-year observation periods were 39.3% pre-PPS and 38.4% post-PPS. Proportions of episodes resulting in death in the observations periods were 12.1 % pre-PPS and 12.5% post-PPS. In a further analysis of these measures, the hospital cases were stratified by whether they were followed by post-acute SNF or HHA use. Post-acute use of SNF or HHA did not influence either hospital readmission or mortality rates. Analysis of subgroups of the disabled population also showed few differences in pre-post PPS hospital readmissions and mortality.
Limitations and Conclusions
This study on the effects of hospital PPS on Medicare beneficiaries has certain limitations. The available data precluded analyses of other service episodes such as traditional nursing home stays. At the time the study was conducted, data were not available to measure use of Medicare Part B services. Detailed service-specific, casemix information (e.g., DRGs) was unavailable for comparison in pre- and post-PPS observation periods. Finally, the analysis was not specifically designed to evaluate the effects of PPS on the need for or use of "aftercare" in the community.
In conclusion, this study of the effects of hospital PPS on the functionally impaired subgroup of Medicare beneficiaries indicated no system-wide adverse outcomes. Further research on the community services, nursing home use and other types of care would be necessary to develop a complete picture of the effects of PPS on disabled Medicare beneficiaries.
I. INTRODUCTION
This report describes a study to measure changes in the pattern of Medicare service use resulting from the implementation of the prospective payment system (PPS) for Medicare hospital reimbursement. Distinct from prior studies which addressed the general Medicare population, our analysis focused on PPS effects on disabled elderly Medicare beneficiaries. Our specific aims were to measure changes in Medicare service use and to evaluate the effects of these changes on quality of care in terms of hospital readmission and mortality. In the following sections, we first discuss the background for this study. Second, we describe data sources and methodology. Third, we present findings. Finally, we discuss the implications of our findings and review the limitations of this study.
II. BACKGROUND
Medicare's prospective payment system (PPS) for hospital inpatient care was implemented in October, 1983. Under this system, payment for care is made on a fixed price per case, based on the average cost for a patient in a given Diagnosis Related Group (DRG). This system of payment provides incentives for hospitals to use resources efficiently, but it contains incentives to avoid patients who are more costly than the DRG average and to discharge patients as early as possible (Iezzoni, 1986). These incentives suggest that nursing homes and home health care with lower per them costs would be employed as substitutes for hospital days. They may also increase the risks that hospital patients are discharged inappropriately and have to be readmitted. In light of the potential effects of Medicare PPS on the utilization, costs and quality of care for Medicare beneficiaries, assessments of the effects of the new reimbursement policy have been of interest to the Administration and Congressional policy makers.
Because the PPS system has been introduced only recently, evaluations of the effects of the policy on Medicare beneficiaries have been limited. In the following, we briefly discuss five studies that addressed various dimensions of the effects of PPS on hospital utilization and outcomes of patients.
One study recently published by researchers at the Commission on Professional and Hospital Activities (CPHA) employed data from the CPHA sponsored Professional Activity Study (PAS) to examine changes in pre- and post-PPS differences in utilization and outcomes (DesHarnais, et al., 1987). Third-quarter data from a cohort of 729 short-term acute care hospitals for 1980-1984 were used in this analysis. A linear forecasting model to project 1984 measures of utilization and outcomes based on trends from 1980 to 1983 was developed to compare the expected 1984 measures to observed 1984 measures. Results from this analysis included findings that total Medicare discharges and length of stay of Medicare hospital patients decreased in the post-PPS period. The analysis also found significant changes in the proportions of hospital patients discharged home to self care and home health care. The proportion discharged to self-care dropped more than 3%, while the proportion discharged home with home health care rose almost 2%. The analysis suggested that the shorter Medicare stays are being supplemented with more use of home health agencies for post-discharge care. Significant increases were also found for the proportion of Medicare discharges transferred to other facilities (e.g., rehabilitation units). In-hospital mortality rates for Medicare patients declined slightly in 1984 although the decline was not statistically significant. Finally, hospital readmissions did not change significantly between the pre- and post-PPS periods, although the measure of hospital readmission that was used was very limited, i.e., readmission to the same hospital during the same quarter of observation.
The CPHA researchers concluded that, while the results of the study provided initial insights, further analysis on the effects of PPS was required because of identifiable limitations of the study (DesHarnais, et al., 1987). For example, use of the PAS data precluded measurement of post-discharge mortality figures. In addition, some discrepancies may have existed between disposition of patients discharged from hospital, as recorded by hospital records, and the actual destination after discharge. A different measure of hospital readmission might also yield different results. Finally, as indicated by the researchers, these analyses measured the short-term effects of PPS; utilization and outcome measures beyond 1984 could also yield different conclusions.
In a second study, Krakauer (HCFA, 1987) analyzed the effectiveness of care provided to Medicare beneficiaries during hospitalization and thereafter in 1983-85. He assessed mortality rates, rates of hospital readmission, use of ambulatory and supportive care and mortality rates. The data employed in this study were Medicare bills submitted for hospitalization and ambulatory care and for limited intermediate care and skilled nursing facility services, and mortality information. The analyses employed a random 5 percent sample of patients who were admitted to and discharged from short-stay hospitals in 1983-85. Post-hospital outcomes such as readmission and mortality were indexed relative to the first hospital admission in a given year.
Krakauer found that while hospital admission rates continued to decline during the study period, 1983-85, there was not a significant increase in the incidence of readmissions. The proportion of persons with no readmissions were 65.0%, 65.8% and 67.3% for the three years. Age-adjusted mortality rates of the total Medicare beneficiary population remained essentially the same in the 3 years, 5.1 percent, although the cumulative mortality rate following an initial admission in a calendar year increased slightly between 1983-84 and 1985. In 1983 and 1984, post-hospital mortality rates were 5.9 percent at 30 days after the first hospital admission and 19.7 percent at one year after the first hospital admission. In 1985, the corresponding rates were 6.8 percent and 21.2 percent. Analyses of the characteristics of hospital admissions suggested that approximately half of the increase in post-hospital mortality was accounted for by an increase in the proportion of admissions for conditions associated with higher mortality risks. Moreover, Krakauer suggested that another part of the difference in mortality rates could be due to an increase in the severity of illness of admitted patients.
In addition to the analysis of the total sample of Medicare hospital patients, Krakauer examined changes in the outcome of nine tracer conditions and procedures. This analysis found a heterogeneous pattern of changes in mortality rates with small increases for high-risk medical admissions but marked decreases in mortality rates following hip or knee replacement and marked increases in mortality following coronary artery bypass graft surgery. Readmissions to hospitals were likely immediately following discharge, with 9-22 percent of the persons at risk of readmission in the tracer conditions being readmitted within 30 days of discharge, while the rate dropped to 4-9 percent for persons at risk of readmission beyond the period 30 days after discharge. Krakauer concluded that "overall, no adverse trends in the outcomes of the medical care provided Medicare beneficiaries are discernible as yet."
In a third study, Conklin and Houchens (1987) assessed changes in mortality rates of Medicare hospital admissions between fiscal years 1984 and 1985, while adjusting for differential case-mix severity in the two years. Mortality was evaluated in a fixed 30-day interval from admission. Disease severity was defined with the Disease Staging methodology and was used to form a patient classification system based on mortality risk. Severity of principal disease, number of high risk comorbidities, age and sex formed the basis of the classification system. Methods of indirect standardization were used to derive a 1985 expected overall mortality rate based on 1984 mortality rates per severity level. Comparisons were then made between the expected (severity adjusted) mortality rate and the observed 1985 mortality rates. This study used data from the 20 percent MEDPAR files for fiscal years 1984 and 1985, and records of deaths from Social Security entitlement files.
Conklin and Houchens found that while crude 30-day mortality rates increased by 9.3% between 1984 and 1985, all of this increase could be explained by the increase in case-mix severity between the two years. Specifically, principal disease accounted for approximately 46 percent of the change in mortality from 1984 to 1985, while the severity of principal diseases explained an additional 35 percent of the 1984-85 change. Finally, after controlling for the number of high risk comorbidities within each stage and principal disease, the results suggested a higher mortality count in 1985 than was actually observed. In addition, the researchers found that an observed 8.7 percent decrease in Medicare hospital admission rates between the two years was primarily caused by a decline in the hospitalization of low severity patients. As a result, the Medicare hospital population in 1985 was, on average, more severely ill and at greater risk of mortality than in 1984. The collective results of the study led the authors to conclude that there was no evidence to indicate that the quality of care has declined during the first two years of PPS.
While the first three studies examined effects of PPS in multiple hospitals in multiple states, two other studies focused on more circumscribed populations. One of these studies (Sager, et al., 1987) examined the impact of PPS on Medicaid nursing home patients in Wisconsin. The other study (Fitzgerald, et al., 1987), analyzed changes in the pattern of hip fracture care before and after PPS.
Sager and his colleagues reviewed hospitalization and mortality data on Wisconsin's elderly Medicaid nursing home population. Hospitalization data were available from the Wisconsin Medicaid program for the period from 1982 through 1984, while mortality data were obtained for the years 1980 through 1985. This study examined hospitalization rates and hospital lengths of stay and location of death of the Medicaid patients. In addition, changes in patterns of hospitalization were compared between the institutionalized and noninstitutionalized elderly patients. The authors reported that during the 12 months following the implementation of PPS, Wisconsin's institutionalized elderly Medicaid population experienced a 72 percent increase in the rate of hospitalization and a 26 percent decline in hospital length of stay. In contrast to the institutionalized elderly, the noninstitutionalized elderly experienced a 7 percent decrease in the rate of hospitalization and a 13 percent decrease in the mean length of stay.
The authors posited two possible explanations for the increased hospitalization of institutionalized persons: (1) physician manipulation of PPS by discharging nursing home residents only to have them scheduled for readmission at a later date and (2) shorter hospital stays representing premature hospital discharges that resulted in more frequent rehospitalizations. The authors noted that since changes in hospitalization were seen only in the institutionalized population, the possibility existed that the frail elderly may represent a unique segment of the Medicare population that is vulnerable to the changes in health care provision encouraged by PPS. "Characterized by multiple disabilities and impaired resilience during illness, this group of elderly is dependent on both short- and long-term care services and would seem potentially susceptible to health care policies that alter the interplay between hospital and post-hospital services."
Sager and his colleagues also found that while mortality rates for Wisconsin's elderly population showed minimal variation during the study period (51.1/1000 in 1982 to 53.0/1000 in 1980) between 1982 and 1985, there was an increase of 26 percent in the rate of deaths occurring in nursing homes. The changes in nursing home death rates, which began in 1982, were also associated with a 10.3 percent decline in hospital deaths during the same period. The authors concluded that the shift in location of death from hospitals to nursing homes was more pronounced after the implementation of PPS. They posited that the observed change in location of death could reflect both a less aggressive use of hospital resources by physicians caring for terminally ill patients and a transfer of seriously ill patients to nursing homes for terminal care. The authors noted that both of these explanations suggest that nursing homes may now be caring for a segment of the terminally ill population that had previously been cared for in hospitals.
In the fifth study, Fitzgerald and his colleagues studied the effects of PPS on the care received by hospitalized hip fracture patients. Their hypothesis was that, after PPS, elderly patients hospitalized for hip fractures would receive shorter, less care-intensive hospitalization and would be institutionalized (in nursing homes) more frequently. Data for this study were derived from hip fracture patients at a 430 bed, university-affiliated municipal hospital that primarily served indigent persons in Indianapolis, Indiana. PPS was implemented at this hospital on January 1, 1984. The patients studied were those aged 65 years or older with a new fracture. Patients hospitalized or institutionalized at the time of fracture, with a history of a previous hip fracture, or with a neoplasm as a known or suspected cause were excluded from the study. These screens produced study samples of 47 cases pre-PPS and 23 cases post-PPS. Pre-PPS years included 1981-1983, while the post-PPS years were 1984 and 1985.
The study found no significant differences before and after PPS in the location of the hip fracture, associated proportions or types of comorbid conditions. Also, both groups walked with similar abilities before the fracture. The mean length of stay decreased from 16.6 days to 10.3 days after the implementation of PPS. In addition, the authors found that the reduction in LOS was due primarily to reductions in the period between the initiation of physical therapy and the discharge date. Corresponding with the reduction in this segment of stay after PPS, the authors found a reduction in the mean number of physical therapy sessions received by the patients, which declined from 9.7 to 4.9. The study also found an increase in the proportion of patients discharged to skilled nursing facilities after hospitalizations, from 21 percent to 48 percent. In addition, the proportion of all patients originally hospitalized who were receiving care in a nursing home six months after discharge increased from 13 percent to 39 percent. Similar results were obtained after the authors excluded extended hospitalization cases from the pre-PPS sample.
The authors pointed out that despite shorter stays and less rehabilitation, their results did not unequivocally demonstrate that patients were less ambulatory at hospital discharge, and that differences in the severity of comorbidity, for example, might have explained the differential referral rate to nursing homes in the two periods. In addition, they noted that the higher six month rate of institutionalization in the post-PPS period may have been due to differences in nursing home characteristics, such as physical therapy facilities. However, the increase in six month institutionalization rates suggested that the patients entering nursing homes at discharge were not subsequently regaining the skills needed for independent living. "This failure of the current rehabilitation process emphasizes the inability of the current system to adequately complement acute-care resource reductions with needed long-term care rehabilitation services in patients previously managed with longer hospital stays."
The results of the prior studies provide initial insights on the effects of PPS on Medicare patients. In light of the importance of the landmark policy, continuing research is warranted to fully assess its effects. Our study was designed to provide information to assess PPS effects on the functionally impaired subgroup of Medicare beneficiaries. Many aspects of our study are different from those of the other studies, although the goals are similar. The differences, including sources and types of data and methodological strategies, provide complementary results in most cases in describing the effects of PPS on Medicare service use and outcomes.
III. METHODS
In the following sections, we describe the data source, the analysis plan and the statistical methods employed in this study.
A. The 1982 and 1984 National Long-Term Care Surveys
The data sources for this study were the 1982 and 1984 National Long-Term Care Surveys (NLTCS) of disabled elderly Medicare beneficiaries, and their Medicare Part A bills and Medicare records on mortality. The NLTCS contained detailed information on the health and functional characteristics of nationally representative samples (about 6,000) of noninstitutionalized disabled Medicare beneficiaries in 1982 and in 1984. These characteristics included medical conditions, dependencies in activities of daily living (ADL) and instrumental activities of daily living (IADL). For these samples, Medicare Part A bills on hospital, skilled nursing facility (SNF) and home health service (HHA) use were obtained from the Health Care Financing Administration (HCFA). In addition, mortality events from Medicare enrollment files were obtained. Hence, the research file contained detailed patient characteristics information for two points in time, straddling the implementation of PPS, and complete Medicare Part A hospital, SNF and home health utilization and mortality information. Because the exact dates of service were available from the Medicare Part A bills, it was possible to define periods of Medicare hospital, SNF and HHA service use as well as periods when such services were not used.
The data set that we assembled for this study provided a basis for addressing analytical dimensions that are not generally available on billing records and hospital discharge abstracts alone (Iezzoni, 1986). The NLTCS allowed a broad characterization of cases including multiple chronic complications or co-morbidities and physical and cognitive impairments. Continuous Medicare Part A bills permitted a tracking of persons in the NLTCS samples through different parts of the health care system (i.e., Medicare hospital, SNF and HHA) so that we could examine transitions from acute care hospitals to subsequent experience in Medicare SNF or HHA services. Finally, our use of the Medicare enrollment files allowed us to measure mortality when individuals were receiving Medicare Part A services and also when they were not.
B. Analysis Plan
Our analysis plan was to compare Medicare service utilization for 12-month periods before and after the implementation of PPS. The pre-PPS period was the one-year window from October 1, 1982 through September 30, 1983. The post-PPS period was the one-year window from October 1, 1984 through September 30, 1985. These time frames were selected because detailed patient information based on the NLTCS data were available only for the two years, 1982 and 1984. Hence, the availability of information on a multiplicity of patient characteristics to identify potential PPS effects on specific subgroups of the Medicare population required us to examine utilization patterns in fixed intervals before and after the implementation of PPS. Other researchers, in contrast, addressed the PPS assessment issues using trend analysis strategies (DesHarnais, et al., 1987).
Episodes of Service Use. The unit of observation in this study was an episode of service use rather than a Medicare beneficiary. We selected episodes rather than Medicare beneficiaries because beneficiaries could experience different numbers of episodes of one type of care (e.g., hospital) and different patterns of multiple service use episodes (e.g., hospital, SNF, HHA) during a 12-month period. By analyzing episodes, we were able to compare differences before and after PPS in all types of Medicare services between the two periods. Hence, the length of stay of a third hospital admission for a given beneficiary, for example, would enter the calculation of average hospital length of stay. Because of the large number of combinations of service use experienced by Medicare beneficiaries in a one-year period, it would be practical only to analyze a very limited number of different patterns if we used beneficiaries as the units of observation.
Episodes were defined as periods of service use according to dates coded on the Medicare Part A bills. The complementary intervals of time when these Medicare services were not used were also defined. These "other" episodes refer to intervals when individuals in the sample were not receiving Medicare inpatient hospital, SNF or HHA services. However, they might have been using non-Medicare nursing home services, or other Medicare services such as outpatient care, although, at the time of the selection of the 1982 and 1984 samples, persons in nursing homes were identified as a special subsample. Because of the potential heterogeneity of situations represented by the "other" episodes, pre-post PPS changes in this type of episode must be interpreted with caution.
An episode was based on recorded dates of service use from the Medicare records. Discharge disposition of any type of service episode was based on status immediately following the specific episode. For example, a Medicare hospital episode terminating in discharge to Medicare SNF care would imply that the SNF episode followed within a day of the hospital discharge. Hence, a post-hospital SNF stay, if it started several days after a hospital discharge, would not be recorded as the disposition of the hospital episode. This definition of coterminous services has the potential effect of reducing the rates of post-hospital utilization of SNF or HHA services. However, this definition was applied uniformly for both pre- and post-PPS periods, and we are not aware of any systematic differences in the onset of post-acute services between the two time periods.
Samples of the Medicare utilization information for the community disabled individuals from the 1982 and 1984 NLTCS were drawn for analysis. Episodes of hospital, SNF, HHA and all other episodes were drawn proportionally to the number of each type of service status available. For example, because of the relatively small number of Medicare SNF episodes, all SNF episodes were drawn for the analysis. On the other hand, a random sample of the much more frequent hospital episodes was selected.
Service Use and Outcome Analyses. Events of interest to the study were analyzed in two ways. First, we conducted analyses to measure changes in the length of stay and discharge status of each type of Medicare Part A services. Hospital, SNF and HHA service events were analyzed as independent episodes. For example, all of the hospital episodes in our sample, whether they were the first, second or third hospitalization during the observation window, were included as an individual unit of observation. No inference was made about the relationship of one hospital episode to another. By focusing on each episode of service use as a unit of observation, the analysis was able to include all episodes of the samples without benchmarking for a specific event, such as the first admission during the pre and post-PPS observation windows. Hence, the results of this analysis provides a representative picture of differences in pre- and post-PPS patterns of Medicare service use, in terms of service types and each episode of any given service type experienced by Medicare beneficiaries.
The second analysis strategy focused on outcomes subsequent to hospital admission. We measured changes in hospital use, and use of post-acute SNF and HHA services, hospital readmissions and mortality during and after hospital stays. While also based on episodes rather than beneficiaries, this analysis keyed events to a hospital admission. Hence, unlike the first analysis, episodes of SNF and HHA use, for example, were included only if they were post-hospital events. Hospital readmissions refer to any pair of hospital stays (e.g., first and second, second and third, etc.). In this way, comparisons between 1982-83 and 1984-85 patterns would include all hospital readmissions, rather than, for example, a "benchmark" first readmission during the observation window.
Population Subgroups as Case-Mix. In both the service use and the outcome analyses, we conducted analyses where we stratified the NLTCS samples by relatively homogeneous subgroups of the disabled population.
We refer to these subgroups as case-mix groups because they represent different types of patients who would likely experience different Medicare service use patterns and outcomes. Our case-mix groups are based on chronic health and functional characteristics and are independent of their state at admission to Medicare services. In this way they are distinct from DRGs, for example, which differentiate the acute care requirements of persons being admitted to hospitals.
Case-mix information on the 1982 and 1984 samples were derived through Grade of Membership analysis of the pooled 1982 and 1984 samples (Woodbury and Manton, 1982; Manton, et al., 1987). Pooling patients from the two periods to define the GOM groups enabled us to make case-mix-specific comparisons consistently across the two periods. The GOM techniques identified an optimum number of case-mix profiles based on maximum likelihood estimation of the set of health and functional status characteristics from the 1982 and 1984 NLTCS. Fifty-six (56) medical conditions, ADLs and IADLs were used in this analysis. The GOM profiles represent subgroups of the total samples which were relatively homogeneous in terms of these characteristics. Because the 1982 and 1984 samples were pooled for the GOM analysis, the case-mix groups that were derived were representative of both the pre- and post-PPS periods. We discuss the GOM methodology in greater detail in the following section on statistical methodology.
With the population subgroups, we could determine whether any change in overall utilization changes between pre- and post-PPS periods remained after adjustments were made to account for case-mix effects. Hence, while hospital LOS has been noted to decrease with PPS, questions still remained about whether the observed declines were due to hospital behavior or to case-mix changes. The case mix controls allowed us to examine this question. Second, the GOM groups represent potentially vulnerable subsets of the total disabled elderly population according to functional and health characteristics. We examined the changes among vulnerable subgroups to determine which segments of the total population were most affected by PPS.
C. Statistical Methodology
We employed a combination of two methodological strategies in this study. First, Grade of Membership analysis was used to derive subgroups of the population according to patient characteristics, and to measure case-mix changes between the pre- and post-PPS periods. Life table methodologies were employed to measure utilization changes between the two periods. Various life table functions described risks of events and durations of expected time between events (e.g., hospital length of stay). Statistical comparisons were made, therefore, between life table patterns of events rather than between measures of central tendency such as mean scores. This methodology provides a more complete comparison of the patterns of changes between the pre- and post-PPS periods. In our presentation of results we indicate statistical significance at .05 and .10 levels.
Grade of Membership (GOM) Analysis. GOM analysis is a multivariate technique that combines two types of analyses usually performed separately (Woodbury and Manton, 1982). The first component is a description of the relation of each case-mix dimension to each of the variables selected for analysis. Using the GOM procedure, a prespecified number (say K) of dimensions can be identified from the available information. The second component is a grade or weight for each person representing how much each person is described by the characteristics associated with a given case-mix dimension. A person can be represented by more than one case-mix dimension and have different degrees or grade of membership for each.
Several characteristics of GOM analysis recommend it as a clustering procedure for the analysis of case-mix in this study. First, GOM is capable of dealing with large numbers of correlated discrete variables and reducing them to a smaller, more manageable number of dimensions. Second, since the analysis identifies "K" sets of discrete profiles, each with their own characteristic relationships to the variables of interest, subgroup variable interactions are directly represented in the analysis. This allows, for example, for comorbidities to serve as descriptors of the stage of the natural history of a specific condition, as well as to describe the pattern of comorbidities. Finally, since the analysis generates coefficients that describe how each person is related to each of the basic profiles, it offers a strategy for generating continuous measures of severity determined by a wide range of interacting medical and disability conditions.
GOM analysis involves a simultaneous analysis of the relationships of both variables and cases to a set of analytically defined profiles of individual functional and health characteristics. Measurements on each individual are predicted as the product of two types of coefficients--one describing how closely an individual's characteristics approximate those described by each of the analytic profiles or subgroups and another describing the characteristics of the profiles. The two types of GOM coefficients can be associated with the two types of results. First, multivariate profiles or "pure types" are defined by the probability that a person in a given group or pure type has each of the set of characteristics or attributes. These can include, for example, presence or absence of specific medical conditions and activities of daily living. Second, for each profile defined in the analysis, weights are derived for each person, ranging from 0 to 1.0 (and summing to 1.0) reflecting the extent to which a given individual resembles each of the profiles. Appendix A discusses the technical details of GOM analyses.
Life Table Analysis. In conjunction with the Grade of Membership analysis employed to develop the case-mix groups, we used cause elimination life table methodologies to analyze the duration data in service episodes. Life table methodologies were employed for several reasons. First, an important dimension of the comparisons of Medicare service use between 1982-83 and 1984-85 was the duration of specific services (e.g., hospital length of stay). Life table methodology permits the derivation of duration specific schedules of the occurrence of events, such as the probability of a discharge to a SNF after a specific number of days of hospital stay.
Second, there were competing risks which censored the occurrence of specific events of interest, such as "end of study" relative to hospital readmission. Cause elimination life table methodology adjusts the probability of being readmitted to a hospital by accounting for the competing risks of "end of study" before readmission. Since we cannot observe a readmission after the study ends, our results could be biased and misleading if we did not account for this censoring. Life table methodology incorporates the use of the periods of exposure of incompleted events (e.g., a nursing home stay that ends after the study) in the calculation of risks of specific outcomes.
Finally, the life table contains functional relationships that provide rich descriptions of the patterns that are fundamentally important to this analysis. For example, while a schedule of conditional probabilities of hospital readmissions can be produced, these probabilities do not tell us how much time passed before the readmission. The life table can provide estimates of the expected amount of time before readmission in addition to the probability of readmission. For the analyses where utilization patterns were examined for specific case-mix groups, specialized cause elimination life table methodologies were developed to derive life table functions for each of the case-mix subgroups. Specifically, life tables were calculated for persons who have identically the characteristics of one of the groups. These tables described the service use patterns of a person with a weight of 1.0 (i.e., 100 percent) on that group and a weight of 0.0 on all other groups. These "pure type" life tables can be adjusted for "competing risk" effects using the standard life table procedures discussed above. The life tables for the total population can be derived by employing the case-mix weights (i.e., the gik) actually calculated for each person. Hence a person who is 0.5 like the first profile and 0.5 like the second profile would have service use life tables that, likewise, are weighted combinations of the life tables for the first and second profiles. Since the case-mix weights must add to one, adding up the weighted life tables must reproduce the life table for the total population, i.e., the population before stratifying by the case-mix weights. This provides a procedure for testing whether the case-mix stratifications (or any other stratification such as the service use differences between 1982-83 and 1984-85 intervals) is "significant." By "significant" we mean whether or not the life tables estimated for each case mix group differ from those for the total population by more than chance. The statistic used to test the significance of differences is the well known X2 "goodness-of-fit" statistic which is used to determine if two or more distributions are statistically significantly different. The computational details of such tests are presented in Manton et al., 1987.
IV. RESULTS
This section presents the results of the analyses of the pre- and post-PPS utilization of Medicare services experienced by the noninstitutionalized disabled elderly beneficiaries. The results are presented in five parts. The first part presents a general context of mortality and Medicare service use of the various subgroups of the total Medicare beneficiary population based on the total population screened for the NLTCS. The remaining four parts address different service use and outcome patterns of the subgroup of Medicare beneficiaries who have chronic disabilities.
A. Analysis of Major Subgroups of the Total Medicare Beneficiary Population
Although our study focused on chronically disabled persons in the total elderly population, it is important to view the service use and mortality of this subgroup in the context of all major components of the total Medicare population. This can be done by examining the patterns of service use in the three major subgroups of the population as defined by the sample design of the 1982-1984 NLTCS. The three sample groups defined at the time of the screening were a.) the community disabled elderly (i.e., those who received the detailed questionnaire and who will be analyzed in great detail in subsequent sections), b.) the community non-disabled elderly, and c.) those persons who were in long term care institutions at the time the sample was defined. Table 1 presents comparative hospital utilization statistics of the three subgroups of Medicare beneficiaries. Detailed tables on all hospital, SNF and HHA patterns are included in Appendix B.
| TABLE 1. Hospital Lengths of Stay and Discharge Outcomes of Subgroups of the Medicare Population*: 1982 and 1984 National Long Term Care Survey | |||
| CommunityNondisabled | CommunityDisabled | Institutionalized | |
| ALL EPISODES | |||
| Weighted Episodes 1982 1984 | 6,347,3805,235,110 | 3,154,5813,013,235 | 646,864595,282 |
| LOS 1982 1984 | 10.18.8 | 11.610.4 | 12.0100 |
| HOSPITAL LOS, BY TERMINATION STATUS OF HOSPITAL STAY | |||
| To SNFs | |||
| Rate 1982 1984 | 2.12.4 | 4.94.5 | 13.810.0 |
| LOS 1982 1984 | 22.020.0 | 19.214.3 | 12.714.4 |
| To HHA | |||
| Rate 1982 1984 | 5.57.6 | 11.614.5 | 1.52.5 |
| LOS 1982 1984 | 17.214.3 | 13.612.2 | 13.112.6 |
| To Other | |||
| Rate 1982 1984 | 85.282.5 | 72.270.5 | 69.671.7 |
| LOS 1982 1984 | 9.07.7 | 10.29.6 | 11.69.1 |
| To Death | |||
| Rate 1982 1984 | 4.75.2 | 8.28.1 | 12.813.2 |
| LOS 1982 1984 | 15.012.4 | 15.111.4 | 13.710.0 |
| * Rates do not add to 100% because of episodes censored by end-of-study. | |||
Table 1 shows that nondisabled, noninstitutionalized persons had shorter hospital stays than either the community disabled or the institutionalized. The higher LOS of the latter groups is probably related to their functional disabilities. The table also shows that the hospital length of stay for the community nondisabled group declined from 10.1 to about 8.8 days--in line with the decline noted in the general Medicare population (Neu, 1987). While this group is relatively healthier in terms of chronic functional and health problems they will still experience, at a lower rate, serious and acute medical problems. Changes in LOS of the nondisabled may be compared with the decline in hospital LOS for persons in institutions (from 12.0 to 10.0 days) and for the community disabled elderly (from 11.6 to 10.4 days). Thus, an groups experienced notable declines in hospital LOS with the institutionalized having the largest decline (i.e., 2.0 days). Conversely, the disabled elderly residing in the community had the lowest absolute and proportional decline in hospital length of stay before and after PPS.
In examining the length of time and percent of cases that terminate in a particular way we see that the nondisabled community elderly and the institutionalized elderly have slight increases in hospital episodes ending in death with the community disabled experiencing virtually no change. Note that these changes have not been adjusted for the increased severity of hospital case-mix which Krakauer and Conklin and Houchens found to eliminate much of the pre-post mortality difference. We also found that, for community dwellers (both disabled and non-disabled), there were compensating decreases in mortality in Medicare SNF and HHA service episodes suggesting that more serious cases were being transferred to hospitals more efficiently. Tables of these patterns are found in Appendix B.
The mortality increases that do exist are of the magnitude that could be caused by year to year changes in national mortality patterns found in Figure 1. For the total elderly population we see that the pattern is erratic with death rate "peaks" in 1983 and 1985 and with the lowest mortality rates for 1986. This irregular pattern suggests that there is no consistent elevation of mortality for the total elderly population, and that any pre- and post-analysis of mortality must be interpreted with these secular irregularities in mind. To illustrate, we conducted parallel analyses to the ones presented here of all experience in calendar years 1982 and 1984. 1984 relative to 1983 was a year of low mortality. As a consequence we observed a general pattern of mortality declines in our analyses using that set of temporal windows. Thus, the 1982-83 and 1984-85 service windows here actually represent a type of "worst" case scenario.
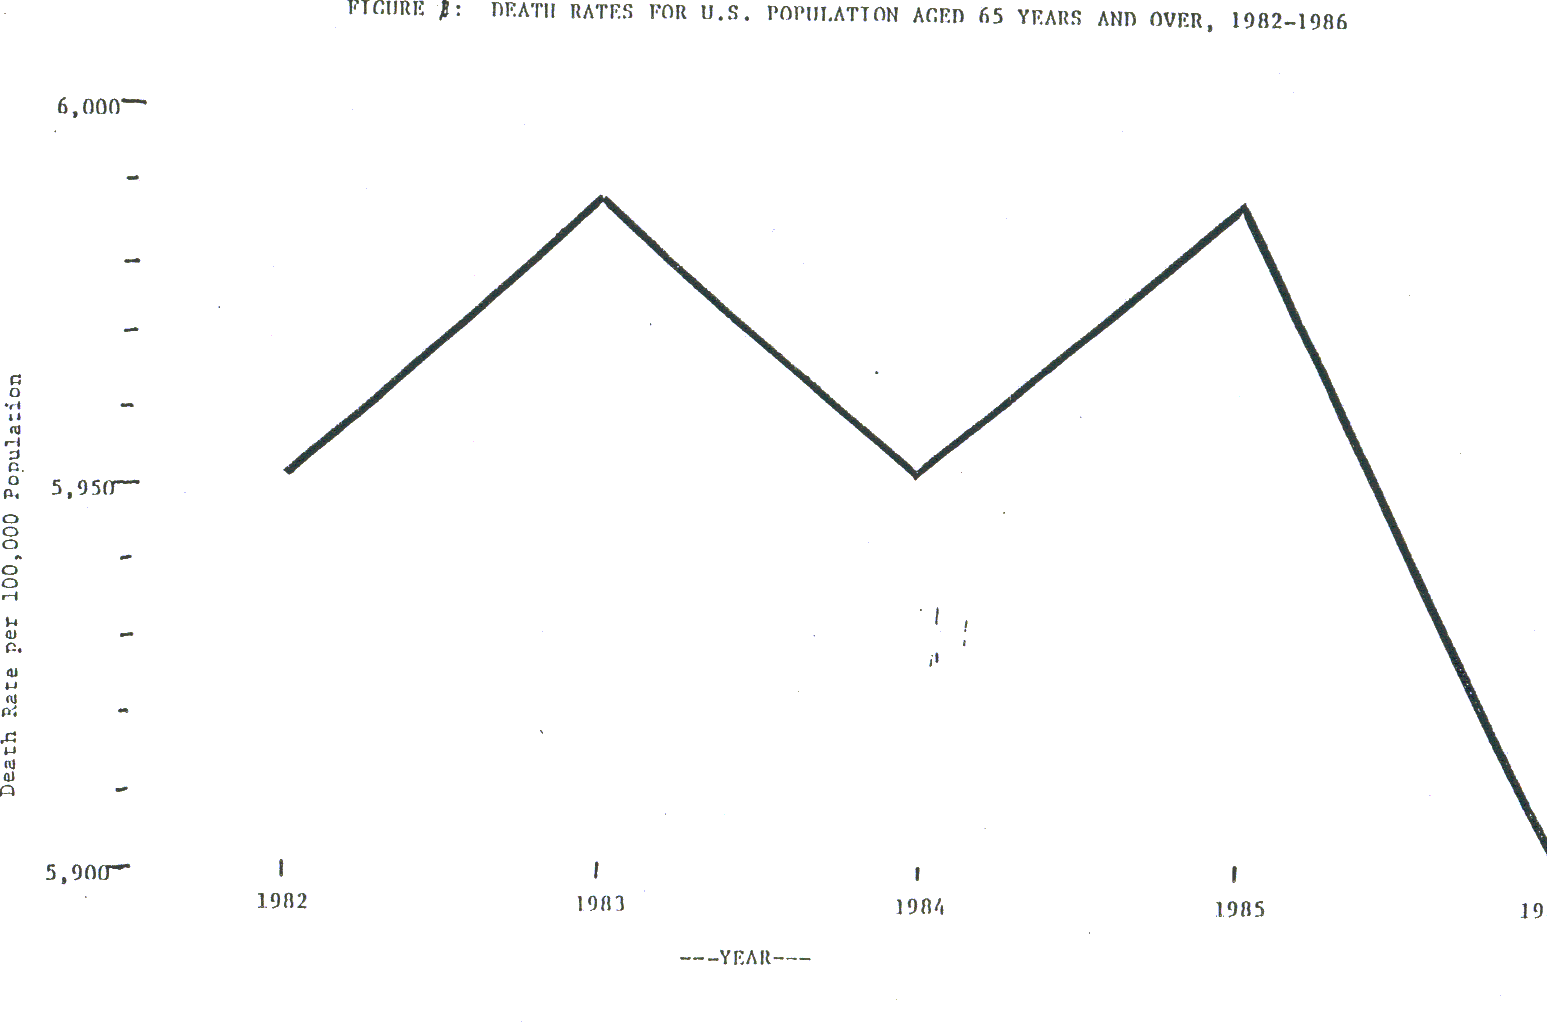
Table 1 also shows that for all three populations increases occurred in the use of HHA services after hospital discharge, with declines in the time spent in hospitals prior to HHA admission. Medicare SNF use increased for the nondisabled community elderly, but decreased for both community disabled and institutionalized elderly..
In subsequent sections we will analyze in greater detail, the service use and mortality of one of the groups, the community disabled elderly. For this potentially vulnerable group, because of the detailed survey information, we will be able to control for detailed chronic health and functional status characteristics. Section B describes the subgroups among the disabled elderly derived from the GOM analysis of pooled 1982 and 1984 NLTCS data. Section C describes the hospital, SNF and home health care utilization patterns in the pre- and post-PPS periods. This analysis examines the changes in length of stay and termination status of episodes of each of these Medicare services between the two time periods without regard to the interrelation of events. Section D discusses hospital readmission patterns by examining rates of readmission at specific intervals after hospital admission. Section E addresses mortality patterns after hospital admission, including deaths in post-acute care settings after hospital discharge.
B. Population Subgroups
The Grade of Membership analysis of the period 1982-83 and 1984-85 NLTCS data produced four relatively homogeneous subgroups. In our analyses, these groups were used principally to determine if overall changes in Medicare service utilization between the pre- and post-PPS periods were found for major subgroups of the disabled Medicare population, and if specific vulnerable subgroups were particularly affected by PPS. The GOM subgroups derived are based on much broader criteria involving chronic health problems than the diagnostic related groups (DRG's) employed in the actual PPS reimbursement system. These groups represent distinct subsets of medical and functional states of Medicare beneficiaries reflecting the multiple comorbidities of elderly persons which may be expected to be associated with service use patterns and possible negative outcomes of care such as hospital readmission and mortality. While a fall description of the GOM subgroup profiles are presented in Appendix C, Table 2 highlights the most significant characteristics of the four groups.
Type I, which we will refer to as "Mildly Disabled," has only a minimum of long-term health and functional status problems, with the most prevalent conditions being rheumatism and arthritis. Relative to the entire population of disabled Medicare beneficiaries, Type I individuals are young, with only 10 percent being over 85 years of age. Sixty-seven percent (67%) indicate that their general health is good or excellent. Only 3 percent had a prior nursing home stay, and only 10 percent spent private dollars for home care.
Type II, which we will refer to as the "Oldest-Old," has many ADL and IADL problems with 72 percent being dependent in bed to chair transfers. This type is also prone to hip and other fractures; the relative risks of hip fracture in this group, for example, is three times greater than the average disabled person. Glaucoma and cancer are also prevalent in this group. Demographically, 50 percent are over 85 years of age, 70 percent are not married and 70 percent are female. This group also has the highest rates of prior nursing home use (22%) compared to the sample average (10%).
Type III, which we will refer to as "Heart and Lung Problems," has mild ADL dependencies, such as bathing, and IADL dependencies. Arthritis, which is prevalent in this group, is associated with a high risk of permanent stiffness. Most characteristic of this group are high risks of cardiovascular (e.g., 80% arteriosclerosis) and lung diseases (e.g., 44% bronchitis) which are associated with high likelihood of diabetes (45%) and obesity (50%). The group is not particularly old, with 95% being under 85 years of age, and is predominantly female.
Type IV, which we will refer to as "Severely ADL Dependent," has a 60 percent chance of being dependent in eating and 100 percent chance of being dependent in all other ADLs. A high risk of being bedfast (11 percent) or chairfast (32 percent) is characteristic of this group. Moreover, membership in this group is also associated with a 70 percent chance of being incontinent. The high level of disability is associated with neurological diseases, including Parkinson's disease, multiple sclerosis and epilepsy. Senility and behavioral problems are also present. Demographically, 48 percent are male, 58 percent married and 25 percent are over 85 years of age. A high proportion (19%) of members of this group had prior nursing home stays.
| TABLE 2. Highlights of GOM Group Profiles* |
| Type I: Mild Disability |
| Rheumatism and arthritis (58%)"Young-Olds" (10% over 85)50% married53% male67% good-excellent health on subjective scale3% with prior nursing home stay47% with no helper days |
| Type II: Oldest-Old |
| Problems with transfer (72%), mobility, toileting and bathingAll IADLsHip fractures (8%: RR=3:1), other breaks (14%: RR=2:1)GlaucomaCancer50% over 85 years old70% not married70% female22% prior nursing home stay (RR=2:1)Home nursing service (.25) and therapist (.06) |
| Type III: Heart and Lung Problems |
| Bathing dependent and IADLs100% arthritis, 62% permanent stiffness45% diabetes, 50% obeseHighest risks of cardiovascular and lung diseases95% female95% under 85 |
| Type IV: Severe ADL Dependency |
| 60% with ADL for eating, 100% all other ADLsBedfast (11%); chairfast (32%)70% incontinent (27% with catheter or colostomy)Parkinsons, mental retardation (10%)Senile (60%)Stroke, some heart and lung48% male, 58% married, 25% over 85, 20% Black80% with poor subjective health19% with prior nursing home use |
| * Probabilities of group membership converted to percentages. |
The four case-mix groups derived in this study represent coherent collections of disability and medical conditions that are suggestive of service use differences and outcomes. Type I would appear to be the least vulnerable to inappropriate outcomes of hospital admissions--principally because of their overall good health. Type II, the Oldest-Old, with hip fractures, for example, would be expected to require post-acute care for rehabilitation. Type III, because of their acute heart and lung problems, might be expected to experience multiple hospital admissions within a one year period and higher than average mortality risks. Type IV, the severely disabled individuals with neurological conditions, would be expected to be users of post-acute care services and long-term care, and at high risk of mortality. Thus the GOM defined groups are distinctly different subgroups of the disabled elderly population, ranging from persons with mild disability to severely disabled individuals. In the following sections on Medicare service use, these GOM groups are used to adjust overall utilization differences between pre- and post-PPS periods. We also discuss significant changes in utilization for each of these GOM subgroup types.
In addition, we employed the second output of GOM analysis, the degree to which individual cases resemble each of the GOM profiles to determine if a shift occurred in the case-mix of episodes of Medicare hospital, SNF and HHA care between the pre- and post-PPS periods. By summing the individual case weights per GOM profile per case, it was possible for us to determine whether there was a shift in the cases that resembled each of the GOM subgroups (shift in the distribution of GOM scores between 1982 and 1984).
Table 3 shows a shift in the proportion of cases by service episodes of each of the four types between 1982 and 1984. The shifts are generally in the expected direction. For example, for hospital episodes there was a large decline in the "Severely ADL Dependent" (i.e., from 20.3% to 16.9%) but increases in the "Oldest-Old" and "Heart and Lung" suggesting an increase in the medical acuity of the population with a significant reduction in seriously impaired persons with less medical acuity. In the SNF group we also see declines in the severely ADL impaired population with increases in the "Mildly Disabled" and "Oldest-Old" populations--again suggesting a change in case mix representing increased acuity of a specific type. HHA services show moderate changes with the oldest-old and severely ADL dependent types increasing in prevalence and the less disabled decreasing. Thus the HHA population has, in contrast to the SNF population, become more chronically disabled and even older. This HHA pattern reflects similar changes in the community population which becomes older and has more severely disabled persons. Thus the whole distribution by case-mix type has been altered by the sorting out of service venues due to the impact of PPS.
| TABLE 3. Distribution of Disabled Elderly in Different Service Settings Pre- and Post-PPS | |||||
| Total | MildlyDisabled | Oldest-Old | Health& LungProblems | SeverelyADLDependent | |
| Hospital | |||||
| 1982 1984 | 100.0100.0 | 30.029.7 | 25.127.2 | 24.526.2 | 20.316.9 |
| SNF | |||||
| 1982 1984 | 100.0100.0 | 27.230.1 | 28.130.8 | 21.520.4 | 23.218.7 |
| HHA | |||||
| 1982 1984 | 100.0100.0 | 22.621.4 | 27.128.2 | 21.721.4 | 28.529.0 |
| Other* | |||||
| 1982 1984 | 100.0100.0 | 32.231.5 | 24.026.4 | 23.621.0 | 20.221.1 |
| Overall GOM Sums | |||||
| 1982 1984 | 100.0100.0 | 29.228.7 | 25.327.3 | 23.422.7 | 22.121.3 |
| * These are episodes when no Medicare hospital, skilled nursing facility or home health services are used. They could include, for example, no services, Medicaid nursing home stays and Medicare outpatient care. | |||||
C. Service Use Analysis
This section discusses the service use patterns of hospital, skilled nursing facility (SNF) and home health agency (HHA) care experienced by the NLTCS chronically disabled community sample between 1982-83 and 1984-85. This analysis was designed to provide a description of changes between the two time periods in terms of rates of how different service events ended, and how these event termination patterns were related to episode duration. For example, we structured the analysis to determine if changes in hospital length of stay after PPS were related to changes in the proportion of hospital discharges followed by use of SNF and HHA care.
Hospital Use. Table 4 presents the patterns of Medicare hospital events for the two time periods, after adjusting for the events for which the discharge outcome was not known because of end-of-study. There was an overall decline in LOS from 11.6 days in the pre-PPS period to 10.2 days in the post-PPS period, after adjustments were made for end-of-study. Table 4 also shows a decline in the proportion of hospital admissions that resulted in a discharge to Medicare SNF services (5.2% versus 4.7%), although discharge to HHA care increased from 12.6 percent to 15.6 percent. There was no change in discharges due to death which was 9.1 percent in both pre- and post-PPS periods, although patients who died in the hospital had shorter stays in the post-PPS period. The LOS of hospital stays declined between the pre- and post-PPS periods, for all discharge terminations except to "other." Because the percent of hospital discharges to SNFs declined, there was no apparent substitution of hospital and SNF days, although some possibility existed for HHA care serving as a substitute for hospital days. Since increases in post-acute care might be viewed as intended effects of PPS, it is surprising that SNF use declined. in later sections we examine the changes in such use in relation to hospital readmission and mortality outcome.
| TABLE 4. Medicare Hospital Episodes, by Discharge Status: Adjusted for End of Study | |||||||
| Observed* | Unadjusted | Adjusted for Case-Mix | |||||
| Chi-Square | Degrees ofFreedom | SignificanceLevel | Chi-Square | Degrees ofFreedom | SignificanceLevel | ||
| ALL EPISODES | |||||||
| Unweighted Episodes in 1982 | 1,365 | 69.0 | 40 | .005 | 168.1 | 160 | .550 |
| Weighted Episodes | 3,154,581 | ||||||
| Hospital LOS | 11.6 | ||||||
| Unweighted Episodes in 1984 | 1,039 | ||||||
| Weighted Episodes | 3,013,235 | ||||||
| Hospital LOS | 10.2 | ||||||
| DISCHARGE TO SNF | |||||||
| 1982 Rate | 5.2 | 16.9 | 8 | .050 | 43.3 | 32 | .100 |
| Hospital LOS | 20.2 | ||||||
| 1984 Rate | 4.7 | ||||||
| Hospital LOS | 14.7 | ||||||
| DISCHARGE TO HHA | |||||||
| 1982 Rate | 12.6 | 18.3 | 8 | .025 | 47.5 | 32 | .050 |
| Hospital LOS | 14.3 | ||||||
| 1984 Rate | 15.6 | ||||||
| Hospital LOS | 12.9 | ||||||
| DISCHARGE TO OTHER** | |||||||
| 1982 Rate | 73.2 | 4.3 | 8 | .900 | 18.6 | 32 | .975 |
| Hospital LOS | 10.1 | ||||||
| 1984 Rate | 70.6 | ||||||
| Hospital LOS | 9.3 | ||||||
| DISCHARGED DEAD | |||||||
| 1982 Rate | 9.1 | 16.4 | 8 | .050 | 29.6 | 32 | .750 |
| Hospital LOS | 15.7 | ||||||
| 1984 Rate | 9.1 | ||||||
| Hospital LOS | 11.1 | ||||||
| * Sum of discharge destination rates does not add to 100% because of end-of-study adjustments.** These are episodes when no Medicare hospital, skilled nursing facility or home health services are used. They could include, for example, no services, Medicaid nursing home stays and Medicare outpatient care. | |||||||
Table 4 also presents the results of statistical analyses when adjustments are made for differences in case-mix between 1982 and 1984. This refinement of the comparison of observed differences in patterns indicated that statistically significant differences (at the .05 level) were found for the hospital stays that ended with admission to HHA. It is apparent that both rates of hospital discharge to HHA and hospital LOS prior to discharge were different between the two time periods. Table 4 indicates that, while HHA admissions from hospitals increased, the LOS in hospitals prior to HHA admissions decreased between pre- and post-PPS periods. There also appears to be a change in the hospital stays that resulted in admissions to SNFs, although this difference was significant at a .10 level. The fact that hospital LOS overall did not differ statistically between 1982 and 1984 after case-mix adjustments suggests that minimal changes in LOS resulted from PPS for the disabled elderly that are the subject of this analysis.
SNF Use. Table 5 presents the discharge patterns of individuals who experienced Medicare SNF use pre- and post-PPS and the length of stay in Medicare SNFs. There was a decline in average LOS for all SNF episodes from 69.9 days to 37.7 days. Results of declining overed days of SNF care are consistent with HCFA statistics (Hall and Sangl, 1987). By termination status of SNF episodes, there was a reduction in discharge from SNFs to hospitals from 30.6 percent in the pre-PPS period to 18.0 percent in the post-PPS period. This suggests a reduction in hospital readmission from SNFs since most SNF stays are preceded by hospital stays. Table 5 also presents the results of statistical tests on the SNF patterns of LOS and discharge destination when adjustments were made for case-mix. These results indicate that the observed differences of changes in SNF utilization were not statistically significant after case-mix adjustments. In fact, only those SNF cases that resulted in discharges to episodes with no further Medicare services were marginally significant (p =.10).
HHA Use. Table 6 presents the patterns of discharge for HHA episodes. There was a decline in average LOS for all HHA episodes from 77.4 days to 52.5 days. However, after adjustments were made for case-mix, this change was not statistically significant.
| TABLE 5. Medicare SNF Episodes, by Discharge Status: Adjusted for End of Study | |||||||
| Observed* | Unadjusted | Adjusted for Case-Mix | |||||
| Chi-Square | Degrees ofFreedom | SignificanceLevel | Chi-Square | Degrees ofFreedom | SignificanceLevel | ||
| ALL EPISODES | |||||||
| Unweighted Episodes in 1982 | 249 | 73.9 | 45 | .005 | 162.6 | 180 | .400 |
| Weighted Episodes | 198,939 | ||||||
| Hospital LOS | 69.9 | ||||||
| Unweighted Episodes in 1984 | 208 | ||||||
| Weighted Episodes | 202,859 | ||||||
| Hospital LOS | 37.7 | ||||||
| DISCHARGE TO HOSPITAL | |||||||
| 1982 Rate | 30.6 | 16.8 | 9 | .050 | 32.2 | 36 | .500 |
| Hospital LOS | 87.5 | ||||||
| 1984 Rate | 18.0 | ||||||
| Hospital LOS | 48.0 | ||||||
| DISCHARGE TO HHA | |||||||
| 1982 Rate | 5.8 | 10.6 | 7 | .250 | 18.2 | 28 | .950 |
| Hospital LOS | 47.5 | ||||||
| 1984 Rate | 11.9 | ||||||
| Hospital LOS | 30.3 | ||||||
| DISCHARGE TO OTHER** | |||||||
| 1982 Rate | 47.5 | 11.4 | 9 | .250 | 51.5 | 36 | .100 |
| Hospital LOS | 62.6 | ||||||
| 1984 Rate | 61.1 | ||||||
| Hospital LOS | 36.7 | ||||||
| DISCHARGED DEAD | |||||||
| 1982 Rate | 9.0 | 11.2 | 9 | .500 | 21.8 | 36 | .975 |
| Hospital LOS | 66.5 | ||||||
| 1984 Rate | 9.0 | ||||||
| Hospital LOS | 33.1 | ||||||
| * Sum of discharge destination rates does not add to 100% because of end-of-study adjustments.** These are episodes when no Medicare hospital, skilled nursing facility or home health services are used. They could include, for example, no services, Medicaid nursing home stays and Medicare outpatient care. | |||||||
| TABLE 6. Medicare HHA Episodes, by Discharge Status: Adjusted for End of Study | |||||||
| Observed* | Unadjusted | Adjusted for Case-Mix | |||||
| Chi-Square | Degrees ofFreedom | SignificanceLevel | Chi-Square | Degrees ofFreedom | SignificanceLevel | ||
| ALL EPISODES | |||||||
| Unweighted Episodes in 1982 | 709 | 101.6 | 52 | .001 | 228.3 | 208 | .500 |
| Weighted Episodes | 1,035,916 | ||||||
| Hospital LOS | 77.4 | ||||||
| Unweighted Episodes in 1984 | 686 | ||||||
| Weighted Episodes | 1,548,840 | ||||||
| Hospital LOS | 52.5 | ||||||
| DISCHARGE TO HOSPITAL | |||||||
| 1982 Rate | 14.7 | 12.6 | 12 | .500 | 38.5 | 48 | .900 |
| Hospital LOS | 78.5 | ||||||
| 1984 Rate | 10.8 | ||||||
| Hospital LOS | 62.8 | ||||||
| DISCHARGE TO SNF | |||||||
| 1982 Rate | 0.5 | 9.8 | 6 | .250 | 9.6 | 24 | .990 |
| Hospital LOS | 56.7 | ||||||
| 1984 Rate | 0.6 | ||||||
| Hospital LOS | 39.8 | ||||||
| DISCHARGE TO OTHER** | |||||||
| 1982 Rate | 80.2 | 14.8 | 11 | .500 | 52.9 | 44 | .500 |
| Hospital LOS | 75.8 | ||||||
| 1984 Rate | 85.0 | ||||||
| Hospital LOS | 51.2 | ||||||
| DISCHARGED DEAD | |||||||
| 1982 Rate | 4.7 | 11.7 | 11 | .500 | 26.4 | 44 | .990 |
| Hospital LOS | 102.5 | ||||||
| 1984 Rate | 3.7 | ||||||
| Hospital LOS | 52.7 | ||||||
| * Sum of discharge destination rates does not add to 100% because of end-of-study adjustments.** These are episodes when no Medicare hospital, skilled nursing facility or home health services are used. They could include, for example, no services, Medicaid nursing home stays and Medicare outpatient care. | |||||||
Other Episodes. Table 7 presents the patterns of durations when Medicare Part A services were not used during the pre- and post-PPS periods. There was an overall increase in the average durations of these episodes, from 231 days to 237 days. This result implies that intervals before and after use of Medicare hospital, SNF and HHA services increased between the two periods. There was also a reduction in the likelihood that these periods ended with an admission to hospitals (80.9% to 70.7%) suggesting lower hospital admission rates after FPS, a result consistent with other studies (Conklin and Houchens, 1987). Rates of "other" episodes resulting in admission to HHA increased from 13.6 percent to 21.5 percent--a result consistent with recent findings from a University of Colorado study (1987). In that study, Shaughnessy and colleagues found that the proportion of Medicare HHA patients admitted from home increased from 23.6 percent in 1982 to 38.5 percent in 1986. This increase in HHA use was significant even after adjustments were made for the chronic health and functional status differences between the four GOM defined subpopulations.
Subgroup Patterns of Hospital, SNF and HHA. In addition to employing the GOM subgroups to adjust for overall utilization changes before and after PPS, we examined differences in the effects of PPS on the specific subgroups among the disabled elderly population. As discussed above, the GOM groups reflect differences among the total population in terms of both medical and functional status. The next four tables highlight the Medicare service use patterns of each of the four GOM subgroups. Each table presents hospital, SNF, HHA and other episodes by discharge destination.
| TABLE 7. Other Episodes*, by Discharge Status: Adjusted for End of Study | |||||||
| Observed** | Unadjusted | Adjusted for Case-Mix | |||||
| Chi-Square | Degrees ofFreedom | SignificanceLevel | Chi-Square | Degrees ofFreedom | SignificanceLevel | ||
| ALL EPISODES | |||||||
| Unweighted Episodes in 1982 | 1,263 | 84.7 | 60 | .025 | 232 | 240 | .750 |
| Weighted Episodes | 7,486,427 | ||||||
| Hospital LOS | 231.0 | ||||||
| Unweighted Episodes in 1984 | 1,269 | ||||||
| Weighted Episodes | 8,499,136 | ||||||
| Hospital LOS | 236.9 | ||||||
| DISCHARGE TO HOSPITAL | |||||||
| 1982 Rate | 80.9 | 22.6 | 12 | .050 | 45.1 | 48 | .750 |
| Hospital LOS | 245.4 | ||||||
| 1984 Rate | 70.7 | ||||||
| Hospital LOS | 254.5 | ||||||
| DISCHARGE TO SNF | |||||||
| 1982 Rate | 1.3 | 12.1 | 12 | .500 | 24.5 | 48 | .990 |
| Hospital LOS | 290.7 | ||||||
| 1984 Rate | 1.4 | ||||||
| Hospital LOS | 266.5 | ||||||
| DISCHARGE TO HHA | |||||||
| 1982 Rate | 13.6 | 27.9 | 12 | .010 | 69.4 | 48 | .025 |
| Hospital LOS | 150.5 | ||||||
| 1984 Rate | 21.5 | ||||||
| Hospital LOS | 170.7 | ||||||
| DISCHARGED DEAD | |||||||
| 1982 Rate | 4.2 | 7.9 | 12 | .900 | 51.4 | 48 | .500 |
| Hospital LOS | 198.1 | ||||||
| 1984 Rate | 6.8 | ||||||
| Hospital LOS | 253.3 | ||||||
| * These are episodes when no Medicare hospital, skilled nursing facility or home health services are used. They could include, for example, no services, Medicaid nursing home stays and Medicare outpatient care.** Sum of discharge destination rates does not add to 100% because of end-of-study adjustments. | |||||||
| TABLE 8. Medicare Hospital, SNF and HHA Use, Pre- and Post-PPS: Mildly Disabled Subgroup | ||||
| EpisodeEnd Status | Episode Type | |||
| Hospital | SNF | HHA | Other | |
| ALL EPISODES | ||||
| Weighted Episodes 1982 1984 | 924,009915,270 | 53,76860,029 | 233,985340,978 | 2,390,0662,828,823 |
| LOS 1982 1984 | 10.8**8.2 | 35.028.6 | 49.739.2 | 283.3291.2 |
| TO HOSPITAL | ||||
| 1982 Rate LOS | ------ | 29.336.8 | 13.738.8 | 92.9290.2 |
| 1984 Rate LOS | ------ | 5.23.5 | 10.162.4 | 70.4287.9 |
| TO SNF | ||||
| 1982 Rate LOS | 2.4**16.5 | ------ | 0.00.0 | 3.0341.2 |
| 1984 Rate LOS | 2.910.1 | ------ | 0.2103.8 | 2.1309.2 |
| TO HHA | ||||
| 1982 Rate LOS | 6.621.9 | 3.127.6 | ------ | 2.850.0 |
| 1984 Rate LOS | 6.314.9 | 7.235.3 | ------ | 19.7290.8 |
| TO OTHER | ||||
| 1982 Rate LOS | 82.69.0 | 59.9**37.2 | 79.335.1 | ------ |
| 1984 Rate LOS | 84.87.6 | 83.730.0 | 86.936.9 | ------ |
| TO DEATH | ||||
| 1982 Rate LOS | 8.417.8 | 7.713.9 | 7.0236.0 | 1.3*155.0 |
| 1984 Rate LOS | 6.09.7 | 3.918.0 | 2.925.2 | 7.7316.7 |
| * Significant at .10 level** Significant at .05 level | ||||
Table 8 presents the patterns of Medicare Part A service use by the "Mildly Disabled" group, which was characterized by relatively minor chronic problems such as arthritis and by 67 percent of the group specifying that their health status was good to excellent. Statistically significant differences (p = .05) between 1982 and 1984 were detected in the hospital, length of stay for this group. A significant change (p = .05) was found in the subset of hospital stays that resulted in an admission for Medicare SNF care. The association between increases in SNF admissions and decreases in hospital LOS suggests the possibility of service substitution among the "Mildly Disabled." Moreover, SNF episodes for this group had an increase in the proportion that were discharged to the other settings. The two results suggest that for the "Mild Disability" group, there was a detectable change in utilization characterized by higher hospital discharge to SNFs and higher SNF discharges to "other" episodes with corresponding decreases in hospital and SNF lengths of stay. We also found a significantly (p =.10) higher mortality rate among the "other" i.e., non-Medicare Part A service) episodes. While we cannot tell from the data where and what types of non-Medicare Part A services were being received, it appears that the higher mortality among the other episodes were offsetting the lower (but not statistically significantly lower) mortality associated with Medicare Part A service use.
Table 9 presents the patterns of Medicare Part A service use episodes for the "Oldest-Old" subgroup, which was characterized by a 50 percent likelihood of being over 85 years of age, hip fracture and cancer and with many ADL problems. There were no statistically significant differences before and after PPS in the patterns of hospital, SNF and HHA episodes. Significant differences were detected for this group in terms of lower rates of being admitted from the community directly to HHA services and higher rates of dying in "other" types of episodes. It should be recalled that "other" refers to all periods when Medicare Part A services were not received. The higher mortality of this subgroup may be due to higher proportions of these individuals dying while receiving non-Medicare nursing home care or other types of services. For example, given that the oldest-old case-mix group was characterized by a high risk of cancer, some might have received community based hospice care. While our data source does not enable us to investigate this result for the "Oldest-Old", our findings suggest needed further research.
| TABLE 9. Medicare Hospital, SNF and HHA Use, Pre- and Post-PPS: Oldest-Old Subgroup | ||||
| EpisodeEnd Status | Episode Type | |||
| Hospital | SNF | HHA | Other | |
| ALL EPISODES | ||||
| Weighted Episodes 1982 1984 | 786,295740,171 | 55,33857,407 | 277,839413,212 | 1,782,0062,116,774 |
| LOS 1982 1984 | 14.513.5 | 117.641.4 | 59.473.5 | 182.4**221.7 |
| TO HOSPITAL | ||||
| 1982 Rate LOS | ------ | 34.5128.0 | 14.962.4 | 67.7201.6 |
| 1984 Rate LOS | ------ | 19.562.9 | 9.950.4 | 56.4248.2 |
| TO SNF | ||||
| 1982 Rate LOS | 12.326.7 | ------ | 0.758.8 | 1.0113.2 |
| 1984 Rate LOS | 10.714.3 | ------ | 0.385.6 | 1.0235.4 |
| TO HHA | ||||
| 1982 Rate LOS | 18.211.7 | 9.5110.6 | ------ | 25.6**134.3 |
| 1984 Rate LOS | 15.616.7 | 13.313.0 | ------ | 24.3127.2 |
| TO OTHER | ||||
| 1982 Rate LOS | 54.313.0 | 25.6100.6 | 80.758.9 | ------ |
| 1984 Rate LOS | 61.613.0 | 63.641.3 | 85.873.7 | ------ |
| TO DEATH | ||||
| 1982 Rate LOS | 15.213.6 | 30.8112.0 | 3.860.5 | 5.7**182.2 |
| 1984 Rate LOS | 12.012.0 | 3.631.6 | 4.0124.2 | 18.3264.4 |
| * Significant at .10 level** Significant at .05 level | ||||
| TABLE 10. Medicare Hospital, SNF and HHA Use, Pre- and Post-PPS: Heart and Lung Subgroup | ||||
| EpisodeEnd Status | Episode Type | |||
| Hospital | SNF | HHA | Other | |
| ALL EPISODES | ||||
| Weighted Episodes 1982 1984 | 754,677737,759 | 41,02038,382 | 219,713344,739 | 1,724,8771,782,299 |
| LOS 1982 1984 | 10.510.6 | 62.641.6 | 120.635.9 | 199.8200.1 |
| TO HOSPITAL | ||||
| 1982 Rate LOS | ------ | 34.286.1 | 15.5**55.8 | 90.4208.6 |
| 1984 Rate LOS | ------ | 27.429.8 | 14.342.8 | 85.6217.9 |
| TO SNF | ||||
| 1982 Rate LOS | 1.916.8 | ------ | 0.436.5 | 0.00.0 |
| 1984 Rate LOS | 1.621.5 | ------ | 0.252.5 | 0.5140.5 |
| TO HHA | ||||
| 1982 Rate LOS | 7.310.4 | 6.145.0 | ------ | 5.949.6 |
| 1984 Rate LOS | 18.911.5 | 20.155.5 | ------ | 12.267.6 |
| TO OTHER | ||||
| 1982 Rate LOS | 88.710.0 | 54.849.1 | 67.584.6 | ------ |
| 1984 Rate LOS | 75.79.6 | 38.735.7 | 81.130.0 | ------ |
| TO DEATH | ||||
| 1982 Rate LOS | 2.127.4 | 4.871.3 | 16.7328.2 | 3.7228.9 |
| 1984 Rate LOS | 3.920.1 | 13.863.5 | 4.3123.9 | 1.7266.1 |
| * Significant at .10 level** Significant at .05 level | ||||
Table 10 presents the patterns of service use for the "Heart and Lung" group, which was characterized by high risks of heart and lung diseases and associated risks factors such as diabetes. For this medically acute group, there was no change in hospital length of stay before and after PPS, which remained about 10.5 days. The only statistically significant (p =.10) difference after PPS was found for HHA episodes that decreased in the rate of discharge to hospitals and decreased in LOS. While differences in mortality were not statistically significant, they suggest an increase in hospital and SNF mortality and corresponding mortality decreases in HHA other settings.
Table 11 presents the patterns of service use for the "Severely Disabled" group, which was characterized by heavy ADL dependency, neurological problems, stroke, and senility. Statistically significant differences were not detected in the hospital utilization patterns of this group. Marginally significant differences (p = .10) were detected for SNF episodes, which decreased in LOS. In addition, we found a slightly higher rate of SNF episodes resulting in discharge to hospital (23.4 versus 25.4 percent) suggesting the possibility of increased hospital readmission for this group. Home health episodes were significantly different with overall LOS decreasing from 108 days to 63 days. While the proportion of HHA episodes resulting in hospital admission was lower, the proportion of HHA episodes discharged to the other settings increased. Finally, there was a marginally significant (p = .10) decrease in community episodes resulting in deaths.
In summary, we found that hospital lengths of stay decreased between 1982-83 and 1984-85 for the subgroup of disabled, non-institutionalized Medicare beneficiaries, but that much of this chance was attributable to case-mix changes. The finding that admission rates to hospitals from SNFs, HHAs and the community declined between the pre- and post-periods, is also consistent with other studies results showing declining hospital admission rates for all Medicare beneficiaries (Conklin and Houchens, 1987). While only marginal changes in the post-acute use of Medicare SNF care were found, significant increases were found for the use of HHA services between the pre- and post-PPS time periods. There were indications of service substitution between hospital care and SNF and HHA care.
| TABLE 11. Medicare Hospital, SNF and HHA Use, Pre- and Post-PPS: Severely Disabled Subgroup | ||||
| EpisodeEnd Status | Episode Type | |||
| Hospital | SNF | HHA | Other | |
| ALL EPISODES | ||||
| Weighted Episodes 1982 1984 | 689,510620,036 | 48,81347,040 | 304,379449,911 | 1,589,4771,771,241 |
| LOS 1982 1984 | 12.19.5 | 68.2*46.5 | 108.3**63.3 | 123.1144.1 |
| TO HOSPITAL | ||||
| 1982 Rate LOS | ------ | 23.4*111.6 | 14.3*136.1 | 41.6140.4 |
| 1984 Rate LOS | ------ | 25.449.4 | 9.585.4 | 45.3199.9 |
| TO SNF | ||||
| 1982 Rate LOS | 10.015.1 | ------ | 0.853.4 | 0.6135.4 |
| 1984 Rate LOS | 6.421.1 | ------ | 1.333.2 | 1.7215.2 |
| TO HHA | ||||
| 1982 Rate LOS | 28.714.4 | 9.924.1 | ------ | 46.4106.3 |
| 1984 Rate LOS | 29.79.6 | 1.522.2 | ------ | 45.894.8 |
| TO OTHER | ||||
| 1982 Rate LOS | 44.59.4 | 46.058.3 | 77.1**106.1 | ------ |
| 1984 Rate LOS | 44.97.7 | 46.653.7 | 85.461.2 | ------ |
| TO DEATH | ||||
| 1982 Rate LOS | 16.813.5 | 20.762.1 | 7.885.1 | 11.4*127.4 |
| 1984 Rate LOS | 19.09.9 | 26.532.5 | 3.958.0 | 7.289.6 |
| * Significant at .10 level** Significant at .05 level | ||||
D. Hospital Readmissions
This analysis focused on hospital admissions and outcomes of these admissions in terms of hospital readmissions. We employed cause elimination life table methodology to measure risks of readmission after specific periods of time after an initiating admission. The initiating admission could be any hospital admission. Hence, this analysis embodied representative samples of each pair of hospital admissions (e.g., first and second, second and third, etc.) as well as all hospital admissions that did not involve a readmission during the one-year observation periods. We benchmarked the analysis on hospital admission, rather than discharge, because we wanted to account for the possible effects of mortality in the hospital as a competing risk for hospital readmission. That is, some hospital admissions result in death in the hospital; these cases would not be eligible for hospital readmission. In choosing to benchmark our hospital readmission risks on those entering hospital, we effectively compared all individuals who entered hospitals in the two time periods.
We adjusted for differences in mortality as competing risks by employing cause elimination life table methodology. This methodology produces risks of hospital readmission net of mortality. Hence, the readmission rates for each period are not confounded by possible differences in exposure to readmission because of differences in mortality risks between the two periods. The characteristics of individuals entering hospitals differed between the pre- and post-PPS periods. This difference was identified in another analysis in our study (the comparison of case-mix by GOM gik's) and indicated an increase in the oldest-old and medical acute groups. As with the other analysis of episodes of Medicare service use, comparisons are made between the pre- and post-PPS periods using October 1 through September 30 windows for both 1982-83 and 1984-85.
In comparing pre- and post-PPS period differences in hospital readmissions, we looked at several dimensions of the phenomenon. First, we examined the proportion of hospital admissions that resulted in readmissions during the one year windows of observation. The proportions between the two years remained about the same--39.3% in 1982-83 and 38.5% in 1984-85. Not surprisingly, the expected number of days before readmission were also similar--194 days versus 199 days.
Second, we examined the risk of readmission as a function of duration of time after the initiating admission. Table 12 presents the schedule of probabilities of hospital readmission for pre- and post-PPS periods, and the difference in probabilities between the two periods. The probability of a hospital readmission between the initial admission date and the subsequent 15 days was 3.8 percent in 1982-83 and 4.1 percent in 1984-85, a likelihood of hospital readmission in the post-PPS period higher by 0.3 percent. The higher post-PPS probability of hospital readmission was also found for the 15-29 day interval after hospital admission. The net increase for this interval was 0.7 percent between 1982 and 1984. For the 30-44 days interval, however, there was a reduction in risk of hospital readmissions of 1.1 percent in the post-PPS period. Overall, the schedules of hospital readmissions in the two time periods were not statistically different
Third, we disaggregated the cases by post-acute care use to determine if the risks of hospital readmission differed by whether post-acute Medicare SNF and home health services were used, as well as for cases that involved no Medicare post-acute services. In comparing the proportion of hospital readmissions for the one-year windows between the pre-PPS and post-PPS periods, Table 13 shows a small decline in readmissions among the hospital episodes that were followed by SNF care (36% vs. 33.9%), similar proportions when HHA were used after hospitalization and a small decline for the cases involving no post-acute care. As with the total cases, we found a slightly different pattern of risk of readmission when we focused on time intervals shortly after admission (i.e., 30 days, 90 days). For initial hospitalizations followed by SNF use, the risks of readmission to a hospital increased from 7.3 percent to 9.2 percent for the 0-30 days interval and from 31 percent to 33.2 percent for the 0-90 day interval. Hospitalizations not followed by post-acute care use resulted in a higher readmission risk in 30 days but a lower risk by 90 days. Expected number of days before readmission decreased between the pre- and post-PPS period, regardless of whether post-acute care were used. Only in the case where no Medicare SNF or HHA services was received was there a statistically significant difference (p = .10) in the pattern of readmissions.
| TABLE 12. Weighted Life Tables for Hospital Readmissions*: 1982-83 and 1984-85** | |||
| Interval of Days After Hospital Admission | Probability (x 100) of Readmission in Interval | ||
| 1982(N=3,892) | 1984(N=2,943) | Difference#(1984-1982) | |
| 0 - 14 | 3.8 | 4.1 | 0.3 |
| 15 - 29 | 8.5 | 9.2 | 0.7 |
| 30 - 44 | 8.8 | 6.7 | -2.1 |
| 45 - 59 | 5.9 | 6.7 | 0.8 |
| 60 - 89 | 11.6 | 9.1 | -2.5 |
| 90 - 119 | 9.0 | 8.2 | -0.8 |
| 120 - 149 | 8.5 | 8.8 | 0.3 |
| 150 - 179 | 7.5 | 7.3 | -0.2 |
| 180 - 239 | 12.7 | 11.8 | -0.9 |
| 240 - 299 | 11.1 | 12.3 | 1.2 |
| 300 - 364*** | 100.0 | 100.0 | 0.0 |
| Proportion of hospital episodes resulting in readmission in period. 1982: 39.3% 1984: 38.4%Expected number of days before readmission. 1982: 194 days 1984: 199 days* Adjusted for competing risks of death and end of study.** One year period from October 1 through September 30.*** Defined as 100 percent chance of occurrence under competing risk adjustment methodology.# Chi-square = 8.80d.f. = 11Significance level = .750 | |||
In a further disaggregation of the total sample of disabled older persons, in which we examined changes of specific case-mix and post-acute care subgroups, we found statistically significant differences at the .05 level in only two cases. The first case involved the "Heart and Lung" GOM group of cases that received HHA services after hospital discharge. This group had a longer expected period of time before hospital readmission (176 vs. 189 days) and had lower risks of readmission within the first 30 and first 45 days after the initiating hospital stay. In a second case, the "Severely Disabled" group with no Medicare post-acute services, there was also a longer expected duration prior to hospital readmission in the post-PPS period, and generally lower risks of readmission at different intervals after the initiating hospital admission.
Overall, our analysis indicated no system-wide changes in hospital readmission risks between the pre- and post-PPS periods for hospital episodes. Among the hospital admissions that were followed by no Medicare A services, there was a marginally significant decline in hospital readmission patterns between 1982-84. For these cases, non-Medicare nursing home and other post-acute services might have been received, although we are not able to make that distinction. Our overall findings are consistent with the notion that PPS incentives result in some discharges to nursing homes being readmitted to hospitals, although the overall pattern of readmissions were not significantly different in the two time periods.
E. Post-Hospital Admission Mortality
In an analysis similar to that for hospital readmissions, we examined the timing of death after hospital admission. Specifically, we employed cause elimination life table methodology to determine the duration specific probability of death adjusted for differential admission rates to hospital in the two periods. In a comparison of the pre- and post-PPS periods, the proportion of persons with hospital admissions who eventually died in the 12-month period remained about the same--12.1% in 1982-83 and 12.5% in 1984-85. The expected number of days after hospital admission to death were identical for the pre- and post-PPS periods. It should be noted that, unlike the results of Table 4, which included rates of hospital discharge resulting in death, the present analysis includes deaths after discharge from the hospital as well as deaths occurring in the hospital.
| TABLE 13. Weighted Life Tables of Hospital Readmission*: 1982-83 and 1984-85 by Use of Postacute Care** | |||
| SNF | HHA | None | |
| Proportion of Hospital Episodes Resulting in Readmission | |||
| 1982 | 36.0%(N=168) | 50.3%(N=753) | 43.4%(N=2,500) |
| 1984 | 33.8%(N=125) | 50.9%(N=747) | 40.0%(N=1,720) |
| Probability (x 100) of Readmission in Interval | |||
| 0-30 days 1982 | 7.3 | 13.2 | 12.8 |
| 0-30 days 1984 | 9.2 | 12.3 | 14.4 |
| 0-90 days 1982 | 31.0 | 39.4 | 32.6 |
| 0-90 days 1984 | 33.2 | 34.9 | 30.1 |
| Expected Number of Days Before Readmission | |||
| 1982 | 206.5 | 175.7 | 196.1 |
| 1984 | 216.4 | 181.7 | 204.9 |
| Overall Comparison of 1982 and 1984 | |||
| Chi-square | 7.3 | 10.0 | 17.0 |
| d.f. | 10 | 11 | 11 |
| Significance level | .750 | .500 | .100 |
| * Adjusted for competing risks of death and end of study.** One year period from October 1 through September 30. | |||
In our analysis of the distribution of deaths at specified intervals of time after hospital admission, we found higher proportions of death occurring in a short period of time after admission. Similar to the patterns of hospital readmission risks found in Table 12, Table 14 shows an increased proportion of deaths occurring within 30 days of hospital admission in 1984 which was offset by a decreased proportion of deaths in succeeding intervals of time after admission. In their analysis of the total Medicare population, Conklin and Houchens (1987) indicated that increases in 30-day mortality after PPS was due exclusively to increased case-mix severity of hospital admission. It is likely that this general finding is applicable to the subgroup of disabled beneficiaries. Overall, there were no statistically significant differences in mortality risks between the pre- and post-PPS periods.
We also stratified the hospital admissions by whether Medicare post-acute services were received to determine if differences in mortality experience between the pre- and post-PPS periods were associated with the use of post-acute care. Table 15 presents the mortality patterns of hospital episodes stratified by use of Medicare SNF, Medicare home health and no post-acute Medicare services. Of the hospital episodes with a subsequent SNF stay, there was a decline in the proportion of deaths for the one year observation period. In the short term, 30 days after hospital admission, there was an increase in mortality risks from 5.9 percent to 8.0 percent. 90 days after hospital admission, the mortality risks of hospital episodes followed by SNF use decreased from 23.7 percent to 14.2 percent. Slight increases in mortality risks were observed for hospital episodes followed by HHA care, both in the short term and for the total observation period of one year. Virtually no differences were found for the hospital episodes that entailed neither SNF nor HHA care following hospitalization.
| TABLE 14. Weighted Life Tables for Death After Hospitalization*: 1982-83 and 1984-85** | |||
| Interval of Days After Hospital Admission | Probability (x 100) of Death in Interval | ||
| 1982(N=3,892) | 1984(N=2,943) | Difference#(1984-1982) | |
| 0 - 14 | 6.3 | 6.8 | 0.5 |
| 15 - 29 | 2.6 | 3.1 | 0.5 |
| 30 - 44 | 2.1 | 1.5 | -0.6 |
| 45 - 59 | 1.4 | 1.2 | -0.2 |
| 60 - 89 | 1.6 | 1.2 | -0.4 |
| 90 - 119 | 0.6 | 0.7 | 0.1 |
| 120 - 149 | 1.0 | 0.7 | -0.3 |
| 150 - 179 | 0.5 | 0.5 | 0.0 |
| 180 - 239 | 0.2 | 1.3 | 1.1 |
| 240 - 299 | 0.8 | 0.8 | 0.0 |
| 300 - 364*** | 100.0 | 100.0 | 0.0 |
| Proportion of hospital episodes resulting in deaths in period. 1982: 12.1% 1984: 12.5%Expected number of days before death. 1982: 287 days 1984: 287 days* Adjusted for competing risks of readmission and end of study.** One year period from October 1 through September 30.*** Defined as 100 percent chance of occurrence under competing risk adjustment methodology.# Chi-square = 13.6d.f. = 11Significance level = .250 | |||
| TABLE 15. Weighted Life Tables of Deaths After Hospital Admission*: 1982-83 and 1984-85 by Use of Postacute Care** | ||||
| SNF | HHA | None | In-HopsitalDeaths | |
| Proportion of Hospital Episodes Resulting in Death | ||||
| 1982 | 21.2%(N=168) | 4.5%(N=753) | 3.3%(N=2,500) | 9.1%(N=449) |
| 1984 | 17.5%(N=125) | 5.7%(N=747) | 3.6%(N=1,720) | 9.1%(N=319) |
| Probability (x 100) of Death in Interval | ||||
| 0-30 days 1982 | 5.9 | 1.2 | 1.3 | 75.0 |
| 0-30 days 1984 | 8.0 | 1.5 | 1.4 | 88.4 |
| 0-90 days 1982 | 23.7 | 4.6 | 3.4 | 97.3 |
| 0-90 days 1984 | 14.2 | 6.0 | 3.6 | 96.8 |
| Expected Number of Days Before Deaths | ||||
| 1982 | 252.7 | 313.2 | 319.0 | 23.2 |
| 1984 | 269.6 | 309.1 | 318.1 | 17.6 |
| Overall Comparison of 1982 and 1984 | ||||
| Chi-square | 16.2 | 9.5 | 4.1 | 11.7 |
| d.f. | 11 | 10 | 10 | 6 |
| Significance level | .250 | .500 | .950 | .100-.050 |
| * Adjusted for competing risks of hospital readmission and end of study.** One year period from October 1 through September 30. | ||||
Table 15 also presents, for persons who died, the proportion of deaths that occurred within 30 and 90 days in the given type of episode. The proportion of deaths occurring in the first 30 days in the hospital increased from 75 percent in 1982-83 to 88 percent in 1984-85--a 17 percent change between the two periods. Statistically significant differences at between the .10 and .05 levels were found for this subgroup of deaths. Consistent with findings by Conklin and Houchens (1987), a likely explanation is that the case-mix of hospital inpatients became more severe after PPS. For the HHA episodes slightly more of the deaths in 1984 occurred within 90 days while, in SNFs fewer deaths occurred within 90 days. Neither of these changes were significant.
Only one of the case mix subgroups was found to have significant differences in mortality patterns. The oldest-old had higher short-term mortality risks, but overall lower risks of post-hospital deaths. Pre-post life table risks of this group reflected those of the overall population in Table 14.
In summary, we did not find statistically significant changes in mortality patterns after hospital admissions (i.e., in hospital and after discharge to some other location). Nor were there changes in mortality patterns by post-acute care use.
V. DISCUSSION
This report presented results from a study to examine the patterns of Medicare hospital, skilled nursing facility and home health agency services before and after the implementation of the hospital prospective payment system. Unlike other studies assessing PPS effects, our study population focused on disabled, noninstitutionalized. Medicare beneficiaries, and subgroups among them.
In general, our results indicated that while changes in utilization of Medicare services occurred, system-wide effects of PPS on outcomes such as hospital readmissions and mortality were not evident. For example, we found reductions in hospital length of stay after PPS and increased use of HHA services. These results are consistent with findings by other researchers (DesHarnais, et al., 1987). We found no overall changes in the risks of hospital readmission and eventual mortality among Medicare hospital patients. The results of our study were consistent with findings by other researchers and understandable, in part, in the context of changes in the health care service environment surrounding the implementation of Medicare's new payment system for hospitals.
Hospital Utilization. We found declines in length of hospital stays for the disabled elderly population, and that these changes were concentrated in certain subgroups. For example, while LOS declined for persons with mild disabilities, they remained the same for those with medically acute conditions. This result suggests that for some Medicare cases, reductions in length of stay could not be achieved in spite of the financial incentives offered by PPS.
Our analysis also suggested a reduction in admissions to hospitals after the implementation of PPS. While consistent with findings of other researchers (Krakauer, 1987, DesHamais, et al., 1987), this result appears to be counterintuitive, in light of the incentives of PPS for higher admission rates and shorter lengths of stays (Stem and Epstein, 1985). A number of reasons for the decline in admission rates have been proposed, including the effects of awareness of unprofitable admissions, the increased use of second opinion and pre-authorization programs, changes in medical technology and the movement of location of services from inpatient to outpatient settings (DesHarnais, et al., 1987). Increases in the role of hospital outpatient care, for example, is illustrated by the fact that the percent of surgical charges under Medicare Part B incurred in hospital outpatient settings has been increasing dramatically. One expected result of reductions in hospital admissions, as a result of the "channeling effects" would be a more severe case-mix of hospital admissions. While we were unable to definitively identify a change in case-mix between the pre- and post-PPS periods, our results on shifts in proportion of patients across the subgroups and the increased hospital risks of mortality within 30 days after admissions would be consistent with this result.
Post-Acute Care. Post-hospital use of Medicare skilled nursing facilities did not increase, as might be expected in light of PPS incentives to substitute post-acute nursing home days for hospital days. However, we were unable to determine with our data source if post-acute use of non-Medicare nursing home care increased after implementation of PPS. Further research with data on Medicare Part B services and service use paid by other sources would clarify these alternative scenarios. Our results indicated that the durations of stay in Medicare SNFs declined after PPS, although we could not explain these results with the data set available for this study.
In contrast to post-acute SNF care, there was a distinct increase in the use of home health services that followed hospital discharges as well as Medicare SNF discharges. Several reasons can be suggested for the increase in HHA use. First, the expected use of post-acute HHA was expected in light of PPS incentives to discharge patients to lower levels of care. Second, between 1982 and 1985, there was a major increase in the availability of HHA services across the U.S. For example, the number of home health care agencies participating in Medicare increased from 3,600 to 5,900 over this time (Hall and Sangl, 1987). Hence, increases in the supply of HHA providers could have contributed substantially to the increase in the post-acute HHA services after PPS.
Hospital Readmissions. Hospital readmission rates were expected to increase after PPS in light of the incentives of PPS for hospitals to discharge patients as quickly as possible. Our analysis suggested that the overall patterns of hospital readmission risks were not different between the one year pre- and post-PPS observation periods. We did find indications of increased hospital readmission rates in cases where initiating hospital discharges were followed by neither Medicare SNF or HHA use (but possibly non-Medicare nursing home care). In addition, a small increase in the rate of hospital readmission was suggested by SNF discharges to hospitals for the subgroup of severely ADL dependent persons.
The pattern of hospital readmissions that we found, for both the pre- and post-PPS periods, were similar to results derived by other researchers at other points in time, in spite of differences in methodologies applied to study this issue. For example, Krakauer's study found no increase in the rates of hospital readmissions between 1983-84 and 1985. This result is analogous to our comparison of the 1982-83 and 1984-85 windows. In another study (DesHarnais, et al., 1987), statistically significant increases in hospital readmissions were also not found. Further analyses would be important to determine the circumstances under which specific groups of individuals might have experienced increased risks of hospital readmissions.
Mortality. We did not find overall changes in mortality among hospital patients between pre- and post-PPS periods, although an increased risk of mortality was indicated for the short-term (e.g., within 30 days of the initiating admission). This result was consistent with those of Krakauer (1987) and Conklin and Houchens (1987). Both of those studies indicated that a shift to higher mortality risks within 30 days after hospital admission is consistent with the increases in case-mix severity after PPS.
Subgroups of the Population. In order to differentiate among the individuals comprising the disabled noninstitutionalized Medicare population, we identified subgroups with Grade of Membership techniques. The characteristics of the four subgroups suggested different needs for Medicare services and different risks of various outcomes such as hospital readmission and mortality. For example, there might have been substitution between hospital and SNF care for the mildly disabled, but for the heart and lung disease patients, no differences in hospital length of stay was observed. A higher rate of other episodes terminating in deaths among the oldest-old suggests that Medicare service use changed for this group. A clear interpretation of this finding requires, however, a data set that can determine what other services and where such individuals were receiving care.
Since our data set contained only Medicare Part A service use records, we were not able to determine the relationship between Medicare Part A service use and other Medicare service use, such as outpatient care, and non-Medicare services, such as nursing home care privately paid or paid by Medicaid. This limitation restricted inferences about case-mix changes of hospital admissions, because lighter care patients who might have been admitted to inpatient hospital care were treated in outpatient facilities instead. This limitation affected our analyses of the patterns of no Medicare A service use episodes, i.e., "other" episodes.
Our definition of termination status of Medicare hospital, SNF, and HHA episodes required coterminous occurrences of two states (e.g., hospital and home health care). Hence, post-acute care services that were initiated several days after hospital discharge were not measured as hospital transition events. Hence, our decision rule probably produced lower rates of post-acute Medicare SNF and HHA utilization rates. However, since our objective in this study was to measure pre- and post-PPS changes in utilization, the application of a uniform definition for both study periods produced comparable measures for the two periods.
VI. CONCLUSIONS
The implementation of a prospective, fixed rate payment system for hospitals under Medicare created both a perception that hospital efficiency could be improved and concern that incentives for efficiency could result in adverse consequences for Medicare beneficiaries. Because of the recent introduction of PPS, relatively few evaluation results have been available to study its effects on Medicare service use and patients.
The purpose of this study was to provide empirical information on Medicare hospital PPS effects on an important subgroup of Medicare beneficiaries, the functionally disabled. Results of our study provided further insights on the effects of PPS on utilization patterns and mortality outcomes in the two periods of time. Along with other studies, some that have been completed while others are being developed, our results are intended to provide a better understanding of the changes that result from a landmark change in Medicare policies. As these studies are completed, policy makers will have a better understanding of the effects of PPS on the provision and outcomes of various t3rpes of Medicare as well as non-Medicare services. Of particular importance would be improved information on how Medicare beneficiaries might be experiencing different locations of services (e.g., increased outpatient care) and how such changes affect overall costs per episode of illness. Similarly, relatively little information currently exists on the status of patients discharged from hospitals in terms of their health status and use of community based recuperative and rehabilitative care.
In conclusion, our study on the effects of hospital PPS on the functionally impaired subgroup of Medicare beneficiaries found expected changes in service utilization and no system-wide adverse outcomes. The changes in service utilization patterns were expected as a consequence of financial incentives provided by PPS. Declines in hospital LOS was expected because of the PPS incentive to hospitals to become more efficient. It is important to note that for certain subgroups of the disabled elderly, hospital LOS actually remained the same before and after implementation of PPS. This finding suggests that in spite of the financial incentives, hospitals were unable to reduce LOS for certain types of patients. The absence of increased SNF use was surprising, but the increase in HHA use was expected. Our study also suggested that quality of care, in terms of hospital readmissions and mortality, were not systematically affected by PPS. Within the constraints of the data set that was assembled for this study, we could find only indications of hospital readmission increases for the severely disabled subgroup, but this change was only from 23.4 percent to 25.4 percent before and after PPS implementation. Overall mortality differences were not found between the two periods, although some differences were found in the patterns of mortality by service settings.
In general, our results on the impaired elderly are consistent with findings from other studies that examined PPS effects on the total Medicare population. While PPS affected utilization of Medicare hospital, SNF And HHA care, systematic adverse effects of the policy on Medicare beneficiaries were not apparent. Further research on the community services, nursing home use and other periods of care would be necessary to develop a complete picture of the effects of PPS on impaired Medicare beneficiaries.
REFERENCES
Conklin, J.E. and R.L. Houchens. 1987. "PPS Impact on Mortality Rates: Adjustments for Case-Mix Severity." Final Report. HCFA Contract No. 500-85-0015, October 6.
DesHarnais, S., E. Kobrinski, J. Chesney, et al. 1987. "The Early Effects of the Prospective Payment System on Inpatient Utilization and the Quality of Care," Inquiry, 24:7-16.
Fitzgerald, J.F., L.F. Fagan, W.M. Tierney and R.S. Dittus. 1987. "Changing Patterns of Hip Fracture Care Before and After Implementation of the Prospective Payment System," JAMA, 258:218-221.
Hall, M.J. and J. Sangl. 1987. "Prospective Payment System on Long Term Care Providers." Presented at the APHA Annual Meeting, New Orleans, Louisiana, October 20.
Iezzoni, L.I. 1986. "Change in the Health Care System: The Search for Proof," Journal of the American Geriatrics Society, 34:615-617.
Krakauer, H. "Outcomes of In-Hospital Care of Medicare Patients: 1983-1985." To be published in Health Care Financing Review, 1987, Annual Supplement.
Manton, K.G., E. Stallard, M.A. Woodbury, and A.I. Yashin. 1987. "Grade of Membership Techniques for Studying Complex Event History Processes with Unobserved Covariates." Sociological Methodology, 1987 (C. Clogg, Ed.). Jossey-Bass, pp.309-346.
Neu, C.R. and S. Harrison. 1987. "Post-hospital Care Before and After the Medicare Prospective Payment System." Presented at the APHA Annual Meeting, New Orleans, Louisiana, October 20.
Sager, M.A., E.A. Leventhal and D.V. Easterling. 1987. "The Impact of Medicare's Prospective Payment System on Wisconsin Nursing Homes," JAMA, 257:1762-1766.
Shaughnessy, P.W., A.M. Kramer, and R.E. Schlenker, "Case-Mix, Quality, and Reimbursement Issues and Findings from Selected Studies of Long-Term Care." Presented at the Office of Research and Demonstrations, Health Care Financing Administration, Baltimore, MD, August 1987.
Stern, R.S. and A.M. Epstein. 1985. "Institutional Responses to Prospective Payment Based on Diagnosis-Related Groups," N Engl J Med, 312:621-627.
Woodbury, M.A. and K.G. Manton. 1982. "A New Procedure for Analysis of Medical Classification," Methods of Information in Medicine, 21:210-220.
APPENDIX A
In the GOM procedure, a person may be described by more than one continuously varying case-mix dimension. Because of this, GOM is distinct from the classification methodology used to identify the DRG categories or hospital reimbursement by which homogeneous discrete groups are defined in terms of the variation of a single criterion (i.e., charges or length of stay) except where clinical judgment was used to modify the statistically defined groups; and each case is assigned to exactly one group and thus does not represent individual heterogeneity in the classification.
We can describe the GOM model with a single equation. The equation indicates that each person's score on the jth observed variables (xijl) is composed of the sum of the product of that person's weights for each of the dimensions (gik's) times the scores of the dimension of the jth variable ( ). Verbally this can be written
[person's score on variable] = the sum of [[person's weight on dimension] x [dimension's score on variable]]
Using mathematical symbols the equation is
 (1)
(1)
wherexijl = the individual's score on the jth variable or attribute predicted by the model,gik = an individual's weight on the Kth pure type (or group), = a dimension's score on the jth variable or attribute,K = number of dimensions, andj = number of variables (and l is the number of different types of responses to the variable).
Each of the values defined in the model can be given a substantive interpretation. The score  represents the probability predicted by the model that the ith person has a particular attribute. The values of gik and are selected so that the xijl, (the observed binary indicator values) and (the predicted probability of each indicator) are as close as possible for a given number of case-mix dimensions, i.e., for a given vale of K.
The product in (1) involves two types of coefficients. The first type are the scores . These are the probabilities that person on the kth dimension have response level l for variable j. The set of these coefficients describes the substantive nature of each of the K analytically defined dimensions just as the set of factor loadings in a factor analysis describes the nature of the analytically determined factors. Thus, to describe the clinical characteristics of each of the K dimensions identified by the procedure, we need to determine if the attribute identified by the procedures as fitting a dimension are reasonably associated with one another.
A similar criterion (i.e., that the analytically defined groups be clinically meaningful) was employed in the creation of the DRG categories by using the expert judgment of physician panels. In the GOM analysis, the health and functional status variables are used directly in the statistical procedure to identify the case-mix dimensions. Of course, the GOM results could also be reviewed and modified by expert panels by one of the following:
- Changing the distribution of the gik's or altering the 's.
- Adding in additional variables to the GOM analysis to help objectively redefine the case-mix dimensions by increasing the scope of measures used in their definition.
The second type of coefficient or score are the gik's. These scores describe how close the observed attributes of individual cases are to the profile of attributes (i.e., the pattern of 's) for each of the K case-mix dimensions. This score has the property that it must be between 0 and 1.0; and it must sum to 1.0 over the K dimensions for each case. As such, they can be used as linear weights to reproduce the observed attributes of each person as a composite of parts of the attributes associated with each of the K analytically determined profiles.
An important parameter in the analysis is the number of case-mix dimensions (i.e., K). Because the coefficients are estimated using maximum likelihood procedure (Woodbury and Manton, 1982), the procedure provides a statistical criterion for selecting the best value of K. This criterion is a X2 value (calculated as twice the change in the log-likelihood function) describing the statistical significance of the K + l dimension, i.e., whether the 's are closer to the xijl's than could be expected by chance when the K + l group is added. One continues to add dimensions until the K + l dimension is no longer significant according to the X2 criterion.
APPENDIX B
| TABLE B-1. Duration in Days (e0) and Percent of Persons in a Given Type of Episode (l0) of Community Non-Disabled, 1982 and 1984 National Long Term Care Survey | |||||||||||
| AllCauses | NursingHome | Hospital | HomeHealthAgency | Community | Deceased | Eliminating End of Study | |||||
| NursingHome | Hospital | HomeHealthAgency | Community | Deceased | |||||||
| Nursing Home Episode | |||||||||||
| 1982 e0 l0 | 55.65100,000 | ------ | 37.7119,807 | 19.234,885 | 38.6743,215 | 32.0911,902 | ------ | 77.4925,029 | 52.625,699 | 75.2854,573 | 72.6914,700 |
| 1984 e0 l0 | 33.18100,000 | ------ | 21.027,071 | 29.6910,283 | 36.9062,986 | 28.708,791 | ------ | 22.197,644 | 30.3811,473 | 41.9571,086 | 30.969,796 |
| Hospital Episode | |||||||||||
| 1982 e0 l0 | 10.06100,000 | 21.972,139 | ------ | 17.175,456 | 9.0085,243 | 14.954,703 | 22.632,260 | ------ | 17.805,695 | 9.2387,164 | 15.624,880 |
| 1984 e0 l0 | 8.76100,000 | 20.032,376 | ------ | 14.327,621 | 7.6982,515 | 12.395,198 | 20.552,496 | ------ | 14.627,911 | 7.8484,233 | 12.975,360 |
| Home Health Agency Episode | |||||||||||
| 1982 e0 l0 | 49.62100,000 | 17.35394 | 33.5910,203 | ------ | 41.8370,599 | 43.063,501 | 17.43411 | 38.7711,251 | ------ | 66.4084,337 | 51.784,002 |
| 1984 e0 l0 | 37.21100,000 | 32.77485 | 30.668,755 | ------ | 36.6680,253 | 29.452,226 | 32.85518 | 33.529,406 | ------ | 42.2987,687 | 32.812,389 |
| Community Episode | |||||||||||
| 1982 e0 l0 | 275.94100,000 | 134.89124 | 138.0222,299 | 31.932,056 | ------ | 114.631,016 | 331.70921 | 306.0491,535 | 90.532,526 | ------ | 311.455,018 |
| 1984 e0 l0 | 288.30100,000 | 102.69175 | 136.2918,584 | 43.802,345 | ------ | 133.251,035 | 334.881,569 | 314.7488,294 | 209.714,910 | ------ | 317.175,227 |
| TABLE B-2. Duration in Days (e0) and Percent of Persons in a Given Type of Episode (l0) of Institutionalized Persons, 1982 and 1984 National Long Term Care Survey | |||||||||||
| AllCauses | NursingHome | Hospital | HomeHealthAgency | Community | Deceased | Eliminating End of Study | |||||
| NursingHome | Hospital | HomeHealthAgency | Community | Deceased | |||||||
| Nursing Home Episode | |||||||||||
| 1982 e0 l0 | 167.49100,000 | ------ | 125.4630,133 | 0.000 | 102.6422,453 | 110.7115,008 | ------ | 195.8245,326 | 0.000 | 163.8930,762 | 197.6923,911 |
| 1984 e0 l0 | 103.21100,000 | ------ | 87.6930,353 | 0.000 | 83.3239,142 | 105.1520,272 | ------ | 108.1833,902 | 0.000 | 98.2042,742 | 130.8223,356 |
| Hospital Episode | |||||||||||
| 1982 e0 l0 | 12.03100,000 | 12.7013,815 | ------ | 13.091,445 | 11.6069,625 | 13.7212,808 | 12.8514,180 | ------ | 13.311,482 | 11.8171,206 | 14.1413,131 |
| 1984 e0 l0 | 9.95100,000 | 14.419,966 | ------ | 12.602,535 | 9.1271,732 | 10.0113,242 | 15.3710,428 | ------ | 12.712,605 | 9.3473,357 | 10.5513,610 |
| Home Health Agency Episode | |||||||||||
| 1982 e0 l0 | 48.71100,000 | 75.001,388 | 19.337,078 | ------ | 42.0181,951 | 180.001,387 | 81.061,601 | 27.847,474 | ------ | 52.2889,049 | 183.781,876 |
| 1984 e0 l0 | 47.24100,000 | 10.501,690 | 35.3911,105 | ------ | 49.2384,830 | 36.501,072 | 10.501,690 | 36.5611,196 | ------ | 50.8386,042 | 36.501,072 |
| Community Episode | |||||||||||
| 1982 e0 l0 | 233.38100,000 | 117.921,248 | 120.9128,879 | 111.832,323 | ------ | 135.398,636 | 250.982,873 | 247.2663,538 | 64.312,419 | ------ | 296.8431,170 |
| 1984 e0 l0 | 238.26100,000 | 101.421,160 | 122.2726,130 | 47.432,008 | ------ | 136.5011,503 | 230.662,370 | 253.4459,641 | 50.752,067 | ------ | 287.8335,922 |
| TABLE B-3. Duration in Days (e0) and Percent of Persons in a Given Type of Episode (l0) of Community Disabled Elderly, 1982 and 1984 National Long Term Care Survey | |||||||||||
| AllCauses | NursingHome | Hospital | HomeHealthAgency | Community | Deceased | Eliminating End of Study | |||||
| NursingHome | Hospital | HomeHealthAgency | Community | Deceased | |||||||
| Nursing Home Episode | |||||||||||
| 1982 e0 l0 | 52.52100,000 | ------ | 49.8523,361 | 21.035,207 | 35.3740,354 | 36.5213,026 | ------ | 88.6130,410 | 47.695,904 | 62.7647,920 | 67.7315,767 |
| 1984 e0 l0 | 35.29100,000 | ------ | 43.9715,668 | 28.0610,697 | 32.4958,318 | 30.417,991 | ------ | 51.2817,094 | 31.4011,484 | 36.8262,875 | 35.458,547 |
| Hospital Episode | |||||||||||
| 1982 e0 l0 | 11.59100,000 | 19.194,892 | ------ | 13.5811,546 | 10.2272,152 | 15.058,197 | 20.185,182 | ------ | 14.0912,001 | 10.5674,231 | 16.188,586 |
| 1984 e0 l0 | 10.36100,000 | 14.324,526 | ------ | 12.1514,490 | 9.5970,462 | 11.408,080 | 14.594,678 | ------ | 12.4214,915 | 9.8272,112 | 11.828,296 |
| Home Health Agency Episode | |||||||||||
| 1982 e0 l0 | 65.76100,000 | 55.23400 | 51.2012,102 | ------ | 50.2066,346 | 65.053,612 | 56.66454 | 77.0314,510 | ------ | 79.5280,398 | 100.554,638 |
| 1984 e0 l0 | 45.50100,000 | 38.075,271 | 48.759,623 | ------ | 41.2978,052 | 40.043,344 | 36.96563 | 63.0110,794 | ------ | 49.2084,961 | 52.693,683 |
| Community Episode | |||||||||||
| 1982 e0 l0 | 204.21100,000 | 121.74360 | 121.4735,717 | 42.118,744 | ------ | 95.852,369 | 292.801,305 | 250.2581,956 | 134.9912,583 | ------ | 200.884,156 |
| 1984 e0 l0 | 206.41100,000 | 105.89498 | 119.3730,134 | 49.2712,554 | ------ | 98.152,698 | 254.971,249 | 259.2575,053 | 132.3117,548 | ------ | 241.116,151 |
APPENDIX C
| TABLE C-1. Probabilities for ADL, IADL and IADL2 Limitations and Medical Conditions, 1982 and 1984 National Long-Term Care, Other Disabled Persons | |||||
| Frequency | I | II | III | IV | |
| ADL LIMITATIONS | |||||
| Respondent Needs Help With: | |||||
| Eating | 10.8 | 0.0 | 0.0 | 0.0 | 59.8 |
| Getting In/Out of Bed | 38.7 | 0.0 | 71.8 | 0.0 | 100.0 |
| Getting About Inside | 52.2 | 0.0 | 100.0 | 0.0 | 100.0 |
| Dressing | 32.3 | 0.0 | 0.0 | 0.0 | 100.0 |
| Bathing | 57.9 | 0.0 | 100.0 | 35.7 | 100.0 |
| Using Toilet | 33.5 | 0.0 | 49.6 | 0.0 | 100.0 |
| Bedfast | 2.3 | 0.0 | 0.0 | 0.0 | 10.6 |
| No Inside Activity | 3.7 | 0.0 | 0.0 | 0.0 | 17.1 |
| Wheelchair Fast | 7.2 | 0.0 | 0.0 | 0.0 | 32.8 |
| IADL LIMITATIONS | |||||
| Respondent Needs Help With: | |||||
| Heavy Work | 84.5 | 33.3 | 100.0 | 100.0 | 100.0 |
| Light Work | 38.3 | 0.0 | 100.0 | 0.0 | 100.0 |
| Laundry | 60.4 | 0.0 | 100.0 | 50.6 | 100.0 |
| Cooking | 47.6 | 0.0 | 100.0 | 0.0 | 100.0 |
| Grocery Shopping | 75.2 | 0.0 | 100.0 | 100.0 | 100.0 |
| Getting About Outside | 74.9 | 3.3 | 100.0 | 100.0 | 100.0 |
| Traveling | 74.1 | 0.0 | 100.0 | 100.0 | 100.0 |
| Managing Money | 38.8 | 0.0 | 41.8 | 3.7 | 100.0 |
| Taking Medicine | 36.3 | 0.0 | 0.0 | 0.0 | 100.0 |
| Telephoning | 24.0 | 0.0 | 0.0 | 0.0 | 100.0 |
| IADL 2 LIMITATIONS | |||||
| How Much Difficulty Does Respondent Have: | |||||
| Climbing 1 Flight of Stairs | |||||
| No Difficulty | 10.7 | 31.8 | 0.0 | 0.0 | 0.0 |
| Some Difficulty | 24.9 | 68.2 | 0.0 | 0.0 | 11.0 |
| Very Difficult | 34.1 | 0.0 | 44.7 | 88.0 | 0.0 |
| Cannot | 30.3 | 0.0 | 55.3 | 12.0 | 89.1 |
| Bending for Socks | |||||
| No Difficulty | 33.8 | 92.5 | 0.0 | 0.0 | 0.0 |
| Some Difficulty | 26.6 | 7.5 | 53.1 | 56.5 | 0.0 |
| Very Difficult | 20.9 | 0.0 | 46.9 | 43.5 | 8.4 |
| Cannot | 18.8 | 0.0 | 0.0 | 0.0 | 91.6 |
| Holding 10 lb. Package | |||||
| No Difficulty | 17.6 | 58.7 | 0.0 | 0.0 | 0.0 |
| Some Difficulty | 14.4 | 37.5 | 4.5 | 9.0 | 0.0 |
| Very Difficult | 16.5 | 3.8 | 20.9 | 43.0 | 0.0 |
| Cannot | 51.5 | 0.0 | 74.7 | 48.1 | 100.0 |
| Reaching Over Head | |||||
| No Difficulty | 45.8 | 96.4 | 77.4 | 0.0 | 0.0 |
| Some Difficulty | 22.9 | 3.6 | 22.6 | 47.4 | 18.5 |
| Very Difficult | 17.5 | 0.0 | 0.0 | 39.6 | 32.8 |
| Cannot | 13.8 | 0.0 | 0.0 | 12.9 | 48.7 |
| Combing Hair | |||||
| No Difficulty | 60.3 | 100.0 | 100.0 | 0.0 | 0.0 |
| Some Difficulty | 18.0 | 0.0 | 0.0 | 75.5 | 17.7 |
| Very Difficult | 10.8 | 0.0 | 0.0 | 24.5 | 29.9 |
| Cannot | 10.8 | 0.0 | 0.0 | 0.0 | 52.4 |
| Washing Hair | |||||
| No Difficulty | 39.8 | 100.0 | 31.9 | 0.0 | 0.0 |
| Some Difficulty | 14.5 | 0.0 | 8.2 | 61.9 | 0.0 |
| Very Difficult | 11.0 | 0.0 | 12.3 | 38.1 | 3.2 |
| Cannot | 34.7 | 0.0 | 47.6 | 0.0 | 96.8 |
| Grasping Small Objects | |||||
| No Difficulty | 59.4 | 100.0 | 100.0 | 0.0 | 0.0 |
| Some Difficulty | 21.7 | 0.0 | 0.0 | 73..0 | 31.1 |
| Very Difficult | 12.0 | 0.0 | 0.0 | 27.0 | 32.1 |
| Cannot | 7.0 | 0.0 | 0.0 | 0.0 | 36.8 |
| Respondent Can See Well Enough to Read Newsprint | 67.5 | 89.8 | 77.6 | 64.9 | 28.9 |
| MEDICAL CONDITIONS | |||||
| Rheumatism/Arthritis | 71.8 | 57.7 | 47.2 | 100.0 | 76.0 |
| Paralysis | 12.3 | 0.0 | 0.0 | 0.0 | 54.0 |
| Perm. Stiffness | 26.5 | 5.4 | 0.0 | 61.5 | 47.2 |
| Multiple Sclerosis | 1.3 | 0.0 | 0.0 | 0.0 | 5.5 |
| Cerebral Palsy | 0.6 | 0.0 | 0.0 | 0.0 | 2.4 |
| Epilepsy | 1.1 | 0.8 | 0.0 | 0.7 | 3.0 |
| Parkinson's Disease | 4.4 | 1.9 | 0.0 | 0.0 | 16.3 |
| Glaucoma | 9.2 | 6.4 | 14.8 | 3.9 | 11.9 |
| Diabetes | 21.2 | 11.9 | 0.8 | 45.4 | 30.5 |
| Cancer | 8.2 | 6.0 | 10.8 | 8.9 | 7.6 |
| Constipation | 36.7 | 14.2 | 0.0 | 84.4 | 62.2 |
| Insomnia | 41.9 | 19.2 | 0.0 | 100.0 | 54.3 |
| Headache | 18.9 | 0.0 | 0.0 | 63.9 | 26.4 |
| Obesity | 17.7 | 13.5 | 4.0 | 51.6 | 5.5 |
| Arteriosclerosis | 36.5 | 12.4 | 0.0 | 80.5 | 71.8 |
| Mental Retardation | 2.3 | 0.0 | 0.0 | 0.0 | 10.2 |
| Senility | 13.2 | 0.0 | 0.0 | 0.0 | 59.5 |
| Heart Attack | 9.1 | 0.0 | 0.0 | 31.4 | 9.7 |
| Other Heart Problems | 33.8 | 8.9 | 0.0 | 100.0 | 41.6 |
| Hypertension | 44.0 | 33.4 | 2.9 | 100.0 | 47.6 |
| Stroke | 11.4 | 4.2 | 0.0 | 7.6 | 38.6 |
| Circulation Trouble | 56.2 | 23.1 | 0.0 | 100.0 | 100.0 |
| Pneumonia | 7.5 | 0.0 | 0.0 | 21.9 | 10.9 |
| Bronchitis | 12.8 | 0.0 | 0.0 | 43.6 | 13.5 |
| Influenza | 15.0 | 6.8 | 0.0 | 41.4 | 15.8 |
| Emphysema | 12.9 | 6.1 | 5.0 | 29.6 | 12.9 |
| Asthma | 7.9 | 1.7 | 0.0 | 25.2 | 8.1 |
| Broken Hip | 2.5 | 0.0 | 8.8 | 0.0 | 1.4 |
| Other Broken Bones | 6.1 | 2.8 | 13.4 | 2.6 | 6.0 |
| SEX | |||||
| Male | 35.6 | 54.0 | 30.6 | 4.4 | 48.3 |
| Female | 64.4 | 46.0 | 69.4 | 95.6 | 51.7 |
| AGE | |||||
| 65-69 | 14.8 | 17.6 | 6.5 | 22.5 | 13.2 |
| 70-74 | 19.5 | 22.7 | 9.4 | 29.4 | 17.7 |
| 75-79 | 22.1 | 27.1 | 13.1 | 32.4 | 16.6 |
| 80-84 | 21.1 | 22.3 | 24.1 | 9.7 | 27.7 |
| 85-89 | 14.6 | 9.7 | 27.5 | 4.9 | 15.1 |
| 90+ | 7.9 | 0.7 | 19.4 | 1.2 | 9.6 |
| MARITAL STATUS | |||||
| Married | 42.9 | 53.6 | 29.4 | 27.7 | 58.8 |
| Not Marrid | 57.1 | 46.4 | 70.6 | 72.3 | 41.2 |
| SUBJECTIVE HEALING | |||||
| Excellent | 9.0 | 22.0 | 10.6 | 0.0 | 0.3 |
| Good | 25.2 | 46.0 | 40.4 | 4.5 | 3.8 |
| Fair | 32.3 | 30.8 | 37.2 | 43.4 | 16.2 |
| Poor | 33.6 | 1.2 | 11.8 | 52.1 | 79.7 |
| EVER BEEN NURSING HOME PATIENT? | 11.4 | 3.0 | 21.8 | 3.2 | 18.8 |
| HAD HOSPITAL STAY IN LAST YEAR? | 49.9 | 28.7 | 39.4 | 66.6 | 71.8 |
| HOW MANY HELPER? | |||||
| 0 | 11.5 | 32.0 | 5.1 | 5.7 | 0.4 |
| 1 | 43.2 | 48.8 | 38.4 | 42.5 | 42.8 |
| 2 | 25.5 | 15.5 | 32.8 | 26.3 | 28.0 |
| 3 | 13.0 | 2.3 | 14.9 | 21.2 | 15.2 |
| 4 | 6.9 | 1.4 | 8.8 | 4.4 | 13.6 |
| HOW MANY DAYS DO THEY HELP PER WEEK TOGETHER? | |||||
| 0 | 18.7 | 47.9 | 7.8 | 13.1 | 2.7 |
| 1-5 | 17.9 | 22.7 | 16.6 | 31.6 | 1.9 |
| 6-7 | 35.9 | 23.9 | 42.5 | 34.0 | 43.9 |
| 8-12 | 13.6 | 3.8 | 18.9 | 15.8 | 17.0 |
| 13+ | 14.0 | 1.7 | 14.1 | 5.4 | 34.6 |
| MEDICAID PAID HEALTH CARE IN LAST YEAR? | 20.1 | 8.3 | 12.0 | 35.6 | 29.1 |
| CURRENT MEDICAID PARTICIPANT? | 22.2 | 11.4 | 16.0 | 35.8 | 29.4 |
| HOME NURSING SERVICE? | 20.6 | 0.0 | 25.2 | 10.5 | 53.5 |