
U.S. Department of Health and Human Services
Changes in Marriage and Fertility Behavior: Behavior Versus Attitudes of Young Adults
Kristin A. Moore, Ph.D. and Thomas M. Stief
Child Trends, Inc.
July 1989
This report was prepared under grants #HD21537-03 and #SES8501616 between HHS's Office of Social Services Policy (now the Office of Disability, Aging and Long-Term Care Policy) and Child Trends, Inc. Additional funding was provided by HHS's National Institute of Child Health and Human Development. For additional information about this subject, you can visit the ASPE home page at http://aspe.hhs.gov. The Project Officer was Gerald Silverman.
The opinions and views expressed in this report are those of the authors. They do not necessarily reflect the views of the Department of Health and Human Services, the contractor or any other funding organization. The production assistance of Peggy Daly is gratefully acknowledged.
Striking changes have occurred in marriage and family behavior during the past several decades. These include large increases in delayed marriage and divorce, in adolescent and premarital sexual activity, in the incidence of abortion, and in non-marital childbearing. As large as these changes have been, other waves of change have come and gone over the years, and it is possible that many of the changes that we have seen are part of such an ebb and flow (Vinovskis, 1988). On the other hand, the magnitude of some of the changes is so great that it is possible that they represent real secular changes in behavior.
Whether the changes are transitory or permanent has important implications for policy. For example, if policies are developed and implemented which lack support among youth, then it will be difficult to effect change just by changing law or policy. The reverse is also the case. If policies are being considered that have considerable underlying support, then their likelihood of success if implemented is much greater. In addition, if the data suggest that current trends are likely to continue, rather than abate or reverse, then it is necessary to plan for the future with this expectation in mind.
One way to gauge whether recent changes are likely to hold at least over the next decade or two is to examine whether the trends in behavior are at odds with the attitudes and values of youth currently coming of age in the United States. A second kind of evidence comes from examining whether the trends are in opposition to or in keeping with trends in technology. That is, are technological advances likely to support the recent trends? Another type of evidence is provided by an assessment of whether the short-term changes are in keeping with truly long-term changes, that is changes over the last 100 or 200 years. In addition, comparisons with comparable modern industrialized democracies can also contribute to an understanding of the permanence of current patterns. In the current paper, however, we will consider primarily the first kind of evidence, that is, the extent to which current patterns are supported by the attitudes and values of contemporary young people.
Evidence regarding current trends in sexual, fertility and marital behavior will first be highlighted and then evidence regarding their permanence will be presented and discussed.
TRENDS
Detailed data on sexual, marital, and fertility behavior are presented in U.S. Children and Their Families: Current Conditions and Recent Trends, 1989. Summaries of the relevant information are presented in Figures 1 through 4.
Sexual Activity Among Teenagers
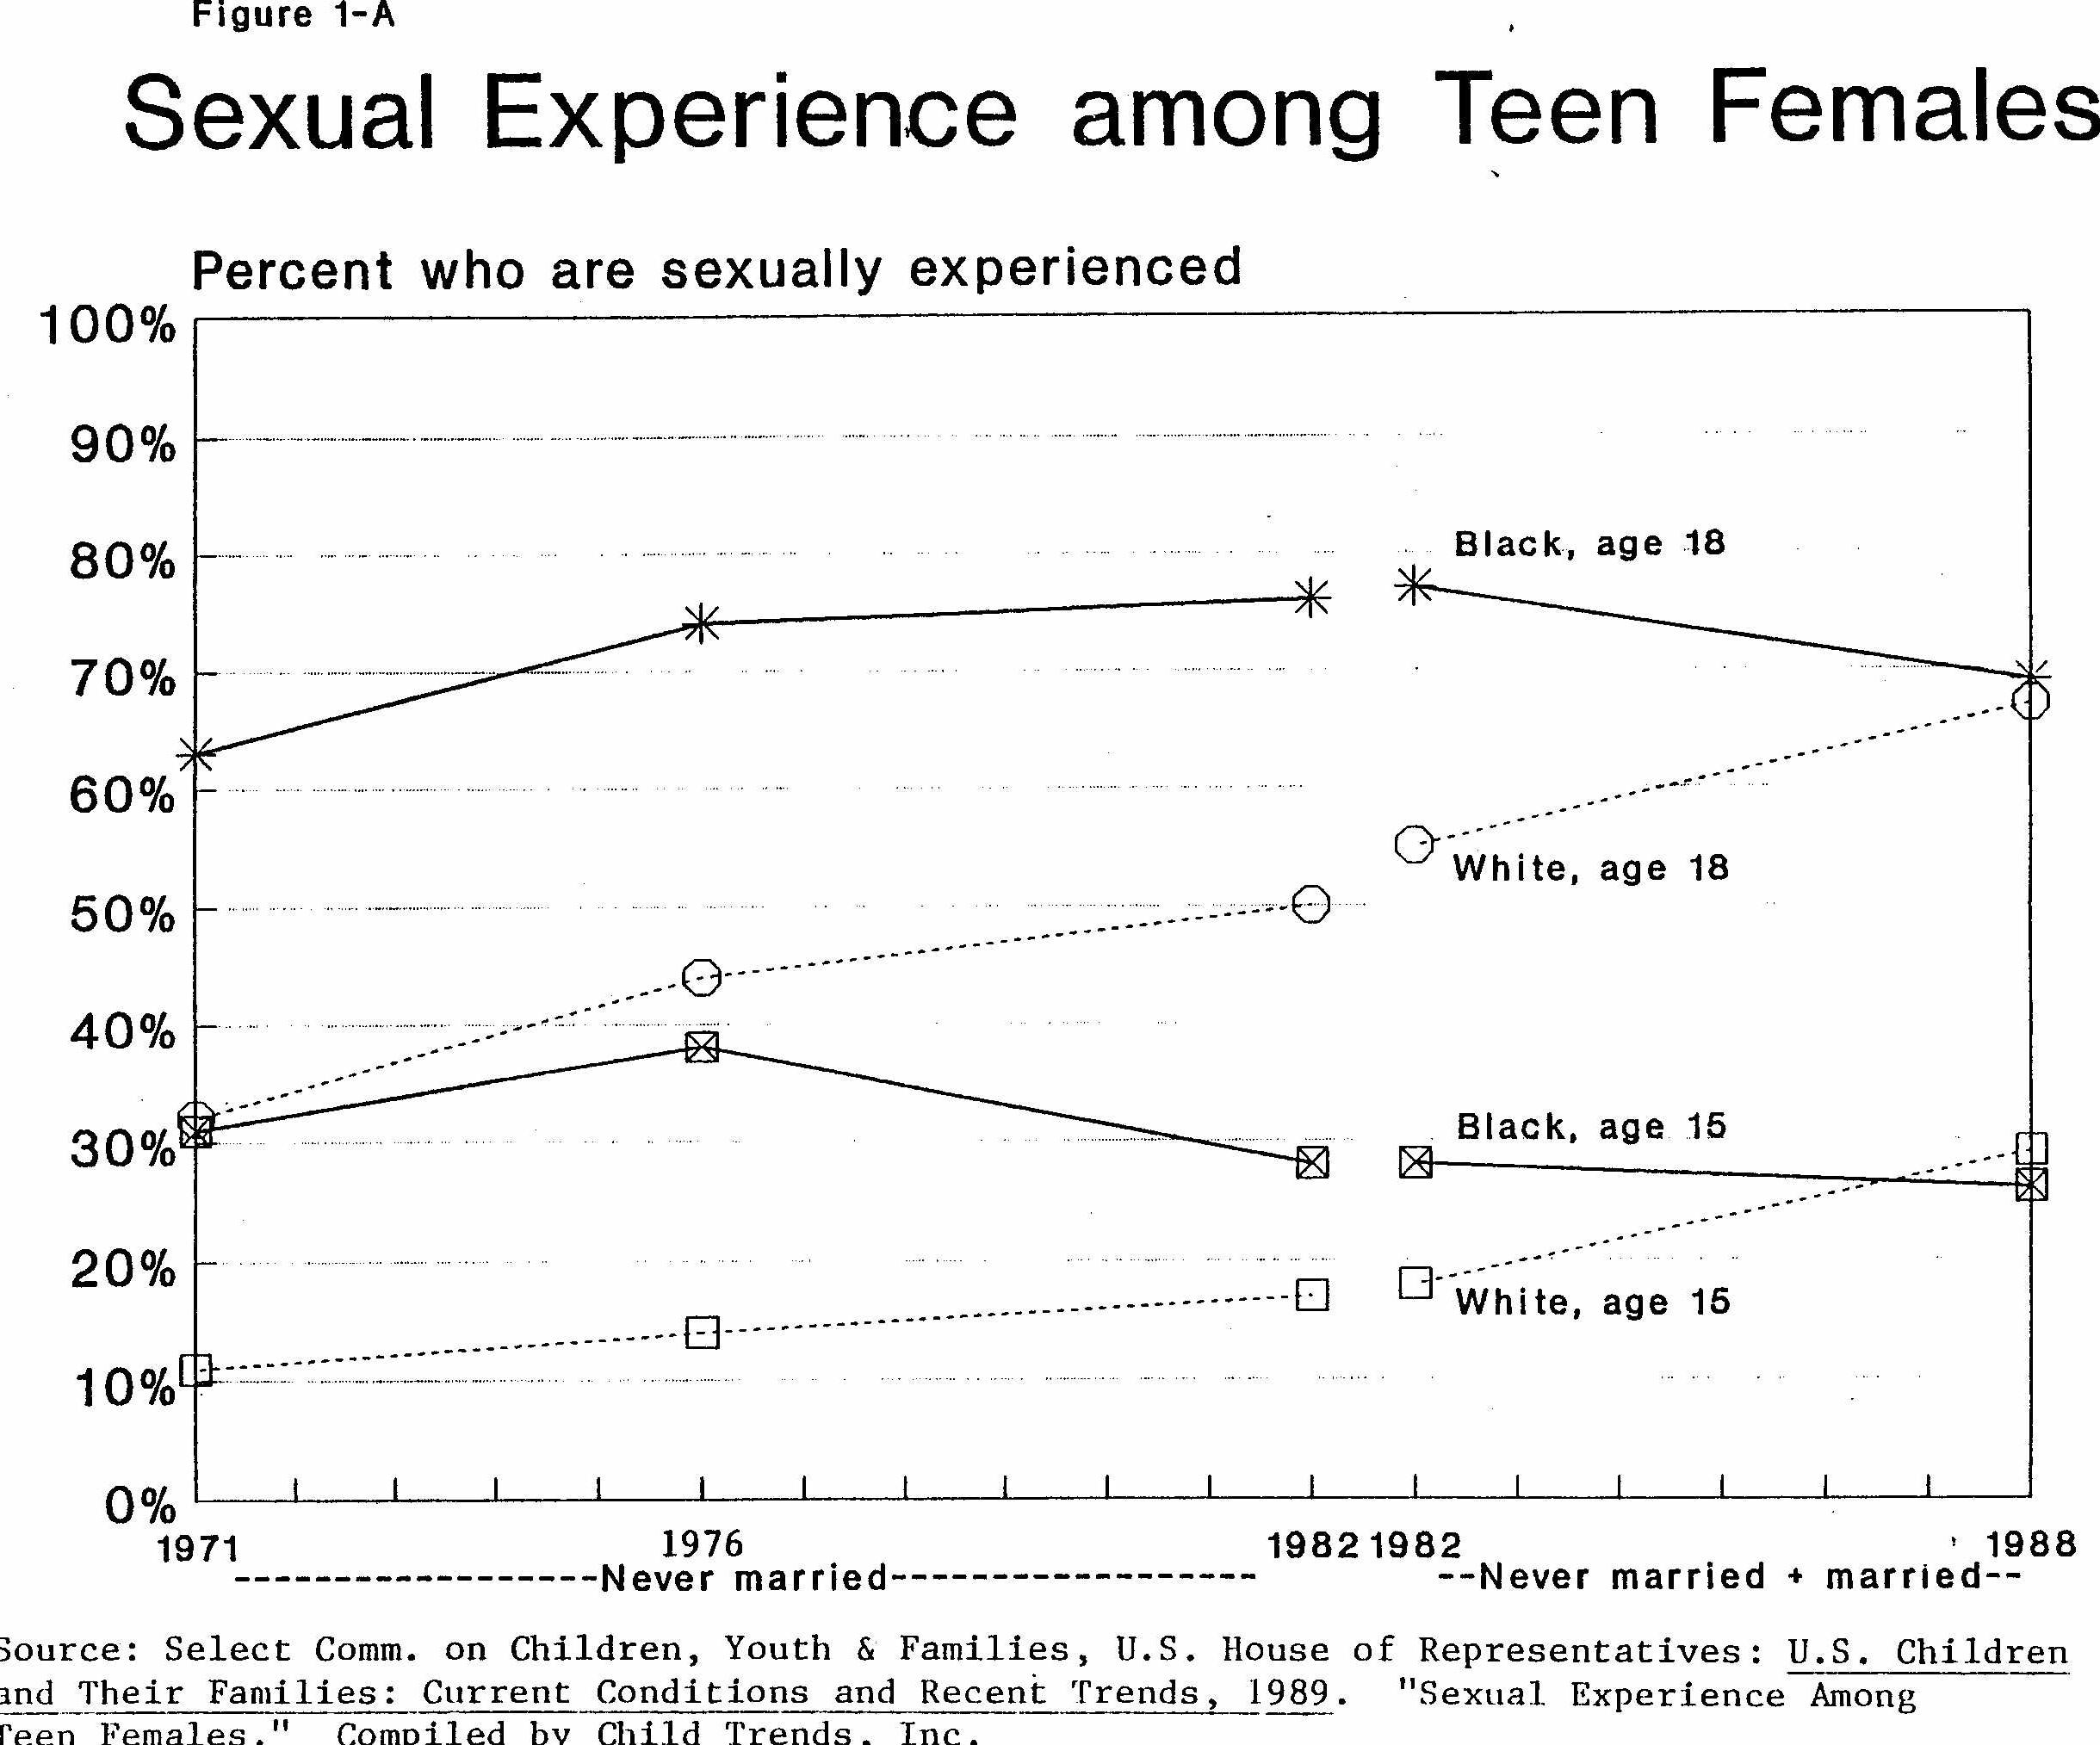
Figure 1-A depicts levels of sexual activity among female adolescents aged 15 and aged 18 between 1971 and 1988. Unfortunately, data are not yet available that can provide a clear time trend. Thus data for the time period 1971-1982 cover a different sample than the data for 1982 and 1988. Comparing the two 1982 estimates, however, shows that adding-in married teens elevates estimates of sexual activity only slightly.
A clear age trend is evident in the data. Older youth are two to three times as likely to be sexually experienced.
A secular increase in levels of sexual activity is also readily apparent for white females. However, after rising during the early seventies, the percentage has gone down slightly during the eighties for black females, especially for the younger group. From these data, it appears that sexual activity among black females is no longer increasing, though the proportion sexually experienced has plateaued at a high level, with a substantial majority initiating sex before the end of their high school years.
For white females, on the other hand, sexual activity was still on the increase through 1988; consequently, where young black women were once far more likely to have had intercourse than their white peers, the two groups are now about equal. In 1988, two out of three females age 18 were experienced, and one out of four of those age 15.
Among teen males, the story has been somewhat different. Figure 1-B depicts levels of sexual activity among male adolescents aged 17 and aged 19 between 1979 and 1988. By age 17, a majority of males are sexually experienced -- two in three non-blacks and nine in ten blacks. By age 19, 85% of non-blacks and nearly all blacks have had sex. These proportions represent substantial increases over the proportions recorded in 1979 for both race groups. While the percentage who are experienced has gone up for non-black youth, it has risen even more quickly for the black youth, to the point where slightly more black 17-year-olds have had intercourse than non-black 19-year-olds. ("Non-black" includes not only "whites" but also hispanics and other minorities.)
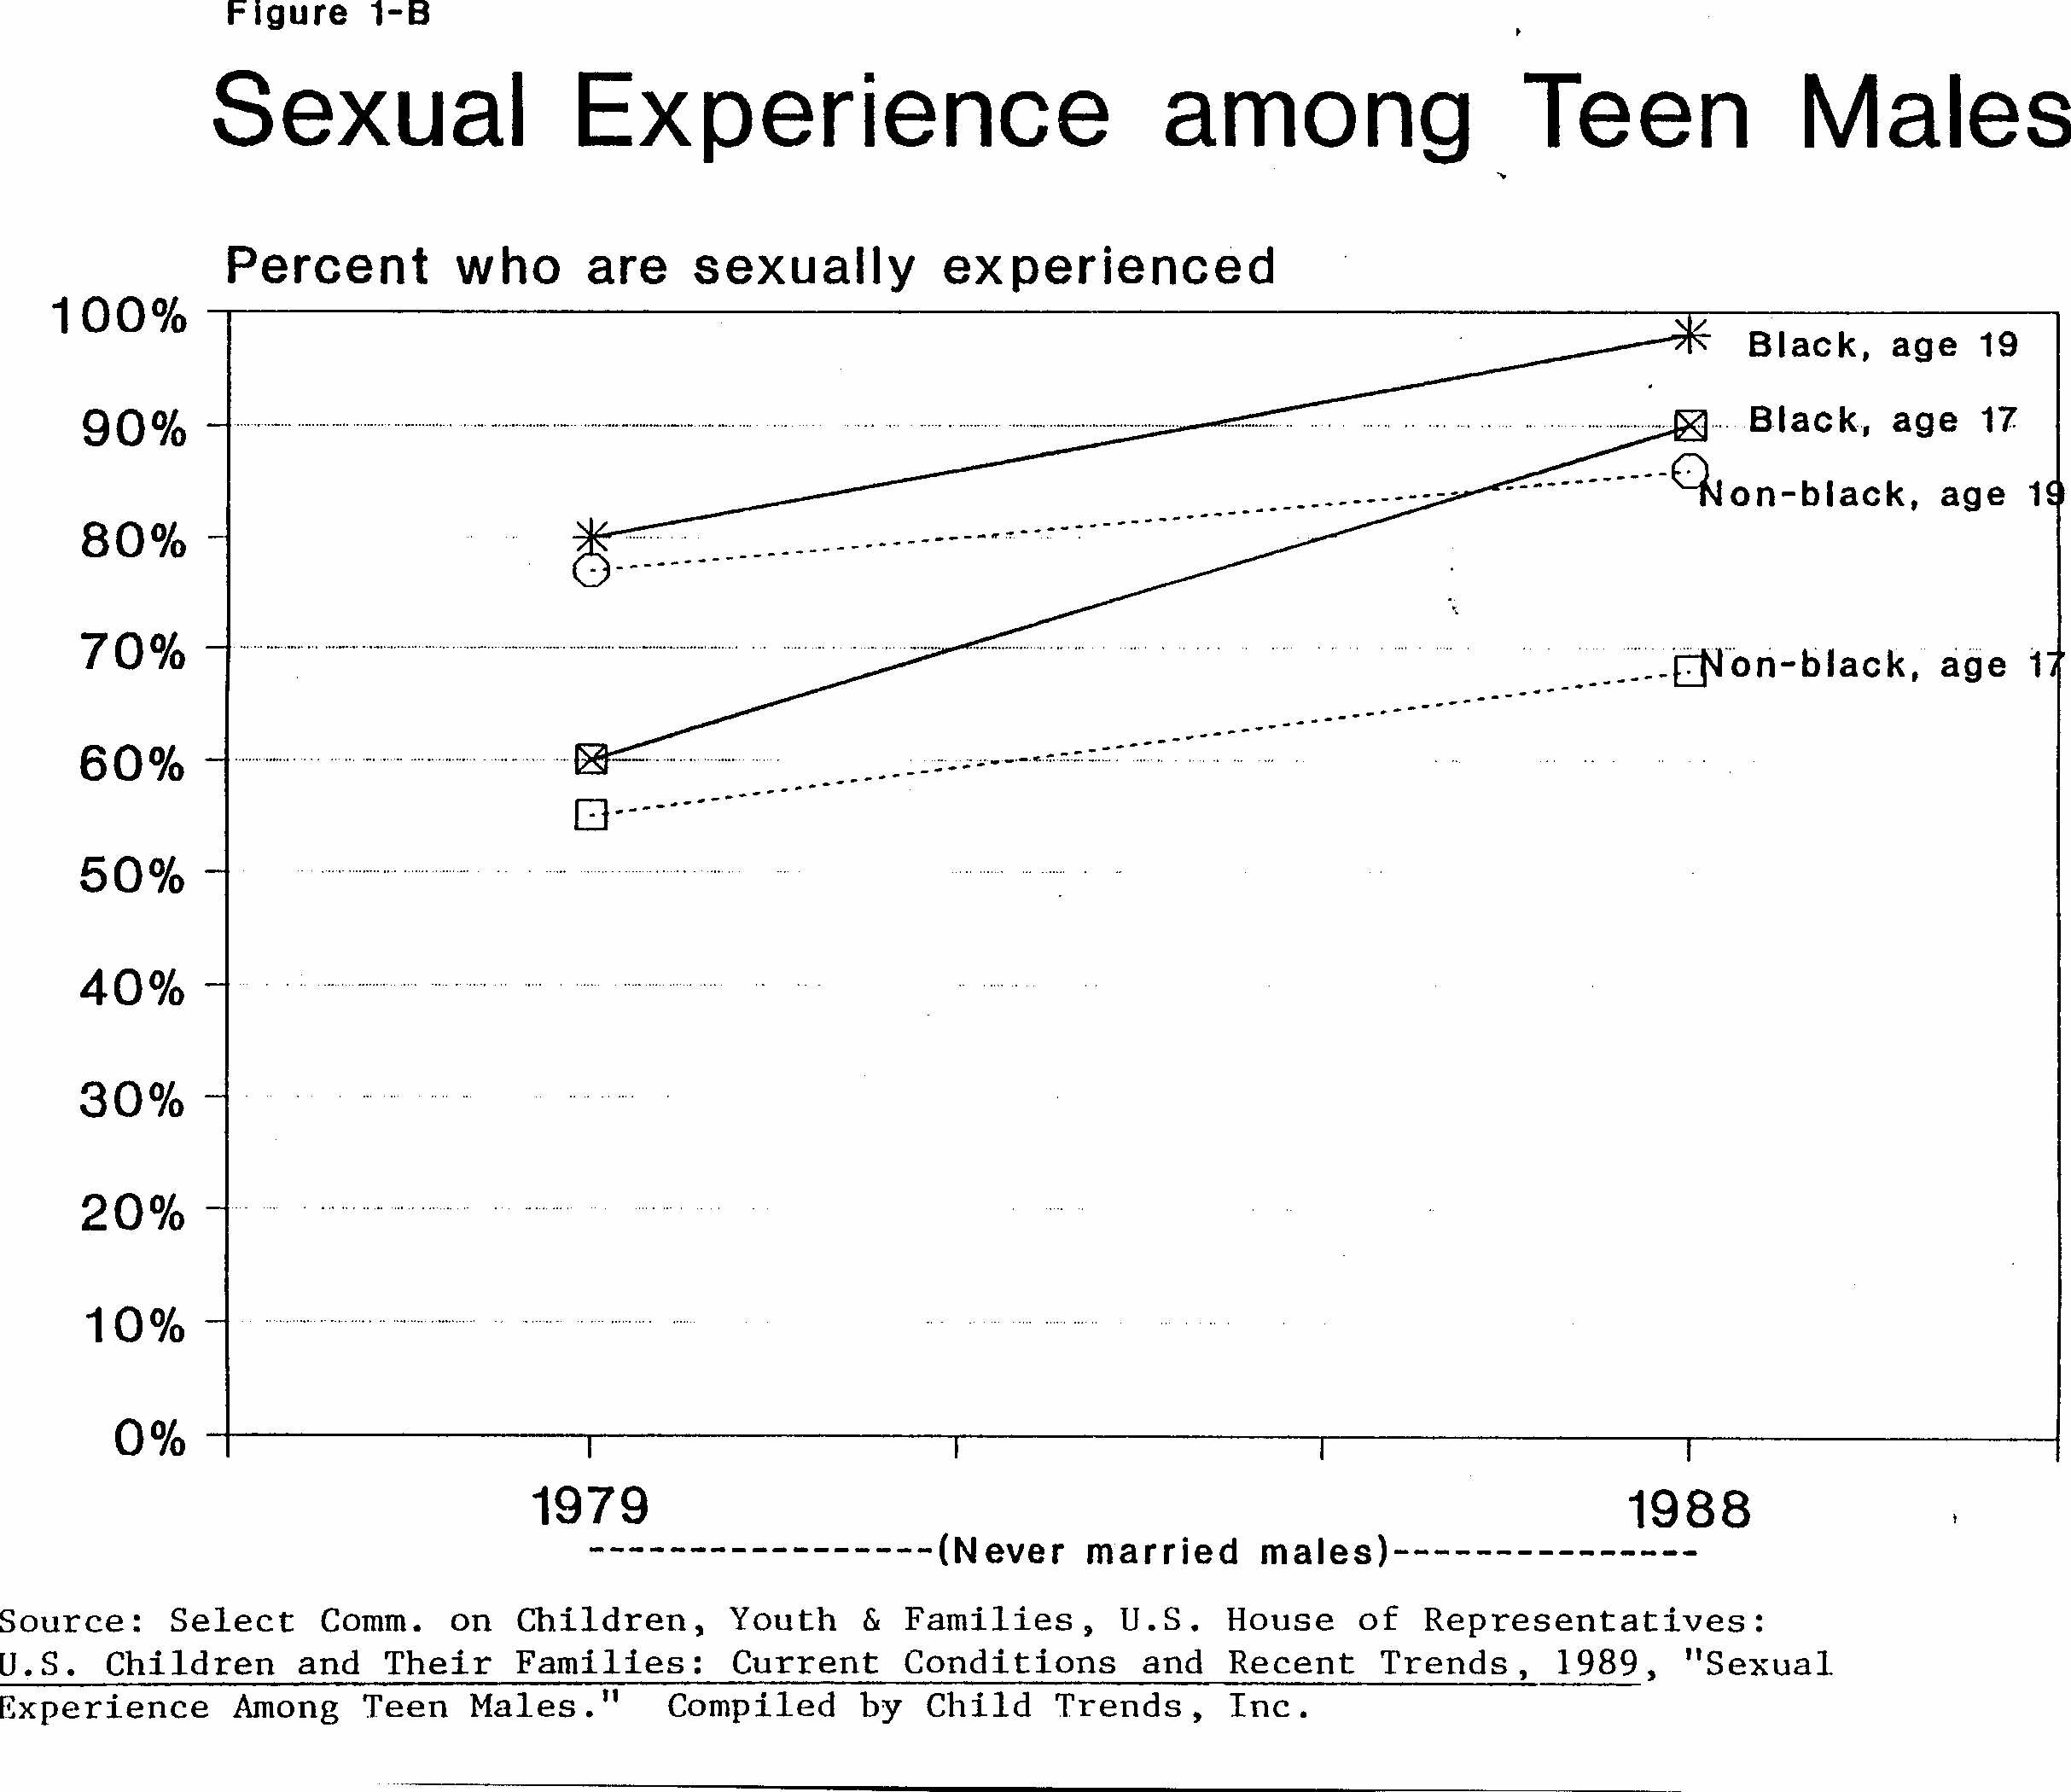
In summary, levels of sexual activity have increased substantially for males, both black and white, and for white females. A substantial majority of youth in all race and sex groups were sexually experienced by the end of their high school years.
Pregnancy, Abortion, and Childbearing Trends
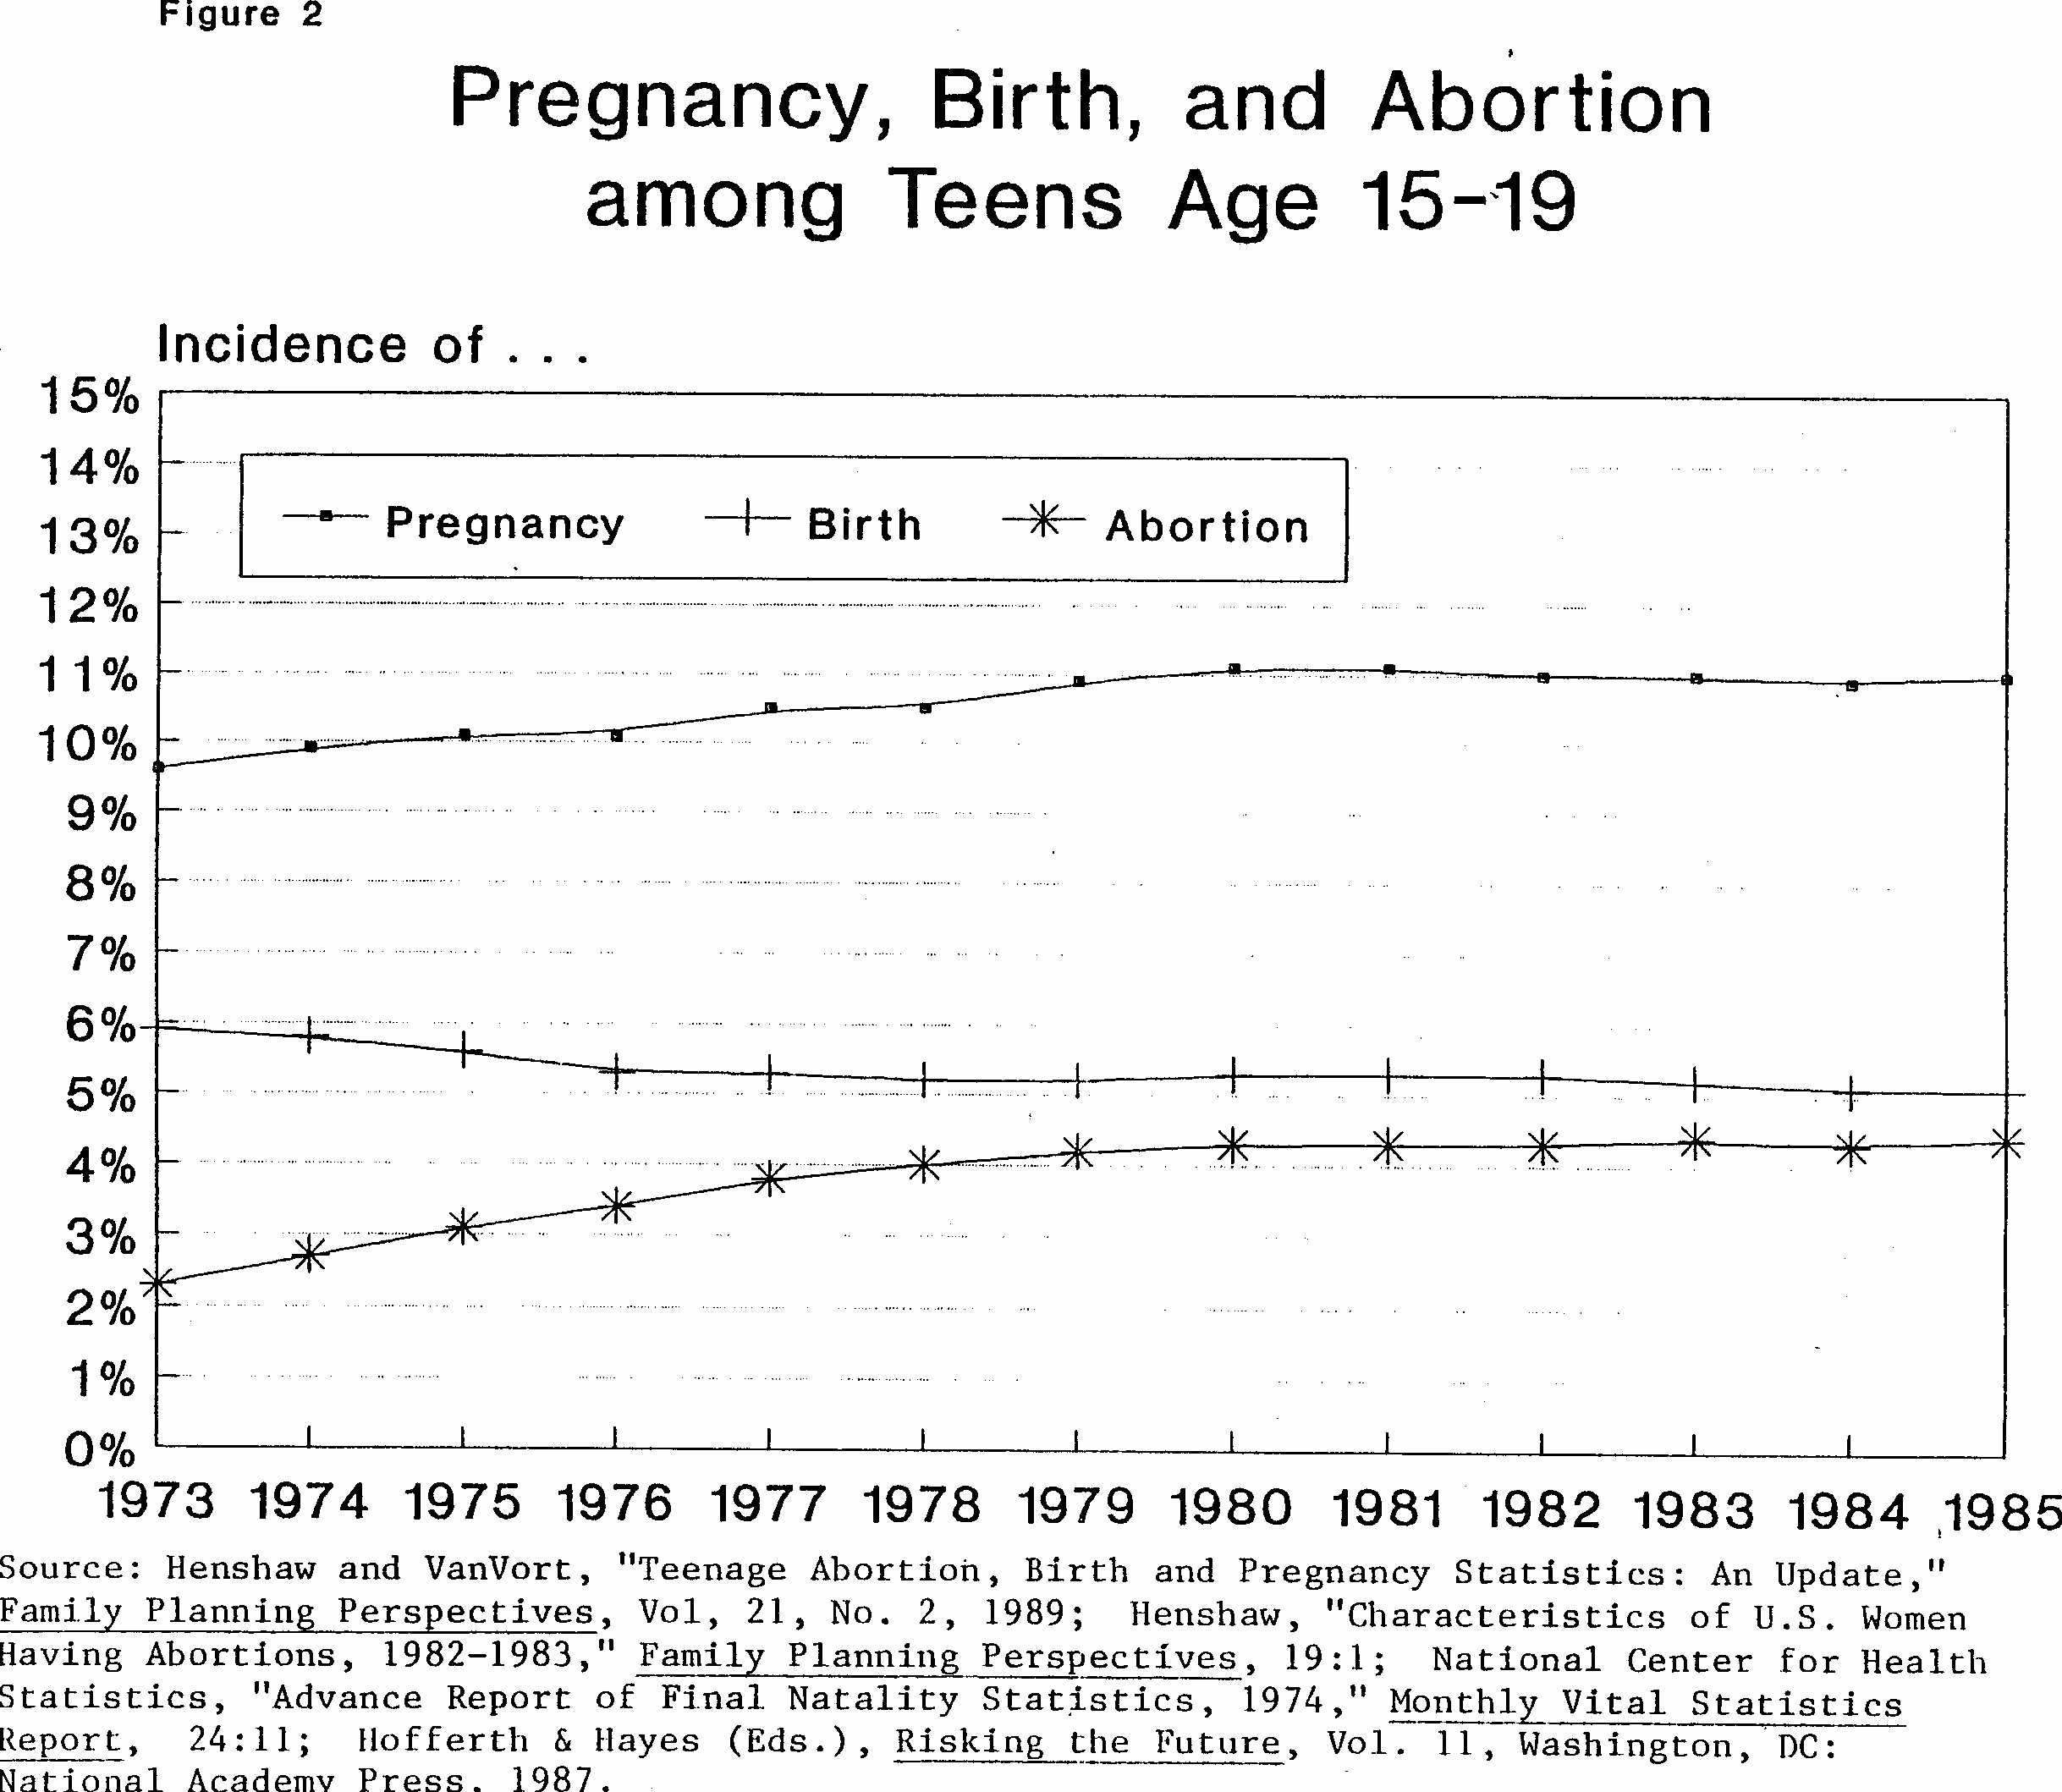
Figure 2 presents trend data on the incidence of pregnancy, childbearing, and abortion, among teens aged 15 to 19 during the years 1973 through 1985. (1985 is the most recent year for which abortion data are available. Since data on abortion are essential for the estimation of pregnancy, more recent trends cannot be estimated.)
During the seventies, the incidence of pregnancy rose moderately as the birth rate declined. This disparity is explained by the rising abortion rate at the time. From 1979 to 1985, the pregnancy, birth, and abortion rates held steady at around 11%, 5%, and 4%, respectively. In other words, more than one in ten females age 15-19 becomes pregnant annually; nearly half terminate their pregnancies in abortion; and no improvement has been charted in over a decade.
Non-Marital Childbearing Among Teens
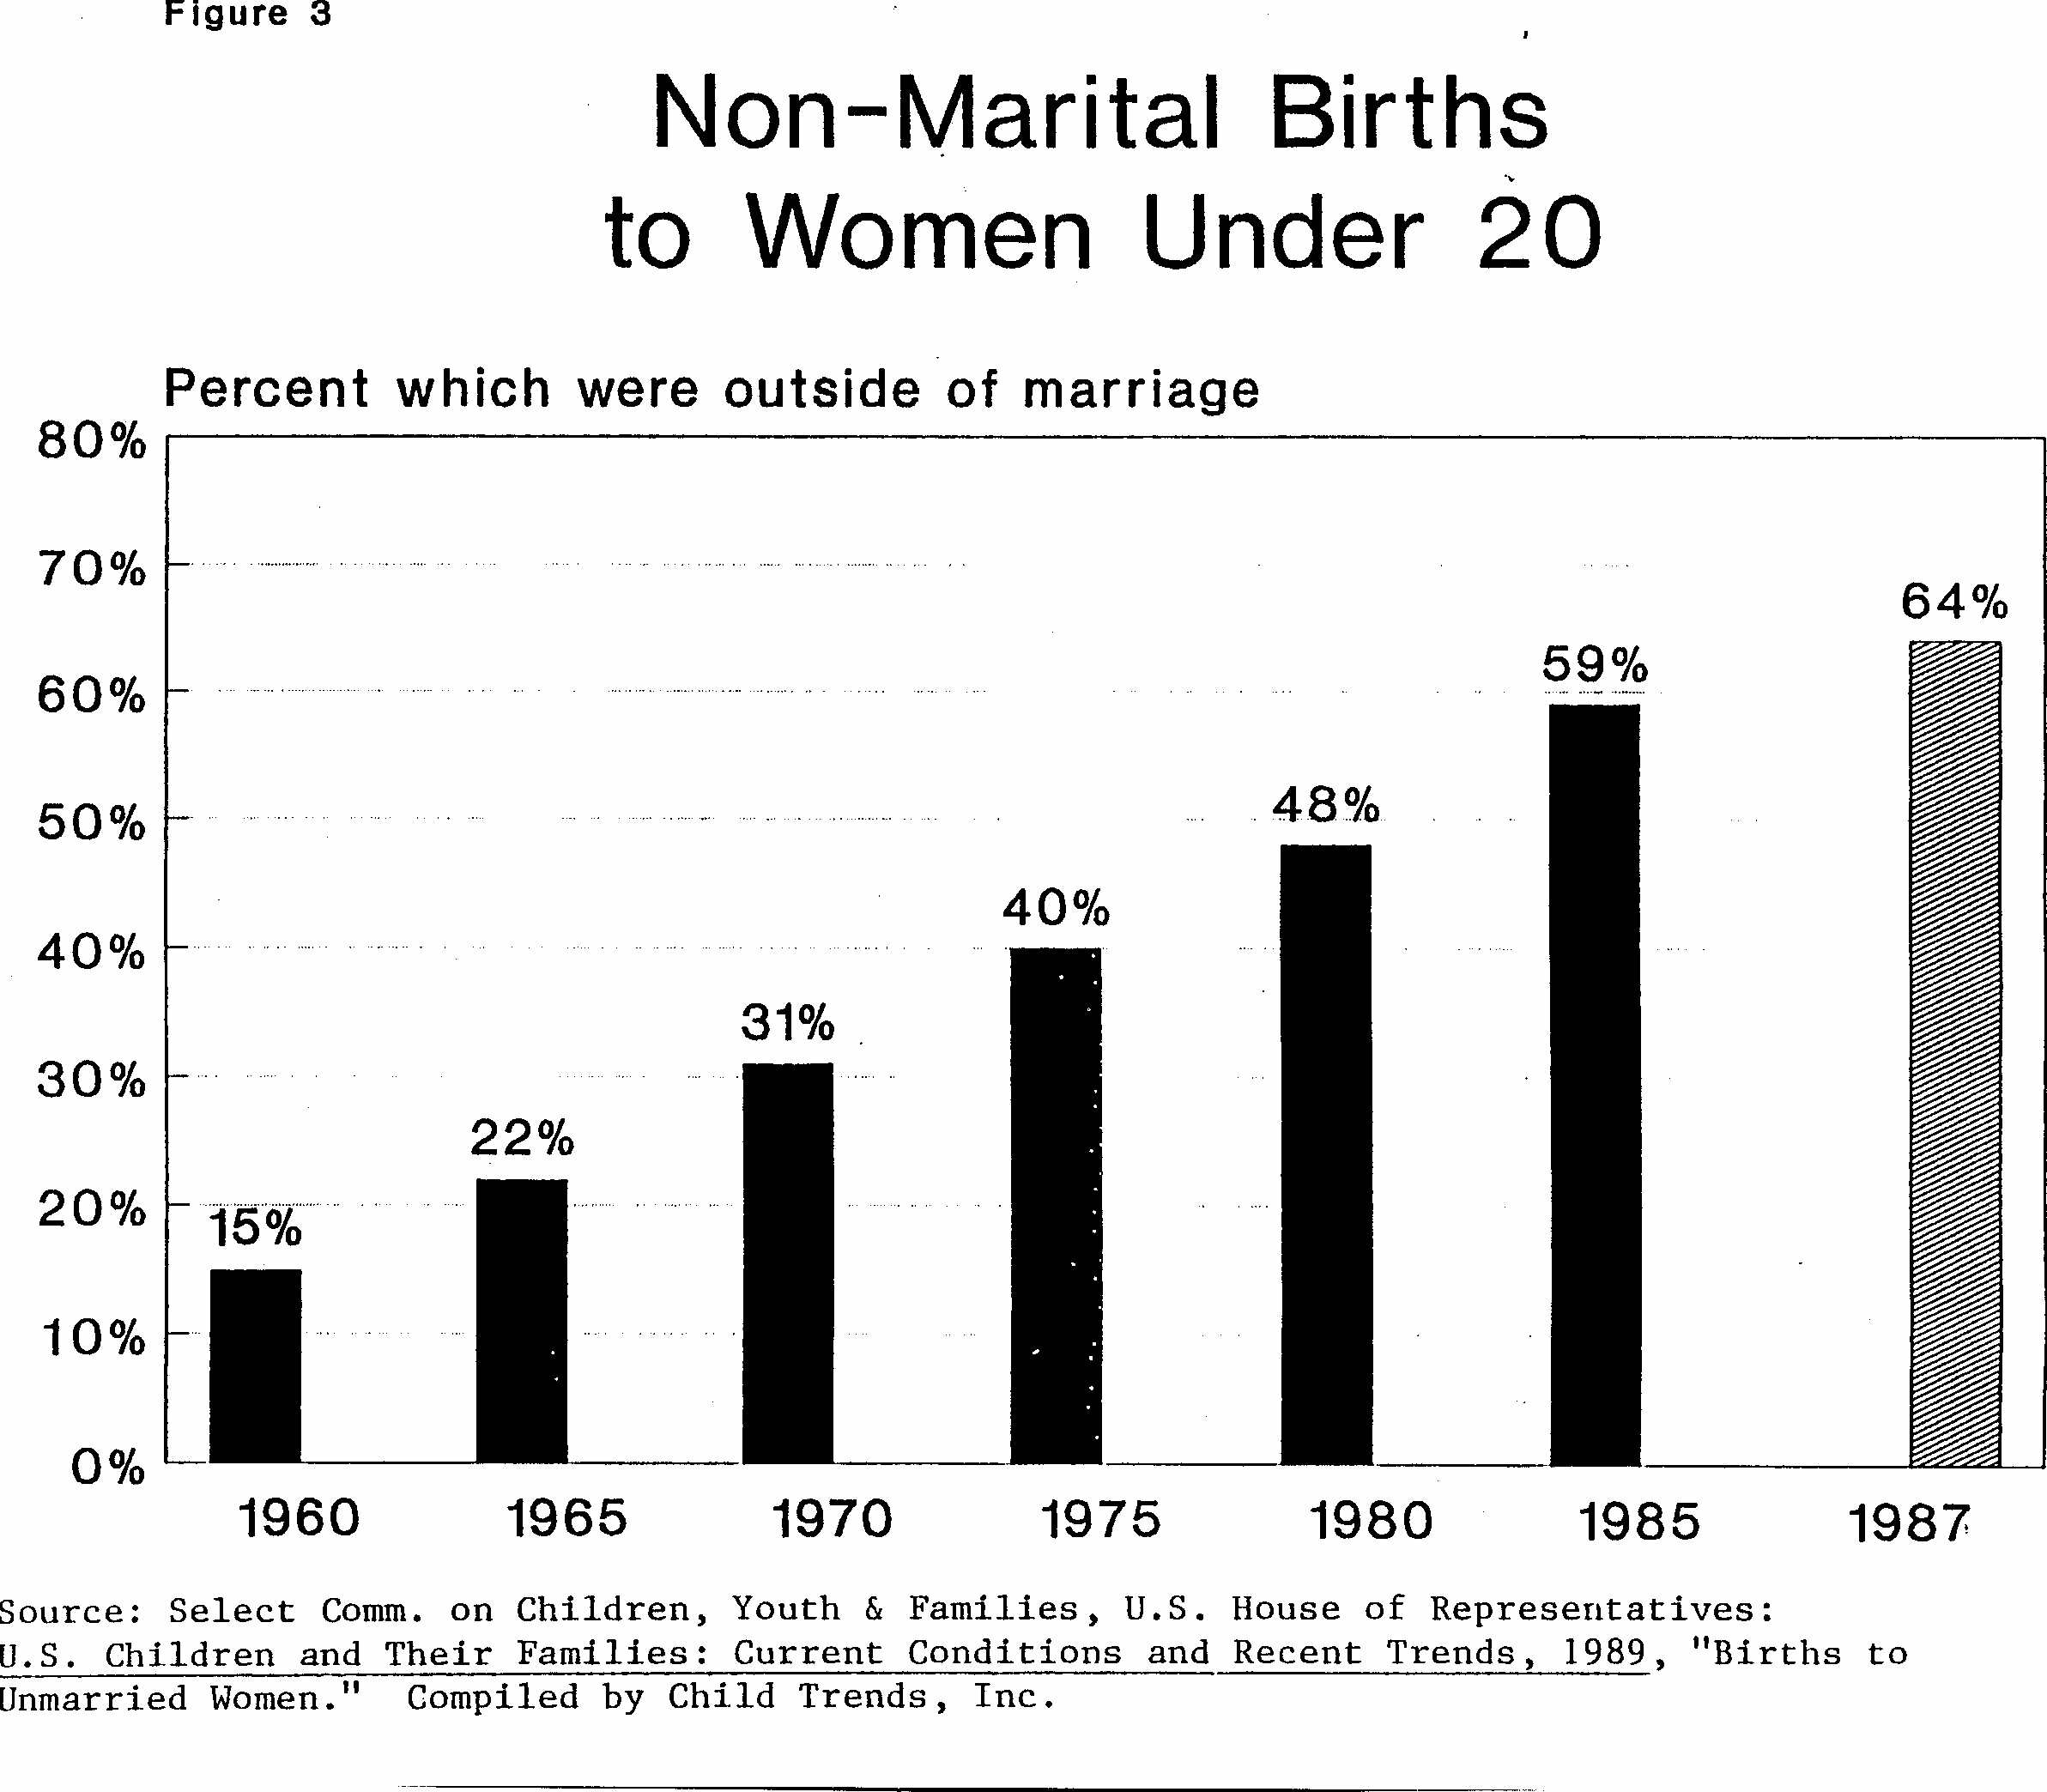
Figure 3 illustrates the increasing proportion of births to adolescents that have occurred outside of marriage. Despite the legalization of abortion, striking increases have occurred in the proportion of non-marital births that are carried to term outside of marriage.
Among mothers younger than age 20, the percentage of births that occurred outside marriage went up 7 to 11 points every five years from 1960 to 1985. As of 1987, nearly two-thirds of teen births were non-marital; moreover, the proportion has risen every single year since 1960. This dramatic increase should be taken not as an illustration of rising rates of teen pregnancy but, rather, as an indication of the shrinking proportion of teen mothers who are married when they give birth.
Striking changes have also occurred in the number of births occurring to teens within and outside of marriage. There has been a decline in the number of births to teens since 1970, reflecting primarily a decline in the number of teens, and, to a lesser extent, a decline in the teenage birth rate. Despite fewer births, the number of non-marital births to teens has risen, from 199,900 in 1970 to 302,541 in 1987. Correspondingly, the number of marital births to teens has declined from 456,560 in 1970 to 170,082 in 1987. Clearly, the propensity to marry has fallen precipitously among teens who are parents.
Marriage and Divorce
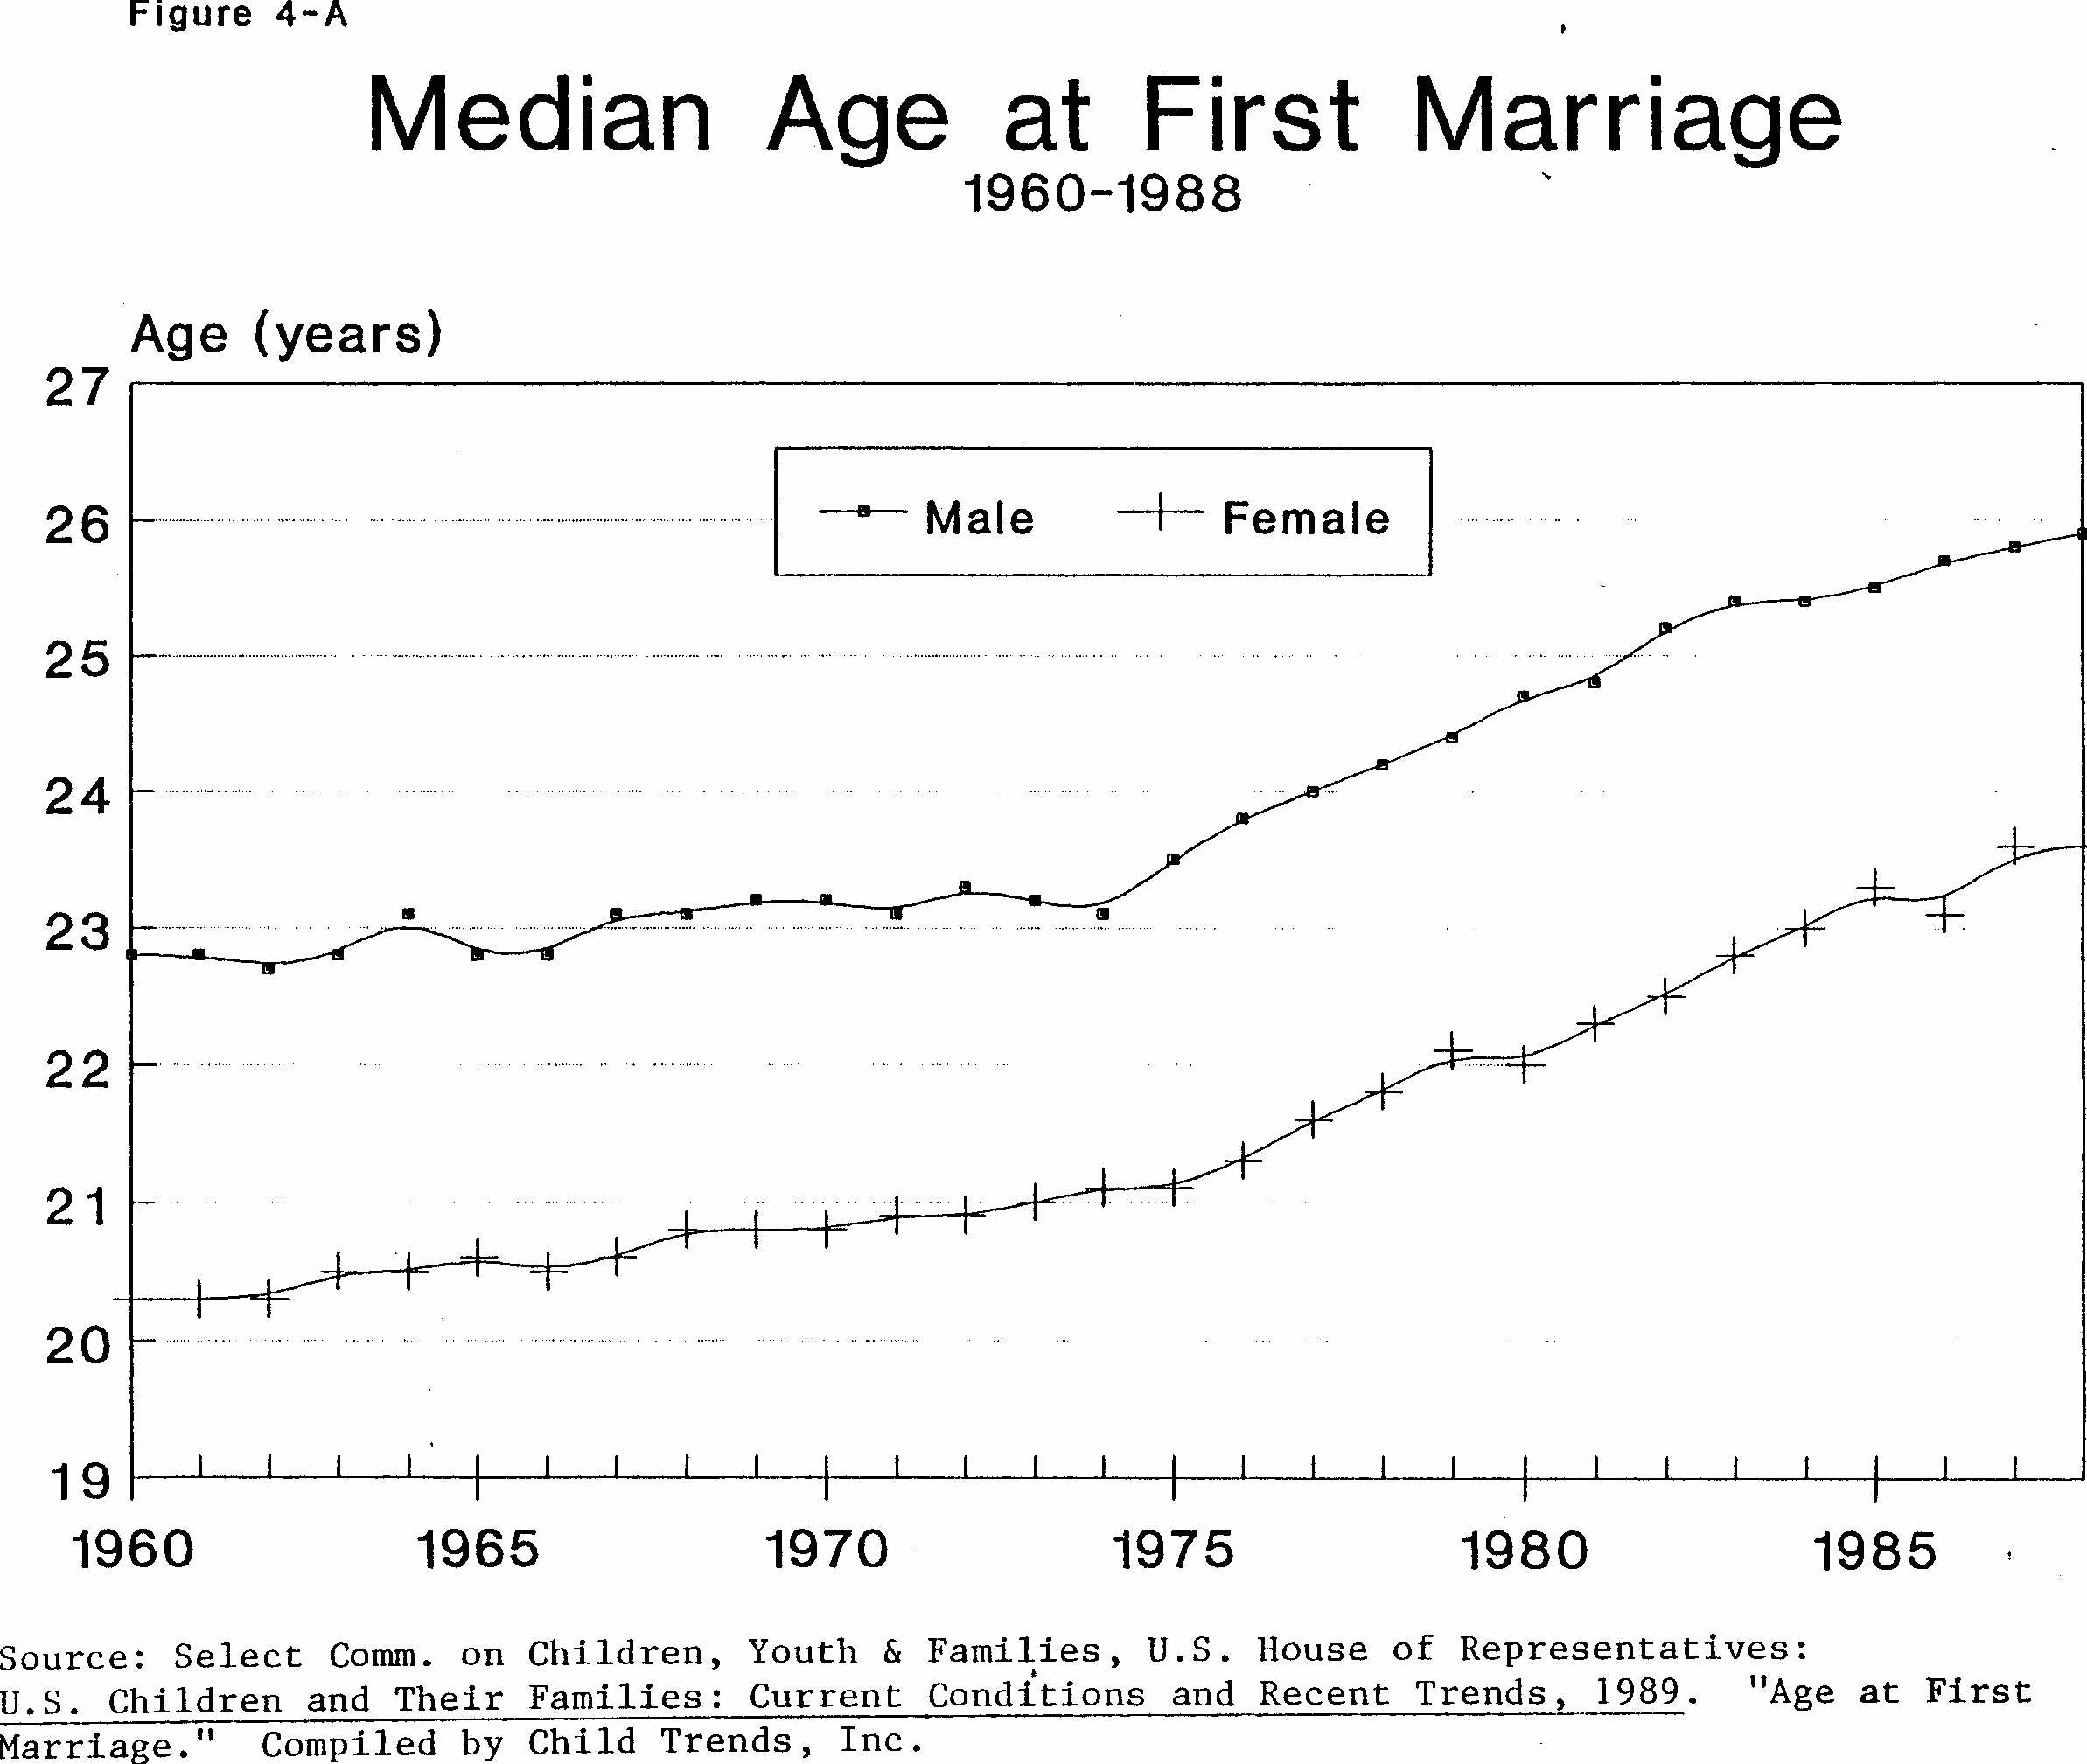
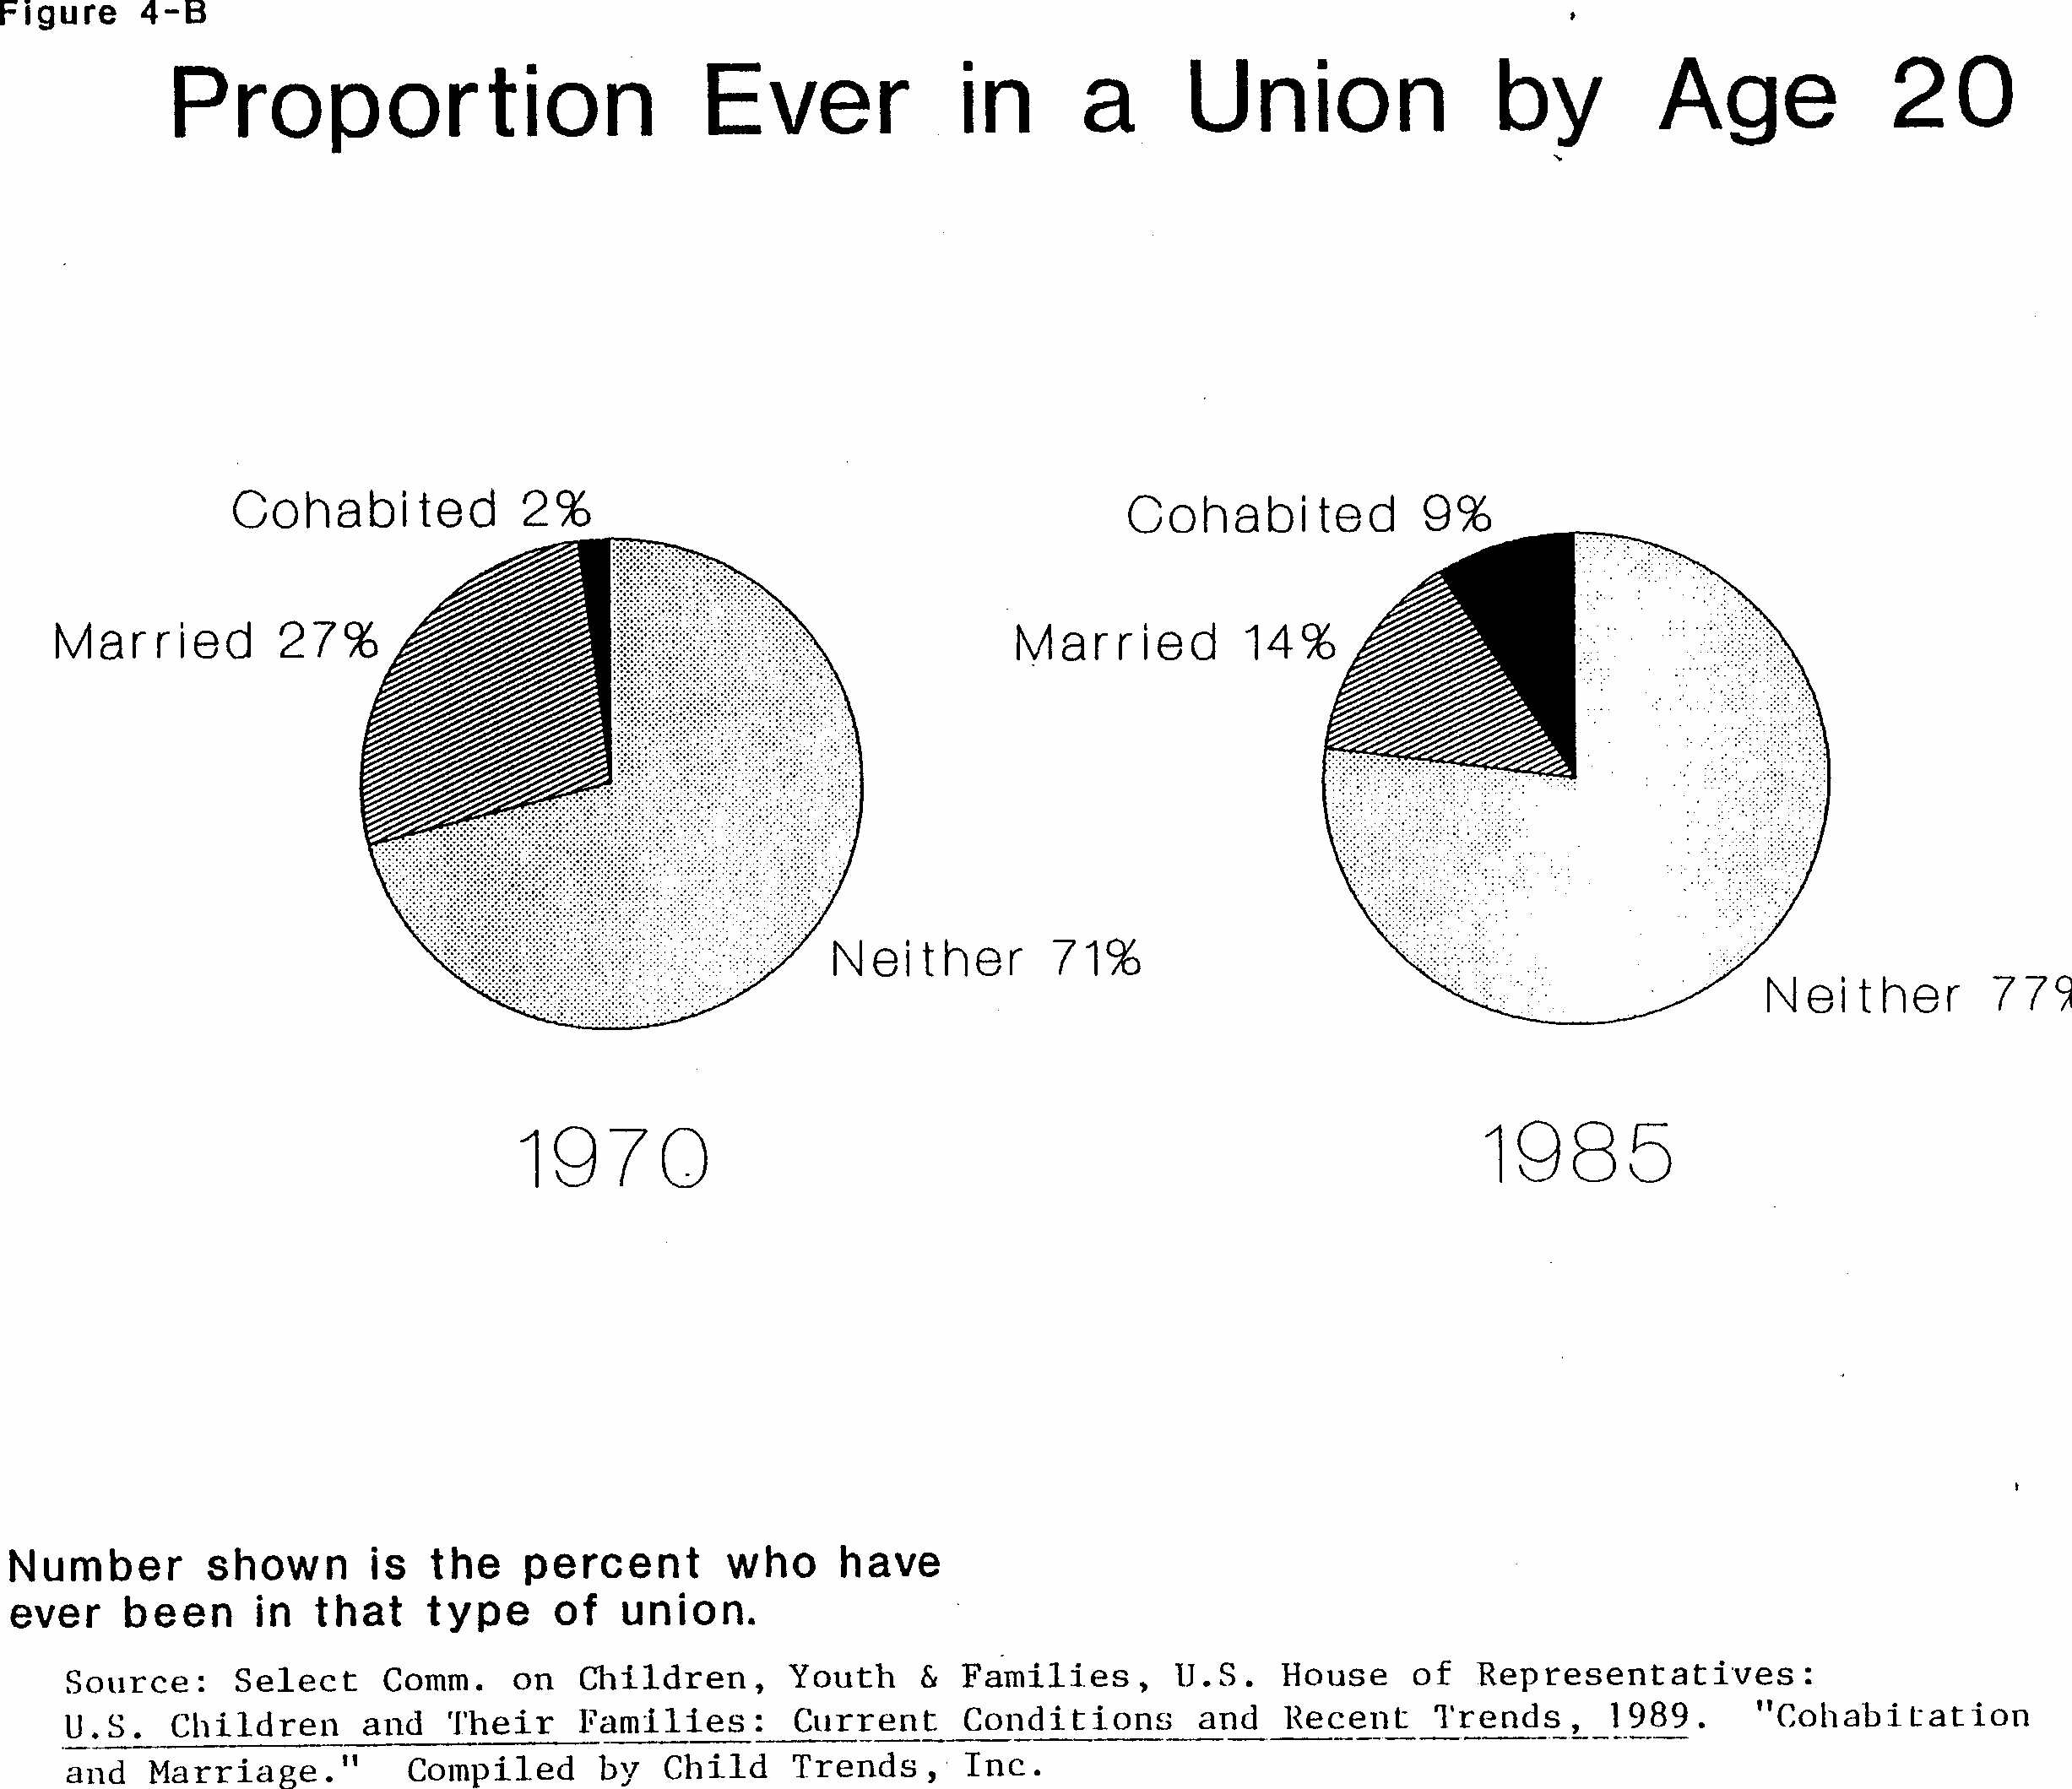
Figure 4-A and Figure 4-B illustrate several aspects of American's changing marriage-related choices. First, the increasing age at which half of all young people marry is shown separately for males and females. Second, the partial substitution of cohabitation for marriage is depicted.
Figure 4-A shows that after rising only minimally during the sixties and early seventies, the median age at first marriage rose by approximately two years of age for males and females alike between 1975 and 1985. As of 1988, this number was roughly 26 years of age for males and 24 for females. (The difference in age by gender has remained relatively constant.)
On the other hand, "never-married" does not necessarily mean "never lived in a union." As shown in Figure 4-B, in 1985, only 14 percent of youth had married by age 20, but an additional 9 percent had cohabited, resulting in 23 percent having been in a union before age 20. While the proportion of youth who have married by age 20 displayed more than a 50-percent decrease between 1970 and 1985 -- from 27 percent to 14 percent -- the proportion who have always lived a single lifestyle rose by less than 10 percent (see Figure 4-B.) This disparity is explained by the increase in cohabitation by age 20, which jumped from 2 percent in 1970 to 9 percent in 1985.
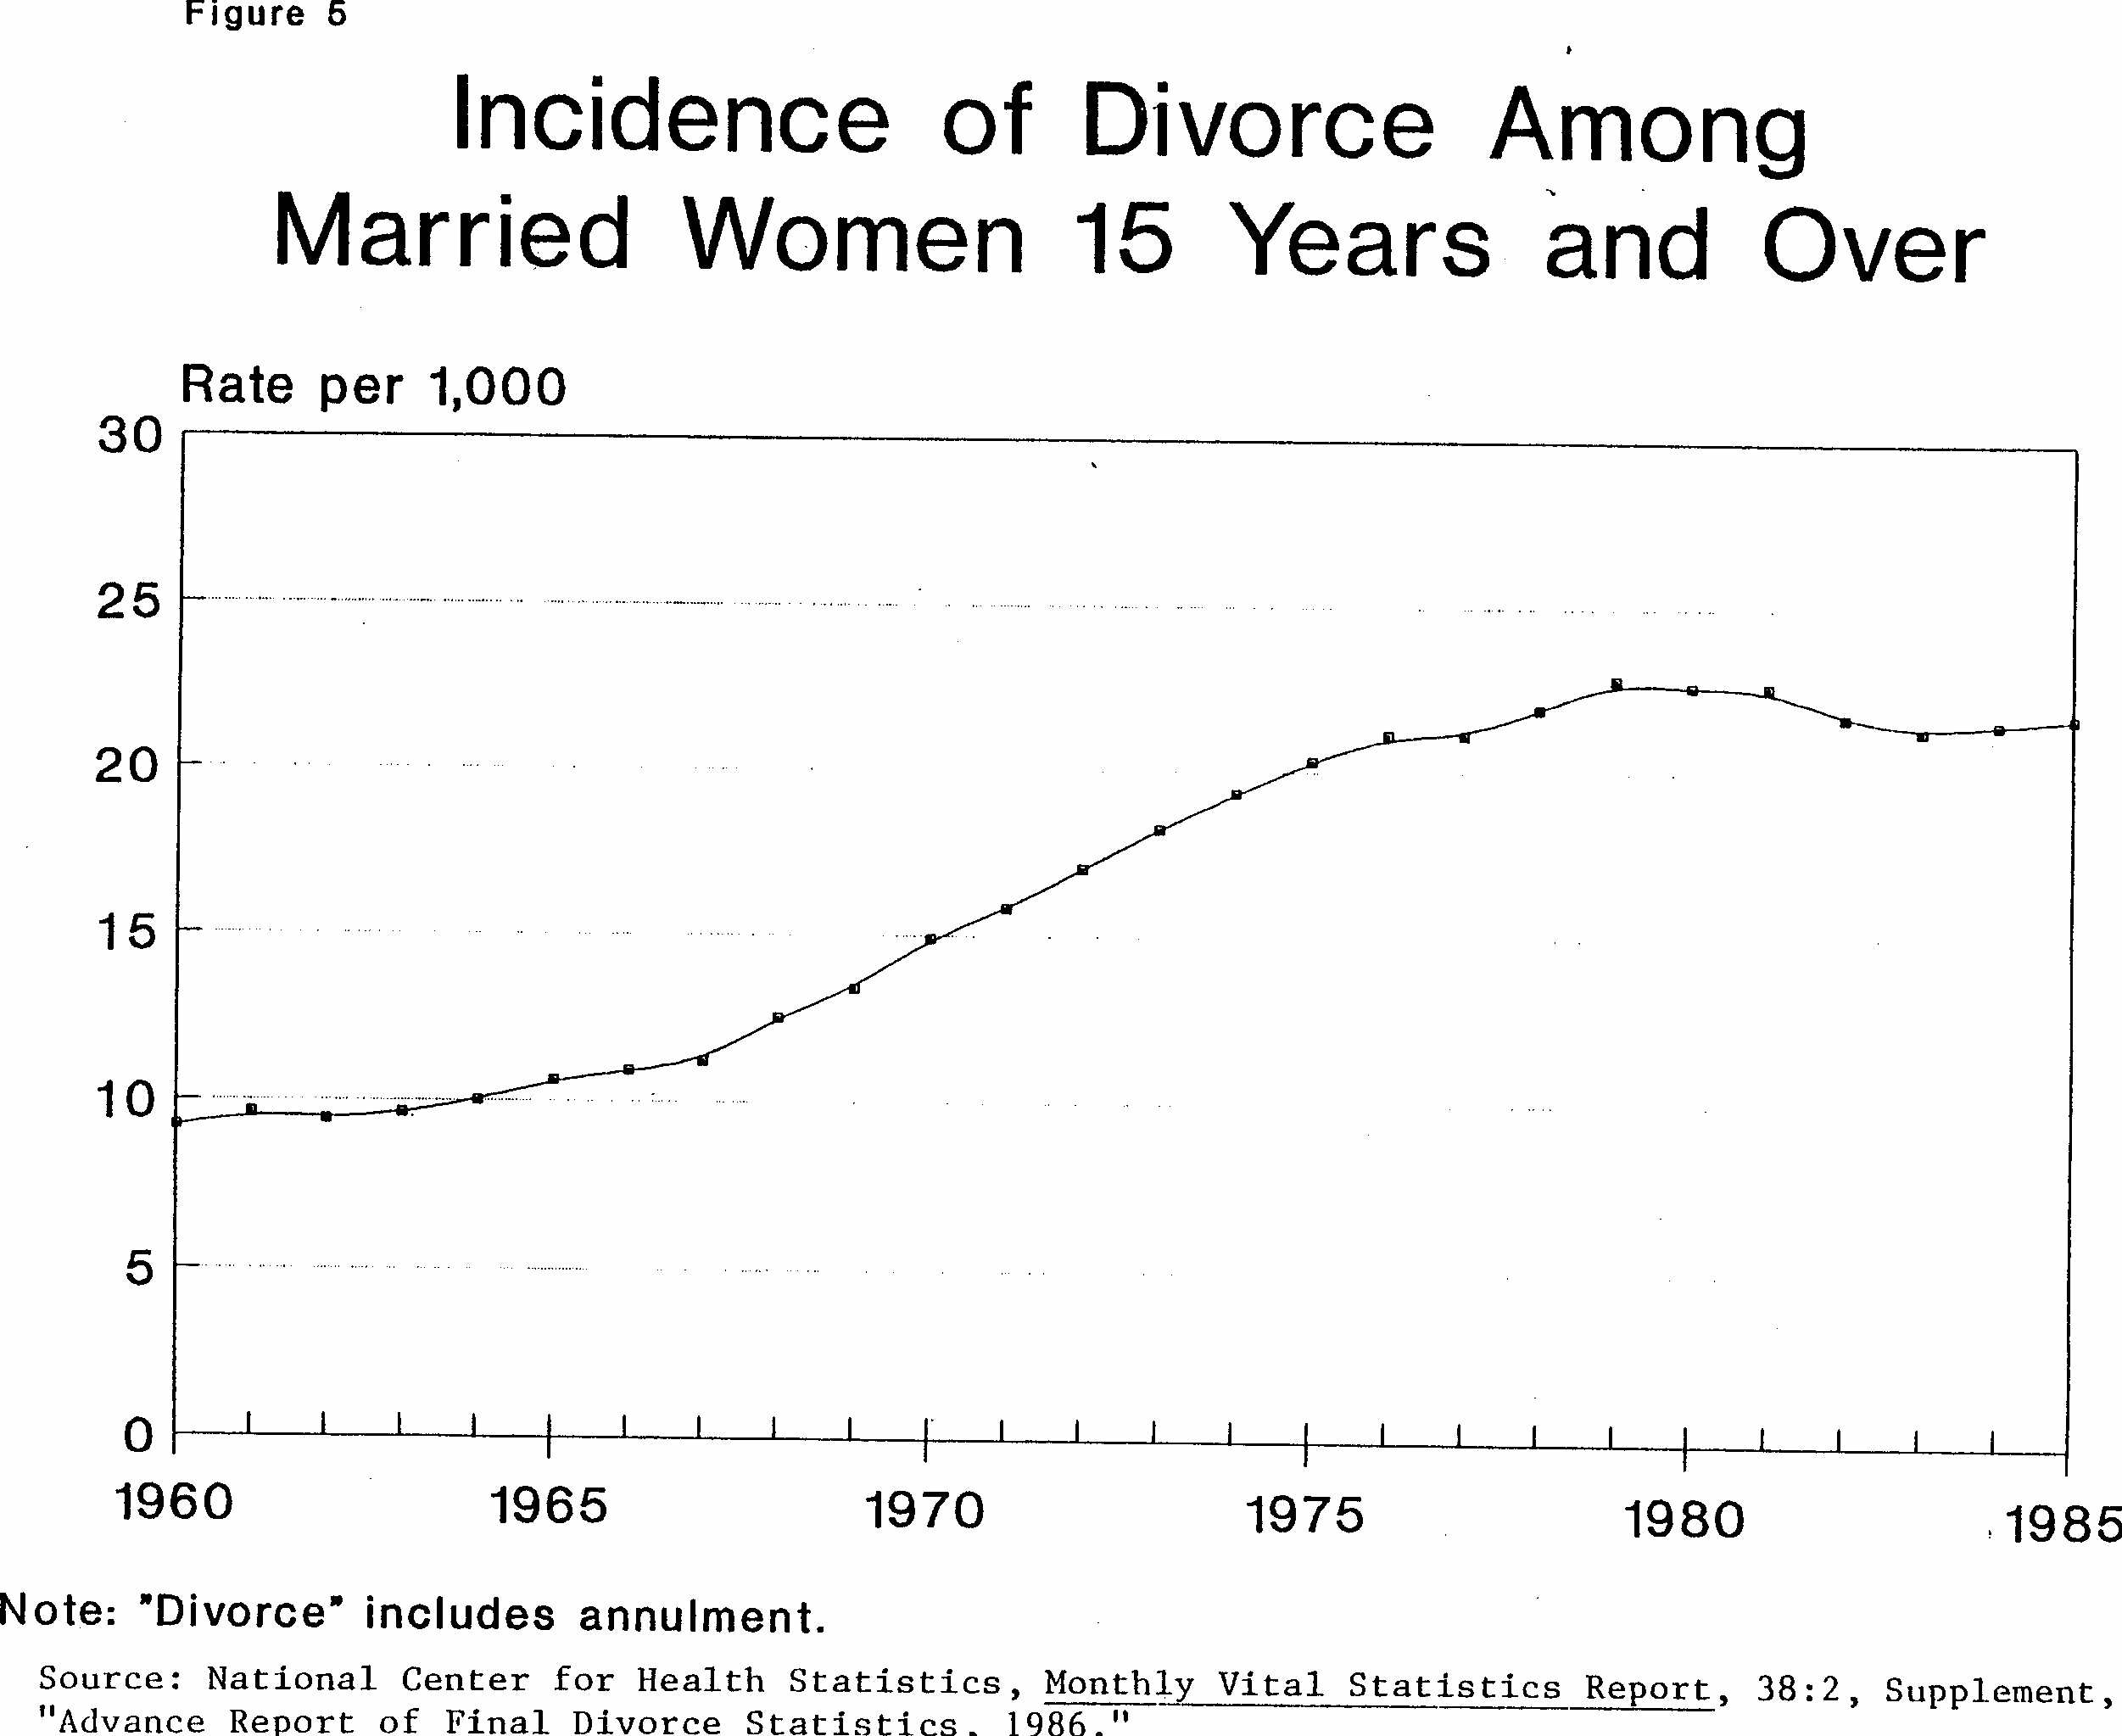
The remarkable rise in the incidence of divorce in the United States is summarized in Figure 5. The rate per 1,000 married women shot up from roughly 9 in 1960 to 23 in 1979. While the divorce rate has leveled off during the eighties, it has levelled off at a plateau twice as high as the divorce rate in the 1960s.
Clearly the changes in American family life have been substantial. Are they likely to be lasting?
In 1987, Wave 3 of the National Survey of Children was conducted. At the time of this third wave, youth in the survey were aged 18 to 22. In this survey, respondents were asked a number of attitudinal questions on topics ranging from welfare policy to housework. A variety of questions also dealt with the issues of early sexual activity, abortion, out-of-wedlock childbearing, marriage, and divorce. The answers given by youth to these questions are discussed in the next section as they pertain to each of the changing behaviors of youth just described.
ATTITUDES REGARDING SEXUAL ACTIVITY
Respondents were asked whether they felt "It is wrong for someone who is 16 to 17 years old to have sex before marriage" and whether "It is wrong for someone who is 14-15 years old to have sex before marriage." The question concerning adolescents aged 16-17 was asked first. The responses of the youth to these questions are presented in Table 1. Responses are presented separately by race and by gender, because behavior varies substantially across these sub-groups.
The young women and men aged 18 to 22 in the sample make a clear and strong distinction between what they feel is appropriate for adolescents aged 14 and 15 and those slightly older. Eighty to ninety percent of the youth feel that sex is wrong at the younger ages (87 percent of the total sample). on the other hand, between 43 and 63 percent feel that sex is wrong at ages 15 and 16 (52 percent of the total sample). In addition, between a quarter and a half of young adults don't just agree but strongly agree that sex is wrong for younger adolescents. At ages 16-17, however, only a minority of youth feel strongly that sex is wrong.
In each case, non-black females hold the most conservative attitudes about early--sexual activity. Black females are similar to black males in the proportion who accept early sex; but among those who disapprove, black females are considerably more likely to feel strongly that sex is wrong. Non-black males, most of whom are white, are the least likely to agree that early sex is wrong. Even among this sub-group, however, 84% feel that sex is wrong at ages 14-15 and nearly half feel sex is wrong at ages 16-17.
It would appear from these data that quite a substantial proportion of young adults oppose early entry into sexual activity. While one inevitably suspects that youth interviewed by adults may be providing somewhat more conservative attitudes than the attitudes they project in the locker room or at the shopping mall, the question to which they are responding is a strong one, requiring a moral judgment. Another question on whether early sex is risky, dumb, a mistake, etc., might be even more likely to elicit disapproving responses. On the other hand, peer pressure to engage in sex provides a "push" in the opposite direction.
According to data from the Gallup Study of American Youth, 1977-1988, a quarter of teens aged 13 to 17 interviewed by telephone in 1988 reported that they had experienced either a great deal or some pressure from their peers to have sexual relations.
| TABLE 1. Proportions Agreeing and Disagreeing That "It Is Wrong for Someone Who is 16 to 17 Years Olds to Have Sex Before Marriage," and that "It is Wrong For Someone Who Is 14 to 15 Years Old to Have Sex Before Marriage," by Race and Gender, Youth Aged 18-22 in 1987. | ||||
| Males | Females | |||
| Non-black | Black | Non-black | Black | |
| Percent Agreeing Sex is Wrong at Ages 16-17 | ||||
| Strongly Agree | 6.5 | 6.6 | 16.3 | 12.7 |
| Agree | 36.7 | 46.5 | 46.4 | 41.9 |
| Depends/Don't Know/Disagree | 56.8 | 46.9 | 37.3 | 45.7 |
| p = .053 | p = .062 | |||
| Percent Agreeing Sex is Wrong at Ages 14-15 | ||||
| Strongly Agree | 33.9 | 23.0 | 51.7 | 40.7 |
| Agree | 50.3 | 64.9 | 40.7 | 48.7 |
| Depends/Don't Know/Disagree | 15.8 | 12.1 | 7.6 | 10.6 |
| ns | p = .015 | |||
| n | 447 | 117 | 458 | 124 |
Table 2 presents responses to a similar question in the 1987 wave of the National Survey of Children from respondents aged 18 to 22, separately by race and sex. Respondents were asked to "think about your teen years" and were asked a series of questions about that time, including whether, "My friends encouraged me to have sex." Only about one in ten non-black females agreed, but one in four black females felt their friends encouraged sex, as did one in three white males and one in two black males. Although the proportion of females who felt such pressure is fairly small, more substantial proportions of males felt pressured by their friends. Given the sensitivity of teenagers to the opinions of their peers (Anderson, 1989), one can imagine that such encouragement is felt keenly.
We also explored the other side of the coin -- whether pressure to postpone sex was experienced. When asked whether, "My mother discouraged me from having sex," strong sex differences emerged, but minimal race differences are evident (see Table 3). Approximately six in ten females feel they received discouragement from their mothers about sex. A little more than a third of males received such discouragement. Thus, females are the recipients of less pressure to have sex and more pressure to avoid sex than are males.
When the reasons of virgins for remaining virgin are explored (see Table 4), it is clear that values are important to those youth who have postponed sex to their late teens and early twenties. The relevant values are those of the youth, of family members, and religious values. It is the case, though, that early sex is avoided for reasons of values primarily by white youth. Relatively few black males or females give such a reason for remaining a virgin. For example, 85% of non-black females but only 30% of black females state that "I want to wait until I'm married." Similarly, 53% of male non-black virgins prefer to wait until marriage, compared with 26% of comparable blacks. Also, white virgins are significantly more likely to feel that premarital sex is "against my religion." Fear of their family finding out is not a major concern of youth aged 18-22, except for non-black females, among whom 29% cite this factor as a reason for postponing sexual activity. It should be noted, though, that practical, non-moral reasons also motivate youth to postpone sex. Concern about pregnancy and catching a disease are important reasons for avoiding sex, as are more opportunistic factors, such as not having found the right person or not having found an opportunity. Hence, while one can cite strong evidence of disapproval with regard to early, premarital sex, by the late teens and early twenties, even among youth remaining virgin practical and opportunistic factors are as important as moral reasons for delaying sexual activity. Non-black female virgins share a near consensus on the importance of waiting for marriage; while personal and family values seem to be considerably less important reasons for postponing sex among black youth.
| TABLE 2. Proportions Agreeing and Disagreeing with the Statement, "My Friends Encouraged Me to Have Sex" When I Was a Teenage, by Race and Gender, Youth Aged 18-22 in 1987. | ||||
| Males | Females | |||
| Non-black | Black | Non-black | Black | |
| True | 32.9 | 49.3 | 11.6 | 23.9 |
| False | 67.1 | 50.7 | 88.4 | 76.1 |
| n | 447 | 117 | 457 | 124 |
| p = .0006 | p = .0004 | |||
| TABLE 3. Proportions Agreeing and Disagreeing with the Statement, "My Mother Discouraged Me From Having Sex," by Race and Gender, Youth Aged 18-22 in 1987. | ||||
| Males | Females | |||
| Non-black | Black | Non-black | Black | |
| True | 38.7 | 34.4 | 60.5 | 56.0 |
| False | 61.2 | 65.6 | 39.5 | 44.0 |
| n | 447 | 117 | 456 | 124 |
| ns | ns | |||
| TABLE 4. Among Youth Reporting He/She Has Not Had Sexual Intercourse, Percent Agreeing that Each Reason is a Personal Reason that Applies to Him/Her, by Race and Sex, Youth Aged 18-22 in 1987 (Respondents Allowed Multiple Reasons). | ||||||
| Males | Females | |||||
| Non-black | Black | Total | Non-black | Black | Total | |
| I want to wait until I'm married | 53% | 26% | 49%* | 85% | 30% | 75%*** |
| It's against my religion | 22% | 0% | 18%* | 40% | 4% | 34%** |
| My family might find out | 12% | 11% | 12% | 29% | 0% | 24%** |
| I haven't found the right person | 48% | 9% | 41%** | 48% | 57% | 50% |
| I found the right person, but we aren't ready | 14% | 22% | 15% | 34% | 29% | 34% |
| I don't want to have to get and use birth control | 12% | 0% | 10%+ | 28% | 3% | 23%* |
| I wouldn't enjoy it | 4% | 0% | 3% | 6% | 3% | 6% |
| I'm concerned about pregnancy | 43% | 21% | 38%+ | 61% | 27% | 55%** |
| I don't want to catch a disease | 44% | 37% | 42% | 52% | 19% | 47%** |
| An opportunity hasn't occurred yet | 20% | 4% | 17%+ | 10% | 27% | 13%* |
| n | 78 | 16 | 94 | 85 | 18 | 103 |
| + p .10; * p .05; ** p .01; *** p .001 | ||||||
Given the strong and very general disapproval of youth aged 18-22 for sexual activity at ages 14-15, the incidence of sexual activity at these ages is surprisingly high. For example, 92% of white females disapprove of sex among 14-15 year-olds, yet preliminary data from the National Survey of Family Growth (London, 1989) indicate that 18% of 15-year-olds had had sex in 1982 and 29% had had sex in 1988.
Other analyses of the NSC (Moore, Nord and Peterson, 1989) indicate that a substantial proportion of early sexual activity is non-voluntary. This factor undoubtedly accounts for some of the discrepancy between personal attitudes and behavior. In addition, it may be that teens aged 14-15 are less disapproving and that it is only with the wisdom of "age" that young adults come to feel sex is wrong during the early teen years. On the other hand, it seems likely that there is considerable cultural support for delaying sexual activity into the middle and later teen years. The sanctioned delay is rather brief, however. With nearly half the sample of youth accepting of sexual activity at ages 16-17, it is clear that social support for chastity wanes rather rapidly during the teen years.
ATTITUDES CONCERNING PREGNANCY
Beyond their feelings about the appropriateness and morality of sexual activity per se, the opinions of youth about pregnancy, abortion and early childbearing also weigh in, at least theoretically, as factors affecting their sexual and fertility behavior. Data from the National Survey of Children indicate clearly that youth initiating sex wish to avoid pregnancy (see Table 5). Almost no youth of either gender, race, or age-at-first-sex group wanted a pregnancy to occur when they started having sex. Non-trivial proportions of youth who were 17 or younger when they first had sex reported that they "didn't think about it [pregnancy]," and teens who were younger when they initiated sex are significantly less resolved to avoid pregnancy than are older teens, but it is clear that early parenthood was not the goal of those initiating sex. In fact, youth are highly negative in their assessment of adolescent parenthood.
Table 6 and Table 7 depict the responses of youth to two rather strongly-worded questions: "Becoming an unmarried mother is one of the worst things that could happen to a 16-year-old girl" and its counterpart for males, "Becoming an unmarried father is one of the worst things that could happen to a 16-year-old boy." These opinion questions were placed at the beginning of the NSC interview, before respondents had received the lengthy interview modules on fertility behavior, parenthood, employment and schooling, so these issues were not made salient to the respondent by the interview itself. Nevertheless, a substantial majority of youth agree that teenage parenthood is one of the worst things that could happen to a 16-year-old.
| TABLE 5. How Youth Felt About Pregnancy at the Time of Youth's First Sexual Intercourse, by Age at First Intercourse, Gender, and Race. | ||||||
| Non-black | Black | |||||
| 17 | >18 | Total | 17 | >18 | Total | |
| Females | ||||||
| Wanted pregnancy | 1.8 | .8 | 1.4 | 1.1 | 4.0 | 2.2 |
| Wanted to avoid pregnancy | 84.5 | 90.0 | 86.6 | 79.5 | 96.0 | 85.4 |
| Didn't care | 3.5 | 7.7 | 5.1 | 1.1 | 0 | .7 |
| Didn't think about it | 10.3 | 1.5 | 6.9 | 18.3 | 0 | 11.7 |
| 100.1 | 100.0 | 100.0 | 100.0 | 100.0 | 100.0 | |
| n | 237 | 132 | 369 | 71 | 37 | 108 |
| Sig. level | .045 | .002 | ||||
| Males | ||||||
| Wanted pregnancy | .9 | 1.3 | 1.0 | 1.2 | 4.1 | 1.6 |
| Wanted to avoid pregnancy | 81.7 | 91.1 | 84.2 | 66.8 | 93.3 | 70.8 |
| Didn't care | 5.8 | 4.9 | 5.6 | 13.0 | 0 | 11.1 |
| 100.0 | 100.0 | 100.0 | 100.0 | 100.0 | 100.0 | |
| n | 251 | 104 | 355 | 89 | 13 | 102 |
| Sig. level | .004 | .02 | ||||
| TABLE 6. Proportions Agreeing and Disagreeing with the Statement, "Becoming an Unmarried Mother is One of the Worst Things That Could Happen to a 16-Year-Old Girl," by Race and Gender, Youth Aged 18-22 in 1987. | ||||
| Males | Females | |||
| Non-black | Black | Non-black | Black | |
| Strongly Agree | 32.7 | 33.2 | 37.4 | 28.5 |
| Agree | 49.5 | 43.0 | 46.5 | 40.8 |
| Depends/Don't Know/Disagree/Strongly Disagree | 17.8 | 23.8 | 16.2 | 30.6 |
| n | 447 | 117 | 458 | 124 |
| ns | p .0011 | |||
| TABLE 7. Proportions Agreeing and Disagreeing with the Statement, "Becoming an Unmarried Father is One of the Worst Things That Could Happen to a 16-Year-Old Boy," by Race and Gender, Youth Aged 18-22 in 1987. | ||||
| Males | Females | |||
| Non-black | Black | Non-black | Black | |
| Strongly Agree | 24.3 | 20.9 | 29.0 | 22.1 |
| Agree | 56.4 | 57.1 | 55.1 | 49.7 |
| Depends/Don't Know/Disagree/Strongly Disagree | 19.2 | 22.0 | 15.8 | 28.2 |
| n | 447 | 117 | 457 | 124 |
| ns | p = .0038 | |||
Given the greater effect of parenthood on teenage girls relative to boys, it may seem surprising how little responses are affected by gender. Male and female respondents differ only slightly in their assessment of early parenthood. In addition, teenage fatherhood is assessed almost as negatively as teenage motherhood. Youth are more likely to "strongly agree" that motherhood is a disaster for a girl than for a boy; but the proportions who disagree or feel "it depends" do not differ. On the other hand, females differ by race. Black females are almost twice as likely to disagree that young unmarried parenthood is one of the worst things that could happen to a teen as are non-black females. This could mean simply that they can think of worse things that could happen; more likely it represents a sub-group who hold less negative attitudes. This interpretation receives some support in Table 8.
ATTITUDES ABOUT NON-MARITAL CHILDBEARING
The proportions expressing various degrees of disapproval of non-marital motherhood are depicted in Table 8 by gender and race. The most striking aspect of the table is the overall lack of disapproval. Less than one in twenty youth strongly agree that "single women should not have children, even if they want to. Even when those who agree are combined with those who agree strongly, only about one in five youth feel that single women should not be mothers. Whites are more likely to disapprove of single motherhood, while blacks are somewhat more likely to be accepting; but the general lack of disapproval is the more notable overall result.
ABORTION ATTITUDES
Despite their acceptance of out-of-wedlock childbearing in general, young women personally confronted with pregnancy are very likely to obtain abortions. Among teens who become pregnant, 46% of those under age 15, 43% of those aged 15-17, and 41% of those 18-19 obtain abortions (Henshaw and Van Vort, 1989). In keeping with this high level of resort to abortion, data from youth in the NSC show considerable tolerance for abortion.
As found in other studies (Smith, 1987), NSC youth are more accepting of a "hard" reason for abortion -- rape -- than they are for "social" reasons --being unmarried, young, or unable to raise the child (see Table 9). Youth are the least accepting of abortions obtained by women who have already had an abortion. In every race/gender sub-group, this reason received the lowest acceptance; yet four in ten white males and about one in four youth in the other groups stated that they feel it's all right to have an abortion even if a woman has already had one abortion.
| TABLE 8. Proportions Agreeing and Disagreeing with the Statement, "Single Women Should Not Have Children, Even If They Want To," by Race and Gender, Youth Aged 18-22 in 1987. | ||||
| Males | Females | |||
| Non-black | Black | Non-black | Black | |
| Strongly Agree | 5.8 | 5.0 | 3.9 | 1.7 |
| Agree | 21.7 | 17.4 | 17.5 | 14.0 |
| Depends/Don't Know | 6.0 | 3.4 | 3.5 | 0 |
| Disagree | 62.3 | 59.3 | 60.0 | 68.5 |
| Strongly Disagree | 4.2 | 14.9 | 15.1 | 15.7 |
| n | 446 | 117 | 457 | 124 |
| p = .0043 | p = .0678 | |||
| TABLE 9. Circumstances Under Which Youth Feel "It's All Right to Have an Abortion," by Race and Sex | ||||||
| Males | Females | |||||
| Non-black | Black | Total | Non-black | Black | Total | |
| If she has been raped | 82% | 71% | 80%** | 83% | 73% | 81% |
| If she is unmarried | 55% | 37% | 52%*** | 40% | 34% | 39%+ |
| If she is 16 or younger | 64% | 47% | 60%*** | 52% | 40% | 50%** |
| Is she has already had one abortion | 43% | 25% | 39%*** | 28% | 27% | 27% |
| If she cannot afford to raise the child | 50% | 43% | 49%+ | 35% | 32% | 34% |
| n | 447 | 117 | 564 | 458 | 124 | 582 |
| + p .10; * p .05; ** p .01; *** p .001 | ||||||
Across the several gender/race groups, blacks are less accepting of abortion than whites in every comparison. With the exception of rape, where young women are as accepting of abortion as are young men, NSC males tend to be more accepting of abortion for a variety of reasons. Thus black females tend to be the least accepting of abortion, despite the fact that black female teens have an abortion rate that is twice that of white teens (Henshaw and Van Vort, 1989). This would suggest that there is considerable readiness for a lowering of the very high pregnancy rate among blacks that accounts for their very high abortion rate.
Clearly youth differentiate among the reasons that women have for obtaining abortions, being more accepting of those "hard" reasons that actually account for only a small minority of abortions (Torres and Forrest, 1988). Nevertheless, nearly half accept abortion for social and economic reasons. The other side of this, of course, is that half do not accept abortion despite poverty, young age, and non-marriage. This suggests two conclusions.
First, a quite substantial proportion of these youth, who have essentially grown up while abortion has been legal, accept abortion for a variety of circumstances. These youth seem unlikely to accept a legal re-definition of abortion as an illegal act. On the other hand, youth, particularly females, make strong distinctions between abortions sought for "hard" versus social reasons; and many youth are not accepting of abortion for any reason but particularly for social reasons. This seems to suggest that efforts to reduce the incidence of abortion, other than efforts to make abortion illegal, should meet with considerable receptivity among youth. The group with the highest teen abortion rate, black females, are the least accepting of abortion. Hence there is a climate of receptivity to not only avoiding early parenthood but to avoiding abortion.
ATTITUDES ABOUT MARRIAGE AND COHABITATION
The strong secular trend toward delayed marriage is clearly supported by attitude data from the National Survey of Children (see Table 10). Only a handful of respondents cited 17 or younger as "the best age" for them to have gotten married. Similarly, only a few respondents selected ages 18-19 as the best age for them to marry or to have married. About a quarter of the females feel that the best age to marry is before age 22, with white females being considerably more likely to prefer early marriage. About half of the NSC white females would prefer to be married by age 24, which accords very well with data on the median age at first marriage shown in Figure 4-A. Black females prefer to delay marriage even more than white females, with about half preferring to marry by ages 24-25. Similarly, slightly more than half of NSC males prefer to marry before age 26, a proportion very much in line with the data for males shown in Figure 4-A.
| TABLE 10. Respondent's Opinion Regarding "The Best Age, If Any, For You To First Get/Have Gotten Married," by Race and Sex. | ||||||
| Males | Females | |||||
| Non-Blacks | Blacks | Total | Non-Blacks | Blacks | Total | |
| 17 | 0 | 0 | 0 | 1.5 | 0 | 1.2 |
| 18-19 | 5.9 | 0 | 4.8 | 7.2 | 2.4 | 6.2 |
| 20-21 | 8.2 | 5.5 | 7.6 | 23..0 | 16.4 | 21.6 |
| 22-23 | 16.2 | 13.9 | 15.7 | 21.6 | 9.4 | 19.1 |
| 24-25 | 31.8 | 21.2 | 29.7 | 31.9 | 30.2 | 31.5 |
| 26-27 | 12.6 | 16.3 | 13.3 | 6.7 | 15.2 | 8.5 |
| 28-29 | 9.6 | 12.7 | 10.2 | 1.9 | 14.4 | 4.5 |
| 30-34 | 4.6 | 8.1 | 5.3 | 1.3 | 4.8 | 2.0 |
| 35+ | 1.5 | 4.4 | 2.1 | .3 | .6 | .4 |
| Prefer not to marry | 5.3 | 17.1 | 7.6 | 2.1 | 6.1 | 2.9 |
| Don't know/no best age | 4.4 | 1.0 | 3.7 | 2.4 | .5 | 2.0 |
| n | 447 | 117 | 564 | 458 | 124 | 582 |
| p = .0000 | p = .0000 | |||||
Hence, it would appear that the rising age at first marriage that has occurred in the U.S. during the past several decades is in accord with the preferences of marriage-age youth and does not (solely) reflect economic or occupational forces. In addition, the data do not suggest a rejection of marriage; most youth plan to marry at some time during their twenties.
The one group with reservations about marriage is that of black males. Nearly one in six stated a preference not to ever marry. In addition, one in eight black males prefer to be 30 or older when they do marry.
In line with their reservations about marrying, black youth, are particularly likely to agree with the statement that "It's hard for most women to find a man who has a good job and wants to be married." Two-thirds of black males and three-quarters of black females agree with this statement (see Table 11). Somewhat more surprising, half of non-black youth also agree with this statement. Nevertheless, the race difference in the proportion agreeing is large and highly significant.
Part of the delay in marriage has been linked to increasing cohabitation among youth (Bumpass, Sweet and Cherlin, 1989; see Figure 4-B). Data displayed in Table 12 indicate that, except for black males, more than half of NSC youth endorse living together before marriage as making "a lot of sense." (The reservations of black males may be linked to the preference of some to avoid marriage altogether.) While minorities feel strongly opposed to cohabitation, it would seem that most youth are fairly, if not strongly, supportive of the growing trend toward "living together."
ATTITUDES ABOUT DIVORCE
In accord with the acceptance youth state for cohabitation, the overwhelming majority feel that a couple should not get married "unless they are prepared to stay together for life" (see Table 13). In fact, their negative feelings about divorce are sufficiently strong that one suspects that their acceptance of cohabitation and non-marital childbearing may reflect a desire to avoid entering a marriage that might eventually end in divorce. Black youth are, again, less certain about marriage, with one in four feeling marriage is all right even if a couple is not prepared to stay together for life, compared to about one in seven white youth. Among whites, about 84% agree that a couple should not marry unless they plan to remain together all their lives.
| TABLE 11. Proportions Agreeing and Disagreeing with the Statement, "It's Hard for Most Women to Find a Man Who Has a Good Job and Wants To Be Married," by Race and Gender, Youth Aged 18-22 in 1987. | ||||
| Males | Females | |||
| Non-black | Black | Non-black | Black | |
| Strongly Agree | 2.6 | 10.2 | 10.0 | 27.4 |
| Agree | 42.1 | 57.0 | 37.3 | 50.0 |
| Depends/Don't Know | 3.8 | .5 | .8 | 1.2 |
| Disagree | 46.6 | 28.2 | 45.5 | 21.0 |
| Strongly Disagree | 4.9 | 4.1 | 6.2 | .4 |
| n | 447 | 117 | 458 | 124 |
| p = .0000 | p = .0000 | |||
| TABLE 12. Proportions Agreeing and Disagreeing With the Statement, "Living Together Before Marriage Makes a Lot of Sense," by Race and Gender, Youth Aged 18-22 in 1987. | ||||
| Males | Females | |||
| Non-black | Black | Non-black | Black | |
| Strongly Agree | 16.5 | 16.3 | 9.0 | 10.1 |
| Agree | 51.6 | 33.0 | 43.6 | 41.3 |
| Depends/Don't Know | 1.7 | 1.1 | 4.0 | 2.0 |
| Disagree | 26.4 | 35.0 | 28.7 | 37.5 |
| Strongly Disagree | 3.8 | 14.6 | 14.7 | 9.1 |
| n | 447 | 117 | 458 | 124 |
| p = .0004 | ns | |||
| TABLE 13. Proportions Agreeing and Disagreeing With the Statement, "Unless a Couple is Prepared to Stay Together for Life, They Should Not Get Married," by Race and Gender, Youth Aged 18-22 in 1987. | ||||
| Males | Females | |||
| Non-black | Black | Non-black | Black | |
| Strongly Agree | 47.3 | 23.0 | 48.7 | 26.1 |
| Agree | 36.4 | 45.6 | 35.3 | 36.9 |
| Depends/Don't Know | 2.1 | 0.0 | 2.0 | 1.0 |
| Disagree | 12.1 | 26.9 | 10.9 | 27.0 |
| Strongly Disagree | 2.2 | 4.5 | 3.1 | 9.1 |
| n | 447 | 117 | 458 | 124 |
| p = .000 | p = .000 | |||
Data in Table 14 demonstrate similar reservations about divorce in that about half of the sample do not feel that divorce should be easy, even for unhappy couples. White females are the most opposed to divorce. Of course, it might be stated, from an opposite perspective, that about half of youth think divorce should be easy if a couple is unhappy. Clearly, youth have fewer reservations about divorce in the face of unhappiness than they do about entering marriage. However, even if a couple is unhappy, six in ten females and five in ten males feel divorce should not be easy.
In this context, it bears mentioning that eight in ten males and seven in ten females feel that children do better with both parents, and that two in three youth feel that "when parents divorce, children develop permanent emotional problems." With such negative attitudes about divorce, it is not surprising that youth have reservations about entering marriage.
On the basis of the responses of youth to these several items, it might be fairly concluded that youth hold generally negative attitudes about divorce, though nearly half do accept divorce for unhappy couples. A logical question at this point is the extent to which negative attitudes about divorce arise from the youth's personal experiences with divorce. The hypothesis is that youth who have experienced disruption in their own families would be more cautious about entering marriage, but perhaps more tolerant of marital disruption in the case of unhappiness.
To address this question, the data in the previous three tables were partitioned according to whether the young person's two biological parents had formed an intact marriage. Table 15, for example, duplicates the data in Table 10 on the best age to get married, but shows it by the additional "intact/disrupted" distinction. Youth whose parents never married, or who married but separated or divorced, are included in the category "disrupted." Youth whose parents married and remained married, including those few cases in which one partner died, are included in the category "intact."
There is no clear evidence in these data that youth exposed to family disruption are more likely to delay marriage. (It may be the case that an association is obscured by social and economic correlates of age at marriage; but such an examination is beyond the scope of this paper.) In fact, youth from disrupted families are less likely to insist upon a life-long marital commitment than are youth from intact families (see Table 16). In each race/gender subgroup, youth whose biological parents have married and remained married are significantly more likely to feel that a couple should not get married unless they are prepared to stay together for life. It should be noted, however, that even among youth from disrupted backgrounds, a majority consistently oppose entering marriage without a lifelong commitment.
| TABLE 14. Proportions Agreeing and Disagreeing With the Statement, "It Should Be Easy for Unhappy Couples to Get a Divorce," by Race and Gender, Youth Aged 18-22 in 1987. | ||||
| Males | Females | |||
| Non-black | Black | Non-black | Black | |
| Strongly Agree | 2.6 | 8.2 | 4.4 | 9.8 |
| Agree | 46.8 | 38.7 | 32.6 | 37.5 |
| Depends/Don't Know | 3.4 | .5 | 2.8 | 2.1 |
| Disagree | 40.6 | 45.8 | 50.2 | 39.9 |
| Strongly Disagree | 6.6 | 6.7 | 10.0 | 10.7 |
| n | 446 | 117 | 458 | 124 |
| p = ns | p = .03 | |||
| TABLE 15. Respondent's Opinion Regarding "The Best Age, if Any, For You To First Get/Have Gotten Married," by Race, Gender, and Whether Marriage of Biological Parents Was Intact or Disrupted, Youth Aged 18-22 in 1987. | ||||
| Non-Black | Black | |||
| Intact | Disrupted | Intact | Disrupted | |
| Males | ||||
| 17 | 0 | 0 | -- | -- |
| 18-19 | 5.7 | 7.0 | -- | -- |
| 20-21 | 8.5 | 8.1 | 1.0 | 10.1 |
| 22-23 | 18.2 | 13.1 | 17.1 | 9.2 |
| 24-25 | 33.5 | 30.8 | 23.7 | 16.8 |
| 26-27 | 11.9 | 15.2 | 14.1 | 17.4 |
| 28-29 | 11.0 | 7.1 | 17.7 | 6.1 |
| 30-34 | 3.1 | 8.5 | 4.3 | 11.6 |
| 35+ | 1.1 | 2.6 | 3.9 | 4.5 |
| Prefer not to marry | 7.2 | 7.6 | 18.1 | 24.2 |
| p | ns | ns | ||
| Unweighted N | 295 | 133 | 52 | 64 |
| Females | ||||
| 17 | .9 | 3.0 | -- | -- |
| 18-19 | 7.3 | 7.7 | 5.2 | -- |
| 20-21 | 23.2 | 24.4 | 18.2 | 15.0 |
| 22-23 | 24.0 | 17.6 | 8.5 | 10.3 |
| 24-25 | 32.1 | 34.2 | 24.5 | 35.4 |
| 26-27 | 6.9 | 6.9 | 5.8 | 23.4 |
| 28-29 | 2.2 | 1.1 | 28.4 | 2.5 |
| 30-34 | 1.5 | .8 | 4.9 | 4.7 |
| 35+ | -- | .3 | 1.2 | -- |
| Prefer not to marry | 1.8 | 3.1 | 3.2 | 8.6 |
| p | ns | ns | ||
| Unweighted N | 308 | 139 | 56 | 67 |
| NOTE: "Intact" families are those in which the child's biological parents are married to one another or in which the marriage was ended by death. "Disrupted" marriages are those terminated by divorce or separation, plus cases in which the biological parents never married. | ||||
On the other hand, youth's feelings about the ease of divorce are not affected by family background among whites. There is an effect among blacks; but the effects are in opposite directions for males and females (see Table 17). Black males from disrupted backgrounds are significantly more likely to agree that divorce should be easy for unhappy couples, while black females from disrupted families are somewhat more likely to oppose easy divorce. Again, the evidence is clearer with regard to making a marriage commitment, with blacks and youth from disrupted families somewhat more accepting of marriage without a lifelong commitment, than it is regarding the acceptability of eventual divorce.
There is one topic, however, on which youth from disrupted backgrounds do feel more strongly than youth from intact families. That issue is child support (see Table 18).
Particularly among white males, but to some extent among white females as well, youth whose own parents, marriage was disrupted are more likely to feel that an absent father should pay child support, despite a variety of extenuating circumstances. For example, 73% of white males from disrupted families feel the father should pay child support even if the father has another family to support, compared to 65% among comparable males from intact families. Similarly, 41% in the disrupted category believe in child support if the mother has remarried, compared to 20% of those from intact families.
Overall, youth are generally favorable toward child support unless it would force a father who is in high school to leave school. Whites tend to feel that remarriage and a mother who prevents a father from seeing the child are excuses for not paying child support; but blacks do not ease up in these cases to the same extent. In fact, overall, with only one exception (black males are more likely to see high school enrollment as a justifiable exception), a higher proportion of blacks than whites favor child support. This may reflect the higher rate of non-marriage and marital disruption in the black community. Given the stronger feelings of white youth from disrupted family backgrounds compared with white youth from intact families, it seems that experience with father-absent families leads to stronger attitudes favoring child support.
| TABLE 16. Proportion Agreeing and Disagreeing With the Statement, "Unless a Couple is Prepared to Stay Together for Life, They Should Not Get Married," by Race, Gender, and Whether Marriage of Biological Parents Was Intact or Disrupted, Youth Aged 18-22 in 1987. | ||||
| Non-Black | Black | |||
| Intact | Disrupted | Intact | Disrupted | |
| Males | ||||
| Strongly Agree | 50% | 42% | 25% | 20% |
| Agree | 36 | 38 | 50 | 40 |
| Depends/Don't Know | 3 | 0 | -- | -- |
| Disagree | 11 | 16 | 23 | 31 |
| Strongly Disagree | 1 | 5 | 1 | 8 |
| 101% | 101% | 99% | 99% | |
| p | .020 | .058 | ||
| Unweighted N | 311 | 136 | 53 | 64 |
| Females | ||||
| Strongly Agree | 51% | 42% | 30% | 22% |
| Agree | 35 | 37 | 38 | 36 |
| Depends/Don't Know | 1 | 4 | 1 | 1 |
| Disagree | 9 | 15 | 25 | 29 |
| Strongly Disagree | 4 | 2 | 5 | 12 |
| 100% | 100% | 99% | 100% | |
| p | .037 | .081 | ||
| Unweighted N | 314 | 144 | 56 | 68 |
| TABLE 17. Proportions Agreeing and Disagreeing With the Statement, "It Should Be Easy for Unhappy Couples to Get a Divorce," by Race, Gender, and Whether Marriage of Biological Parents Was Intact or Disrupted, Youth Aged 18-22 in 1987. | ||||
| Non-Black | Black | |||
| Intact | Disrupted | Intact | Disrupted | |
| Males | ||||
| Strongly Agree | 3% | 2% | 4% | 13% |
| Agree | 48 | 45 | 34 | 44 |
| Depends/Don't Know | 2 | 7 | -- | 1 |
| Disagree | 41 | 39 | 52 | 38 |
| Strongly Disagree | 7 | 6 | 9 | 4 |
| 101% | 99% | 99% | 100% | |
| p | ns | .009 | ||
| Unweighted N | 311 | 135 | 53 | 64 |
| Females | ||||
| Strongly Agree | 4% | 5% | 16% | 4% |
| Agree | 34 | 29 | 36 | 39 |
| Depends/Don't Know | 3 | 2 | 0 | 4 |
| Disagree | 48 | 55 | 40 | 40 |
| Strongly Disagree | 10 | 10 | 8 | 13 |
| 99% | 101% | 100% | 100% | |
| p | ns | .096 | ||
| Unweighted N | 314 | 144 | 56 | 68 |
| TABLE 18. Youth's Attitudes Regarding When a Father Who Does Not Live With His Children Should Pay Child Support, by Race, Gender, and Whether Youth's Biological Parents Have an Intact Marriage or a Disrupted Relationship, Youths 18-22 in 1987. | ||||||
| Percent Agreeing Absent Father Should Pay Child Support | ||||||
| Non-Black | Black | |||||
| Intact | Disrupted | Total | Intact | Disrupted | Total | |
| Males | ||||||
| If the mother prevents the father from seeing the child | 33 | 39 | 35 | 46 | 56 | 51 |
| If there is no legal child support award | 69 | 75 | 70 | 85 | 81 | 83 |
| If the children are being supported by welfare | 66 | 83 | 71*** | 79 | 83 | 81 |
| If the mother has remarried | 20 | 41 | 26*** | 50 | 63 | 56+ |
| If the father has another family to support | 65 | 73 | 67+ | 83 | 72 | 78+ |
| If the father is in high school and would have to drop out to get a job | 39 | 49 | 42 | 45 | 25 | 36* |
| n | 310 | 136 | 446 | 53 | 64 | 117 |
| Females | ||||||
| If the mother prevents the father from seeing the child | 49 | 41 | 47+ | 57 | 59 | 58 |
| If there is no legal child support award | 72 | 77 | 73+ | 84 | 88 | 86 |
| If the children are being supported by welfare | 73 | 79 | 75+ | 77 | 85 | 81 |
| If the mother has remarried | 45 | 53 | 47+ | 62 | 66 | 64 |
| If the father has another family to support | 76 | 84 | 78* | 82 | 77 | 79 |
| If the father is in high school and would have to drop out to get a job | 33 | 32 | 33 | 44 | 37 | 40 |
| n | 314 | 144 | 458 | 56 | 68 | 124 |
| + p .10; * p .05; ** p .01; *** p .001 | ||||||
SUMMARY AND CONCLUSIONS
Despite major changes in the marriage and fertility behaviors of contemporary Americans, the attitudes of youth about these changes have been somewhat slower to change. Nevertheless, the attitudes and values of youth do reflect the period in which they have grown up. Most important, the opinions expressed by youth show important opportunities for policy leverage, as well as some areas in which behavior change may be resisted. Because the attitudes of youth vary greatly from topic to topic, each issue must be discussed in turn.
Regarding sexual intercourse during adolescence, it is clear that, despite increases in the proportions of youth initiating sex during their early teen years, the vast majority of older teens feel that sex is wrong for 14- and 15-year-olds. The disapproval weakens for 16- and 17-year-olds, however, suggesting that there is strong support for abstinence among young people themselves in the early teen years and into the middle teen years but waning support in the late teen years. Given the acceptance of youth for the trend toward premarital sex during the later teen years, support for sustained and correct contraceptive use among older adolescents seems essential. On the other hand, a striking degree of support is evident for abstinence during the early teen years.
Regarding peer pressure, a third of white males and half of black males report having been pressured by peers to have sex when they were teens, but only a third report that their mothers discouraged sex. Hence there are clear opportunities for programs to undercut peer pressure and to encourage parents to become more involved, particularly among male adolescents. Female adolescents receive less peer pressure to have sex and more discouragement from mothers; but many adolescent females are also the objects of pressure to have sex and about four in ten die not feel discouraged to have sex by their mothers, so efforts may be appropriate fore both groups.
An overwhelming majority, particularly among whites, feel that both teen motherhood and teen fatherhood are disasters -- "one of the worst things that could happen" to a 16-year-old. In addition, the vast majority of sexually experienced youth report wanting to avoid pregnancy when they initiated sex. Hence, most youth can be expected to be receptive to programs intended to prevent pregnancy. One caveat is that black youth feel less negative about early pregnancy and parenthood than do white youth. Nevertheless, even among blacks, a large majority hold negative attitudes about adolescent pregnancy.
Youth also hold mixed but fairly negative attitudes about abortion. With the exception of rape, the sample is quite divided on the acceptability of abortion. The group least accepting of abortion is the group that most often obtains abortions -- black females. Hence, considerable receptivity exists not only for postponing sex in early adolescence and for preventing early pregnancy and childbearing, but for preventing abortion as well. It bears mentioning, however, that one-third to two-thirds of the sample are accepting of abortion for social reasons such as being young or unmarried. This suggests that laws to prohibit abortion would face considerable resistance. Since considerable and relatively unequivocal support exists for prevention, programs stressing prevention may be the most-productive avenue for policy initiatives.
Regarding marriage, contemporary young adults hold strong attitudes. They prefer delayed marriage, in keeping with the trend toward being older at first marriage, and they feel strongly that couples should not marry unless they intend to remain together for life. However, most youth plan to marry at some time during their twenties. Only among black males does a substantial proportion prefer to avoid marriage, with about one in six black males expressing this preference.
Perhaps reflecting their perception of this attitude, but probably also reflecting the relatively poor job prospects of black males, three-quarters of black females feel that it's "hard for most women to find a man who has a good job and wants to be married." Since the propensity to marry is there for most youth, programs might help by strengthening employment prospects, particularly for blacks. It is important to note that, despite discouragement about the prospects for marriage, most youth plan to marry and favor a commitment to a lifelong marriage.
Although youth from disrupted families are significantly less likely to require a lifelong commitment, a substantial majority even within this group favor such a commitment.
In keeping with their reservations about marriage, about half of the youth feel cohabitation is a good idea and only about one in five are opposed to non-marital childbearing.
Youth tend to hold highly negative attitudes about divorce. Only about half think divorce should be easy for unhappy couples; about three-quarters feel that children do better with two parents; and two-thirds feel that "children develop permanent emotional problems" when their parents divorce. In addition, youth favor child support, and youth from disrupted families tend to feel even more strongly than youth whose parents married and remained married.
In sum from the perspective of discouraging early and unwanted pregnancy and single parenthood, data on the attitudes and values of youth are more hopeful than the data on trends in behavior. Youth are skeptical about early sexual activity, and very opposed to early pregnancy and to abortion. In addition, they favor marriage with a lifelong commitment, are concerned about the consequences of divorce for children, and are strongly in favor of child support. While they accept childbearing outside of marriage, they feel that children do better with two parents. While many youth feel discouraged about the prospects for women to find an employed man who wants to be married, most youth do want to marry, generally during their twenties. Policies that can be constructed to support youth in bringing their behavior in line with their attitudes may be able to affect the behavioral trends that have caused so much concern during the past several decades.
REFERENCES
Anderson, Elijah. "Sex Codes and Family Life Among Poor Inner-City Youths." The Annals of the American Academy, pp.59,78.
Bezilla, Robert., Ed. "America's Youth: 1977-1988." Princeton, NJ: The Gallup Organization, Inc., 1988.
Bumpass, Larry, James Sweet and Andrew Cherlin. "The Role of Cohabitation in Declining Rates of Marriage." Paper presented at the 1989 Annual Meetings of the Population Association of America.
Henshaw, Stanley K. and Jennifer Van Vort. "Teenage Abortion, Birth and Pregnancy Statistics: An Update." Family Planning Perspectives, Volume 21, Number 2, March/April 1989, pp.85-88.
London, K.A., W.D. Mosher, W.F. Pratt and L.B. Williams. "Preliminary Findings From the National Survey of Family Growth, Cycle IV." National Center for Health Statistics, Division of Vital Statistics, National Survey of Family Growth. Data presented at the 1989 Meetings of the Population Association of America.
Moore, Kristin A., Christine Winquist Nord and James L. Peterson. "Nonvoluntary Sexual Activity Among Adolescents." Family Planning Perspectives, Volume 21, Number 3, May/June 1989, pp.110-114.
Smith, T.W. National Opinion Research Center, unpublished data from 1972-1987 General Social Surveys, Chicago, August, 1987.
Torres, Aida and Jacqueline Darroch Forrest. "Why Do Women Have Abortions?" Family Planning Perspectives, Volume 20, Number 4, July/August 1988, pp.169-176.