

Key Findings:
- According to federal survey data, the percentage of all office-based physicians who report accepting new Medicare patients has not changed significantly between 2005 and 2012, with 87.9% of physicians accepting new Medicare patients in 2005 and 90.7% in 2012.
- The percentage of physicians who report accepting new Medicare patients is similar to, and in recent years slightly higher than, the percentage accepting new privately insured patients.
- Medicare beneficiary access to care is high and has remained stable over the past five years.
Physician Participation in Medicare and Private Insurance
In order to assess trends in provider acceptance of Medicare and privately insured patients, the National Center for Health Statistics (NCHS) analyzed seven years of federal survey data from the National Ambulatory Medical Care Survey (NAMCS). NAMCS is conducted by the NCHS of the Centers for Disease Control and Prevention, and is a nationally-representative survey of office-based M.D.s and D.O.s (Doctors of Medicine and Doctors of Osteopathy), excluding radiologists, anesthesiologists, and pathologists. Data for 2005-2010 come from in-person interviews of physicians or office staff.[1]
The NAMCS data show that the percentage of physicians who report accepting new Medicare patients has remained stable over the past seven years, with approximately 90% of physicians accepting new Medicare patients (Figure 1). Interim results from 2012 are based on a mail-survey, and data from in-person interviews will be available soon. These initial data suggest that acceptance rates have increased slightly in 2012 from 2011. For most of the 2005-2012 time period, the percentage of physicians accepting new privately insured patients is quite similar to the percentage accepting new Medicare patients, although evidence suggests the percentage accepting new Medicare patients may have increased slightly in 2011-12 while the percentage accepting new privately insured patients may have decreased slightly.[2]
Figure 1: Percentage of Physicians Accepting New Patients with Medicare and Private Insurance, 2005-2012
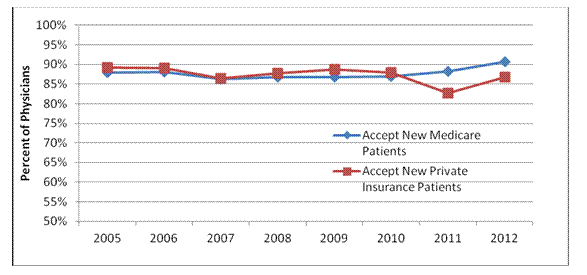
Source: NCHS analysis of the 2005-2012 National Ambulatory Medical Care Survey (NAMCS)
According to Centers for Medicare and Medicaid Services (CMS) data, there were about 650,000 physicians who participated in the Medicare program in 2011 and nearly 1 million participating providers in total (including non-physician providers such as nurse practitioners).[3] It is clear from the data in Figure 1 the percentage of all physicians who accept new Medicare patients has been stable from 2005 to 2012. To the extent that there may have been a very small increase in the number of providers ‘opting out’, that increase has been mitigated by an increase in the share of other physicians who accept new Medicare patients. Further, the total number of providers participating in and billing Medicare has steadily increased since 2007 (Figure 2).
Figure 2: Number of Providers Participating in and Billing Medicare, 2007-2011
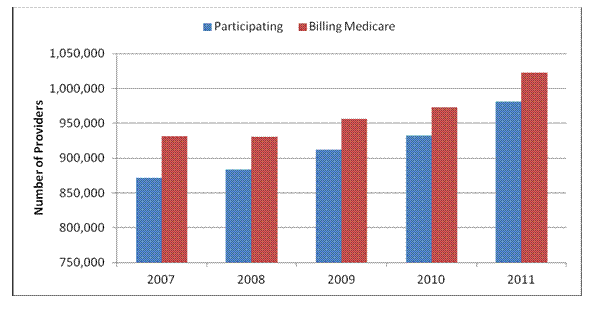
Source: CMS Data Compendium, 2007-2011 editions, table VI.6
Note: Providers include MDs, DOs, limited license practitioners, and non-physician providers.
The data in Figure 1 and Figure 2 show that provider acceptance of new Medicare patients has been stable over the 2005 to 2012 period and the total number of providers participating in the program has increased. These findings allay concern that the number of physicians ‘opting out’ of Medicare has increased in recent years.[4] Physicians may opt out of the Medicare program for two years and establish written contracts with Medicare beneficiaries. Under these private contracts, beneficiaries are liable for payment of the care furnished. If a Medicare beneficiary receives services from a physician who has ‘opted out’, the beneficiary can pay the physician directly, but neither the physician nor the beneficiary receives any payment from Medicare. A 2005 study examining characteristics of providers opting out of Medicare found that overall less than one percent of providers eligible to opt out of Medicare did so, and the two specialties with the highest opt out percentages were psychiatrists (with 1.11% opting out) and plastic and reconstructive surgeons (with 1.56% opting out).[5] In contrast, about a third of one percent of primary care physicians (0.35%) opted out of Medicare.
Medicare Beneficiaries’ Access to Care
The extent to which providers participate in Medicare can affect beneficiaries’ access to timely, affordable care. For example, if provider participation in Medicare were low, beneficiaries might face long waits for appointments or larger out-of-pocket payments for care. However, based on multiple data sources, Medicare beneficiaries’ access to care appears to be excellent: it has been stable over the past five years and is comparable to or better than access reported by privately insured individuals.
Each year, the Medicare Payment Advisory Commission (MedPAC), an independent Congressional agency which advises the U.S. Congress on issues affecting the Medicare program, assesses the adequacy of Medicare payments to physicians and other providers by evaluating beneficiary access to care, volume growth, quality of care, and Medicare’s payment rates relative to those in the private sector. MedPAC conducts an annual survey of 4,000 Medicare beneficiaries and 4,000 privately insured individuals age 50-64 to evaluate access.[6] In its March 2013 Report to Congress, based on this and other federal surveys, MedPAC noted that Medicare beneficiaries report good access to care, and access to physicians’ services has remained stable over the past five years (Table 1).[7] For example, in 2012, 77% of Medicare beneficiaries reported they never experienced an unwanted delay in getting an appointment for routine care, compared with 76% in 2008. These results are similar to the reports provided by people with private insurance in the MedPAC survey. Similarly, the large majority of beneficiaries had no problems getting an appointment with a new physician, and again the results are comparable to those for people with private insurance. Additionally, Medicare beneficiaries were less likely than the privately insured to report forgoing needed medical care (8% vs. 11%) in 2012.
| Table 1: Access to care among Individuals with Medicare and Private Insurance, 2008 and 2012
| ||||||||
|
| Medicare (age 65+) | Private Insurance (age 50-64) | ||||||
| 2008 | 2012 | 2008 | 2012 | |||||
| Unwanted delay in getting an appointment: Among those who needed an appointment in the past 12 months, “How often did you have to wait longer than you wanted to get a doctor’s appointment?” | ||||||||
| For routine care: |
|
|
|
| ||||
| Never | 76% | 77% | 69% | 72% | ||||
| Sometimes | 17 | 17 | 24 | 21 | ||||
| Usually | 3 | 3 | 5 | 3 | ||||
| Always | 2 | 2 | 2 | 3 | ||||
| For illness or injury: |
|
|
|
| ||||
| Never | 84 | 84 | 79 | 80 | ||||
| Sometimes | 12 | 12 | 17 | 16 | ||||
| Usually | 1 | 2 | 2 | 2 | ||||
| Always | 1 | 1 | 2 | 2 | ||||
| Not accessing a doctor for medical problems: “During the past 12 months, did you have any health problems or conditions about which you think you should have seen a doctor or other medical person, but did not?” | ||||||||
| Percent answering “Yes” | 8 | 8 | 12 | 11 | ||||
| Getting a new physician: Among those who tried to get an appointment with a new primary care physician or a specialist in the past 12 months, “How much of a problem was it finding a primary care doctor/specialist who would treat you? Was it…” | ||||||||
| Primary care physician | % Among those Seeking a New Physician | % Among Total Medicare | % Among those Seeking a New Physician | % Among Total Medicare | % Among those Seeking a New Physician | % Among Total Private Insurance | % Among those Seeking a New Physician | % Among Total Private Insurance |
| No problem | 71 | 4.6 | 72 | 4.7 | 72 | 5.4 | 75 | 5.0 |
| Small problem | 10 | 0.6 | 14 | 0.9 | 8 | 0.6 | 9 | 0.6 |
| Big problem | 18 | 1.1 | 14 | 0.9 | 21 | 1.6 | 15 | 1.0 |
| Specialist |
|
|
|
| ||||
| No problem | 88 | 12.8 | 87 | 11.7 | 83 | 15.5 | 86 | 15.6 |
| Small Problem | 7 | 1.0 | 6 | 0.7 | 9 | 1.7 | 7 | 1.2 |
| Big problem | 4 | 0.6 | 7 | 0.9 | 7 | 1.4 | 7 | 1.2 |
| Source: MedPAC, March 2013 Report to Congress, Table 4-1. Based on MedPAC-sponsored telephone surveys conducted in 2008-2012. | ||||||||
These findings are consistent with other national surveys. For example, data from the 2010 Medicare Current Beneficiary Survey (MCBS) indicate that 95% of beneficiaries had a usual source of medical care. Nearly half of all beneficiaries seeking an appointment with a provider were able to see a provider within three days. About five percent of beneficiaries had trouble getting needed care. Similarly, the 2011 National Health Interview Survey (NHIS) included several questions on problems with access to care. Overall, access problems among Medicare beneficiaries were low and comparable to the privately insured (Table 2).
Table 2: Access Problems among Medicare and Privately Insured, 2011-2012
| Percent of those aged 18+: | Medicare | Private insurance |
| Had trouble finding a general doctor or provider to see you in the past 12 months | 2.4% | 1.7% |
| Was not able to find a general doctor or provider to see you in the past 12 months | 0.4 | 0.5 |
| In the past 12 months, was told by a doctor's office or clinic that they would not accept you as a new patient | 2.2 | 1.7 |
| In the past 12 months, was told by a doctor's office or clinic that they would not accept your insurance | 3.7 | 2.5 |
Source: NCHS analysis of the 2011 National Health Interview Survey
Additionally, data from the Fee-For-Service Consumer Assessment of Healthcare Providers and Systems (FFS CAHPS) survey suggest that there has been a slight increase in FFS beneficiaries’ access to care (Figure 3). The percentage of FFS Medicare beneficiaries reporting that they always were able to receive needed care from a specialist increased between 2008 and the first quarter of 2013 (from 61% to 66%). Similarly, the percentage of FFS Medicare beneficiaries reporting that they always were able to get care for an illness or injury when they thought they needed it increased slightly between 2008 and the first quarter of 2013 (from 69% to 71%), as did the percentage who reported always being able to get an appointment for regular or routine health care when needed (61% to 62%).
Figure 3: Fee-for-Service Beneficiaries’ Access to Care, 2008-2013
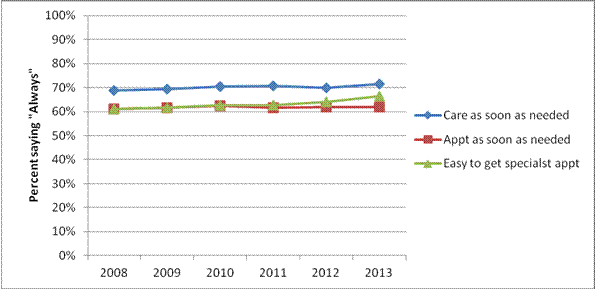
Source: CMS and ASPE analysis of 2008-2013 FFS CAHPS data
Notes: All items have four response categories rated 1-4, where 1 is “never” and 4 is “always”.
Conclusion
Approximately 90% of all office-based physicians report accepting new Medicare patients. The percentage of physicians who report accepting new Medicare patients is similar to the percentage of physicians who report accepting new privately insured patients. In addition, the share accepting new Medicare patients has been relatively stable over the 2005-2012 period and shows a slight increase in 2011-2012 based on initial NAMCS data. Beneficiary reports of access to care, including the ability to find a physician and see a doctor in a timely manner, are also favorable. Again, these results are comparable to reports by patients with private insurance and have been stable over time. Overall, Medicare beneficiary access to care has been consistently high over the last decade and continues to be high today.
Acknowledgments
The authors would like to thank Sandy Decker at the National Center for Health Statistics for her assistance with the NAMCS and NHIS data estimates and Elizabeth Goldstein at the Centers for Medicare & Medicaid Services for her assistance with the FFS-CAHPS data analysis. We also would like to thank HHS staff for their comments.
[1] 2011 data come from the NAMCS Electronic Records Supplement and 2012 from the NAMCS Electronic Health Records Survey, both conducted by mail. Unweighted response rates were between 58-67% depending on the year. Estimates used sample weights to yield nationally-representative estimates, and standard errors accounted for the complex survey design. Estimates excluded pediatricians and any respondent missing information on either acceptance of new Medicare or privately insured patients. Respondents missing information on acceptance of both ranged from 6-12%, depending on the year.
[2] Based on the NAMCS, primary care physicians (PCPs) and other specialties have similar trends of acceptance rates. PCPs are slightly less likely to accept new patients with either Medicare or private insurance than other specialties, but most physicians accept new patients of either insurance type. The percentage accepting new Medicare patients has been stable over the last decade, with about 85% of PCPs and 90% of other specialties accepting new Medicare patients. PCPs show an increase in acceptance rates (87.4%) in 2012; the increase for other specialties to 92.4% was not statistically significant.
[3] Medicare participating providers agree to accept “assignment” (the full Medicare payment rate) for services. Non-participating providers can accept assignment or can choose to be reimbursed by Medicare at 95% of the Medicare rate for participating providers with the ability to balance bill beneficiaries up to 115% of the non-participating provider rate. The sum of these two categories is shown in the “billing” column. Those providers who completely opt-out do not receive any reimbursements from Medicare, even for covered services.
[4] Beck, M. “More Doctors Steer Clear of Medicare”, Wall Street Journal 7/29/13 p.A1, vCCLXII #24. This article reported that the number of physicians opting out of Medicare increased from 3,700 in 2009 to 9,539 in 2012.
[5] Buczko, W (2005). “Provider Opt-out Under Medicare Private Contracting,” Health Care Financing Review 26(2):43-59.
[6] The MedPAC survey includes all Medicare beneficiaries and does not distinguish Medicare FFS enrollees from those in Medicare Advantage (MA) plans because of the technical difficulty in obtaining reliable self-identification of FFS or MA enrollment from surveyed individuals.
[7] Medicare Payment Advisory Commission (MedPAC), “Report to the Congress: Medicare Payment Policy,” Chp. 4, March 2013.