
ADVISORY COUNCIL ON ALZHEIMER'S RESEARCH, CARE, AND SERVICES
Friday, July 19, 2013
The Current State of the Private Long-Term Care Insurance Industry
Marc A. Cohen, Ph.D.
LifePlans, Inc.
Presentation Topics
- Current overview of U.S. LTC Insurance Market
- Profile of Individuals Purchasing Policies
- Product Evolution
- Market Exit among Carriers and Implications
Current LTC Insurance Industry Parameters
- Individual market
- Roughly 5-6 million individual policies in force.
- Total annualized in-force premium of over $8 billion.
- Approximately one dozen companies still active in market
- Annual sales in 2010 were 65% lower than in 2000.
- Between 2009 and 2012 average annual growth was positive at 6%
- Group Market
- Between 2.2 and 2.6 million certificates in force.
- Total premium of greater than $2.0 billion.
- Compound annual sales growth rate between 2005 and 2010 is +5%
- Slightly more than 11,000 employer groups sponsoring coverage
- Less than 8 insurers actively selling in the group market
| Number of Insured Lives has been relatively flat since 2005 |
|---|
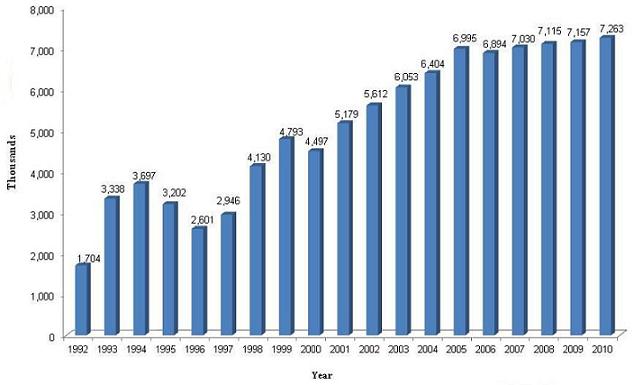 |
| Source: NAIC, 2011 |
| Annual Sales of Individual LTC Insurance Policies have been declining since 2002 |
|---|
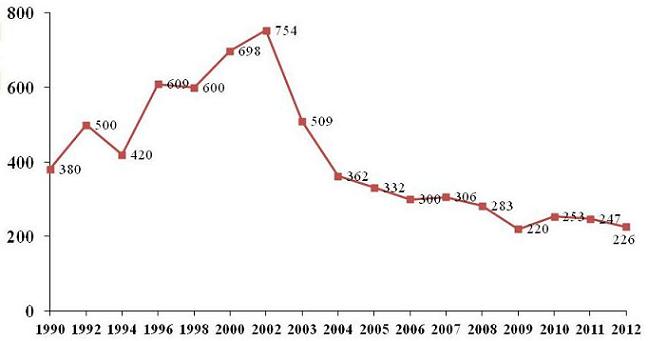 |
| Note: LifePlans analysis based on AHIP, LIMRA and LifePlans sales surveys, 2012. |
Growing proportion of sales is in the Group Market
- Group market represents a growing share of sales:
- In 2000: 75% Individual market 25% Group Market
- In 2010: 58% Individual market 42% Group Market
- Concentration in both markets: Top 10 carriers in individual market and top 5 in group market: 95% of sales
- Market penetration less than 10% of total population
- 16% of the age 65+ with incomes > $20,000 have policies.
Characteristics of Products and Purchasers
Great deal of product innovation over last 20 years
- Began as nursing home insurance in 1980s but now reimburses the costs of care in community and institutional settings:
- Nursing home
- Assisted Living
- Home and community-based care
- Access to a bank of benefits
- Typically to reimburse the costs of services
- Standard benefit triggers based on functional and cognitive status
- Care management provided to help at claim time.
- Average premiums differ by market:
- Individual Market: about $189 per month (average age 59)
- Group Market: about $57 per month (average age 46)
| Policies have become more comprehensive with richer benefits | |||||
|---|---|---|---|---|---|
| Policy Characteristics | Average for 2010 | Average for 2005 | Average for 2000 | Average for 1995 | Average for 1990 |
| Policy Type | |||||
| Nursing Home Only | 2% | 3% | 14% | 33% | 63% |
| Nursing Home & Home Care | 92% | 90% | 77% | 61% | 37% |
| Home Care Only | 6% | 7% | 9% | 6% | --- |
| Daily Benefit Amount for NH Care | $154 | $142 | $109 | $85 | $72 |
| Daily Benefit Amount for Home Care | $153 | $135 | $106 | $78 | $36 |
| Nursing Home Only Elimination Period | 86 days | 80 days | 65 days | 59 days | 20 days |
| Integrated Policy Elimination Period | 89 days | 81 days | 47 days | 46 days | --- |
| Nursing Home Benefit Duration | 4.8 years | 5.4 years | 5.5 years | 5.1 years | 5.6 years |
| Percent Choosing Inflation Protection | 92% | 76% | 41% | 33% | 40% |
| Annual Premium | $2,268 | $1,918 | $1,677 | $1,505 | $1,071 |
| Source: AHIP, 2011. | |||||
| As policies have become more comprehensive and actuarial assumptions “trued up”, premiums have increased |
|---|
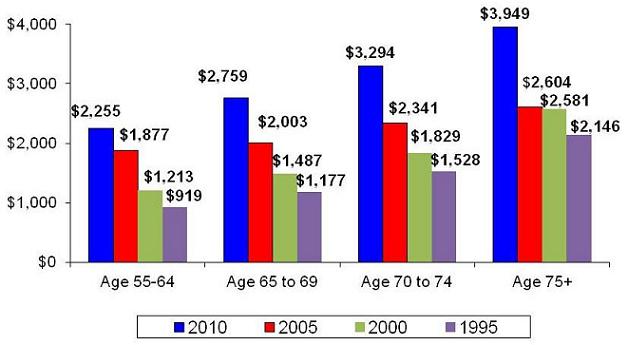 |
| Premium Increase: 1995-2010: age 55-64: 145%; age 65-69: 134%; age 70-74: 115%; age 75+: 84% Source: AHIP, 2011 |
| Younger, wealthier and employed individuals are buying policies | |||||
|---|---|---|---|---|---|
| Characteristic | 2010 | 2005 | 2000 | 1995 | 1990 |
| Average Age %> 70 | 59 years 8% | 61 years 16% | 65 years 40% | 69 years 49% | 68 years 42% |
| % Married | 69% | 73% | 70% | 62% | 68% |
| Median Income % > $50,000 | $87,500 77% | $62,500 71% | $42,500 42% | $30,000 20% | $27,000 21% |
| Median Assets % > $75,000 | $325,000 82% | $275,000 83% | $225,000 77% | $87,500 49% | N.A. 53% |
| % College Educated | 71% | 61% | 47% | 36% | 33% |
| % Employed | 69% | 71% | 35% | 23% | N.A. |
| Source: AHIP, 2011. | |||||
| The share of LTC sales to the middle market age 40-69 is declining |
|---|
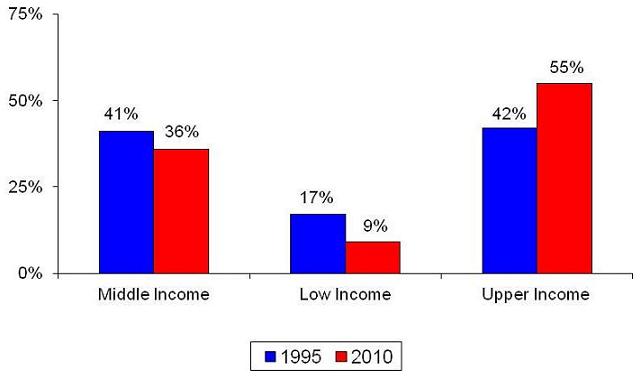 |
| Note: Low income 33% of income distribution; Middle income = 33% - 66%; Higher income = >66% Source: LifePlans analysis of AHIP Buyer Data, 2011 |
| Most people choose not to buy policies because they are viewed as too costly (2010) |
|---|
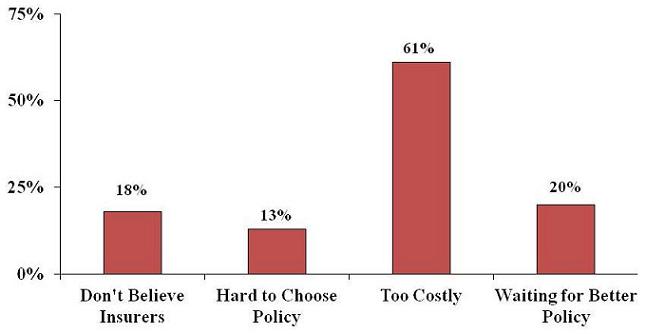 |
| Source: AHIP, 2011 |
| Most people buy policies to maintain lifestyle and consumption, not just to protect assets (2010) |
|---|
 |
| Source: AHIP, 2011 |
Public support for the private market has taken a variety of forms
- HIPAA Tax qualification status
- Deductibility of premiums for itemizers
- Few people benefit because of 7.5% AGI threshold
- Partnership Programs
- Purchasers of LTCI can access Medicaid without having to spend-down assets
- 45 states participate
- Little knowledge of the program: 25% of random sample age 50 and over knew about program
- 45% indicated they would be more likely to purchase LTCI if state had a Partnership Program
- State Tax incentives for purchase of LTCI
- More than half the states provide tax incentives
- Benefits too small to make much of a difference
Claims Payments among LTC Insurance Companies
| Recent claims performance has deteriorated somewhat: On a cumulative basis, claims are running 3% higher than expected |
|---|
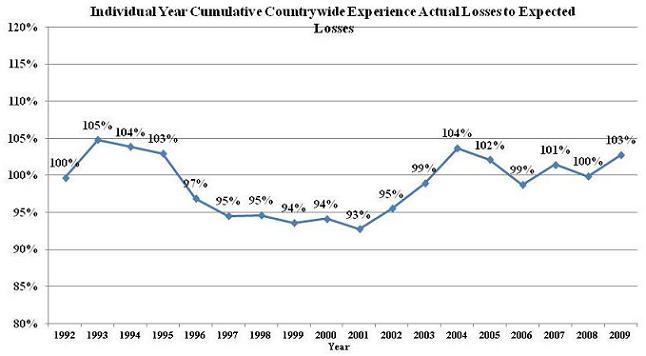 |
| Industry Actual to Expected Annual Incurred Claims, 2009-2011 |
|---|
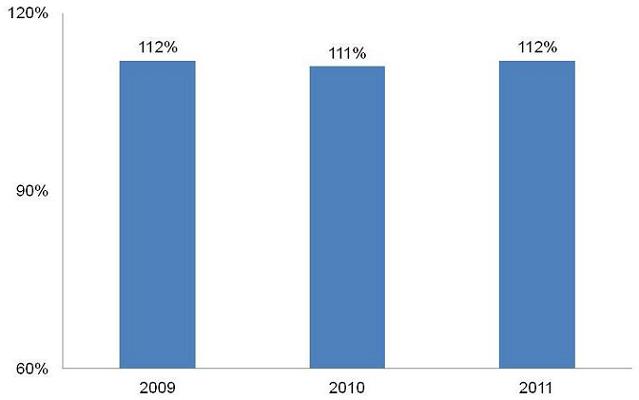 |
| Source: NAIC Experience Reports, 2012 |
Society of Actuary Findings on Dementias and Long-Term Care Insurance
- “…Alzheimer’s claims continue to be most frequent, longest and most expensive, as well as trending upward”
- Alzheimer’s claims have gone from representing 15% to 34% of total claims by count (2004)
- Alzheimer’s claims paid-to-date are more than three times greater than the next leading cause (stroke).
| Claims Experience among 8,500 Claimants within Six Years of Policy Issue (“Early Claimants”) |
|---|
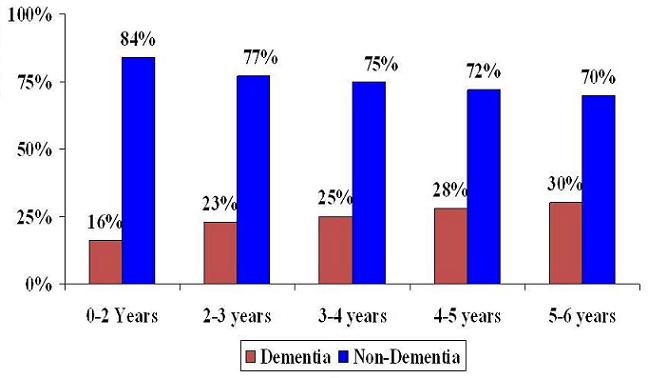 |
| Financial Implications of Dementia Among “Early Claimants” |
|---|
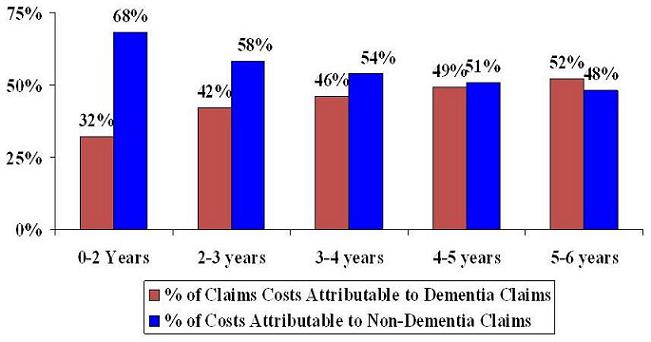 |
| Source: NAIC Experience Reports, 2012 |
| Slightly less than half of new claims have dementia and most receive care in institutional settings |
|---|
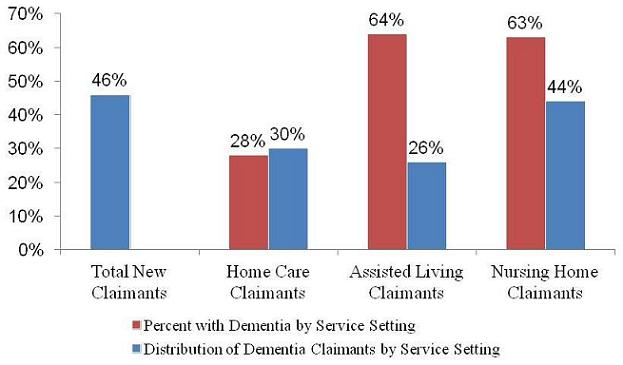 |
| Note: People who are cognitively impaired are 50% less likely to transition between care settings compared to their non-cognitively impaired counterparts. Source: ASPE, 2008 |
| Mortality rates for those with dementia are almost as great as for those with 5-6 ADL limitations 21 months after initial claim |
|---|
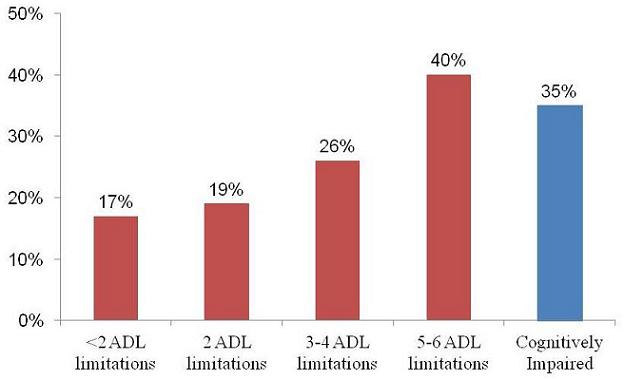 |
| Source: ASPE, 2008 |
Most claimants are well served by companies when it comes to claims payments
- More than $35 billion paid in claims and now >$4 billion per year
- Data suggests that roughly 95% of all claims are paid.
- Of people receiving claims payments, 94% had no disagreement with the insurer and 3% had a disagreement that was resolved satisfactorily.
- Vast majority of claimants indicate that policy benefits met their care needs; 90% felt their policy provided flexibility in service choice.
- The insurance covers a significant percentage of the daily costs of care -- (between 72% and 98%).
- Half of claimants felt that in the absence of their policy, they would have to seek institutional care or would not be able to afford service levels.
- Most people do not find it difficult to file a claim (77%).
Source: U.S. Department of Health and Human Services, 2010
Recent Trends: Significant Market Exit among Major Carriers
| Roughly a dozen companies are still selling a meaningful numbers of policies; in 2002, AHIP reported 102 companies selling policies | |
|---|---|
| Currently Selling | Closed Blocks |
| Genworth Life Insurance Company/ Genworth Life Insurance Company of NY John Hancock (Individual Policies) Bankers Life & Casualty Company Transamerica Life Insurance Company State Farm Mutual Auto Insurance Company New York Life Insurance Company Northwestern Long Term Care Insurance Company Mutual of Omaha Insurance Company Massachusetts Mutual Life Insurance Company Medamerica Insurance Company/ Medamerica Insurance Company of NY Knights of Columbus Thrivent Financial For Lutherans | Unum Life Insurance Company of America First Unum Life Insurance Company Metropolitan Life Insurance Company John Hancock Group Metlife Insurance Company of CT Continental Casualty Company Prudential Insurance Company of America RiverSource Life Insurance Company Allianz Life Insurance Company of North America Senior Health Insurance Company of PA Penn Treaty Aetna Life Insurance Company Lincoln Benefit Life Company Union Security Insurance Company Time Insurance Company Ability Insurance Company United Teacher Assoc Insurance Company American Family Life Assurance Company of Colorado Monumental Life Insurance Company Kanawha Insurance Company CUNA Mutual Insurance Society Physicians Mutual Insurance Company Provident Life & Accident Insurance Company WEA Insurance Corp Guarantee Trust Life Insurance Company Southern Farm Bureau Life Insurance Company WEA Insurance group is still marketing a small number of Partnership policies. |
| Single most Important Reasons that Companies have left the Market: Capital Requirements and Product Performance |
|---|
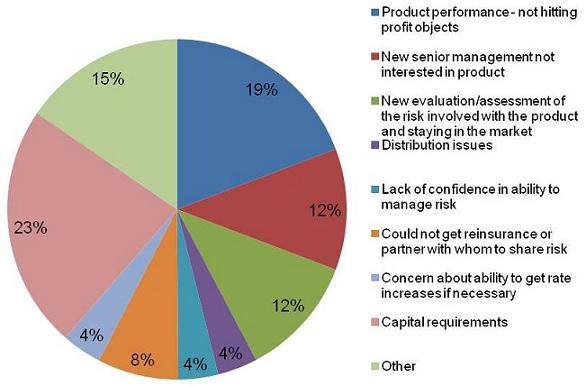 |
| Most companies indicate they are not likely to return to the market |
|---|
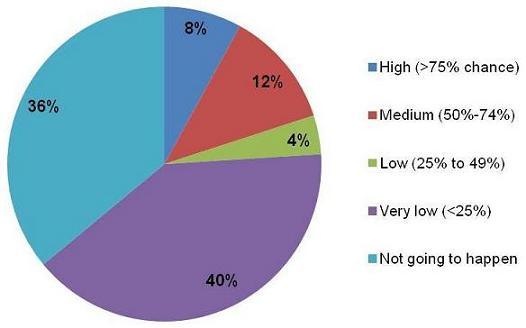 |
| Circumstances under which Company would consider re-entering Market |
|---|
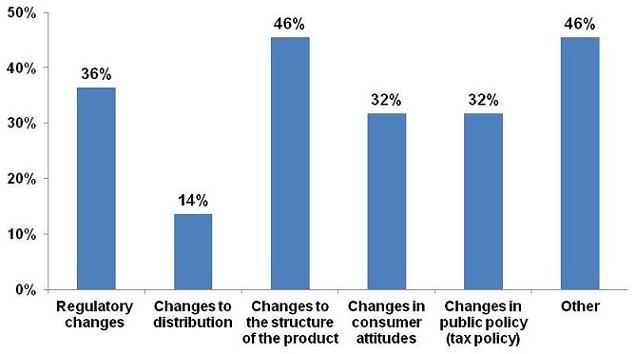 |
Key Demand and Supply Issues in the Market
- Demand
- Lack of information/shrouded attributes
- Misperceptions about need, costs, and coverage
- Myopia
- Consumer confusion/product complexity
- Mistrust of industry/contracts
- Supply
- Adverse selection
- High selling costs
- Inefficient risk-bearing: common shocks
Key Demand and Supply Solutions
- Demand-related
- Simplify/standardize products
- Index premiums
- Educational campaign and warnings
- Expanded employer role
- Mandated availability
- Smart opt-out/ forced-choice
- Targeted subsidy
- Supply-related
- Reinsurance pool
- Expanded employer role
- Joint marketing with health insurance
Conclusions
- By all measures private market is not meeting initial expectations
- Public policy and regulatory approaches should be designed to help the industry “Re-set” to attract middle market buyers:
- Lower the cost of policies,
- Allow greater product funding-flexibility,
- Support new forms of combination-products,
- Encourage strategies that help to minimize risks outside of the control of companies to “de-risk “to lower capital requirements
- Important to provide companies with more certainty around rate relief regulatory policy
Return to
National Alzheimer's Project Act Home Page
Advisory Council on Alzheimer's Research, Care, and Services Page
Advisory Council on Alzheimer's Research, Care, and Services Meetings Page
Files
Document
Mtg9-Slides3.pdf (pdf, 2.08 MB)