
Most Older Adults Are Likely to Need and Use Long-Term Services and Supports
ASPE ISSUE BRIEF
Richard W. Johnson and Melissa M. Favreault
Urban Institute
Judith Dey, William Marton, and Lauren Anderson
Department of Health and Human Services
January 2021
Link to Printer Friendly Version in PDF Format (10 PDF pages)
ABSTRACT: Most Americans underestimate the risk of outliving their financial resources in retirement or experience economic hardship stemming from large, unanticipated health and long-term care costs in later life. Based on microsimulation modeling, this brief shows that more than one-half of adults develop serious disabilities after they reach age 65 and use some paid long-term services and supports (LTSS), such as home care or nursing home care. Older adults who earned relatively little over their lifetimes are most likely to develop a need for LTSS and receive paid LTSS, but the risk of needing care and receiving paid services is high throughout the lifetime earnings distribution.
The full report on which this brief is based is "Economic Hardship and Medicaid Enrollment in Later Life: Assessing the Impact of Disability, Health, and Marital Status Shocks," available at https://aspe.hhs.gov/basic-report/economic-hardship-and-medicaid-enrollment-later-life-assessing-impact-disability-health-and-marital-status-shocks. The DYNASIM projections were developed by Melissa Favreault, Karen Smith, Paul Johnson, Doug Murray, and Damir Cosic at the Urban Institute, with conceptual and modeling help from William Marton and Brenda Spillman. All errors are our own.
This report was prepared under contract #HHSP233201600024I between HHS's ASPE/BHDAP and the Urban Institute. For additional information about this subject, you can visit the BHDAP home page at https://aspe.hhs.gov/bhdap or contact the ASPE Project Officers, at HHS/ASPE/BHDAP, Room 424E, H.H. Humphrey Building, 200 Independence Avenue, S.W., Washington, D.C., 20201; Judith.Dey@hhs.gov, Lauren.Anderson@hhs.gov, Helen.Lamont@hhs.gov.
DISCLAIMER: The opinions and views expressed in this report are those of the authors. They do not reflect the views of the Department of Health and Human Services, the contractor or any other funding organization. This report was completed and submitted on October 2020.
| Most Americans underestimate the risk of outliving their financial resources in retirement or experience economic hardship stemming from large, unanticipated health and long-term care costs in later life. Based on microsimulation modeling, this brief shows that more than one-half of adults develop serious disabilities after they reach age 65 and use some paid long-term services and supports (LTSS), such as home care or nursing home care. Older adults who earned relatively little over their lifetimes are most likely to develop a need for LTSS and receive paid LTSS, but the risk of needing care and receiving paid services is high throughout the lifetime earnings distribution. These findings highlight the need for better planning for LTSS by both families and policymakers. |
Background
Long-term services and supports (LTSS) encompass a variety of health, health-related, and social services that assist individuals with functional limitations. LTSS includes assistance with activities of daily living (ADLs) such as eating, bathing, and dressing and instrumental activities of daily living (IADLs) such as housekeeping and money management over an extended period.
The goal of LTSS is to facilitate functioning among people with disabilities. Most LTSS is delivered by unpaid caregivers (such as family or friends), many of whom struggle to balance their care activities with employment and other family responsibilities (Spillman et al. 2014). This unpaid care is typically referred to as "informal" care. However, paid LTSS provided by paraprofessionals, the focus of this brief, is becoming increasingly important as the availability of family caregivers shrinks. Coming generations of older adults will have fewer children to provide care, and more women in their 50s and 60s, who provide much of the care received by older adults, work outside the home. LTSS are delivered in a variety of settings, some institutional (e.g., nursing homes), and some home and community-based (e.g., adult day services, assisted living facilities, and personal care services) (Thach and Wiener 2018).
Older adults' growing use of LTSS is an important policy issue. The increased demand is largely, although not entirely, driven by the aging of the baby boom generation. The population ages 80 and older, which is most likely to need LTSS, is growing faster than any other age group (Thach and Wiener 2018). As utilization increases, there are important questions about how services will be financed. Neither Medicare nor traditional health insurance covers typical LTSS expenses, and relatively few older adults are covered by private long-term care insurance (LTCI). Consequently, when older adults with disabilities turn to paid helpers because unpaid caregivers are unavailable or LTSS needs exceed what family and friends can provide, they must generally pay for this care out-of-pocket. Some may deplete their savings and enroll in Medicaid if these costs exceed their income. Some studies find that nursing home care often precipitates Medicaid coverage (Borella, De Nardi and French 2017; Keohane, Trivedi and Mor 2017; Spillman and Waidmann 2014, 2015). However, Wiener et al. (2013) find that one-half of older adults who deplete most of their wealth and qualify for Medicaid did not receive any paid LTSS before that point.
Many people do not believe they will ever need LTSS. In a 2014 survey, 43% of respondents ages 40-70 estimated that they had no more than a one-in-five chance of entering a nursing home (Wiener et al. 2015). (As shown below, nursing home use is much more common.) Nonetheless, many older adults worry about the financial consequences of needing care. In a 2017 online survey, 59% of retirees reported that they were very or somewhat concerned about being able to pay for nursing care, 54% were concerned about their ability to pay for health care, and 57% were concerned that their savings and investments might not keep up with inflation (Greenwald and Associates 2018).
Methods
We assess LTSS needs and utilization for older adults and show how these outcomes vary by lifetime earnings. The analysis uses the Urban Institute's Dynamic Simulation of Income Model 4 (DYNASIM4) to estimate health and disability status, LTSS use after age 65, and lifetime earnings. Our sample consists of adults born between 1941 and 1974 who survive to age 65. (Prior ASPE work by Johnson [2019] explored LTSS needs and utilization using historic data rather than projection.)
DYNASIM4 starts with a nationally representative sample of the United States population from the 2004 and 2008 panels of the Survey of Income and Program Participation. It "ages" the population year-by-year, estimating demographic and economic events using transition probabilities and rule-based algorithms. The model's aging rules are based on rich longitudinal data from multiple household surveys, and the health and mortality projections incorporate socioeconomic differences, including those defined by education, lifetime earnings, marital status, and race and Hispanic origin. DYNASIM4 projections reflect compositional changes in the population over the next seven decades. Many outcomes are calibrated to the intermediate assumptions of the 2019 Social Security trustees report (Board of Trustees, Federal Old-Age and Survivors Insurance and Disability Insurance Trust Funds 2019), typically based on age and sex. The report and the projections do not take into account any effects from the 2020 coronavirus pandemic.
Projections of LTSS utilization are based on equations of different types of paid care--home care, nursing home, and residential care--that are estimated jointly and depend on disability severity, other personal and family characteristics, and relative prices. Prices for paid care in DYNASIM4 are based on the state-specific median for each service type (Genworth 2019), with small adjustments based on income, LTCI coverage, and disability severity.
Our analysis focuses on people with serious LTSS needs, which we define as requiring help with two or more ADLs or having severe cognitive impairments. This definition is similar to the eligibility requirement for benefits under tax-qualified LTCI policies as specified in the Health Insurance Portability and Accountability Act of 1996. Estimates of disability prevalence are higher when we include people with less severe disabilities. For LTSS use, the analysis identifies older adults who receive any paid LTSS and any nursing home care. The paid LTSS measures include services paid by any source, including Medicaid, private insurance, and out-of-pocket. Our prevalence estimates consider only outcomes for a given individual; they do not include spousal disabilities or paid LTSS use by spouses.
We report the prevalence of LTSS needs and LTSS use for each fifth of the lifetime earnings distribution, which combines earnings from spouses for married adults. For people who survive to age 65 and reach that age between 2018 and 2022, the earnings cutoff is $1.48 million (in 2020 inflation-adjusted dollars) for the bottom quintile, $2.44 million for the second quintile, $3.43 million for the third quintile, and $4.75 million for the fourth quintile. (The highest quintile includes those with lifetime income that exceeds $4.75 million.) Dividing these figures by 40 to proxy for the number of years in a typical career, we estimate that cutoffs for average annual lifetime earnings are $37,100 for the bottom quintile, $61,100 for the second quintile, $85,690 for the middle quintile, and $118,830 for the fourth quintile.
Results
More than one-half of older adults, regardless of their lifetime earnings, are projected to experience serious LTSS needs and use some paid LTSS after turning 65. More than one-third (39%) will receive nursing home care.
Serious LTSS Needs
Consistent with other literature (e.g., Williams et al. 2010), we find that older adults with limited lifetime earnings are more likely to develop serious LTSS needs than those with more earnings, and limited earners have longer durations of need. Sixty-five percent of older adults in the bottom quintile of the lifetime earnings distribution are projected to develop serious LTSS needs, compared with 57% of those in the second earnings quintile (Figure 1). Moreover, 31% of older adults in the bottom lifetime earnings quintile can expect to experience serious LTSS needs for at least five years, compared with 24% of those in the second earnings quintile.
More than one-half (55%) of older adults in the top fifth of the lifetime earnings distribution develop LTSS needs. In fact, the likelihood of developing serious LTSS needs does not vary much among the second, third, fourth, and fifth earning quintiles. However, adults in the top earnings quintile are less likely than those in the bottom two quintiles to experience serious LTSS needs for five or more years. This projection of people with long-duration LTSS needs is somewhat higher than Johnson's (2019) estimate from historic data, suggesting some shifting over time in disability experience. Baby boomers' experiences with chronic conditions in mid-life and increased life expectancies may contribute to this shift.
| FIGURE 1. Percentage of Older Adults with Serious LTSS Needs After Age 65, by Duration of Need and Lifetime Earnings Quintile |
|---|
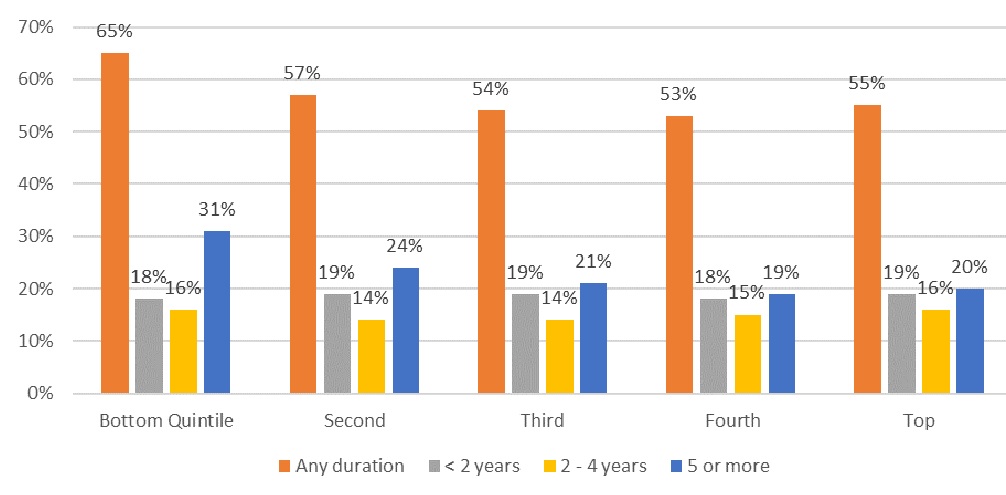 |
| NOTE: Estimates are for adults born between 1941 and 1974 who survive to age 65. |
Paid LTSS
We project that more than half of older adults in every quintile of the lifetime earnings distribution will use paid LTSS at some point after reaching age 65. Paid LTSS use is especially common among older adults with limited lifetime earnings. Sixty-three percent of older adults in the bottom earnings quintile are projected to receive some paid LTSS, compared with 55% of those in the second earnings quintile (Figure 2). This difference likely reflects greater need among those with limited earnings and their higher rates of Medicaid coverage. Older adults near the bottom of the lifetime earnings distribution are also more likely to receive paid LTSS for at least five years than older adults who earned more over their lifetime.
However, paid LTSS does not change much as lifetime earnings increase beyond the second quintile of the distribution. Fifty-six percent of older adults in the top lifetime earnings quintile receive some paid LTSS, a bit more than among those in the middle of the earnings distribution. The percentages for different durations of paid LTSS are also largely the same.
| FIGURE 2. Percentage of Older Adults Who Receive Paid LTSS, by Duration and Lifetime Earnings Quintile |
|---|
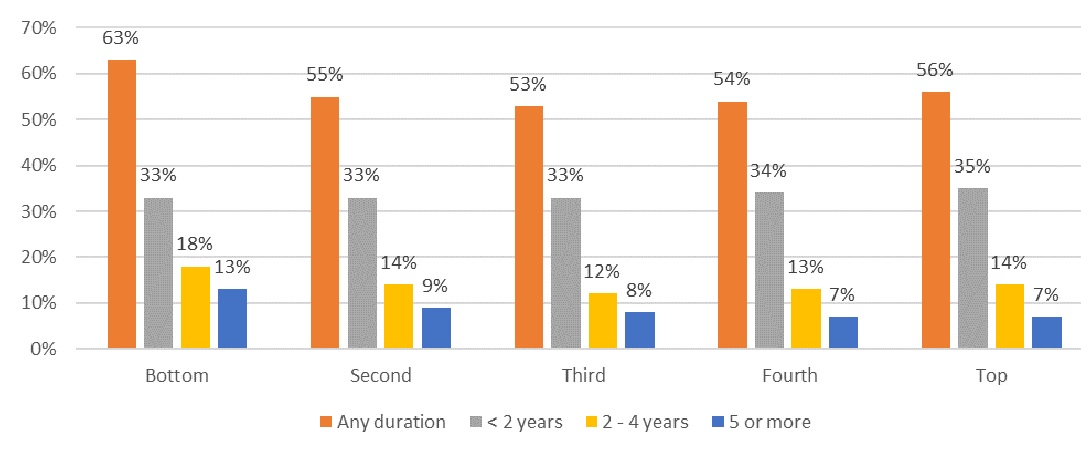 |
| NOTE: Estimates are for adults born between 1941 and 1974 who survive to age 65. The paid LTSS measures include services paid by any source, including Medicaid, private insurance, and out-of-pocket. |
Nursing Home Care
Nursing home care is less common than other types of paid LTSS. Approximately 37% of older adults ever receive nursing home care after turning 65 and 9% receive care for two or more years. Although the likelihood of nursing home care does not vary much by lifetime earnings, as shown in Figure 3, older adults with higher lifetime earnings are more likely than those with lower earnings to receive nursing home care, a reversal of the pattern we observed between earnings and LTSS needs and the use of other types of paid LTSS. Most of the earnings-related increase in nursing home care is driven by relatively short nursing home stays. Thirty-three percent of older adults in the top earnings quintile are projected to receive nursing home care that lasts less than two years, compared with only 25% of older adults in the bottom earnings quintile.
Although not shown here, the source of payment for nursing home care varies depending on lifetime earnings.[1] People in the bottom earnings quintile have relatively high projected rates of nursing home care partly because many qualify for Medicaid, the largest public payer of LTSS. Unlike people with limited lifetime earnings, those with relatively high lifetime earnings generally pay for nursing home care exclusively out-of-pocket or through private insurance unless they deplete nearly all of their savings and later qualify for Medicaid.
| FIGURE 3. Percentage of Older Adults Who Receive Nursing Home Care, by Duration of Care and Lifetime Earnings Quintile |
|---|
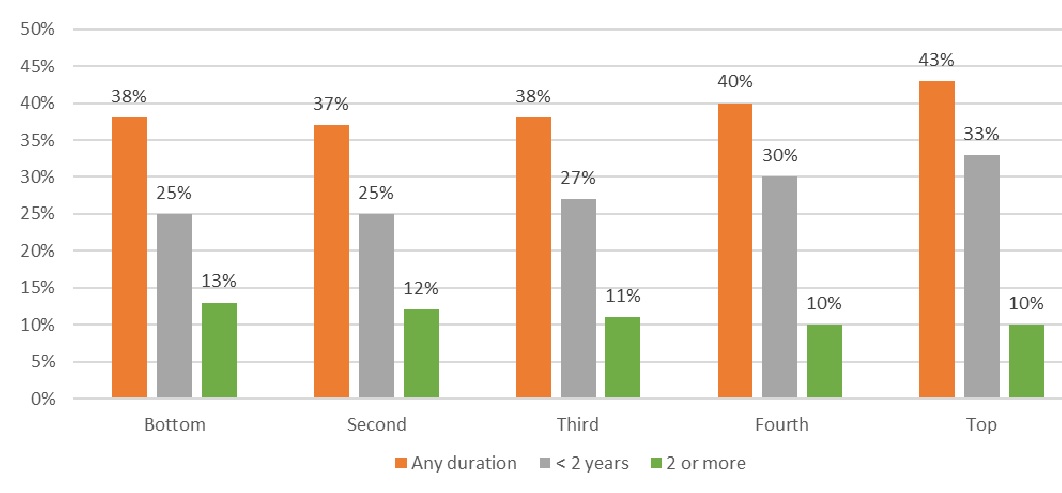 |
| NOTE: Estimates are for adults born between 1941 and 1974 who survive to age 65. |
Conclusion
Most adults develop serious LTSS needs after they reach age 65 and use paid LTSS. Although usage rates are highest among those who earned the least over their careers, paid LTSS use is widespread at all earnings levels. The need for paid LTSS can jeopardize older adults' financial security, because these services are expensive, Medicare does not cover typical LTSS expenses, and few older adults are covered by LTCI. Moreover, few Americans believe they will ever need LTSS and may not prepare for those late-life expenses. These findings highlight the need for better planning for LTSS by both families and policymakers, especially given the projected increase in the population ages 80 and older, who are most likely to use paid LTSS.
Endnotes
-
Please See related ASPE Issue Brief: Extended LTSS Utilization Makes Older Adults More Reliant on Medicaid, available at https://aspe.hhs.gov/basic-report/extended-ltss-utilization-makes-older-adults-more-reliant-medicaid-issue-brief.
References
Board of Trustees, Federal Old-Age and Survivors Insurance and Disability Insurance Trust Funds. 2019. The 2019 Annual Report of the Board of Trustees of the Federal Old-Age and Survivors Insurance and Disability Insurance Trust Funds. Washington, DC: Board of Trustees, Federal Old-Age and Survivors Insurance and Disability Insurance Trust Funds.
Borella, Margherita, Mariachristina De Nardi, and Eric French. 2017. "Who Receives Medicaid in Old Age? Rules and Reality." Fiscal Studies, 39(1): 65-93.
Genworth. 2019. Cost of Care Survey 2019: Median Cost Data Tables. Richmond, VA: Genworth. https://pro.genworth.com/riiproweb/productinfo/pdf/282102.pdf.
Greenwald and Associates. 2018. 2017 Risks and Process of Retirement Survey: Report of Findings. Schaumburg, IL: Society of Actuaries.
Johnson, Richard W. 2019. What Is the Lifetime Risk of Needing and Receiving Long-Term Services and Supports? Washington, DC: U.S. Department of Health and Human Services, Office of the Assistant Secretary for Planning and Evaluation. https://aspe.hhs.gov/basic-report/what-lifetime-risk-needing-and-receiving-long-term-services-and-supports.
Keohane, Laura M., Amal N. Trivedi, and Vincent Mor. 2017. "Recent Health Care Use and Medicaid Entry of Medicare Beneficiaries." Gerontologist, 57(5): 977-986. doi:10.1093/geront/gnw189
Spillman, Brenda, and Timothy Waidmann. 2014. Rates and Timing of Medicaid Enrollment among Older Americans. Washington, DC: U.S. Department of Health and Human Services, Office of the Assistant Secretary for Planning and Evaluation. https://aspe.hhs.gov/pdf-report/rates-and-timing-medicaid-enrollment-among-older-americans.
Spillman, Brenda, and Timothy Waidmann. 2015. Beyond Spend-down: The Prevalence and Process of Transitions to Medicaid. ASPE LTC Financing Colloquium. Washington, DC: U.S. Department of Health and Human Services, Office of the Assistant Secretary for Planning and Evaluation. https://aspe.hhs.gov/report/beyond-spend-down-prevalence-and-process-transitions-medicaid.
Spillman, Brenda C., Jennifer Wolff, Vicki A. Freedman, and Judith D. Kasper. 2014. Informal Caregiving for Older Americans: An Analysis of the 2011 National Study of Caregiving. Washington, DC: U.S. Department of Health and Human Services, Office of the Assistant Secretary for Planning and Evaluation. https://aspe.hhs.gov/report/informal-caregiving-older-americans-analysis-2011-national-study-caregiving.
Thach, Nga T., and Joshua M. Wiener. 2018. An Overview of Long-Term Services and Supports and Medicaid. Washington, DC: U.S. Department of Health and Human Services, Office of the Assistant Secretary for Planning and Evaluation. https://aspe.hhs.gov/basic-report/overview-long-term-services-and-supports-and-medicaid-final-report.
Wiener, Joshua M., Galina Khatutsky, Nga Thach, Angela M. Greene, Benjamin Allaire, Derek Brown, Helen Lamont, William Marton, and Samuel Shipley. 2015. Findings from the Survey of Long-Term Care Awareness and Planning. Washington, DC: U.S. Department of Health and Human Services, Office of the Assistant Secretary for Planning and Evaluation. https://aspe.hhs.gov/basic-report/findings-survey-long-term-care-awareness-and-planning-research-brief.
Williams, David R., Selina A. Mohammed, Jacinta Leavell, and Chiquita Collins. 2010. "Race, Socioeconomic Status, and Health: Complexities, Ongoing Challenges, and Research Opportunities." Annals of the New York Academy of Sciences, 1186(1): 69-101.
Improving Health and Long-Term Care Modeling Capacity
This report was prepared under contract #HHSP233201600024I between HHS's ASPE/BHDAP and the Urban Institute. For additional information about this subject, you can visit the BHDAP home page at https://aspe.hhs.gov/bhdap or contact the ASPE Project Officers, at HHS/ASPE/BHDAP, Room 424E, H.H. Humphrey Building, 200 Independence Avenue, S.W., Washington, D.C., 20201; Judith.Dey@hhs.gov, Lauren.Anderson@hhs.gov, Helen.Lamont@hhs.gov.
Reports Available
Economic Hardship and Medicaid Enrollment in Later Life: Assessing the Impact of Disability, Health, and Marital Status Shocks
- HTML version: https://aspe.hhs.gov/basic-report/economic-hardship-and-medicaid-enrollment-later-life-assessing-impact-disability-health-and-marital-status-shocks
- PDF version: https://aspe.hhs.gov/pdf-report/economic-hardship-and-medicaid-enrollment-later-life-assessing-impact-disability-health-and-marital-status-shocks
Extended LTSS Utilization Makes Older Adults More Reliant on Medicaid Issue Brief
- HTML version: https://aspe.hhs.gov/basic-report/extended-ltss-utilization-makes-older-adults-more-reliant-medicaid-issue-brief
- PDF version: https://aspe.hhs.gov/pdf-report/extended-ltss-utilization-makes-older-adults-more-reliant-medicaid-issue-brief
Most Older Adults Are Likely to Need and Use Long-Term Services and Supports Issue Brief
- HTML version: https://aspe.hhs.gov/basic-report/most-older-adults-are-likely-need-and-use-long-term-services-and-supports-issue-brief
- PDF version: https://aspe.hhs.gov/pdf-report/most-older-adults-are-likely-need-and-use-long-term-services-and-supports-issue-brief
Risk of Economic Hardship Among Older Adults Issue Brief
- HTML version: https://aspe.hhs.gov/basic-report/risk-economic-hardship-among-older-adults-issue-brief
- PDF version: https://aspe.hhs.gov/pdf-report/risk-economic-hardship-among-older-adults-issue-brief
The Risk and Costs of Severe Cognitive Impairment at Older Ages: Literature Review and Projection Analyses
To be posted March 2021 at https://aspe.hhs.gov/bhdap.
Long-Term Services and Supports for Older Americans: Risks and Financing, 2020 Research Brief
To be posted March 2021 at https://aspe.hhs.gov/bhdap.
Projections of Risk of Needing Long-Term Services and Supports at Ages 65 and Older
To be posted March 2021 at https://aspe.hhs.gov/bhdap.
The Risk and Costs of Severe Cognitive Impairment at Older Ages: Key Findings from our Literature Review and Projection Analyses Research Brief
To be posted March 2021 at https://aspe.hhs.gov/bhdap.