
U.S. Department of Health and Human Services
January 2000
PDF Version: http://aspe.hhs.gov/daltcp/reports/icdeltci.pdf (54 PDF pages)
This report was prepared under contract between the U.S. Department of Health and Human Services (HHS), Office of Disability, Aging and Long-Term Care Policy (DALTCP) and LifePlans, Inc. Additional funds were provided by the Robert Wood Johnson Foundation Home Care Research Initiative. For additional information about the study, you may visit the DALTCP home page at http://aspe.hhs.gov/_/office_specific/daltcp.cfm or contact the ASPE Project Officer, Pamela Doty, at HHS/ASPE/DALTCP, Room 424E, H.H. Humphrey Building, 200 Independence Avenue, SW, Washington, DC 20201. Her e-mail address is: Pamela.Doty@osaspe.dhhs.gov.
TABLE OF CONTENTS
- I. BACKGROUND
- II. PURPOSE
- III. METHOD
- A. Data
- B. Sample
- IV. FINDINGS
- A. Profiling Informal Caregivers of Private Long-Term Care Insurance Claimants
- B. The Nature of Informal Care
- C. The Caregiving Experience
- D. Effects of Insurance on Caregiving
- E. Comparing Informal Caregivers of Privately Insured and Non-Privately Insured Community-Dwelling Disabled Elders
- FIGURES
- FIGURE 1: Relationship of Primary Informal Caregiver to Claimant
- FIGURE 2: Distribution of Informal Caregivers by Children
- FIGURE 3: Living Arrangement between ICG and Care-Receiver
- FIGURE 4: Employment Status of ICG by Relationship
- FIGURE 5: Length of Time Since end of Employment among Informal Caregivers by Relationship to Claimant
- FIGURE 6: Length of Time Caregiving
- FIGURE 7: ADL Help Provided by ICGs
- FIGURE 8: Relationship between Care-Receiver Disability Status and Caregiver Identity
- FIGURE 9: IADL Help Provided by ICGs
- FIGURE 10: Severity of Disability and Quantity of Care Provided by Informal Caregiver (weekly hours)
- FIGURE 11: Relationship Between Hours of Care Provided and Type of Helper
- FIGURE 12: Change of Residence among Non-Spousal Informal Caregivers
- FIGURE 13: Impact of Caregiving on Employment among All Informal Caregivers
- FIGURE 14: Whether or not Caregiving Bothers Caregiver
- FIGURE 15: Percentage of Caregivers Living with Care-Receivers Who Experience Stress when Claimant Cannot be Left Alone
- FIGURE 16: Caregivers Assessment as to whether Presence of Insurance Benefits has Affected Stress
- FIGURE 17: Informal Caregiver's Role in Encouraging the Purchase of LTC Insurance
- FIGURE 18: Informal Caregivers' Perceptions about the Impact of Claimants' Policy
- FIGURE 19: How Care has Changed for those Reporting a Change in the Nature of Care Provided
- FIGURE 20: Whether Cash Payment to Informal Caregiver Would Increase level of Caregiving
- FIGURE 21: Whether in Absence of Policy Institutional Alternatives Would be Sought
- FIGURE 22: Weekly Hours of Informal Care Reported by Caregivers
- FIGURE 23: Functional and Cognitive Status of Care-Receiver as Reported by Caregiver
- FIGURE 24: Impact of Informal Caregiving on Employment Status among Working Caregivers by Insurance Status of Care-Receivers
- TABLES
- TABLE 1: Sample Size and Response Rates by Company
- TABLE 2: Socio-Demographic Characteristics of Informal Caregivers of Privately Insured Disabled Elders
- TABLE 3: Effects of Providing Care on Employment among Working Caregivers
- TABLE 4: Specific Effects of Caregiving
- TABLE 5: The Relationship between Caregiver Stress and Functional Disability of Care-Receiver
- TABLE 6: Demographic Characteristics of Surveyed Informal Caregivers of Privately Insured and Non-Privately Insured Disabled Elders Age 65 and Over
- TABLE 7: Percent Agreeing with Statements about Caregiving Stress by Caregiver type and Insurance Status of Care-Receiver
ACKNOWLEDGMENTS
This research could not have been completed without the assistance and guidance of many individuals both inside and outside of the long-term care insurance industry. We would like to gratefully acknowledge the assistance provided by Robert Glowacki, Carolyn Eickenberg, and Sharon O'Dell from Aegon, Roy Christianson and David Rogers from American Travellers, Ray Nelson and Leslie Peters from Bankers Life and Casualty, Carol McBrayer, Melissa Stinson, Steve French and Richard Garner from CNA Insurance, Dan Nitz from Fortis Long-Term Care, Roger Desjardins, Mary Katz and Armando Leiva from G.E. Capital Assurance, Linda Berg-Maney and Peter Bokjov from John Hancock, and Bonnie Davis and Jim DuEst from UnumProvident. All of these individuals devoted a significant amount of time to assure that the sample of home care claimants was representative, that data from administrative systems was uniform and accurate, and that the fieldwork could be completed successfully. We are grateful for their patience and good cheer during the entire research process.
The project's technical advisory group included Susan Morisato, FSA, Bankers Life and Casualty, Bob Yee, FSA, of G.E. Capital Assurance, Christopher Murtaugh, Ph.D., Center for Home Care Policy and Research, Vicki Freeman, Ph.D., Rand Corporation, Randy Brown, Ph.D., Mathematica Policy Research, Inc., Brenda Spillman, Ph.D., Agency for Health Care Policy and Research, Nancy Miller, Ph.D., Health Care Financing Administration. Along with Dr. Laurence Branch of Duke University, the committee provided critical input into the initial design of the project and its sampling strategy.
We would also like to acknowledge the assistance of Beth Jackson, Ph.D., and Laurie Meneades of Medstat in preparation of the 1989 and 1994 National Long-Term Care Survey Datasets.
Finally, we greatly appreciate the patience, guidance, and advice of our two project officers and financial sponsors: Pam Doty, Ph.D., at the Office of Disability, Aging and Long-Term Care Policy of the Department of Health and Human Services, Office of the Assistant Secretary for Planning and Evaluation and Penny Feldman, Ph.D., of the Robert Wood Johnson Foundation Home Care Research Initiative. Their unwavering support and encouragement enabled us to overcome many of the hurdles presented by a study of this magnitude.
Of course the contents of this report are the sole responsibility of its authors. Any errors are the authors alone.
EXECUTIVE SUMMARY
In April 1999, a report entitled "A Descriptive Analysis of Patterns of Informal and Formal Caregiving among Privately Insured and Non-Privately Insured Disabled Elders Living in the Community" was submitted to the Department of Health and Human Services and the Robert Wood Johnson Foundation. The purpose of that report was to provide basic descriptive statistics on disabled policyholders of private long-term care (LTC) insurance who had accessed insurance benefits in the community. Information about these individuals and their service use was compared to similar data among non-insured disabled community-dwelling elders.
As part of the study the primary informal caregivers of these disabled insured claimants were also interviewed. These were the individuals identified by the claimant as helping the most with everyday activities but who did not receive payment for doing so. In the April report, we showed that these individuals continued to provide a great deal of care even as the claimant received substantial amounts of formal (paid) care. Moreover, many of the informal caregivers indicated that they had not reduced the amount of care they were providing to their disabled care-receiver since receipt of insurance benefits. Finally, an overwhelming majority of informal caregivers said that the presence of insurance-financed formal care had reduced the level of stress associated with caregiving.
The focus of the April report was on claimants. The purpose of this supplementary report is to provide more information and greater detail on the primary informal caregivers (ICG) of disabled private LTC insurance policyholders who have accessed long-term care benefits and are living in the community. We also compare key characteristics of these individuals to informal caregivers of non-privately insured disabled elders.1 Caregiver effort expended on privately insured and non-privately insured disabled community-dwelling elders is measured as well. Finally, we evaluate caregiver perceptions regarding the value of the LTC insurance policy and summarize and discuss the implications of findings.
Key findings are presented below.
The Demographic Profile of Informal Caregivers
-
Informal caregivers of privately insured disabled elders are often elders themselves, are well educated, typically female, and people who generally enjoy high economic status.
-
A large number of ICGs are married to their care-receivers. The majority of informal caregivers for the privately insured are spouses, whereas for the non-privately insured, relatives other than a spouse provide the bulk of care.
-
Whether or not formal care substitutes for informal care is related to the demographics of the caregiver. For adult children it is more common for formal care to substitute for informal care, but this is not generally the case for spouses.
-
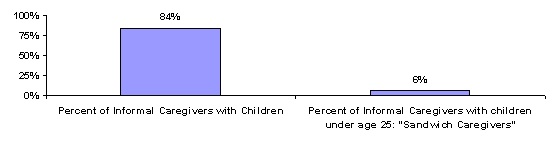
A mere 6% of caregivers of the privately insured has children under the age of 25 living in their homes. Thus, while the problems of the "sandwich" caregivers are important and socially significant, it must be emphasized that this group is not a substantial component of this sample of informal caregivers.
The Care Provided by Informal Caregivers
-
The majority of the caregivers in our sample reported that they have been providing informal care to the insured for four years or less (83%), with most saying they have provided care for between two and four years (69%).
-
On average, ICGs help claimants with 2.6 ADLs. As the severity of ADL dependency increases (i.e. more ADLs), the likelihood that a spouse will be the ICG increases. Only 30% of non-spousal ICGs care for claimants with five or six ADLs, compared to 40% of spousal ICGs in that category.
-
Caregivers provide an average of 39 hours of help per week, with a median of 24 hours. For those ICGs that were working more than 30 hours per week, this average drops to 19 hours of help per week with a median of 12 hours.
-
Spousal ICGs caring for severely disabled claimants (e.g. those with five to six ADL limitations) are much more likely to provide 40 or more hours per week of care than are children caring for similarly disabled individuals -- 56% versus 18%.
-
Paid helpers provide complementary help to unpaid caregivers. Where the ICG is providing eight hours per week or less of ADL help, paid help also tends to be low. Where the ICG is providing large amounts of ADL help there are more frequent uses of paid help for large blocks of time.
Employment Status
-
Thirty-five percent (35%) of informal caregivers of privately insured disabled elderly are currently working.
-
Only 10% of spousal ICGs were currently employed, while employment was much higher among child and child-in-law ICGs -- about two in three.
-
The average weekly hours worked for employed ICGs was 38.
The Impact of Caregiving on Employment
-
The effects of caregiving on the employment of ICGs are pervasive and wide-ranging. The responsibility of providing care for a disabled elder does not mean that one simply leaves the labor force or fails to enter it. It also affects the amount of time one is able to work, the quality of work one is capable of performing, whether or not one can search for a new job or even whether one can seriously consider the offer of a new job.
-
About 7% of all respondents (and 18% of child ICGs) indicated that they had stopped work in order to take care of the disabled claimant.
-
About two-in-five working caregivers said they are currently working fewer hours due to caregiving and two-in-five non-working caregivers indicated that at some point in the past, they had worked fewer hours per week than they would have liked because they were helping the claimant.
-
Forty percent (40%) also stated that they had to take time off without pay with an average of 17 days of work missed per year due to caring for a disabled elder. This represents about 8% of the work year. The average earnings of these employed caregivers are $67,417. Thus, these lost workdays translate to lost earnings of $5,393 per year.
-
About 85% of those who were employed answered that they had at some time had to rearrange their job schedule because of caregiving responsibilities.
-
Sixteen percent (16%) reported that caregiving had kept them from looking for a job and another 11% had to turn down a job because of the care that they were providing. For spousal ICGs, those who had been kept from looking or who had to turn down a job was less than 10%, but 27% of child ICGs had been kept from looking and 20% had had to turn down a job.
The Impact of Caregiving on Emotional Well-being and Stress
-
More than half of the informal caregivers (58%) responded that caregiving bothered them.
-
Over half (55%) stated that they do not sleep through the night as a result of providing care. If one only looks at the instances where the caregiver and care-receiver are living with one another, 66% of caregivers say that their sleep is interrupted because of the care they provide.
-
Providing care has more of an emotional effect on caregivers than physical although about one-quarter of the respondents agreed that caring caused their health to get worse.
-
Most informal caregivers reported that caregiving is hard on them emotionally and limits their privacy and social or free time. Moreover, many feel that the care-receiver needs medical care that they cannot provide and that they have to provide the care-receiver with constant attention.
Comparing Informal Caregiving of Privately Insured and Non-Privately Insured Community-Dwelling Disabled Elders2
-
Informal caregivers of the privately insured disabled tend to be older, more highly educated, and enjoy higher incomes than their counterparts caring for the disabled without private insurance. Moreover, they are more likely to be married.
-
Informal caregivers of the privately insured disabled are about four times more likely to be employed than are those caring for non-privately insured disabled elders -- 35% compared to 9%.
-
Caregivers caring for disabled individuals without private insurance are more likely to live with them. There is also a greater likelihood that these caregivers are adult children, many of whom are unmarried.
-
On average, informal caregivers of the privately insured report providing about 40 hours a week of assistance compared to about 42 hours for those caring for non-privately insured disabled elders.
-
Among employed caregivers, those caring for the privately insured are more likely to have to take time off without pay, to have to rearrange their work schedule to accommodate the care needs of the care-receiver, and have had to quit a job to continue to provide care.
Impact of Private Long-Term Care Insurance on Caregiving
-
About two-in-three caregivers indicated that the presence of insurance-financed formal care has reduced their general stress level.
-
In the presence of insurance benefits, roughly two-in-three informal caregivers have not reduced the level of care that they provide.
-
For most informal caregivers, formal care does not substitute for informal care. This was true across types of caregivers and across severity of disability.
-
About half (47%) indicated that in the absence of the private insurance to pay for home care services, the care-receiver would have to seek institutional alternatives.
Conclusions
One of the most important findings of this study is that despite caring for very disabled elders, many caregivers of privately insured care-receivers are able to continue to work, especially adult children caregivers. While they may continue to experience inconveniences (e.g. having to rearrange their schedule, missing days of care, and others) they have not had to drop out of the labor force completely.
The differences in care provision and caregiving experience between spousal and non-spousal caregivers is stark. For the most part, spousal caregivers care for the most disabled claimants, provide more weekly hours of care, and provide much more hands-on assistance with basic activities of daily living. Even when the disability level of the care-receiver is held constant, spousal caregivers provide much more care than do non-spousal caregivers. Not surprisingly, they also experience greater emotional stress.
Informal and formal caregiving appear to be complementary. The presence of insurance-financed formal care does not significantly reduce the magnitude of caregiver effort. This effort does entail certain self-perceived health risks. Roughly one-quarter of caregivers indicated that their health had worsened as a result of their caregiving activities. How to minimize such risks should be an important component of caregiver training and support.
Not captured by the quantitative data are the individual experiences of caregivers themselves. While caregivers indicated that the presence of insurance does reduce their general level of stress they continue to experience daily difficulties even when significant amounts of formal care are provided. Many respondents just wanted to have the ability to talk to someone about their caregiving experience. They also indicated that they could use additional information about how to be more effective and how to cope with the daily stresses of caregiving. Finally, many indicated that they were not adequately prepared to provide care. The implication is that even when private insurance is available to finance significant amounts of care, ongoing support for informal caregivers is needed. Such support needs to address the emotional, and for some, the physical aspects associated with caregiving.
I. BACKGROUND
The population of Americans who require or are at risk of requiring help with personal care and other daily functional tasks is growing rapidly. This is primarily due to the growth rate of the elderly population -- especially those aged 85 and older. The proportion of the elderly requiring personal assistance ranges from 9% of those aged 65 to 69 to well over 50% of those aged 85 and over (U.S. Census Bureau, 1998). Between 1990 and 2000 alone, the U.S. population aged 65 and older grew by 12%, and the population aged 85 and older by 50%. This population growth among persons at high risk of disability cannot help but create a rising demand for long-term care (LTC) services.
LTC expenditures (i.e. expenditures on nursing homes and related facilities, in-home registered nurse and home health aide visits, and other home and community-based services) now account for almost 12% of total personal health expenditures -- a three-fold increase since 1960. Among people aged 65 and older, LTC expenditures account for 28% of personal health expenditures (21% for nursing home services and 7% for home and community-based care). This percentage is especially noteworthy given that only one-in-four older Americans with functional disabilities reside in nursing homes and related facilities. Among disabled elders who continue to reside in the community, two-thirds use no formal (paid) LTC services at all, relying exclusively on the informal (unpaid) help provided by family, friends, and neighbors.
Many studies have attempted to profile these informal helpers of disabled elders (See: Penrod, Kane, R.A., Kane, R.L. & Finch, 1995; NAC, 1998; Tennstedt, 1999) and more recently, to estimate the cost or value of unpaid caregiving. One recent study estimates the economic value of informal caregiving to be close to $200 billion per year (Arno, 1999). It stands to reason that with the growing elderly population and a public that is reluctant to pay for LTC, the likelihood of caring for an elderly relative or friend will also increase. Currently, about one-in-four households are providing some form of care to an ill or disabled relative (NAC, 1997).
Not surprisingly, informal caregiving is gaining widespread recognition and support among policymakers and practitioners alike. In his 1999 State of the Union message, President Clinton recommended that in recognition of the financial burden imposed by informal caregiving, a tax credit of up to $1,000 per year be available to those caring for disabled relatives.
In the past, studies have looked at who is providing informal care and the various effects caregiving has on them physically, emotionally and financially. One of the most common critiques of prior research is that it attempts to understand the caregiver independent and often irrespective of the care-receiver (Barer & Johnson, 1990). When trying to get an overall picture of caregiving, it is important not only to gather information about the caregiver, but to understand in detail the characteristics of the care-receiver as well. This is because the caregiving experience is intimately linked to the health and functional status of the care-receiver. Additionally, few studies have looked closely at important subgroups like male and female caregivers, those with public or private insurance, or caregiving across racial or ethnic groups.
Most disabled elders prefer to remain living at home instead of moving to an institution or facility. The recent growth in the private LTC insurance market and the increasing popularity of policies covering home and community-based care, has made remaining at home longer a more realistic possibility for those who have such insurance. Currently, more than 6 million policies have been sold to individuals, primarily age 65 and older. While some studies have looked at the experience of informal caregivers of disabled elders in the general population, not much is known about informal caregivers of disabled elders with private LTC insurance. For example, we do not know how a disabled person's having access to insurance benefits that pay for home health aides and other personal care workers affect the level of support or overall experience of their informal caregivers of these privately insured disabled elders. It is the objective of this study to investigate the identity, behavior, and attitudes of informal caregivers of disabled and privately insured elders.
The current study of informal caregivers is part of a larger study on Long-Term Care Insurance Claimants, funded by the Office of the Assistant Secretary for Planning and Evaluation (ASPE), Office of Disability, Aging and Long-Term Care Policy and the Robert Wood Johnson Foundation. The principal report was completed in April 1999 and is entitled: "A Descriptive Analysis of Patterns of Informal and Formal Caregiving among Privately Insured and Non-Privately Insured Disabled Elders Living in the Community." The overall study can be separated into a number of components, but three are fundamental: LTC insurance claimants who reside in the community, LTC insurance claimants who reside in institutional settings and informal caregivers. There are many elements that connect these three groups, but attention to the individual pieces is essential. It is only by focusing separately on each of these three groups that one can get a clear view of who they are, what their attitudes are, and how they behave in an insured context.
The impact of LTC insurance on behavior is a puzzle. We know relatively little about how people will react and respond to the presence of such insurance, and to the payment of benefits resulting from claims under the insurance. The behavior of informal caregivers associated with LTC insurance claimants is a key piece of that puzzle. In most cases the experience of informal care is one that is outside the environment of LTC insurance. What we call informal care is the type of care, which has been fairly traditional in nature, that is, care provided by family and friends. Formal care, or paid care, is more the innovation.3 What we know about informal caregivers and the care they provide, from an uninsured environment, is not very helpful in predicting the care provided in an insured environment.4
The informal caregivers studied in this report are unique in a number of ways: they are caregivers of people who would be willing (and, not unimportantly, able) to purchase LTC insurance; they were providing care following the commencement of insurance benefits and probably prior to that flow of benefits; and, they are all currently providing care to disabled elders.
Of course these informal caregivers are unique in another fundamental way -- they are the roughly four hundred people being studied. They are people with individual qualities, qualifications, and characteristics.
II. PURPOSE
The purpose of this report is to provide basic descriptive statistics on the primary informal caregivers (ICG) of disabled private LTC insurance policyholders who have accessed LTC benefits and are living in the community. We also compare key characteristics of these individuals to informal caregivers of non-privately insured disabled elders. In this report we:
- provide a profile of informal caregivers of disabled privately insured claimants and compare them to a profile of informal caregivers of non-privately insured disabled individuals;
- measure caregiver effort on behalf of privately insured community-based claimants and compare this to caregiver effort for disabled non-privately insured elders living in the community;
- evaluate caregiver perceptions regarding the value of the LTC insurance policy; and
- summarize and discuss the implications of findings.
III. METHOD
A. Data
Sources of Information
The initial data for the study is a database consisting of privately insured disabled elders. Eight of the largest LTC insurance companies in the U.S. participated in the study and each contributed a sample of claimants residing in the community. These companies also provided data from their administrative and claim systems to supplement information collected directly from claimants. The claimants themselves identified their ICG as part of a personal interview.
The participating companies included: (1) Aegon; (2) American Travellers; (3) Bankers Life and Casualty; (4) CNA Insurance; (5) Fortis Long-Term Care; (6) G.E. Capital Assurance; (7) John Hancock; and (8) UnumProvident. Together their claimant blocks represent more than 80% of all open home health care claims and nursing home claims.5 These companies represent diverse market segments and policy designs, and employ differing underwriting and claims management strategies.
Data Collection
Data from all privately insured home care claimants were gathered via in-person interviews conducted by trained nurses and social workers with at least two years of geriatric experience. We collected information from informal caregivers via telephone interviews. Clinical nurses specializing in the field of geriatrics conducted these telephone interviews, which typically took between 20 and 30 minutes to complete. Each interviewer underwent extensive training on the survey instrument to assure interrater reliability. The research team completed all fieldwork between November 1997 and February 1999.
It is important to note that each completed survey underwent a detailed quality review. In some cases, surveys had to be returned to the interviewer either because certain data elements were not complete or because of the presence of data discrepancies. While time consuming, this process led to the collection of reliable and accurate self-reported information.
B. Sample
Our sample of informal caregivers is derived from the sample of LTC insurance claimants living in the community. To be included in the claimant sample, individuals had to meet the following criteria:
- They had to be at least 65 years old;
- They had to be classified as an active claimant by the insurance company, having already received at least one payment for home/community-based services;
- They had to be living in the "community" (i.e. not living in an institution such as assisted living or nursing home); and
- They had to have a policy that covered both nursing home care and home care.
As part of the interview, claimants were asked a series of questions about helpers who provided services to them. Specifically, they were asked, "Who is the person that regularly helps you the most with your everyday activities but does not receive monetary payment for doing so?" The helper thus identified is treated as the ICG. This information was also verified with the identified ICG at the time that we arranged for the phone interview. The proportion of the claimant population that identified someone as their ICG was 77%. Of the 461 ICGs that we reached by telephone, 424 or 92% participated in the study.
Response Rates
Table 1 displays the response rates by the insurance company for the informal caregivers who were located and contacted. As shown, we achieved high response rates for this analytic sample. The lowest response rate for a particular company was 83% and the highest was 95%.
| TABLE 1. Sample Size and Response Rates by Company | |||
| Company | Analytic Sample | Response Rate | |
| Company 1 | 61 | 95% | |
| Company 2 | 24 | 83% | |
| Company 3 | 97 | 96% | |
| Company 4 | 39 | 88% | |
| Company 5 | 44 | 85% | |
| Company 6 | 48 | 94% | |
| Company 7 | 55 | 95% | |
| Company 8 | 56 | 92% | |
| Total | 424 | 92% | |
| SOURCE: 1999 Supplemental Informal Caregiver Survey.NOTE: These are the response rates among individuals who were successfully located and contacted. Even when we classify those who could not be located/contacted as "non-responder," the response rate among informal caregivers is 82%. | |||
IV. FINDINGS
A. Profiling Informal Caregivers of Private Long-Term Care Insurance Claimants
Demographic Characteristics
Table 2 provides a detailed look at the demographic profile of informal caregivers for privately insured claimants. It is important to note that the care-receivers (or claimants) were the ones who identified the ICGs. In most other studies of informal caregiving, the caregiver is self-selected; that is, the caregiver is responsible for identifying himself or herself as the person who provides unpaid care.6
As shown, these caregivers are well-educated, typically female, and people who generally enjoy relatively high economic status. These characteristics are similar to those of the population that tends to purchase LTC insurance.7 The ICGs ranged in age from 32 to 92, with an average age of 65. Although the range of ages is wide, there was a concentration of ICGs who were in their seventies and eighties. This is most likely due to the fact that most (53%) of ICGs are spouses of disabled claimants (see Figure 1). When looking at only non-spousal ICGs, the age range was 32 to 88, with an average age of 53. Although most caregivers are female, the number of male informal caregivers is also substantial. Traditionally, informal caregivers are thought to be female -- daughters or daughters-in-law. The fact that the majority of ICGs were spouses and that the majority of claimants (68%) were females might account for the large number of males.
Eighty-one percent (81%) of ICGs are married. This is somewhat misleading, though, because so many ICGs are spouses of claimants. If one focuses exclusively on the non-spousal ICGs, only 57% are married. The marital status of ICGs who are children of claimants is also relevant. Sixty-two percent (62%) of daughter ICGs are married, but only 51% of sons who are ICGs.
| TABLE 2. Socio-Demographic Characteristics of Informal Caregivers of Privately Insured Disabled Elders | |
| Socio-Demographic Characteristics | Informal Caregivers of all Privately Insured Home Care Claimants |
| Average Age | 65 years* |
| Gender | |
| Male | 40% |
| Female | 60% |
| Marital Status | |
| Never Married | 9% |
| Married | 81% |
| Divorced/Separated | 8% |
| Widowed | 2% |
| Education Level | |
| Less than High School Graduate | 6% |
| High School Graduate | 18% |
| Technical/Trade/Business/Some College | 26% |
| College Graduate | 28% |
| Graduate | 23% |
| Race | |
| White (not Hispanic) | 96% |
| Non-White | 4% |
| Total Income | |
| <$30,000 | 25% |
| >$30,000 | 75% |
| SOURCE: 1999 Supplemental Informal Caregiver Survey (n=424). 328 respondents reported income data.* The average age of all non-spousal caregivers is 53. The majority of informal caregivers in our sample are spouses and our age criterion for home care claimants was 65 and over. | |
Relationship of Informal Caregivers to Claimants
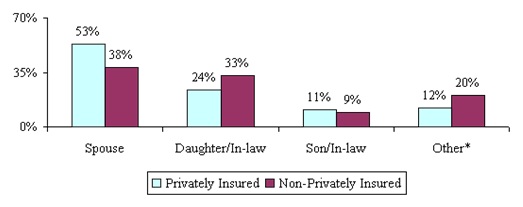
Figure 1 identifies the relationship of the ICG to the claimant. Also included for comparative purposes is data identifying the relationship of informal caregivers to disabled non-privately insured elderly in the general population.8
The protocol for identifying the ICG is the same for both samples.
| FIGURE 1: Relationship of Primary Informal Caregiver to Claimant |
 |
| SOURCE: 1999 LifePlans National Claimant Study (n=424) and 1994 NLTCS data (n=1209).NOTE: Other refers to other male or female relatives (i.e. sister/brother) or other non-relative (i.e. friends or neighbors). |
A number of factors enter into the determination of who serves as the ICG. Because the ICG identified is the person who helps the most, the amount of time available on the part of the caregivers matters. Similarly, geographic proximity to the claimant matters. A third factor of substantial importance is willingness to provide care without reimbursement or pay. The ICG would most likely be someone who cares a great deal about the well being of the claimant. All of these considerations lead one to suspect that the marital status of the claimant would play the most important role in the determination of the identity of the ICG. If a claimant is married, it is reasonable to expect that the spouse will be the ICG. (That is, marriage is a pre-condition to having a spouse as primary ICG, but it is not the only factor.) As is apparent, the most common connection between caregiver and claimant is marriage.
It should be pointed out that the proportion of married disabled individuals in the two samples is similar. Thus, it is striking to note that the majority of informal caregivers for the privately insured are spouses, whereas for the non-privately insured, it is relatives and others rather than a spouse that provide the bulk of care. Still, spouses represent the single largest category of informal caregiver for both groups. Put simply, marital status is the principal determinant of who will be the ICG. This finding may indicate that in the insured environment, if formal care does substitute for informal care the substitution could be selective. That is, it appears as if the formal care financed by insurance benefits may substitute for the care provided by adult children but not necessarily for the care provided by a spouse. This accords with previous research indicating that a primary motivation for the purchase of private LTC insurance is to "...avoid being a burden on family members" (Cohen & Kumar, 1996). Data here suggests that the family members on whom disabled elders do not want to be a burden are adult children, typically daughters and daughters-in-law.
The pattern of relying on a spouse for caregiving holds up even when one focuses exclusively on claimants with living children. For married claimants with children, 89% identified their ICG as their husband or wife, and 10% identified a child as ICG. By contrast, for widow(er)s and divorced claimants with children, 86% of the ICGs were their children.
It is not unusual for caregivers to have responsibilities for both someone older than they are and someone younger. The common concern in this regard is for ICGs who must look after a parent and one or more children. Figure 2 shows that 84% of all ICGs have children. Typically, these ICGs have two children. Obviously, there is concern with these so-called "sandwich" caregivers who may be called upon to care for both parents and children. Yet, among the privately insured, a mere 6% have children under the age of 25 living in their homes. In a recent study of 1,509 caregivers, 41% had children under age 18 in the household (NAC, 1997).9 Thus, while the problems of the "sandwich" caregivers are important and socially significant, it must be emphasized that this group is not an important component of this sample of ICGs caring for the privately insured.
| FIGURE 2: Distribution of Informal Caregivers by Children |
 |
| SOURCE: 1999 Supplemental Informal Caregiver Survey (n=424). |
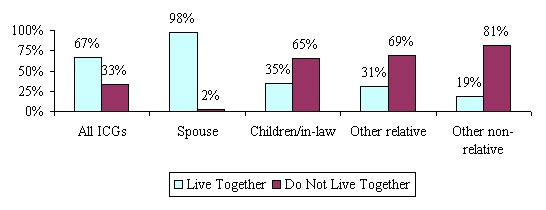
More than two-thirds of the informal caregivers in our sample report that they live with the person for whom they are providing care (see Figure 3). Since most informal caregivers are the spouses of the care recipient, one would expect this. When the ICG is someone other than a spouse, only about one-third co-reside with the disabled individual. Where the ICG is a child or child-in-law 35% live with their disabled parent, and where the ICG is some other relative (i.e. sister/brother or grandchild) 31% co-reside.
| FIGURE 3: Living Arrangement between ICG and Care Receiver |
 |
| SOURCE: 1999 Supplemental Informal Caregiver Survey (n=420). |
This prevalence of residency among the insured sample is still fairly high as compared to the general population of all informal caregivers of disabled elders and non-elders alike. The National Association of Caregivers (NAC) reported that only about 25% of care-receivers live with the person who is caring for them (NAC, 1997).
Employment Status of Informal Caregiver
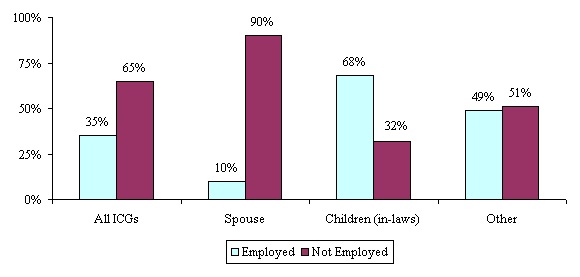
There has been much written, particularly recently, on caregiving and employment (See Arno, et al, 1999; MetLife, 1999). One can imagine that working full-time and providing care to a disabled elder can take a toll on a person's work and personal life. Informal caregivers in our sample were asked a variety of questions about their employment status and history. Participants were asked if they are currently working for pay at a job or business. Only 35% of informal caregivers of privately insured disabled elderly are currently working. This is not surprising given that the average age of caregivers in our sample is 65.
Figure 4 shows the breakdown of employment status by the nature of the relationship between the ICG and the claimant. As shown, only 10% of spousal ICGs were currently employed, while employment was much higher among child and child-in-law ICGs -- about two-in-three.
Caregivers who were currently working reported their usual amount of work per week. Most of the working ICGs were employed at or close to full-time. Only 22% were working less than 30 hours per week. The average number of hours worked by employed ICGs was 38.
| FIGURE 4: Employment Status of ICG by Relationship |
 |
| SOURCE: 1999 Supplemental Informal Caregiver Survey (n=421). |
A series of questions was asked of caregivers who were not currently in the workforce. Most of those who were not currently employed had worked at some time in the past. Only 6% indicated that they had never worked for pay. However, for many of those who had worked previously, their last job had ended some time ago. Half of those not currently employed had stopped working ten or more years prior to the interview. The range of responses to the question of when the ICG had stopped working is shown in Figure 5.
| FIGURE 5: Length of Time Since End of Employment among Informal Caregivers by Relationship to Claimant |
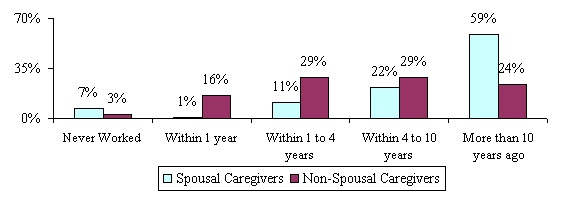 |
| SOURCE: 1999 Supplemental Informal Caregiver Survey (n=276 non-working ICGs). |
It is important to note that although most spousal ICGs had worked previously, they had stopped working at least ten years earlier. Child ICGs who were not working had typically ended their employment more recently: 40% had stopped working within the last two years and 24% had stopped within the last year.
The main reason given by spousal ICGs for having ended employment was retirement. The reasons given by child ICGs were much more varied, with the largest number responding either "to retire" or "to take care of home and family." Only 7% of all respondents (and 18% of child ICGs) indicated that they had stopped work in order to take care of the disabled claimant.
B. The Nature of Informal Care
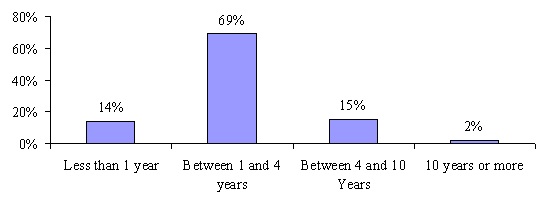
As shown, for the most part, ICGs of privately insured community-based claimants are spouses and adult children. It is important to examine the kinds of activities these helpers help with and how much and how long they have been helping. As shown in Figure 6, the majority of the caregivers in our sample reported that they have been providing informal care to the insured for 4 years or less (83%), with most saying they have provided care for between one and four years (69%).10 Also noteworthy is the fact that about half of caregivers have increased the amount of care they provide to the claimant since the onset of disability. This likely reflects the continued decline in functioning of the care-receiver.
| FIGURE 6: Length of Time Caregiving |
 |
| SOURCE: 1999 Supplemental Informal Caregiver Survey (n=422). |
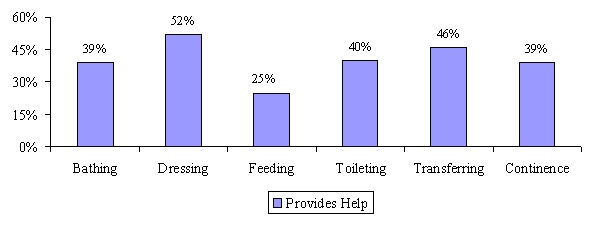
We also asked the primary ICGs about the specific Activities of Daily Living (ADLs) and Instrumental Activities of Daily Living (IADLs) they helped the claimant to perform. Figure 7 shows a breakdown of help by the claimant's specific ADL limitation.
| FIGURE 7: ADL Help Provided by ICGs |
 |
| SOURCE: 1999 Supplemental Informal Caregiver Survey (n=424). |
On average, ICGs help claimants with 2.6 ADLs. The average number of reported ADL limitations experienced by claimants was 3.3. The difference in the number of ADLs for which care is being supplied and received -- .7 ADLs -- suggests the involvement of formal caregivers to make up the difference or that needs are not being completely met. The most common activities that informal caregivers help with are dressing (52%) and transferring (46%). Note that these activities require the least amount of professional training and may be less intrusive from a privacy perspective.
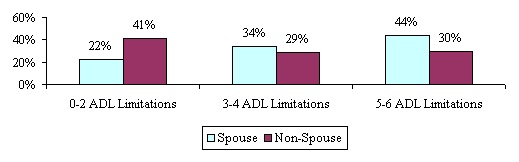
Figure 8 displays the association between the number of ADL limitations requiring assistance and the identity of the ICG. ADL limitations are broken into three groups: less than three, three or four, and more than four. As shown, as the severity of ADL dependency increases (i.e. more ADLs), the likelihood that a spouse will be the ICG increases.
Only 30% of non-spousal ICGs care for claimants with five or six ADLs, compared to 40% of spousal ICGs in that category. A likely explanation for this is that non-spousal caregivers, who typically do not live with the disabled care-receiver, would be unable to provide the time needed to care for someone with five or six ADLs. In contrast, spousal caregivers can more successfully maintain a severely disabled individual in the home. A disabled elder with a spouse can remain at home more easily given the attention of the spouse. Such attention would not be as readily available to unmarried claimants. Thus, compared to spousal caregivers, non-spousal caregivers are more likely to care for less disabled individuals. There was no particular association of ICG type with the presence of cognitive impairment among care-receivers.
| FIGURE 8: Relationship between Care-Receiver Disability Status and Caregiver Identity |
 |
| SOURCE: 1999 Supplemental Informal Caregiver Survey (n=424). |
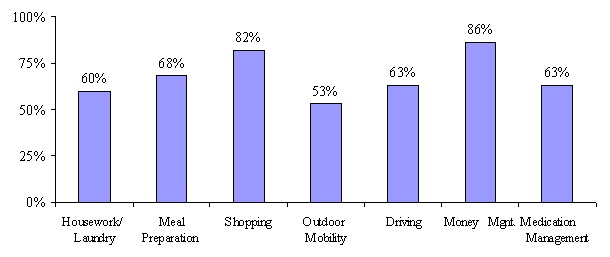
One could imagine that informal caregivers would be more likely to help with activities around the house, tasks that perhaps they have been doing for some time, or activities that they may have to do for themselves anyway. As shown in Figure 9, this is in fact the case; money management, grocery shopping and meal preparation are the most common activities performed by ICGs on behalf of the disabled care-receiver. ICGs help with an average of 4.7 IADLs.
If an ICG said that he or she helped with a particular activity, additional questions were asked to determine how often and how much time the activity required. For each activity, ICGs identified how many days in the past week they assisted and how many hours per day. On average caregivers provide care six days per week. Caregivers were also asked a general question regarding the number of hours they regularly help in one week. This measure could also include time spent just being with the insured (i.e. companionship) or doing other activities related to expressive needs, not necessarily related to direct ADL or IADL care. For this question, all ICGs reported an average of almost 39 hours of help provided per week, with a median of 24 hours. For those ICGs that were employed more than 30 hours/week, this drops to 19 hours of help provided per week with a median of 12 hours.11
| FIGURE 9: IADL Help Provided by ICGs |
 |
| SOURCE: 1999 Supplemental Informal Caregiver Survey (n=424). |
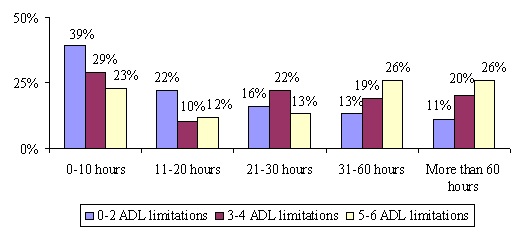
It is reasonable to expect that greater levels of disability will be associated with more care. In Figure 10 the data displayed describe the relationship between the number of ADL limitations and the amount of care (in hours per week) provided by the ICG. Consider claimants who can function independently in only three or fewer ADLs. More than 60% of their ICGs provide 20 hours per week or less of care. By comparison, over half of the ICGs who assist claimants with five or six ADLs provide over 30 hours per week of care.
The same pattern persists for claimants suffering from cognitive impairment. Caregivers of the cognitively impaired spend much more time providing care than do caregivers of the cognitively intact. In fact, about 42% of the ICGs caring for cognitively impaired individuals spend more than 40 hours per week doing so; this compares to about 30% of the ICGs providing care to the cognitively intact.
| FIGURE 10: Severity of Disability and Quantity of Care Provided by Informal Caregiver(weekly hours) |
 |
| SOURCE: 1999 Supplemental Informal Caregiver Survey (n=420). |
In Figure 8 and Figure 10, we looked at the relationship between the identity of the ICG, the quantity of care, and the severity of disability. Do different ICGs offer differing amounts of care? If spouses are more likely to care for severely disabled claimants, it would seem likely that they would also offer more hours per week of care. But will spouses who care for the severely disabled offer more hours per week of care than children or others that provide care for the severely disabled? The answer is yes. Spousal ICGs caring for severely disabled claimants (e.g. those with five or six ADL limitations) are much more likely to provide 40 or more hours per week of care than are children caring for similarly disabled individuals -- 56% versus 18%. The latter either have greater amounts of formal care or greater levels of unmet need.
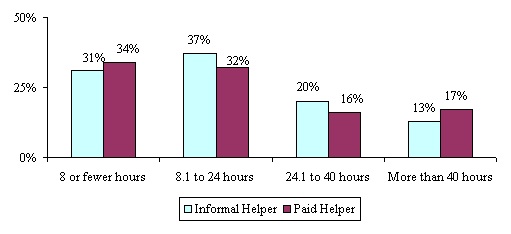
Another question relates to whether the efforts of paid and unpaid caregivers overlap. In other words, do paid and unpaid helpers complement or substitute for each other in terms of the number of hours of care they provide. As shown in Figure 11, paid helpers provide complementary help. Where the ICG is providing eight hours or less of ADL help, paid help also tends to be low. Where the ICG is providing large amounts of ADL help there are more frequent uses of paid help for large blocks of time.
Finally, although not shown in Figure 11, when the ICG is a child of the claimant, it is unusual for the child to provide very large amounts of ADL help. In fact, in the cases where ADL help provided by child ICGs is less than eight hours, paid help is often substantial. For spousal ICGs, it is much more common for large quantities of ADL help to be provided, and paid help does complement the efforts of the ICG.
| FIGURE 11: Relationship Between Hours of Care Provided and Type of Helper |
 |
| SOURCE: 1999 Supplemental Informal Caregiver Survey (n=424). |
C. The Caregiving Experience
We also wanted to measure how caregiving affected the lives of those who provide the care. In order to do this we asked a series of questions related to work, health and emotional status. First, for those providing care we wanted to know over the course of their caregiving experience, did they provide more, less or about the same amount of care at the time of the interview as they did when they first began caring for the claimant. Half of respondents indicated that they now provide more care then when they began and the other half were split fairly evenly between less care and the same amount of care. Given that these are chronically disabled elders living in the community, it makes sense that many would require more care as time progresses. As a rule, the disabled elders in our sample tend to need more help with everyday activities as time goes on and their level of functioning slowly deteriorates, rather than improves. Thus, even though insurance encourages the use of formal (paid) help, informal caregivers often wind up providing more care or the same amount of care now.
Residency
The provision of informal care has important implications for residency. In its simplest form, the matter comes down to the question: With whom does the claimant live? Much has been written about the relationship between caregiving, the costs of providing care, and residency (Borsch-Supan et al, 1996). The question of residency, or co-residency, is especially important because the ease and cost of providing care for a disabled elder are seriously influenced by living arrangement. If the ICG and claimant live together they will have an entirely different relationship than if they live apart. Naturally, the principal determinant of the living situation is the relationship between the claimant and the caregiver.
If one approaches the question from the perspective of the claimant, one-third of claimants live alone and 44% live with a spouse. It is more interesting to approach the question from the perspective of the ICG. Most ICGs live with their care-receivers (over two-thirds), but this observation is dominated by spouses. Where the ICG is a child, 36% live with their disabled parent, and where the ICG is someone else 28% co-reside. Finally, the ICGs who were most likely to have claimants living with them were those who had never been married; 66% of the unmarried ICGs lived with claimants.
Regarding the disability status of the claimant, the greater number of ADLs for which assistance is necessary, the more likely it is that the claimant will reside with the ICG. Even so, while claimants with the higher number of ADL dependencies are more likely to live with their caregiver, it is still true that the majority of them live independently. Income, however, does show an association with living arrangement: as the ICG's income rises, the likelihood of the claimant living with the ICG falls.
For ICGs with incomes less than $30,000, two-thirds of them live with their claimants. For ICGs with incomes above $70,000, only 18% live with their claimants. This observed behavior is consistent with two explanations. One is that for lower income ICGs the additional income brought by a claimant is desirable. This income (retirement income or social security) would supplement the caregiver's income and allow for a higher standard of living. The other is that as income increases the ICG would prefer to live independently of the claimant.
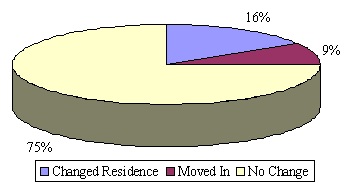
Caregiving often requires the continual presence of the helper and monitoring of the disabled individual. We asked ICGs whether caring for a disabled elder was the impetus for changing residence. Specifically, we asked whether the non-spousal ICG had to change geographic location to be closer to their loved one or whether they had to move in with them. Figure 12 below shows that overall most non-spousal caregivers (75%) did not have to change their residence or move-in with the claimant because of his or her disability.
Of those that did not live together at the time of interview, we asked if the insured ever changed his or her place of residence or moved in with the caregiver because of disability. These percentages were higher. Thirty-four percent (34%) of the caregivers reported that the insured had to move closer or in with them. There is a greater willingness or ability for the ICGs to take their loved ones into their homes than to change their own residence.
| FIGURE 12: Change of Residence among Non-Spousal Informal Caregivers |
 |
| SOURCE: 1999 Supplemental Informal Caregiver Survey (n=199). |
Employment
We designed a number of questions to assess the impact of providing care to the employment of the claimant. Of all caregivers in our sample, 36% reported that they were working for pay at the time of the interview and 64% of non-spousal caregivers reported working. For all working caregivers, we asked several questions relating to the amount of time, if any, they had to miss work in order to provide care for their disabled elder. Table 3 summarizes working caregivers' responses to a series of questions relating to how informal caregiving affects the work life of the ICG.
First, we wanted to determine if the caregiver was perhaps working less than he or she would like due to caregiving responsibilities. In fact, 40% of working caregivers said they are currently employed fewer hours than they would like. Those that were not currently working fewer hours were asked if they ever had done so in the past. Again, 40% responded that at some point in the past they had worked fewer hours per week than they would have liked because they were helping the claimant. Forty percent (40%) of the caregivers also stated that they had to take time off without pay with an average of 17 days of work missed per year due to caring for a disabled elder. These 17 days represent about 8% of the work year. The average earnings of these employed caregivers is $67,417. Thus, these lost workdays translate to lost earnings of $5,393 per year.
| TABLE 3. Effects of Providing Care on Employment among Working Caregivers | |
| Questions | Percent Responding Yes |
| Are you currently working fewer hours per week than you would like to because of providing care? | 40% |
| Have you ever worked fewer hours per week than you would like to because of providing care? | 40% |
| Aside from the above, have you ever had to take time off without pay because of the care you provide? | 40% |
| Average length of time off without pay per year | 17 days |
| Have you ever had to rearrange your schedule because of the care you provide? | 85% |
| SOURCE: 1999 Supplemental Informal Caregiver Survey (n=150). | |
Apart from the issue of working less than desired, it is possible that a caregiver would have to rearrange her/his work schedule. In fact, 85% of those who were employed answered that they had at some time had to rearrange their job schedule because of caregiving responsibilities. Taken together, these results create a clear picture of the impact that the tasks associated with caregiving have on the work environment.
We also asked those ICGs who were not currently working for the main reason they stopped working at their last job. Only 7% reported leaving their last job to care for the disabled elder currently in their care. Retirement was cited as the most common reason for ending employment.
There were four additional employment-related questions that were asked of all informal caregivers whether they were currently working or not. These questions were designed to capture other potential effects of caregiving on employment. As shown in Figure 13, 10% of respondents had to quit a job at some point because of caring for the claimant.
| FIGURE 13: Impact of Caregiving on Employment among All Informal Caregivers |
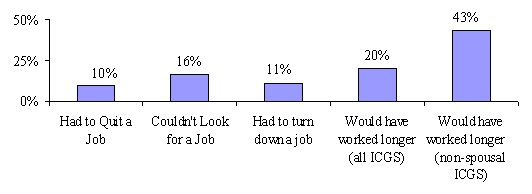 |
| SOURCE: 1999 Supplemental Informal Caregiver Survey (n=424). |
Responses were somewhat different for child ICGs. For spousal ICGs, 6% had quit a job, but for child ICGs the figure was 18%. With respect to the job search issue, we asked whether the activity of caregiving had ever kept the ICG from looking for another job or whether s/he had ever had to turn down a job because of caregiving responsibilities for the claimant. Another 16% reported that caregiving had kept them from looking for a job and another 11% had to turn down a job because of current care responsibilities. Again, we observed different responses depending on the nature of the ICG's relationship to the claimant.
Few spousal ICGs -- less than 10% -- were prevented from seeking employment or had to turn down a job. However, 27% of child ICGs had been kept from looking for a job and 20% had had to turn down a job. All told, slightly more than one-in-three informal caregivers indicated that their employment had been affected by their caregiving role. Finally, we asked those who were not working, if they would have continued working longer were they not taking care of the disabled claimant. Overall, 20% of caregivers said that they would have continued working longer, but when looking only at adult children (in-law), this increases to 43%.
The effects of caregiving on the employment of ICGs are pervasive and wide-ranging. The responsibility of providing care for a disabled elder does not mean that one simply leaves the labor force or fails to enter it. It can also affect the amount of time one is able to work (per week), the quality of work one is capable of performing, whether or not one can search for a new job or even whether one can seriously consider the offer of a new job.
Caregiver Emotional Well Being
Providing care to a disabled elderly friend or relative can cause stress on a caregiver's living and working arrangements, but it can have some of its most profound effects on the caregiver's physical and emotional health. We asked caregivers a number of questions related to emotional well being in order to better understand and characterize the potential stress associated with providing care. We asked a number of general stress questions that were followed by a series of statements. The ICG could either agree or disagree with these statements.
First, we wanted to know in general, if providing help ever "bothered" the caregiver. More than half of the ICGs (58%) responded that it did. For this group, we then asked how much it bothered them. As shown in Figure 14, more than 75% said that helping bothered them a great deal or somewhat.
| FIGURE 14: Whether of not Caregiving Bothers Caregiver |
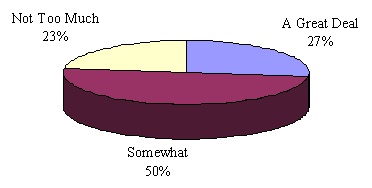 |
| SOURCE: 1999 Supplemental Informal Caregiver Survey (n=243). |
Another general measure that we used to gauge stress was how often an ICG?s sleep was interrupted because of the care he or she provides. Over half (55%) stated that they do not sleep through the night as a result of providing care. If we only look at the instances where the caregiver and care-receiver are living with one another, 66% of caregivers say that their sleep is interrupted because of the care they provide. Even for those that do not co-reside, one-third report sleep interruption, primarily due to phone calls. Most often, formal help for claimants is provided during the day. However, a claimant's needs also occur during the night when formal caregivers are not likely to be present. Thus, in such instances, claimants turn to their ICG for help.
Next, we read a series of statements to the ICG and asked if they agreed or disagreed with each. This was done in order to determine specific areas of the caregiver's life that may be affected by care provision. These statements were designed to further classify the particular effects that providing care may have on the ICG. Table 4 outlines the responses.
| TABLE 4. Specific Effects of Caregiving | |||
| Statements About Caregiving and Stress | Agree | Disagree | |
| Disabled person needs special medical care that I cannot provide | 53% | 47% | |
| Caring is hard on me emotionally | 73% | 27% | |
| Caring limits my privacy | 50% | 50% | |
| I have to care for her/him when I don't feel well | 65% | 35% | |
| Caring limits my social life or free time | 70% | 30% | |
| I have to give her/him almost my constant attention | 51% | 49% | |
| Caring has caused my health to worsen | 26% | 74% | |
| Caring limits time with my family | 41% | 59% | |
| SOURCE: 1999 Supplemental Informal Caregiver Survey (n=418). | |||
Again, it is clear that informal caregiving can create stress and hardship for those providing care. Others have already observed that caregiving can be a significant risk factor for the development of depressive symptoms (Kiecolt-Glaser & Glaser, 1999). The responses above suggest that providing care has more of an emotional effect on caregivers than a physical effect. Only 26% agreed that caring for a disabled loved one caused their health to get worse. When these responses were broken down by the severity of disability of the claimant, as measured by ADLs needing assistance, a pattern emerged (see Table 5).
| TABLE 5. The Relationship between Caregiver Stress and Functional Disability of Care Receiver | ||||
| Measure of Stress | Number of ADL Limitations | |||
| 0 to 2 | 3 to 4 | 5 to 6 | ||
| Needs special attention I cannot give | Agree | 54% | 48% | 56% |
| Disagree | 46% | 52% | 44% | |
| Taking care is emotionally difficult | Agree | 71% | 70% | 79% |
| Disagree | 29% | 30% | 21% | |
| I lose privacy with caregiving | Agree | 48% | 48% | 54% |
| Disagree | 52% | 52% | 46% | |
| I have to provide care when I don't feel well enough myself | Agree | 61% | 66% | 67% |
| Disagree | 39% | 34% | 33% | |
| Caregiving limits my social life or free time | Agree | 61% | 70% | 79% |
| Disagree | 39% | 30% | 21% | |
| I must provide constant attention | Agree | 40% | 54% | 63% |
| Disagree | 60% | 46% | 37% | |
| Caregiving has caused my health to get worse | Agree | 22% | 26% | 32% |
| Disagree | 78% | 74% | 68% | |
| Caregiving limits my family time | Agree | 36% | 46% | 43% |
| Disagree | 64% | 54% | 57% | |
| SOURCE: 1999 Supplemental Informal Caregiver Survey (n=418). | ||||
ICGs caring for severely disabled claimants (i.e. those with five or six ADL limitations) were the most likely to experience one of the measures of stress. Conversely, respondents agreed less frequently with these statements about stress when they were caring for less disabled people.
A question that is interesting to relate to the stress questions is whether the ICG believes that the claimant can be left alone. This question was answered only for situations where the claimant lives with the ICG. As can be seen in Figure 15, there is a particularly close association between whether providing care is difficult emotionally and whether the claimant can be left alone. For those ICGs who believe that their care recipients cannot be left alone, 80% find the caregiving emotionally difficult and 63% feel bothered by it. This is felt most strongly by spouses. Ninety-three percent (93%) of spouses who feel that caregiving is emotionally difficult indicate that they cannot leave their partner alone.
| FIGURE 15: Percentage of Caregivers Living with Care-Receivers Who Experience Stress when Claimant Cannot be Left Alone |
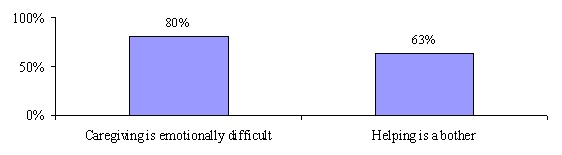 |
| SOURCE: 1999 Supplemental Informal Caregiver Survey (n=284 caregivers and care-receivers living together). |
Overall providing informal care to privately insured community-based claimants seems to have a pervasive effect on most aspects of the caregiver's life -- employment as well as emotional health. Some caregivers also report declines in their own health status as a result of caregiving. This accords with recent research suggesting that being a caregiver who is experiencing mental or emotional strain is an independent risk factor for mortality, particularly among elderly spousal caregivers (Schulz & Beach, 1999). Even though caregivers often relate that caring has had a significant effect on their lives, many of them also felt that it was their duty to care. When we asked this particular series of questions relating to emotional well being and the effects of caregiving, ICGs were quick to let us know that while they perceived that caring had adverse effects on them, they viewed it as their responsibility. Some caregivers were reluctant to answer the questions at times because they could not understand their importance. It was often difficult for them to separate their feelings of stress and responsibility from one another.
Lastly, we were interested in the effect that having private LTC insurance may have had on the overall stress level of ICGs. In theory, the presence of insurance-financed care could reduce or increase stress. An increase would result from the need to monitor formal caregivers or to interact with the insurer as well as with providers. Such is not the case. Only 4% of informal caregivers indicate that the presence of insurance actually increased stress levels. Another one-quarter of informal caregivers indicated that the insurance had no effect on their stress level. The most frequent response (68%) was that insurance benefits have reduced stress. It is also the case that ICGs caring for more disabled elders more frequently report stress.
| FIGURE 16: Caregivers Assessment as to Whether Presence of Insurance Benefits has Affected Stress |
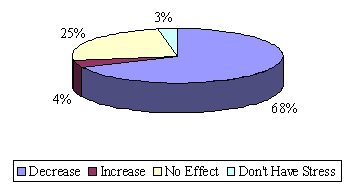 |
| SOURCE: 1998 Informal Caregiver Survey (n=418). |
D. Effects of Insurance on Caregiving
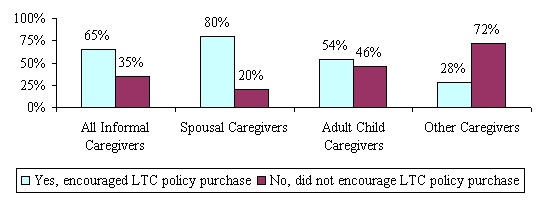
We asked the ICGs a series of questions to determine what effect, if any, having a private LTC insurance policy had on the type and amount of care that they were providing to loved ones. Like the claimants themselves, caregivers are concerned about how LTC insurance benefits will affect and shape their caregiving role. In addition, the policy has major financial implications for many of the caregivers. If one were to ask who benefits most from the purchase of a LTC insurance policy, the answer would be split between those who benefit by an eased burden of care and those who benefit from the financial assistance. As shown previously, spousal ICGs are least likely to experience a change in employment status. Moreover, even in the presence of insurance-financed formal care, spousal ICGs continue to provide significant amounts of assistance with ADL limitations. Therefore, it is interesting to begin this section by addressing the question of whether the ICG has a role in the purchase of the LTC policy. All informal caregivers were asked whether or not they encouraged the claimant to purchase a LTC policy. Figure 17 summarizes the results.
Only 20% of spousal ICGs did not encourage the purchase of the LTC policy. The other 80% either encouraged its purchase jointly, made the decision to purchase, or purchased the policy themselves. Children and other ICGs were least involved in the insurance purchase decision (or more precisely, did not encourage the purchase).
| FIGURE 17: Informal Caregiver's Role in Encouraging the Purchase of LTC Insurance |
 |
| SOURCE: 1998 Informal Caregiver Survey (n=394). |
We asked ICGs a variety of questions on their view of LTC insurance and on the effect of the specific policy on their behavior. Our discussion will focus first on the effect on caregiving and then on the ICG's perception of the policy. LTC insurance allows for the substitution of formal or paid care in place of informal or unpaid care. The ICG might respond to this situation by providing less care or by changing the nature of care provided. It is also possible that the need for care could change once the benefits of a policy commence, and that this could lead to a greater demand for care from all parties or sources, including the ICG. We asked caregivers whether the quantity of care they provide had changed following the commencement of benefits. More specifically, we inquired as to whether:
- they provide more, less or the same amount of care given that insurance benefits are being paid to the claimant; and
- in the absence of the claimant's policy would they now provide more, less or the same amount of care as they currently provide.
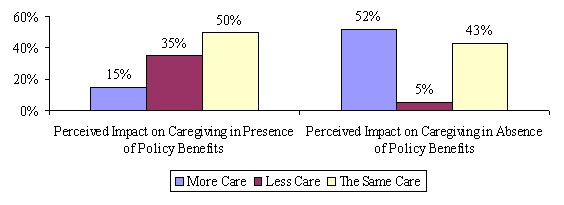
Figure 18 shows that in the presence of insurance benefits; roughly two-in-three informal caregivers have not reduced the level of care that they provide. In fact, half of the caregivers have not changed the amount of care they provide at all. This finding suggests that for most informal caregivers, formal care does not simply substitute for or replace informal care. This was true across types of caregivers and across severity of disability. With that said, however, the picture is not crystal clear: about one-in-three did indicate that they now provide less informal care.
It is also noteworthy that 15% of informal caregivers suggested that they provide more informal care now that insurance benefits are being received and more formal care provided. This may reflect the fact that the situation of the claimant may have deteriorated since the onset of benefit payments so that the informal caregiver has had to increase the amount of care they provide. It may also be the case that the presence of insurance to finance formal care has enabled them to provide more care, but perhaps of a different nature, rather than less. This suggests that in some instances, formal care may be a complementary rather than substitute service for informal caregiving. It also implies that if disability had remained constant, the number of cases where ICGs provided less care as a consequence of insurance might have been larger.
| FIGURE 18: Informal Caregiver's Perceptions about the Impact of Claimants' Policy |
 |
| SOURCE: 1998 Informal Caregiver Survey (n=417). |
A closely related question posed to ICGs deals with whether more, less or the same amount of informal care would be provided by them to the claimant if there was not a policy to pay benefits. By focusing on behavior at a specific point in time, this question attempts to hold constant the level of disability in assessing the impact of LTC insurance. Among all caregivers, a slight majority (52%) indicated that if the policy was not paying benefits they would increase the level of informal care that they provide. Those ICGs who said they would provide more care were asked for an estimate of how much more care they would provide. The median number for those respondents was 20 hours per week.
One might wonder why so many more ICGs indicated that they would provide more care in the absence of the insurance policy (52%) than indicated that the amount of care they provide had fallen since benefits began (35%). The logical explanation is that the condition of the claimant had declined since before benefits were being paid. Thus, a continued decline is reasonable to presume. In the presence of insurance benefits, the level of informal caregiving needed to meet the increasing needs of the claimant may remain constant. Without insurance benefits, however, the level of caregiving would have had to increase.
Of the three possible responses, that of less care is least likely or expected. In fact, only about 5% of ICGs indicated that they would provide less care. One plausible explanation for the "less care" response is that without a LTC policy the disabled elder would have to seek some form of institutional care. In such a case, the ICG would provide less care. In fact, a number of ICGs who responded that they would provide less care also indicated that without the current LTC insurance policy, the claimant would have to find institutional care.
We asked informal caregivers whether the presence of insurance benefits has changed the nature or type of informal care that they provide. Most (71%) indicated that it had not. For those informal caregivers who indicated that they had changed the type of care that they provide, most show a reduction in ADL and IADL assistance and an increase in companionship services (see Figure 19). Not shown in the figure is the fact that 37% of the spousal ICGs spent "more time just being together" while over half (57%) of child ICGs spent more time just being together.
| FIGURE 19: How Care has Changed for those Reporting a Change in the Nature of Care Provided |
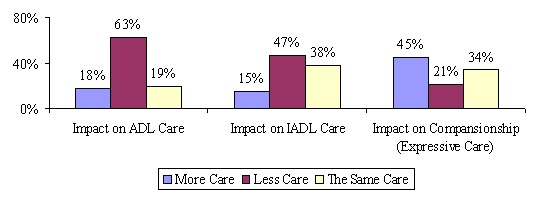 |
| SOURCE: 1998 Informal Caregiver Survey (n=121 caregivers who changed nature of care provided). |
Most LTC insurance policies as currently written pay benefits to formal licensed caregivers. They do not pay cash to relatives or other informal caregivers.12 One company included in this study does provide cash payments, and the claimant could, if s/he chose, pay the informal caregiver. If the benefits were paid directly to ICGs, it is plausible that they may change the amount of care they provide. Such behavior would seem to depend on the "economic motivation" of the caregiver. Figure 20 shows ICG responses to the question of whether direct payment to the ICG would lead to different behavior on her/his part. The responses are displayed by the relationship between the ICG and the claimant.
For spousal ICGs very few (8%) would provide a different amount of care if paid. Child and other ICGs would be more willing to provide additional care if paid although the number who would do so is still small -- 15% of respondents would provide that additional care. Taken together, these findings indicate that more than four-in-five believe that they would not change the amount of care provided if they were paid cash for their caregiving.
| FIGURE 20: Whether Cash Payment to Informal Caregiver Would Increase Level of Caregiving |
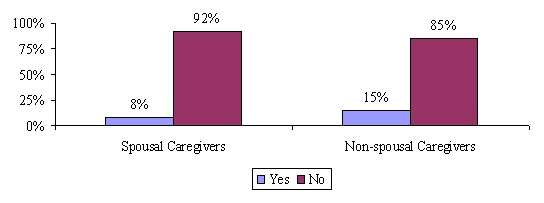 |
| SOURCE: 1998 Informal Caregiver Survey (n=370).NOTE: This analysis is based on responses of individuals whose policies do not pay cash benefits. |
A great deal of research has also focused on whether the use of formal home care services delays or prevents the use of costly institutional care like nursing home care (See Weissert, 1985; Weissert et al, 1989; Garber & MaCurdy, 1989; Shapiro and Tate, 1989; Green et al, 1993; Wolf, 1997; Kane 1998). Most of this research concludes that, unless very carefully targeted, home care rarely prevents someone from using nursing home care. Instead, there is a growing consensus that home care serves a distinct population that differs in relevant respects from the nursing home population. Yet, the decision to seek institutional care is a complicated one involving a myriad of factors, many of which cannot be adequately captured even by the most sophisticated multivariate modeling.
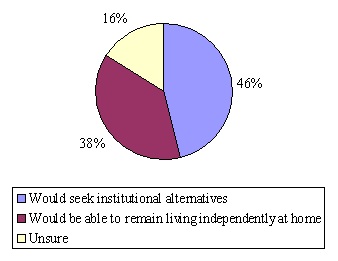
Because the impact of formal home care services on the use of costly institutional services is such an important issue, we decided to approach it from a somewhat different perspective. Rather than model the characteristics of individuals to determine potential overlap with the nursing home population, we focus on potential service-seeking behaviors. In other words, in our survey we asked the informal caregiver whether or not, in the absence of the insurance policy, the disabled claimant would be able to remain living at home. This provides an indication of whether or not, from the informal caregivers' perspective, the individual would be able to continue living independently in the community. Figure 21 shows that among informal caregivers, almost half (46%) indicated that in the absence of the private insurance to pay for home care services, the elder would have to seek institutional alternatives.
| FIGURE 21: Whether in Absence of Policy Institutional Alternatives Would be Sought |
 |
| SOURCE: 1998 Informal Caregiver Survey (n=418). |
If one removes the fairly large number of "unsure" responses (16% of the total), spouses, children and other ICGs each responded "yes" more often than "no". Not shown in the figure is the fact that non-spousal caregivers, typically adult children, were the most likely to indicate that in the absence of policy benefits the claimant would need to seek institutional care -- 53% of non-spousal ICGs compared to 43% of spousal ICGs. It should be noted that we also looked at the association between responses to this question and the claimant's number of ADL limitations, the cognitive condition of the claimant, the health assessment of both the claimant and the ICG, and the income of the ICG. In none of these analyses was there a statistically significant relationship between these variables and the likelihood of responding that the care-receiver would need to seek institutional care.
E. Comparing Informal Caregivers of Privately Insured and Non-Privately Insured Community-Dwelling Disabled Elders
A primary purpose of the study of LTC insurance claimants was to compare privately insured disabled elders, most of whom receive benefits under their LTC policies, to disabled elders who do not have private insurance protection. We also wished to compare their informal caregivers along a number of dimensions. As mentioned previously, a common critique of comparative studies of informal caregiving and caregivers is that the definition of both formal and informal caregivers and caregiving is not held constant (Barer & Johnson, 1990; Stone, 1991). That is, because researchers employ different definitions of caregiving, one cannot be certain that the same phenomenon are being measured and compared. There have been few studies that have relied on consistently collected information using similar sampling bases and survey instruments.
Another common problem is that much of the caregiving literature attempts to understand the caregiver independent and often irrespective of the care-receiver. When trying to get an overall picture of caregiving, it is important not only to gather information about the caregiver, but to understand in detail the characteristics of the care-receiver as well. In this way, it is possible to gain a comprehensive picture of the caregiving population, the population of elders receiving informal care and how they effect and interact with each other. Finally, there is often a problem associated with the way in which caregivers are identified and selected for information gathering. Barer and Johnson (1990) report that many of the caregivers being studied are selected on the basis of their own identification as the primary informal support. Thus, not only do definitions vary, but also the self-selected nature of research samples makes it difficult to make generalizations to relevant populations.
This current study addresses these shortcomings by comparing information on the informal caregivers of insurance claimants with caregivers derived from the Informal Caregiver Supplements to the 1989 and 1994 National Long-Term Care Surveys (NLTCS).13 In both of these surveys, the primary caregiver is defined and identified in exactly the same way. As is true in the claimant database, in the NLTCS, the ICG is determined from information provided by the disabled community-dwelling elder receiving help and assistance. Second, each survey collected comparable and detailed demographic, health and disability profile of the individuals who receive informal care (i.e. care-receivers), thus eliminating the potential bias created from self-selected samples. Lastly, identical questions were asked on the 1999 Supplemental Informal Caregiver Survey of privately insured care-receivers and on the 1989 NLTCS Informal Caregiver Survey.
To assure an accurate comparison between the samples, we apply a minimum disability threshold and focus our analysis on a sub-set of informal caregivers.14 The sample inclusion criteria for disabled individuals in the 1989 NLTCS are more liberal than the inclusion criteria for the 1999 National Claimant Sample. To be included in the former, an individual had to be age 65 and over and only have one IADL limitation or be cognitively impaired. For the 1999 National Claimant Sample individuals had to be age 65 or older and, for the most part, have at least two ADL limitations or be cognitively impaired. To make the samples comparable, individuals in both samples had to be:
- disabled in at least two of six ADLs that require some level of human assistance;15or
- cognitively impaired as measured by the Short Portable Mental Status Questionnaire (SPMSQ);16or
- diagnosed with dementia or Alzheimer's disease.
Once these minimum disability selection criteria are applied, an accurate comparison of informal caregivers can be made. All subsequent comparative analyses of the informal caregivers of these two populations are based on sub-samples of disabled elders age 65 and over that reflect this underlying minimum disability threshold. In total, once these criteria are applied, the 1999 Supplemental Informal Caregiver Survey consists of 368 caregivers and the 1989 NLTCS sample consists of 448 caregivers.
Demographic Characteristics
Table 6 highlights a number of the demographic characteristics of the informal caregivers of insured and non-insured disabled elders. As shown, on all socio-demographic dimensions, there are differences across the two samples of caregivers. Informal caregivers of the privately insured disabled tend to be older, more highly educated, and they are much wealthier than are their counterparts caring for the disabled without private insurance.17 Moreover, they are more likely to be married and are about four times more likely to be employed. This is somewhat surprising given the difference in average age between the two groups and the fact that greater proportions of caregivers for the privately insured are themselves spouses.18 Caregivers for these privately insured have been providing care for an average of about three years whereas caregivers of the non-privately insured have been giving such care for closer to five years. (Not shown in the table.)
Caregivers caring for disabled individuals without private insurance are more likely to live with them. There is also a greater likelihood that these caregivers are adult children, many of whom are unmarried. It may be that the presence of LTC insurance enables the privately insured to rely less on adult children for care. Previous research has shown that the desire to avoid having to rely on family and friends for care is a strong motivator for initial purchase (Cohen & Kumar, 1996).
| TABLE 6. Demographic Characteristics of Surveyed Informal Caregivers of Privately Insured and Non-Privately Insured Disabled Elders Age 65 and Over | ||
| Demographic Characteristics | Caregivers of Privately Insured Disabled Elders | Caregivers of Non-Privately Insured Disabled Elders |
| Average Age | 65 years*** | 61 years |
| Less than 65 | 37% | 51% |
| Age 65 and over | 63% | 49% |
| Gender | ||
| Female | 61%*** | 71% |
| Male | 39% | 29% |
| Marital Status | ||
| Married | 80%*** | 73% |
| Not Married | 20% | 27% |
| Educational Status | ||
| Less than High School | 6%*** | 38% |
| High School Graduate | 18% | 41% |
| More than High School | 76% | 21% |
| Income Status | ||
| Less than $30,000 | 18%*** | 82% |
| $30,000 or more | 82% | 18% |
| Employment Status | ||
| Employed | 35%*** | 9% |
| Not Employed | 65% | 91% |
| Living Arrangement | ||
| Live with Disabled | 70%*** | 77% |
| Don't Live with Disabled | 30% | 23% |
| Relationship to Disabled | ||
| Spouse | 61%*** | 43% |
| Adult Child | 23% | 36% |
| Other | 16% | 21% |
| SOURCE: 1989 NLTCS (n=448) and 1999 Supplemental Informal Caregiver Survey (n=368).NOTES: Statistical significance related to between sample comparisons. *** significant at the .001 level. | ||
Figure 22 shows the amount of informal care provided to disabled individuals with and without insurance. This data is based on the reports of the informal caregivers themselves. On average, informal caregivers of the privately insured provide about 40 hours a week of assistance compared to about 42 hours for those caring for non-privately insured disabled elders. It is worth noting that among the privately insured, the care-receivers report that they are receiving an average of about 27 hours of care whereas the caregivers report providing 40 hours a week of care.19
| FIGURE 22: Weekly Hours of Informal Care Reported by Caregivers |
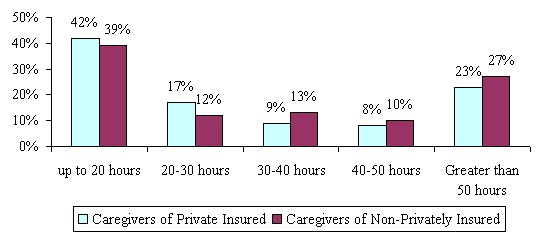 |
| SOURCE: 1989 NLTCS and 1999 Supplemental Informal Caregiver Survey.NOTE: Differences are not significant. |
It is interesting to note that the difference in total hours of informal care between the two groups is not statistically significant. This, despite the fact that the privately insured receive an average of 38 hours per week of formal care compared to 13 hours for the non-privately insured (HHS, 1999). This supports the proposition that even in the presence of insurance-financed services, substantial levels of informal support are provided.
| FIGURE 23: Functional and Cognitive Status of Care-Receiver as Reported by Caregiver |
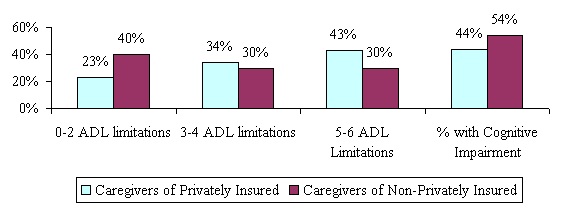 |
| SOURCE: 1989 NLTCS (n=4481) and 1999 Supplemental Informal Caregiver Survey (n=368).NOTE: Differences are not significant at the .001 level. |
Figure 23 summarizes the health and disability status of the individuals being cared for. On average, the privately insured have greater functional disability -- 3.9 ADL limitations compared to 3.1 for the non-privately insured -- whereas those without insurance are more likely to be cognitively impaired.
Impact of Caregiving on Employment and Emotional Well Being
Previous research and findings presented here show that informal caregiving can have a major impact on the employment experience of caregivers. For working caregivers, we asked whether they ever had to:
- rearrange their schedule at a job because of the care they were providing;
- take time-off to provide informal care;
- work fewer hours than they would have liked because they were helping the disabled individual; or
- quit a job in order to care for the disabled individual.
These questions were also asked in the NLTCS. Figure 24 summarizes the responses to these questions and also shows the proportion of working caregivers that work more than 30 hours per week.
| FIGURE 24: Impact of Informal Caregiving on Employment Status among Working Caregivers by Insurance Status of Care-Receivers |
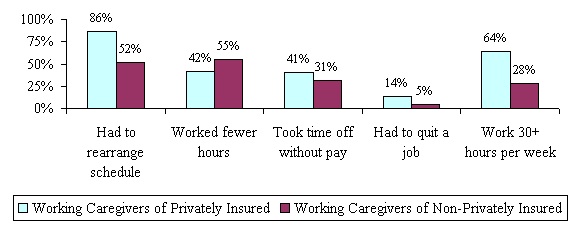 |
| SOURCE: 1989 NLTCS (n=42) and 1999 Supplemental Informal Caregiver Survey (n=168).NOTE: Differences are not significant at the .001 level. |
The relationship between insurance status, informal caregiving and employment is complicated. As shown, the caregivers of the privately insured are more likely to be employed than are those caring for the non-privately insured -- 35% compared to 9% (see Table 6). Moreover, they work more hours per week -- 33 compared to 21 -- and this may reflect a potential effect of their care-receiver having LTC insurance. Yet, among employed caregivers, those caring for the privately insured are also more likely to have to take time off without pay, to have to rearrange their work schedule to accommodate the care needs of the care-receiver, and have had to quit a job to continue to provide care.20 This may reflect the fact that ICGs caring for the privately insured are caring for more functionally disabled individuals. It may also be the case that because the caregivers of the privately insured work more hours on average, they are more likely to have to rearrange their schedule or take time off without pay. They may not have the same ability to meet the care needs of the disabled care-receiver and juggle their job when they are working so many hours per week. Hand-in-hand with this finding is the finding that caregivers of the non-privately insured are more likely to report that they have had to work fewer hours than they would have liked because of the help that they provide to the disabled care-receiver.
Caregivers were also asked about the impact of caregiving on emotional well being. Table 7 summarizes results for each of the samples by whether or not the caregiver is a spouse or non-spouse.
| TABLE 7. Percent Agreeing with Statements about Caregiving Stress by Caregiver type and Insurance Status of Care-Receiver | ||||
| Attitudes about the Impact of Informal Caregiving | Caregivers of Privately Insured | Caregivers of Non-Privately Insured | ||
| Spouse | Non-Spouse | Spouse | Non-Spouse | |
| Taking care of him/her is hard on me emotionally. | 76% | 75% | 47% | 47% |
| I have to take care of him/her when I don't feel well myself. | 69% | 60% | 68%* | 61% |
| Taking care of him/her limits my free time or social life. | 77%* | 67% | 48%* | 55% |
| I have to give him/her almost my constant attention. | 66%*** | 38% | 43% | 39% |
| Taking care of him/her has caused my health to get worse. | 29% | 26% | 23%** | 15% |
| SOURCE: 1989 NLTCS (n=448) and 1999 Supplemental Informal Caregiver Survey (n=367).NOTE: Statistical significance relates to within sample comparisons. * significant at the .10 level; ** significant at the .05 level; *** significant at the .001 level. | ||||
With few exceptions, spousal caregivers are most likely to agree with these statements than are non-spousal caregivers. This is true across both samples. It is also true that caregivers of the privately insured are more likely to agree with these statements than are those caring for the non-privately insured. This may reflect the fact that there is a much greater proportion of working caregivers among the privately insured hence, the need to balance work and caregiving produces greater levels of stress. Also, the individuals that they are caring for are more disabled.21 Caregivers are least likely to agree with the statement that "...taking care of him/her has caused my health to get worse". Even so, among the non-privately insured, spousal caregivers are more likely to agree with this than are non-spousal caregivers.
The relationship of the caregiver to the care-receiver, the insurance status of the care-receiver, and the employment status of the caregiver affect the entire caregiving experience. The overall amount of care provided to disabled individuals across these two samples is similar. So too is the general reaction to the caregiving experience. Yet, there are important differences relating to the impact of caregiving on stress and employment. Such differences may be associated with many factors including the underlying health status of the disabled care-receiver as well as with the amount of time individuals have been caring for their disabled relative.
V. CONCLUDING THOUGHTS
In this study we have characterized informal caregivers and the caregiving experience of individuals with private LTC experience. When possible, we have made comparisons between caregivers caring for sub-samples of disabled privately and non-privately insured individuals. Perhaps one of the most important findings is that despite caring for very disabled elders, many caregivers of insured care-receivers are able to continue to work, especially adult children caregivers. While they may experience inconveniences (e.g. having to rearrange their schedule, missing days of care, and others) they have not had to drop out of the labor force completely. The fact that caregivers of the insured care-receivers were able to work so many hours increased the likelihood of such inconveniences. Of those non-spousal caregivers who were not working for pay, less than one-in-five indicated that they had to stop working to care for the disabled claimant. On the other hand, among adult children roughly two-in-five indicated that they would have continued working longer but for the care that they needed to provide to their disabled parent.
The differences in care provision and caregiving experience between spousal and non-spousal caregivers is stark. For the most part, spousal caregivers who care for the most disabled claimants provide more weekly hours of care, and provide much more hands-on assistance with basic ADLs. Even when the disability level of the care-receiver is held constant, spousal caregivers provide much more care than do non-spousal caregivers. Not surprisingly, they also experience greater emotional stress. They are more likely to agree that caregiving is hard on them emotionally, that they have to provide care even when they are not well, that it limits their social life, and that as a result of caregiving, their own health is worsening. To the extent that insurance plays a significant role in the caregiving experience, its effects seem to be greater for non-spousal caregivers, typically adult children.
Informal and formal caregiving appear to be complementary. In cases where the informal caregiver provides lower levels of informal care, formal care also is low. The converse is also true: when an informal caregiver is providing large amounts of care, so too is the formal caregiver. This observation supports early findings in this study that the presence of insurance-financed formal care does not significantly reduce caregiver effort. When asked, two-thirds of caregivers indicated that they had not reduced the amount of care they provide since insurance benefits commenced. This was true across caregiver type and across the severity of disability of the care-receiver.
Recent studies have suggested that caregiving can cause a deterioration in the health of the caregiver. Findings in this study support this proposition. Roughly one-quarter of caregivers indicated that their health had worsened as a result of their caregiving activities. This was true for both spousal and non-spousal caregivers as well as for caregivers providing care to privately insured disabled claimants. Clearly, there are health risks that go along with providing substantial amounts of care to disabled individuals. How to minimize such risks should be an important component of caregiver training and support.
There has been renewed interest in programs and insurance plans that make direct cash payments to disabled individuals so that they can use the money to purchase care from whomever they desire. One issue is whether informal caregivers would change the amount of care that they provide if they received monetary payment. Most caregivers indicated that the receipt of cash would not increase the level of care that they provide. Perhaps this is not surprising, given that over half of the caregivers were spouses. However, even among the non-spousal caregivers, only one-in-six indicated that a receipt of cash would lead them to increase the quantity of care they provide.
Not captured in this report are the individual experiences of caregivers themselves: how they cope on a daily basis with the challenge of caring for disabled relatives, how they try to balance caregiving with work and family life, and how they derive satisfaction from so doing. While these informal caregivers indicated that the presence of insurance does reduce their general level of stress they continue to experience daily difficulties even when significant amounts of formal care are provided. One of the more interesting qualitative findings was that many respondents just wanted to have the ability to talk to someone about their caregiving experience. They also indicated that they could use additional information about how to be better prepared to provide the necessary care and how to cope with the daily stresses associated with caregiving. The implication is that even when private insurance is available to finance significant amounts of care, ongoing support for informal caregivers is needed. Such support needs to address the emotional, and for some, the physical aspects associated with caregiving.
REFERENCES
Arno, P., C. Levine, and M. Memmott (1999). The Economic Value of Informal Caregiving. Health Affairs, 18(2)
Barer, B., and C. Johnson (1990). A Critique of the Caregiving Literature. The Gerontologist, 30(1), pp.26-29.
Borsch-Supan, D., L. McFadden, and R. Schnabel (1996). Living Arrangements: Health and Wealth Effects, in D.A. Wise Advances in the Economics of Aging. The University of Chicago Press, as well as the references cited therein.
Cohen, M., and N. Kumar (1996). The Changing Face of Long-Term Care Insurance in 1994: Profiles and Innovations in a Dynamic Market. Inquiry.
Garber, A.B., and T. MaCurdy (1989). Predicting Nursing Home Utilization among the High Risk Elderly. National Bureau of Economic Research. Cambridge Massachusetts.
Kiecolt-Glaser, J., and R. Glaser (1999). Chronic Stress and Mortality among Older Adults. Journal of the American Medical Association, 282(23).
Greene, V., M. Lovely, and J. Ondrich (1993). The Cost-Effectiveness of Community Services in a Frail Elderly Population. The Gerontologist, 33(2).
Kane, R. (1998). Examining the Efficiency of Home Care. Unpublished manuscript submitted to the Home Care Research Initiative, University of Minnesota.
LifePlans, Inc. and The Center for Health and Long-Term Care Research (1999). A Descriptive Analysis of Patterns of Informal and Formal Caregiving among Privately Insured and Non-Privately Insured Disabled Elders Living in the Community. [http://aspe.hhs.gov/daltcp/reports/ifpattrn.htm]
Metlife (1999). The Metlife Juggling Act Study: Balancing Caregiving with Work and the Costs Involved. Mature Market Institute, November.
National Association of Caregivers (1997). Family Caregiving in the U.S.: Findings from a National Survey. Washington D.C.
Penrod, J., R. Kane, R. Kane, and M. Finch (1995). Who Cares? The Size, Scope, and Composition of the Caregiver Support System. The Gerontologist, 35(4).
Schulz, R., and S. Beach (1999). Caregiving as a Risk Factor for Mortality. Journal of the American Medical Association, 282(23).
Shapiro, E., and R.B. Tate (1988). Who is Really at Risk of Institutionalization. The Gerontologist, 28.
Stone, R. (1991). Defining Family Caregivers of the Elderly: Implications for Research and Public Policy. The Gerontologist, 31(6), pp. 724-725.
Tennstedt, S. (1999). Family Caregiving in an Age Society. Paper presented at the U.S. Administration on Aging Symposium. Baltimore, MD.
United States Bureau of the Census. Median Earnings of Full-Time Year Round Workers Selected Characteristics: 1998. Current Population Survey.
United States Bureau of the Census. Educational Attainment in the United States: March 1999. Washington, D.C.
Weissert, W. (1985). Seven Reasons why it is so Difficult to Make Home and Community-Based Care Cost Effective. Health Services Research, 20.
Weissert, W., and C. Cready (1989). Toward a Model for Improved Targeting of Aged at Risk of Institutionalization. Health Services Research, 24.
Wolf, D. (1997). Efficiency in the Allocation and Targeting of Community-Based Long-Term Care Resources. Unpublished manuscript submitted to the Home Care Research Initiative. Syracuse University.
NOTES
-
We use the term non-privately insured to highlight the fact that many elders have a form of public insurance in Medicaid.
-
To be included in the comparison sample, the informal caregivers had to be caring for disabled elders that met a minimum disability threshold of at least two of six ADL limitations or cognitive impairment.
-
Virtually every comment relating to care of the elderly merits qualification. There have "always" been situations of individuals being employed to provide special care for the aged, where the family could afford such a luxury. It is only recently, though, that there has been widespread formal care for the aged who live outside institutions. The relationship between formal and informal care has been changing as formal care becomes available, as its price changes, and as the social and economic demands of informal caregivers change. LTC insurance is a new element that potentially alters the relationship between informal caregivers, formal caregivers, and those who receive the care.
-
There are two aspects that are of particular concern. The LTC insurance may induce behavior that is unlike that associated with an uninsured disabled elder, and the individuals who are insured (and their associated caregivers) may be different from the general population.
-
It is important to note that only in recent years has the volume of home health care claims grown significantly. Few carriers have garnered significant experience on home health care claims.
-
Important exceptions to this general observation are the 1989 and 1994 National Long-Term Care Surveys (NLTCS). In these surveys, disabled elders aged 65 and over also identified the unpaid person who helps them the most with everyday activities -- the primary informal caregiver. For this reason, in a subsequent section, we have chosen the NLTCS national samples as a basis for comparisons between insured and non-insured disabled elders.
-
See "Who Buys Long-Term Care Insurance." LifePlans Inc., 1995.
-
Comparative data is taken from the 1994 National Long-Term Care Survey (NLTCS). The NLTCS was designed to collect data about the health and functional status of the Medicare beneficiary population over age 65. The questions were intended to identify persons who had certain disabilities or health problems lasting three months or longer. These individuals were also asked to identify their primary unpaid helper.
-
It should be noted that the disabled group for this sample was somewhat younger, thus increasing the likelihood that caregivers of the group would also have younger children living with them.
-
In their survey of family caregiving in the United States, NAC reported the average duration of care to be 4.5 years.
-
The substantial difference between the mean and the median reveals the influence of outliers -- a relatively small number of cases with very large number of hours of care.
-
There are a number of companies that are now paying cash benefits to informal caregivers. Also, individuals with policies that pay cash disability payments can use their benefits to pay informal caregivers.
-
Where appropriate, we also use caregiver data from the 1994 NLTCS.
-
For more information please see: "A Descriptive Analysis of Patterns of Informal and Formal Caregiving among Privately Insured and Non-Privately Insured Disabled Elders Living in the Community," Department of Health and Human Services, April 1999. [http://aspe.hhs.gov/daltcp/reports/ifpattrn.htm]
-
The ADLs include bathing, dressing, toileting, transferring, continence management, and feeding. A disability is present if an individual requires stand-by, cueing, or hands-on assistance.
-
Having four or more errors on the SPMSQ.
-
Income is not adjusted for changes in the cost of living between 1989 and 1999.
-
It is important to note that these findings do correspond to more recent data on informal caregivers derived from the 1994 NLTCS (HHS, 1999).
-
A plausible explanation for this discrepancy is that ICGs count companionship as part of their care hours whereas the care-receiver may not do so.
-
These comparative findings must be viewed with caution given the relatively small number of caregivers from the 1989 NLTCS sample that actually work.
-
For more information please see: "A Descriptive Analysis of Patterns of Informal and Formal Caregiving among Privately Insured and Non-Privately Insured Disabled Elders Living in the Community," Department of Health and Human Services, April 1999. [http://aspe.hhs.gov/daltcp/reports/ifpattrn.htm]
To obtain a printed copy of this report, send the full report title and your mailing information to:
U.S. Department of Health and Human ServicesOffice of Disability, Aging and Long-Term Care PolicyRoom 424E, H.H. Humphrey Building200 Independence Avenue, S.W.Washington, D.C. 20201FAX: 202-401-7733Email: webmaster.DALTCP@hhs.gov
RETURN TO:
Office of Disability, Aging and Long-Term Care Policy (DALTCP) Home [http://aspe.hhs.gov/_/office_specific/daltcp.cfm]Assistant Secretary for Planning and Evaluation (ASPE) Home [http://aspe.hhs.gov]U.S. Department of Health and Human Services Home [http://www.hhs.gov]
Other Reports Available
A Descriptive Analysis of Patterns of Informal and Formal Caregiving among Privately Insured and Non-Privately Insured Disabled Elders Living in the Community Executive Summary http://aspe.hhs.gov/daltcp/reports/ifpattes.htm HTML http://aspe.hhs.gov/daltcp/reports/ifpattrn.htm PDF http://aspe.hhs.gov/daltcp/reports/ifpattrn.pdf
Informal Caregivers of Disabled Elders with Long-Term Care Insurance Executive Summary http://aspe.hhs.gov/daltcp/reports/icdeltes.htm HTML http://aspe.hhs.gov/daltcp/reports/icdeltci.htm PDF http://aspe.hhs.gov/daltcp/reports/icdeltci.pdf
Multivariate Analysis of Patterns of Informal and Formal Caregiving among Privately Insured and Non-Privately Insured Disabled Elders Living in the Community Executive Summary http://aspe.hhs.gov/daltcp/reports/2000/multanes.htm HTML http://aspe.hhs.gov/daltcp/reports/2000/multanal.htm PDF http://aspe.hhs.gov/daltcp/reports/2000/multanal.pdf
The Use of Nursing Home and Assisted Living Facilities Among Privately Insured and Non-Privately Insured Disabled Elders Executive Summary http://aspe.hhs.gov/daltcp/reports/2000/nhalfues.htm HTML http://aspe.hhs.gov/daltcp/reports/2000/nhalfuse.htm PDF http://aspe.hhs.gov/daltcp/reports/2000/nhalfuse.pdf