
Marc A. Cohen, Ph.D.
Vice President, LifePlans, Inc.
President, Center for Health and Long-Term Care Research
Maurice Weinrobe, Ph.D.
Professor of Economics, Clark University
Jessica Miller, M.S.
Senior Research Associate, LifePlans, Inc.
ACKNOWLEDGMENTS
This research could not have been completed without the assistance and guidance of many individuals both inside and outside of the long-term care insurance industry. We would like to gratefully acknowledge the assistance provided by Robert Glowacki, Carolyn Eickenberg, and Sharon O'Dell from Aegon, Roy Christianson and David Rogers from American Travellers, Ray Nelson and Leslie Peters from Bankers Life and Casualty, Carol McBrayer, Melissa Stinson, Steve French and Richard Garner from CNA Insurance, Dan Nitz from Fortis Long-Term Care, Roger Desjardins, Mary Katz and Armando Leiva from G.E. Capital Assurance, Linda Berg-Maney and Peter Bokjov from John Hancock, and Bonnie Davis and Jim DuEst from UnumProvident. All of these individuals devoted a significant amount of time to assure that the sample of home care claimants was representative, that data from administrative systems was uniform and accurate, and that the fieldwork could be completed successfully. We are grateful for their patience and good cheer during the entire research process.
The project's technical advisory group included Susan Morisato, FSA, Bankers Life and Casualty, Bob Yee, FSA, of G.E. Capital Assurance, Christopher Murtaugh, Ph.D., Center for Home Care Policy and Research, Vicki Freeman, Ph.D., Rand Corporation, Randy Brown, Ph.D., Mathematica Policy Research, Inc., Brenda Spillman, Ph.D., Agency for Health Care Policy and Research, Nancy Miller, Ph.D., Health Care Financing Administration. Along with Dr. Laurence Branch of Duke University, the committee provided critical input into the initial design of the project and its sampling strategy.
A number of key individuals helped in the interpretation of these study findings, provided important input into this final report, and assisted in refining the analyses contained herein. We would like to thank Grant Ritter, Ph.D., Brandeis University; Christine Bishop, Ph.D., Brandeis University; and William Crowne, Ph.D. of the Medstat Group. Their input and guidance was invaluable. We would also like to acknowledge the assistance of Beth Jackson, Ph.D., and Laurie Meneades of the Medstat Group in preparation of the 1994 National Long-Term Care Survey Dataset.
Finally, we greatly appreciate the patience, guidance, and advice of our two project officers and financial sponsors: Pam Doty, Ph.D., at the Office of Disability, Aging and Long-Term Care Policy of the Department of Health and Human Services, Office of the Assistant Secretary for Planning and Evaluation and Penny Feldman, Ph.D., of the Robert Wood Johnson Foundation Home Care Research Initiative. Their unwavering support and encouragement enabled us to overcome many of the hurdles presented by a study of this magnitude.
Of course the contents of this report are the sole responsibility of its authors. Any errors are the authors alone.
EXECUTIVE SUMMARY
In April of 1999, a report entitled "A Descriptive Analysis of Patterns of Informal and Formal Caregiving among Privately Insured and Non-Privately Insured Disabled Elders Living in the Community" was submitted to the Department of Health and Human Services and the Robert Wood Johnson Foundation. The purpose of that report was to provide basic descriptive statistics on disabled policyholders of private long-term care (LTC) insurance who had accessed long-term care benefits in the community. Information about these individuals and their service use was then compared to similar data among non-insured disabled community-dwelling elders.
Many of the comparative descriptive analyses in that report showed important differences between the privately insured and non-privately insured groups along a number of important dimensions. For example, we showed that individuals with private insurance use less informal care but, on average, use more total weekly assistance with activities of daily living (ADLs) and instrumental activities of daily living (IADLs) than do those without insurance. We also showed that the use of Medicare funded home health services is much lower among the privately insured than among those without private insurance. Finally, a significant minority of individuals with private LTC insurance reported undermet ADL needs.
While all of these bivariate results were found to be statistically significant, because no other possible explanatory variables were controlled for, one could not attribute these differences to the presence of insurance. In this report, we employ a number of multivariate analytic techniques to begin to do so. Thus, the purpose of this report is to enhance our understanding of the factors associated with these differences and to begin to identify the independent effect or role played by LTC insurance. We also analyze the underlying dimensions of satisfaction that are related to the claimant's evaluation of the insurance policy.
Key findings are presented below.
The Impact of Private LTC Insurance on Total Services Consumed
-
Having private LTC insurance does increase the amount of care received by individuals and the same can be said for having public LTC insurance (i.e. Medicaid). The presence of insurance increases weekly care by between 10 and 13 hours.
-
Benefits also appear to be distributed rationally: individuals with greater levels of ADL and IADL limitations receive more weekly care.
-
Finally, the net effect of having an informal caregiver is more care received and not less. Put another way, the additional care financed by insurance does not lead to an overall reduction in the total care received by individuals. Even in cases where informal caregiving may decline, this is more than offset by increases in formal caregiving.
The Impact of Private LTC Insurance on the Use of Medicare Financed Home Health Care Services
-
Above and beyond selection effects, individuals with LTC insurance are less likely to access Medicare home health services than are those without the insurance.
-
Given the demographic and health characteristics of the privately insured, their rate of Medicare home health use is only one-half of what would be predicted -- 5.6% compared to 11.1%.
-
Expansions in the market for private insurance should be accompanied with declines in Medicare home health usage and expenditures. For every 100 privately insured claimants, Medicare saves annual costs of up to $20,647 (1999 dollars).
The Relationship between Insurance Status and Undermet Need
-
Privately insured claimants are more likely to report undermet ADL need than are the non-privately insured. Yet, when holding other variables constant, having private LTC insurance does not influence whether or not someone reports undermet ADL need.
-
The majority of claimants do not report undermet needs. However, individuals with multiple caregivers and those who receive a great deal of care informally are most likely to report undermet ADL need.
-
While both age and disability status are positively associated with the probability of reporting undermet need, the effects moderate somewhat among the oldest and most disabled individuals. This suggests that the insurance is helping to address the needs of the group most "at risk" for potentially having to access more costly institutional care.
-
The fact that a sizeable minority of individuals reports undermet ADL needs indicates problems in the service delivery system. Such problems as the lack of clear lines of responsibility vis-à-vis coordination of care and inadequate caregiver training are among the most important underlying individuals' sense that their ADL needs are not being adequately met.
Consumer Satisfaction with Private LTC Insurance
-
When it comes to claimants' evaluation of the insurance policy, the critical dimensions of satisfaction with insurance benefits include how much care people are receiving, how individuals are treated by the insurance company at claim time, the characteristics of the insurance policy, and whether the policy allows them to remain living in the community.
-
Although policy design is important to claimant satisfaction, it is not the most important variable. The interaction between the insurance company and the claimant at claim time and how a claim is serviced are critical to the claimant's overall evaluation of the policy.
Conclusions
These multivariate analyses demonstrate that it is not just who is buying the insurance that explains differences in service utilization, but the presence of the insurance itself. Findings presented here suggest that, while the insurance clearly finances greater levels of formal care, its benefits do not replace informal care. In fact, reductions in the level of informal caregiving are more than offset by increases in formal care.
There is also an interaction between the insurance and use of Medicare home health services. Those who have LTC insurance are much less likely to access Medicare funded services. Thus, as the market continues to grow, reductions in Medicare financed home health services can be expected to decline. Whether this would be sustained over time is a question that cannot be answered from this data.
There are lessons for insurance companies as well. Insurers will need to broaden their role and focus on how to help individuals use benefits judiciously. They may also be called upon to take a more active role in monitoring the quality of providers and assuring that services are meeting needs. Results presented here strongly suggest that, as more people seek to protect themselves against the catastrophic costs of long-term care, successful marketing and retention of policyholders will depend on the customer service strategies of insurance companies as well as on the inherent value of their products.
BACKGROUND
In April of 1999, a report entitled "A Descriptive Analysis of Patterns of Informal and Formal Caregiving among Privately Insured and Non-Privately Insured Disabled Elders Living in the Community" was submitted to the Department of Health and Human Services and the Robert Wood Johnson Foundation. The purpose of that report was to provide basic descriptive statistics on disabled policyholders of private long-term care (LTC) insurance who had accessed long-term care benefits in the community. Information about these individuals and their service use was then compared to similar data among non-insured disabled community-dwelling elders.
In that report, we provided detailed descriptive information on the socio-demographic and service utilization profile of disabled claimants receiving home and community-based care benefits under their LTC insurance policies. We also characterized the level and mix of informal and formal support received by disabled claimants, and this was compared to a nationally representative sample of non-privately insured disabled elders living in the community. Identified were the factors associated with observed differences between the two groups in relation to the utilization of home care, and measured was caregiver effort on each group's behalf. Finally, we evaluated claimant and caregiver perceptions regarding the value of their LTC policy and estimated the extent of unmet and undermet need. The findings of the descriptive analyses served as a basis for highlighting important policy implications related to the service delivery system and to the design of private and public LTC policies and programs.
Because claimants with private LTC insurance had never been studied, let alone compared to disabled individuals without insurance, the basic descriptive information generated from the study has made an important contribution to the knowledge base. Moreover, many of the comparative descriptive analyses showed important differences between the privately insured and non-privately insured groups along a number of important dimensions. For example, we showed that individuals with private insurance use less informal care but on average use more total weekly assistance with activities of daily living (ADLs) and instrumental activities of daily living (IADLs) than do those without insurance. We also showed that the use of Medicare funded home health services is much lower among the privately insured than among those without private insurance. Finally, a significant minority of individuals with private LTC insurance reported undermet ADL needs.
While these findings are important, it is difficult to know what explains these observed differences. That is, we cannot know whether greater use of care among the privately insured is due to factors unrelated to the presence of insurance benefits. Perhaps the privately insured are more disabled, are more likely to be married, have greater wealth, or differ in other ways that result in their having a higher propensity to consume services. Until these other variables are controlled for, it is difficult to know the extent to which having insurance itself influences service use. For those interested in studying, regulating, or helping to develop and encourage growth in the private insurance market, having such information is particularly important.
PURPOSE
The purpose of this report is to attempt to isolate the independent effect of LTC insurance on patterns of formal and informal caregiving. This will be done through the use of multivariate analytic techniques. Key differences between the privately insured and non-privately insured that warrant further exploration include the following:
On average disabled individuals with private LTC insurance received many more hours of ADL and IADL care each week compared to those without private insurance -- 65 hours compared to 51 hours;
Privately insured disabled elders are much less likely to use Medicare funded services than are disabled elders without insurance -- 6% compared to 29%;
Privately insured disabled individuals are more likely to report having undermet ADL needs than are uninsured disabled elders -- 25% compared to 17%.
While all of these bivariate results were found to be statistically significant, in the absence of other controls, one cannot attribute the differences to the presence of insurance. In the analyses that follow, we employ multivariate analytic techniques to do so. We also analyze the underlying dimensions of satisfaction that are related to the claimant's evaluation of the insurance policy.
METHOD AND DATA
A. Data
The analysis presented below is based on the integration of two distinct datasets. These are the:
- 1999 Private LTC Insured Panel;
- 1994 National Long-Term Care Survey (1994 NLTCS).
The Insured Panel is comprised of disabled individuals who are currently receiving benefits under their LTC insurance policy and disabled policyholders that have not yet accessed benefits. The subset of the 1994 NLTCS that we use is comprised of individuals who are disabled in the community.1
The Insured Panel
Eight LTC insurers provided a qualified sample of 849 claimants who were receiving benefits under their LTC policies in the community. Of these, 693 participated in the study -- 82% of those contacted. These individuals had policies covering both nursing home care and home health care and were age 65 and over. A trained nurse or social worker interviewed each in their home.2
In addition, we interviewed by telephone 670 policyholders (randomly selected from non-claimants) to identify the proportion of individual policyholders who may be disabled (i.e. have two or more limitations in activities of daily living (ADLs) or are cognitively impaired) but not accessing insurance benefits. Only four non-claimants were identified as disabled.3 Based on this exercise, we concluded that claimants were not a sub-set of disabled policyholders. We did add the four disabled policyholders to the 693 claimants to get an Insured Panel based on 697 individuals.
Why are disabled non-claimants added to the sample of disabled claimants? This is because the key research questions relate to the impact of LTC insurance policy ownership on the use of formal and informal services. Suppose the insured sample was comprised only of claimants, who by definition are in the sample because they have a propensity to use services. The sampling basis for the non-insured sample -- the 1994 NLTCS -- is the presence of ADL or IADL limitations, that is, disability status. Individuals in that sample may or may not be using formal services. Thus, the non-insured sample includes disabled persons with and without a propensity to consume formal services. If we compared service utilization between the 1994 NLTCS and a sample comprised wholly of LTC insurance claimants, we would not be able to rule out the competing interpretation that any statistically significant differences in service use result from insured individuals' propensity to consume services rather than from the presence of insurance. Even if we were able to identify or match a sub-set of individuals from the non-insured sample who "looked like LTC insurance purchasers" the problem would not be solved: this is because by definition, a claimant sample would have been comprised of individuals with a propensity to consume services.
To make the samples more comparable, that is, "drawn" on a similar basis, we include in the claimant sample individual policyholders who are disabled (by the insurance policy definitions) but who do not make claims on their insurance. In this way, it is disability status and not service use that represents the underlying sampling basis for the Insured Panel, and this can be compared directly to the 1994 NLTCS Panel.
The 1994 NLTCS Panel
The 1994 National Long-Term Care Survey (NLTCS) was designed to collect data about the health and function of the Medicare beneficiary population age 65 and older. The questions were meant to identify persons who had certain disabilities or health problems lasting three months or longer. In general, individuals who completed a comprehensive community survey were those who had at least one chronic limitation in either an instrumental activity of daily living (IADL) or in an activity of daily living (ADL). The total 1994 NLTCS sample consisted of 4,167 individuals.
Only a sub-set of the Insured Panel and the NLTCS sample are used in the analyses that follow. This is because the criterion for inclusion in the 1994 NLTCS, a limitation in one or more IADLs or ADLs, is typically more liberal than the criteria for inclusion in the Insured Panel sample -- disability defined as having two or more ADL limitations or cognitive impairment. Thus, unless disability level was controlled for, we would not be able to make direct meaningful comparisons of the two populations.
To make the sampling basis of the two populations more similar, we applied the same minimum disability threshold to both samples. The criteria that are applied to individuals in each sample include being:
- disabled in at least two out of six ADLs that require some level of human assistance;4 or
- cognitively impaired as measured by the Short Portable Mental Status Questionnaire (SPMSQ);5 or
- diagnosed with dementia or Alzheimer's disease .
Once these minimum disability selection criteria are applied, the samples can then be compared one to the other on all dimensions related to formal and informal service use. All subsequent analyses are based on sub-samples that reflect this underlying minimum disability threshold.
The NLTCS sub-sample is comprised of 1,357 individuals (out of 4,167) and the claimant sub-sample is comprised of 581 individuals (out of 697).6
B. Multivariate Modeling
Although the sampling basis of the two samples is comparable, the underlying populations from which the two samples are drawn differ in several respects. Figure 1 shows, for example, that there are major socio-demographic differences between the privately insured and the non-privately insured samples.
Aside from these known and identifiable differences, there is a high likelihood that there are other unobserved differences between the two groups that could affect service utilization in systematic ways. If unaccounted for, such differences could lead to biased estimators on other variables. An underlying assumption of multivariate modeling is that the effects of omitted (unobserved or unmeasured) variables are randomly distributed. If such effects are not randomly distributed, their exclusion from a model can lead to biased estimates of the coefficients of other included variables, including the key indicator variable -- insurance status.
To address this problem in subsequent analyses, where appropriate, we will employ sample selection models. These models allow one to control for the effect of unobserved variables related to having an insurance policy. Put another way, these models allow us to isolate the effects of "who purchases insurance" from the effect of "who has insurance". This enables us to isolate the "insurance purchase bias" from the "insurance effect" (See Appendix 1 for more detail).
| FIGURE 1: Differences in Socio-Demographic Characteristics of Disabled Elders by Insurance Status |
 |
| SOURCE: 1999 Insured Panel (n=583). For income, n=483. 1994 NLTCS data (n=1357). For education variable, n=1276. NOTE: Differences are significant at the .05 level. |
FINDINGS
In the section that follows, we present the findings from each of the multivariate analyses. We begin by focusing on the observed differences between the total number of hours of care used by each of the two groups.
A. Use of Long-Term Care Services
The descriptive analysis showed that the privately insured disabled population receives an average of two hours more per day of ADL and IADL assistance than does the disabled population without private insurance -- 65 hours per week compared to 51 hours (DHHS & RWJ, 1999). Much of this is attributable to the receipt of formal services. Second, while about 63% of all ADL assistance to the privately insured is provided by formal caregivers, the figure is only 30% for the non-privately insured. Third, the non-insured population is much less likely to use formal caregivers for IADLs; in fact, informal caregivers provide 80% of IADL assistance to the non-privately insured, whereas only 45% of IADL assistance is provided informally to those with private insurance.
To test whether or not the presence of LTC insurance has an effect on total service use even after controlling for other variables, we employed the sample selection technique outlined in Appendix 1. Table 1 summarizes the results for three separate equations. The first is a probit analysis for insurance ownership. It is based on the entire sample and estimates the probability that an individual will have private LTC insurance. The coefficients derived from this equation are used to calculate the Inverse Mills Ratio (IMR). The IMR is entered as a regressor in the second equation. This equation estimates the weekly hours of care exclusively for the Insured Panel. By including the IMR in this equation, we are controlling for selection effects on service utilization that are associated with being a LTC insurance policyholder. The third and final equation is estimated from the combined sample -- insured and non-insured -- and includes a dummy variable for having insurance. Again, the dependent variable is the total number of weekly hours of ADL and IADL assistance received by the disabled individuals.7
As shown in the results of the second equation, the coefficient on the IMR was not found to be significant. This indicates that selection bias is not present in the model.8, 9
| TABLE 1. Probit and Regression Model for Expected Number of Weekly Hours of ADL and IADL Care Received (standard errors in parentheses) | ||||
|---|---|---|---|---|
| Variable | Mean Value (Total Sample) | Having/ Not-Having Insurance (n=1,805) | Insured Only Total Weekly Hours of ADL and IADL Care (n=467) | Total Sample Total Weekly Hours of ADL and IADL Care (n=1,822) |
| Age | 81 | -.0134*** (.004) | -.390 (.264) | .464*** (.122) |
| Gender (0=Male) | .68 | .05683 (.0707) | -4.929 (3.57) | -2.278 (1.969) |
| Living Alone (0=No) | .26 | .38512*** (.079) | -15.113*** (4.43) | -6.863 (2.255) |
| Education (0=less than high school) | .30 | .7793*** (.072) | ----- | ----- |
| Having Children nearby (0=No) | .64 | -.01984 (.069) | ----- | ----- |
| ADL Impairments (0=<3) | .59 | ----- | 25.118*** (3.82) | 26.891*** (2.156) |
| IADL Impairments (0=<6) | .69 | ----- | 7.525 (4.79) | 25.782*** (2.289) |
| Self-assessed health (0=excellent, good or fair) | .32 | ----- | 2.330 (3.53) | 7.331*** (2.026) |
| Cognitive Impairment (0=No) | .54 | ----- | 8.971*** (3.34) | 5.015*** (1.898) |
| Presence of Informal Caregiver (0=No) | .86 | -.3339*** (.089) | 7.237*** (4.57) | 6.811*** (2.767) |
| LTC Insurance (0=None) | .30 | ----- | ----- | 10.856*** (3.636) |
| Income | $22,659 | .0354*** (.002) | -2.91 (.233) | .370*** (.097) |
| LTC Insurance Income | $11,4421 | ----- | ----- | -.362*** (.115) |
| Medicaid as a payer (0=No) | .04 | ----- | ----- | 13.462*** (4.698) |
| Had a Stroke (0=No) | .18 | ----- | 4.993 (3.71) | 10.771*** (2.424) |
| Inverse Mills ratio | .40 | ----- | 9.786 (8.26) | ---- |
| Constant | ----- | -1.078*** (.361) | 68.822*** (22.262) | -35.376*** (10.270) |
| Adjusted R2 | ----- | ----- | 20.5% | 31.7% |
Significance Level * p=.10; ** p=.05; *** p=.01.
| ||||
Consider first, the characteristics associated with having insurance. As shown, age, living arrangement, education level, income and the presence of an informal caregiver are all significantly related to having LTC insurance. On the other hand, older age and the presence of an informal caregiver are negatively associated with having insurance.
That older age is negatively related to insurance purchase may reflect the fact that LTC insurance premiums are level funded but age-rated. This means that the premiums that individuals face increase substantially at older ages and therefore the probability of having a policy may decline as the policy price increases. The negative relationship between the presence of an informal caregiver and LTC insurance policy ownership is also not surprising. The absence of an available informal caregiver would be a primary motivation for purchasing LTC insurance. The insurance is designed to bring formal (paid) caregivers into the home. Individuals who want to remain in their homes and who would need to rely solely on formal caregivers if they became disabled because they lack informal support should find LTC insurance attractive. Similarly, individuals who live alone are more likely to have the insurance than are individuals who live with a spouse or children. Finally, gender and the presence of children living within 25 miles were not significant predictors of insurance status.
The second equation shows the relationship between explanatory variables and hours of care for the Insured Panel only. A primary purpose was to test whether or not the Inverse Mills Ratio (IMR) was statistically significant. Out of 11 variables tested, four were found to be statistically significant and the adjusted R2 was 20.5%. The coefficient on the IMR was not statistically significant, thus indicating that there are no selection effects present.
The third equation is used to estimate the equation for care hours for the combined sample. Thirteen variables were found to be significant predictors of the number of hours of ADL and IADL care received. These variables are discussed below.
Socio-Demographic Characteristics
Age is positively associated with use of formal and informal long-term care services, even when controlling for disability and cognitive status. This variable probably captures additional factors related to frailty and individuals' perceived sense of need for supervision and assistance in performing ADLs and IADLs. When accounting for other variables, living alone was negatively associated with the number of hours of care received. In fact, those who live alone use about seven fewer hours of care compared to those living with another person.10
The relationship between income and care received is more complicated. Because a great deal of LTC is provided informally, the price of care faced by individuals can vary greatly, depending on the availability of informal supports. For most "normal" goods, increased levels of income lead to greater levels of demand for that good. Income is positively related to the number of hours of care received. However, when interacted with insurance status, the effect of income is moderated, as indicated by the negative coefficient on the interaction term. This is what one would expect: having insurance reduces or even eliminates the effect of income variation on the demand for care at the time that need is experienced. In this sample, the effect of income on consumption of services is overwhelmed by the presence of private LTC insurance.
Health Characteristics
Not surprisingly, functional disability status is related to the amount of weekly care received. Individuals with more than three ADL limitations receive about 27 more hours of care per week than do those with fewer limitations. Individuals with significant IADL impairments also receive more weekly hours of care than do those with fewer limitations -- about 26 hours. Although not shown in the table, the beta coefficients on disability variables suggest that they have the greatest impact on the amount of care received. It is also interesting to note that both types of disabilities are associated with greater use of personal care; when there is significant disability in either of these broad categories of function, a great deal of human assistance is required.
Individuals who are cognitively impaired also receive more care -- about five more hours per week -- than do those who are cognitively intact. Finally, self-assessment of health status is related to the amount of care received. Individuals, who view their health as poor, are also more likely to use more weekly assistance -- about seven hours per week.
We also tested eight diagnoses to determine which, if any, were related to use of care in the community.11 With the exception of stroke, none were significantly related to the hours of care received. If an individual had suffered a stroke, they were likely to receive about 11 more hours of care per week (compared to those who had not had a stroke).
Informal Support Availability
Individuals can receive care from two sources: formal service providers or informal supports. When individuals do have an available informal caregiver they receive more care, about seven more hours per week. This is true even when controlling for insurance status. This suggests that both the informal and formal service systems continue to contribute hours of care to disabled elders, even among those who have the financial wherewithal or insurance to purchase formal care only. Clearly, formal and informal care are not perfect substitutes for each other.
Insurance Variables
Two types of insurance have been included in the model: (1) private LTC insurance and (2) public insurance, Medicaid. The latter can be viewed as a public insurance program with a very large deductible. Economic theory suggests that in the presence of insurance, the marginal cost of the insured good is lower, thus increasing quantity demanded of the good. A primary motivation for purchase of LTC insurance is to ensure access to formal services. Medicaid also guarantees continued consumption of formal nursing home care as well as home and community-based care, although on a somewhat more restrictive basis.
Our analysis indicates that the price-quantity relationship is borne out: even when controlling for the other variables, those who have private LTC insurance or public insurance (Medicaid) use more care. In fact, everything else held constant, individuals with LTC insurance receive about ten more hours of care per week, and those receiving Medicaid receive 13 more hours per week than do individuals without any insurance.12, 13
The positive coefficient on the insurance variable, as well as on the informal caregiver variable, suggest that even though there may be some degree of substitution between formal and informal care, the net effect of insurance on total care received is still positive. Put another way, the decline in informal caregiving that may result when insurance benefits are paid is more than offset by the increase in formal care provided. This is true for both the private and the public insurance systems.
Summary
Clearly, individuals with private LTC insurance differ in relevant respects from those without insurance. Nevertheless, we did not find selection effects on service utilization among the insurance sample. This may reflect the fact that insurance companies are effective in the underwriting process and are able to screen out individuals who have a proclivity to service use, given certain revealed characteristics at the time that they apply for insurance.
Having private LTC insurance does increase the amount of care received by disabled individuals, and the same can be said for having public LTC insurance. The presence of insurance increases weekly care by between 10 and 13 hours. Benefits also appear to be distributed rationally: individuals with greater levels of ADL and IADL limitations receive more weekly care. Additionally, the insurance effect substantially eliminates the effect of income variation on the demand for hours of care. Finally, the net effect of having an informal caregiver is more total care received. The additional care financed by insurance does not lead to an overall reduction in the total care received by individuals. Even in cases where informal caregiving may decline, this is more than offset by increases in formal caregiving.
B. Use of Medicare Financed Home Health Care Services
While we could not discern payment sources for each particular home care service for the two samples, we were able to identify the payment source for formal care as a whole, and thereby compare the distribution of payment sources for home care services. As a starting point, it is important to remember that virtually all individuals in the Insured Panel use formal services and that the majority (more than 70%) do not pay anything out-of-pocket for these services.
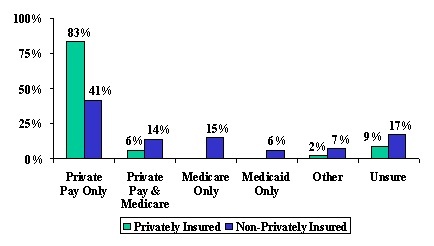
In the analyses that follow, we focus on the subset of individuals who use formal (paid) services. As shown in Figure 2, Medicare is not a particularly important payment source for the privately insured, in contrast to the non-privately insured, where roughly 30% of disabled elders use Medicare as a payment source for home care services.14 For every privately insured individual accessing Medicare, there are five non-privately insured, disabled elders doing the same.
| FIGURE 2: Payment Sources for Home Care Services by Insurance Status |
 |
| SOURCE: 1999 National Claimant Study (n=586) and 1994 NLTCS data (n=1357). |
There may be a number of reasons why the privately insured access Medicare services less frequently than do the non-privately insured. First, because LTC insurance contracts include coordination of benefits clauses, the overlap between receipt of Medicare services and receipt of LTC insurance benefits ought to be minimal. Second, given that people are paying premiums for policies that cover home care, there may be less incentive and general awareness about the ability to access Medicare benefits for home health care services. Finally, the health and medical status of the privately insured may vary significantly from the non-privately insured, and there may be less need or demand for the skilled post-acute services for which Medicare has been a traditional payer. In order to test this last observation, we show the differences between insured and non-insured individual users and non-users of Medicare funded home care services.
| TABLE 2. The Characteristics Associated with Medicare Use Among Individuals who Use Formal Services by Insurance Status | ||||
|---|---|---|---|---|
| Characteristics | Privately Insured | Non-Privately Insured | ||
| Use Medicare (n=36) | Do Not Use Medicare (n=550) | Use Medicare (n=165) | Do Not Use Medicare (n=404) | |
| Average Age | 78 | 79 | 82* | 83 |
| Female | 47%** | 67% | 71% | 73% |
| ADL Limitations | 4.6*** | 3.7 | 3.6* | 3.3 |
| IADL Limitations | 7.4 | 7.3 | 7.0 | 6.7 |
| Perceived Health to be Poor | 47%** | 29% | 48%*** | 37% |
| Cognitive Impairment | 50% | 35% | 34%*** | 51% |
| Presence of Informal Caregiver | 81% | 78% | 90% | 90% |
| Living Alone | 19% | 29% | 29% | 35% |
| Income | $28,000*** | $41,000 | $15,000 | $16,000 |
| Number of Medical Diagnoses | .75** | .57 | 1.2*** | .9 |
| ANOVA F-statistic significance level: * .10; ** .05; *** .10. | ||||
Table 2 shows that perceived health status, the number of ADL limitations, and the number of medical diagnoses are all related to use of Medicare home health, across both samples. Within the Insured Panel, having a lower income and being female are also characteristics that are associated with use of Medicare funded services. For the non-privately insured population, the cognitively impaired are less likely to access Medicare than are the cognitively intact. Because many of these characteristics may be related one to the other, they were entered into a logistic equation so that the independent effect of each could be adequately captured. In some cases, variables were transformed so as to aid in the interpretation of results. Table 3 summarizes results.
As shown, four variables are significantly related to the probability of using Medicare home health care services. These include having three or more ADL impairments, a self-health assessment of poor, having LTC insurance, and income. The odds ratio is presented in the third column of the table and is labeled Exp (B). The odds ratio can be used to interpret the magnitude of the effect of each variable on the probability of using Medicare home health. For example, the odds of using Medicare home health are 1.86 times greater for those with at least three ADL limitations. Also, individuals who assess their health to be poor are 1.78 times more likely to access Medicare services than are those who assess their health to be fair, good or excellent. As income increases, the probability of accessing Medicare declines.
| TABLE 3. Logistic Regression Model for Use of Medicare Home Health Care (total sample) | |||
|---|---|---|---|
| Variable | Coefficients | Standard Error | Exp (B) |
| Age (0=below age 80) | -.1578 | .262 | .85 |
| Gender (0=Male) | -.2107 | .266 | .81 |
| ADL Impairments (0=less than 3 impairments) | .6196** | .265 | 1.86 |
| Self-assessed health (0=excellent, good or fair) | .5775** | .258 | 1.78 |
| Cognitive Impairment (0=No) | -.0177 | .258 | .98 |
| LTC Insurance (0=None) | -1.776*** | .326 | .17 |
| Income | -.0238*** | .009 | .98 |
| Number of Diagnoses | .2117 | .138 | 1.24 |
| Constant1 | -.2823*** | .604 | ---- |
| NOTE: The equation was tested with age and ADL status as continuous variables. The results for these and other variables did not differ but the model did not fit the data as well. Therefore, we have modeled both of these variables as dichotomous. Also note that an income and insurance interaction term was tested and found not to be significant. Significant Level * p=.1; ** p=.05; *** p=.01; (n=418). Nagelkerke R2=34.6%
| |||
There is a negative relationship between Medicare use and insurance status. Individuals with LTC insurance are only .17 times as likely to access Medicare as are those without private insurance. Put another way, those without insurance are about six times as likely to access Medicare as are those with insurance, holding income and other variables constant.15
While the above equation clearly demonstrates that individuals with LTC insurance are less likely to access Medicare, selection effects may also be present. That is, it may be that there are unobserved differences among individuals who purchase LTC insurance that are related to the probability of using Medicare. If we don't control for selection effects, then we may incorrectly attribute lower Medicare utilization among the privately insured solely to the presence of insurance. In circumstances where the dependent variable is measured at the interval level, the Inverse Mills Ratio for insurance purchase would be entered into the equation predicting Medicare use among the insured group only. If the coefficient on the Inverse Mills Ratio was found to be significant, then this would indicate the presence of selection effects. However, the Inverse Mills Ratio can only be used in cases where the dependent variable is normally distributed. Because we are modeling a dichotomous dependent variable, i.e., whether or not an individual uses Medicare home health care, an alternative method for testing selection effects must be employed.
Identification of selection effects implies that we are trying to determine whether or not there is a "disinclination" among a privately insured group to use Medicare funded home health care services. To separate out this possible effect from the pure "insurance effect", we focus our analysis on the sub-set of individuals who do not have private insurance; that is, on disabled individuals drawn exclusively from the 1994 NLTCS dataset. For each person in this sample, we predict whether or not they "should have insurance". This is done by employing the logistic regression coefficients estimated for the insurance purchase decision developed previously (see Table 1). If the predicted probability for each individual in the 1994 NLTCS is greater than or equal to 50%, then the individual is placed into the "predicted insurance group." If the probability is less than 50%, they are placed into a "predicted non-insurance group." In essence, these two groups serve as proxies for those who do and do not have private insurance.
We then examine the rate of Medicare use between the two groups. If there is a statistically significant difference between the rate of use between the two groups, then we can be reasonably certain that there are, in fact, selection effects present. Put another way, we can estimate the magnitude of the "disinclination to use Medicare" among individuals who have characteristics associated with owning a private LTC insurance policy but do not, in fact, have one. This difference, which is based on our proxy groups, can be used to gauge the magnitude of any selection effects between the actual groups of privately and non-privately insured individuals.
Application of the logistic regression equation to the group of non-privately insured formal service users predicts that 11.0% "should have had" private LTC insurance. That is, given the characteristics of the 1994 NLTCS sample of service users, the logistic regression predicts that 11.0% of them would have private LTC insurance. The individuals predicted to have insurance are typically younger, have much higher incomes, are more educated, and are less likely to have a child living nearby or have an informal caregiver than are those predicted to not have insurance. Table 4 summarizes the rate of Medicare usage among the groups.
| TABLE 4. Predicted Rate of Medicare Home Health Use among Individuals Predicted to Have or Not Have Private LTC Insurance | ||
|---|---|---|
| Use Medicare Home Health | Do Not Use Medicare Home Health | |
| Predicted to have Insurance | 31.2%* | 68.8% |
| Predicted not to have Insurance | 20.7% | 79.3% |
| X2 = 2.696; * significant at the .10 level. (n=1,155). | ||
As shown, the difference in the rate of Medicare use between the two groups is statistically significant at the .10 level. Only 20.7% of individuals predicted to have private insurance use Medicare compared to 31.2% of those predicted not to have insurance. This statistically significant difference suggests the presence of selection effects. Put another way, individuals who have characteristics associated with LTC insurance ownership are also less inclined to use Medicare home health care. The rate of use among those predicted to have insurance is about one-third lower than among those predicted not to have insurance.
We have clearly established that those with private insurance access Medicare funded home care services much less frequently than do those without insurance. Some of this is due to selection effects and some due to the presence of insurance. To gauge the magnitude of the two effects, we first estimate an equation for predicting Medicare usage among the non-privately insured population. This equation is then used to predict such usage among the insured population. The difference between the actual rate of Medicare home health usage and the predicted rate of use provides a basis for evaluating the initial magnitude of the insurance effect. Table 5 shows the estimated equation for Medicare use among the non-privately insured population.
| TABLE 5. Logistic Regression Model for Use of Medicare Home Health Care Among Non-Privately Insured Disabled Elders | |||
|---|---|---|---|
| Variable | Coefficients | Standard Error | Exp (B) |
| Age | -.0342** | .015 | .97 |
| Gender (0=Male) | .1702 | .251 | 1.19 |
| ADL Impairments (0=less than 3 impairments) | .4673** | .245 | 1.60 |
| Self-assessed health (0=excellent, good or fair) | .2258 | .245 | 1.25 |
| Cognitive Impairment (0=yes) | -.2740 | .250 | .760 |
| Medicaid (0=no Medicaid) | .6064* | .332 | 1.83 |
| Income (0=less than $25,000) | -.1405 | .281 | .88 |
| Number of Diagnoses | .2591** | .123 | 1.30 |
| Constant1 | 1.6783 | 1.26 | -------- |
| Significance Level * p=.10; ** p=.05; *** p=.01. (n=360). Nagelkerke R2 = 10.8%.
| |||
Four variables are significantly related to the probability of using Medicare among the non-privately insured disabled population. These include age, having more than three ADL impairments and the presence of multiple medical diagnoses. Also, individuals who depend on Medicaid are more likely to access Medicare funded services than are non-Medicaid eligibles.
When we use the estimated coefficients from this equation to predict Medicare usage among the Insured Panel, we derive a predicted use rate of 11.1%. This means that, given the characteristics of the Insured Panel, one would expect that 11.1% would have been accessing Medicare funded home health care services. Instead, only 5.6% did so, thus indicating a usage rate of approximately half of what would be expected. One-third of this difference is due to selection effects (see Table 4) and two-thirds due to the presence of LTC insurance.
Further analysis of the 1994 NLTCS suggests that the average cost of a Medicare reimbursed home health visit for these disabled individuals was $64.67; the average number of visits that year was 51. Thus, annual Medicare home health expenditures were $3,298 per person. By applying this information to the privately insured population and inflating the dollars to 1999 levels, we find that for every 100 privately insured claimants, Medicare saves annual costs of up to $20,647 16. Again, two-thirds of these savings are due to the insurance effect and another third are due to the propensity of these individuals to avoid accessing Medicare.
Summary
The analysis presented here suggests that individuals with LTC insurance are less likely to access Medicare home health services than are those without the insurance. Moreover, given their demographic and health characteristics, the rate of use among the privately insured is up to one-half of what would be predicted, were these individuals not to have their insurance.
The models do not do a very good job of explaining the variation in the Medicare home health care use. While more than 20 different variables were tested, in no model did more than four variables turn out to be significantly related to Medicare use. This suggests that there is wide variation in the use of this benefit and that much remains to be learned about how and why individuals -- with and without insurance -- access it.17
C. The Relationship between Insurance Status and Undermet ADL Neet
Much of the current research on long-term care is focused on characterizing the disabled population, identifying the type and level of services needed and used, and estimating public and private expenditures on care. Given the development of both longitudinal and cross-sectional databases, researchers have also tracked trends in disability rates and service use over time. Yet, there has been almost no examination of how well disabled individuals actually function in the community. Although the number of dollars spent on home care has been increasing, this does not address the question of whether, at a given point in time, needs are fully served. We do not know, for example whether the service delivery system is adequately responding to the care needs of disabled elders living at home.
In the section that follows, we examine the relationship between insurance status and the perception of the performance of the formal and informal service system. More specifically, we focus on whether the service system is leaving people with a feeling that their ADL needs are being met. To measure this, we focus on the concept of Undermet Need. An undermet need is present when an individual indicates that he or she could use more help or believes that he/she had to wait too long to receive the help. The presence of an undermet need in ADLs may reflect the fact that caregivers are not available in a timely manner. This can result from scheduling difficulties or because, once in the home, caregivers are not providing the care when it is needed.
Figure 3 shows that the rate of reported undermet need is about 1.4 times greater among privately insured claimants than among non-insured disabled elders. This difference is statistically significant at the .05 level.
| FIGURE 3: Proportion Reporting Undermet ADL Needs by Insurance Status |
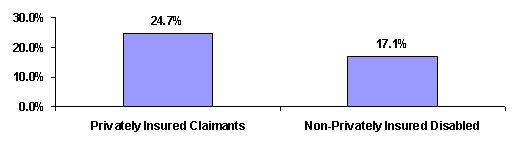 |
| SOURCE: 1999 National Claimant Study (n= 595 claimants); 1994 NLTCS (n=1,348). |
Given the differences in the characteristics and service use patterns of the two populations, until we control for relevant variables it is difficult to isolate the relationship between insurance status and the higher rate of reported undermet ADL needs. As shown in Table 6, there are significant differences in relevant characteristics between the two groups on almost all variables that one might expect to be related to reported levels of undermet ADL needs. For example, individuals in the insured sample reporting undermet ADL needs are more disabled (i.e. greater ADL and IADL impairments), have more ADL helpers, receive more hours of formal care, and have higher income levels than do those in the non-insured sample. Individuals in the non-privately insured sample reporting undermet ADL needs have more medical diagnoses, are more cognitively impaired, are more likely to perceive their health status to be poor, and are more likely to have informal caregivers and receive more hours of informal care.
| TABLE 6. Characteristics Associated with Reported Undermet ADL Needs by Insurance Status | ||
|---|---|---|
| Characteristics | Privately Insured (n=143) | Non-Privately Insured (n=230) |
| Average Age Percent over age 80 | 78 years 41%** | 80 years 50% |
| Percent Female | 68% | 69% |
| Number of ADL Limitations | 4.1*** | 3.8 |
| IADL Limitations | 7.4* | 7.1 |
| Perceived Health to be Poor | 29%*** | 53% |
| Cognitive Impairment | 42%*** | 69% |
| Number of Medical Diagnoses | .6*** | 1.2 |
| Presence of Informal Caregiver | 85%*** | 97% |
| Number of ADL Helpers | 2.3*** | 1.7 |
| Weekly Hours of Formal Care | 32.0*** | 15.3 |
| Weekly Hours of Informal Care | 38.9*** | 53.9 |
| Average Income | $36,918*** | $14,741 |
| Income Greater than $30,000 | 47%*** | 6% |
| ANOVA F-statistic significance level: *** .01; ** .05; * .10. | ||
Undermet ADL need is a binary variable for the existence of any reported undermet need. Table 7 reports the results of a logistic regression relating undermet need to a variety of independent variables. While each variable showing a significant difference in Table 6 was initially included in the equation, some were dropped because of the high degree of inter-variable correlation. Also, to aid in the interpretation of results, certain variables like age were transformed from continuous to categorical variables.
Table 7 shows that, of ten variables tested, nine were statistically significant at the .10 level or greater. Individuals over age 80 are 2.74 times more likely to report undermet ADL needs than are those under age 80. Moreover, ADL dependency is also positively related to the probability of reporting undermet ADL needs. An interesting result, however, is that when age and disability status is interacted, the effect on reported undermet need is negative. This suggests that while the probability of reporting undermet need increases with both main effects, age and disability, this is moderated by the interaction term. Put another way, the probability of reporting undermet need increases with age and disability, but at a decreasing rate. Those reporting the presence of cognitive impairment are also less likely to report undermet ADL needs than are their cognitively intact counterparts.18
| TABLE 7. Logistic Regression Model for Estimating the Probability of Reporting Undermet ADL Needs | |||
|---|---|---|---|
| Variable | Coefficients | Standard Error | Exp (B) |
| Percentage over age 80 | 1.0087** | .3925 | 2.74 |
| Number of ADLs | .2698*** | .0828 | 1.31 |
| ADLs interacted with Age | -.2935*** | .1008 | .75 |
| Self-assessed health (0=excellent, good or fair) | .3425** | .1786 | 1.41 |
| Cognitive Impairment (0=yes) | -.3121* | .1820 | .73 |
| Number of ADL Helpers | .5666*** | .0967 | 1.76 |
| Number of Hours of Informal Care | .0061*** | .0024 | 1.01 |
| Number of Hours of Formal Care | -.0046* | .0028 | .99 |
| Has LTC Insurance | .2303 | .2316 | 1.26 |
| Income | -.0156** | .0051 | .98 |
| Constant1 | -2.5525*** | .3329 | ------- |
| Significance Level * p=.10; ** p=.05; *** p=.01. (n=717). Nagelkerke R2 = 22.4%.
| |||
Another surprising finding is that, as the number of ADL helpers increase, the probability of reporting undermet ADL needs also increases. After age, this variable has the largest impact on the dependent variable.
This suggests that, when multiple caregivers are involved in caring for an individual, certain needs may "fall through the cracks". In the absence of clearly delineated lines of responsibility and accountability across caregivers, there is a much greater chance that individual ADL needs will not be attended to properly. Alternatively, it may be that individuals with more needs have more helpers, and there is a greater probability of having an undermet need as one's needs increase.
Whether care is provided formally or informally is also an important determinant of whether someone is likely to report undermet ADL needs. As shown in Table 7, as the number of hours of informal care increase, the probability of reporting undermet ADL needs also increases. In contrast, however, as the number of hours of formal care increase, the probability of reporting undermet ADL needs decreases. This suggests that when relatives or friends provide informal care, it may be perceived as inadequate. If this perception is valid, it would follow that training informal caregivers would better prepare them to respond to the multiple needs of their disabled care receivers.
Finally, increasing income levels are associated with lower levels of reported undermet ADL needs, and having LTC insurance is not related to the dependent variable at all. Even though the level of reported undermet need is higher among the privately insured sample, after allowing for the influence of age, disability status, service utilization patterns and income among the two groups, having LTC insurance in and of itself does not influence whether or not one's ADL needs are met.19
Summary
Clearly, long-term care insurance is succeeding in bringing formal caregivers into the homes of disabled elders, allowing many to remain in the community. The majority of claimants do not report undermet needs. Yet, somewhat surprisingly, individuals with multiple caregivers and those who receive a great deal of care informally are most likely to report undermet ADL needs. It is reasonable to assume that those who receive the most care also need it the most. For them, anything less than round-the-clock care may be perceived as a shortfall. Given that most insurance policies have daily limits on the amount of care that can be reimbursed, it may be that such policy limits lead to undermet needs for the most seriously impaired.
Another issue relates to care coordination. Findings presented here suggest that clear lines of responsibility vis-à-vis coordination of care may not always be present. Also, informal caregivers may not be adequately trained or responsive to meeting the needs of their disabled relatives. Both of these findings imply a need for greater coordination of care and for more training of informal caregivers. Similarly, although greater levels of formal care reduce the probability of reporting an undermet ADL need, problems with service availability and scheduling persist, and this contributes to undermet ADL need.
While both age and disability status are positively associated with the probability of reporting undermet need, the effects moderate somewhat among the oldest and most disabled individuals. This suggests that the insurance is helping to address the needs of the group most "at risk" for potentially having to access more costly institutional care. Finally, the presence of private LTC insurance does not influence whether or not someone reports undermet ADL needs. Even though the probability of reporting undermet ADL needs is greater among the privately insured, when the influence of other variables is taken into account, insurance is not a relevant factor. This supports the proposition that service delivery issues rather than insurance policy design are the most important factors underlying individuals' sense that their ADL needs are not being adequately met.
D. Consumer Satisfaction
The average age of individuals who purchase private long-term care insurance is 68 years. Yet, the average age of claimants is closer to age 80. This means that most LTC insurance purchasers can expect to hold their policy for 10 or more years before they might actually need to access benefits. During this premium payment period, the primary "benefit" of a policy is psychic in nature: individuals derive utility from knowing that the certain premium they pay reduces the uncertainty and ultimate financial risk they might face in the absence of a policy. Consumer satisfaction during this phase is a small matter. Once benefits commence, however, consumer satisfaction with the policy is a more relevant issue.
We asked claimants a series of questions related to general satisfaction with their insurance policy as well as with claims management practices. The focus of this section is on gaining a better understanding of the factors underlying individuals' general satisfaction with their policy. As shown in Figure 4, the vast majority of claimants is indeed satisfied with their policy. In fact, only about one in seven indicated that they were dissatisfied or very dissatisfied with their policy.
| FIGURE 4: Degree of Satisfaction with LTC Insurance Policy |
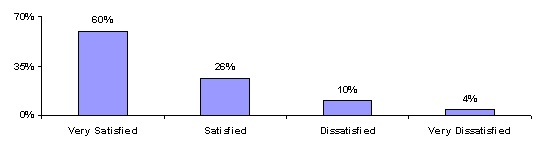 |
| SOURCE: 1999 National Claimant Study (n= 697 claimants). |
The general concept of satisfaction and an individual's rating of their degree of satisfaction is necessarily subjective. Still, one might expect that certain aspects of a policy or an insurer's interaction with a claimant would influence a claimant's general sense of satisfaction. For example, if a claimant reports having undermet needs even though they are receiving insurance benefits, one might expect that they would be somewhat less satisfied with their policy. Or perhaps individuals with policies that have low daily benefit amounts are unsatisfied. Table 8 shows the relationship between three classes of variables and policyholder satisfaction.
| TABLE 8. The Characteristics Associated with Satisfaction Levels | ||
|---|---|---|
| Characteristic | Satisfied with Policy (n=599) | Dissatisfied with Policy (n=98) |
| Demographic Characteristics | ||
| Average Age (years) | 79* | 80 |
| Gender (percent female) | 68% | 64% |
| Income | $37,000 | $40,000 |
| Number of ADL dependencies | 3.2* | 3.6 |
| Presence of Informal Caregiver | 77% | 75% |
| Presence of Undermet ADL Need | 23% | 28% |
| Insurance Policy Characteristics | ||
| Policy type: Disability policy | 10%* | 5% |
| Daily Benefit Amount | $79 | $81 |
| Duration of Coverage | 4.6 years* | 3.9 years |
| Claims Administration and Claimant Experience | ||
| Had no difficulty filing policy | 77%*** | 28% |
| Had difficulty understanding the policy | 19%*** | 62% |
| Had a disagreement with the company | 12%*** | 62% |
| Coverage is adequate to meet most needs | 65%*** | 30% |
| Chose enough coverage | 75%*** | 51% |
| ANOVA F-statistic significance level: *.10; **.05; *** .01. | ||
As shown, nine of the 14 variables tested, were significantly associated with satisfaction.20 Older individuals and those with more ADL limitations are more likely to be dissatisfied with their policy than are younger, less disabled claimants. With respect to policy characteristics, while daily benefit amount is not related to overall satisfaction, both the policy type and the duration of coverage are. Having a disability policy design and longer coverage durations are positively associated with satisfaction.
A claimant's interaction with the insurance company is very important to their sense of satisfaction with the insurance policy itself. Individuals who have not had difficulty filing their policy, have understood what their policy covers, and have not had any disagreements with the insurer about covered services also tend to be more satisfied with their policy. If the policy enables claimants to meet their care needs, and if they believe that the coverage they chose at initial purchase was adequate, they are also more likely to be satisfied with their policy.
We conducted a factor analysis in order to understand better the underlying "dimensionality" of the concept of satisfaction. In essence we wished to identify a small set of factors that could be used to represent relationships among sets of many interrelated variables. The basic assumption of factor analysis is that observed correlations between variables result from their sharing certain factors that cannot actually be observed but can be used to explain complex phenomena like, for example, satisfaction.
Table 9 displays the component score coefficient matrix for the dependent variable satisfaction. Using Principal Components Analysis, five factors were extracted, each of which had an Eigenvalue greater than 1.0. The cumulative variance in the dependent variable accounted for by these factors is 62%.21
An analysis of the component score coefficient matrix highlights five distinct dimensions related to satisfaction. An analysis of the factor loadings for each suggests that these dimensions can be broadly thought of as:
- Disability and Service Use
- Interaction with Insurer
- Policy Characteristics
- Payment Type
- Impact on Living Arrangement
The variables with the largest factor loadings in the first factor include those related to disability status -- ADLs and IADLs -- and to the provision of care -- the total number of hours of care and the total number of caregivers. Taken together, this dimension of quality accounts for 20% of the variance in the dependent variable. It can be interpreted to mean that one's disability status, and the amount of care received to compensate for disabilities, are the most important dimensions of claimants' sense of satisfaction with their policy.
| TABLE 9. Component Score Coefficient Matrix for Individuals Satisfied with Their Long-Term Care Insurance Policy | |||||
|---|---|---|---|---|---|
| Variable | Factor 1 | Factor 2 | Factor 3 | Factor 4 | Factor 5 |
| Number of ADL Limitations | .351 | -.006 | -.041 | .065 | .061 |
| Number of IADL Limitations | .315 | .018 | .022 | .125 | .127 |
| Number of ADL Helpers | .258 | -.080 | -.131 | -.148 | .082 |
| Total Hours of Care | .330 | -.060 | .039 | -.055 | -.097 |
| Had Disagreement with Insurance Company | -.006 | .386 | .060 | .254 | .106 |
| Had Trouble Understanding Policy Coverage | .023 | .451 | -.039 | -.069 | .148 |
| Was Easy to File the Policy | -.015 | -.442 | -.056 | .091 | .161 |
| Home Care Daily Benefit Greater than $40 | .062 | .012 | .537 | -.302 | -.204 |
| Home Care Duration Greater than 2 Years | .033 | .003 | .547 | .259 | -.353 |
| Disability Policy Design | .023 | -.027 | -.130 | .754 | -.274 |
| Policy is Meeting Care Needs | -.087 | -.251 | .236 | .107 | .256 |
| Having the Policy Allows Individual to Stay in Community | .003 | .029 | .297 | .213 | .772 |
| Percent of Variance | 20% | 13% | 11% | 9% | 8% |
| NOTE: Cumulative percent of variance captured by factors is 62%; Extraction Method is Principal Components; Factors for Eigenvalues greater than 1; KMO measure of sampling adequacy is 69%. | |||||
The next most important dimension of satisfaction relates to the interaction between the claimant and the insurance company. Whether or not an individual has had a disagreement with the insurance company, understands their policy, or found the claims filing process to be easy are all related to overall sense of satisfaction. This factor accounts for an additional 13% of the variance. It is also interesting to note that this dimension is more important than the policy parameters themselves. That is, how a claimant feels about their policy has less to do with the policy features themselves and more to do with the way that they are treated at claim time. This is evidenced by the fact that the third and fourth factors account for slightly less variance than the "interaction with insurer" factor; the variables with the largest unique factor loadings include policy duration, daily benefit amount and having a policy that pays cash benefits, i.e. the disability policy design. Finally, the fifth dimension of satisfaction has to do with individuals' perceptions of what the policy is enabling them to do vis-à-vis living arrangement. Individuals who believe that their policy is enabling them to avoid having to seek institutional alternatives by meeting their care needs are also more likely to be satisfied with their policy.
Summary
Although policy design is important to claimant satisfaction, it is not the most important variable. The interaction between the insurance company and the claimant at claim time and how a claim is serviced are critical to the claimant's overall evaluation of the policy. If the administration of claims is handled well and the claimant understands their coverage -- something that may be the responsibility of the agents selling the policy on behalf of the insurance company -- then there is a much greater likelihood of he/she being satisfied with the policy in general. This is true even when account is taken of the disability status of the claimant and the presence of undermet need. The "servicing" of the claim can be as important as the financial flexibility provided by the policy itself as a factor in the claimants' feeling about the policy.
CONCLUSIONS
Given the fact that we are just beginning to learn about the experience of claimants, the conclusions drawn from these analyses should be viewed cautiously. Even so, these multivariate analyses demonstrate that the role that private LTC insurance plays in financing the care needs of disabled elders is complex. While the insurance clearly finances greater levels of formal care, its benefits decrease reliance on informal care, but do not replace informal care. In fact, reductions in the level of informal caregiving are more than offset by increases in formal care. Thus, when disabled elders with and without private insurance are compared, even holding all other variables constant, insured individuals receive more weekly assistance with ADLs and IADLs than do those without the insurance.
There is an interaction between having LTC insurance and accessing Medicare funded home health care benefits. Those who have LTC insurance are much less likely to access Medicare funded services. This is true even when controlling for demographic and health variables as well as selection effects. This may either be due to a preference of the insured to use their private insurance benefits to purchase care or to a lack of awareness that Medicare covers such services. It may also reflect some degree of provider preference for private versus public dollars. In either case, expansions in the private insurance market are likely to lead initially to reductions in Medicare funded home care services. Whether this would be sustained over time is a question that cannot be answered from this data.
Regarding undermet need, when controlling for other significant demographic, health, and service utilization variables, the presence of insurance does not have an effect. Still, because of their characteristics those with private insurance are more likely to report undermet need. The fact that a sizeable minority of individuals reports undermet need certainly indicates that there are significant gaps in the service delivery system. Disabled elders and their caregivers may have difficulty arranging for and coordinating care, or they may be overly dependent on informal care, which appears to be somewhat less effective in meeting needs than formal care.
Given these observations, insurers may want to take a more active role in managing, coordinating, or monitoring both the finance and delivery of care. Aside from having a positive impact on reducing undermet need, this will likely improve consumer satisfaction. Among the roughly one in seven claimants who were dissatisfied with their policy, most linked their dissatisfaction to their interaction with the insurer and the servicing of their claim and not to the design of the policy.
As the market continues to grow, insurers will need to broaden their role and focus on how to help individuals use benefits judiciously. They may also be called upon to take a more active role in monitoring the quality of providers and assuring that services that are being provided meet needs. Results presented here strongly suggest that, as more people seek to protect themselves against the catastrophic costs of long-term care, successful marketing and retention of policyholders will depend on the customer service strategies of insurance companies as well as on the inherent value of their products.
REFERENCES
AARP (1998). Medicaid and Long-Term Care for Older People. AARP Public Policy Institute, Washington, DC.
AARP (1997). Out-of-Pocket Health Spending by Medicare Beneficiaries Age 65 and Oder: 1997 Projections. AARP Public Policy Institute, Washington, DC.
Cohen, M., and N. Kumar (1996). The Changing Face of Long-Term Care Insurance in 1994: Profiles and Innovations in a Dynamic Market. Inquiry.
Cohen, M., E. Tell, J. Greenberg, and S. Wallack (1987). The Financial Capacity of the Elderly to Insure for Long-Term Care. The Gerontologist, 27.
Crown, W., W. Leutz, and J. Capitman (1992). Economic Rationality: The Market for Private Long-Term Care Insurance, and the Role for Public Policy. The Gerontologist, 32.
Feder, J. (1999). The Policy Context for the Long-Term Care Debate. Georgetown University Institute for Health Care Research and Policy. Paper presented to Council on the Economic Impact of Health System Change, Princeton, NJ.
Friedland, R. (1990). Facing the Costs of Long-Term Care. Employee Benefit Research Council, Washington, DC.
Garber, A.B., and T. MaCurdy (1989). Predicting Nursing Home Utilization among the High Risk Elderly. National Bureau of Economic Research, Cambridge, MA.
Greene, V., M. Lovely, and J. Ondrich, (1993). The Cost-Effectiveness of Community Services in a Frail Elderly Population. The Gerontologist, 33(2).
Health Insurance Association of America (1998). Long-Term Care Insurance in 1996: Research Findings, Washington, DC.
Health Insurance Association of America (1995). Long-Term Care Insurance in 1994: Profiles and Innovations in a Dynamic Market, Washington, DC.
Health Insurance Association of America (1992). Who Buys Long-Term Care Insurance? Washington, DC.
Jackson, B., and P. Doty (1999). Medicare Home Health Services 1989-1994: Patterns of Benefit Use Among Chronically Disabled Elders. Office of the Assistant Secretary for Planning and Evaluation, Office of Disability, Aging and Long-Term Care Policy, U.S. Department of Health and Human Services, Washington, DC. [http://aspe.hhs.gov/daltcp/reports/medhhs.htm]
Kane, R. (1998). Examining the Efficiency of Home Care. Unpublished manuscript submitted to the Home Care Research Initiative, University of Minnesota.
Ladd, R., R. Kane, and R. Kane (1999). State Long-Term Care Profiles Report, 1996. University of Minnesota at Minneapolis, School of Public Health, Division of Health Services Research and Policy. Table 4, Page. 14. [http://aspe.hhs.gov/daltcp/reports/ltcprof.htm]
Leon, J., P. Neuman, and S. Parente (1997). Understanding the Growth in Medicare's Home Health Expenditures. The Kaiser Medicare Policy Project, The Henry J. Kaiser Family Foundation.
National Alliance for Caregiving (1998). The Caregiving Boom: Baby Boomer Women Giving Care. Washington, DC, September.
Rivlin, A., J. Wiener, R. Hanley, and D. Spence (1988). Caring for the Disabled Elderly: Who will Pay? Brookings Institution, Washington, DC.
Shapiro, E., and R.B. Tate (1988). Who is Really at Risk of Institutionalization. The Gerontologist, 28.
Tennstedt, S., B. Harrow, and S. Crawford (1996). Informal Care Versus Formal Services: Changes in Patterns of Care over Time. Journal of Aging and Social Policy, 7(3-4).
United States Department of Commerce, Bureau of the Census. Statistical Abstract of the United States, 1998. Washington, DC.
United States Department of Commerce, Bureau of the Census. Statistical Abstract of the United States, 1994. Washington, DC.
United States Department of Commerce, Bureau of the Census. Money Income in the United States, 1997. Washington, DC.
United States Department of Commerce, Bureau of the Census. Educational Attainment in the United States, March 1998. Washington, DC.
Weissert, W. (1985). Seven Reasons why it is so Difficult to Make Home and Community-Based Care Cost Effective. Health Services Research, 20.
Weissert, W., and C. Cready (1989). Toward a Model for Improved Targeting of Aged at Risk of Institutionalization. Health Services Research, 24.
Wiener, J., L. Illston, and R. Hanley (1994). Sharing the Burden: Strategies for Public and Private Long-term Care Insurance. Brookings Institution, Washington, DC.
Wolf, D. (1997). Efficiency in the Allocation and Targeting of Community-Based Long-Term Care Resources. Unpublished manuscript submitted to the Home Care Research Initiative. Syracuse University.
APPENDIX 1
Sample selection models are typically comprised of a number of equations. In this inquiry, the first equation estimates the variables related to the probability of having a LTC insurance policy. A limited dependent variable estimation process (e.g. Probit analysis) is most appropriate for this stage of the modeling because the dependent variable -- being an LTC insurance policyholder -- is dichotomous. The result of this analysis is that each individual in the pooled 1994 NLTCS and 1999 Insured Panel sample is assigned a probability of being a LTC insurance policyholder. These probabilities are then used to calculate a variable known as the Inverse Mill's Ratio. It is a nonlinear function of the ratio of the predicted probability and the actual probability of having insurance; therefore, it captures the residual or unobserved variables relating to the probability of being an insurance policyholder on the dependent variable of interest.
The Inverse Mill's Ratio (IMR) is then entered as a regressor into a second equation, which for the purposes of this example, focuses on understanding service utilization among the insured group only. By including this variable in the second equation, we can control for the effect on service utilization of unobserved variables related to having an insurance policy. Put another way, we can isolate the "insurance purchase bias" from the insurance effect on service utilization. This allows us to obtain unbiased estimates for the insurance effect on service utilization among individuals in the Insured Panel. In all analyses where the Insured Panel is being compared to the NLTCS, sample selection models were employed.22
For example, suppose we wished to measure the "insurance effect" on the amount of total care individuals' use. The first equation is used to predict the probability of having insurance. The second equation predicts the number of hours of total care received by the Insured Panel. As shown below, the Inverse Mills Ratio, designated as ![]() , is entered into this second equation. It controls for the unobserved variables associated with the insurance purchase decision. If the coefficient for the IMR is not significant, then the third equation is used to estimate hours of care for the entire sample. It includes a dummy variable that identifies whether or not someone has insurance.
, is entered into this second equation. It controls for the unobserved variables associated with the insurance purchase decision. If the coefficient for the IMR is not significant, then the third equation is used to estimate hours of care for the entire sample. It includes a dummy variable that identifies whether or not someone has insurance.
Equation 1: The probability of Being Privately Insured
![]()
Where Z = a dichotomous variable indicating whether or not someone has insurance;
Where ![]() = vector of explanatory variables
= vector of explanatory variables
Where ![]() = the random disturbance term
= the random disturbance term
Equation 2: The Number of Total Weekly Hours of ADL/IADL Care Received (Insured Panel Only)
![]()
Where Y = is variable that measures weekly hours of ADL and IADL care for Insured Panel
Where ![]() = vector of explanatory variables that have at least one variable that is not included in equation 1.
= vector of explanatory variables that have at least one variable that is not included in equation 1.
![]() = the Inverse Mill's Ratio (IMR)
= the Inverse Mill's Ratio (IMR)
![]() = the random disturbance term
= the random disturbance term
Equation 3: The Number of Total Weekly Hours of ADL/IADL Care Received (Total Sample)
![]()
Where Y = is variable that measures weekly hours of ADL and IADL care for the combined Insured Panel and 1994 NLTCS
Where ![]() = vector of explanatory variables that includes a dummy variable for having insurance.
= vector of explanatory variables that includes a dummy variable for having insurance.
![]() = the random disturbance term.
= the random disturbance term.
If it turns out that the Inverse Mills Ratio is not significant, then this suggests that the propensity to purchase insurance does not affect the propensity to use more hours of care among the Insured Panel and that there is no observed insurance purchase bias. The implication is that an ordinary least squares regression model based on the entire sample -- insured and non-insured -- can include a dummy variable for insurance. The coefficient on this variable can then be interpreted as the impact of being insured on the total number of weekly hours of care (holding other variables constant).
NOTES
-
Given the relatively low incidence of LTC insurance ownership in the general population age 65 and over -- less than 5% -- and given the characteristics of these individuals, all are assumed not to have LTC insurance.
-
The participating companies included: (1) Aegon; (2) American Travellers; (3) Bankers Life and Casualty; (4) CNA Insurance; (5) Fortis Long-Term Care; (6) G.E. Capital Assurance; (7) John Hancock; and (8) UNUM. Together the claimant blocks from these companies represent more than 80% of all open home health care claims and nursing home claims. These companies also represent diverse market segments and policy designs, and employ differing underwriting and claims management strategies.
-
Policymakers not in claim were surveyed to find out how many policyholders who met the qualifying criteria to trigger benefits had not yet filed a claim or had perhaps had claims inappropriately denied.
-
The ADL activities include bathing, dressing, toileting, transferring, continence management, and feeding. A disability is present if an individual requires stand-by, cueing, or hands-on assistance.
-
Having 4 or more errors on the SPMSQ.
-
The reason why a sub-sample of claimants is used is because 15% of them did not meet the minimum disability threshold. Therefore, they were excluded from subsequent analyses. For more information about these individuals see "A Descriptive Analysis of Patterns of Informal and Formal Caregiving among Privately Insured and Non-Privately Insured Disabled Elders Living in the Community", Department of Health and Human Services and Robert Wood Johnson Foundation, April, 1999.
-
The mean number of ADL and IADL hours received by individuals in this sample is 54 hours per week.
-
To test this finding further, the second equation was estimated without the adjustment for sample selection (IMR). For the most part, coefficients on included variables did not change, which means that the unobserved variables associated with having an insurance policy do not influence the amount of care among individuals in the Insured Panel.
-
Given the significant time and expense that goes into the underwriting process of LTC insurers, it is not entirely surprising that these insured individuals were not found to have a propensity to consume services more than non-insured individuals. When individuals apply for insurance, the insurance carriers successfully screen out those who they can identify as being above average risks for needing care.
-
It is important to note that the "average" effect is estimated when all other variables in the equation are evaluated at their mean values.
-
The diagnoses tested include diabetes, cancer, paralysis, pneumonia, stroke, heart disease, fractures and a category capturing other diagnoses.
-
Note that the negative effect of the "income-LTC Insurance" interaction term must be accounted for when comparing the impact of insurance among the privately insured with the impact of insurance among the publicly insured. The negative coefficient on the interaction term suggests that having private insurance provides about 10 rather than 11 additional weekly hours of care.
-
The findings related to Medicaid should be viewed with caution. Only 4% of the sample received Medicaid financed home care services. For the most part, such programs are not considered overly generous in terms of benefits. Thus, the findings that individuals with Medicaid do receive more total care than do those without such insurance, while significant, may also be an artifact of the relatively small sample.
-
For more detailed information on the use of Medicare home health services see Jackson, B. and Doty, P. (1999). Medicare Home Health Services 1989-1994: Patterns of Benefit Use Among Chronically Disabled Elders. Office of the Assistant Secretary for Planning and Evaluation, Office of Disability, Aging and Long-Term Care Policy, U.S. Department of Health and Human Services, Washington, D.C.
-
This is just the reciprocal of .17, and reflects the odds of Medicare use among the non-insured compared to the insured.
-
The average daily benefit is inflated by 3% per year. Thus, in 1999 dollars, the per-visit costs are $74.97. Savings are derived by multiplying current Medicare home health use (5.6% of claimants) times the expected Medicare costs and subtracting this from the projected costs in the absence of the private insurance (11% of claimants) times the expected Medicare Costs. This is given as [(100)*(.11)*($74.97)*(51)]-[(100)*(.056)*($74.97)*(51)] = $20,647.
-
For more information see Cohen, M. and Tumlinson, A. (1995). "Understanding State Variation in Medicare Home Health Care: The Impact of Medicaid Program Characteristics, State Policy and Provider Behavior." Medical Care, Volume 35, Number 6.
-
It is important to note that "self-reported" undermet ADL needs for the cognitively impaired is actually provided by primary informal caregivers.
-
We tested insurance policy design variables among the privately insured sample and found that the only significant variable was "policy type"; individuals who had a pure disability policy design were less likely to report undermet ADL needs than were those with indemnity or reimbursement policies.
-
The dependent variable was recoded to be dichotomous: satisfied and dissatisfied.
-
The Kaye-Meyer-Olkin (KMO) measure of sampling adequacy is 69.2%. This indicates that factor analysis is a reasonable method of analysis as correlations between pairs of variables can be explained by other variables; this is an important prerequisite for conducting factor analysis.
-
It is important to note that there must be at least one variable in the first equation that is not included in the second equation, otherwise, the Inverse Mills Ratio would be a linear combination of other variables in the model.
To obtain a printed copy of this report, send the full report title and your mailing information to:
U.S. Department of Health and Human Services
Office of Disability, Aging and Long-Term Care Policy
Room 424E, H.H. Humphrey Building
200 Independence Avenue, S.W.
Washington, D.C. 20201
FAX: 202-401-7733
Email: webmaster.DALTCP@hhs.gov