
Prepared by Staff of the
U.S. Department of Health and Human Services
"
Executive Summary
The Welfare Indicators Act of 1994 requires the Department of Health and Human Services to prepare annual reports to Congress on indicators and predictors of welfare dependence. This 2001 Indicators of Welfare Dependence, the fourth annual report, is the first report to provide welfare dependency indicators for the 1996-1998 period, reflecting changes that have taken place since enactment of the Personal Responsibility and Work Opportunity Reconciliation Act (PRWORA) in August 1996. As directed by the Welfare Indicators Act, the report focuses on benefits under the Aid to Families with Dependent Children (AFDC) program, now the Temporary Assistance to Needy Families (TANF) program; the Food Stamp Program; and the Supplemental Security Income (SSI) program.
Welfare dependence, like poverty, is a continuum, with variations in degree and in duration. Families may be more or less dependent if larger or smaller shares of their total resources are derived from welfare programs. The amount of time over which families depend on welfare might also be considered in assessing their degree of dependency. Although recognizing the difficulties inherent in defining and measuring dependence, the bipartisan Advisory Board on Welfare Indicators proposed the following definition, as one measure to examine in concert with other key indicators of dependence and deprivation:
A family is dependent on welfare if more than 50 percent of its total income in a one-year period comes from AFDC/TANF, food stamps and/or SSI, and this welfare income is not associated with work activities. Welfare dependence is the proportion of all families who are dependent on welfare.
The proposed definition is difficult to measure because of limitations with existing data collection efforts. Most importantly, the available data do not distinguish between cash benefits where work is required and non-work-related cash benefits. In addition, there are time lags in the availability of the national data from the detailed surveys that may be best suited to measure dependence. This 2001 report uses data from the Current Population Survey (CPS) and administrative data to provide updated measures through 1998 for several dependency indicators, a significant update from the 1995 measures reported last year. Other measures are based on the Survey of Income and Program Participation (SIPP) and other data sources. Drawing on these various data sources, this report provides a number of key indicators of welfare recipiency, dependence, and labor force attachment. Selected highlights from the many findings in the report include the following:
- In 1998, 3.8 percent of the total population was dependent in the sense of receiving more than half of total family income from TANF, food stamps, and/or SSI (see Indicator 1). This rate has fallen considerably from the 5.8 percent rate measured in 1993. Dependency rates would be lower if they could be adjusted to exclude welfare income associated with work required to obtain benefits.
- The drop in dependency parallels the more well-known drop in AFDC/TANF and food stamp caseloads. The percentage of individuals receiving AFDC/TANF, for example, fell from 5.4 percent to 3.2 percent between 1993 and 1998 (see Indicator 3). Food stamp recipiency rates dropped from 10.5 percent to 7.3 percent over the same time period. Recipiency rates for TANF and food stamps fell again between 1998 and 1999, suggesting that dependency rates in 1999 (not yet available) will fall below the levels reported for 1998.
- In an average month in 1998, more than half (56 percent) of TANF recipients lived in families with at least one family member in the labor force. Comparable figures for food stamp and SSI recipients were 57 and 37 percent, respectively (see Indicator 2). Labor force participation, particularly full-time employment, increased considerably among AFDC/TANF families between 1993 and 1998.
- Long-term dependency is relatively rare. Only 4 percent of those who were recipients in 1982 received more than 50 percent of their income from AFDC and food stamps in nine or more years over a ten-year period. This represents less than 0.5 percent of the total population. Half of the 1982 recipients never received more than 50 percent of their annual income from AFDC and food stamps over the 1982-1991 time period (see Indicator 9).
Since the causes of welfare receipt and dependence are not clearly known, the report also includes a larger set of risk factors associated with welfare receipt. The risk factors are loosely organized into three categories: economic security measures, measures related to employment and barriers to employment, and measures of nonmarital childbearing. The economic security risk factors include measures of poverty and deprivation that are important not only as predictors of dependence, but also as a supplement to the dependence indicators, ensuring that dependence measures are not assessed in isolation. It is important to examine whether decreases in dependency are accompanied by improvements in family economic status or by reductions in family material circumstances. The report includes data on the official poverty rate, one of the most common measures of deprivation:
- As the dependency rate fell between 1993 and 1998, the poverty rate for all individuals fell also, from 15.1 percent in 1993 to 12.7 percent in 1998. The poverty rate fell again in 1999, declining to 11.8 percent, the lowest rate since 1979 (see Economic Security Risk Factor 1, Figure ECON 1a).
Finally, the report has four appendices that provide additional program data on major welfare programs, as well as alternative measures of dependency, additional data on non-marital births, and further information about data sources in this year’s report.
Acknowledgements
Contributors to this report include Gil Crouse, Susan Hauan, Julia Isaacs, and Matt Lyon of the Office of Human Services Policy under the direction of Barbara Broman, Acting Deputy Assistant Secretary for Human Services Policy, Office of the Assistant Secretary for Planning and Evaluation.
Obtaining a Printed Copy of This Report
Send the report title and your name and address by mail or fax to [and we will mail you a copy]:
Office of Human Services Policy, Room 404E
Assistant Secretary for Planning and Evaluation
200 Independence Ave., S.W.
Washington, D.C. 20201
Fax: 202-690-6562
Chapter I: Introduction and Overview
The Welfare Indicators Act of 1994 (Pub. L. 103-432) directed the Secretary of Health and Human Services (HHS) to publish an annual report on welfare dependency. This 2001 report, the fourth annual report, gives updated data on the measures of welfare recipiency, dependency, and predictors of welfare dependence developed for previous reports. It is the first report to provide welfare dependency indicators for the 1996-1998 period, reflecting changes that have taken place since enactment of the Personal Responsibility and Work Opportunity Reconciliation Act (PRWORA) in August 1996.
The purpose of this report is to address questions concerning the extent to which American families depend on income from welfare programs. Under the Welfare Indicators Act, HHS was directed to address the rate of welfare dependency, the degree and duration of welfare recipiency and dependence, and predictors of welfare dependence. The Act further specified that analyses of means-tested assistance should include benefits under the Aid to Families with Dependent Children (AFDC) program, now the Temporary Assistance to Needy Families (TANF) program; the Food Stamp Program; and the Supplemental Security Income (SSI) program.
The first annual report was produced under the oversight of a bipartisan Advisory Board on Welfare Indicators, which assisted the Secretary in defining welfare dependence, developing indicators of welfare dependence, and choosing appropriate data. Under the terms of the original authorizing legislation, the Advisory Board was terminated in October 1997, prior to the submission of the first annual report. Subsequent annual reports have provided updates for the measures developed for the first report. The report was shortened last year, in keeping with Congressional interest in a smaller set of indicators and predictors of dependency.
This 2001 report provides updated measures through 1998 for several dependency measures, a significant update from the 1995 measures reported last year. This update was possible because of a change in data source for a half-dozen indicators, from the Survey of Income and Program Participation (SIPP) to the Current Population Survey (CPS). Whereas the SIPP data are only available through 1995, the CPS data are available for more recent years, allowing examination of indicators and predictors of dependency since the 1996 enactment of welfare reform. Concurrent with the change in data source, the report has been reorganized slightly, with the annually updated figures now presented at the beginning of each section, followed by the measures that are updated less frequently.
Organization of Report
This introductory chapter provides an overview of the specific summary measures of welfare dependence proposed by the Advisory Board. It also discusses summary measures of poverty, following the Board’s recommendation that dependence measures not be assessed in isolation from measures of deprivation. Analysis of both measures is important because changes in dependence measures could result either from increases in work activity and other factors that would raise family incomes, or from sanctions or other changes in welfare programs that would reduce welfare program participation but might not improve the material circumstances of these families. The introduction concludes with a discussion of data sources used for the report.
Chapter II of the report, Indicators of Dependence, presents a dozen indicators of welfare dependence and recipiency. These indicators include dependency measures based on total income from all three programs — AFDC/TANF, SSI, and food stamps, as well as measures of recipiency for each of the three programs considered separately. The labor force participation among families receiving welfare and multiple receipt across programs are also shown. The second half of the chapter also includes longitudinal data on transitions on and off welfare programs and spells of dependency and recipiency.
Chapter III, Predictors and Risk Factors Associated with Welfare Receipt, focuses on predictors of welfare dependence — risk factors believed to be associated with welfare receipt in some way. These predictors are shown in three different groups:
- Economic security — including various measures of poverty, receipt of child support, food insecurity, and health insurance coverage — is important in predicting dependence in the sense that families with fewer economic resources are more likely to rely on welfare programs for their support.
- Measures of the work status and barriers to employment of adult family members also are critical, because families must generally receive an adequate income from employment in order to avoid dependence without severe deprivation.
- Finally, data on non-marital births are important since history has shown that a high proportion of long-term welfare recipients became parents outside of marriage, frequently as teen parents.
Additional data are presented in four appendices. Appendix A provides basic program data on each of the main welfare programs and their recipients; Appendix B shows how dependency is affected by the inclusion of benefits from the SSI program; Appendix C includes additional data on non-marital childbearing; and Appendix D provides more information about the change in data sources in this 2001 report. The main welfare programs included in Appendix A are:
- The Aid to Families with Dependent Children (AFDC) program, the largest cash assistance program, provided monthly cash benefits to families with children, until its replacement by the Temporary Assistance for Needy Families (TANF) program, which is run directly by the states. Data on the AFDC and TANF programs are provided in Appendix A, with AFDC data provided from 1977 through June 1997, and TANF data from July 1997 through 1999, or when available, 2000.
- The Food Stamp Program provides monthly food stamp coupons to all individuals, whether they are living in families or alone, provided their income and assets are below thresholds set in Federal law. It reaches more poor people over the course of a year than any other means-tested public assistance program. Appendix A provides historical data from 1970 to 1999, or when available, 2000.
- The Supplemental Security Income (SSI) program provides monthly cash payments to elderly, blind, or disabled individuals or couples whose income and assets are below levels set in Federal law. Though the majority of recipients are adults, disabled children also are eligible. Historical data from 1974 through 1999 are provided in Appendix A.
Measuring Welfare Dependence
As suggested by its title, this report focuses on welfare “dependency” as well as welfare “recipiency.” While recipiency can be defined fairly easily, based on the presence of benefits from AFDC/TANF, SSI or food stamps, dependency is a more complex concept.
Welfare dependence, like poverty, is a continuum, with variations in degree and in duration. Families may be more or less dependent if larger or smaller shares of their total resources are derived from welfare programs. The amount of time over which a family depends on welfare might also be considered in assessing its degree of dependency. Nevertheless, a summary measure of dependence to be used as an indicator for policy purposes must have some fixed parameters that allow one to determine which families should be counted as dependent, just as the poverty line defines who is poor under the official standard. The definition of dependence proposed by the Advisory Board for this purpose is as follows:
A family is dependent on welfare if more than 50 percent of its total income in a one-year period comes from AFDC, food stamps and/or SSI, and this welfare income is not associated with work activities. Welfare dependence is the proportion of all families who are dependent on welfare.
This measure is not without its limitations. The Advisory Board recognized that no single measure could fully capture all aspects of dependence and that the proposed measure should be examined in concert with other key indicators of dependence and deprivation. In addition, while the proposed definition would count unsubsidized and subsidized employment and work required to obtain benefits as work activities, existing data sources do not permit distinguishing between welfare income associated with work activities and non-work-related welfare benefits. As a result, the data shown in this report overstate the incidence of dependence (as defined above) because welfare income associated with work required to obtain benefits is classified as welfare and not as income from work. This issue may be growing in importance under the increased work requirements of the TANF program. In 1999, the percentage of welfare recipients who were working (including employment, work experience, and community service) reached an all-time high of 28 percent, compared to the 7 percent recorded in 1992.(1)
This proposed definition also represents an essentially arbitrary choice of a percentage (50 percent) of income from welfare beyond which families will be considered dependent. However, it is relatively easy to measure and to track over time, and is likely to be associated with any very large changes in total dependence, however defined. For example, as the recent changes in welfare law move more recipients into employment or work-related activities, dependence under this definition is expected to decline.
As shown in Figure SUM 1, 3.8 percent of the population would be considered “dependent” on welfare in 1998 under the above definition. This is less than one-third of the percentage (13.5 percent) who lived in a family receiving at least some AFDC/TANF, food stamp or SSI benefits during the year. Both dependency and recipiency rates have fallen since 1994: dependency rates fell from 5.8 to 3.8 percent, while recipiency rates fell from 17.2 to 13.5 percent. The drop in recipiency rates is consistent with administrative data showing a peak in AFDC caseloads in 1993 and in food stamp caseloads in 1994 and a steady decrease in both programs since that time. What is not apparent from administrative records, but is shown in these national survey data, is that the dependency rate also peaked in 1993, with particularly strong declines in dependency between 1996 and 1998.
Recipiency and dependency rates are higher for non-Hispanic blacks and Hispanics than for non-Hispanic whites, as shown in Table SUM 1, which shows these rates for various racial and age categories. Recipiency and dependency also are higher for young children than for adults.
Dependency on assistance also varies depending upon which programs are counted as “welfare programs.” Dependency would be lower — 2.1 percent — if only AFDC/TANF and food stamp benefits were counted (as shown in Appendix B). In general, 70 to 75 percent of individuals who are dependent under the standard definition also are dependent under an alternative definition that considers AFDC and food stamps alone (as is done in some measures in this report). In general, non-whites and the very young were more likely to be dependent than other racial and age categories, and they are primarily dependent on AFDC and food stamps. Even in these populations, however, the vast majority of families do not meet the criteria for dependence.
Another factor affecting dependency is the time period observed. The summary measures shown in Figure and Table SUM 1 focus on recipiency and dependency rates over a one-year time period. Long-term dependency is more rare, as shown in the longitudinal measures in the second half of Chapter II. Indicator 9, for example, shows that only 4 percent of those who were AFDC recipients in 1982 were dependent (i.e., received more than 50 percent of their income from AFDC and food stamps) for nine or ten years. This represents less than 0.5 percent of the total population. Half of the 1982 recipients were not dependent in any year over the 1982-1991 time period.
Figure SUM 1. Recipiency and Dependency Rates: 1993-1998
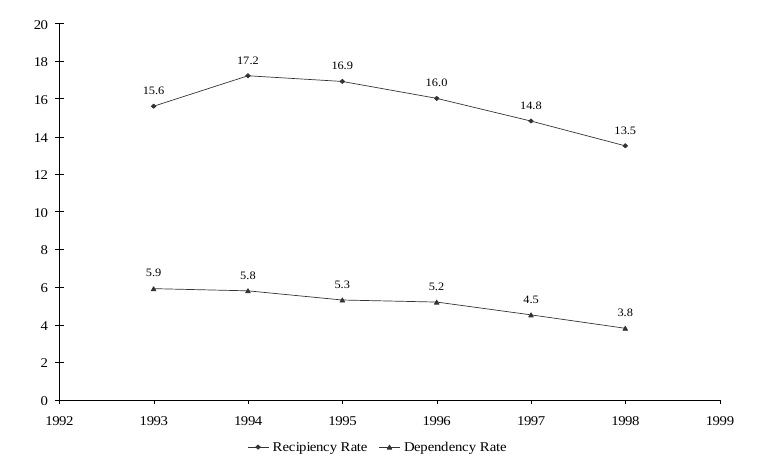
Note: Recipiency is defined as living in a family with receipt of any amount of AFDC/TANF, SSI, or food stamps during year. Dependency is defined as having more than 50 percent of annual income from AFDC/TANF, SSI and/or food stamps. Dependency rates would be lower if adjusted to exclude welfare assistance associated with working.
Source: March CPS data, analyzed using the TRIM3 microsimulation model.
Table SUM 1. Recipiency and Dependency Rates: 1993-1998
| 1993 | 1994 | 1995 | 1996 | 1997 | 1998 | |
|---|---|---|---|---|---|---|
| Recipiency Rates (Rates of Any Amount of AFDC/TANF, Food Stamps, or SSI) | ||||||
| All Persons | 16.6 | 17.2 | 16.9 | 16.0 | 14.8 | 13.5 |
| Racial Categories | ||||||
| Non-Hispanic White | 10.3 | 10.9 | 10.0 | 9.9 | 9.7 | 8.6 |
| Non-Hispanic Black | 38.0 | 38.3 | 38.6 | 35.6 | 30.2 | 29.6 |
| Hispanic | 34.6 | 34.9 | 35.0 | 32.0 | 28.0 | 24.5 |
| Age Categories | ||||||
| Children Ages 0-5 | 30.5 | 31.5 | 31.6 | 28.2 | 25.1 | 22.4 |
| Children Ages 6-10 | 24.9 | 26.8 | 26.5 | 24.2 | 21.2 | 20.0 |
| Children Ages 11-15 | 22.1 | 23.6 | 21.7 | 21.1 | 19.4 | 17.0 |
| Women Ages 16-64 | 16.4 | 16.9 | 16.6 | 16.0 | 14.7 | 13.6 |
| Men Ages 16-64 | 11.5 | 11.9 | 11.8 | 11.7 | 11.1 | 10.0 |
| Adults Age 65 and over | 11.2 | 10.9 | 10.6 | 10.3 | 10.2 | 9.9 |
| Dependency Rates (More than 50 Percent of Income from Means-Tested Assistance) | ||||||
| All Persons | 5.9 | 5.8 | 5.3 | 5.2 | 4.5 | 3.8 |
| Racial Categories | ||||||
| Non-Hispanic White | 3.0 | 2.9 | 2.3 | 2.6 | 2.5 | 2.1 |
| Non-Hispanic Black | 17.8 | 16.7 | 15.5 | 13.8 | 11.4 | 10.5 |
| Hispanic | 11.8 | 12.5 | 12.2 | 10.9 | 9.1 | 6.6 |
| Age Categories | ||||||
| Children Ages 0-5 | 13.9 | 13.7 | 12.9 | 11.2 | 9.3 | 7.8 |
| Children Ages 6-10 | 11.2 | 11.2 | 10.5 | 9.5 | 8.4 | 6.7 |
| Children Ages 11-15 | 9.3 | 9.2 | 7.6 | 8.1 | 7.4 | 5.7 |
| Women Ages 16-64 | 5.9 | 5.7 | 5.2 | 5.2 | 4.6 | 3.9 |
| Men Ages 16-64 | 2.7 | 2.7 | 2.5 | 2.7 | 2.5 | 2.1 |
| Adults Age 65 and over | 2.4 | 2.7 | 2.2 | 2.4 | 2.1 | 2.1 |
Note: Recipiency is defined as living in a family with receipt of any amount of AFDC/TANF, SSI, or food stamps during year. Dependency is defined as having more than 50 percent of annual family income from AFDC/TANF, SSI and/or food stamps. Dependency rates would be lower if adjusted to exclude welfare assistance associated with working.
Source: March CPS data, analyzed using the TRIM3 microsimulation model.
1 The earnings of those in unsubsidized employment would be correctly captured as income from work in national surveys. Any welfare benefits associated with work experience, community service programs or other work activities, however, would be counted as income from welfare in most national surveys, an incorrect classification according to the proposed definition.
Measuring Deprivation
Changes in dependence may or may not be associated with changes in the level of deprivation, depending on the alternative sources of support found by families who might otherwise be dependent on welfare. To assess the social impacts of any change in dependence, changes in the level of poverty or deprivation also must be considered. One way of measuring deprivation is to look at changes in the level of need over time. Elsewhere in this report, for example, measures of food insecurity and lack of health insurance are presented.
The deprivation measure presented in this report, however, focuses directly on changes in the poverty rate, both under the official poverty rate and under expanded measures that take into account cash benefits, non-cash benefits and taxes. These measures also show the degree to which welfare and related programs are effective in moving people out of poverty. The data, shown in Figure SUM 2 illustrate two primary points. First, cash welfare and non-cash welfare benefits reduce the number of poor families. Second, under any of the poverty measures presented in Figure SUM 2, poverty rates have been decreasing since 1993, as economic conditions have improved and policies have promoted and rewarded work. Each of these points is discussed below.
Three different concepts of income are used in Figure SUM 2, which shows alternative measures of poverty rates for all persons between 1979 and 1999. (The table underlying this graph is presented in Chapter III, under the Economic Security Risk Factor, ECON 4). The three measures in the graph are as follows:
- The bold line shows the official poverty rate, based on total cash income, including earned and unearned income. The official poverty rate was 11.8 percent in 1999.
- The dotted line with unfilled circles shows what poverty would be if means-tested cash assistance (primarily AFDC and SSI) were excluded from cash income. Under this measure, income includes earnings and other private cash income, plus social security, workers’ compensation, and other social insurance programs. Poverty under this measure would be almost one percentage point higher, 12.7 percent in 1999. This indicates that many more families would be poor if they did not receive welfare benefits.
- The lowest line shows how poverty would be lower if the cash value of non-cash benefits (food and housing) and taxes (including refunds under the Earned Income Tax Credit) were counted as income.(2) Under this definition, poverty rates would fall by more than two percentage points, to 9.8 percent in 1999.
Figure SUM 2. Percentage of Total Population in Poverty with Various Means-Tested Benefits Added to Total Cash Income: 1979-1999
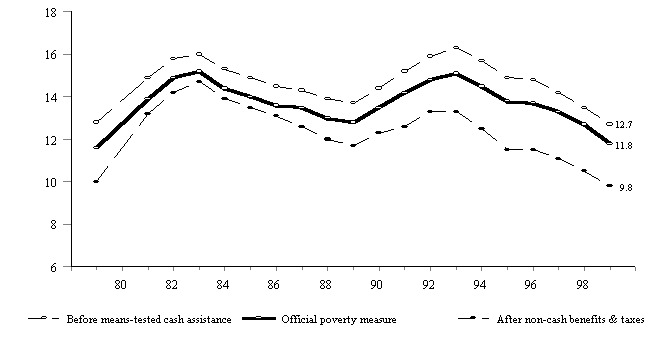
Source: Congressional Budget Office tabulations of March CPS data. Additional calculations by DHHS. See ECON 4 in Chapter III for underlying table and further notes.
The combined effect of means-tested cash assistance, food and housing benefits, and EITC and taxes was to reduce the poverty rate in 1999 by 2.9 percentage points, from 12.7 percent to 9.8 percent (the difference between the top and bottom lines in Figure SUM 2). The net effectiveness of means-tested benefits (including cash assistance, food and housing benefits, and the EITC and other taxes) in reducing the poverty rate has averaged about three percentage points during most of the past decade. Net reductions in poverty rates were somewhat lower during the recession of the early 1980s, and somewhat higher in the mid 1990’s, largely due to expansions in the EITC.
As economic conditions improved during the mid-1990s, poverty rates decreased under all three concepts of income. Poverty rates continued to decline after enactment of PRWORA in 1996. In fact, a comparison of SUM 1 and SUM 2 suggests that deprivation decreased at the same time as the large declines in caseloads and welfare dependency. In 1998, the final poverty rate was 10.4 percent after adding in non-cash benefits and taxes, a decline from 13.3 percent in 1993. Over the same time period, the dependence measure also declined, from 5.9 percent to 3.8 percent. The combined effect of welfare reform and the strong economy has been to reduce dependence on welfare at the same time as reducing poverty. It will be important to continue to track changes in these dependency and deprivation rates over the next several years, to see how they are affected by future changes in economic conditions.
2 The effects of non-cash benefits (food and housing) and taxes are shown separately in ECON 4 in Chapter III. Prior to 1993, taxes increased poverty. Since 1993, taxes, including the refunds through the Earned Income Tax Credit, have caused additional reductions in poverty.
Data Sources
This 2001 report relies more heavily than past reports on data from the Annual March Demographic Supplement to the Current Population Survey (CPS). Several of the indicators and predictors of dependence are now based on CPS data rather than data from the Survey of Income and Program Participation (SIPP). This change was necessary because the Census Bureau was unable to update the SIPP data analyses beyond the 1995 data presented in last year’s report.
If it were not for the lags in data availability, the Survey of Income and Program Participation (SIPP) would be considered the most useful national survey for measuring welfare dependency. It was used most extensively in the first three annual reports. Its strengths are its longitudinal design, system of monthly accounting, and detail concerning employment, income and participation in federal income-support and related programs. These features make the SIPP particularly effective for capturing the complexities of program dynamics and it continues to be an important source of data in this report, particularly for measures related to spell duration and transitions in and out of recipiency, dependency and poverty.
For measures of receipt, dependency, and poverty at a single point in time, however, this year’s report primarily uses the March CPS, which measures income and poverty over an annual accounting period. The CPS data are available on a more timely basis than the SIPP, and have been widely used to measure trends since the welfare reform legislation of 1996. However, because the CPS does not collect income in the same detail as the SIPP, it has been subject to criticism for underreporting of income, particularly welfare income. To address this concern, some of the indicators in this report are based on CPS data that has been analyzed by the Transfer Income Model (TRIM3), a microsimulation model developed by the Urban Institute under contract to the Office of the Assistant Secretary for Planning and Evaluation. Although its primary purpose is to simulate program eligibility and the impact of policy proposals, the TRIM model has also been used to correct for underreporting of welfare receipt and benefits. Welfare caseloads in TRIM3 are based on CPS data, adjusted upward to ensure that total estimates of recipients equal the total counts from administrative data. Even with these adjustments, some measurement differences between the CPS/TRIM data and SIPP data remain.
As shown in Figure SUM 3, the overall measures of dependency and recipiency are not greatly affected by the change in data sources. Both data sources show a decline in dependency between 1993 and 1995, from 5.9 to 5.1 percent under the SIPP data, and from 5.9 to 5.3 percent under the TRIM-adjusted CPS data. Still, readers are cautioned against comparing measures for 1987-1995 from the SIPP data in last year’s report with the new measures for 1996-1998 from the TRIM-adjusted CPS data. Therefore, indicators using the CPS data were analyzed over a six-year period — 1993 to 1998 — providing a new time series of how the indicators are changing over time from a consistent data source. Further information about the change in data sources is provided in Appendix D.
Figure SUM 3.
Recipiency and Dependency Rates from Two Data Sources: 1987-1998
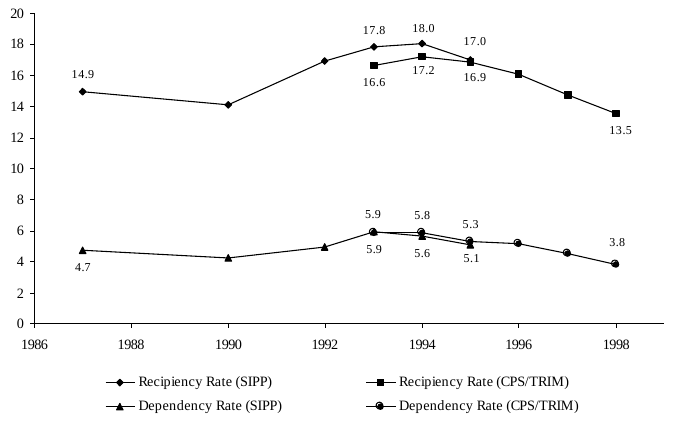
Note: Recipiency is defined as receipt of any amount of AFDC/TANF, SSI, or food stamps during year. Dependency is defined as having more than 50 percent of annual family income from AFDC/TANF, SSI and/or food stamps. Dependency rates would be lower if adjusted to exclude welfare assistance associated with working.
Source: March CPS data, analyzed using the TRIM3 microsimulation model.
The Panel Study of Income Dynamics (PSID) is another source of data used in this report. Like the SIPP it provides longitudinal data, but over a much longer time period than the approximate three-year time period of the SIPP. The PSID has collected annual income data, including transfer income, since 1968, providing vital data for indicators of long-term welfare receipt, dependence, and deprivation. As with the SIPP data, there have been lags in obtaining updated PSID data for the mid- to late-1990s. Once again, the indicators that are based on PSID data cover the same ten-year period (1982-1991) as in the last several volumes. The Department plans to publish updated PSID analyses in next year’s report.
Finally, the report also draws upon administrative data for the AFDC/TANF, Food Stamp and SSI programs. These data are largely reported in Appendix A. Like the CPS data, administrative data are generally available with little time lags; these data are generally available through fiscal year 1999 (or, for some aggregate caseload statistics, fiscal year 2000). To the extent possible, TANF administrative data are reported in a consistent manner with data from the earlier AFDC program, as noted in the footnotes to the tables in Appendix A. The fact remains that assistance under locally designed TANF programs encompasses a diverse set of cash and non-cash services designed to support families in making a transition to work, and so direct comparisons between AFDC receipt and TANF receipt must be made with caution. This issue also affects reported data on TANF receipt in national data sets such as the CPS and SIPP.
Most of the data sources allow analysis of the indicators and predictors of welfare dependence across several age and race/ethnic categories. Where the data are available, statistics are shown for three racial/ethnic groups — non-Hispanic whites, non-Hispanic blacks, and Hispanics. In some instances, however, there are not sufficient data on individuals of Hispanic origin, and so the measures are shown for only two racial/ethnic categories.
Two other technical notes concern the unit of analysis and the difference between annual and monthly measures. The individual, rather than the family or household, is the unit of analysis for most of the statistics in this report. The individual’s dependency status, however, is generally based on total family income, taking into account means-tested assistance, earnings and other sources of income for all individuals in the family.(3) This chapter, for example, has reported the percentage of individuals that are dependent (in SUM 1) or poor (in SUM 2) according to annual total family income. Recipiency status is also based on total annual family income in some instances; in SUM 1, for example, recipients are individuals in families receiving assistance at some point in the year. In most other indicators, recipiency is measured as the direct receipt of a benefit by an individual in a month. The difference between an individual and a family measure of recipiency is largest in the SSI program, which provides benefits to individuals and couples, not to families.
There also are differences between monthly and annual observation of benefit receipt. For example, the measures of annual recipiency (that is, any receipt over the course of a year) shown in Figure and Table SUM 1 are higher than the more traditional measures of recipiency in an average month, as shown in several other indicators.
3 Family is generally defined as following the broad Census Bureau definition of family — all persons related by blood, marriage, or adoption.
Chapter II: Indicators of Dependence
Following the format of the previous annual reports to Congress, Chapter II presents summary data related to indicators of dependence. These indicators differ from other welfare statistics because of their emphasis on welfare dependence, rather than simple welfare receipt. As discussed in Chapter I, the Advisory Board on Welfare Indicators suggested measuring dependence as the proportion of families with more than 50 percent of their total income in a one-year period coming from AFDC (now TANF), food stamps and/or SSI. Furthermore, this welfare income was not to be associated with work activities.
The indicators in Chapter II were selected to provide information about dependence, following, to the extent feasible, the definition of dependence proposed by the Advisory Board. Existing data from administrative records and national surveys, however, do not generally distinguish welfare benefits received in conjunction with work from benefits received without work. Thus, it was not possible to construct one single indicator of dependence; that is, one indicator that measures both percentage of income from means-tested assistance and presence of work activities.
Instead, this chapter includes some indicators that focus on the percentage of recipients’ income from means-tested assistance, while other indicators focus on presence of work activities at the same time as welfare receipt. Still other indicators present summary data and characteristics on all recipients, not limited to those with more than 50 percent of total income from welfare programs or those without work activities.
Overall, the indicators of dependency were selected to reflect both the range and depth of dependence. Indicators in this chapter focus on recipients of three major means-tested cash and nutritional assistance programs: cash assistance through the Aid to Families with Dependent Children (AFDC) and the Temporary Assistance to Needy Families (TANF) programs, Supplemental Security Income (SSI) for elderly and disabled recipients, and the Food Stamp Program.
Here is a brief summary of each of the eleven indicators:
Indicator 1: Degree of Dependence. This indicator focuses most closely on those individuals who meet the Advisory Board’s proposed definition of “dependence.” Thus, it examines those individuals with more than 50 percent of their annual family income from AFDC/TANF, food stamps and/or SSI. This indicator also shows the average percentage of income from means-tested assistance and earnings received by families with varied incomes relative to the poverty level (Indicator 1b).
Indicator 2: Receipt of Means-Tested Assistance and Labor Force Attachment. This indicator looks further at the relationship between receipt of means-tested assistance and participation in the labor force. This is an important issue because of the significant number of low-income individuals who use a combination of means-tested assistance and earnings from the labor force to get by each month.
Indicator 3: Rates of Receipt of Means-Tested Assistance. This indicator paints yet another picture of dependence by measuring recipiency rates, that is, the percentage of the population that receives AFDC/TANF, food stamps, or SSI in an average month. Program administrative data make these figures readily available over time, allowing a better sense of historical trends than is available from the more specialized indicators of dependence.
Indicator 4: Rates of Participation in Means-Tested Assistance Programs. While means-tested public assistance programs are open to all that meet their requirements, not all eligible households participate in the programs. This indicator uses administrative data and microsimulation models to reflect “take up rates” – the number of families that actually participate in the programs as a percentage of those who are eligible.
Indicator 5: Multiple Program Receipt. Depending on their circumstances, individuals may choose a variety of different means-tested assistance “packages.” This indicator looks at the percentage of individuals receiving AFDC/TANF, food stamps, and SSI in a month, examining how many rely on just one of these programs, and how many rely on a combination of two programs.
Indicator 6: Dependence Transitions. This indicator uses data from the Survey of Income and Program Participation (SIPP) to look at the ability of individuals who are dependent on welfare in one year to make the transition out of dependence in the following year.
Indicator 7: Dependence Spell Duration. Like Indicator 6, this indicator is concerned with dynamics of welfare receipt and welfare dependence. It shows the proportion of individuals with short, medium, and long spells, or episodes, of AFDC receipt. The focus is on individuals in AFDC families with no labor force participants. Information on spell lengths for SSI and food stamps is provided in Indicator 8.
Indicator 8: Program Spell Duration. One critical aspect of dependence is how long individuals receive means-tested assistance. Like Indicator 7, this indicator provides information on short, medium, and long spells of welfare receipt. It differs from Indicator 7 in looking at all recipients, regardless of attachment to the labor force, and in analyzing recipients of each of the three major means-tested programs – AFDC, food stamps, and SSI.
Indicator 9: Long-Term Dependency. This indicator uses data from the Panel Study of Income Dynamics (PSID) to examine dependency over a ten-year time period. It measures dependency as individuals with more than 50 percent of their income from AFDC/TANF and food stamps, not counting SSI.
Indicator 10: Long-Term Receipt. Many individuals who leave welfare programs cycle back on after an absence of several months. Thus it is important to look beyond individual program spells, measured in Indicator 8, to examine the cumulative amount of time individuals receive assistance over a period of several years. The issue of long-term receipt is particularly important in light of time limits that have been enacted under state TANF programs.
Indicator 11: Events Associated with the Beginning and Ending of Program Spells. To gain a better understanding of welfare dynamics, it is important to go beyond measures of spell duration and examine information regarding the major events in people’s lives that are correlated with the beginnings or endings of program spells. This measure focuses on receipt of AFDC.
Indicator 1: Degree of Dependence
Figure IND 1a. Percentage of Total Income from Means-Tested Assistance Programs: 1998
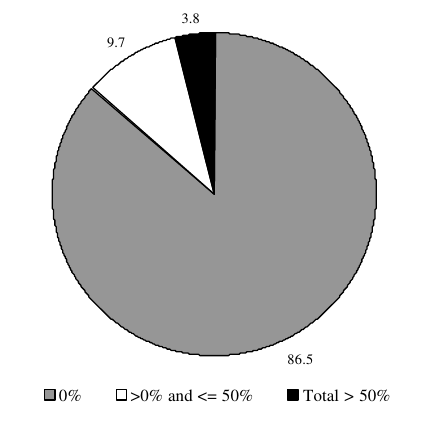
Source: March CPS data, analyzed using the TRIM3 microsimulation model.
- Less than 4 percent of the total population in 1998 received more than half of their total family income from TANF, food stamps and SSI. This number has steady declined since 1993, when nearly 6 percent of the population could be defined as “dependent” on public assistance. The decline in dependency over time was depicted in Figure SUM 1, in Chapter I.
- The vast majority (87 percent) of the total population received no means-tested assistance in 1998. The inverse of this, or the percentage of those in families receiving at least one dollar of assistance from one of the three programs, is the recipiency rate of 13.5 percent shown in Figure and Table SUM 1, in Chapter I.
- In 1998, three out of four of individuals receiving some public assistance reported that TANF, food stamps, and SSI accounted for one-half or less of their total family income.
- As shown in Table IND 1a, a smaller percentage of non-Hispanic whites were receiving more than 50 percent of their annual income from means-tested assistance programs in 1998 (2 percent) than the percentage of non-Hispanic blacks and Hispanics similarly dependent on public assistance (11 percent and 7 percent, respectively).
- Very young children (birth to five years) were more likely than children of other ages to be in families receiving some amount of public assistance. In addition, 8 percent of very young children were dependent on public assistance in 1998.
Table IND 1a.
Percentage of Total Income from Means-Tested Assistance Programs, by Race and Age: Selected Years
| 0% | >0% and <= 50% | Total > 50% | |
|---|---|---|---|
| 1998 | |||
| All Persons | 86.5 | 9.7 | 3.8 |
| Non-Hispanic White | 91.5 | 6.5 | 2.1 |
| Non-Hispanic Black | 70.5 | 19.1 | 10.5 |
| Hispanic | 75.5 | 17.8 | 6.6 |
| Children Ages 0-5 | 77.6 | 14.6 | 7.8 |
| Children Ages 6-10 | 80.0 | 13.4 | 6.7 |
| Children Ages 11-15 | 83.0 | 11.3 | 5.7 |
| Women Ages 16-64 | 86.4 | 9.7 | 3.9 |
| Men Ages 16-64 | 90.0 | 7.9 | 2.1 |
| Adults Age 65 and over | 90.1 | 7.8 | 2.1 |
| 1997 | |||
| All Persons | 85.3 | 10.2 | 4.5 |
| Non-Hispanic White | 90.3 | 7.2 | 2.5 |
| Non-Hispanic Black | 69.9 | 18.8 | 11.4 |
| Hispanic | 72.0 | 18.9 | 9.1 |
| Children Ages 0-5 | 74.9 | 15.8 | 9.3 |
| Children Ages 6-10 | 78.8 | 12.8 | 8.4 |
| Children Ages 11-15 | 80.6 | 12.0 | 7.4 |
| Women Ages 16-64 | 85.4 | 10.0 | 4.6 |
| Men Ages 16-64 | 88.9 | 8.7 | 2.5 |
| Adults Age 65 and over | 89.9 | 8.0 | 2.1 |
| 1996 | |||
| All Persons | 84.0 | 10.9 | 5.2 |
| Non-Hispanic White | 90.1 | 7.2 | 2.6 |
| Non-Hispanic Black | 64.4 | 21.8 | 13.8 |
| Hispanic | 68.0 | 21.2 | 10.9 |
| Children Ages 0-5 | 71.8 | 17.0 | 11.2 |
| Children Ages 6-10 | 75.8 | 14.6 | 9.5 |
| Children Ages 11-15 | 78.9 | 13.0 | 8.1 |
| Women Ages 16-64 | 84.0 | 10.8 | 5.2 |
| Men Ages 16-64 | 88.3 | 9.0 | 2.7 |
| Adults Age 65 and over | 89.7 | 7.9 | 2.4 |
| 1995 | |||
| All Persons | 83.2 | 11.6 | 5.3 |
| Non-Hispanic White | 90.0 | 7.7 | 2.3 |
| Non-Hispanic Black | 61.4 | 23.1 | 15.5 |
| Hispanic | 65.0 | 22.8 | 12.2 |
| Children Ages 0-5 | 68.4 | 18.6 | 12.9 |
| Children Ages 6-10 | 73.5 | 16.0 | 10.5 |
| Children Ages 11-15 | 78.3 | 14.1 | 7.6 |
| Women Ages 16-64 | 83.4 | 11.3 | 5.2 |
| Men Ages 16-64 | 88.2 | 9.3 | 2.5 |
| Adults Age 65 and over | 89.4 | 8.3 | 2.2 |
| 1994 | |||
| All Persons | 82.8 | 11.4 | 5.8 |
| Non-Hispanic White | 89.1 | 8.0 | 2.9 |
| Non-Hispanic Black | 61.7 | 21.6 | 16.7 |
| Hispanic | 65.1 | 22.4 | 12.5 |
| Children Ages 0-5 | 68.5 | 17.8 | 13.7 |
| Children Ages 6-10 | 73.2 | 15.6 | 11.2 |
| Children Ages 11-15 | 76.5 | 14.3 | 9.2 |
| Women Ages 16-64 | 83.1 | 11.2 | 5.7 |
| Men Ages 16-64 | 88.1 | 9.3 | 2.7 |
| Adults Age 65 and over | 89.1 | 8.2 | 2.7 |
| 1993 | |||
| All Persons | 83.4 | 10.7 | 5.9 |
| Non-Hispanic White | 89.7 | 7.3 | 3.0 |
| Non-Hispanic Black | 62.0 | 20.3 | 17.8 |
| Hispanic | 65.4 | 22.8 | 11.8 |
| Children Ages 0-5 | 69.5 | 16.6 | 13.9 |
| Children Ages 6-10 | 75.1 | 13.7 | 11.2 |
| Children Ages 11-15 | 77.9 | 12.8 | 9.3 |
| Women Ages 16-64 | 83.6 | 10.5 | 5.9 |
| Men Ages 16-64 | 88.5 | 8.8 | 2.7 |
| Adults Age 65 and over | 88.8 | 8.8 | 2.4 |
Note: Means-tested assistance includes AFDC/TANF, SSI, and food stamps. Total >50% includes all persons with more than 50 percent of their total annual family income from these means-tested programs. Income includes cash income and the value of food stamps. Differences between data presented in this report and the 2000 Indicators of Welfare Dependence report are discussed in Appendix D.
Source: March CPS data, analyzed using the TRIM3 microsimulation model.
Figure IND 1b. Percentage of Total Income from Various Sources, by Poverty Status: 1998
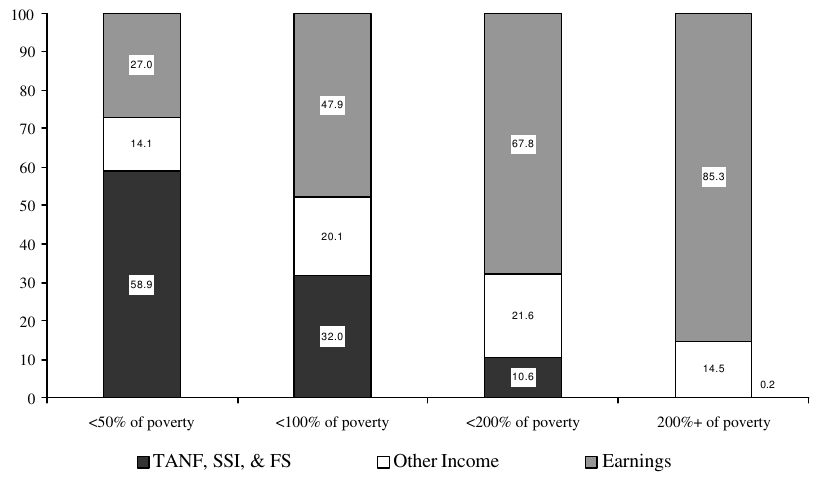
Source: March CPS data, analyzed using the TRIM3 microsimulation model.
- Those in families with incomes below the poverty level received nearly half (48 percent) of their total family income from earnings and about a third (32 percent) of their total family income from means-tested assistance programs (AFDC/TANF, SSI, and food stamps) in 1998.&amp;nbsp; In contrast, those with family incomes over 200 percent of the poverty level received the majority (85 percent) of their incomes from earnings and less than one percent of their income from means-tested assistance (a percentage so small as to not be visible in Figure IND 1b).
- The percentage of family income received from earnings is inversely proportional to overall family income relative to the poverty line.&amp;nbsp; For example, the percentage of income received from earnings for those living in deep poverty (below 50 percent of poverty) was only 27 percent, compared to 48 percent for all poor individuals in 1998.
- On average, children were more likely than the elderly to live in families receiving a higher percentage of their income from means-tested assistance programs, as shown by Table IND 1b.&amp;nbsp; The elderly received more income from other sources, including Social Security benefits and private pensions.
Table IND 1b. Percentage of Total Income from Various Sources, by Poverty Status, Race, and Age: 1998
| < 50% poverty | <100% of poverty | <200% of poverty | 200%+ of poverty | |
|---|---|---|---|---|
| All Persons | ||||
| TANF, SSI, and Food Stamps | 58.9 | 32.0 | 10.6 | 0.2 |
| Earnings | 27.0 | 47.9 | 67.8 | 85.3 |
| Other Income | 14.1 | 20.1 | 21.6 | 14.5 |
| Racial Categories | ||||
| Non-Hispanic White | ||||
| TANF, SSI, and Food Stamps | 51.0 | 29.1 | 7.7 | 0.1 |
| Earnings | 28.5 | 45.6 | 64.7 | 84.5 |
| Other Income | 20.5 | 25.3 | 27.7 | 15.4 |
| Non-Hispanic Black | ||||
| TANF, SSI, and Food Stamps | 69.1 | 38.1 | 16.7 | 0.7 |
| Earnings | 20.3 | 41.1 | 62.9 | 87.1 |
| Other Income | 10.5 | 20.8 | 20.4 | 12.3 |
| Hispanic | ||||
| TANF, SSI, and Food Stamps | 54.4 | 28.4 | 10.6 | 0.6 |
| Earnings | 36.1 | 59.2 | 78.7 | 91.1 |
| Other Income | 9.6 | 12.4 | 10.6 | 8.3 |
| Age Categories | ||||
| Children Ages 0-5 | ||||
| TANF, SSI, and Food Stamps | 65.4 | 37.7 | 13.7 | 0.3 |
| Earnings | 23.9 | 51.2 | 77.2 | 93.7 |
| Other Income | 10.8 | 11.1 | 9.1 | 6.1 |
| Children Ages 6-10 | ||||
| TANF, SSI, and Food Stamps | 65.6 | 35.2 | 12.3 | 0.2 |
| Earnings | 22.7 | 51.6 | 75.9 | 92.7 |
| Other Income | 11.7 | 13.1 | 11.8 | 7.2 |
| Children Ages 11-15 | ||||
| TANF, SSI, and Food Stamps | 63.6 | 34.7 | 11.7 | 0.2 |
| Earnings | 22.4 | 49.6 | 75.1 | 91.1 |
| Other Income | 14.0 | 15.6 | 13.2 | 8.7 |
| Women Ages 16-64 | ||||
| TANF, SSI, and Food Stamps | 56.4 | 32.6 | 11.3 | 0.2 |
| Earnings | 28.8 | 48.1 | 71.4 | 88.2 |
| Other Income | 14.8 | 19.3 | 17.3 | 11.6 |
| Men Ages 16-64 | ||||
| TANF, SSI, and Food Stamps | 41.9 | 26.1 | 8.3 | 0.2 |
| Earnings | 41.0 | 54.8 | 75.7 | 89.5 |
| Other Income | 17.1 | 19.2 | 16.0 | 10.3 |
| Adults Age 65 and over | ||||
| TANF, SSI, and Food Stamps | 25.1 | 19.3 | 6.2 | 0.3 |
| Earnings | 8.0 | 5.3 | 9.5 | 33.0 |
| Other Income | 66.9 | 75.3 | 84.3 | 66.7 |
Note: Total income is total annual family income, including the value of food stamps. Other income is non means-tested, non-earnings income such as child support, alimony, pensions, Social Security benefits, interest, and dividends.&amp;nbsp; Poverty status categories are not mutually exclusive. Differences between data presented in this report and the 2000 Indicators of Welfare Dependence report are discussed in Appendix D.
Source: March CPS data, analyzed using the TRIM3 microsimulation model.
Indicator 2: Receipt of Means-tested Assistance and Labor Force Attachment
Figure IND 2a. Percentage of Recipients in Families with Labor Force Participants, by Program: 1998
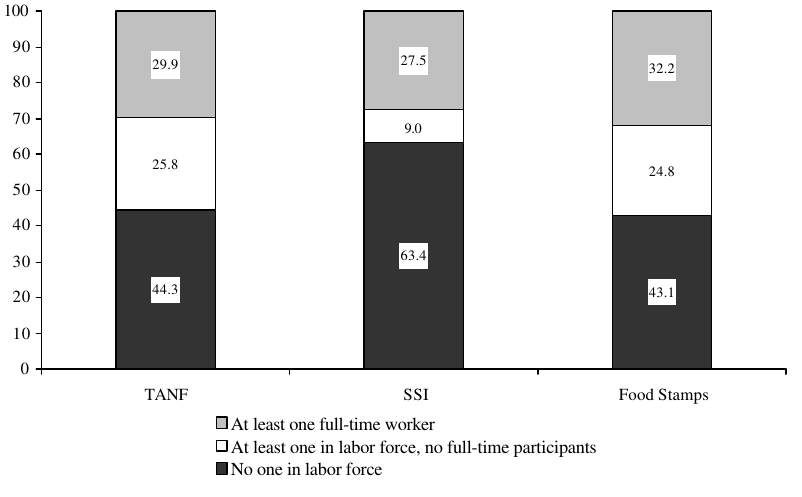
Source: March CPS data, analyzed using the TRIM3 microsimulation model.
-
In 1998, 56 percent of individuals who received TANF, 57 percent of individuals who received food stamps, and 37 percent of individuals who received SSI were in families with at least one person in the labor force.
-
About one-fourth of TANF and food stamp recipients live in families with a part-time labor force participant. In contrast, SSI recipients were more likely to live in families with no labor force participant, or in families with a full-time worker.
-
As shown in Table IND 2a, among recipients of TANF, food stamps, and SSI, a larger percentage of children under age 6 were in families with at least one full-time worker, as compared to children ages 6 to 15.
-
Working-age male recipients of TANF and food stamps were more likely than working-age females to be in families with at least one full-time worker.
Table IND 2a. Percentage of Recipients in Families with Labor Force Participants, by Program, Race, and Age: 1998
| No one in LF | At least one in LF, No one FT | At least one FT worker | ||
|---|---|---|---|---|
| TANF | All Persons | 44.3 | 25.8 | 29.9 |
| Non-Hispanic White | 38.5 | 28.2 | 33.3 | |
| Non-Hispanic Black | 53.4 | 24.8 | 21.9 | |
| Hispanic | 42.1 | 21.5 | 36.5 | |
| Children Ages 0-5 | 46.9 | 20.6 | 32.6 | |
| Children Ages 6-10 | 48.0 | 24.7 | 27.4 | |
| Children Ages 11-15 | 44.3 | 30.9 | 24.8 | |
| Women Ages 16-64 | 43.5 | 27.9 | 28.5 | |
| Men Ages 16-64 | 32.2 | 28.2 | 39.6 | |
| Adults Age 65 and over | 67.9 | 8.0 | 24.1 | |
| SSI | All Persons | 63.4 | 9.0 | 27.5 |
| Non-Hispanic White | 68.1 | 8.9 | 23.0 | |
| Non-Hispanic Black | 66.3 | 8.4 | 25.3 | |
| Hispanic | 54.5 | 9.1 | 36.4 | |
| Children Ages 0-5 | 27.4 | 16.3 | 56.3 | |
| Children Ages 6-10 | 39.4 | 19.9 | 40.7 | |
| Children Ages 11-15 | 29.0 | 23.3 | 47.6 | |
| Women Ages 16-64 | 68.9 | 9.1 | 22.0 | |
| Men Ages 16-64 | 67.8 | 8.8 | 23.4 | |
| Adults Age 65 and over | 67.7 | 4.6 | 27.7 | |
| FOOD STAMPS | All Persons | 43.1 | 24.8 | 32.2 |
| Non-Hispanic White | 43.4 | 24.8 | 31.8 | |
| Non-Hispanic Black | 45.5 | 25.4 | 29.1 | |
| Hispanic | 39.2 | 21.2 | 39.7 | |
| Children Ages 0-5 | 36.8 | 24.3 | 38.9 | |
| Children Ages 6-10 | 37.0 | 26.4 | 36.6 | |
| Children Ages 11-15 | 38.8 | 29.5 | 31.8 | |
| Women Ages 16-64 | 43.3 | 26.6 | 30.1 | |
| Men Ages 16-64 | 39.8 | 24.6 | 35.6 | |
| Adults Age 65 and over | 88.6 | 6.7 | 4.6 |
Note: Recipients are limited to those individuals or family members directly receiving benefits in a month. Full-time workers are those who usually work 35 hours or more per week. Part-time labor force participation includes those who are unemployed, laid off, and/or looking for work. This indicator measures, on an average monthly basis, the combination of individual benefit receipt and labor force participation by any family member in the same month. Differences between data presented in this report and the 2000 Indicators of Welfare Dependence report are discussed in Appendix D.
Source: March CPS data, analyzed using the TRIM3 microsimulation model.
Figure IND 2b. Percentage of AFDC/TANF Recipients in Families with Labor Force Participants: 1993-1998
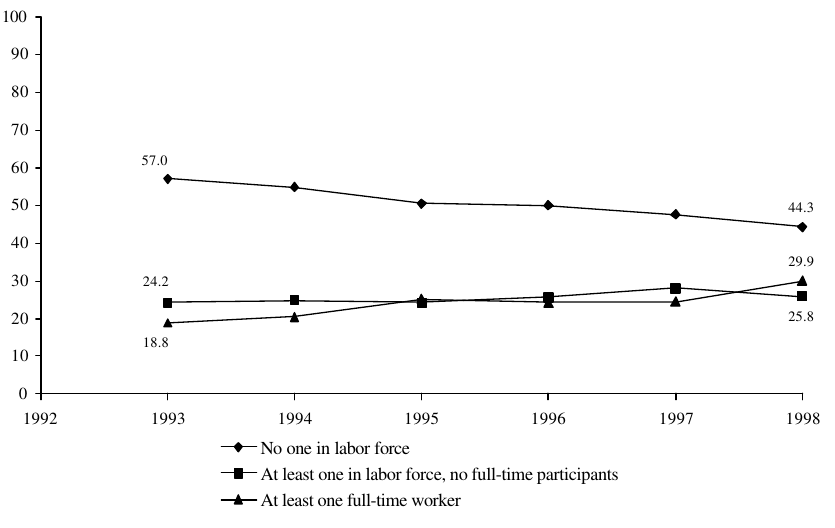
Source: March CPS data, analyzed using the TRIM3 microsimulation model.
-
The percentage of AFDC/TANF recipients living in families with at least one full-time worker increased during the mid-to-late 1990s, from 19 percent in 1993 to 30 percent in 1998.
- The percentage of AFDC/TANF recipients living in families with no one in the labor force dropped significantly between 1993 and 1998. In 1998, only 44 percent of AFDC/TANF recipients lived in families with no one in the labor force in the same month as benefit receipt, as compared to 57 percent in 1993.
- Some of the increase in full-time work among AFDC/TANF recipients represents a shift from part-time to full-time work. In fact, 1998 marked the first time in several years that the majority of AFDC/TANF recipients living in families with at least one labor force participant also lived with at least one full-time worker.
Table IND 2b. Percentage of AFDC/TANF Recipients in Families with Labor Force Participants: 1993-1998
| No one in LF | At least one in LF, No one FT | At least one FT worker | |
|---|---|---|---|
| 1993 | 57.0 | 24.2 | 18.8 |
| 1994 | 54.8 | 24.8 | 20.4 |
| 1995 | 50.6 | 24.3 | 25.1 |
| 1996 | 50.1 | 25.6 | 24.3 |
| 1997 | 47.6 | 28.0 | 24.4 |
| 1998 | 44.3 | 25.8 | 29.9 |
Note: Recipients are limited to those individuals or family members directly receiving benefits in a month. Full-time workers are those who usually work 35 hours or more per week. Part-time labor force participation includes those who are unemployed, laid off, and/or looking for work. This indicator measures, on an average monthly basis, the combination of individual benefit receipt and labor force participation by any family member in the same month. Differences between data presented in this report and the 2000 Indicators of Welfare Dependence report are discussed in Appendix D.
Source: March CPS data, analyzed using the TRIM3 microsimulation model.
Indicator 3: Rates of Receipt of Means-tested Assistance
Figure IND 3a. Percentage of the Total Population Receiving AFDC/TANF, by Age: 1970-1999
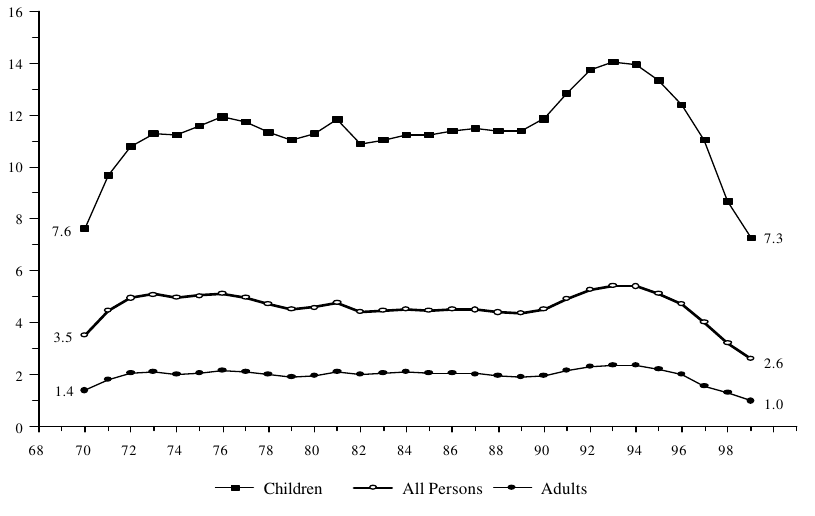
Source: U.S. Department of Health and Human Services, Administration for Children and Families, Office of Family Assistance, and U.S. Bureau of the Census, Resident Population Estimates of the United States by Age and Sex, April 1, 1990 to July 1, 2000, Internet release date January 2, 2001 (Available online at http://www.census.gov).
-
Although the survey data needed to examine overall welfare receipt and dependency are not yet available past 1998, administrative data for AFDC/TANF, food stamps, and SSI provide measures of recipiency for each of these three programs through 1999, as shown in Figures IND 3a, IND 3b, and IND 3c. Additional administrative data are shown in Appendix A.
- Less than 3 percent of the population received TANF in 1999. This is the lowest rate of AFDC/TANF receipt in the 28 years shown in Table IND 3a. The percentage of the total population receiving AFDC/TANF has dropped significantly since 1994, when it was at a 25-year high of over 5 percent.
-
AFDC/TANF recipiency rates have been much higher over time for children than for adults, with the child recipiency rates also showing more pronounced changes over time. Between 1993 and 1999, the receipt of AFDC/TANF receipt among children was cut in half (from 14 to 7 percent), the most rapid decline in a generation.
Table IND 3a. Number and Percentage of the Total Population Receiving AFDC/TANF, by Age: 1970-1999
| Total Recipients Number | Adult Recipients Number | Child Recipients Number | ||||
|---|---|---|---|---|---|---|
| Fiscal Year | (thousands) | Percent | (thousands) | Percent | (thousands) | Percent |
| 1970 | 7,188 | 3.5 | 1,863 | 1.4 | 5,325 | 7.6 |
| 1971 | 9,281 | 4.5 | 2,516 | 1.8 | 6,765 | 9.7 |
| 1972 | 10,345 | 4.9 | 2,848 | 2.0 | 7,497 | 10.8 |
| 1973 | 10,760 | 5.1 | 2,984 | 2.1 | 7,776 | 11.3 |
| 1974 | 10,591 | 5.0 | 2,935 | 2.0 | 7,656 | 11.3 |
| 1975 | 10,854 | 5.0 | 3,078 | 2.1 | 7,776 | 11.6 |
| 1976 | 11,171 | 5.1 | 3,271 | 2.2 | 7,900 | 11.9 |
| 1977 | 10,933 | 5.0 | 3,230 | 2.1 | 7,703 | 11.8 |
| 1978 | 10,485 | 4.7 | 3,128 | 2.0 | 7,357 | 11.4 |
| 1979 | 10,146 | 4.5 | 3,071 | 1.9 | 7,075 | 11.0 |
| 1980 | 10,422 | 4.6 | 3,226 | 2.0 | 7,196 | 11.3 |
| 1981 | 10,979 | 4.8 | 3,491 | 2.1 | 7,488 | 11.8 |
| 1982 | 10,233 | 4.4 | 3,395 | 2.0 | 6,838 | 10.9 |
| 1983 | 10,467 | 4.5 | 3,548 | 2.1 | 6,919 | 11.1 |
| 1984 | 10,677 | 4.5 | 3,652 | 2.1 | 7,025 | 11.2 |
| 1985 | 10,630 | 4.5 | 3,589 | 2.0 | 7,041 | 11.2 |
| 1986 | 10,810 | 4.5 | 3,637 | 2.1 | 7,173 | 11.4 |
| 1987 | 10,878 | 4.5 | 3,624 | 2.0 | 7,254 | 11.5 |
| 1988 | 10,734 | 4.4 | 3,536 | 2.0 | 7,198 | 11.4 |
| 1989 | 10,741 | 4.4 | 3,503 | 1.9 | 7,238 | 11.4 |
| 1990 | 11,263 | 4.5 | 3,643 | 2.0 | 7,620 | 11.9 |
| 1991 | 12,391 | 4.9 | 4,016 | 2.1 | 8,375 | 12.9 |
| 1992 | 13,423 | 5.3 | 4,336 | 2.3 | 9,087 | 13.7 |
| 1993 | 13,943 | 5.4 | 4,519 | 2.4 | 9,424 | 14.1 |
| 1994 | 14,033 | 5.4 | 4,554 | 2.4 | 9,479 | 14.0 |
| 1995 | 13,479 | 5.1 | 4,322 | 2.2 | 9,157 | 13.4 |
| 1996 | 12,476 | 4.7 | 3,920 | 2.0 | 8,556 | 12.4 |
| 1997 | 10,779 | 4.0 | 3,106 | 1.6 | 7,673 | 11.0 |
| 1998 | 8,633 | 3.2 | 2,573 | 1.3 | 6,060 | 8.7 |
| 1999 | 7,069 | 2.6 | 1,973 | 1.0 | 5,096 | 7.3 |
Notes: See Appendix A, Tables TANF 2, TANF 12, and TANF 14, for more detailed data on recipiency rates, including recipiency rates by calendar year. Recipients are expressed as the fiscal year average of monthly caseloads from administrative data, excluding recipients in the territories. Child recipients include a small number of dependents ages 18 and older who are students. The average number of adult and child recipients in 1998 and 1999 is estimated using data from the Quality Control sample.
Source: U.S. Department of Health and Human Services, Administration for Children and Families, Office of Family Assistance, and U.S. Bureau of the Census, Resident Population Estimates of the United States by Age and Sex, April 1, 1990 to July 1, 2000, Internet release date January 2, 2001 (Available online at http://www.census.gov).
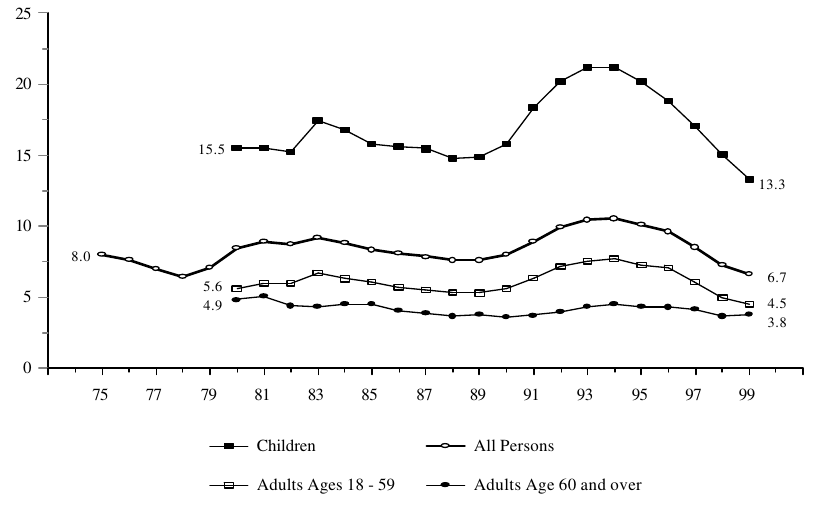
Figure IND 3b. Percentage of the Total Population Receiving Food Stamps, by Age: 1975-1999
Source: USDA, Food and Nutrition Service, Office of Analysis, Nutrition, and Evaluation, Characteristics of Food Stamp Households, Fiscal Year 1999, and earlier reports, and U.S. Bureau of the Census, Resident Population Estimates of the United States by Age and Sex, April 1, 1990 to November 1, 2000, Internet release date January 2, 2001 (Available online at http://www.census.gov).
- The food stamp recipiency rate, like the AFDC/TANF recipiency rate shown previously in Figure IND 3a, has fallen sharply in recent years. The percentage of all persons receiving food stamps peaked in 1994, at nearly 11 percent, but dropped to less than 7 percent in 1999, its lowest point since 1979.
- As with AFDC/TANF, food stamp recipiency rates have been much higher over time for children than for adults. Between 1980 and 1999, the percentage of all children who received food stamps was between two and one-half to three times that for all adults 18 to 59.
- Similar trends in food stamps recipiency – largely reflecting changes in the rate of unemployment and programmatic changes – existed across all age groups over time, as shown in Table IND 3b. The percentages of individuals receiving food stamps within all age groups declined from 1984 through 1988, rose in the early 1990s, peaked in 1994, and fell sharply between 1994 and 1999.
Table IND 3b. Number and Percentage of the Total Population Receiving Food Stamps, by Age: 1975-1999
| Total Recipients Number | Adult Recipients Age 60 and over Number | Adult Recipients Ages 18-59 Number | Child Recipients Ages 0-18 Number | |||||
|---|---|---|---|---|---|---|---|---|
| Fiscal Year | (thousands) | Percent | (thousands) | Percent | (thousands) | Percent | (thousands) | Percent |
| 1975 | 17,217 | 8.0 | – | – | – | – | – | – |
| 1976 | 16,733 | 7.7 | – | – | – | – | – | – |
| 1977 | 15,579 | 7.1 | – | – | – | – | – | – |
| 1978 | 14,503 | 6.5 | – | – | – | – | – | – |
| 1979 | 15,976 | 7.1 | – | – | – | – | – | – |
| 1980 | 19,253 | 8.5 | 1,741 | 4.9 | 7,186 | 5.6 | 9,876 | 15.5 |
| 1981 | 20,654 | 9.0 | 1,845 | 5.0 | 7,811 | 6.0 | 9,803 | 15.5 |
| 1982 | 20,446 | 8.8 | 1,641 | 4.4 | 7,838 | 6.0 | 9,591 | 15.3 |
| 1983 | 21,667 | 9.3 | 1,654 | 4.4 | 8,960 | 6.7 | 10,910 | 17.4 |
| 1984 | 20,796 | 8.8 | 1,758 | 4.5 | 8,521 | 6.3 | 10,492 | 16.8 |
| 1985 | 19,847 | 8.3 | 1,783 | 4.5 | 8,258 | 6.1 | 9,906 | 15.8 |
| 1986 | 19,381 | 8.1 | 1,631 | 4.1 | 7,895 | 5.7 | 9,844 | 15.7 |
| 1987 | 19,072 | 7.9 | 1,589 | 3.9 | 7,684 | 5.5 | 9,771 | 15.5 |
| 1988 | 18,613 | 7.6 | 1,500 | 3.7 | 7,506 | 5.3 | 9,351 | 14.8 |
| 1989 | 18,778 | 7.6 | 1,582 | 3.8 | 7,560 | 5.3 | 9,429 | 14.9 |
| 1990 | 20,038 | 8.0 | 1,511 | 3.6 | 8,084 | 5.6 | 10,127 | 15.8 |
| 1991 | 22,599 | 9.0 | 1,593 | 3.8 | 9,190 | 6.4 | 11,952 | 18.4 |
| 1992 | 25,369 | 9.9 | 1,687 | 3.9 | 10,550 | 7.2 | 13,349 | 20.2 |
| 1993 | 26,952 | 10.5 | 1,876 | 4.4 | 11,214 | 7.6 | 14,196 | 21.2 |
| 1994 | 27,434 | 10.6 | 1,952 | 4.5 | 11,539 | 7.7 | 14,391 | 21.2 |
| 1995 | 26,579 | 10.1 | 1,896 | 4.3 | 10,962 | 7.3 | 13,860 | 20.2 |
| 1996 | 25,494 | 9.6 | 1,892 | 4.3 | 10,766 | 7.1 | 12,992 | 18.8 |
| 1997 | 22,820 | 8.5 | 1,834 | 4.1 | 9,385 | 6.1 | 11,871 | 17.1 |
| 1998 | 19,746 | 7.3 | 1,637 | 3.7 | 7,772 | 5.0 | 10,546 | 15.1 |
| 1999 | 18,149 | 6.7 | 1,666 | 3.8 | 7,090 | 4.5 | 9,354 | 13.3 |
Note: See Appendix A, Tables FSP 1 and FSP 6 for more detailed data on recipiency rates. Recipients are expressed as the fiscal year average of monthly caseloads from administrative data, excluding recipients in the territories.
Source: USDA, Food and Nutrition Service, Office of Analysis, Nutrition, and Evaluation, Characteristics of Food Stamp Households, Fiscal Year 1999, and earlier reports, and U.S. Bureau of the Census, Resident Population Estimates of the United States by Age and Sex, April 1, 1990 to November 1, 2000, Internet release date January 2, 2001 (Available online at http://www.census.gov).
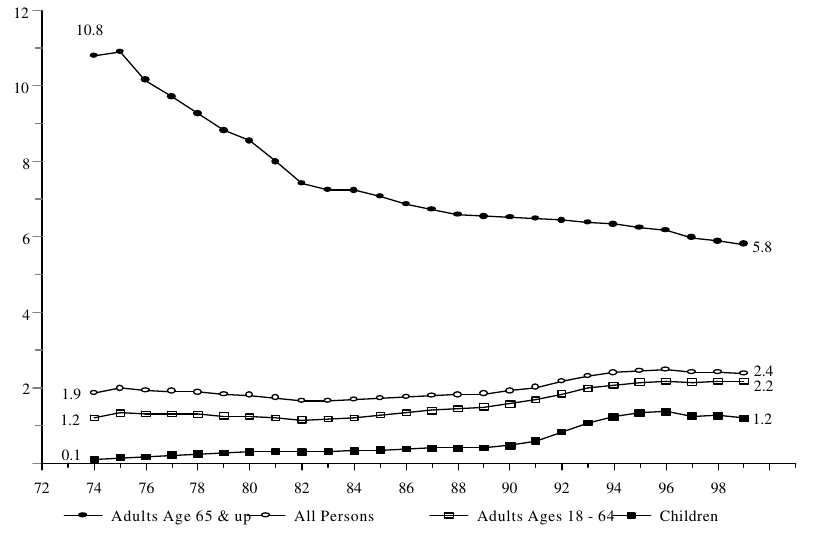
Figure IND 3c. Percentage of the Total Population Receiving SSI, by Age: 1974-1999
Source: Social Security Administration, Office of Research, Evaluation, and Statistics, Social Security Bulletin ·Annual Statistical Supplement · 2000 (Data available online at http://www.ssa.gov/statistics), and U.S. Bureau of the Census, Resident Population Estimates of the United States by Age and Sex, April 1, 1990 to November 1, 2000, Internet release date January 2, 2001 (Available online at http://www.census.gov).
- Unlike the recipiency rates for AFDC/TANF and food stamps, which have been influenced by outside factors such as the economy and welfare reform, overall recipiency rates for SSI show less variation over time. After trending downward slightly from 1975 to the early 1980s, the proportion of the total population that receives SSI has risen from 1.7 percent in 1983 to 2.4 percent in 1999. As shown in Table IND 3c, the total number of recipients has grown by 70 percent over the same period, from 3.9 million to 6.6 million people.
- Elderly adults (aged 65 and older) have much higher recipiency rates than any other age group. The gap has narrowed, however, as percentage of adults aged 65 and older has been cut nearly in half, declining from 11 percent in 1974 to less than 6 percent in 1999.
- The proportion of children receiving SSI increased gradually between 1975 and 1990, and grew more rapidly in the early-to-mid 1990s, reaching a high of 1.4 percent in 1996. The rate has since fallen, with 1.2 percent of children receiving SSI in 1999.
Table IND 3c. Number and Percentage of the Total Population Receiving SSI, by Age: 1975-1999
| Total Recipients Number | Adult Recipients Age 65 & over Number | Adult Recipients Ages 18-64 Number | Child Recipients Ages 0-18 Number | |||||
|---|---|---|---|---|---|---|---|---|
| (thousands) | Percent | (thousands) | Percent | (thousands) | Percent | (thousands) | Percent | |
| Dec'75 | 4,314 | 2.0 | 2,508 | 10.9 | 1,699 | 1.3 | 107 | 0.2 |
| Dec'76 | 4,236 | 1.9 | 2,397 | 10.2 | 1,714 | 1.3 | 125 | 0.2 |
| Dec'77 | 4,238 | 1.9 | 2,353 | 9.7 | 1,738 | 1.3 | 147 | 0.2 |
| Dec'78 | 4,217 | 1.9 | 2,304 | 9.3 | 1,747 | 1.3 | 166 | 0.3 |
| Dec'79 | 4,150 | 1.8 | 2,246 | 8.8 | 1,727 | 1.3 | 177 | 0.3 |
| Dec'80 | 4,142 | 1.8 | 2,221 | 8.6 | 1,731 | 1.2 | 190 | 0.3 |
| Dec'81 | 4,019 | 1.7 | 2,121 | 8.0 | 1,703 | 1.2 | 195 | 0.3 |
| Dec'82 | 3,858 | 1.7 | 2,011 | 7.4 | 1,655 | 1.2 | 192 | 0.3 |
| Dec'83 | 3,901 | 1.7 | 2,003 | 7.3 | 1,700 | 1.2 | 198 | 0.3 |
| Dec'84 | 4,029 | 1.7 | 2,037 | 7.2 | 1,780 | 1.2 | 212 | 0.3 |
| Dec'85 | 4,138 | 1.7 | 2,031 | 7.1 | 1,879 | 1.3 | 227 | 0.4 |
| Dec'86 | 4,269 | 1.8 | 2,018 | 6.9 | 2,010 | 1.3 | 241 | 0.4 |
| Dec'87 | 4,385 | 1.8 | 2,015 | 6.7 | 2,119 | 1.4 | 251 | 0.4 |
| Dec'88 | 4,464 | 1.8 | 2,006 | 6.6 | 2,203 | 1.5 | 255 | 0.4 |
| Dec'89 | 4,593 | 1.9 | 2,026 | 6.5 | 2,302 | 1.5 | 265 | 0.4 |
| Dec'90 | 4,817 | 1.9 | 2,059 | 6.5 | 2,450 | 1.6 | 309 | 0.5 |
| Dec'91 | 5,118 | 2.0 | 2,080 | 6.5 | 2,642 | 1.7 | 397 | 0.6 |
| Dec'92 | 5,566 | 2.2 | 2,100 | 6.5 | 2,910 | 1.9 | 556 | 0.8 |
| Dec'93 | 5,984 | 2.3 | 2,113 | 6.4 | 3,148 | 2.0 | 723 | 1.1 |
| Dec'94 | 6,296 | 2.4 | 2,119 | 6.3 | 3,335 | 2.1 | 841 | 1.2 |
| Dec'95 | 6,514 | 2.5 | 2,115 | 6.3 | 3,482 | 2.2 | 917 | 1.3 |
| Dec'96 | 6,630 | 2.5 | 2,110 | 6.2 | 3,568 | 2.2 | 955 | 1.4 |
| Dec'97 | 6,495 | 2.4 | 2,054 | 6.0 | 3,562 | 2.2 | 880 | 1.3 |
| Dec'98 | 6,566 | 2.4 | 2,033 | 5.9 | 3,646 | 2.2 | 887 | 1.3 |
| Dec'99 | 6,557 | 2.4 | 2,019 | 5.8 | 3,691 | 2.2 | 847 | 1.2 |
Note: December population figures used as the denominators are obtained by averaging the Census Bureau's July 1 population estimates for the current and the following year. See Appendix A, Tables SSI 2, SSI 8, and SSI 9 for more detailed data on SSI recipiency rates. In this report the categories of children under 18 and adults 18-64 differ from those in previous editions where the category of children included a small number of dependents 18 and older who were students.
Source: Social Security Administration, Office of Research, Evaluation, and Statistics, Social Security Bulletin, Annual Statistical Supplement, 2000 (Data available online at http://www.ssa.gov/statistics), and U.S. Bureau of the Census, Resident Population Estimates of the United States by Age and Sex, April 1, 1990 to November 1, 2000, Internet release date January 2, 2001 (Available online at http://www.census.gov).
Indicator 4: Rates of Participation in Means-tested Assistance Programs
Figure IND 4. Participation Rates in the AFDC/TANF, Food Stamp and SSI Programs: Selected Years
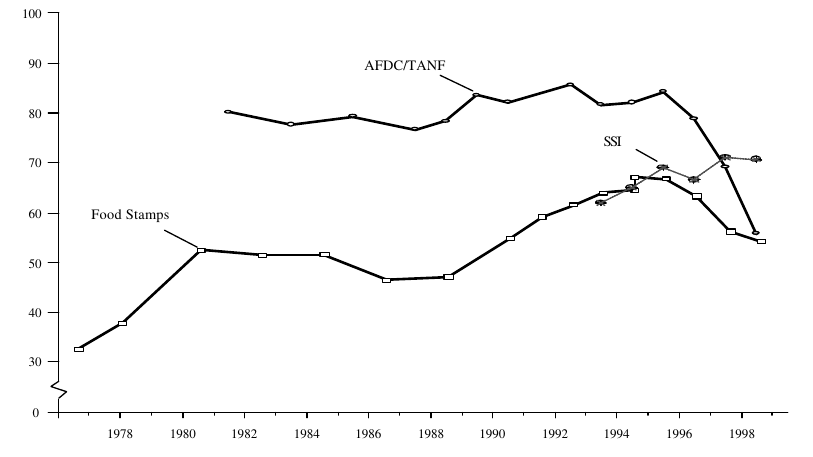
Source: AFDC and SSI participation rates are tabulated using TRIM3 microsimulation model, while food stamp participation rates are from a Mathematica Policy Research, Inc. model. See Tables IND 4a, IND 4b, and IND 4c for details.
-
Whereas Indicator 3 examined participants as a percentage of the total population (recipiency rates), this indicator examines participating families or households as a percentage of the estimated eligible population (participation rates, also known as “take up” rates).
-
Participation rates for both AFDC/TANF and the Food Stamp Program fell significantly between 1995 and 1998. In contrast, the SSI participation rate showed a slight net increase over this time period.
-
Only 56 percent of the families estimated as eligible for AFDC/TANF actually enrolled and received benefits in an average month in 1998. This was significantly lower than traditional participation rates, which ranged from 77 to 86 percent between 1981 and 1996.
-
For the first time, in 1998 the SSI participation rate was significantly higher than the TANF rate – 71 percent versus 56 percent – while the food stamp participation rate was only slightly lower – 54 percent.
Table IND 4a. Number and Percentage of Eligible Families Participating in AFDC/TANF: Selected Years
| Calendar Year | Eligible Families (in millions) | Participating Families (in millions) | Participation Rate (percent) |
|---|---|---|---|
| 1981 | 4.8 | 3.8 | 80.2 |
| 1983 | 4.7 | 3.7 | 77.7 |
| 1985 | 4.7 | 3.7 | 79.3 |
| 1987 | 4.9 | 3.8 | 76.7 |
| 1988 | 4.8 | 3.7 | 78.4 |
| 1989 | 4.5 | 3.8 | 83.6 |
| 1990 | 4.9 | 4.1 | 82.2 |
| 1992 | 5.6 | 4.8 | 85.7 |
| 1993 | 6.1 | 5.0 | 81.7 |
| 1994 | 6.1 | 5.0 | 82.6 |
| 1994 (revised) | 6.1 | 5.0 | 82.1 |
| 1995 | 5.7 | 4.8 | 84.3 |
| 1996 | 5.6 | 4.4 | 78.9 |
| 1997 | 5.6 | 3.7 | 67.5 |
| 1997 (adjusted) | 5.4 | 3.7 | 69.2 |
| 1998 (adjusted) | 5.4 | 3.0 | 55.8 |
Notes: Participation rates are estimated by an Urban Institute model (TRIM3) which uses CPS data to simulate AFDC/TANF eligibility and participation for an average month, by calendar year. There have been small changes in estimating methodology over time, due to model improvements and revisions to the CPS. Most notably, since 1994, the model has been revised to more accurately estimate SSI participation among children, and in 1997 and 1998 the model was adjusted to more accurately exclude ineligible immigrants. The numbers of eligible and participating families shown above include the territories and pregnant women without children, even though these two small groups are excluded from the TRIM model The numbers shown here implicitly assume that participation rates for the territories and for pregnant women with no other children are the same as for all other eligibles.
Source: DHHS, Administration for Children and Families caseload tabulations, and unpublished data from the TRIM3 microsimulation model.
- The eligible population for AFDC/TANF declined by only 5 percent between 1995 and 1998, according to estimates shown in Table IND 4a. Thus the large caseload declines over that period were largely a result of declining participation or “take up” rates among the eligible populations.
Table IND 4b. Number and Percentage of Eligible Households Participating in the Food Stamp Program: Selected Years
| Eligible Households (in millions) | Participating Households (in millions) | Participation Rate (percent) | |
|---|---|---|---|
| September 76 | 16.3 | 5.3 | 33 |
| February 78 | 14.0 | 5.3 | 38 |
| August 80 | 14.0 | 7.4 | 52 |
| August 82 | 14.5 | 7.5 | 51 |
| August 84 | 14.2 | 7.3 | 52 |
| August 86 | 15.3 | 7.1 | 47 |
| August 88 | 14.9 | 7.0 | 47 |
| August 90 | 14.5 | 8.0 | 55 |
| August 91 | 15.6 | 9.2 | 59 |
| August 92 | 16.7 | 10.2 | 62 |
| August 93 | 17.0 | 10.9 | 64 |
| August 94 (o) | 17.0 | 11.0 | 65 |
| August 94 (r) | 15.9 | 10.7 | 67 |
| August 95 | 15.5 | 10.4 | 67 |
| August 96 | 15.9 | 10.1 | 63 |
| September 97 | 15.0 | 8.5 | 56 |
| September 98 | 14.0 | 7.6 | 54 |
Note: Eligible households estimated from a Mathematica Policy Research, Inc. model that uses CPS data to simulate the Food Stamp Program. Caseload data are from USDA, FNS program operations caseload data. There have been small changes in estimating methodology over time, due to model improvements and revisions to the CPS. Most notably, the model was revised in 1994 to produce more accurate (and lower) estimates of eligible households. The original 1994 estimate and estimates for previous years show higher estimates of eligibles and lower participation rates relative to the revised estimate for 1994 and estimates for subsequent years.
Source: U.S. Department of Agriculture, Food and Nutrition Service, Trends in Food Stamp Program Participation Rates: Focus on September 1997.
- The proportion of eligible households who participated in the Food Stamp program fell from 63 percent in 1996 to 54 percent in 1998, a drop of 9 percentage points. This is the third year in a row that there has been a decline in Food Stamp participation rates.
-
In addition, there was a decline in the number of households eligible for the Food Stamp program, from almost 16 million in August 1994 to 14 million in September 1998. This decline was driven by new eligibility restrictions on aliens and able-bodied adults without dependent children, growth in the economy, changes in the TANF program, and other factors.
-
The significant drop in participating households, from 10.1 million households in August 1996 to 7.6 million households in September 1998, reflects the combined effect of a decline in the eligible population and lower participation rates.
Table IND 4c. Percentage of Eligible Adult Units Participating in the SSI Program, by Type: 1993-1998
| One-Person Units | ||||
|---|---|---|---|---|
| All Adult Units | Aged | Disabled | Married-Couple Units | |
| 1993 | 62.0 | 57.0 | 71.0 | 37.0 |
| 1994 | 65.0 | 58.4 | 73.0 | 43.9 |
| 1995 | 69.1 | 64.9 | 74.0 | 52.2 |
| 1996 | 66.6 | 60.4 | 73.5 | 46.7 |
| 1997 | 71.1 | 62.7 | 79.4 | 49.1 |
| 1998 | 70.7 | 63.6 | 77.9 | 48.1 |
Notes: Participation rates estimated using the TRIM3 microsimulation model, which uses CPS data to simulate SSI eligibility for an average month, by calendar year. There have been small changes in estimating methodology over time, due to model improvements and revisions to the CPS. In particular, the model was revised in 1997 to more accurately exclude ineligible immigrants. Thus the increased participation rate in 1997 is partly due to a revision in estimating methodology. Also note that the figure for married-couple units is based on very small sample sizes–married couple units were only about 7.5 percent of the eligible adults units and 5.1 percent of the units receiving SSI in the average month of 1998.
Source: Unpublished data from the TRIM3 microsimulation model.
-
In contrast to the declining participation rates for the AFDC/TANF and Food Stamp programs, the participation rate for adult units in the SSI Program has been increasing, from 62 percent in 1993, to 71 percent in 1997 and 1998. Note, however, that some of the apparent growth between 1996 and 1997 may be due to a revision in estimating methodology, as noted above.
-
In 1998, as in past years, disabled adults in one-person units had a higher participation rate (78 percent) than both aged adults in one-person units (64 percent) and adults in married-couple units (48 percent).
Indicator 5: Multiple Program Receipt
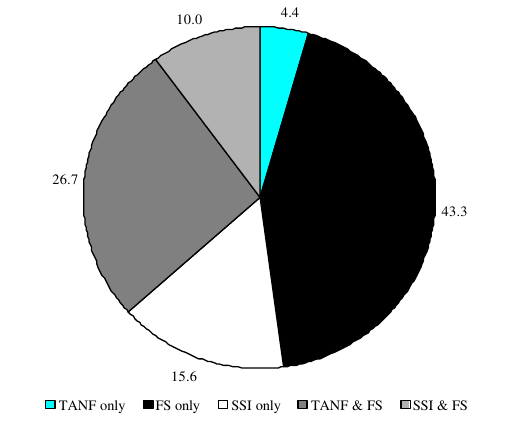
Figure IND 5. Percentage of Population Receiving Assistance from Multiple Programs (TANF, Food Stamps, & SSI), Among Those Receiving Assistance: 1998
Source: March CPS data, analyzed using the TRIM3 microsimulation model.
- Of the 9 percent of the population in families receiving TANF, food stamps, or SSI benefits in an average month in 1998, nearly two-thirds (63 percent) received assistance from only one program. Most of these received food stamps or SSI benefits only. Another pattern of benefit receipt, found in over one-fourth of those with any receipt, was TANF and food stamps.
-
Children are more likely than others to live in families receiving TANF and/or food stamps. For example, 8 percent of children under six lived in families receiving both TANF and food stamps in an average month in 1998, as shown in Table IND 5a.
-
The percentage of individuals receiving assistance from at least one program among AFDC/TANF, food stamps, and SSI in an average month decreased during the mid-to-late 1990s (from 13 percent in 1993 to 9 percent in 1998), as shown in Table IND 5b. The decline was most dramatic for those receiving a combination of AFDC/TANF and food stamps.
Table IND 5a. Percentage of Population Receiving Assistance from Multiple Programs (TANF, Food Stamps, SSI), by Race and Age: 1998
| Any Receipt | One Program Only | Two Programs | ||||
|---|---|---|---|---|---|---|
| TANF | FS | SSI | TANF & FS | FS & SSI | ||
| All Persons | 9.0 | 0.4 | 3.9 | 1.4 | 2.4 | 0.9 |
| Racial Categories | ||||||
| Non-Hispanic White | 5.7 | 0.2 | 2.4 | 0.9 | 1.4 | 0.7 |
| Non-Hispanic Black | 21.9 | 0.6 | 10.0 | 2.7 | 6.3 | 2.3 |
| Hispanic | 15.4 | 1.5 | 6.4 | 2.4 | 4.1 | 1.0 |
| Age Categories | ||||||
| Children Ages 0-5 | 17.9 | 1.2 | 7.9 | 0.7 | 7.6 | 0.5 |
| Children Ages 6-10 | 15.6 | 0.9 | 7.5 | 0.7 | 6.1 | 0.4 |
| Children Ages 11-15 | 12.8 | 0.7 | 5.4 | 0.9 | 5.2 | 0.6 |
| Women Ages 16-64 | 8.5 | 0.4 | 3.8 | 1.2 | 2.2 | 1.0 |
| Men Ages 16-64 | 5.2 | 0.2 | 2.5 | 1.2 | 0.6 | 0.7 |
| Adults Age 65 and over | 7.9 | 0.0 | 1.9 | 3.8 | 0.0 | 2.2 |
See below for notes and source.
Table IND 5b. Percentage of Population Receiving Assistance from Multiple Programs (AFDC/TANF, Food Stamps, SSI): 1993-1998
| Any Receipt | One Program Only | Two Programs | ||||
|---|---|---|---|---|---|---|
| AFDC/ TANF | FS | SSI | AFDC/TANF & FS | FS & SSI | ||
| 1993 | 12.6 | 0.6 | 5.2 | 1.1 | 4.8 | 1.0 |
| 1994 | 12.8 | 0.5 | 5.3 | 1.2 | 4.6 | 1.1 |
| 1995 | 12.3 | 0.4 | 5.0 | 1.2 | 4.5 | 1.1 |
| 1996 | 12.0 | 0.3 | 5.3 | 1.2 | 4.0 | 1.1 |
| 1997 | 10.2 | 0.4 | 4.3 | 1.3 | 3.1 | 1.0 |
| 1998 | 9.0 | 0.4 | 3.9 | 1.4 | 2.4 | 0.9 |
Note: Categories are mutually exclusive. SSI receipt based on individual receipt; AFDC and food stamp receipt based on full recipient unit. By definition, individuals may not receive both AFDC and SSI; hence, no individual receives benefits from all three programs. The percentage of individuals receiving assistance from any one program in an average month (shown here) is lower than the percentage residing in families receiving assistance over the course of a year (shown in Table SUM 1 in Chapter I and Table IND 1a in Chapter II). Differences between data presented in this report and the 2000 Indicators of Welfare Dependence report are discussed in Appendix D.
Source: March CPS data, analyzed using the TRIM3 microsimulation model.
Indicator 6: Dependence Transitions
Figure IND 6. Dependency Status in 1995 of Persons Who Received More than 50 Percent of Income from Means-Tested Assistance in 1994, by Race
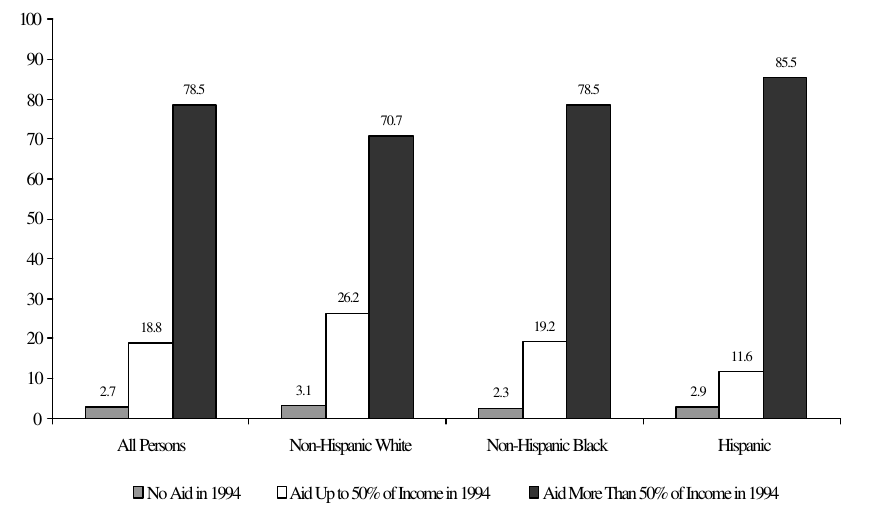
Source: Unpublished data from the SIPP, 1993 panel.
- Nearly four-fifths (79 percent) of all recipients who received more than 50 percent of their total income from means-tested assistance programs in 1994 also received more than 50 percent of their total income from these same programs in 1995.
-
Of recipients who received more than 50 percent of their total income from AFDC, food stamps and SSI in 1994, a larger percentage of non-Hispanic whites became “less dependent” in 1995 (received 50 percent or less of their total income from means-tested assistance programs) compared to Hispanics and non-Hispanic blacks.
-
As shown in Table IND 6, a slightly larger percentage of women who received more than half of their total income from means-tested assistance programs in 1994 remained “dependent” in 1995 compared to the same percentage for men (79 percent compared to 73 percent).
Table IND 6. Dependency Status in 1995 of Persons Who Received More than 50 Percent of Income from Means-Tested Assistance in 1994, by Race and Age
| Percentageof Persons Receiving | ||||
|---|---|---|---|---|
| Individuals Receiving more than 50% of Income from Assistance in 1994 | Total (000's) | No Aid in 1995 | Up to 50% in 1995 | Over 50% in 1995 |
| All Persons | 13,986 | 2.7 | 18.8 | 78.5 |
| Racial Categories | ||||
| Non-Hispanic White | 4,804 | 3.1 | 26.2 | 70.7 |
| Non-Hispanic Black | 4,710 | 2.3 | 19.2 | 78.5 |
| Hispanic | 3,418 | 2.9 | 11.6 | 85.5 |
| Age Categories | ||||
| Children Ages 0-5 | 3,185 | 2.0 | 18.6 | 79.4 |
| Children Ages 6-10 | 2,102 | 0.6 | 17.8 | 81.6 |
| Children Ages 11-15 | 1,724 | 1.6 | 19.5 | 78.9 |
| Men Ages 16-64 | 1,866 | 2.5 | 18.7 | 72.6 |
| Women Ages 16-64 | 4,472 | 7.1 | 20.4 | 78.8 |
| Adults Age 65 and over | 636 | 4.6 | 17.9 | 77.5 |
Note: Means-tested assistance is defined as AFDC, food stamps, and SSI. While only affecting a small number of cases, general assistance income is included within AFDC income. Individuals are defined as dependent if they reside in families with more than 50 percent of total annual family income from these means-tested programs. Because full calendar year data for 1995 were not available for all SIPP respondents, some transitions were based on twelve-month periods that did not correspond exactly to calendar years.
Source: Unpublished data from the SIPP, 1993 panel.
Indicator 7. Dependence Spell Duration
Figure IND 7. Percentage of AFDC Spells of Individuals in Families with No Labor Force Participants for Individuals Entering Programs During the 1993 SIPP Panel, by Length of Spell
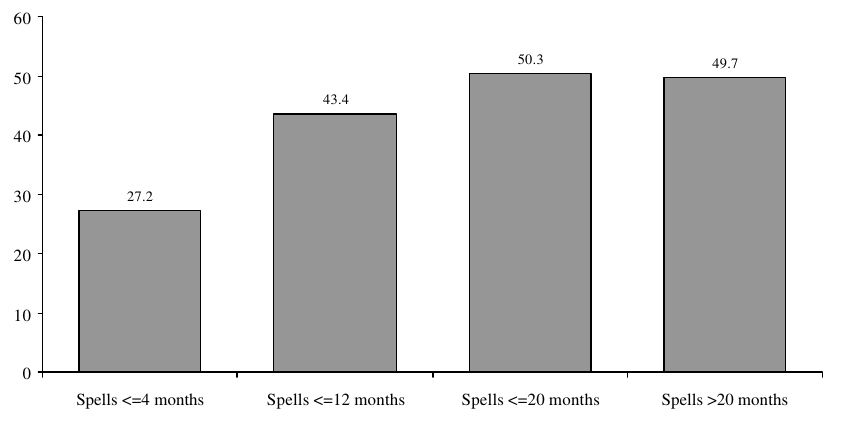
Source: Unpublished data from the SIPP, 1993 panel.
- Forty-three percent of AFDC spells for individuals in families with no one in the labor force ended within a year.
- Over one-quarter (27 percent) of AFDC spells for individuals in families where no one participated in the labor force lasted four months or less.
- As shown in Table IND 7, a smaller percentage of AFDC spells to children in families with no labor force participants ended in four months or less compared to their adult counterparts (25 percent compared to 31 percent).
- Spells shown in Figure IND 7 are limited to spells of recipients in families without any labor force participation. Spell lengths are shorter in Figure IND 8, which shows spells for all recipients, including those in families with labor force participants. For example, whereas only half (50 percent) of spells shown in Figure IND 7 end in 20 months or less, over two-thirds (69 percent) of all AFDC spells last 20 months or less, as shown in Figure IND 8.
Table IND 7. Percentage of AFDC Spells of Individuals in Families with No Labor Force Participants for Individuals Entering Programs During the 1993 SIPP Panel, by Lengthof Spell, Race, and Age
| Spells <=4 months | Spells <=12 months | Spells <=20 months | Spells >20 months | |
|---|---|---|---|---|
| All Persons | 27.2 | 43.4 | 50.3 | 49.7 |
| Racial Categories | ||||
| Non-Hispanic White | 30.2 | 40.7 | 43.0 | 57.0 |
| Non-Hispanic Black | 17.4 | 45.6 | N/A | N/A |
| Hispanic | 33.2 | N/A | N/A | N/A |
| Age Categories | ||||
| Children Ages 0-15 | 24.7 | 41.9 | 49.1 | 50.9 |
| Adults Ages 16-64 | 30.6 | 45.8 | 51.9 | 48.1 |
Note: Spell length categories are not mutually exclusive. Spells separated by only 1 month are not considered separate spells. Due to the length of the observation period, actual spell lengths for spells that lasted more than 20 months cannot be observed. AFDC spells are defined as those spells starting during the 1993 SIPP panel for individuals in families with no labor force participants. For certain racial categories, data are not available (N/A) due to insufficient sample size.
Source: Unpublished data from the SIPP, 1993 panel.
Indicator 8: Program Spell Duration
Figure IND 8. Percentage of AFDC, Food Stamp, and SSI Spells for Individuals Entering Programs During the 1993 SIPP Panel, by Length of Spell
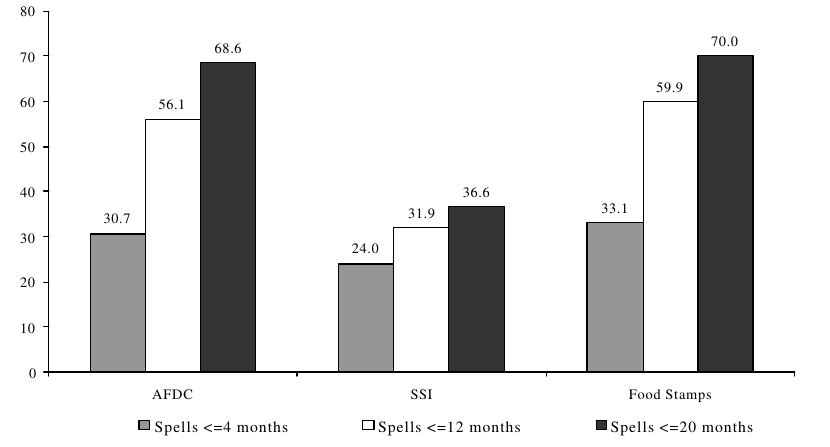
Source: Unpublished data from the SIPP, 1993 Panel.
- Short spells lasting 4 months or less accounted for 31 percent of AFDC spells, 24 percent of SSI spells, and 33 percent of food stamp spells.
- Over one-half of all AFDC and food stamp spells lasted one year or less (56 percent and 60 percent, respectively). In contrast, only 32 percent of SSI spells ended within one year. The percentage of SSI spells that lasted more than 20 months is twice the percentage of AFDC and food stamp spells that lasted this long (see Table IND 5).
- As shown in Table IND 8, for AFDC spells, a larger percentage of short spells (lasting 4 months or less) and a smaller percentage of long spells (lasting more than 20 months) occurred among non-Hispanic whites compared to non-Hispanic blacks and Hispanics.
- A larger percentage of AFDC and food stamp spells among adults ages 16 to 64 ended within 4 months compared to spells among children.
- Short spells are less common among recipients in families without labor force participants, as shown previously in Figure and Table IND 7.
Table IND 8. Percentage of AFDC, Food Stamp and SSI Spells for Individuals Entering Programs During the 1993 SIPP Panel, by Length of Spell, Race, and Age
| Spells <=4 months | Spells <=12 months | Spells <=20 months | Spells >20 months | ||
|---|---|---|---|---|---|
| AFDC | All Recipients | 30.7 | 56.1 | 68.6 | 31.4 |
| Racial Categories | |||||
| Non-Hispanic White | 35.6 | 62.2 | 72.3 | 27.7 | |
| Non-Hispanic Black | 24.6 | 52.3 | 66.7 | 33.3 | |
| Hispanic | 30.8 | 52.5 | 63.4 | 36.6 | |
| Age Categories | |||||
| Children Ages 0-15 | 28.1 | 53.6 | 65.6 | 34.4 | |
| Adults Ages 16-64 | 33.5 | 59.0 | 72.2 | 27.8 | |
| SSI | All Recipients | 24.0 | 31.9 | 36.6 | 63.4 |
| Racial Categories | |||||
| Non-Hispanic White | 27.2 | 34.6 | 40.8 | 59.2 | |
| Non-Hispanic Black | 20.5 | 26.2 | 30.0 | 70.0 | |
| Hispanic | 20.0 | 32.2 | NA | NA | |
| Age Categories | |||||
| Adults Ages 16-64 | 26.8 | 34.6 | 39.7 | 60.3 | |
| FOODSTAMPS | All Recipients | 33.1 | 59.9 | 70.0 | 30.0 |
| Racial Categories | |||||
| Non-Hispanic White | 34.3 | 62.1 | 71.5 | 28.5 | |
| Non-Hispanic Black | 28.4 | 53.4 | 64.9 | 35.1 | |
| Hispanic | 35.4 | 64.0 | 71.1 | 28.9 | |
| Age Categories | |||||
| Children Ages 0-15 | 29.8 | 56.5 | 67.0 | 33.0 | |
| Adults Ages 16-64 | 35.9 | 63.0 | 72.8 | 27.2 |
Note: Spell length categories are not mutually exclusive. Spells separated by only 1 month are not considered separate spells. Due to the length of the observation period, actual spell lengths for spells that lasted more than 20 months cannot be observed. AFDC spells are defined as those starting during the 1993 SIPP Panel. For certain age and racial categories, data are not available (N/A) because of insufficient sample size. Data on SSI recipiency for children are not available (N/A).
Source: Unpublished data from the SIPP, 1993 Panel.
Indicator 9. Long-term Dependency
Figure IND9. Percentage of AFDC Recipients with More than 50 Percent of Income from AFDC and Food Stamps Between 1982 and 1991, by Years of Dependency
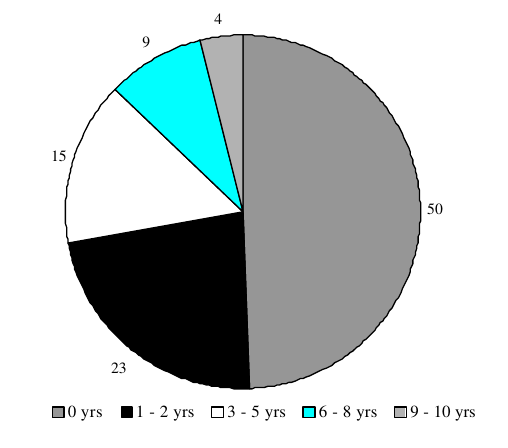
Source: Unpublished data from the PSID, 1983-1992.
- Half of all recipients in 1982 were not dependent on welfare in any year over the following decade. Specifically, in they did not receive more than 50 percent of their income from AFDC and food stamps in any year between 1982 and 1991(SSI receipt is excepted). This was also true for 55 percent of all recipients a decade earlier, as shown in the lower half of Table IND 9.
- About 13 percent of recipients in 1982 were “dependent” (received more than 50 percent of annual income from AFDC and food stamps) for more than five years over the following decade. In addition, 15 percent were dependent for three to five years, and 23 percent were dependent for one or two years.
- Only 34 percent of young child recipients in 1982 were not dependent in any year between 1982 and 1991, as shown in Table IND 9. A slightly higher percentage (39 percent) of child recipients had no years of dependency in the earlier decade. The percentage of young black children who were not dependent increased across the two time periods (from 24 percent to 31 percent). In comparison, the percentage of non-black recipient children who were not dependent on public assistance decreased substantially across the two time periods (from 50 percent to 37 percent).
Table IND 9. Percentage of AFDC Recipients with More than 50 Percent of Income from AFDC and Food Stamps Across Two Ten-Year Time Periods, by Years of Dependency, Race, and Age
| Between 1982 and 1991: | |||
| All Recipients | |||
| All Recipients | Black | Non-Black | |
| 0 Years | 50 | 43 | 54 |
| 1 - 2 Years | 23 | 21 | 25 |
| 3 - 5 Years | 15 | 17 | 14 |
| 6 - 8 Years | 9 | 12 | 6 |
| 9 - 10 Years | 4 | 7 | 2 |
| Children 0 - 5 in 1982 | |||
| All Child Recipients | Black Children | Non-Black Children | |
| 0 Years | 34 | 31 | 37 |
| 1 - 2 Years | 28 | 19 | 35 |
| 3 - 5 Years | 16 | 18 | 15 |
| 6 - 8 Years | 13 | 19 | 9 |
| 9 - 10 Years | 8 | 14 | 4 |
| Between 1972 and 1981: | |||
| All Recipients | |||
| All Recipients | Black | Non-Black | |
| 0 Years | 55 | 44 | 62 |
| 1 - 2 Years | 22 | 22 | 22 |
| 3 - 5 Years | 14 | 19 | 11 |
| 6 - 8 Years | 5 | 9 | 3 |
| 9 - 10 Years | 4 | 7 | 2 |
| Children 0 - 5 in 1972 | |||
| All Child Recipients | Black Children | Non-Black Children | |
| 0 Years | 39 | 24 | 50 |
| 1 - 2 Years | 25 | 27 | 23 |
| 3 - 5 Years | 21 | 27 | 17 |
| 6 - 8 Years | 6 | 9 | 4 |
| 9 - 10 Years | 9 | 12 | 6 |
Note: The base for the percentages is recipients in a one-year time period, defined as individuals receiving at least $1 of AFDC in the first year (1982 or 1972). Child recipients are defined by age in the first year. This measures years of dependency over the specified ten-year time periods, and does not take into account years of dependency that may have occurred before the initial year (1982 or 1972).
Source: Unpublished data from the PSID, 1973-1992.
Indicator 10: Long-term Receipt
Figure IND 10. Percentage of AFDC Recipients in 1982, by Years of Receipt Between 1982 and 1991
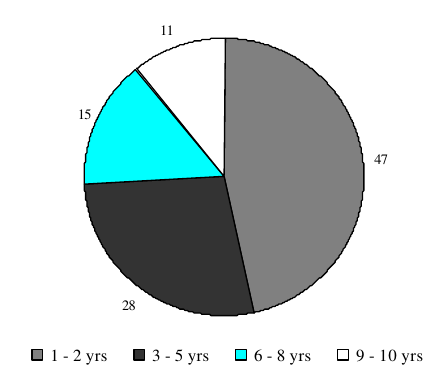
Source: Unpublished data from the PSID, 1983-1992.
- Among all AFDC recipients in 1982, almost half (47 percent) received assistance for only one or two years between 1982 and 1991. Over one quarter (28 percent) received AFDC and/or food stamps for 3 to 5 years, and about one quarter (26 percent) received AFDC for more than 5 years. Similar patterns were evident for recipients in 1972, as can be seen in the lower half of Table IND 10.
- As shown in Table IND 10, compared to non-black recipients, a smaller percentage of black recipients received AFDC for only 1 to 2 years while a larger percentage received benefits for more than 5 years in both ten-year time periods.
- A smaller percentage of child recipients experienced short-term receipt and a larger percentage experienced longer-term receipt in both time periods relative to the percentages for all recipients.
- Whereas over half (53 percent) of recipients received at least some AFDC for three or more years between 1982 and 1991 (as shown in Figure IND 10), only 28 percent of recipients received more than 50 percent of their income from AFDC and food stamps for three or more years over the same time period (as previously shown in Figure IND 9).
Table IND 10. Percentage of AFDC Recipients Across Two Ten-Year Time Periods, by Years of Receipt, Race, and Age
| Between 1982 and 1991: | |||
| All Recipients | |||
| All Recipients | Black | Non-Black | |
| 1 - 2 Years | 47 | 37 | 53 |
| 3 - 5 Years | 28 | 27 | 28 |
| 6 - 8 Years | 15 | 19 | 12 |
| 9 - 10 Years | 11 | 17 | 6 |
| Children 0 - 5 in 1982 | |||
| All Child Recipients | Black Children | Non-Black Children | |
| 1 - 2 Years | 34 | 28 | 39 |
| 3 - 5 Years | 29 | 28 | 30 |
| 6 - 8 Years | 17 | 16 | 19 |
| 9 - 10 Years | 20 | 29 | 13 |
| Between 1972 and 1981: | |||
| All Recipients | |||
| All Recipients | Black | Non-Black | |
| 1 - 2 Years | 49 | 32 | 59 |
| 3 - 5 Years | 28 | 34 | 25 |
| 6 - 8 Years | 13 | 19 | 9 |
| 9 - 10 Years | 11 | 15 | 8 |
| Children 0 - 5 in 1972 | |||
| All Child Recipients | Black Children | Non-Black Children | |
| 1 - 2 Years | 37 | 24 | 46 |
| 3 - 5 Years | 29 | 31 | 27 |
| 6 - 8 Years | 15 | 23 | 10 |
| 9 - 10 Years | 19 | 23 | 17 |
Note: The base for percentages is recipients in a one-year time period, defined as individuals receiving at least $1 of AFDC in the first year (1982 or 1972). Child recipients are defined by age in the first year. This measures years of receipt over the specified ten-year time periods, and does not take into account years of receipt that may have occurred before the initial year (1972 or 1982).
Source: Unpublished data from the PSID, 1973-1992.
Indicator 11: Events Associated with the Beginning and Ending of Program Spells
Table IND 11a. Percentage of First AFDC Spell Beginnings Associated with Specific Events: Selected Periods
|
Spell Began |
Spell Began |
Spell Began |
|
|---|---|---|---|
| First birth to an unmarried, non-cohabiting mother |
27.9 |
20.9 |
22.2 |
| First birth to a married and/or cohabiting mother |
13.3 |
17.4 |
11.3 |
| Second (or higher order) birth |
19.9 |
18.2 |
15.2 |
| Divorce/separation |
19.7 |
28.1 |
17.3 |
| Mother's work hours decreased by >500 hours per year |
26.3 |
18.8 |
26.2 |
| Other adults' work hours decreased by >500 hours, but no change in family structure |
34.8 |
27.9 |
21.6 |
| Other adults' work hours decreased by >500 hours, and a change in family structure |
4.7 |
7.9 |
11.4 |
| Householder acquired work limitation |
18.1 |
15.6 |
23.5 |
| Other transfer income dropped by >$1,000 (in 1996$) |
4.5 |
6.5 |
4.1 |
| Changed state of residence | 4.5 | 10.6 | 5.4 |
Note: Events are defined to be neither mutually exclusive nor exhaustive. Work limitation is defined as a self-reported physical or nervous condition that limits the type of work or the amount of work the respondent can do.
Source: Unpublished data from the PSID, 1974–1992.
- Between 1986 and 1991, the most common events associated with the beginnings of a first AFDC spell were work-related: a decrease in mother’s work hours (26 percent), a decrease in work hours of another adult (22 percent), and acquisition of a work limitation (24 percent).
-
The percentage of first AFDC episode beginnings associated with a householder acquiring a work limitation was higher for spells that began between 1986 and 1991 (24 percent) than for spells that began between 1973 and 1979 (16 percent) or 1980 to 1985 (18 percent).
-
Between 1973 and 1979, first births to an unmarried, non-cohabiting mother were associated with 28 percent of first AFDC episodes. In contrast, such births were associated with 21 percent of first spells beginning between 1980 and 1985, and 22 percent of spells beginning between 1986 and 1991.
Table IND 11b. Percentage of First AFDC Spell Endings Associated with Specific Events: Selected Periods
|
Spell Ended |
Spell Ended |
Spell Ended |
|
|---|---|---|---|
| Mother married or acquired cohabitor |
16.1 |
17.1 |
21.7 |
| Children under 18 no longer present |
4.4 |
4.1 |
4.8 |
| Mother's work hours increased by more than 500 hours per year |
15.4 |
25.0 |
27.1 |
| Other adults' work hours increased by more than 500 hours, but no change in family structure |
21.8 |
16.8 |
16.7 |
| Other adults' work hours increased by more than 500 hours, and a change in family structure |
6.5 |
10.3 |
5.8 |
| Householder no longer reports work limitation |
13.0 |
19.2 |
15.8 |
| Other transfer income increased by $1,000 or more (in 1996$) |
5.0 |
5.5 |
5.8 |
| Changed state of residence |
5.9 |
11.0 |
5.9 |
Note: Events are defined to be neither mutually exclusive nor exhaustive. Work limitation is defined as a self-reported physical or nervous condition that limits the type of work or the amount of work the respondent can do.
Source: Unpublished data from the PSID, 1974-1992.
- During the 1986 to 1991 time period, over one-fourth (27 percent) of first AFDC spell endings were associated with increases in mother’s work hours. The corresponding percentage was smaller for spells ending between 1973 and 1979 (15 percent).
-
In the period between 1973 and 1979, a greater percentage of spell endings was associated with an increase in work hours for other adults (22 percent) as compared to mothers (15 percent). In the more recent time period (1986 to 1991), a greater percentage of spell endings was associated with an increase in mother’s work hours (27 percent) compared to other adults (17 percent).
Chapter III: Predictors and Risk Factors Associated with Welfare Receipt
The Welfare Indicators Act challenges the Department of Health and Human Services to identify and set forth not only indicators of welfare dependence and welfare duration, but also predictors and causes of welfare receipt. Up to this point, welfare research has not established clear and definitive causes of welfare dependence. However, research has identified a number of risk factors associated with welfare utilization. For purposes of this report, the terms “predictors” and “risk factors” are used somewhat interchangeably.
Where the Advisory Board established under the Welfare Indicators Act recommended narrowing the focus of dependence indicators, it recommended an expansive view toward predictors and risk factors. The range of possible predictors is extremely wide, and until they are measured and analyzed over time as the PRWORA changes continue to be implemented, their value will not be fully known. Some of the “predictors” included in this chapter may turn out to be simply correlates of welfare receipt, some may have a causal relationship, some may be consequences, and some may have predictive value.
For purposes of this report, the predictors/risk factors included in this chapter are grouped into three categories: economic security risk factors, employment-related risk factors, and risk factors associated with non-marital childbearing.
Economic Security Risk Factors (ECON). The first group includes nine measures associated with economic security. This group encompasses six measures of poverty, as well as measures of child support receipt, food insecurity, and lack of health insurance. The tables and figures illustrating measures of economic security are labeled with the prefix ECON throughout this chapter.
Poverty measures are important predictors of dependence, because families with fewer economic resources are more likely to be dependent on means-tested assistance. In addition, poverty and other measures of deprivation, such as food insecurity, are important to assess in conjunction with the measures of dependence outlined in Chapter II.
Reductions in caseloads and dependence can reduce poverty, to the extent that such reductions are associated with greater work activity and higher economic resources for former welfare families. However, reductions in welfare caseloads can increase poverty and other deprivation measures, to the extent that former welfare families are left with fewer economic resources.
Several aspects of poverty are examined in this chapter. Those that can be updated annually using the Current Population Survey include: overall poverty rates (ECON 1); the percentage of individuals in deep poverty (ECON 2), and poverty rates using alternative definitions of income (ECON 3 and 4). The chapter also includes data on the length of poverty episodes or spells (ECON 5); and the cumulative time spent in poverty over a decade (ECON 6).
This chapter also includes data on child support payments (ECON 7), which can play an important role in reducing dependence on government assistance and thus serve as a predictor of dependence. Household food insecurity (ECON 8) is an important measure of deprivation that, although correlated with general income poverty, provides an alternative measure of tracking the incidence of material hardship and need, and how it may change over time. Finally, health insurance (ECON 9) is both tied to the income level of the family, and may be a precursor to future health problems among both adults and children.
Employment and Work-Related Risk Factors (WORK). The second grouping, labeled with the WORK prefix, includes nine factors related to employment and barriers to employment. These measures include data on overall labor force attachment and the employment and earnings for low-skilled workers, as well as data on barriers to work. The latter category includes incidence of adult disabilities and children with chronic health conditions, adult substance abuse, levels of educational attainment and school drop-out rates, and child care costs.
Employment and earnings provide many families with an escape from dependence. It is important, therefore, to look both at overall labor force attachment (WORK 1), and at employment and earnings levels for those with low education levels (WORK 2 and WORK 3). The economic condition of the low-skill labor market is a key predictor of the ability of young adult men and women to support families without receiving means-tested assistance.
The next two measures in this group (WORK 4 and WORK 5) focus on educational attainment. Individuals with less than a high school education have the lowest amount of human capital and are at the greatest risk of becoming poor, despite their work effort.
Measures of barriers to employment provide indicators of potential work limitations, which may be predictors of greater dependence. Substance abuse (WORK 6), disabling conditions (WORK 7), and chronic child health conditions (WORK 8) all have the potential of limiting the ability of the adults in the household to work. In addition, debilitating health conditions and high medical expenditures can place a strain on a family’s economic resources. High child care costs (WORK 9) are both a potential barrier to work and an additional strain on family finances.
Non-Marital Birth Risk Factors (BIRTH). The final group of risk factors addresses out-of-wedlock childbearing. The tables and figures in this subsection are labeled with the BIRTH prefix. This category includes long-term time trends in births to unmarried women (BIRTH 1), births to unmarried teens (BIRTH 2 and BIRTH 3), and children living in families with never-married parents (BIRTH 4). Children living in families with never-married mothers are at high risk of dependence, and it is therefore important to track changes in the size of this vulnerable population.
As noted above, the predictors/risk factors included in this chapter do not represent an exhaustive list of measures. They are merely a sampling of available data that address in some way the question of how a family is faring on the scale of deprivation and well-being. Such questions are a necessary part of the dependence discussion as researchers assess the effects of the major changes that have occurred in the laws governing public assistance programs.
Economic Security Risk Factors
Economic Security Risk Factor 1. Poverty Rates
Figure ECON 1. Percentage of Persons in Poverty, by Age: 1959-1999
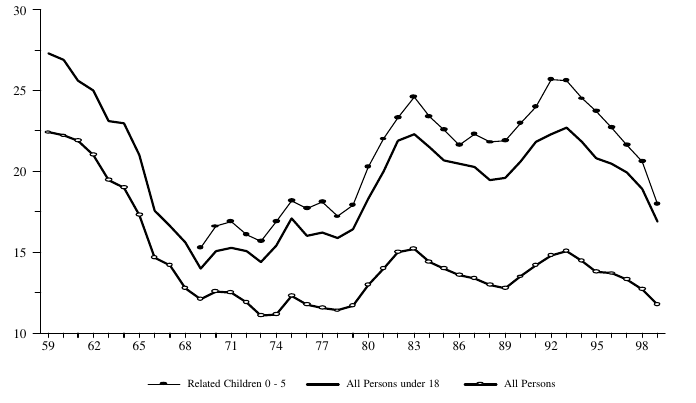
Source: U.S. Bureau of the Census, “Poverty in the United States: 1999,” Current Population Reports, Series P60-210 and data published online at http://www.census.gov/hhes/www/poverty.html.
- The percentage of persons living in poverty has continued to decline since 1993, when the poverty rate for all persons was at a ten-year high of just over 15 percent. In 1999, the overall poverty rate was just under 12 percent, the lowest level since 1979.
-
While the poverty rate for children has declined along with the overall rate in the past several years, children, particularly young children, continue to have higher poverty rates than the overall population. For example, in 1999, the poverty rate for related children ages 0 to 5 was 18 percent, compared to 12 percent for the overall population.
-
The poverty rate for blacks declined nearly 10 percentage points between 1992 and 1999, from 33 percent to less than 24 percent, as shown in Table ECON 1. The gap between black and white poverty rates was at an historic low of 14 percentage points; the gap has narrowed by a third since the early 1990s, when it exceeded 21 percentage points. The poverty rate among Hispanics reached 23 percent in 1999, the lowest level since 1979.
- The poverty rate for the elderly (persons ages 65 and over) reached an historic low of less than 10 percent in 1999. This was a lower poverty rate than the rate both for children under 18 (17 percent) and adults ages 18-64 (10 percent).
Table ECON 1. Percentage of Persons in Poverty, by Race and Age: Selected Years
| Related Children | All Persons | ||||||||
|---|---|---|---|---|---|---|---|---|---|
| Ages 0-5 | Ages 6-17 | Total | Under 18 | 18 to 64 | 65 & over | White | Black | Hispanic Origin | |
| 1959 |
N/A |
N/A |
22.4 |
27.3 |
17.0 |
35.2 |
18.1 |
55.1 |
N/A |
| 1963 |
N/A |
N/A |
19.5 |
23.1 |
N/A |
N/A |
15.3 |
N/A |
N/A |
| 1966 |
N/A |
N/A |
14.7 |
17.6 |
10.5 |
28.5 |
11.3 |
41.8 |
N/A |
|
1969 |
15.3 |
13.1 |
12.1 |
14.0 |
8.7 |
25.3 |
9.5 |
32.2 |
N/A |
| 1973 |
15.7 |
13.6 |
11.1 |
14.4 |
8.3 |
16.3 |
8.4 |
31.4 |
21.9 |
| 1976 | 17.7 |
15.1 |
11.8 |
16.0 |
9.0 |
15.0 |
9.1 |
31.1 |
24.7 |
|
1979 |
17.9 |
15.1 |
11.7 |
16.4 |
8.9 |
15.2 |
9.0 |
31.0 |
21.8 |
| 1980 |
20.3 |
16.8 |
13.0 |
18.3 |
10.1 |
15.7 |
10.2 |
32.5 |
25.7 |
| 1981 |
22.0 |
18.4 |
14.0 |
20.0 |
11.1 |
15.3 |
11.1 |
34.2 |
26.5 |
|
1982 |
23.3 |
20.4 |
15.0 |
21.9 |
12.0 |
14.6 |
12.0 |
35.6 |
29.9 |
| 1983 |
24.6 |
20.4 |
15.2 |
22.3 |
12.4 |
13.8 |
12.1 |
35.7 |
28.0 |
| 1984 |
23.4 |
19.7 |
14.4 |
21.5 |
11.7 |
12.4 |
11.5 |
33.8 |
28.4 |
|
1985 |
22.6 |
18.8 |
14.0 |
20.7 |
11.3 |
12.6 |
11.4 |
31.3 |
29.0 |
| 1986 |
21.6 |
18.8 |
13.6 |
20.5 |
10.8 |
12.4 |
11.0 |
31.1 |
27.3 |
| 1987 |
22.3 |
18.9 |
13.4 |
20.3 |
10.6 |
12.5 |
10.4 |
32.4 |
28.0 |
|
1988 |
21.8 |
17.5 |
13.0 |
19.5 |
10.5 |
12.0 |
10.1 |
31.3 |
26.7 |
| 1989 |
21.9 |
17.4 |
12.8 |
19.6 |
10.2 |
11.4 |
10.0 |
30.7 |
26.2 |
| 1990 |
23.0 |
18.2 |
13.5 |
20.6 |
10.7 |
12.2 |
10.7 |
31.9 |
28.1 |
|
1991 |
24.0 |
19.5 |
14.2 |
21.8 |
11.4 |
12.4 |
11.3 |
32.7 |
28.7 |
| 1992 |
25.7 |
19.4 |
14.8 |
22.3 |
11.9 |
12.9 |
11.9 |
33.4 |
29.6 |
| 1993 |
25.6 |
20.0 |
15.1 |
22.7 |
12.4 |
12.2 |
12.2 |
33.1 |
30.6 |
|
1994 |
24.5 |
19.5 |
14.5 |
21.8 |
11.9 |
11.7 |
11.7 |
30.6 |
30.7 |
| 1995 |
23.7 |
18.3 |
13.8 |
20.8 |
11.4 |
10.5 |
11.2 |
29.3 |
30.3 |
| 1996 |
22.7 |
18.3 |
13.7 |
20.5 |
11.4 |
10.8 |
11.2 |
28.4 |
29.4 |
|
1997 |
21.6 |
18.0 |
13.3 |
19.9 |
10.9 |
10.5 |
11.0 |
26.5 |
27.1 |
| 1998 |
20.6 |
17.1 |
12.7 |
18.9 |
10.5 |
10.5 |
10.5 |
26.1 |
25.6 |
| 1999 |
18.0 |
15.5 |
11.8 |
16.9 |
10.0 |
9.7 |
9.8 |
23.6 |
22.8 |
Notes: Persons of Hispanic origin may be of any race. All persons under 18 include related children (own children, including stepchildren and adopted children, plus all other children in the household who are related to the householder by birth, marriage, or adoption), unrelated individuals under 18 (persons who are not living with any relatives), and householders or spouses under age 18.
Source: U.S. Bureau of the Census, “Poverty in the United States: 1999,” Current Population Reports, Series P60-210 and data published online at http://www.census.gov/hhes/www/poverty.html.
Economic Security Risk Factor 2. Deep Poverty Rates
Figure ECON 2. Percentage of Total Population Below 50 and 100 Percent of Poverty Level: 1975-1999
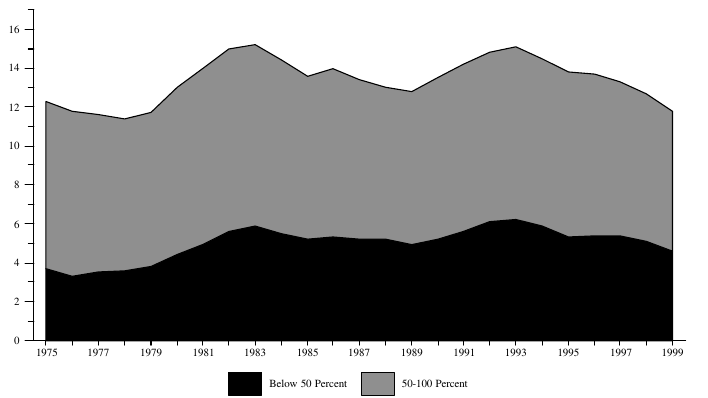
Source: U.S. Bureau of the Census, “Poverty in the United States: 1999,” Current Population Reports, Series P60-210 and unpublished tables available online at http://www.census.gov/hhes/www/poverty.html.
-
Between 1993 and 1999, the percentage of the population in “deep poverty” (with incomes below 50 percent of the federal poverty level), decreased by more than a quarter (from over 6 percent in 1993 to less than 5 percent in 1999).
-
In general, the percentage of the population with incomes below 50 percent of the poverty threshold has followed a pattern that reflects the trend in the overall poverty rate, as shown in figure ECON 2. The percentage of people below 50 percent of poverty rose in the late 1970s and early 1980s, then, after falling slightly, rose to a second peak in 1993. The overall poverty rate followed a somewhat similar pattern, with more pronounced peaks and valleys.
-
Over the past two decades, there has been an overall increase in the proportion of the poverty population in deep poverty. From a low of 28 percent of the poverty population in 1976, this population rose to nearly 41 percent by 1992. In 1999, 39 percent of poor persons had incomes that fell below 50 percent of the poverty level.
- Not only the poverty rate, but also the total number of poor people fell in 1999, as shown in Table ECON 2. While the overall U.S. population increased by nearly 100 million people between 1959 and 1999, there were actually 7 million fewer people in poverty in 1999 than forty years prior.
Table ECON 2. Number and Percentage of Total Population Below 50, 75, 100, and 125 Percent of Poverty Level: Selected Years
| Below 50 percent | Below 75 percent | Below 100 percent | Below 125 percent | ||||||
|---|---|---|---|---|---|---|---|---|---|
| Number In 000’s | Total Population | Number | Percent | Number | Percent | Number | Percent | Number | Percent |
| 1959 | 176,600 | N/A | N/A | N/A | N/A | 39,500 | 22.4 | 54,900 | 31.1 |
| 1961 | 181,300 | N/A | N/A | N/A | N/A | 39,600 | 21.9 | 54,300 | 30.0 |
| 1963 | 187,300 | N/A | N/A | N/A | N/A | 36,400 | 19.5 | 50,800 | 27.1 |
| 1965 | 191,400 | N/A | N/A | N/A | N/A | 33,200 | 17.3 | 46,200 | 24.1 |
| 1967 | 195,700 | N/A | N/A | N/A | N/A | 27,800 | 14.2 | 39,200 | 20.0 |
| 1969 | 199,500 | 9,600 | 4.8 | 16,400 | 8.2 | 24,100 | 12.1 | 34,700 | 17.4 |
| 1971 | 204,600 | N/A | N/A | N/A | N/A | 25,600 | 12.5 | 36,500 | 17.8 |
| 1973 | 208,500 | N/A | N/A | N/A | N/A | 23,000 | 11.1 | 32,800 | 15.8 |
| 1975 | 210,900 | 7,700 | 3.7 | 15,400 | 7.3 | 25,900 | 12.3 | 37,100 | 17.6 |
| 1976 | 212,300 | 7,000 | 3.3 | 14,900 | 7.0 | 25,000 | 11.8 | 35,500 | 16.7 |
| 1977 | 213,900 | 7,500 | 3.5 | 15,000 | 7.0 | 24,700 | 11.6 | 35,700 | 16.7 |
| 1978 | 215,700 | 7,700 | 3.6 | 14,900 | 6.9 | 24,500 | 11.4 | 34,100 | 15.8 |
| 1979 | 222,900 | 8,600 | 3.8 | 16,300 | 7.3 | 26,100 | 11.7 | 36,600 | 16.4 |
| 1980 | 225,000 | 9,800 | 4.4 | 18,700 | 8.3 | 29,300 | 13.0 | 40,700 | 18.1 |
| 1981 | 227,200 | 11,200 | 4.9 | 20,700 | 9.1 | 31,800 | 14.0 | 43,800 | 19.3 |
| 1982 | 229,400 | 12,800 | 5.6 | 23,200 | 10.1 | 34,400 | 15.0 | 46,600 | 20.3 |
| 1983 | 231,700 | 13,600 | 5.9 | 23,600 | 10.2 | 35,300 | 15.2 | 47,000 | 20.3 |
| 1984 | 233,800 | 12,800 | 5.5 | 22,700 | 9.7 | 33,700 | 14.4 | 45,400 | 19.4 |
| 1985 | 236,600 | 12,400 | 5.2 | 22,200 | 9.4 | 33,100 | 13.6 | 44,200 | 18.7 |
| 1986 | 238,600 | 12,700 | 5.3 | 22,400 | 9.4 | 32,400 | 14.0 | 44,600 | 18.7 |
| 1987 | 241,000 | 12,500 | 5.2 | 21,700 | 9.0 | 32,200 | 13.4 | 43,100 | 17.9 |
| 1988 | 243,500 | 12,700 | 5.2 | 21,400 | 8.8 | 31,700 | 13.0 | 42,600 | 17.5 |
| 1989 | 246,000 | 12,000 | 4.9 | 20,700 | 8.4 | 31,500 | 12.8 | 42,600 | 17.3 |
| 1990 | 248,600 | 12,900 | 5.2 | 22,600 | 9.1 | 33,600 | 13.5 | 44,800 | 18.0 |
| 1991 | 251,200 | 14,100 | 5.6 | 24,400 | 9.7 | 35,700 | 14.2 | 47,500 | 18.9 |
| 1992 | 256,500 | 15,500 | 6.1 | 26,200 | 10.2 | 38,000 | 14.8 | 50,500 | 19.7 |
| 1993 | 259,300 | 16,000 | 6.2 | 27,200 | 10.5 | 39,300 | 15.1 | 51,900 | 20.0 |
| 1994 | 261,600 | 15,400 | 5.9 | 26,400 | 10.1 | 38,100 | 14.5 | 50,500 | 19.3 |
| 1995 | 263,700 | 13,900 | 5.3 | 24,500 | 9.3 | 36,400 | 13.8 | 48,800 | 18.5 |
| 1996 | 266,200 | 14,400 | 5.4 | 24,800 | 9.3 | 36,500 | 13.7 | 49,300 | 18.5 |
| 1997 | 268,500 | 14,600 | 5.4 | 24,200 | 9.0 | 35,600 | 13.3 | 47,800 | 17.8 |
| 1998 | 271,100 | 13,900 | 5.1 | 23,000 | 8.5 | 34,500 | 12.7 | 46,000 | 17.0 |
| 1999 | 273,500 | 12,700 | 4.6 | 21,600 | 7.9 | 32,300 | 11.8 | 44,300 | 16.2 |
Note: The number of persons below 50 percent and 75 percent of poverty for 1969 are estimated based on the distribution of persons below 50 percent and 75 percent for 1969 taken from the 1970 decennial census.
Source: U.S. Bureau of the Census, “Poverty in the United States: 1999,” Current Population Reports, Series P60-210, unpublished tables available online at http://www.census.gov/hhes/www/poverty.html, and 1970 Census of Population, Volume 1, Social and Economic Characteristics, Table 259.
Economic Security Risk Factor 3. Alternative Poverty Measures
Figure ECON 3. Percentage of Persons in Poverty Using Official and Alternative Poverty Measure: 1990-1999
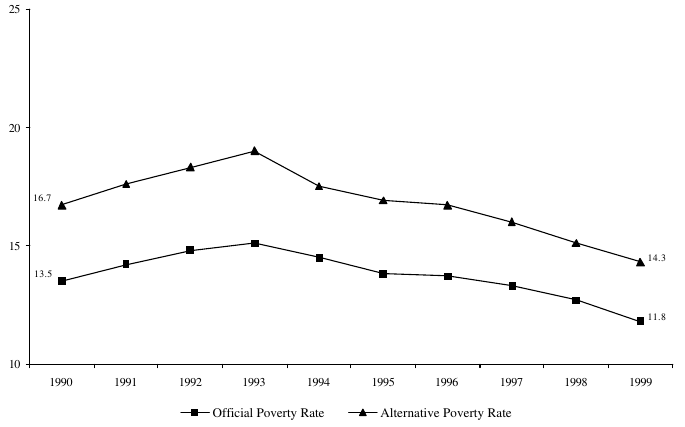
Source: Census Bureau tabulations of March CPS data.
-
An alternative measure of poverty yields a poverty rate that is consistently higher than the official poverty rate, but that follows a similar pattern over time. The “DES-U” measure shown here is one of several developed by the Census Bureau to implement changes recommended by a panel from the National Academy of Sciences. These changes include counting non-cash benefits as income, subtracting from income certain work-related, health and child care expenses, and adjusting poverty thresholds for family size and geographic differences in housing costs (see note, Table ECON 3).
-
The percentage of children in poverty has steadily dropped since 1993, under both the “DES-U” alternative poverty measure (as shown in Table ECON 3) and the official poverty measure (as shown in Table ECON 1).
-
The alternative poverty rate used here suggests a significantly higher poverty rate among the elderly (adults ages 65 and over) than the official poverty rate. The official percentage of elderly adults in poverty in 1999 was under 10 percent, close to that of non-elderly adults (see Table ECON 1), while the alternative poverty measure resulted in a rate of poverty among elderly adults of 17 percent, almost as high as that for children.
Table ECON 3. Percentage of Persons in Poverty Using Alternative Poverty Measure, by Race and Age: 1990-1999
| Total | All Persons | White | Black | Hispanic Origin | |||
|---|---|---|---|---|---|---|---|
| Ages 0-17 | Ages 18-64 | Age 65 and Over | |||||
| 1990 | 16.7 | 22.8 | 13.8 | 18.1 | 14.2 | 32.6 | 36.4 |
| 1991 | 17.6 | 24.2 | 14.5 | 18.9 | 14.9 | 34.2 | 37.9 |
| 1992 | 18.3 | 24.8 | 15.2 | 20.3 | 15.5 | 35.4 | 38.2 |
| 1993 | 19.0 | 25.4 | 16.0 | 20.7 | 16.2 | 35.7 | 39.1 |
| 1994 | 17.5 | 23.1 | 14.7 | 19.4 | 15.1 | 30.7 | 36.9 |
| 1995 | 16.9 | 22.1 | 14.3 | 18.5 | 14.5 | 30.6 | 36.2 |
| 1996 | 16.7 | 21.6 | 14.1 | 19.0 | 14.5 | 29.8 | 35.0 |
| 1997 | 16.0 | 20.7 | 13.6 | 18.4 | 14.0 | 28.1 | 32.5 |
| 1998 | 15.1 | 19.6 | 12.8 | 16.9 | 13.1 | 26.8 | 30.8 |
| 1999 | 14.3 | 17.9 | 12.4 | 16.5 | 12.5 | 24.8 | 27.6 |
Note: Persons of Hispanic origin may be of any race. The alternative poverty measure used is the Different Equivalence Scale, unstandardized, or DES-U. Like several other measures developed by the Census Bureau to implement recommendations in a 1995 National Academy of Sciences (NAS) report, this measure counts noncash benefits as income, subtracts from income certain work-related, health and child care expenses, and adjusts poverty thresholds for family size and geographic differences in housing. It is distinguished by using a different equivalence scale to adjust for changes in expenses as family size increases. Specifically, it adds a third parameter to the NAS measure that allows the first child in a single-adult family to represent a greater increase in expenses than the first child in a two-adult family. This version of the DES has not been “standardized,” that is, the overall poverty rate has not been adjusted to match the overall rate under the official measure for any particular year. Data for the above populations using the official poverty measure may be found in Table ECON 1.
Source: Census Bureau tabulations of March CPS data.
Economic Security Risk Factor 4. Poverty Rates with Various Means-tested Benefits Included
Figure ECON 4. Percentage of Total Population in Poverty with Various Means-Tested Benefits Added to Total Cash Income: 1979-1999
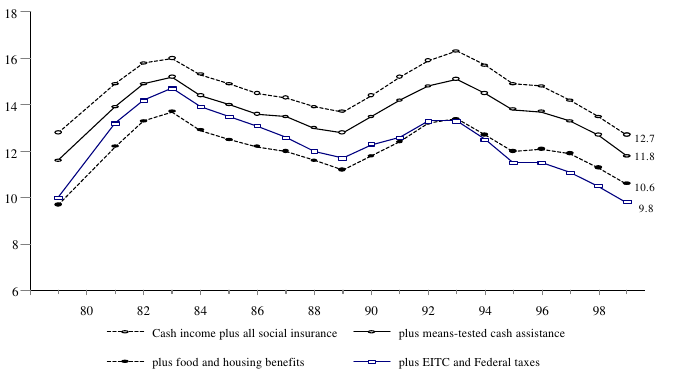
Source: Congressional Budget Office tabulations of March CPS data. Additional calculations by DHHS.
-
Benefits from means-tested assistance programs remove some people from poverty. The official definition of poverty – which includes means-tested cash assistance (primarily TANF and SSI) in addition to cash income and social insurance – was 11.8 percent in 1999, as shown in the bold line in Figure ECON 4. Without cash welfare, the 1999 poverty rate would be one percentage point higher, or 12.7 percent, as shown by the top line in the figure above.
-
Adding other, non-cash, public assistance benefits to this definition has the effect of lowering the percentage of people who have incomes below the official poverty rate. Adding in the value of food and housing benefits reduces the poverty rate to 10.6 percent in 1999.
-
When income is defined as including benefits from the Earned Income Tax Credit (EITC) and federal taxes, the percentage of the total population in poverty decreases to 9.8 percent in 1999. Taxes have had a net effect of reducing poverty rates since the significant increases in the size of the EITC in 1993 and 1995.
Table ECON 4. Percentage of Total Population in Poverty with Various Means-Tested Benefits Added to Total Cash Income: Selected Years
| 1979 | 1983 | 1986 | 1989 | 1993 | 1995 | 1996 | 1998 | 1999 | |
|---|---|---|---|---|---|---|---|---|---|
| Cash Income Plus All Social Insurance | 12.8 | 16.0 | 14.5 | 13.7 | 16.3 | 14.9 | 14.8 | 13.5 | 12.7 |
| Plus Means-Tested Cash Assistance | 11.6 | 15.2 | 13.6 | 12.8 | 15.1 | 13.8 | 13.7 | 12.7 | 11.8 |
| Plus Food and Housing Benefits | 9.7 | 13.7 | 12.2 | 11.2 | 13.4 | 12.0 | 12.1 | 11.3 | 10.6 |
| Plus EITC and Federal Taxes | 10.0 | 14.7 | 13.1 | 11.7 | 13.3 | 11.5 | 11.5 | 10.4 | 9.8 |
| Reduction in Poverty Rate | 2.8 | 1.3 | 1.4 | 2.0 | 3.0 | 3.4 | 3.3 | 3.1 | 2.9 |
Note: The four measures of income are as follows: 1) “Cash Income plus All Social Insurance” is earnings and other private cash income, plus social security, workers’ compensation, and other social insurance programs. It does not include means-tested cash transfers; (2) “Plus Means-Tested Assistance” shows the official poverty rate, which takes into account means-tested assistance, primarily AFDC/TANF and SSI; (3) “Plus Food and Housing Benefits” shows how poverty would be lower if the cash value of food and housing benefits were counted as income; and (4); “Plus EITC and Federal Taxes” is the most comprehensive poverty rate shown. EITC refers to the refundable Earned Income Tax Credit, which is always a positive adjustment to income whereas Federal payroll and income taxes are a negative adjustment. The fungible value of Medicare and Medicaid is not included.
Source: Congressional Budget Office tabulations of March CPS data. Additional calculations by DHHS.
- The combined effect of means-tested cash assistance, food and housing benefits, EITC and taxes was to reduce the poverty rate in 1999 by 2.9 percentage points, as shown in Table ECON 4. Net reductions in poverty rates were somewhat lower during the recession of the early 1980s, and somewhat higher in the mid-1990s, largely due to expansions in the EITC.
Economic Security Risk Factor 5. Poverty Spells
Figure ECON 5. Percentage of Poverty Spells for Individuals Entering Poverty During the 1993 SIPP Panel, by Length of Spell
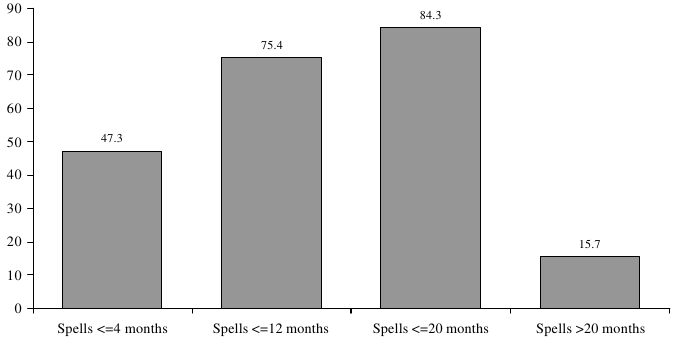
Source: Unpublished data from the SIPP, 1993 panel.
-
Nearly half (47 percent) of all poverty spells that began during the 1993 SIPP panel ended within 4 months and three-fourths ended within one year. Only 16 percent of all such spells were longer than 20 months.
-
Spells of poverty among adults age 65 and older tend to last longer than poverty spells among younger individuals. As shown in Table ECON 5, only 65 percent of poverty spells among adults age 65 and older ended within one year compared to 80 percent for women ages 16 to 64, 75 percent for men ages 16 to 64, and 73 percent for children ages 0 to 15.
-
A larger percentage of poverty spells among non-Hispanic blacks were longer than 20 months (23 percent) than was the case for spells among non-Hispanic whites (14 percent) and among Hispanics (15 percent).
-
In general, poverty spells are shorter than spells of welfare receipt begun in the same time period, as can be seen by comparing Figure ECON 5 to Figure IND 8 in Chapter II. That is, there is more movement in and out of poverty than movement on and off welfare. For example, 75 percent of poverty spells lasted a year or less, whereas only 60 percent of food stamp spells and 56 percent of AFDC spells lasted a year or less.
Table ECON 5. Percentage of Poverty Spells for Individuals Entering Poverty During the 1993 SIPP Panel, by Length of Spell, Race, and Age
| Spells <=4 months | Spells <=12 months | Spells <=20 months | Spells >20 months | |
|---|---|---|---|---|
| All Persons | 47.3 | 75.4 | 84.3 | 15.7 |
| Racial Categories | ||||
| Non-Hispanic White | 47.3 | 78.8 | 86.3 | 13.7 |
| Non-Hispanic Black | 39.9 | 64.1 | 76.7 | 23.3 |
| Hispanic | 42.5 | 74.4 | 84.7 | 15.3 |
| Age Categories | ||||
| Children Ages 0 – 15 | 43.8 | 73.0 | 82.2 | 17.8 |
| Women Ages 16 – 64 | 47.6 | 79.9 | 88.9 | 11.1 |
| Men Ages 16 – 64 | 51.6 | 75.2 | 84.2 | 15.8 |
| Adults Age 65 and over | 40.7 | 65.4 | 73.0 | 27.0 |
Note: Spell length categories are not mutually exclusive. Spells separated by only 1 month are not considered separate spells. Due to the length of the observation period, actual spell lengths for spells that lasted more than 20 months cannot be observed.
Source: Unpublished data from the SIPP, 1993 panel.
Economic Security Risk Factor 6. Long-term Poverty
Figure ECON 6. Percentage of Children Ages 0 to 5 in 1982 Living in Poverty Between 1982 and 1991, by Years in Poverty and Race
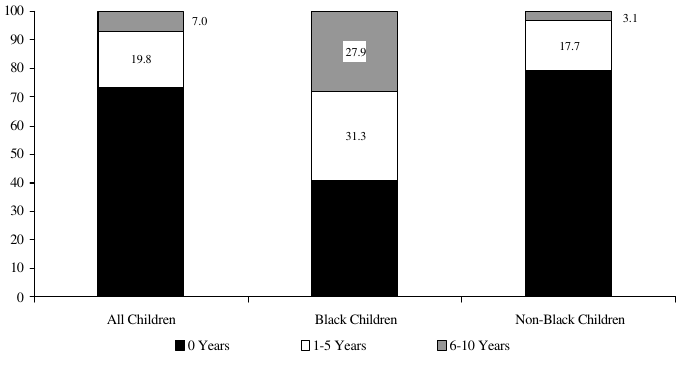
Source: Unpublished data from the PSID, 1983-1992.
-
Among children who were ages 0 to 5 in 1982, nearly three-quarters (73 percent) never lived in poverty for any year over the next ten years. One-fifth (20 percent) lived in poverty for one to five years and 7 percent were poor for six to ten years.
-
During the 1982-1991 period, 28 percent of black children experienced longer-term poverty of six to ten years, a percentage much higher than that for non-black children during the same ten-year period (3 percent). Similar patterns existed in the 1972-1981 period, as shown in Table ECON 6.
-
For both time periods, the percentages of all individuals who were poor for only one to two years were much larger than the percentages of all individuals who experienced longer-term poverty. For example, while 11 percent of all individuals were poor for only one to two years between 1982 and 1991, only 3 percent were poor for six to eight years and only 2 percent were poor for nine to ten years during the same time period.
-
Children were more likely than others to experience long-term poverty, especially poverty of nine or ten years. Table ECON 6 shows that this pattern was true in both time periods.
Table ECON 6. Percentage of Individuals Living in Poverty Across Two Ten-Year Time Periods, by Years in Poverty, Race, and Age
| Between 1982 and 1991: | |||
| All Persons | |||
| All Persons | Black | Non-Black | |
| 0 Years | 78.8 | 50.6 | 82.9 |
| 1 - 2 Years | 11.3 | 14.9 | 10.7 |
| 3 - 5 Years | 5.3 | 14.4 | 4.0 |
| 6 - 8 Years | 2.8 | 11.2 | 2.0 |
| 9 - 10 Years | 1.8 | 8.9 | 0.7 |
| 100.0 | 100.0 | 100.0 | |
| Children 0 - 5 in 1982 | |||
| All Children | Black Children | Non-Black Children | |
| 0 Years | 73.3 | 40.9 | 79.2 |
| 1 - 2 Years | 12.3 | 16.5 | 11.6 |
| 3 - 5 Years | 7.5 | 14.8 | 6.1 |
| 6 - 8 Years | 3.2 | 11.1 | 1.7 |
| 9 - 10 Years | 3.8 | 16.8 | 1.4 |
| Between 1972 and 1981: | |||
| All Persons | |||
| All Persons | Black | Non-Black | |
| 0 Years | 79.2 | 45.6 | 83.7 |
| 1 - 2 Years | 12.3 | 20 | 11.3 |
| 3 - 5 Years | 4.6 | 16.6 | 3.1 |
| 6 - 8 Years | 2.5 | 10.4 | 1.5 |
| 9 – 10 Years | 1.2 | 7.5 | 0.4 |
| Children 0 - 5 in 1972 | |||
| All Children | Black Children | Non-Black Children | |
| 0 Years | 75.6 | 34.1 | 82.3 |
| 1 - 2 Years | 13.1 | 21.7 | 11.7 |
| 3 - 5 Years | 5.6 | 20.5 | 3.2 |
| 6 - 8 Years | 3.2 | 11.1 | 1.9 |
| 9 – 10 Years | 2.5 | 12.8 | 0.9 |
Note: The base for the percentage is individuals in the first year (1982 or 1972). Children are defined by age in the first year. This measures years of poverty over the specified ten-year time periods and does not take into account years of poverty that may have occurred before the initial year (1982 or 1972).
Source: Unpublished data from the PSID, 1973-1992.
Economic Security Risk Factor 7. Child Support
Figure ECON 7a. Total, Non-AFDC/TANF, and AFDC/TANF Title IV-D Child Support Collections: 1978-1999
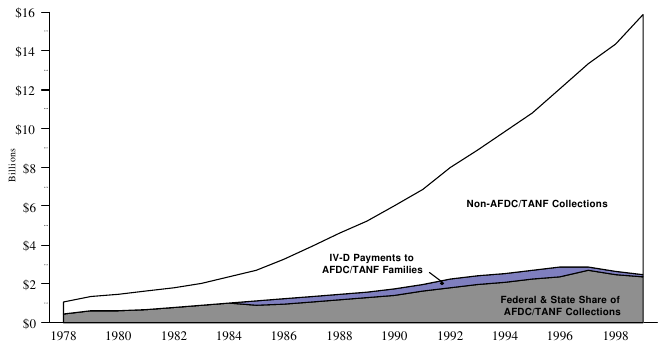
Source: U.S. Department of Health and Human Services, Administration for Children and Families, Office of Child Support Enforcement, Preliminary Child Support Enforcement FY 1999 Data Report, 2000 (and earlier years), Washington, DC.
-
Collections paid through the Child Support Enforcement system (Title IV-D of the Social Security Act) totaled $15.8 billion in 1999, nearly $1.5 billion more than in 1998. During the 1990s, child support collections grew rapidly, at an average rate of almost $1.1 billion a year.
-
Non-TANF collections as a percentage of overall collections by the IV-D program have rapidly increased in recent years. Non-TANF collections increased by nearly $1.7 billion between 1998 and 1999, while TANF collections declined by nearly $0.2 billion. However, the 6 percent drop in TANF collections between 1998 and 1999 was smaller than the 13 percent drop in the number of TANF recipient families over the same time period.
-
The amount of TANF collections paid to AFDC/TANF families has decreased since FY 1996, when the first $50 of each month’s child support collection were “passed through” to families that were receiving cash benefits. The $50 pass-through was repealed by the 1996 welfare reform law, although a number of states have opted to pass through some or all of collections to the custodial TANF family, despite the loss of revenues to the state.
-
In 1999, over 95 percent of TANF collections (collections on behalf of TANF recipients and for past due support assigned to the state by former TANF recipients) was retained to reimburse the state and federal governments for the cost of welfare benefits, as shown in Table ECON 7a.
Table ECON 7a. Total, Non-AFDC/TANF, and AFDC/TANF Title IV-D Child Support Collections: 1978-1999
| Total Collections (in millions) | |||||||
|---|---|---|---|---|---|---|---|
| AFDC/TANF Collections | |||||||
| Total | |||||||
| Fiscal Year | Current Dollars | Constant '99 Dollars | Total | Payments to AFDC/TANF Families | Federal & State Share of Collections | Non- AFDC/TANF Collections | Total IV-D Administrative Expenditures |
| 1978 | $1,047 | $2,618 | $472 | $13 | $459 | $575 | $312 |
| 1979 | 1,333 | 3,059 | 597 | 12 | 584 | 736 | 383 |
| 1980 | 1,478 | 3,042 | 603 | 10 | 593 | 874 | 466 |
| 1981 | 1,629 | 3,053 | 671 | 12 | 659 | 958 | 526 |
| 1982 | 1,771 | 3,098 | 786 | 15 | 771 | 985 | 612 |
| 1983 | 2,024 | 3,401 | 880 | 15 | 865 | 1,144 | 691 |
| 1984 | 2,378 | 3,828 | 1,000 | 17 | 983 | 1,378 | 723 |
| 1985 | 2,694 | 4,182 | 1,090 | 189 | 901 | 1,604 | 814 |
| 1986 | 3,249 | 4,913 | 1,225 | 275 | 955 | 2,019 | 941 |
| 1987 | 3,917 | 5,768 | 1,349 | 278 | 1,070 | 2,569 | 1,066 |
| 1988 | 4,605 | 6,526 | 1,486 | 289 | 1,188 | 3,128 | 1,171 |
| 1989 | 5,241 | 7,074 | 1,593 | 307 | 1,286 | 3,648 | 1,363 |
| 1990 | 6,010 | 7,729 | 1,750 | 334 | 1,416 | 4,260 | 1,606 |
| 1991 | 6,886 | 8,429 | 1,984 | 381 | 1,603 | 4,902 | 1,804 |
| 1992 | 7,964 | 9,462 | 2,259 | 435 | 1,824 | 5,705 | 1,995 |
| 1993 | 8,907 | 10,273 | 2,416 | 446 | 1,971 | 6,491 | 2,241 |
| 1994 | 9,850 | 11,067 | 2,550 | 457 | 2,093 | 7,300 | 2,556 |
| 1995 | 10,827 | 11,836 | 2,689 | 474 | 2,215 | 8,138 | 3,012 |
| 1996 | 12,020 | 12,785 | 2,855 | 480 | 2,375 | 9,165 | 3,055 |
| 1997 | 13,364 | 13,841 | 2,843 | 157 | 2,685 | 10,521 | 3,432 |
| 1998 | 14,348 | 14,622 | 2,650 | 152 | 2,498 | 11,698 | 3,589 |
| 1999 | 15,843 | 15,843 | 2,482 | 113 | 2,368 | 13,362 | 4,039 |
Note: Not all states report current child support collections in all years. Constant dollar adjustments to the 1999 level were made using a CPI-U-X1 fiscal year average price index. Fiscal year 1999 data may not be exactly comparable to that of previous years due to changes in data reporting forms.
Source: U.S. Department of Health and Human Services, Administration for Children and Families, Office of Child Support Enforcement, Preliminary Child Support Enforcement FY 1999 Data Report, 2000 (and earlier years), Washington, DC.
Figure ECON 7b. Average Annual Child Support Enforcement Payments for Current Support by Non-Custodial Parents with an Obligation and Payment (1998 Dollars): 1986-1998
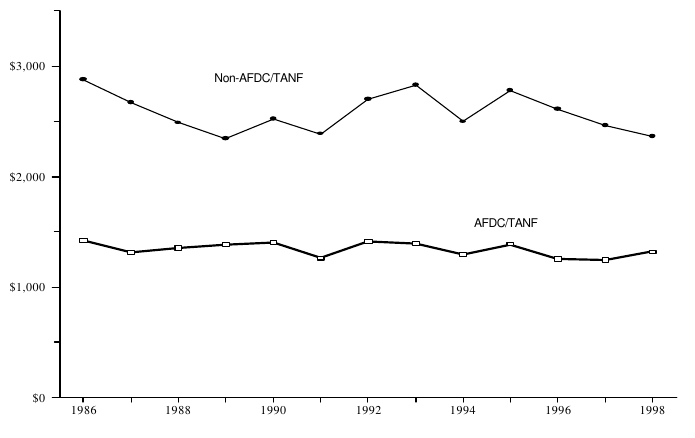
Source: U.S. Department of Health and Human Services, Administration for Children and Families, Office of Child Support Enforcement, Child Support Enforcement Twenty-Third Annual Report to Congress, for the period ending September 30, 1998 (and earlier years), Washington, DC.
-
Average child support payments on behalf of families not receiving AFDC/TANF have, over time, been about twice as large as those payments for families receiving AFDC/TANF. (Note that many families classified as not on AFDC/TANF in a particular year may have received AFDC/TANF at some point in the past.)
-
When converted to constant dollars, average payments have not quite kept pace with inflation, as shown in Table ECON 7b. In constant (1998) dollars, annual child support enforcement payments to AFDC/TANF families decreased by 8 percent between FY 1986 and FY 1998, from $1,425 to $1,319. Payments to non-AFDC/TANF families fell by 18 percent in constant dollars over the same time period, from $2,877 to $2,361.
Table ECON 7b. Average Annual Child Support Enforcement Payments for Current Support by Non-Custodial Parents with an Obligation and Payment (Nominal and 1998 Dollars): 1986-1998
| Payments (in millions) | |||||||
|---|---|---|---|---|---|---|---|
| AFDC/TANF | Non-AFDC/TANF | Total | |||||
| Fiscal Year | Current Dollars | Constant ’98 Dollars | Current Dollars | Constant ’98 Dollars | Current Dollars | Constant ’98 Dollars | F.Y. CPI-U |
| 1986 | $959 | $1,425 | $1,936 | $2,877 | $1,433 | $2,130 | 109.3 |
| 1987 | 910 | 1,315 | 1,851 | 2,675 | 1,416 | 2,046 | 112.4 |
| 1988 | 975 | 1,353 | 1,793 | 2,488 | 1,468 | 2,037 | 117.0 |
| 1989 | 1,046 | 1,386 | 1,770 | 2,345 | 1,457 | 1,930 | 122.6 |
| 1990 | 1,110 | 1,401 | 1,998 | 2,521 | 1,672 | 2,110 | 128.7 |
| 1991 | 1,049 | 1,260 | 1,989 | 2,389 | 1,711 | 2,055 | 135.2 |
| 1992 | 1,210 | 1,411 | 2,314 | 2,698 | 1,919 | 2,238 | 139.3 |
| 1993 | 1,230 | 1,392 | 2,498 | 2,827 | 1,990 | 2,252 | 143.5 |
| 1994 | 1,178 | 1,299 | 2,266 | 2,499 | 1,889 | 2,083 | 147.3 |
| 1995 | 1,294 | 1,388 | 2,595 | 2,784 | 2,167 | 2,325 | 151.4 |
| 1996 | 1,200 | 1,252 | 2,504 | 2,612 | 2,109 | 2,201 | 155.6 |
| 1997 | 1,221 | 1,241 | 2,427 | 2,467 | 2,116 | 2,150 | 159.8 |
| 1998 | 1,319 | 1,319 | 2,361 | 2,361 | 2,117 | 2,117 | 162.4 |
| 1986-98 | |||||||
| – change | $360 | -$106 | $425 | -$516 | $684 | -$13 | 53.1 |
| – percent | 37.6 | -7.5 | 21.9 | -18.0 | 47.7 | -0.6 | 48.6 |
Note: Data for 1996 and 1997 are revised from previous report. Data for 1998 do not include information from Florida, Illinois, and Wisconsin.
Source: U.S. Department of Health and Human Services, Administration for Children and Families, Office of Child Support Enforcement, Child Support Enforcement Twenty-Third Annual Report to Congress, for the period ending September 30, 1998 (and earlier years), Washington, DC.
Economic Security Risk Factor 8. Food Insecurity
Figure ECON 8. Percentage of Households Classified as Food Insecure: 1999
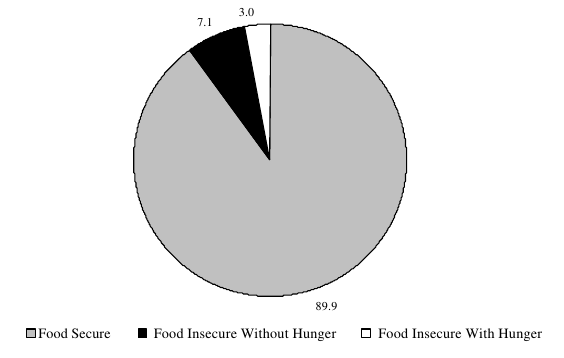
Source: U.S. Dept. of Agriculture, ERS, calculations using data August 1998 CPS Food Security Supplement.
-
A large majority (90 percent) of American households was food secure in 1999 – that is, showed little or no evidence of concern about food supply or reduction in food intake.
-
Approximately 10 percent of households experienced food insecurity (not being able to afford enough food) at some level during the twelve months ending in April 1999. More than two-thirds of the food insecure households were without hunger, meaning that although food insecurity was evident in their concerns and in adjustments to household food management, little or no reduction in food intake was reported.
-
The prevalence of food insecurity with hunger in 1999 was 3 percent. One or more members of these households were estimated to have experienced reduced food intake and hunger as a result of financial constraints.
-
Households with income below poverty had a higher rate of food insecurity (37 percent) than the 10 percent rate among the general population, as shown in Table ECON 8a. Only 4 percent of families with incomes at or above 185 percent of the poverty level showed evidence of food insecurity.
-
As shown in Table ECON 8b, the incidence of food insecurity and hunger has declined since 1995, when food security data were first collected. Increases in 1996 and 1998 may be due to the timing of data collection in even years (fall) as compared with odd years (spring).
Table ECON 8a. Percentage of Households Classified as Food Insecure, by Selected Characteristics: 1999
| Food Secure | Food Insecure Total | Food Insecure Without Hunger | Food Insecure With Hunger | |
|---|---|---|---|---|
| All Households | 89.9 | 10.1 | 7.1 | 3.0 |
| Racial Categories | ||||
| Non-Hispanic White | 93.0 | 7.0 | 4.9 | 2.1 |
| Non-Hispanic Black | 78.8 | 21.2 | 14.8 | 6.4 |
| Hispanic | 79.2 | 20.8 | 15.3 | 5.5 |
| Non-Hispanic Other | 89.8 | 10.2 | 7.1 | 3.1 |
| Households, by Age | ||||
| Households with Children Under 6 | 83.8 | 16.2 | 13.1 | 3.1 |
| Households with Children Under 18 | 85.2 | 14.8 | 11.5 | 3.3 |
| Households with Elderly but No Children | 94.2 | 5.8 | 4.3 | 1.6 |
| Household Income -to-Poverty Ratio | ||||
| Under 0.50 | 60.8 | 39.2 | 25.5 | 13.7 |
| Under 1.00 | 63.3 | 36.7 | 24.5 | 12.2 |
| Under 1.30 | 67.7 | 32.3 | 21.6 | 10.7 |
| Under 1.85 | 73.9 | 26.1 | 18.0 | 8.1 |
| 1.85 and over | 95.9 | 4.1 | 3.1 | 1.0 |
See below for notes and source.
Table ECON 8b. Percentage of Households Classified as Food Insecure: 1995-1999
| Food Secure | Food Insecure Total | Food Insecure Without Hunger | Food Insecure With Hunger | |
|---|---|---|---|---|
| 1995 | 89.7 | 10.3 | 6.4 | 3.9 |
| 1996 | 89.6 | 10.4 | 6.3 | 4.1 |
| 1997 | 91.3 | 8.7 | 5.6 | 3.1 |
| 1998 | 89.8 | 10.2 | 6.6 | 3.6 |
| 1999 | 91.3 | 8.7 | 5.9 | 2.8 |
Note: Food secure households show little or no evidence of concern about food supply or reduction in food intake. Households classified as food insecure without hunger report food-related concerns, adjustments to household food management, and reduced variety and desirability of diet but report little or no reduction in food intake. Households classified as food insecure with hunger report reduced food intake and hunger. Because of changes in survey administration, statistics in Tables ECON 8b have been adjusted for cross-year comparability. These adjustments result in understating the prevalence of food insecurity. For example, the best estimate of food insecurity in 1999 is 10.1 percent (Table ECON 8a), while the estimate adjusted for cross-year comparability is 8.7 percent (Table ECON 8b).
Source: U.S. Department. of Agriculture, Economic Research Service, Household Food Security in the United States, 1999.
Economic Security Risk Factor 9. Lack of Health Insurance
Figure ECON 9. Percentage of Persons without Health Insurance, by Income: 1999
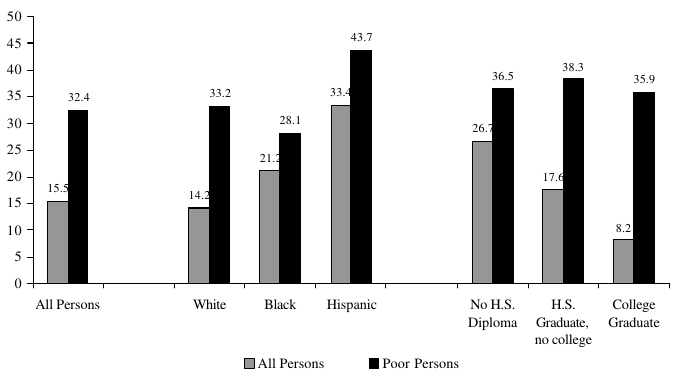
Source: U.S. Bureau of the Census, Current Population Survey, March 2000.
-
Poor persons were twice as likely as all persons to be without health insurance in 1999 (32 percent compared to 16 percent). While the ratio varied across categories, persons with family income at or below the poverty line were more likely to be without health insurance regardless of race, gender, educational attainment, or age.
-
Hispanics were the racial/ethnic group least likely to have health insurance in 1999, among both the general population and those with incomes below the poverty line. While whites in general were more likely to have insurance than blacks, poor blacks were more likely to have insurance than poor whites.
-
Among all persons, amount of education was inversely related to health insurance coverage, as shown in Table ECON 9. However, among poor persons, educational attainment made little difference as to whether individuals had health insurance.
-
As shown in Table ECON 9, individuals ages 18 to 34 are the most likely to be without health insurance, among both the general population and the poor population. Nearly half of all 18 to 34 year-olds with incomes below the poverty line had no health insurance in 1999.
Table ECON 9. Percentage of Persons without Health Insurance, by Income and Selected Characteristics: 1999
| All Persons | Poor Persons | |
|---|---|---|
| All Persons | 15.5 | 32.4 |
| Male | 16.5 | 35.0 |
| Female | 14.6 | 30.4 |
| White | 14.2 | 33.2 |
| Black | 21.2 | 28.1 |
| Hispanic | 33.4 | 43.7 |
| No H.S. Diploma | 26.7 | 36.5 |
| H.S. Graduate, no college | 17.6 | 38.3 |
| College Graduate | 8.2 | 35.9 |
| Age 18 and under | 13.9 | 23.3 |
| Ages 18-24 | 29.0 | 45.4 |
| Ages 25-34 | 23.2 | 51.9 |
| Ages 35-44 | 16.5 | 44.8 |
| Ages 45-64 | 13.8 | 36.0 |
| Age 65 and over | 1.3 | 3.4 |
Note: "Poor persons" are defined as those with total family incomes at or below the poverty rate. Persons of Hispanic ethnicity may be of any race.
Source: U.S. Bureau of the Census, “Health Insurance Coverage: 1999,” Current Population Reports, Series P60-211, 2000.
Employment and Work-related Risk Factors
Employment and Work-related Risk Factor 1. Labor Force Attachment
Figure WORK 1. Percentage of Individuals in Families with Labor Force Participants, by Race: 1999
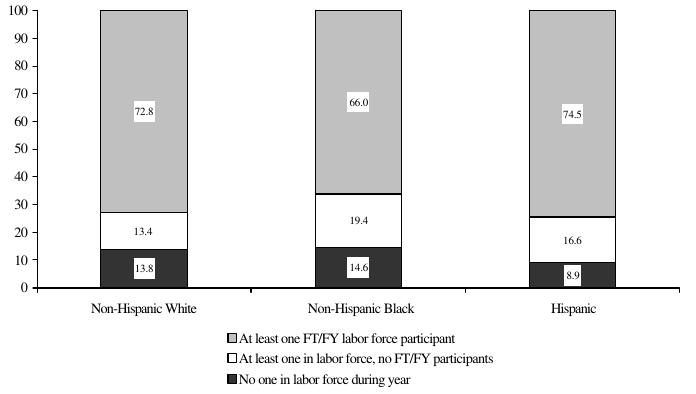
Source: Unpublished tabulations of March CPS data.
-
In 1999, over 72 percent of the total population lived in families with at least one person working on a full-time full-year basis, as shown in Table WORK 1a. Full-time full-year work was higher in 1999 than in the rest of the 1990s, as shown in Table WORK 1b.
-
Overall, 13 percent of the population lived in families with no labor force participants and 15 percent lived in families with part-time and/or part-year labor force participants in 1999.
-
Persons of Hispanic origin were less likely than non-Hispanic blacks or non-Hispanic whites to live in families with no one in the labor force in 1999 (9 percent compared to 15 and 14 percent, respectively).
-
Working-age women were more likely than working-age men to live in families with no one in the labor force. Men were more likely to live in families with at least one full-time full-year worker.
Table WORK 1a. Percentage of Individuals in Families with Labor Force Participants,
by Race and Age: 1999
| No one in LF During Year | At least one in LF No one FT/FY | At least one FT/FY LF participant | |
|---|---|---|---|
| All Persons | 13.1 | 14.6 | 72.3 |
| Racial Categories | |||
| Non-Hispanic White | 13.8 | 13.4 | 72.8 |
| Non-Hispanic Black | 14.6 | 19.4 | 66.0 |
| Hispanic | 8.9 | 16.6 | 74.5 |
| Age Categories | |||
| Children Ages 0-5 | 4.6 | 16.0 | 79.5 |
| Children Ages 6-10 | 5.0 | 15.4 | 79.6 |
| Children Ages 1-15 | 5.1 | 13.8 | 81.1 |
| Women Ages 16-64 | 7.5 | 15.5 | 77.0 |
| Men Ages 16-64 | 5.6 | 13.0 | 81.4 |
| Adults Age 65 and over | 64.7 | 15.5 | 19.8 |
See below for notes and source.
Table WORK 1b. Percentage of Individuals in Families with Labor Force Participants: 1990-1999
| No one in LF During Year | At least one in LF No one FT/FY | At least one FT/FY LF participant | |
|---|---|---|---|
| 1990 | 13.7 | 18.1 | 68.3 |
| 1991 | 14.3 | 18.7 | 67.0 |
| 1992 | 14.3 | 18.6 | 67.1 |
| 1993 | 14.2 | 18.6 | 67.3 |
| 1994 | 14.0 | 17.7 | 68.3 |
| 1995 | 13.8 | 17.0 | 69.2 |
| 1996 | 13.6 | 16.7 | 69.7 |
| 1997 | 13.5 | 16.3 | 70.2 |
| 1998 | 13.3 | 15.3 | 71.4 |
| 1999 | 13.1 | 14.6 | 72.3 |
Note: Full-time full-year workers are defined as those who usually worked for 35 or more hours per week, for at least 50 weeks in a given year. Part-time and part-year labor force participation includes individuals who are unemployed, laid off, and/or looking for work. This indicator represents annual measures of labor force participation, and thus cannot be compared to monthly measures of labor force participation in Indicator 2 and published in previous Indicators of Welfare Dependence reports (see Appendix D for details).
Source: Unpublished tabulations of March CPS data.
Employment and Work-related Risk Factor 2. Employment Among the Low-skilled
Figure WORK 2. Percentage of All Persons Ages 18 to 65 with No More than a High School Education Who Were Employed: 1969-2000
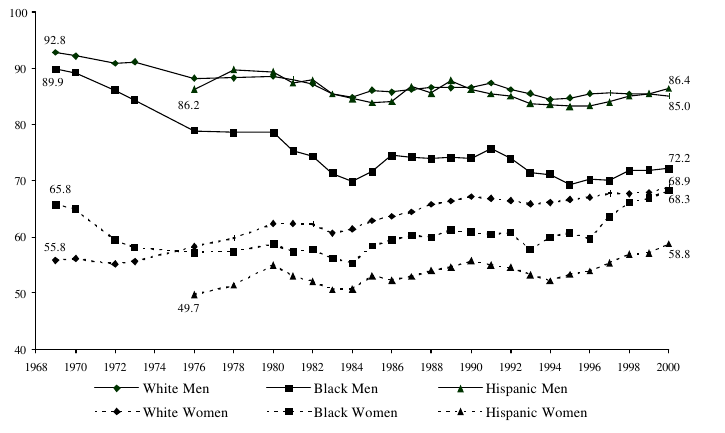
Source: ASPE tabulations of March Current Population Surveys.
-
Between 1969 and 1984, the percentage of low-skilled men who were employed dropped significantly, with the largest decline among black men, as shown in Figure WORK 2. During this time period, the percentage of black men with no more than a high school education who were employed dropped 20 percentage points; for low-skilled white men, employment rates dropped 8 percentage points.
-
Since 1984, employment levels for white and Hispanic men with a high school education or less have leveled off, hovering close to 85 percent. Employment levels for low-skilled black men have fluctuated over the past fifteen years, rising as high as 76 percent in 1991, and falling as low as 69 percent in 1995.
-
In 2000, only 72 percent of black men with no more than a high school education were working, as compared to 85 to 86 percent of similarly educated white and Hispanic men. However, employment rates for black women with no more than a high school diploma were at an all-time high in 2000 of 68 percent, nearly identical to the 69 percent for white women and higher than the 59 percent for Hispanic women, as shown in Table WORK 2.
Table WORK 2. Percentage of All Persons Ages 18 to 65 with No More than a High School Education Who Were Employed: 1969-2000
| Men | Women | |||||
|---|---|---|---|---|---|---|
| White | Black | Hispanic | White | Black | Hispanic | |
| 1969 | 92.8 | 89.9 | N/A | 55.8 | 65.8 | N/A |
| 1970 | 92.1 | 89.2 | N/A | 56.1 | 64.9 | N/A |
| 1972 | 90.9 | 86.1 | N/A | 55.2 | 59.4 | N/A |
| 1973 | 91.1 | 84.3 | N/A | 55.6 | 58.1 | N/A |
| 1976 | 88.2 | 78.8 | 86.2 | 58.3 | 57.2 | 49.7 |
| 1978 | 88.3 | 78.6 | 89.8 | 59.8 | 57.4 | 51.4 |
| 1980 | 88.6 | 78.5 | 89.4 | 62.3 | 58.7 | 55.0 |
| 1981 | 88.0 | 75.3 | 87.4 | 62.3 | 57.4 | 53.0 |
| 1982 | 87.3 | 74.4 | 87.9 | 62.3 | 57.7 | 52.1 |
| 1983 | 85.4 | 71.3 | 85.4 | 60.7 | 56.2 | 50.6 |
| 1984 | 84.8 | 69.9 | 84.6 | 61.4 | 55.3 | 50.8 |
| 1985 | 86.1 | 71.6 | 83.9 | 62.9 | 58.4 | 53.1 |
| 1986 | 85.7 | 74.5 | 84.1 | 63.7 | 59.4 | 52.4 |
| 1987 | 86.3 | 74.2 | 86.7 | 64.4 | 60.3 | 53.0 |
| 1988 | 86.6 | 73.9 | 85.6 | 65.8 | 59.9 | 54.0 |
| 1989 | 86.5 | 74.1 | 87.8 | 66.4 | 61.3 | 54.6 |
| 1990 | 86.6 | 74.0 | 86.2 | 67.2 | 60.9 | 55.8 |
| 1991 | 87.4 | 75.6 | 85.4 | 66.8 | 60.4 | 55.0 |
| 1992 | 86.2 | 73.9 | 85.0 | 66.5 | 60.7 | 54.6 |
| 1993 | 85.5 | 71.4 | 83.7 | 65.9 | 57.8 | 53.3 |
| 1994 | 84.4 | 71.1 | 83.5 | 66.1 | 59.9 | 52.2 |
| 1995 | 84.7 | 69.3 | 83.2 | 66.6 | 60.7 | 53.3 |
| 1996 | 85.5 | 70.2 | 83.3 | 67.0 | 59.7 | 53.9 |
| 1997 | 85.6 | 70.0 | 84.0 | 67.7 | 63.6 | 55.4 |
| 1998 | 85.3 | 71.8 | 85.0 | 67.7 | 66.1 | 56.9 |
| 1999 | 85.4 | 71.9 | 85.5 | 67.9 | 66.8 | 57.1 |
| 2000 | 85.0 | 72.2 | 86.4 | 68.9 | 68.3 | 58.8 |
Note: All data reflect employment rates for March of the given year. White and Black includes those of Hispanic origin for all years. Hispanic was not available until 1975.
Source: ASPE tabulations of March Current Population Surveys.
Employment and Work-related Risk Factor 3. Earnings of Low-skilled Workers
Figure WORK 3. Mean Weekly Wages of Men Working Full-Time, Full-Year with No More than a High School Education, by Race (1999 Dollars): Selected Years
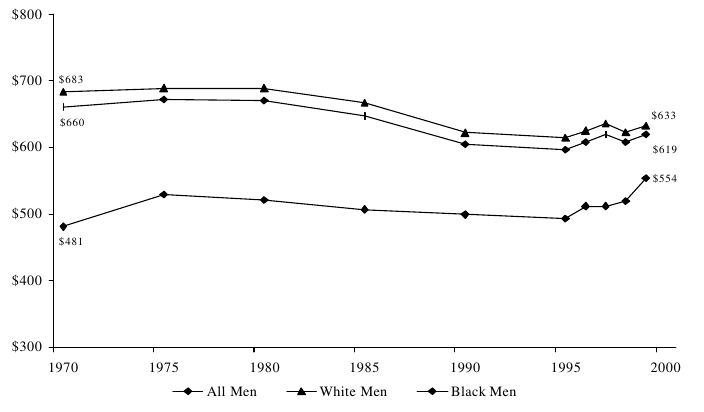
Source: ASPE tabulations of March CPS data.
-
Mean weekly wages for full-time work by men with no more than a high school diploma have decreased in real terms for much of the past quarter century, with some recovery in the late 1990s. In 1970, the mean weekly wage for low-skilled men working full-time was $660 (in 1999 dollars); the comparable wage in 1995 was $597, a decrease of 10 percent.
-
In recent years, this pattern has changed, and weekly wages for low-skilled men have risen, even after taking inflation into account. The mean weekly wage for low-skilled full-time workers was $619 in 1999 – a rise above the 1995 level, but still not as high as wages for this group in 1970 (in 1999 dollars).
-
The gap between mean weekly wages for white and black men with low education levels has narrowed over time, especially over the last five years. In 1970, the mean weekly wage for low-skilled black men working full-time was $481 (in 1999 dollars), or 70 percent of the $683 average for white men. However, full-time working black men with no more than a high school education received 80 percent of the mean weekly wages of white men in 1995 ($493 compared to $614) and 88 percent of the mean weekly wages of white men in 1999 ($554 compared to $633).
Table WORK 3: Mean Weekly Wages of Men Working Full-Time, Full-Year with No More than a High-School Education, by Race (1999 Dollars): Selected Years
| 1970 | 1975 | 1980 | 1985 | 1990 | 1995 | 1996 | 1997 | 1998 | 1999 | |
|---|---|---|---|---|---|---|---|---|---|---|
| All Men | $660 | $672 | $670 | $647 | $605 | $597 | $608 | $619 | $608 | $619 |
| White Men | $683 | $689 | $689 | $667 | $622 | $614 | $625 | $636 | $623 | $633 |
| Black Men | $481 | $529 | $521 | $507 | $499 | $493 | $512 | $512 | $519 | $554 |
Note: Full-time, full-year workers work at least 48 weeks per year and 35 hours per week. White and black include those of Hispanic origin for all years.
Source: ASPE tabulations of March CPS data.
Employment and Work-related Risk Factor 4. Educational Attainment
Figure WORK 4. Percentage of Adults Age 25 and Over, by Level of Educational Attainment: 1960-2000
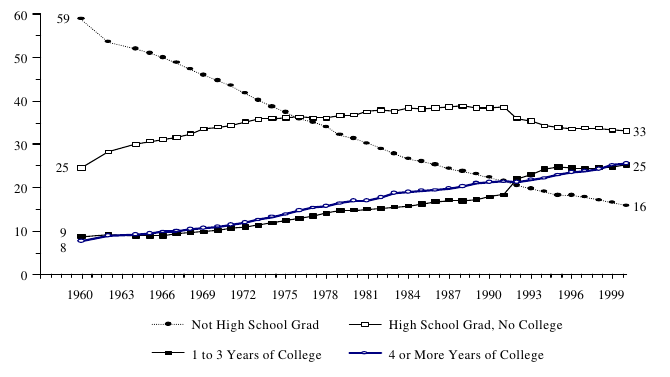
Source: U.S. Bureau of the Census, “Educational Attainment in the United States: March 2000, (Update)”, Current Population Reports, Series P20-536, March 2000, and earlier reports, December 2000.
-
There has been a marked decline over the past forty years in the percentage of the population who has not earned a high school diploma. This percentage fell from 59 percent in 1960 to 16 percent in 2000.
-
The percentage of the population receiving a high school education only (with no subsequent college) was 25 percent in 1960 and rose to 39 percent in 1988. Since then this figure has fallen to 33 percent, although some of this decline is a result of a change in the survey methodology in 1992 (see note to Table WORK 4).
-
etween 1960 and 1990, the percentage of the population with some college (one to three years) doubled, from 9 percent to 18 percent. The apparent jump in 1992 is a result of a change in the survey methodology (see note to Table WORK 4), but the trend continued upward, reaching a little over 25 percent in 2000.
-
The percentage of the population completing four or more years of college more than tripled from 1960 to 2000, rising steadily from 8 percent to nearly 26 percent.
Table WORK 4. Percentage of Adults Age 25 and Over, by Level of Educational Attainment: Selected Years
| Not a High School Graduate | Finished High School, No College | One to Three Years Of College | Four or More Years Of College | |
|---|---|---|---|---|
| 1940 | 76 | 14 | 5 | 5 |
| 1950 | 67 | 20 | 7 | 6 |
| 1960 | 59 | 25 | 9 | 8 |
| 1965 | 51 | 31 | 9 | 9 |
| 1970 | 45 | 34 | 10 | 11 |
| 1975 | 37 | 36 | 12 | 14 |
| 1980 | 31 | 37 | 15 | 17 |
| 1981 | 30 | 38 | 15 | 17 |
| 1982 | 29 | 38 | 15 | 18 |
| 1983 | 28 | 38 | 16 | 19 |
| 1984 | 27 | 38 | 16 | 19 |
| 1985 | 26 | 38 | 16 | 19 |
| 1986 | 25 | 38 | 17 | 19 |
| 1987 | 24 | 39 | 17 | 20 |
| 1988 | 24 | 39 | 17 | 20 |
| 1989 | 23 | 38 | 17 | 21 |
| 1990 | 22 | 38 | 18 | 21 |
| 1991 | 22 | 39 | 18 | 21 |
| 1992 | 21 | 36 | 22 | 21 |
| 1993 | 20 | 35 | 23 | 22 |
| 1994 | 19 | 34 | 24 | 22 |
| 1995 | 18 | 34 | 25 | 23 |
| 1996 | 18 | 34 | 25 | 24 |
| 1997 | 18 | 34 | 24 | 24 |
| 1998 | 17 | 34 | 25 | 24 |
| 1999 | 17 | 33 | 25 | 25 |
| 2000 | 16 | 33 | 25 | 26 |
Note: Completing the GED is not considered completing high school within this table. Beginning with data for 1992, a new survey question results in different categories than for prior years. Data shown as Finished High School, No College was previously from the category “High School, 4 years” and is now from the category “High School Graduate.” Data shown as One to Three Years of College was previously from the category “College 1 to 3 years” and is now the sum of the categories: “Some College” and two separate “Associate Degree” categories. Data shown as Four or more Years of College was previously from the category “College 4 years or more,” and is now the sum of the categories: “Bachelor's Degree,” “Master's Degree,” “Doctorate Degree,” and “Professional Degree.”
Source: U.S. Bureau of the Census, “Educational Attainment in the United States: March 2000, (Update)”, Current Population Reports, Series P20-536, March 2000, and earlier reports,” December 2000.
Employment and Work-related Risk Factor 5. High-school Dropout Rates
Figure WORK 5. Percentage of Students Enrolled in Grades 10 to 12 in the Previous Year Who Were Not Enrolled and Had Not Graduated in the Survey Year, by Race: Selected Years
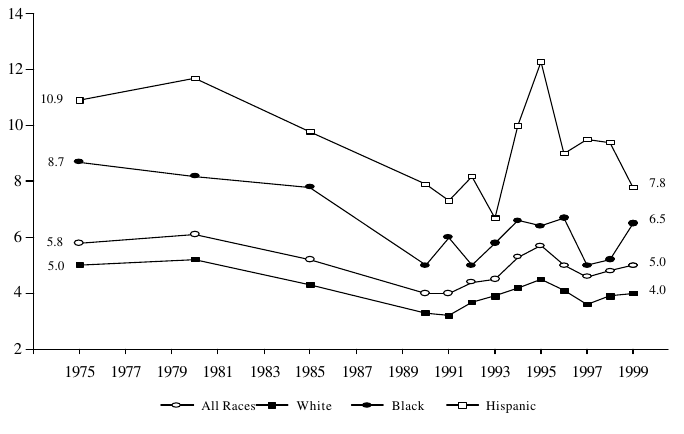
Source: U.S. Department of Health and Human Services, Office of the Assistant Secretary for Planning and Evaluation, Trends in the Well-Being of America’s Children and Youth: 1998. Table EA 1.4; U.S. Department of Education, National Center for Education Statistics, Dropout Rates in the United States: 1998, Table 1 and Dropout Rates in the United States: 1999, Table 1.
-
After declining steadily during the 1980s, dropout rates for teens in grades 10 to 12 began rising, from a total dropout rate of 4.0 percent in 1991 to a peak of 5.7 percent in 1995. The overall rate declined to 4.6 percent in 1997 but has since then trended slightly upward, to 5.0 percent in 1999.
-
Among races, dropout rates are highest for Hispanic teens over time. In 1999, the dropout rate was 7.8 percent for Hispanic teens, compared to 6.5 percent for black teens and 4.0 percent for white teens.
Table WORK 5. Percentage of Students Enrolled in Grades 10 to 12 in the Previous Year Who Were Not Enrolled and Had Not Graduated in the Survey Year, by Race: Selected Years
| 1975 | 1980 | 1985 | 1990 | 1992 | 1994 | 1995 | 1996 | 1997 | 1998 | 1999 | |
|---|---|---|---|---|---|---|---|---|---|---|---|
| Total | 5.8 | 6.1 | 5.2 | 4.0 | 4.4 | 5.3 | 5.7 | 5.0 | 4.6 | 4.8 | 5.0 |
| Non-Hispanic White | 5.0 | 5.2 | 4.3 | 3.3 | 3.7 | 4.2 | 4.5 | 4.1 | 3.6 | 3.9 | 4.0 |
| Non-Hispanic Black | 8.7 | 8.2 | 7.8 | 5.0 | 5.0 | 6.6 | 6.4 | 6.7 | 5.0 | 5.2 | 6.5 |
| Hispanic | 10.9 | 11.7 | 9.8 | 7.9 | 8.2 | 10.0 | 12.3 | 9.0 | 9.5 | 9.4 | 7.8 |
Note: Persons of Hispanic ethnicity may be of any race.
Source: U.S. Department of Health and Human Services, Office of the Assistant Secretary for Planning and Evaluation, Trends in the Well-Being of America’s Children and Youth: 1998. Table EA 1.4; U.S. Department of Education, National Center for Education Statistics, Dropout Rates in the United States: 1998, Table 1 and Dropout Rates in the United States: 1999, Table 1.
Employment and Work-related Risk Factor 6. Adult Alcohol and Substance Abuse
Figure WORK 6. Percentage of Adults Who Used Cocaine or Marijuana or Abused Alcohol, by Age: 1999
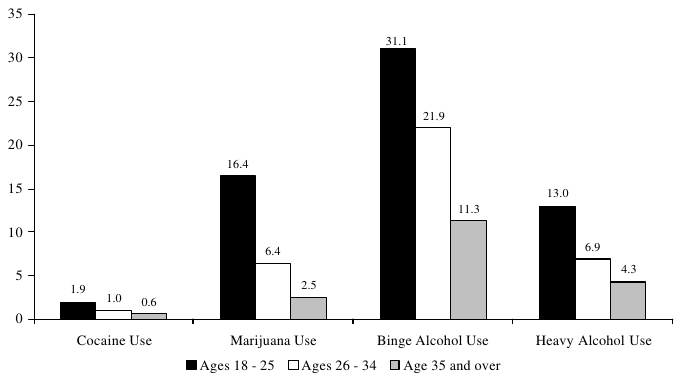
Source: U.S. Department of Health and Human Services, Substance Abuse and Mental Health Services Administration, National Household Survey on Drug Abuse.
-
In 1999, young adults (ages 18 to 25) were more likely than other adults to report cocaine use, marijuana use, or alcohol abuse in the past month. About one in six (16 percent) of adults 18 to 25 reported using marijuana in the past month, compared with 6 percent of adults 26 to 34 and 3 percent of adults 35 and older. Young adults were also significantly more likely to abuse alcohol than older adults.
-
The percentages of persons reporting binge alcohol use were significantly larger than the percentages for all other reported behaviors, across all age groups and for all years with reports on alcohol use, as shown in Table WORK 6.
-
Use of marijuana and cocaine has decreased across all age groups over the past twenty years. For example, reported cocaine use among adults ages 18 to 25 fell from 10 percent in 1979 to 2 percent in 1999; marijuana use fell from 36 percent in 1979 to 16 percent in 1999. There has been a much smaller decline in the use of alcohol since 1985.
Table WORK 6. Percentage of Adults Who Used Cocaine or Marijuana or Abused Alcohol, by Age: Selected Years
| 1979 | 1985 | 1988 | 1991 | 1994 | 1995 | 1996 | 1997 | 1998 | 1999 | |
|---|---|---|---|---|---|---|---|---|---|---|
| Cocaine | ||||||||||
| Ages 18-25 | 9.9 | 8.1 | 4.8 | 2.2 | 1.2 | 1.0 | 2.0 | 1.2 | 2.0 | 1.9 |
| Ages 26-34 | 3.0 | 6.3 | 2.8 | 1.9 | 1.3 | 1.2 | 1.5 | 0.9 | 1.2 | 1.0 |
| Age 35 and Over | 0.2 | 0.5 | 0.4 | 0.5 | 0.4 | 0.4 | 0.4 | 0.5 | 0.5 | 0.6 |
| Marijuana | ||||||||||
| Ages 18-25 | 35.6 | 21.7 | 15.3 | 12.9 | 12.1 | 12.0 | 13.2 | 12.8 | 13.8 | 16.4 |
| Ages 26-34 | 19.7 | 19.0 | 12.3 | 7.7 | 6.9 | 6.7 | 6.3 | 6.0 | 5.5 | 6.4 |
| Age 35 and Over | 2.9 | 2.6 | 1.8 | 2.6 | 2.3 | 1.8 | 2.0 | 2.6 | 2.5 | 2.5 |
| Binge Alcohol Use | ||||||||||
| Ages 18-25 | N/A | 34.4 | 28.2 | 31.2 | 33.6 | 29.9 | 32.0 | 28.0 | 31.7 | 31.1 |
| Ages 26-34 | N/A | 27.5 | 19.7 | 21.5 | 24.0 | 24.0 | 22.8 | 23.1 | 22.0 | 21.9 |
| Age 35 and Over | N/A | 12.9 | 9.7 | 10.1 | 11.8 | 11.8 | 11.3 | 11.7 | 11.9 | 11.3 |
| Heavy Alcohol Use | ||||||||||
| Ages 18-25 | N/A | 13.8 | 12.0 | 15.2 | 13.2 | 12.0 | 12.9 | 11.1 | 13.8 | 13.0 |
| Ages 26-34 | N/A | 11.5 | 7.1 | 7.9 | 8.0 | 7.9 | 7.1 | 7.5 | 7.2 | 6.9 |
| Age 35 and Over | N/A | 5.2 | 4.0 | 4.4 | 4.8 | 3.9 | 3.8 | 4.0 | 4.4 | 4.3 |
Note: Cocaine and marijuana use is defined as use during the past month. “Binge" Alcohol Use is defined as drinking five or more drinks on the same occasion on at least one day in the past 30 days. "Occasion" means at the same time or within a couple hours of each other. Heavy Alcohol Use is defined as drinking five or more drinks on the same occasion on each of five or more days in the past 30 days; all Heavy Alcohol Users are also "Binge" Alcohol Users.
Source: U.S. Department of Health and Human Services, Substance Abuse and Mental Health Services Administration, National Household Survey on Drug Abuse.
Employment and Work-related Risk Factor 7. Adult/child Disability
Figure WORK 7. Percentage of the Total Population Reporting a Disability, by Age: 1994
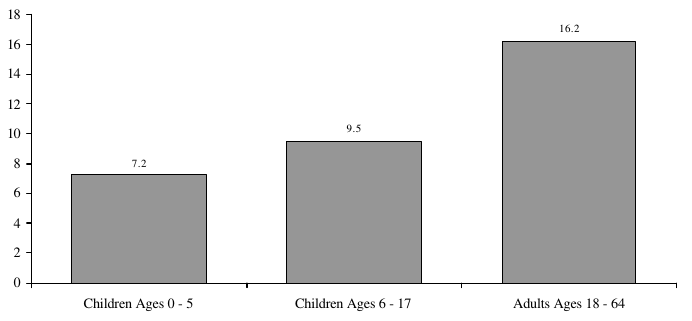
Source: Unpublished data from the 1994 National Health Interview Survey on Disability, Phase I; 1994 NHIS, and 1994 Family Resources Supplement.
-
In 1994, adults were more likely than children of school age (ages 6 to 17) to have a functional disability, and school-age children were in turn more likely to have a functional disability than younger children (ages 0 to 5).
-
Among the non-elderly population, disability rates were the same for non-Hispanic whites and non-Hispanic blacks (15 percent), but lower for Hispanics (11 percent), as shown in Table WORK 7.
-
While adults were more likely to report a functional disability than children, a higher percentage of children than adults were actually recipients of disability program benefits in 1994, as shown in the bottom panel of Table WORK 7.
Table WORK 7. Percentage of the Total Population Reporting a Disability, by Race and Age: 1994
Functional Disability
| All Persons, All Ages | 18.3 |
| All Persons under 65 Years | 13.9 |
| Racial Categories | |
| (Persons under 65 Years) | |
| Non-Hispanic White | 14.5 |
| Non-Hispanic Black | 14.5 |
| Hispanic | 11.3 |
| Age Categories | |
| Children Ages 0-5 | 7.2 |
| Children Ages 6-17 | 9.5 |
| Adults Ages 18-64 | 16.2 |
| Adults Age 65 and over | 51.0 |
Alternative Measures of Disability
| Functional Disability | Work Disability | Perceived Disability | Disability Program Recipient | |
|---|---|---|---|---|
| Children Ages 0-17 | 8.7 | N/A | 2.8 | 6.7 |
| Adults Ages 18-64 | 16.2 | 10.7 | 7.0 | 5.7 |
Note: Functional disability only includes those disabilities expected to last at least 12 months. Functional disabilities were defined as either: (1) limitations in or inability to perform a variety of physical activities (i.e. walking, lifting, reaching); (2) serious sensory impairments (i.e. inability to read newsprint even with glasses or contact lenses); (3) serious symptoms of mental illness (i.e. frequent depression or anxiety; frequent confusion, disorientation, or difficulty remembering) which has seriously interfered with life for the last year; (4) use of selected assistive devices (i.e. wheelchairs, scooters, walkers); (5) developmental delays for children identified by a physician (i.e. physical, learning); (6) for children under 5, inability to perform age-appropriate functions (i.e. sitting up, walking); and, (7) long-term care needs. Work disability is defined as limitations in or the inability to work as a result of a physical, mental or emotional health condition. Perceived disability is a new disability measure based on the Americans with Disabilities Act (ADA) and includes individuals who were perceived by themselves or others as having a disability. Disability program recipients include persons covered by Supplemental Security Income (SSI), Social Security Disability Insurance (SSDI), Special Education Services, Early Intervention Services, and/or disability pensions.
Source: Unpublished data from the 1994 National Health Interview Survey on Disability, Phase I; 1994 NHIS, and 1994 Family Resources Supplement.
Employment and Work-related Risk Factor 8. Children's Health Conditions
Figure WORK 8. Selected Chronic Health Conditions per 1,000 Children Ages 0 to 17: Selected Years
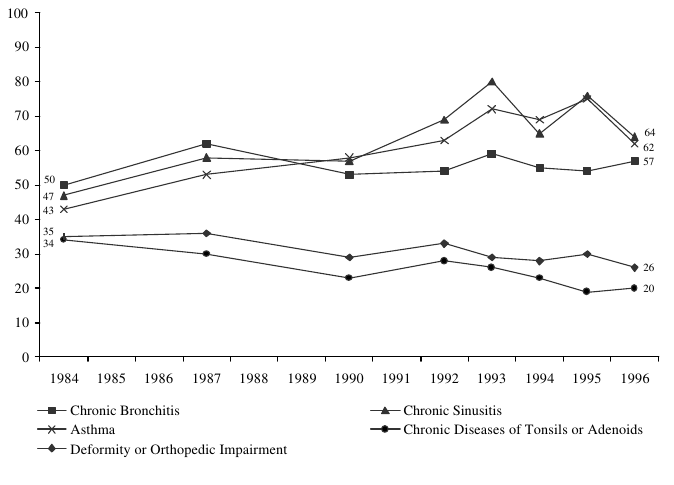
Source: U.S. Department of Health and Human Services, Office of the Assistant Secretary for Planning and Evaluation, Trends in the Well-Being of America’s Children and Youth: 1998. Table HC 2.5.
-
Respiratory conditions, especially chronic sinus itis and asthma, were the most prevalent chronic health conditions experienced in recent years by children.
-
Rates for asthma show some year-to-year variation, but were higher in the mid-1990s (62 to 75 children per thousand) than in the mid-1980s (43 to 53 children per thousand). Like rates for asthma, the prevalence of chronic sinusitis has both increased and showed considerable year-to-year variation.
-
In 1996, 26 children per thousand had a deformity or orthopedic impairment, down from a high of 36 children per thousand in 1987, as shown in Table WORK 8.
-
The rate for heart disease among children has ranged from a low of 18 cases per thousand in
1994 to a high of 24 cases per thousand in 1996, with no clear trend.
Table WORK 8. Selected Chronic Health Conditions per 1,000 Children Ages 0 to 17: Selected Years
| 1984 | 1987 | 1990 | 1992 | 1993 | 1994 | 1995 | 1996 | |
|---|---|---|---|---|---|---|---|---|
| Respiratory Conditions | ||||||||
| Chronic Bronchitis | 50 | 62 | 53 | 54 | 59 | 55 | 54 | 57 |
| Chronic Sinusitis | 47 | 58 | 57 | 69 | 80 | 65 | 76 | 64 |
| Asthma | 43 | 53 | 58 | 63 | 72 | 69 | 75 | 62 |
| Chronic Diseases of Tonsils or Adenoids | 34 | 30 | 23 | 28 | 26 | 23 | 19 | 20 |
| Impairments | ||||||||
| Deformity or Orthopedic Impairment | 35 | 36 | 29 | 33 | 29 | 28 | 30 | 26 |
| Speech Impairment | 16 | 19 | 14 | 21 | 20 | 21 | 18 | 16 |
| Hearing Impairment | 24 | 16 | 21 | 15 | 17 | 18 | 15 | 13 |
| Visual Impairment | 9 | 10 | 9 | 10 | 7 | 9 | 7 | 6 |
| Other Conditions | ||||||||
| Heart Disease | 23 | 22 | 19 | 19 | 20 | 18 | 19 | 24 |
| Anemia | 11 | 8 | 10 | 11 | 9 | 12 | 7 | 5 |
| Epilepsy | 7 | 4 | 4 | 3 | 5 | 5 | 4 | 5 |
Source: U.S. Department of Health and Human Services, Office of the Assistant Secretary for Planning and Evaluation, Trends in the Well-Being of America’s Children and Youth: 1998. Table HC 2.5.
Employment and Work-related Risk Factor 9. Child Care Expenditures
Figure WORK 9. Percentage of Monthly Income Spent on Child Care by Families with Employed Mothers: 1995
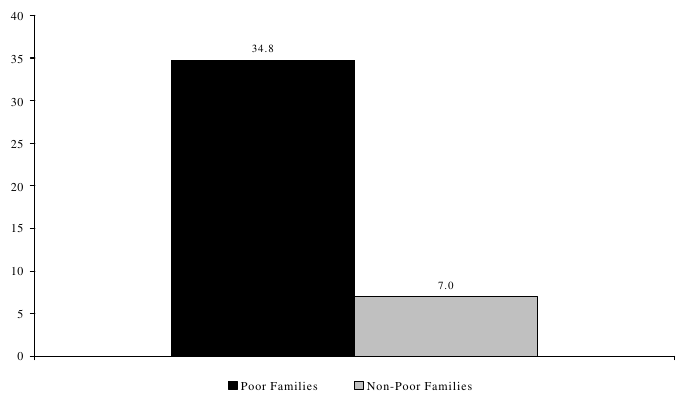
Source: U.S. Bureau of the Census, “Who’s Minding the Kids? Child Care Arrangements: Fall 1995” Current Population Reports, Series P70-70 2000.
-
Child care expenditures accounted for more than one-third (35 percent) of the monthly family income of poor families with employed mothers who used paid arrangements for at least one child under age fifteen in the fall of 1995. Child care expenses accounted for a much smaller share – 7 percent – of monthly income of non-poor families with employed mothers. Across all families, the share is also about 7 percent.
-
As shown in Table WORK 9a, employed single mothers spent a larger percentage of their monthly family income on child care expenses (13 to 14 percent) than did employed married mothers (6 percent).
-
The percentage of family income spent on child care has risen slowly, but steadily, from 6 percent in 1986 to 7 percent in 1995, as shown in Table WORK 9b.
-
Child care expenditures as a percentage of monthly income in poor families with employed mothers has fluctuated in the past several years, from 27 percent in 1991, to 21 percent in 1993 and 35 percent in 1995.
Table WORK 9a. Percentage of Monthly Income Spent on Child Care by Families with Employed Mothers, by Selected Characteristics: 1995
| All Families | 7.4 |
| Racial Categories | |
| Non-Hispanic White | 6.8 |
| Non-Hispanic Black | 8.7 |
| Hispanic | 11.9 |
| Marital Status | |
| Married, Husband Present | 6.4 |
| Widowed, Separated, Divorced | 13.7 |
| Never Married | 13.4 |
| Poverty Status | |
| Below poverty | 34.8 |
| Above poverty | 7.0 |
| 100 to 199 percent of poverty | 16.9 |
| 200 percent and above poverty | 6.2 |
Notes: Based on expenditures for families with children under age fifteen and an employed mother and at least one child in a paid child care arrangement.
Source: U.S. Bureau of the Census, “Who’s Minding the Kids? Child Care Arrangements: Fall 1995,” Current Population Reports, Series P70-70, 2000.
Non-marital Birth Risk Factors
Non-marital Birth Risk Factor 1. Births to Unmarried Women
Figure BIRTH 1. Percentage of Births to Unmarried Women, by Age Group: 1940-1999
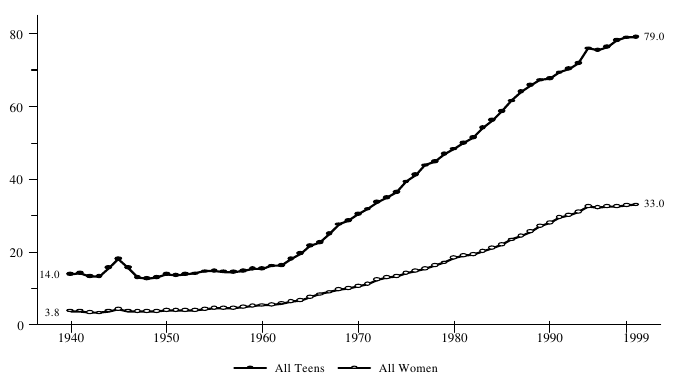
Source: National Center for Health Statistics, “Nonmarital Childbearing in the United States, 1940 - 1999,” National Vital Health Statistics Reports, Vol. 48 (16), 2000; “Births: Final Data for 1998,” National Vital Statistics Reports, Vol. 48(3), 2000; “Births: Final Data for 1999,” National Vital Statistics Reports, Vol. 49(1), 2001.
-
The percentage of children born outside of marriage to women of all ages has increased over the past half-century, from 4 percent in 1940 to 33 percent in 1999. This increase reflects changes in several factors: the rate at which unmarried women have children, the rate at which married women have children, and the rate at which women marry.
-
The percentage of children born outside of marriage is especially high among teen women. Close to four-fifths (79 percent) of all births to teens took place outside of marriage in 1999.
-
After fifty years of growth, the percentage of unmarried births to all women has leveled off since 1994. Growth in the percentage of unmarried births to teen mothers has also slowed since 1994, but it is still rising (from 76 percent in 1994 to 79 percent in 1999).
-
Recently, the percentage of out-of-wedlock births has leveled off among black teens and all black women. Among white teens and all white women, the trend continues upward (see Table C-1 in Appendix C for non-marital birth data by age and race).
Table BIRTH 1. Percentage of Births to Unmarried Women, by Age Group: 1940-1999
| Under 15 | 15-17 Years | 18-19 Years | All Teens | All Women | |
|---|---|---|---|---|---|
| 1940 | 64.5 | N/A | N/A | 14.0 | 3.8 |
| 1941 | 64.1 | N/A | N/A | 14.2 | 3.8 |
| 1942 | 64.5 | N/A | N/A | 13.2 | 3.4 |
| 1943 | 64.2 | N/A | N/A | 13.4 | 3.3 |
| 1944 | 64.5 | N/A | N/A | 15.7 | 3.8 |
| 1945 | 70.0 | N/A | N/A | 18.2 | 4.3 |
| 1946 | 66.4 | N/A | N/A | 15.7 | 3.8 |
| 1947 | 65.1 | N/A | N/A | 13.0 | 3.6 |
| 1948 | 61.4 | 20.8 | 8.5 | 12.7 | 3.7 |
| 1949 | 61.8 | 21.1 | 8.6 | 12.9 | 3.7 |
| 1950 | 63.7 | 22.6 | 9.4 | 13.9 | 4.0 |
| 1951 | 62.9 | 21.8 | 9.1 | 13.5 | 3.9 |
| 1952 | 63.6 | 22.8 | 9.2 | 14.0 | 3.9 |
| 1953 | 64.0 | 22.3 | 9.6 | 14.1 | 4.1 |
| 1954 | 64.4 | 23.2 | 10.1 | 14.7 | 4.4 |
| 1955 | 66.3 | 23.2 | 10.3 | 14.9 | 4.5 |
| 1956 | 66.1 | 23.0 | 10.0 | 14.6 | 4.6 |
| 1957 | 66.1 | 23.1 | 9.8 | 14.5 | 4.7 |
| 1958 | 66.2 | 23.3 | 10.3 | 14.9 | 5.0 |
| 1959 | 67.9 | 24.2 | 10.6 | 15.4 | 5.2 |
| 1960 | 67.8 | 24.0 | 10.7 | 15.4 | 5.3 |
| 1961 | 69.7 | 25.3 | 11.3 | 16.2 | 5.6 |
| 1962 | 69.5 | 26.7 | 11.3 | 16.4 | 5.9 |
| 1963 | 71.1 | 28.2 | 12.5 | 18.0 | 6.3 |
| 1964 | 74.2 | 29.9 | 13.5 | 19.7 | 6.8 |
| 1965 | 78.5 | 32.8 | 15.3 | 21.6 | 7.7 |
| 1966 | 76.3 | 35.3 | 16.1 | 22.6 | 8.4 |
| 1967 | 80.3 | 37.7 | 18.0 | 25.0 | 9.0 |
| 1968 | 81.0 | 40.4 | 20.1 | 27.6 | 9.7 |
| 1969 | 79.3 | 41.3 | 21.1 | 28.7 | 10.0 |
| 1970 | 80.8 | 43.0 | 22.4 | 30.5 | 10.7 |
| 1971 | 82.1 | 44.5 | 23.2 | 31.8 | 11.3 |
| 1972 | 81.9 | 45.9 | 24.7 | 33.8 | 12.4 |
| 1973 | 84.8 | 46.7 | 25.6 | 35.0 | 13.0 |
| 1974 | 84.6 | 48.3 | 27.0 | 36.4 | 13.2 |
| 1975 | 87.0 | 51.4 | 29.8 | 39.3 | 14.2 |
| 1976 | 86.4 | 54.0 | 31.6 | 41.2 | 14.8 |
| 1977 | 88.2 | 56.6 | 34.4 | 43.8 | 15.5 |
| 1978 | 87.3 | 57.5 | 36.2 | 44.9 | 16.3 |
| 1979 | 88.8 | 60.0 | 38.1 | 46.9 | 17.1 |
| 1980 | 88.7 | 61.5 | 39.8 | 48.3 | 18.4 |
| 1981 | 89.2 | 63.3 | 41.4 | 49.9 | 18.9 |
| 1982 | 89.2 | 65.0 | 43.0 | 51.4 | 19.4 |
| 1983 | 90.4 | 67.5 | 45.7 | 54.1 | 20.3 |
| 1984 | 91.1 | 69.2 | 48.1 | 56.3 | 21.0 |
| 1985 | 91.8 | 70.9 | 50.7 | 58.7 | 22.0 |
| 1986 | 92.5 | 73.3 | 53.6 | 61.5 | 23.4 |
| 1987 | 92.9 | 75.8 | 56.0 | 64.0 | 24.5 |
| 1988 | 93.6 | 77.1 | 58.5 | 65.9 | 25.7 |
| 1989 | 92.4 | 77.7 | 60.4 | 67.2 | 27.1 |
| 1990 | 91.6 | 77.7 | 61.3 | 67.6 | 28.0 |
| 1991 | 91.3 | 78.7 | 63.2 | 69.3 | 29.5 |
| 1992 | 91.3 | 79.2 | 64.6 | 70.5 | 30.1 |
| 1993 | 91.3 | 79.9 | 66.1 | 71.8 | 31.0 |
| 1994 | 94.5 | 84.1 | 70.0 | 75.9 | 32.6 |
| 1995 | 93.5 | 83.7 | 69.8 | 75.6 | 32.2 |
| 1996 | 93.8 | 84.4 | 70.8 | 76.3 | 32.4 |
| 1997 | 95.7 | 86.7 | 72.5 | 78.2 | 32.4 |
| 1998 | 96.6 | 87.5 | 73.6 | 78.9 | 32.8 |
| 1999 | 96.5 | 87.7 | 74.0 | 79.0 | 33.0 |
Note: Trends in non-marital births may be affected by changes in the reporting of marital status on birth certificates and in procedures for inferring non-marital births when marital statue is not reported.
Source: National Center for Health Statistics, “Nonmarital Childbearing in the United States, 1940 - 1999,” National Vital Health Statistics Reports, Vol. 48 (16), 2000; National Center for Health Statistics, “Births: Final Data for 1998,” National Vital Statistics Reports, Vol. 48(3), 2000; National Center for Health Statistics, “Births: Preliminary Data for 1999,” National Vital Statistics Reports, Vol. 48(14), 2000.
Non-marital Birth Risk Factor 2. Births to Unmarried Teens
Figure BIRTH 2. Percentage of All Births to Unmarried Teens Ages 15 to 19, by Race: 1940-1999
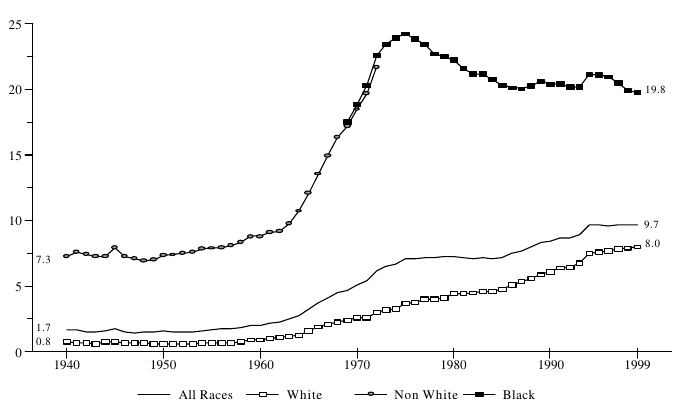
Source: National Center for Health Statistics, “Nonmarital Childbearing in the United States, 1940 - 1999,” National Vital Health Statistics Reports, Vol. 48 (16), 2000; “Births: Final Data for 1998,” National Vital Statistics Reports, Vol. 48(3), 2000; “Births: Final Data for 1999,” National Vital Statistics Reports, Vol. 49(1), 2001.
-
In contrast to Figure BIRTH 1, which showed births to unmarried teens as a percentage of all teen births, Figure BIRTH 2 shows births to unmarried teens as a percentage of births to all women. This percentage has risen over time, from just under 2 percent in 1940 to just under 10 percent in 1999. It may be affected by several factors: the age distribution of the population, the marriage rate among teens, the birth rate among unmarried teens, and the birth rate among all other women.
-
Between 1960 and 1999, the percentage of all births that were to unmarried teens trended upward among white women, from less than 1 percent in 1960 to 8 percent in 1999.
-
Among black women, the percentage of all births that were to unmarried teens varied greatly during the same period, rising sharply to a peak of 24 percent in 1975, and showing a gradual decline in most years since then. The rate fell to 20 percent in 1999, the lowest percentage since 1970. The sharp increase in the late 1960s and early 1970s reflects a rise in non-marital teen births concurrent with a decline in total black births.
Table BIRTH 2. Percentage of All Births to Unmarried Teens Ages 15 to 19, by Race: 1940-1999
| All Races | White | Black | |
|---|---|---|---|
| 1940 | 1.7 | 0.8 | N/A |
| 1941 | 1.7 | 0.7 | N/A |
| 1942 | 1.5 | 0.7 | N/A |
| 1943 | 1.5 | 0.6 | N/A |
| 1944 | 1.6 | 0.8 | N/A |
| 1945 | 1.8 | 0.8 | N/A |
| 1946 | 1.5 | 0.7 | N/A |
| 1947 | 1.4 | 0.7 | N/A |
| 1948 | 1.5 | 0.7 | N/A |
| 1949 | 1.5 | 0.6 | N/A |
| 1950 | 1.6 | 0.6 | N/A |
| 1951 | 1.5 | 0.6 | N/A |
| 1952 | 1.5 | 0.6 | N/A |
| 1953 | 1.6 | 0.6 | N/A |
| 1954 | 1.7 | 0.7 | N/A |
| 1955 | 1.7 | 0.7 | N/A |
| 1956 | 1.7 | 0.7 | N/A |
| 1957 | 1.8 | 0.7 | N/A |
| 1958 | 1.9 | 0.8 | N/A |
| 1959 | 2.0 | 0.9 | N/A |
| 1960 | 2.0 | 0.9 | N/A |
| 1961 | 2.2 | 1.0 | N/A |
| 1962 | 2.3 | 1.1 | N/A |
| 1963 | 2.5 | 1.2 | N/A |
| 1964 | 2.8 | 1.3 | N/A |
| 1965 | 3.3 | 1.6 | N/A |
| 1966 | 3.8 | 1.9 | N/A |
| 1967 | 4.1 | 2.1 | N/A |
| 1968 | 4.5 | 2.3 | N/A |
| 1969 | 4.7 | 2.4 | 17.5 |
| 1970 | 5.1 | 2.6 | 18.8 |
| 1971 | 5.5 | 2.6 | 20.3 |
| 1972 | 6.2 | 3.0 | 22.6 |
| 1973 | 6.5 | 3.2 | 23.4 |
| 1974 | 6.7 | 3.3 | 23.9 |
| 1975 | 7.1 | 3.7 | 24.2 |
| 1976 | 7.1 | 3.8 | 23.8 |
| 1977 | 7.2 | 4.0 | 23.4 |
| 1978 | 7.2 | 4.0 | 22.7 |
| 1979 | 7.2 | 4.1 | 22.5 |
| 1980 | 7.3 | 4.4 | 22.2 |
| 1981 | 7.1 | 4.5 | 21.5 |
| 1982 | 7.1 | 4.5 | 21.2 |
| 1983 | 7.2 | 4.6 | 21.2 |
| 1984 | 7.1 | 4.6 | 20.7 |
| 1985 | 7.2 | 4.8 | 20.3 |
| 1986 | 7.5 | 5.1 | 20.1 |
| 1987 | 7.7 | 5.3 | 20.0 |
| 1988 | 8.0 | 5.6 | 20.3 |
| 1989 | 8.3 | 5.9 | 20.6 |
| 1990 | 8.4 | 6.1 | 20.4 |
| 1991 | 8.7 | 6.4 | 20.4 |
| 1992 | 8.7 | 6.5 | 20.2 |
| 1993 | 8.9 | 6.8 | 20.2 |
| 1994 | 9.7 | 7.5 | 21.1 |
| 1995 | 9.6 | 7.6 | 21.1 |
| 1996 | 9.6 | 7.7 | 20.9 |
| 1997 | 9.7 | 7.8 | 20.5 |
| 1998 | 9.7 | 7.9 | 19.9 |
| 1999 | 9.7 | 8.0 | 19.8 |
Note: Trends in non-marital births may be affected by changes in the reporting of marital status on birth certificates and in procedures for inferring non-marital births when marital statue is not reported. Beginning in 1980, data are tabulated by the race of the mother. Prior to 1980, data are tabulated by the race of the child. White and black include those of Hispanic origin for all years. Rates for 1981-1989 have been revised and differ, therefore, from rates published in Vital Statistics in the United States, Vol. 1, Natality, for 1991 and earlier years.
Source: National Center for Health Statistics, “Nonmarital Childbearing in the United States, 1940 - 1999,” National Vital Health Statistics Reports, Vol. 48 (16), 2000; National Center for Health Statistics, “Births: Final Data for 1998,” National Vital Statistics Reports, Vol. 48(3), 2000; National Center for Health Statistics, “Births: Preliminary Data for 1999,” National Vital Statistics Reports, Vol. 48(14), 2000.
Non-marital Birth Risk Factor 3. Unmarried Teen Birth Rates Within Age Groups
Figure BIRTH 3a. Births per 1,000 Unmarried Teens Ages 15 to 17, by Race: 1960-1999
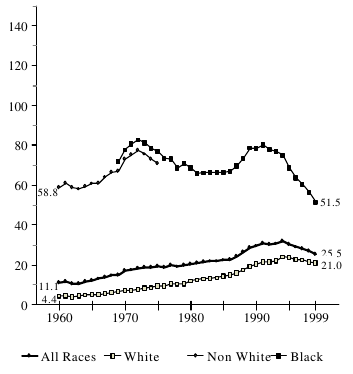
Figure BIRTH 3b. Births per 1,000 Unmarried Teens Ages 18 and 19, by Race: 1960-1999
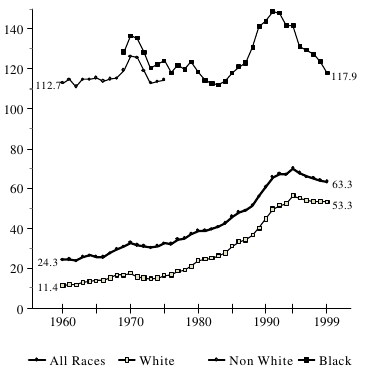
Source: National Center for Health Statistics, “Nonmarital Childbearing in the United States, 1940 - 1999,” National Vital Health Statistics Reports, Vol. 48 (16), 2000; “Births: Final Data for 1998,” National Vital Statistics Reports, Vol. 48(3), 2000; “Births: Final Data for 1999,” National Vital Statistics Reports, Vol. 49(1), 2001.
-
The birth rate per 1,000 unmarried teens fell between 1994 and 1999 for both black and white teens and for both younger (15 to 17 years) and older age groups (18 and 19 years). The rate for black teens 18 and 19, for example, fell from 142 per 1,000 to 118 per 1,000. Declines were larger among black teens than among white teens.
-
Prior to 1994, birth rates among unmarried white teens in both age groups rose steadily for nearly three decades (4 to 24 percent among 15 to 17 year-olds and 11 to 56 percent among 18 and 19 year-olds).
-
Among unmarried black teens in both age groups, birth rates varied greatly over the period, reaching peaks in both the early 1970s and early 1990s. Rates for both age groups were lower in 1999 than in 1969. While birth rates among unmarried black teens remain high compared to rates for unmarried white teens, the gap been black and white teens narrowed considerably during the 1990s.
Table BIRTH 3. Births per 1,000 Unmarried Teen Women Within Age Groups, by Race: 1960-1999
| Ages 15-17 | Ages 18 and 19 | |||||
|---|---|---|---|---|---|---|
| All Races | White | Black | All Races | White | Black | |
| 1960 | 11.1 | 4.4 | N/A | 24.3 | 11.4 | N/A |
| 1961 | 11.7 | 4.6 | N/A | 24.6 | 12.1 | N/A |
| 1962 | 10.7 | 4.1 | N/A | 23.8 | 11.7 | N/A |
| 1963 | 10.9 | 4.5 | N/A | 25.8 | 13.0 | N/A |
| 1964 | 11.6 | 4.9 | N/A | 26.5 | 13.6 | N/A |
| 1965 | 12.5 | 5.0 | N/A | 25.8 | 13.9 | N/A |
| 1966 | 13.1 | 5.4 | N/A | 25.6 | 14.1 | N/A |
| 1967 | 13.8 | 5.6 | N/A | 27.6 | 15.3 | N/A |
| 1968 | 14.7 | 6.2 | N/A | 29.6 | 16.6 | N/A |
| 1969 | 15.2 | 6.6 | 72.0 | 30.8 | 16.6 | 128.4 |
| 1970 | 17.1 | 7.5 | 77.9 | 32.9 | 17.6 | 136.4 |
| 1971 | 17.5 | 7.4 | 80.7 | 31.7 | 15.8 | 135.2 |
| 1972 | 18.5 | 8.0 | 82.8 | 30.9 | 15.1 | 128.2 |
| 1973 | 18.7 | 8.4 | 81.2 | 30.4 | 14.9 | 120.5 |
| 1974 | 18.8 | 8.8 | 78.6 | 31.2 | 15.3 | 122.2 |
| 1975 | 19.3 | 9.6 | 76.8 | 32.5 | 16.5 | 123.8 |
| 1976 | 19.0 | 9.7 | 73.5 | 32.1 | 16.9 | 117.9 |
| 1977 | 19.8 | 10.5 | 73.0 | 34.6 | 18.7 | 121.7 |
| 1978 | 19.1 | 10.3 | 68.8 | 35.1 | 19.3 | 119.6 |
| 1979 | 19.9 | 10.8 | 71.0 | 37.2 | 21.0 | 123.3 |
| 1980 | 20.6 | 12.0 | 68.8 | 39.0 | 24.1 | 118.2 |
| 1981 | 20.9 | 12.6 | 65.9 | 39.0 | 24.6 | 114.2 |
| 1982 | 21.5 | 13.1 | 66.3 | 39.6 | 25.3 | 112.7 |
| 1983 | 22.0 | 13.6 | 66.8 | 40.7 | 26.4 | 111.9 |
| 1984 | 21.9 | 13.7 | 66.5 | 42.5 | 27.9 | 113.6 |
| 1985 | 22.4 | 14.5 | 66.8 | 45.9 | 31.2 | 117.9 |
| 1986 | 22.8 | 14.9 | 67.0 | 48.0 | 33.5 | 121.1 |
| 1987 | 24.5 | 16.2 | 69.9 | 48.9 | 34.5 | 123.0 |
| 1988 | 26.4 | 17.6 | 73.5 | 51.5 | 36.8 | 130.5 |
| 1989 | 28.7 | 19.3 | 78.9 | 56.0 | 40.2 | 140.9 |
| 1990 | 29.6 | 20.4 | 78.8 | 60.7 | 44.9 | 143.7 |
| 1991 | 30.9 | 21.8 | 80.4 | 65.7 | 49.6 | 148.7 |
| 1992 | 30.4 | 21.6 | 78.0 | 67.3 | 51.5 | 147.8 |
| 1993 | 30.6 | 22.1 | 76.8 | 66.9 | 52.4 | 141.6 |
| 1994 | 32.0 | 24.1 | 75.1 | 70.1 | 56.4 | 141.6 |
| 1995 | 30.5 | 23.6 | 68.6 | 67.6 | 55.4 | 131.2 |
| 1996 | 29.0 | 22.7 | 64.0 | 65.9 | 54.1 | 129.2 |
| 1997 | 28.2 | 22.4 | 60.6 | 65.2 | 53.6 | 127.2 |
| 1998 | 27.0 | 21.8 | 56.5 | 64.2 | 53.5 | 123.5 |
| 1999 | 25.5 | 21.0 | 51.5 | 63.3 | 53.3 | 117.9 |
Note: Rates are per 1,000 unmarried women in specified group. Trends in non-marital births may be affected by changes in the reporting of marital status on birth certificates and in procedures for inferring non-marital births when marital statue is not reported. Beginning in 1980, data are tabulated by the race of the mother. Prior to 1980, data are tabulated by the race of the child. White and black include those of Hispanic origin for all years. Rates for 1981-1989 have been revised and differ, therefore, from rates published in Vital Statistics in the United States, Vol. 1, Natality, for 1991 and earlier years.
Source: See Figures BIRTH 3a and BIRTH 3b.
Non-marital birth risk factor 4. Never-married family status
Figure BIRTH 4. Percentage of All Children Living in Families with a Never-Married Female Head, by Race: 1982-2000
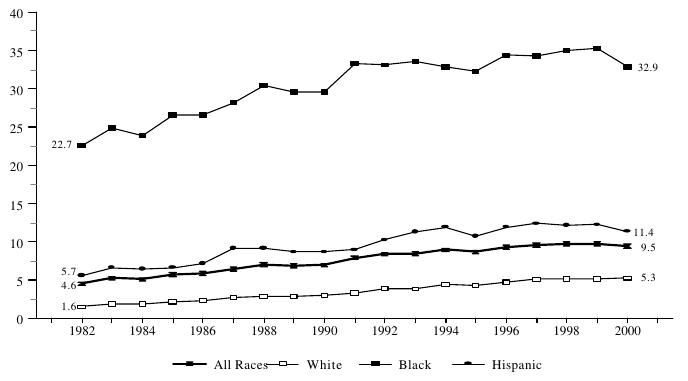
Source of CPS data: U.S. Bureau of the Census, “Marital Status and Living Arrangements,” Current Population Reports, Series P20-212, 287, 365, 380, 399, 418, 423, 433, 445, 450, 461, 468, 478, 484, 491, 496, 506, 514, various years, and ASPE tabulations of the 1999 and 2000 CPS.
Source of 1960 data: U.S. Bureau of the Census, 1960 Census of Population, PC(2)-4B, “Persons by Family Characteristics,” tables 1 and 19.
-
The percentage of children living in families with never-married female heads increased from under 5 percent in 1982 to nearly 10 percent in 2000.
-
The percentage of white children living in families headed by never-married women has continued to rise over the past twenty years, from less than 2 percent in 1982 to over 5 percent in 2000.
-
Among Hispanics, the percentage of children living with never-married female heads more than doubled over the past sixteen years, going from less than 6 percent in 1982 to more than 12 percent in 1997. In 2000, the percentage dropped nearly a full point.
-
The percentage of black children living in families headed by never-married women was much higher than the percentages for other groups throughout the time period. However, the percentage dropped from 35 to 33 percent in the past year.
Table BIRTH 4. Number and Percentage of All Children Living in Families with a Never-Married Female Head, by Race: Selected Years
| Numberof Children (in thousands) | Percentage | |||||||
|---|---|---|---|---|---|---|---|---|
| All Races | White | Black | Hispanic | All Races | White | Black | Hispanic | |
| 1960 | 221 | 49 | 173 | – | 0.4 | 0.1 | 2.2 | – |
| 1970 | 527 | 110 | 442 | – | 0.8 | 0.2 | 5.2 | – |
| 1975 | 1,166 | 296 | 864 | – | 1.8 | 0.5 | 9.9 | – |
| 1980 | 1,745 | 501 | 1,193 | 210 | 2.9 | 1.0 | 14.5 | 4.0 |
| 1982 | 2,768 | 793 | 1,947 | 291 | 4.6 | 1.6 | 22.7 | 5.7 |
| 1984 | 3,131 | 959 | 2,109 | 357 | 5.2 | 1.9 | 23.9 | 6.5 |
| 1986 | 3,606 | 1,174 | 2,375 | 451 | 5.9 | 2.3 | 26.6 | 7.2 |
| 1987 | 3,985 | 1,385 | 2,524 | 587 | 6.5 | 2.8 | 28.2 | 9.2 |
| 1988 | 4,302 | 1,482 | 2,736 | 600 | 7.0 | 3.0 | 30.4 | 9.2 |
| 1989 | 4,290 | 1,483 | 2,695 | 592 | 6.9 | 2.9 | 29.6 | 8.7 |
| 1990 | 4,365 | 1,527 | 2,738 | 605 | 7.0 | 3.0 | 29.6 | 8.7 |
| 1991 | 5,040 | 1,725 | 3,176 | 644 | 8.0 | 3.4 | 33.3 | 9.0 |
| 1992 | 5,410 | 2,016 | 3,192 | 757 | 8.4 | 3.9 | 33.1 | 10.3 |
| 1993 | 5,511 | 2,015 | 3,317 | 848 | 8.5 | 3.9 | 33.6 | 11.3 |
| 1994 | 6,000 | 2,412 | 3,321 | 1,083 | 9.0 | 4.5 | 32.9 | 12.0 |
| 1995 | 5,862 | 2,317 | 3,255 | 1,017 | 8.7 | 4.3 | 32.3 | 10.8 |
| 1996 | 6,365 | 2,563 | 3,567 | 1,161 | 9.4 | 4.8 | 34.4 | 12.0 |
| 1997 | 6,598 | 2,788 | 3,575 | 1,242 | 9.7 | 5.1 | 34.3 | 12.4 |
| 1998 | 6,700 | 2,850 | 3,644 | 1,254 | 9.8 | 5.2 | 35.1 | 12.2 |
| 1999 | 6,759 | 2,841 | 3,652 | 1,310 | 9.8 | 5.2 | 35.3 | 12.3 |
| 2000 | 6,591 | 2,881 | 3,413 | 1,256 | 9.5 | 5.3 | 32.9 | 11.4 |
Note: Data are for all children under 18 who are not family heads (excludes householders, subfamily reference persons, and their spouses). Also excludes inmates of institutions; children who are living with neither of their parents are excluded from the denominator. Based on Current Population Survey (CPS) except 1960, 1970, and 1980, which are based on decennial census data. Nonwhite data are shown for Black in 1960. In 1982, improved data collection and processing procedures helped to identify parent-child subfamilies. (See Current Population Reports, P-20, 399, Marital Status and Living Arrangements: March 1984.)
Source of CPS data: U.S. Bureau of the Census, “Marital Status and Living Arrangements,” Current Population Reports, Series P20-212, 287, 365, 380, 399, 418, 423, 433, 445, 450, 461, 468, 478, 484, 491, 496, 506, 514, various years, and ASPE tabulations of the 1999 and 2000 CPS.
Source of 1960 data: U.S. Bureau of the Census, 1960 Census of Population, PC(2)-4B, “Persons by Family Characteristics,” tables 1 and 19.
Appendix A: Program Data
The Welfare Indicators Act of 1994 specifies that the annual welfare indicators reports shall include analyses of families and individuals receiving assistance under three means-tested benefit programs: the Aid to Families with Dependent Children (AFDC) program authorized under part A of title IV of the Social Security Act (replaced with the Temporary Assistance for Needy Families (TANF) program by the Personal Responsibility and Work Opportunity Reconciliation Act of 1996), the Food Stamp Program under the Food Stamp Act of 1977, as amended, and the Supplemental Security Income (SSI) program under title XVI of the Social Security Act. This chapter includes information on these three programs, derived primarily from administrative data reported by state and federal agencies instead of the national survey data presented in previous chapters. National caseloads and expenditure trend information on each of the three programs is included, as well as state-by-state trend tables on each program and information on the characteristics of participants in each program.
Aid to Families with Dependent Children (AFDC) and Temporary Assistance for Needy Families (TANF)
Aid to Families with Dependent Children (AFDC) was established by the Social Security Act of 1935 as a grant program to enable states to provide cash welfare payments for needy children who had been deprived of parental support or care because their father or mother is absent from the home, incapacitated, deceased, or unemployed. All 50 states, the District of Columbia, Guam, Puerto Rico, and the Virgin Islands operated an AFDC program. States defined “need,” set their own benefit levels, established (within federal limitations) income and resource limits, and administered the program or supervised its administration. States were entitled to unlimited federal funds for reimbursement of benefit payments, at “matching” rates which were inversely related to state per capita income. States were required to provide aid to all persons who were in classes eligible under federal law and whose income and resources were within state-set limits.
During the 1990s, the federal government increasingly used its authority under Section 1115 of the Social Security Act to waive portions of the federal requirements under AFDC. This allowed states to test such changes as expanded earned income disregards, increased work requirements and stronger sanctions for failure to comply with them, time limits on benefits, and expanded access to transitional benefits such as child care and medical assistance. As a condition of receiving waivers, states were required to conduct rigorous evaluations of the impacts of these changes on the welfare receipt, employment, and earnings of participants.
The Personal Responsibility and Work Opportunity Reconciliation Act of 1996 (PRWORA) replaced AFDC, the Job Opportunities and Basic Skills Training (JOBS) program and the Emergency Assistance (EA) program with a cash welfare block grant called the Temporary Assistance for Needy Families (TANF) program. Key elements of TANF include a lifetime limit of five years (60 months) on the amount of time a family with an adult can receive assistance funded with federal funds, increasing work participation rate requirements which states must meet, and broad state flexibility on program design. Spending through the TANF block grant is capped and funded at $16.4 billion per year, slightly above fiscal year 1995 federal expenditures for the four component programs. States must also meet a “maintenance of effort (MOE) requirement” by spending on needy families at least 75 percent of the amount of state funds used in FY 1994 on these programs (80 percent if they fail work participation rate requirements).
TANF gives states wide latitude in spending both Federal TANF funds and state MOE funds. Subject to a few restrictions, TANF funds may be used in any way that supports one of the four statutory purposes of TANF: to provide assistance to needy families so that children can be cared for at home; to end the dependence of needy parents on government benefits by promoting job preparation, work and marriage; to prevent and reduce the incidence of out-of-wedlock pregnancies; and to encourage the formation and maintenance of two-parent families.
Data Issues Relating to the AFDC-TANF Transition
States had the option of beginning their TANF programs as soon as PRWORA was enacted in August 1996, and a few states began TANF programs as early as September 1996. All states were required to implement TANF by July 1, 1997. Because states implemented TANF at different times, the FY 1997 data reflects a combination of the AFDC and TANF programs. In some states, limited data are available for FY 1997 because states were given a transition period of six months after they implemented TANF before they were required to report data on the characteristics and work activities of TANF participants.
Because of the greatly expanded range of activities allowed under TANF, a substantial portion of TANF funds will be spent on activities other than cash payments to families. When tracking overall expenditure trends, the tables in this Appendix (e.g., Table TANF 3) include only those TANF funds spent on “cash and work-based assistance” and “administrative costs,” not on work activities, supportive services, or other allowable uses of funds. Spending on these other activities is detailed in Table TANF 5. Note that TANF administrative costs include funds spent administering all activities, not just cash and work-based assistance. (Administrative costs under AFDC had included a small amount of funds for administering AFDC child care programs; such programs, and the costs of administering them, have now been transferred to the Child Care and Development Fund as part of PRWORA).
There also is potential for discontinuity between the AFDC and the TANF caseload figures. One program change is that there is no longer a separate “Unemployed Parent” program under TANF. While a separate work participation rate is calculated for two-parent families, this population is not identical to the UP caseload under AFDC. Moreover, it is possible that a limited number of families will be considered recipients of TANF assistance, even if they do not receive a monthly cash benefit. At present, the vast majority of families receiving “assistance”[1] are, in fact, receiving cash payments; however, this may change over time.
AFDC/TANF Program Data
The following tables and figures present data on caseloads, expenditures, recipient characteristics of the AFDC and TANF programs. Trends in national caseloads and expenditures are shown in Figure TANF 1 and the first set of tables (Tables TANF 1-6). These are followed by information on characteristics of AFDC/TANF families (Table TANF 7) and a series of tables presenting state-by-state data on trends in the AFDC/TANF program (Tables TANF 8-13). These data complement the data on trends in AFDC recipiency and participation rates shown in Tables IND 4a and IND 5a in Chapter II.
AFDC/TANF Caseload Trends (Figure TANF 1, Tables TANF 1-2). Welfare caseloads have declined dramatically during the past several years. Welfare caseloads peaked at record highs in 1994, when 14.2 million recipients in over 5 million families received AFDC benefits each month. Since then, the welfare caseload has fallen by 8.3 million recipients to 5.8 million recipients in June 2000, a drop of 59 percent. This is the largest welfare caseload decline in history and the smallest number of people on welfare since 1968, and the lowest percentage of the population on welfare since 1965.
As shown in Figure TANF 1, AFDC caseloads generally tended to increase in times of economic recession and decline in times of economic growth. The recent decline, however, has far outstripped that experienced in any previous period.
Several studies have attempted to explain the unprecedented decline in caseloads, and specifically, to disentangle the effects of PRWORA and welfare reform from the simultaneous growth in the U.S. economy. Separating these effects is difficult, because PRWORA was enacted at a time when the economy was expanding dramatically, offering a uniquely conducive environment within which to move many welfare recipients off the rolls and into the labor market. Other policy changes, most notably expansions in the Earned Income Tax credit, add further complexity.
In general, studies have found that both economic conditions and welfare reform policies have played important roles in the recent caseload decline. A review of a dozen studies concluded that roughly 15 to 30 percent of the caseload decline prior to 1996 was attributed by most studies to welfare policies under waivers to the AFDC rules with approximately 30 to 45 percent of the decline explained by economic conditions (Schoeni and Blank, 2000). A study by the Council of Economic Advisors (1999) of the post-PRWORA period finds that just over one-third of caseload decline can be explained by welfare reform policy, while 8 to 10 percent is due to the economy. In addition to general labor market conditions, the effects of economic policy post-1996 (namely increases in the minimum wage) explain another 10 to 16 percent of the caseload drop. In both periods, a large portion of the welfare decline is not explained by the examined variables. Possible factors that could account for this additional decline include the expansions of the Earned Income Tax Credit (EITC) and changing cultural perceptions of welfare receipt.
Recent studies using different modeling techniques and a wider range of outcomes find that the economy may be even more important in the post-1996 period than previously thought. For example, one study finds that while TANF does have a very strong effect on post-1996 caseload decreases, the economy has a stronger effect than does TANF on trends in work, hours and earnings during the same period.
The full effect of a robust economy is difficult to capture, partly because most econometric models cannot measure the true interaction between welfare reform and concurrent economic conditions. The existing models also do not measure precisely the separate effects of additional policy enhancements to make work pay -- such as expansions in EITC, SCHIP/Medicaid, child care, transportation and housing subsidies -- which have occurred over the same period.
AFDC/TANF Expenditures (Tables TANF 3-6 and Figure TANF 2). Tables TANF 3, 4 and 5 show trends in expenditures on AFDC and TANF. Table TANF 3 tracks both programs, breaking out the costs of benefits and administrative expenses. It also shows the division between federal and state spending. Table TANF 4 breaks out the benefits paid under the single parent or “basic” program and the Unemployed Parent (UP) program, and also nets out the value of child support collected on behalf of recipient children, but retained by the state to reimburse welfare expenditures. This table presents data through 1996 only, because the TANF data reporting requirements do not require that caseload data be separated into “basic” and “UP” components. Table TANF 5 shows the variety of activities funded under the TANF program.
Figure TANF 2 and Table TANF 6 shows that inflation has had a significant effect in eroding the value of the average monthly AFDC/TANF benefit. In real dollars, the average monthly benefit per recipient in 1998 was only 65 percent of what it was at its peak in the late 1970s. The benefit per person increased in 1999, however, reaching $156 per month. This level was $20 higher than in 1998, but still below the real value of benefits in the 1970s, 1980s and early 1990s.
AFDC/TANF Recipient Characteristics (Table TANF 7). With the dramatic declines in the welfare rolls since the implementation of TANF, there has been a great deal of speculation regarding how the composition of the caseload has changed. Two striking trends are the increases in the proportion of child-only cases and in employment among adult recipients.
One of the most dramatic trends is the recent jump in the proportion of adult recipients who are working. In FY 1999, 28 percent of TANF adult recipients were employed, up from 11 percent in FY 1996 and 7 percent in FY 1990. Similar trends are shown in data on income from earnings. These trends likely reflect positive effects of welfare-to-work programs, the strong economy, and the fact that, with larger earnings disregards, families with earnings do not exit welfare as rapidly. In addition, the increased employment of welfare recipients is consistent with broader trends in labor force participation among mothers with young children. Among single mothers with children under six and family income below 200 percent of the Federal poverty level, for example, the employment rate increased from 35 percent in 1992 to 55 percent in 1999. In addition, employment rates for white, black, and Hispanic women ages 18 to 65 with no more than a high school education were at all-time highs in 1999 (as shown in WORK 2 in Chapter III).
Another dramatic change in the caseload is the increasing fraction of child-only cases. Child only cases have climbed from 11.6 percent of the caseload in FY 1990 to 29.1 percent in FY 1999. This dramatic growth has been due to both the overall decline in the number of adult-present cases as well as an increase in the number of child-only cases. Child-only cases are generally not subject to the work requirements or time limits under TANF.
In other areas, the administrative data show fewer changes in composition than might have been expected. There has been widespread anecdotal evidence that the most job ready recipients -- those with the fewest barriers to employment -- have already exited the welfare caseload and have stopped coming onto the welfare rolls, leaving a more disadvantaged population remaining. However, as the expectations for welfare recipients have increased, and fewer recipients are totally exempted from work requirements, others have speculated that the most disadvantaged recipients may also have been sanctioned off the rolls or terminated for failure to comply with administrative requirements. In fact, analyses of program data have not found much evidence of an increase or decline in readily observed barriers to employment in the current caseload.
The question of whether the caseload has become more disadvantaged cannot be answered simply through administrative data provided by the states, which do not contain detailed information on such barriers to employment as lack of basic skills, alcohol and drug abuse, domestic violence, and disabilities. A few recent studies have found very high levels of these barriers among the TANF population. These studies have also found that the effects of these barriers are interactive; while any one barrier to employment can often be overcome, the more barriers a recipient faces, the less likely she is to find a job and maintain consistent employment over a period of time.
AFDC/TANF State-by-State Trends (Tables TANF 8-14). There is a great deal of state-to-state variation in the trends discussed above. For example, as shown in Table TANF 10, while every state has experienced a caseload decline since 1993, the percentage change between the state’s caseload peak and June 2000 ranges from 92 percent (Wyoming) to 29 percent (Rhode Island). Seven states have experienced caseload declines of 75 percent or more. Table TANF 10 also shows that states reached their peak caseloads as early as May 1990 (Louisiana) and as late as May 1995 (Maryland).
Figure TANF 1. AFDC/TANF Families Receiving Income Assistance
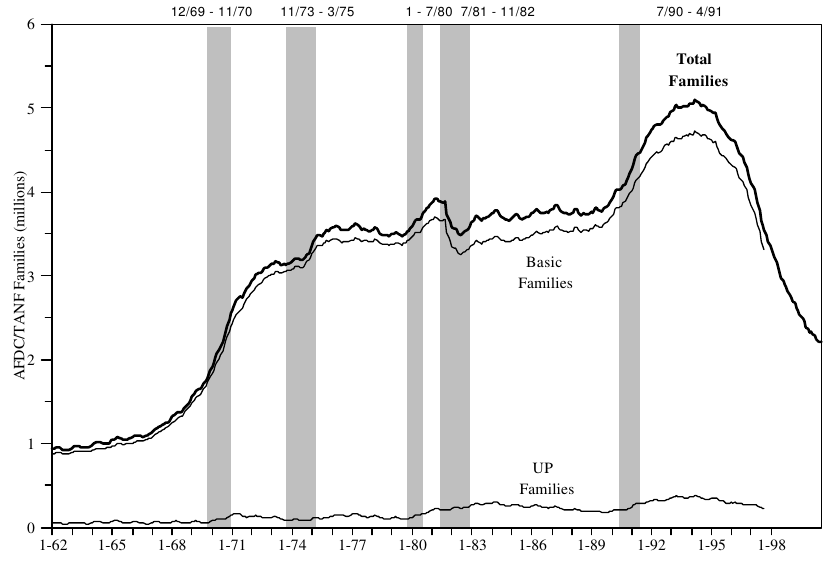
Note: “Basic families” are single-parent families and “UP families” are two-parent cases receiving benefits under AFDC Unemployed Parent programs that operated in certain states before FY 1991 and in all states after October 1, 1990. The AFDC Basic and UP programs were replaced by TANF as of July 1, 1997 under the Personal Responsibility and Work Opportunity Reconciliation Act of 1996. Shaded areas indicate periods of recession from peak to trough as designated by the National Bureau for Economic Research. The decrease in number of families receiving assistance during the 1981-82 recession stems from changes in eligibility requirements and other policy changes mandated by OBRA 1981. Last data point plotted is June 2000.
Source: U.S. Department of Health and Human Services, Administration for Children and Families, Office of Planning, Research, and Evaluation.
Figure TANF 2. Average Monthly AFDC/TANF Benefit per Recipient in Constant Dollars
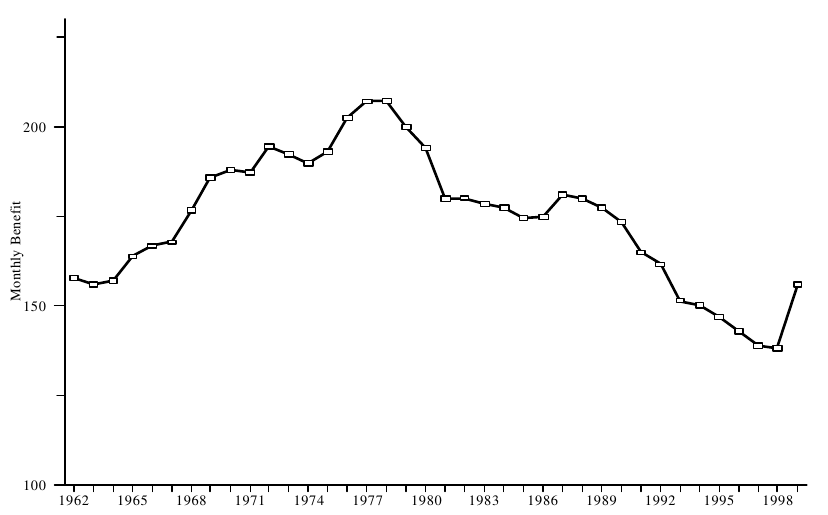
Note: See Table TANF 6 for underlying data.
Source: U.S. Department of Health and Human Services, Administration for Children and Families, Office of Family Assistance, Quarterly Public Assistance Statistics, 1992 & 1993, and unpublished data.
Table TANF 1. Trends in AFDC/TANF Caseloads, 1962 – 1999
| Average Monthly Number (In thousands) | Children as a Percent of Total Recipients | Average Number of Children per Family | |||||
|---|---|---|---|---|---|---|---|
| Fiscal Year | Total Families 1 | Total Recipients | Unemployed Parent Families | Unemployed Parent Recipients | Total Children | ||
| 1962........... | 924 | 3,593 | 49 | 224 | 2,778 | 77.3 | 3.0 |
| 1963........... | 950 | 3,834 | 54 | 291 | 2,896 | 75.5 | 3.0 |
| 1964........... | 984 | 4,059 | 60 | 343 | 3,043 | 75.0 | 3.1 |
| 1965........... | 1,037 | 4,323 | 69 | 400 | 3,242 | 75.0 | 3.1 |
| 1966........... | 1,074 | 4,472 | 62 | 361 | 3,369 | 75.3 | 3.1 |
| 1967........... | 1,141 | 4,718 | 58 | 340 | 3,561 | 75.5 | 3.1 |
| 1968........... | 1,307 | 5,348 | 67 | 377 | 4,011 | 75.0 | 3.1 |
| 1969........... | 1,538 | 6,147 | 66 | 361 | 4,591 | 74.7 | 3.0 |
| 1970........... | 1,909 | 7,429 | 78 | 420 | 5,494 | 74.0 | 2.9 |
| 1971........... | 2,532 | 9,556 | 143 | 726 | 6,963 | 72.9 | 2.8 |
| 1972........... | 2,918 | 10,632 | 134 | 639 | 7,698 | 72.4 | 2.6 |
| 1973........... | 3,124 | 11,038 | 120 | 557 | 7,965 | 72.2 | 2.5 |
| 1974........... | 3,170 | 10,845 | 95 | 434 | 7,824 | 72.1 | 2.5 |
| 1975........... | 3,357 | 11,067 | 101 | 451 | 7,928 | 71.6 | 2.4 |
| 1976........... | 3,575 | 11,339 | 135 | 593 | 8,156 | 71.9 | 2.3 |
| 1977........... | 3,593 | 11,108 | 149 | 659 | 7,818 | 70.4 | 2.2 |
| 1978........... | 3,539 | 10,663 | 128 | 567 | 7,475 | 70.1 | 2.1 |
| 1979........... | 3,496 | 10,311 | 114 | 506 | 7,193 | 69.8 | 2.1 |
| 1980........... | 3,642 | 10,597 | 141 | 612 | 7,320 | 69.1 | 2.0 |
| 1981........... | 3,871 | 11,160 | 209 | 881 | 7,615 | 68.2 | 2.0 |
| 1982........... | 3,569 | 10,431 | 232 | 976 | 6,975 | 66.9 | 2.0 |
| 1983........... | 3,651 | 10,659 | 272 | 1,144 | 7,051 | 66.1 | 1.9 |
| 1984........... | 3,725 | 10,866 | 287 | 1,222 | 7,153 | 65.8 | 1.9 |
| 1985........... | 3,692 | 10,813 | 261 | 1,131 | 7,165 | 66.3 | 1.9 |
| 1986........... | 3,748 | 10,995 | 254 | 1,102 | 7,300 | 66.4 | 1.9 |
| 1987........... | 3,784 | 11,065 | 236 | 1,035 | 7,381 | 66.7 | 2.0 |
| 1988........... | 3,748 | 10,920 | 210 | 929 | 7,325 | 67.1 | 2.0 |
| 1989........... | 3,771 | 10,935 | 193 | 856 | 7,370 | 67.4 | 2.0 |
| 1990........... | 3,974 | 11,460 | 204 | 899 | 7,755 | 67.7 | 2.0 |
| 1991........... | 4,374 | 12,592 | 268 | 1,148 | 8,513 | 67.6 | 1.9 |
| 1992........... | 4,768 | 13,625 | 322 | 1,348 | 9,226 | 67.7 | 1.9 |
| 1993........... | 4,981 | 14,143 | 359 | 1,489 | 9,560 | 67.6 | 1.9 |
| 1994........... | 5,046 | 14,226 | 363 | 1,510 | 9,611 | 67.6 | 1.9 |
| 1995........... | 4,879 | 13,659 | 335 | 1,384 | 9,280 | 67.9 | 1.9 |
| 1996........... | 4,552 | 12,644 | 301 | 1,241 | 8,671 | 68.6 | 1.9 |
| 1997 2 ......... | 3,947 | 10,954 | 275 3 | 1,158 3 | 7,781 3 | 71.0 3 | 2.0 3 |
| 1998........... | 3,179 | 8,770 | 179 | 753 4 | 6,273 | 71.5 | 2.0 |
| 1999........... | 2,643 | 7,188 | NA | NA | 5,319 | 74.0 | 2.0 |
1 Includes unemployed parent families.
2 The Personal Responsibility and Work Opportunity Reconciliation act of 1996 repealed the AFDC program as of July 1, 1997 and replaced it with the Temporary Assistance to Needy Families (TANF) program.
3 Based on data from the old AFDC reporting system which was available only for the first 9 months of the fiscal year.
4 Estimated based on the ratio of Unemployed Parent recipients to Unemployed Parent families in 1997.
Source: U.S. Department of Health and Human Services, Administration for Children and Families, Office of Planning, Research and Evaluation, (Available online at http://www.acf.dhhs.gov/).
Table TANF 2. Number of AFDC/TANF Recipients, and Recipients as a Percentage of Various population Groups, 1970 – 1999
| Calendar 1 Year | Total Recipients in the States & DC (in thousands) | Child Recipients in the States & DC (in thousands) | Recipients as a Percent of Total Population 2 | Recipients as a Percent of Poverty Population 3 | Recipients as a Percent of Pretransfer Poverty Population 4 | Child Recipients as a Percent of Total Child Population 2 | Child Recipients as a Percent of Children in Poverty 3 |
|---|---|---|---|---|---|---|---|
| 1970........... | 8,303 | 6,104 | 4.1 | 32.7 | NA | 8.8 | 58.5 |
| 1971........... | 10,043 | 7,303 | 4.9 | 39.3 | NA | 10.5 | 69.2 |
| 1972........... | 10,736 | 7,766 | 5.1 | 43.9 | NA | 11.2 | 75.5 |
| 1973........... | 10,738 | 7,763 | 5.1 | 46.7 | NA | 11.3 | 80.5 |
| 1974........... | 10,621 | 7,637 | 5.0 | 45.4 | NA | 11.3 | 75.2 |
| 1975........... | 11,131 | 7,928 | 5.2 | 43.0 | NA | 11.8 | 71.4 |
| 1976........... | 11,098 | 7,850 | 5.1 | 44.4 | NA | 11.8 | 76.4 |
| 1977........... | 10,856 | 7,632 | 4.9 | 43.9 | NA | 11.7 | 74.2 |
| 1978........... | 10,387 | 7,270 | 4.7 | 42.4 | NA | 11.2 | 73.2 |
| 1979........... | 10,140 | 7,057 | 4.5 | 38.9 | 53.1 | 11.0 | 68.0 |
| 1980........... | 10,599 | 7,295 | 4.7 | 36.2 | 49.2 | 11.4 | 63.2 |
| 1981........... | 10,893 | 7,397 | 4.7 | 34.2 | 47.1 | 11.7 | 59.2 |
| 1982........... | 10,161 | 6,767 | 4.4 | 29.5 | 40.6 | 10.8 | 49.6 |
| 1983........... | 10,569 | 6,967 | 4.5 | 29.9 | 41.9 | 11.1 | 50.1 |
| 1984........... | 10,644 | 7,017 | 4.5 | 31.6 | 43.6 | 11.2 | 52.3 |
| 1985........... | 10,672 | 7,073 | 4.5 | 32.3 | 45.0 | 11.3 | 54.4 |
| 1986........... | 10,851 | 7,206 | 4.5 | 33.5 | 46.6 | 11.5 | 56.0 |
| 1987........... | 10,842 | 7,240 | 4.5 | 33.6 | 46.7 | 11.5 | 55.9 |
| 1988........... | 10,728 | 7,201 | 4.4 | 33.8 | 47.7 | 11.4 | 57.8 |
| 1989........... | 10,799 | 7,286 | 4.4 | 34.3 | 47.6 | 11.5 | 57.9 |
| 1990........... | 11,497 | 7,781 | 4.6 | 34.2 | 47.1 | 12.1 | 57.9 |
| 1991........... | 12,728 | 8,601 | 5.0 | 35.6 | 49.1 | 13.2 | 60.0 |
| 1992........... | 13,571 | 9,189 | 5.3 | 35.7 | 50.8 | 13.9 | 60.1 |
| 1993........... | 14,007 | 9,460 | 5.4 | 35.7 | 48.5 | 14.1 | 60.2 |
| 1994........... | 13,970 | 9,448 | 5.4 | 36.7 | 50.0 | 13.9 | 61.8 |
| 1995........... | 13,241 | 9,013 | 5.0 | 36.4 | 50.1 | 13.1 | 61.5 |
| 1996........... | 12,156 | 8,355 | 4.6 | 33.3 | 46.4 | 12.1 | 57.8 |
| 1997........... | 10,235 | 7,3405 | 3.8 | 28.8 | 40.7 | 10.5 | 52.0 |
| 1998........... | 8,250 | 5,791 | 3.1 | 23.9 | 34.6 | 8.3 | 43.0 |
| 1999........... | 8,250 | 4,850 | 2.5 | 20.9 | 31.1 | 6.9 | 40.1 |
1 Total recipients are calculated here as the monthly average for the calendar year in order to compare with the calendar year counts of the poverty populations used to compute the recipiency rates. See Table IND 3a for fiscal year recipiency rates.
2 Population numbers used as denominators are resident population. See Current Population Reports, Series P25-1106.
3 For poverty population data see Current Population Reports, Series P60-210 and Resident Population Estimates of the United States by Age and Sex, April 1, 1990 to July 1, 2000, Internet release date January 2, 2001.
4 The pretransfer poverty population used as denominator is the number of all persons in families with related children under 18 years of age whose income (cash income plus social insurance plus Social Security but before taxes and means-tested transfers) falls below the appropriate poverty threshold. See Appendix J, Table 20, 1992 Green Book;data for subsequent years are unpublished Congressional Budget Office tabulations.
5 Average for January through June of 1997.
Source: U.S. Department of Health and Human Services, Administration for children and Families, Office of Family Assistance and U.S. Bureau of the Census, "Poverty in the United States: 1999," Current Population reports, Series P60-210 and earlier years, (Available online at http://www.census.gov/hhes/www/poverty.html).
Table TANF 3. Total, Federal, and State AFDC/TANF Expenditures, 1970 – 1999 [In millions of dollars]
| Federal Funds (Current Dollars) |
State Funds (Current Dollars) |
Total (Current Dollars) |
Total (Constant ‘99 Dollars 1 ) |
|||||
|---|---|---|---|---|---|---|---|---|
| Fiscal Year | Benefits | Administrative | Benefits | Administrative | Benefits | Administrative | Benefits | Administrative |
| 1970.............. | $2,187 | $572 2 | $1,895 | $309 | $4,082 | $881 2 | $16,722 | $3,609 |
| 1971.............. | 3,008 | 271 | 2,469 | 254 | 5,477 | 525 | 21,480 | 2,059 |
| 1972.............. | 3,612 | 240 3 | 2,942 | 241 | 6,554 | 481 3 | 24,821 | NA |
| 1973................ | 3,865 | 313 | 3,138 | 296 | 7,003 | 610 | 25,473 | 2,219 |
| 1974.............. | 4,071 | 379 | 3,300 | 362 | 7,371 | 740 | 24,694 | 2,479 |
| 1975.............. | 4,625 | 552 | 3,787 | 529 | 8,412 | 1,082 | 25,686 | 3,304 |
| 1976.............. | 5,258 | 541 | 4,418 | 527 | 9,676 | 1,069 | 27,658 | 3,056 |
| 1977.............. | 5,626 | 595 | 4,762 | 583 | 10,388 | 1,177 | 27,640 | 3,132 |
| 1978.............. | 5,724 | 631 | 4,898 | 617 | 10,621 | 1,248 | 26,513 | 3,115 |
| 1979.............. | 5,825 | 683 | 4,954 | 668 | 10,779 | 1,350 | 24,742 | 3,099 |
| 1980.............. | 6,448 | 750 | 5,508 | 729 | 11,956 | 1,479 | 24,672 | 3,052 |
| 1981.............. | 6,928 | 835 | 5,917 | 814 | 12,845 | 1,648 | 24,103 | 3,092 |
| 1982.............. | 6,922 | 878 | 5,934 | 878 | 12,857 | 1,756 | 22,541 | 3,079 |
| 1983.............. | 7,332 | 915 | 6,275 | 915 | 13,607 | 1,830 | 22,816 | 3,069 |
| 1984.............. | 7,707 | 876 | 6,664 | 822 | 14,371 | 1,698 | 23,114 | 2,731 |
| 1985.............. | 7,817 | 890 | 6,763 | 889 | 14,580 | 1,779 | 22,636 | 2,762 |
| 1986.............. | 8,239 | 993 | 6,996 | 967 | 15,235 | 1,960 | 23,069 | 2,968 |
| 1987.............. | 8,914 | 1,081 | 7,409 | 1,052 | 16,323 | 2,133 | 24,034 | 3,141 |
| 1988.............. | 9,125 | 1,194 | 7,538 | 1,159 | 16,663 | 2,353 | 23,570 | 3,328 |
| 1989.............. | 9,433 | 1,211 | 7,807 | 1,206 | 17,240 | 2,417 | 23,273 | 3,263 |
| 1990.............. | 10,149 | 1,358 | 8,390 | 1,303 | 18,539 | 2,661 | 23,840 | 3,422 |
| 1991.............. | 11,165 | 1,373 | 9,191 | 1,300 | 20,356 | 2,673 | 24,918 | 3,272 |
| 1992.............. | 12,258 | 1,459 | 9,993 | 1,378 | 22,250 | 2,837 | 26,435 | 3,371 |
| 1993.............. | 12,270 | 1,518 | 10,016 | 1,438 | 22,286 | 2,956 | 25,703 | 3,409 |
| 1994.............. | 12,512 | 1,680 | 10,285 | 1,621 | 22,797 | 3,301 | 25,614 | 3,709 |
| 1995.............. | 12,019 | 1,770 | 10,014 | 1,751 | 22,032 | 3,521 | 24,083 | 3,849 |
| 1996.............. | 11,065 | 1,633 | 9,346 | 1,633 | 20,411 | 3,266 | 21,709 | 3,474 |
| 1997 4 ........... | 9,746 | 1,271 | 7,902 | 1,128 | 17,648 | 2,399 | 18,278 | 2,484 |
| 1998.............. | 7,168 | 1,125 | 7,096 | 1,028 | 14,264 | 2,154 | 14,536 | 2,195 |
| 1999.............. | 6,475 | 1,407 | 6,975 | 884 | 13,449 | 2,291 | 13,449 | 2,291 |
Note: Benefits do not include emergency assistance payments and have not been reduced by child support collections. Foster care payments are included from 1971 to 1980. Beginning in fiscal year 1984, the cost of certifying AFDC households for food stamps is shown in the food stamp program’s appropriation under the U.S. Department of Agriculture. Administrative costs include: Work Program, ADP, FAMIS, Fraud Control, Child Care administration (through 1996), SAVE and other State and local administrative expenditures.
1 Constant dollar adjustments to 1999 level were made using a CPI-U-X1 fiscal year price index.
2 Includes expenditures for services.
3 Administrative expenditures only.
4 The Personal Responsibility and Work opportunity Reconciliation Act of 1996 repealed the AFDC program as of July1, 1997 and replaced it with the Temporary Assistance to Needy Families (TANF)program. Under PRWORA, spending categories are not entirely equivalent to those under AFDC: for example administrative expenses under TANF do not include IV-A child care administration (which accounted for 4 percent of1996 administrative expense).
Source: U.S. Department of Health and Human Services, Administration for Children and Families, Office of Financial Systems.
Table TANF 4. Federal and State AFDC Benefit Payments Under the single Parent and Unemployed Parent Programs, Fiscal Years 1970 to1996 [In millions of current and 1996 dollars]
| Cash & Work Based Assistance | Work Activities | Child Care | Adminis tration | Systems | Transitional Services | Other Expenditures | Total Expenditures | |
|---|---|---|---|---|---|---|---|---|
| Federal TANF Grants | ||||||||
| 1997 | 7,708 | 467 | 14 | 872 | 109 | 0 | 862 | 10,032 |
| 1998 | 7,168 | 763 | 252 | 938 | 224 | 6 | 1,136 | 10,487 |
| 1999 | 6,475 | 1,225 | 604 | 1,070 | 337 | 17 | 1,595 | 11,323 |
| State Maintenance of Effort Expenditures in the TANF Program | ||||||||
| 1997 | 5,955 | 311 | 752 | 704 | 101 | 9 | 926 | 8,758 |
| 1998 | 6,879 | 520 | 890 | 883 | 138 | 11 | 1,301 | 10,623 |
| 1999 | 6,541 | 503 | 1,135 | 743 | 118 | 23 | 1,334 | 10,397 |
| State Maintenance of Effort Expenditures in Separate State Programs | ||||||||
| 1997 | 69 | 12 | 111 | 0 | 0 | – | 18 | 210 |
| 1998 | 216 | 3 | 137 | 6 | 1 | – | 28 | 391 |
| 1999 | 434 | 26 | 257 | 22 | 0 | 0 | 126 | 865 |
| Total Expenditures | ||||||||
| 1997 | 13,731 | 790 | 877 | 1,577 | 211 | 9 | 1,805 | 19,000 |
| 1998 | 14,264 | 1,286 | 1,280 | 1,828 | 362 | 17 | 2,465 | 21,502 |
| 1999 | 13,449 | 1,754 | 1,995 | 1,835 | 456 | 40 | 3,055 | 22,585 |
Source: U.S. Department of Health and Human services, Administration for Children and Families, Office of Financial services.
Table TANF 6. Trends in AFDC/TANF Average Monthly Payments, 1962 – 1999
| Monthly Benefit per Recipient |
Average Number of Persons per Family |
Monthly per Fa(not reduced by CBenefit mily hild Support) | Weighted Average1 Maximum Benefit (per 3-person Family) |
||||
|---|---|---|---|---|---|---|---|
| Fiscal Year | Current Dollars | 1999 Dollars | Current Dollars | 1999 Dollars | Current Dollars | 1999 Dollars | |
| 1962........... | $31 | $158 | 3.9 | $121 | $614 | NA | NA |
| 1963........... | 31 | 156 | 4.0 | 126 | 630 | NA | NA |
| 1964........... | 32 | 157 | 4.1 | 131 | 649 | NA | NA |
| 1965........... | 34 | 164 | 4.2 | 140 | 683 | NA | NA |
| 1966........... | 35 | 167 | 4.2 | 146 | 694 | NA | NA |
| 1967........... | 36 | 168 | 4.1 | 150 | 694 | NA | NA |
| 1968........... | 40 | 177 | 4.1 | 162 | 723 | NA | NA |
| 1969........... | 43 | 186 | 4.0 | 173 | 742 | 186 2 | 802 |
| 1970........... | 46 | 188 | 3.9 | 178 | 730 | 194 2 | 796 |
| 1971........... | 48 | 187 | 3.8 | 180 | 707 | 201 2 | 788 |
| 1972........... | 51 | 195 | 3.6 | 187 | 709 | 205 2 | 778 |
| 1973........... | 53 | 192 | 3.5 | 187 | 680 | 213 2 | 774 |
| 1974........... | 57 | 190 | 3.4 | 194 | 649 | 229 2 | 766 |
| 1975........... | 63 | 193 | 3.3 | 209 | 638 | 243 | 742 |
| 1976........... | 71 | 202 | 3.2 | 226 | 645 | 257 | 734 |
| 1977........... | 78 | 207 | 3.1 | 241 | 641 | 271 | 721 |
| 1978........... | 83 | 207 | 3.0 | 249 | 624 | 284 | 710 |
| 1979........... | 87 | 200 | 2.9 | 257 | 590 | 301 | 690 |
| 1980........... | 94 | 194 | 2.9 | 274 | 564 | 320 | 660 |
| 1981........... | 96 | 180 | 2.9 | 277 | 519 | 326 | 611 |
| 1982........... | 103 | 180 | 2.9 | 300 | 526 | 331 | 579 |
| 1983........... | 106 | 178 | 2.9 | 311 | 521 | 336 | 564 |
| 1984........... | 110 | 177 | 2.9 | 321 | 517 | 352 | 565 |
| 1985........... | 112 | 174 | 2.9 | 329 | 511 | 369 | 573 |
| 1986........... | 116 | 175 | 2.9 | 339 | 513 | 383 | 580 |
| 1987........... | 123 | 181 | 2.9 | 359 | 529 | 393 | 579 |
| 1988........... | 127 | 180 | 2.9 | 370 | 524 | 404 | 572 |
| 1989........... | 131 | 177 | 2.9 | 381 | 514 | 412 | 557 |
| 1990........... | 135 | 173 | 2.9 | 389 | 500 | 421 | 541 |
| 1991........... | 135 | 165 | 2.9 | 388 | 475 | 425 | 520 |
| 1992........... | 136 | 162 | 2.9 | 389 | 462 | 419 | 498 |
| 1993........... | 131 | 151 | 2.8 | 373 | 430 | 414 | 478 |
| 1994........... | 134 | 150 | 2.8 | 376 | 423 | 420 | 467 |
| 1995........... | 134 | 147 | 2.8 | 377 | 411 | 418 | 457 |
| 1996........... | 135 | 143 | 2.8 | 374 | 397 | 422 | 449 |
| 1997 3 ........ | 134 | 139 | 2.8 | 373 | 386 | 420 | 435 |
| 1998........... | 136 | 138 | 2.8 | 374 | 381 | 431 | 439 |
| 1999........... | 156 | 156 | 2.7 | 424 | 424 | 450 | 450 |
1 The maximum benefit for a 3-person family in each state is weighted by that state’s share of total AFDC families.
2 Estimated based on the weighted average benefit for a 4-person family.
3 The Personal Responsibility and Work Opportunity Reconciliation Act of 1996 repealed the AFDC program as of July 1, 1997 and replaced it with the Temporary Assistance to Needy families (TANF) program.
Note: AFDC benefit amounts have not been reduced by child support collections. Constant dollar adjustments to 1999 level were made using a CPI-U-X1 fiscal year price index.
Source: U.S. Department of Health and Human services, Administration for Children and Families, Office of Family Assistance,Quarterly Public Assistance Statistics, 1992 & 1993 and earlier years along with unpublished data.
Table TANF 7. Characteristics of AFDC/TANF Families, Selected Years 1969 – 1999
| Fiscal year1 | ||||||||||
|---|---|---|---|---|---|---|---|---|---|---|
| May 1969 | May 1975 | March 1979 | 1983 | 1988 | 1990 | 1992 | 1996 | 1998 | 1999 | |
| Avg. Family Size (persons) | 4.0 | 3.2 | 3.0 | 3.0 | 3.0 | 2.9 | 2.9 | 2.8 | 2.8 | 2.8 |
| Number of Child Recipients | ||||||||||
| One | 26.6 | 37.9 | 42.3 | 43.4 | 42.5 | 42.2 | 42.5 | 43.9 | 42.4 | 42.3 |
| Two | 23.0 | 26.0 | 28.1 | 29.8 | 30.2 | 30.3 | 30.2 | 29.9 | 29.6 | 29.0 |
| Three | 17.7 | 16.1 | 15.6 | 15.2 | 15.8 | 15.8 | 15.5 | 15.0 | 15.7 | 15.9 |
| Four or More | 32.5 | 20.0 | 13.9 | 10.1 | 9.9 | 9.9 | 10.1 | 9.2 | 10.6 | 11.0 |
| Unknown | NA | NA | NA | 1.5 | 1.7 | 1.4 | 0.7 | 1.3 | 1.8 | 1.9 |
| Child-Only Families | 10.1 | 12.5 | 14.6 | 8.3 | 9.6 | 11.6 | 14.8 | 21.5 | 23.4 | 29.1 |
| Families with Non-Recipients | 33.1 | 34.8 | NA | 36.9 | 36.8 | 37.7 | 38.9 | 49.9 | – | – |
| Median Months on AFDC/TANF | ||||||||||
| Since Most Recent Opening | 23.0 | 31.0 | 29.0 | 26.0 | 26.3 | 23.0 | 22.5 | 23.6 | – | – |
| Presence of Assistance | ||||||||||
| Living in Public Housing | 12.8 | 14.6 | NA | 10.0 | 9.6 | 9.6 | 9.2 | 8.8 | NA | 12.6 |
| Part icipating in Food Stamp | ||||||||||
| Or Donated Food Program | 52.9 | 75.1 | 75.1 | 83.0 | 84.6 | 85.6 | 87.3 | 89.3 | 83.5 | 80.7 |
| Presence of Income | ||||||||||
| With Earnings | NA | 14.6 | 12.8 | 5.7 | 8.4 | 8.2 | 7.4 | 11.1 | 20.6 4 | 25.2 4 |
| No Non-AFDC/TANF Income | 56.0 | 71.1 | 80.6 | 86.8 | 79.6 | 80.1 | 78.9 | 76.0 | 73.0 4 | 69.9 4 |
| Adult Employment Status (percent of adults) | ||||||||||
| Employed | – | – | – | – | – | 7.0 | 6.6 | 11.3 | 22.8 | 27.6 |
| Unemployed | – | – | – | – | – | – | – | – | 45.0 | 43.9 |
| Not in Labor Force | – | – | – | – | – | – | – | – | 28.3 | 25.5 |
| Unknown | – | – | – | – | – | – | – | – | 4.0 | 3.0 |
| Adult Women's employment status (percent of adult female recipients):3 | ||||||||||
| Full-time job | 8.2 | 10.4 | 8.7 | 1.5 | 2.2 | 2.5 | 2.2 | 4.7 | – | – |
| Part -time job | 6.3 | 5.7 | 5.4 | 3.4 | 4.2 | 4.2 | 4.2 | 5.4 | – | – |
| Marital Status (percent of adults) | ||||||||||
| Single | – | – | – | – | – | – | – | – | 52.5 | 58.1 |
| Married | – | – | – | – | – | – | – | – | 16.4 | 18.4 |
| Separated | – | – | – | – | – | – | – | – | 11.7 | 12.3 |
| Widowed | – | – | – | – | – | – | – | – | 0.7 | 0.8 |
| Divorced | – | – | – | – | – | – | – | – | 8.8 | 8.3 |
| Unknown | – | – | – | – | – | – | – | – | 9.9 | 2.0 |
| Basis for Child's Eligibility (percent children): | ||||||||||
| Incapacitated | 11.7 2 | 7.7 | 5.3 | 3.4 | 3.7 | 3.6 | 4.1 | 4.3 | – | – |
| Unemployed | 4.6 2 | 3.7 | 4.1 | 8.7 | 6.5 | 6.4 | 8.2 | 8.3 | – | – |
| Death | 5.5 2 | 3.7 | 2.2 | 1.8 | 1.8 | 1.6 | 1.6 | 1.6 | – | – |
| Divorce or Separation | 43.3 2 | 48.3 | 44.7 | 38.5 | 34.6 | 32.9 | 30.0 | 24.3 | – | – |
| Absent, No Marriage Tie | 27.9 2 | 31.0 | 37.8 | 44.3 | 51.9 | 54.0 | 53.1 | 58.6 | – | – |
| Absent, Other Reason | 3.5 2 | 4.0 | 5.9 | 1.4 | 1.6 | 1.9 | 2.0 | 2.4 | – | – |
| Unknown | – | – | – | 1.7 | – | – | 0.9 | 0.6 | – | – |
Note: Figures are percentages of families/cases unless noted otherwise.
1 Percentages are based on the average monthly caseload during the year. Hawaii and the territories are not included in1983.
Data after 1986 include the territories and Hawaii.
2 Calculated on the basis of total number of families.
3 For years prior to 1983, data are for mothers only.
4 Presence of income is measured as a percentage of adult recipients,not families, in 1998 and subsequent years.
Source: U.S. Department of Health and Human Services, Administration for Children and Families, Office of Planning, Research and Evaluation,Characteristics and Financial Circumstances of TANF Recipients: Fiscal year 1999 and earlier years, (Current data available online at http://www.acf.dhhs.gov/programs/opre/characteristics/fy98/sum.htm).
Table TANF 8. AFDC/TANF Benefits by State, Selected Fiscal Years 1978 – 1999 [Millions of dollars]
| 1978 | 1982 | 1984 | 1986 | 1988 | 1990 | 1992 | 1994 | 1996 | 1999 | |
|---|---|---|---|---|---|---|---|---|---|---|
| Alabama | $78 | $72 | $74 | $68 | $62 | $62 | $85 | $92 | $75 | $35 |
| Alaska | 17 | 32 | 37 | 46 | 54 | 60 | 96 | 113 | 107 | 64 |
| Arizona | 30 | 49 | 67 | 79 | 103 | 138 | 243 | 266 | 228 | 122 |
| Arkansas | 51 | 34 | 39 | 48 | 53 | 57 | 61 | 57 | 52 | 24 |
| California | 1,813 | 2,734 | 3,207 | 3,574 | 4,091 | 4,955 | 5,828 | 6,088 | 5,908 | 4,290 |
| Colorado | 74 | 87 | 107 | 107 | 125 | 137 | 163 | 158 | 129 | 55 |
| Connecticut | 168 | 210 | 226 | 223 | 218 | 295 | 377 | 397 | 323 | 187 |
| Delaware | 28 | 28 | 28 | 25 | 24 | 29 | 37 | 40 | 35 | 23 |
| Dist. of Columbia | 91 | 86 | 75 | 77 | 76 | 84 | 102 | 126 | 121 | 80 |
| Florida | 145 | 207 | 251 | 261 | 318 | 418 | 733 | 806 | 680 | 285 |
| Georgia | 103 | 172 | 149 | 223 | 266 | 321 | 420 | 428 | 385 | 207 |
| Guam | 3 | 4 | 5 | 4 | 3 | 5 | 8 | 12 | 14 | NA |
| Hawaii | 83 | 88 | 83 | 73 | 77 | 99 | 125 | 163 | 173 | 100 |
| Idaho | 21 | 20 | 21 | 19 | 19 | 20 | 24 | 30 | 30 | 4 |
| Illinois | 699 | 802 | 845 | 886 | 815 | 839 | 883 | 914 | 833 | 540 |
| Indiana | 118 | 139 | 153 | 148 | 167 | 170 | 218 | 228 | 153 | 85 |
| Iowa | 107 | 127 | 159 | 170 | 155 | 152 | 164 | 169 | 131 | 92 |
| Kansas | 73 | 81 | 87 | 91 | 97 | 105 | 119 | 123 | 98 | 46 |
| Kentucky | 122 | 123 | 135 | 104 | 143 | 179 | 213 | 198 | 191 | 120 |
| Louisiana | 97 | 127 | 145 | 162 | 182 | 188 | 182 | 168 | 130 | 67 |
| Maine | 51 | 59 | 69 | 84 | 80 | 101 | 118 | 108 | 99 | 61 |
| Maryland | 166 | 213 | 229 | 250 | 250 | 296 | 333 | 314 | 285 | 156 |
| Massachusetts | 476 | 468 | 406 | 471 | 558 | 630 | 751 | 730 | 560 | 331 |
| Michigan | 780 | 1,064 | 1,214 | 1,248 | 1,231 | 1,211 | 1,162 | 1,132 | 779 | 435 |
| Minnesota | 164 | 235 | 287 | 322 | 338 | 355 | 387 | 379 | 333 | 234 |
| Mississippi | 33 | 55 | 58 | 74 | 85 | 86 | 89 | 82 | 68 | 27 |
| Missouri | 152 | 175 | 196 | 209 | 215 | 228 | 274 | 287 | 254 | 165 |
| Montana | 15 | 19 | 27 | 37 | 41 | 40 | 46 | 49 | 45 | 25 |
| Nebraska | 38 | 49 | 56 | 62 | 56 | 59 | 65 | 62 | 54 | 68 |
| Nevada | 8 | 12 | 10 | 16 | 20 | 27 | 41 | 48 | 48 | 28 |
| New Hampshire | 21 | 25 | 16 | 20 | 21 | 32 | 54 | 62 | 50 | 36 |
| New Jersey | 489 | 513 | 485 | 509 | 459 | 451 | 527 | 531 | 462 | 301 |
| New Mexico | 32 | 45 | 49 | 51 | 56 | 61 | 106 | 144 | 153 | 108 |
| New York | 1,689 | 1,641 | 1,916 | 2,099 | 2,140 | 2,259 | 2,944 | 2,913 | 2,929 | 2,105 |
| North Carolina | 138 | 143 | 149 | 138 | 206 | 247 | 335 | 353 | 300 | 176 |
| North Dakota | 14 | 14 | 16 | 20 | 22 | 24 | 28 | 26 | 21 | 22 |
| Ohio | 441 | 606 | 725 | 804 | 805 | 877 | 984 | 1,016 | 763 | 380 |
| Oklahoma | 74 | 74 | 85 | 100 | 119 | 132 | 169 | 165 | 122 | 58 |
| Oregon | 148 | 100 | 101 | 120 | 128 | 145 | 200 | 197 | 155 | 177 |
| Pennsylvania | 726 | 740 | 724 | 389 | 747 | 798 | 906 | 935 | 822 | 530 |
| Puerto Rico | 25 | 65 | 38 | 33 | 67 | 72 | 75 | 74 | 63 | NA |
| Rhode Island | 59 | 70 | 71 | 79 | 82 | 99 | 128 | 136 | 125 | 110 |
| South Carolina | 52 | 76 | 75 | 103 | 91 | 96 | 119 | 115 | 101 | 39 |
| South Dakota | 18 | 17 | 17 | 15 | 21 | 22 | 25 | 25 | 22 | 11 |
| Tennessee | 77 | 74 | 83 | 100 | 125 | 168 | 206 | 215 | 190 | 110 |
| Texas | 122 | 118 | 229 | 281 | 344 | 416 | 517 | 544 | 496 | 233 |
| Utah | 41 | 47 | 52 | 55 | 61 | 64 | 76 | 77 | 64 | 40 |
| Vermont | 21 | 38 | 40 | 40 | 40 | 48 | 67 | 65 | 56 | 52 |
| Virgin Islands | 2 | 3 | 2 | 2 | 2 | 3 | 4 | 4 | 4 | NA |
| Virginia | 136 | 166 | 165 | 179 | 169 | 177 | 225 | 253 | 199 | 117 |
| Washington | 175 | 240 | 294 | 375 | 401 | 438 | 606 | 610 | 585 | 317 |
| West Virginia | 53 | 56 | 75 | 109 | 107 | 110 | 120 | 126 | 101 | 33 |
| Wisconsin | 260 | 406 | 519 | 444 | 506 | 440 | 453 | 425 | 291 | 91 |
| Wyoming | 6 | 9 | 13 | 16 | 19 | 19 | 27 | 21 | 17 | 10 |
| United States | $10,621 | $12,857 | $14,371 | $15,236 | $16,663 | $18,543 | $22,250 | $22,798 | $20,411 | $13,016 |
Note: Benefits refers to total cash benefits paid (see Table TANF 3) but does not include emergency assistance payments.
Source: U.S. Department of Health and Human Services, Administration for Children and Families, Office of Program Support, Office of Management services, data from the ACF-196 TANF Report and ACF-231 AFDC Line by Line report.
Table TANF 9. Comparison of Federal Funding for AFDC and Related Programs and 1999 Family Assistance Grants Awarded Under PRWORA [In millions]
| State | FY 1996 Grants for AFDC, EA & JOBS 1 | FY 1999 State Family Assistance Grant 2 | Increase from FY 1996 Level |
Percent Increase from FY 1996 Level |
|---|---|---|---|---|
| Alabama | $75.9 | $118.7 | $42.8 | 56 |
| Alaska | 58.7 | 64.5 | 5.9 | 10 |
| Arizona | 197.8 | 230.6 | 32.9 | 17 |
| Arkansas | 51.9 | 59.8 | 7.9 | 15 |
| California | 3,622.8 | 3,751.1 | 128.4 | 4 |
| Colorado | 158.3 | 142.7 | -15.6 | -10 |
| Connecticut | 215.3 | 266.8 | 51.5 | 24 |
| Delaware | 35.2 | 32.3 | -2.9 | -8 |
| Dist of Columbia | 70.8 | 92.6 | 21.8 | 31 |
| Florida | 497.5 | 591.8 | 94.3 | 19 |
| Georgia | 288.4 | 348.9 | 60.5 | 21 |
| Hawaii | 97.9 | 98.9 | 1.0 | 1 |
| Idaho | 31.3 | 33.1 | 1.8 | 6 |
| Illinois | 601.1 | 585.1 | -16.0 | -3 |
| Indiana | 133.1 | 206.8 | 73.7 | 55 |
| Iowa | 128.9 | 131.5 | 2.7 | 2 |
| Kansas | 89.8 | 101.9 | 12.2 | 14 |
| Kentucky | 157.2 | 181.3 | 24.0 | 15 |
| Louisiana | 114.3 | 172.3 | 58.0 | 51 |
| Maine | 74.8 | 78.1 | 3.3 | 4 |
| Maryland | 214.3 | 229.1 | 14.8 | 7 |
| Massachusetts | 353.1 | 479.4 | 126.3 | 36 |
| Michigan | 632.2 | 795.4 | 163.1 | 26 |
| Minnesota | 220.8 | 267.4 | 46.5 | 21 |
| Mississippi | 70.3 | 91.2 | 20.8 | 30 |
| Missouri | 195.4 | 217.1 | 21.7 | 11 |
| Montana | 40.4 | 45.5 | 5.1 | 13 |
| Nebraska | 56.0 | 58.0 | 2.0 | 4 |
| Nevada | 41.4 | 45.8 | 4.4 | 11 |
| New Hampshire | 34.7 | 38.5 | 3.8 | 11 |
| New Jersey | 383.2 | 404.0 | 20.9 | 5 |
| New Mexico | 132.1 | 132.7 | 0.5 | 0 |
| New York | 2,160.7 | 2,442.9 | 282.3 | 13 |
| North Carolina | 312.6 | 319.8 | 7.2 | 2 |
| North Dakota | 25.7 | 26.4 | 0.7 | 3 |
| Ohio | 543.7 | 728.0 | 184.3 | 34 |
| Oklahoma | 118.2 | 147.6 | 29.4 | 25 |
| Oregon | 142.0 | 166.8 | 24.8 | 17 |
| Pennsylvania | 770.1 | 719.5 | -50.6 | -7 |
| Rhode Island | 89.5 | 95.0 | 5.5 | 6 |
| South Carolina | 94.4 | 100.0 | 5.6 | 6 |
| South Dakota | 20.2 | 21.3 | 1.1 | 5 |
| Tennessee | 137.4 | 202.0 | 64.6 | 47 |
| Texas | 419.0 | 512.0 | 92.9 | 22 |
| Utah | 64.7 | 81.1 | 16.4 | 25 |
| Vermont | 42.4 | 47.4 | 5.0 | 12 |
| Virginia | 121.4 | 158.3 | 36.9 | 30 |
| Washington | 415.4 | 403.3 | -12.1 | -3 |
| West Virginia | 87.7 | 110.2 | 22.5 | 26 |
| Wisconsin | 276.4 | 317.5 | 41.1 | 15 |
| Wyoming | 15.0 | 20.8 | 5.8 | 39 |
| United States | $14,931 | $16,713 | $1,782 | 12 |
1 Excludes IV-A child care. AFDC benefits include the Federal share of child support collections to be comparable to the Family Assistance Grant; 1996 expenditures as reported through February 25, 1997.
2 The awards include State Family Assistance Grants (SFAG) and supplemental Grants for Population Increases. AZ, CA, OK, OR, SD WI, and WY cumulative totals have been adjusted for Tribes operating TANF within the State.
Source: U.S. Department of Health & Human Services,Administration for Children and Families, Office of Financial Services.
Table TANF 10. AFDC/TANF Caseload by State, October 1989 to June2000Peak [In thousands]
| State | Peak Caseload Oct ‘89 to June 2000 | Date Peak Occurred Oct ’89 to June 2000 | August ‘96 Caseload | June 2000 Caseload | Percent Decline 1 August ’96 to June 2000 | Percent Decline Peak to June 2000 |
|---|---|---|---|---|---|---|
| Alabama | 52.3 | Mar-93 | 41.0 | 18.7 | 54 | 64 |
| Alaska | 13.4 | Apr-94 | 12.2 | 7.5 | 38 | 44 |
| Arizona | 72.8 | Dec-93 | 62.4 | 31.9 | 49 | 56 |
| Arkansas | 27.1 | Mar-92 | 22.1 | 12.0 | 45 | 56 |
| California | 933.1 | Mar-95 | 880.4 | 489.1 | 44 | 48 |
| Colorado | 43.7 | Dec-93 | 34.5 | 10.8 | 69 | 75 |
| Connecticut | 61.9 | Mar-95 | 57.3 | 27.1 | 53 | 56 |
| Delaware | 11.8 | Apr-94 | 10.6 | 5.8 | 45 | 51 |
| Dist. of Columbia | 27.5 | Apr-94 | 25.4 | 22.4 | 12 | 18 |
| Florida | 259.9 | Nov-92 | 200.9 | 62.8 | 69 | 76 |
| Georgia | 142.8 | Nov-93 | 123.3 | 51.2 | 58 | 64 |
| Guam | 2.8 | Sep-99 | 2.2 | 2.8 | -23 | 1 |
| Hawaii | 23.4 | Jun-97 | 21.9 | 14.9 | 32 | 36 |
| Idaho | 9.5 | Mar-95 | 8.6 | 1.4 | 84 | 85 |
| Illinois | 243.1 | Aug-94 | 220.3 | 85.8 | 61 | 65 |
| Indiana | 76.1 | Sep-93 | 51.4 | 35.1 | 32 | 54 |
| Iowa | 40.7 | Apr-94 | 31.6 | 20.1 | 36 | 51 |
| Kansas | 30.8 | Aug-93 | 23.8 | 12.4 | 48 | 60 |
| Kentucky | 84.0 | Mar-93 | 71.3 | 37.5 | 47 | 55 |
| Louisiana | 94.7 | May-90 | 67.5 | 25.5 | 62 | 73 |
| Maine | 24.4 | Aug-93 | 20.0 | 10.7 | 47 | 56 |
| Maryland | 81.8 | May-95 | 70.7 | 28.9 | 59 | 65 |
| Massachusetts | 115.7 | Aug-93 | 84.7 | 41.7 | 51 | 64 |
| Michigan | 233.6 | Apr-91 | 170.0 | 70.9 | 58 | 70 |
| Minnesota | 66.2 | Jun-92 | 57.7 | 39.3 | 32 | 41 |
| Mississippi | 61.8 | Nov-91 | 46.4 | 15.0 | 68 | 76 |
| Missouri | 93.7 | Mar-94 | 80.1 | 45.9 | 43 | 51 |
| Montana | 12.3 | Mar-94 | 10.1 | 4.5 | 56 | 64 |
| Nebraska | 17.2 | Mar-93 | 14.4 | 10.1 | 30 | 41 |
| Nevada | 16.3 | Mar-95 | 13.7 | 6.9 | 50 | 58 |
| New Hampshire | 11.8 | Apr-94 | 9.1 | 5.8 | 36 | 51 |
| New Jersey | 132.6 | Nov-92 | 101.7 | 50.1 | 51 | 62 |
| New Mexico | 34.9 | Nov-94 | 33.4 | 22.7 | 32 | 35 |
| New York | 463.7 | Dec-94 | 418.3 | 248.1 | 41 | 46 |
| North Carolina | 134.1 | Mar-94 | 110.1 | 44.7 | 59 | 67 |
| North Dakota | 6.6 | Apr-93 | 4.8 | 2.9 | 40 | 57 |
| Ohio | 269.8 | Mar-92 | 204.2 | 95.8 | 53 | 64 |
| Oklahoma | 51.3 | Mar-93 | 36.0 | 7.3 | 80 | 86 |
| Oregon | 43.8 | Apr-93 | 29.9 | 17.1 | 43 | 61 |
| Pennsylvania | 212.5 | Sep-94 | 186.3 | 88.0 | 53 | 59 |
| Puerto Rico | 61.7 | Jan-92 | 49.9 | 31.3 | 37 | 49 |
| Rhode Island | 22.9 | Apr-94 | 20.7 | 16.3 | 21 | 29 |
| South Carolina | 54.6 | Jan-93 | 44.1 | 15.5 | 65 | 72 |
| South Dakota | 7.4 | Apr-93 | 5.8 | 2.8 | 52 | 62 |
| Tennessee | 112.6 | Nov-93 | 97.2 | 55.5 | 43 | 51 |
| Texas | 287.5 | Dec-93 | 243.5 | 128.3 | 47 | 55 |
| Utah | 18.7 | Mar-93 | 14.2 | 8.2 | 43 | 56 |
| Vermont | 10.3 | Apr-92 | 8.8 | 5.9 | 33 | 43 |
| Virgin Islands | 1.4 | Dec-95 | 1.4 | 0.8 | 43 | 46 |
| Virginia | 76.0 | Apr-94 | 61.9 | 30.1 | 51 | 60 |
| Washington | 104.8 | Feb-95 | 97.5 | 54.8 | 44 | 48 |
| West Virginia | 41.9 | Apr-93 | 37.0 | 10.7 | 71 | 75 |
| Wisconsin | 82.9 | Jan-92 | 51.9 | 16.4 | 68 | 80 |
| Wyoming | 7.1 | Aug-92 | 4.3 | 0.6 | 87 | 92 |
| United States | 5,098 | Mar-94 | 4,409 | 2,208 | 50 | 57 |
1 Negative values denote percent increase.
Source: U.S. Department of Health and Human Services, Administration for Children and Families, Office of Planning, Research and Evaluation, Division of Data Collection and Analysis.
Table TANF 11. Average Monthly AFDC/TANF Recipients by State, Selected Fiscal Years 1965 –1999 [In thousands]
| 1965 | 1970 | 1975 | 1980 | 1985 | 1989 | 1994 | 1999 | Percent Change | ||
|---|---|---|---|---|---|---|---|---|---|---|
| 1989-94 | 1994-99 | |||||||||
| Alabama | 78 | 123 | 160 | 180 | 151 | 129 | 132 | 48 | 2 | -64 |
| Alaska | 5 | 8 | 12 | 15 | 16 | 19 | 38 | 26 | 96 | -32 |
| Arizona | 40 | 51 | 71 | 51 | 72 | 105 | 201 | 90 | 91 | -55 |
| Arkansas | 30 | 45 | 101 | 85 | 64 | 70 | 69 | 29 | -0 | -58 |
| California | 528 | 1,148 | 1,362 | 1,387 | 1,619 | 1,763 | 2,639 | 1,791 | 50 | -32 |
| Colorado | 42 | 66 | 96 | 77 | 79 | 97 | 119 | 38 | 22 | -68 |
| Connecticut | 59 | 83 | 125 | 139 | 122 | 106 | 166 | 84 | 56 | -50 |
| Delaware | 12 | 20 | 31 | 32 | 24 | 19 | 27 | 15 | 43 | -44 |
| Dist. of Columbia | 20 | 40 | 103 | 85 | 58 | 48 | 74 | 51 | 55 | -31 |
| Florida | 106 | 204 | 265 | 256 | 271 | 327 | 669 | 198 | 105 | -70 |
| Georgia | 71 | 198 | 354 | 221 | 239 | 266 | 393 | 156 | 48 | -60 |
| Guam | 1 | 2 | 3 | 5 | 6 | 4 | 7 | 9 | 67 | 27 |
| Hawaii | 14 | 25 | 47 | 60 | 51 | 43 | 62 | 45 | 45 | -28 |
| Idaho | 10 | 16 | 19 | 21 | 17 | 17 | 23 | 3 | 38 | -88 |
| Illinois | 262 | 368 | 777 | 672 | 735 | 632 | 712 | 368 | 13 | -48 |
| Indiana | 48 | 73 | 162 | 157 | 165 | 147 | 216 | 108 | 47 | -50 |
| Iowa | 44 | 64 | 85 | 104 | 123 | 98 | 110 | 59 | 13 | -46 |
| Kansas | 36 | 53 | 67 | 68 | 67 | 74 | 87 | 33 | 17 | -62 |
| Kentucky | 81 | 129 | 159 | 167 | 160 | 156 | 208 | 99 | 34 | -52 |
| Louisiana | 104 | 202 | 235 | 213 | 230 | 277 | 248 | 109 | -10 | -56 |
| Maine | 19 | 36 | 80 | 60 | 57 | 51 | 64 | 35 | 27 | -45 |
| Maryland | 80 | 131 | 216 | 212 | 195 | 176 | 222 | 88 | 26 | -60 |
| Massachusetts | 94 | 208 | 347 | 350 | 235 | 242 | 307 | 133 | 27 | -57 |
| Michigan | 162 | 253 | 641 | 685 | 691 | 640 | 666 | 261 | 4 | -61 |
| Minnesota | 51 | 76 | 124 | 135 | 152 | 164 | 187 | 123 | 14 | -34 |
| Mississippi | 83 | 115 | 186 | 173 | 155 | 179 | 159 | 39 | -11 | -76 |
| Missouri | 107 | 140 | 260 | 199 | 197 | 203 | 263 | 132 | 30 | -50 |
| Montana | 7 | 13 | 22 | 19 | 22 | 28 | 35 | 14 | 26 | -60 |
| Nebraska | 16 | 30 | 38 | 35 | 44 | 41 | 45 | 33 | 10 | -26 |
| Nevada | 5 | 12 | 14 | 12 | 14 | 20 | 38 | 20 | 89 | -47 |
| New Hampshire | 4 | 9 | 26 | 22 | 14 | 13 | 30 | 15 | 139 | -49 |
| New Jersey | 104 | 286 | 440 | 459 | 367 | 298 | 335 | 165 | 13 | -51 |
| New Mexico | 30 | 51 | 61 | 53 | 51 | 59 | 102 | 79 | 74 | -22 |
| New York | 517 | 1,052 | 1,210 | 1,100 | 1,112 | 979 | 1,255 | 812 | 28 | -35 |
| North Carolina | 111 | 124 | 170 | 198 | 166 | 200 | 333 | 135 | 66 | -59 |
| North Dakota | 8 | 11 | 14 | 13 | 12 | 15 | 16 | 8 | 8 | -50 |
| Ohio | 183 | 266 | 535 | 513 | 673 | 629 | 685 | 276 | 9 | -60 |
| Oklahoma | 73 | 95 | 97 | 89 | 82 | 103 | 131 | 56 | 27 | -57 |
| Oregon | 31 | 75 | 99 | 102 | 74 | 87 | 114 | 44 | 31 | -61 |
| Pennsylvania | 303 | 426 | 627 | 629 | 561 | 523 | 620 | 298 | 19 | -52 |
| Puerto Rico | 202 | 223 | 232 | 168 | 173 | 185 | 183 | 107 | -2 | -41 |
| Rhode Island | 24 | 38 | 52 | 52 | 44 | 42 | 63 | 50 | 50 | -21 |
| South Carolina | 30 | 52 | 135 | 153 | 120 | 107 | 140 | 44 | 30 | -69 |
| South Dakota | 11 | 16 | 25 | 20 | 16 | 19 | 19 | 8 | 1 | -57 |
| Tennessee | 76 | 129 | 201 | 162 | 155 | 195 | 300 | 150 | 53 | -50 |
| Texas | 91 | 214 | 394 | 308 | 363 | 540 | 788 | 309 | 46 | -61 |
| Utah | 22 | 33 | 34 | 37 | 38 | 44 | 50 | 29 | 14 | -41 |
| Vermont | 5 | 12 | 21 | 23 | 22 | 20 | 28 | 18 | 41 | -35 |
| Virgin Islands | 1 | 2 | 4 | 3 | 4 | 3 | 4 | 3 | 11 | -11 |
| Virginia | 46 | 87 | 174 | 166 | 154 | 146 | 195 | 89 | 34 | -54 |
| Washington | 71 | 109 | 143 | 154 | 178 | 219 | 292 | 172 | 33 | -41 |
| West Virginia | 116 | 93 | 69 | 77 | 106 | 109 | 114 | 32 | 5 | -72 |
| Wisconsin | 45 | 79 | 161 | 213 | 288 | 245 | 226 | 47 | -8 | -79 |
| Wyoming | 4 | 5 | 7 | 7 | 10 | 14 | 16 | 2 | 19 | -90 |
| United States | 4,323 | 7,415 | 11,094 | 10,597 | 10,813 | 10,934 | 14,226 | 7,188 | 30 | -49 |
Source: U.S. Department of Health and Human Services, Administration for Children and Families, Office of Planning, Research and Evaluation, Temporary Assistance for Needy Families (TANF). Program, Third Annual Report to Congress, August 2000.
Table TANF 12. AFDC/TANF Recipiency Rates for Total Population by State Selected Fiscal Years 1965 – 1999 [In percent]
| 1965 | 1970 | 1975 | 1980 | 1985 | 1989 | 1994 | 1999 | Percent Change | ||
|---|---|---|---|---|---|---|---|---|---|---|
| 1989-94 | 1994-99 | |||||||||
| Alabama | 2.2 | 3.6 | 4.3 | 4.6 | 3.8 | 3.2 | 3.1 | 1.1 | -3 | -65 |
| Alaska | 1.8 | 2.6 | 3.1 | 3.7 | 3.0 | 3.5 | 6.3 | 4.2 | 78 | -34 |
| Arizona | 2.6 | 2.9 | 3.1 | 1.9 | 2.3 | 2.9 | 4.8 | 1.9 | 66 | -61 |
| Arkansas | 1.5 | 2.3 | 4.7 | 3.7 | 2.8 | 3.0 | 2.8 | 1.1 | -5 | -60 |
| California | 2.9 | 5.7 | 6.3 | 5.8 | 6.1 | 6.0 | 8.4 | 5.4 | 40 | -36 |
| Colorado | 2.2 | 3.0 | 3.7 | 2.6 | 2.5 | 3.0 | 3.3 | 0.9 | 10 | -71 |
| Connecticut | 2.1 | 2.7 | 4.1 | 4.5 | 3.8 | 3.2 | 5.1 | 2.5 | 57 | -50 |
| Delaware | 2.4 | 3.6 | 5.4 | 5.4 | 3.9 | 2.9 | 3.9 | 2.1 | 33 | -47 |
| Dist. of Columbia | 2.5 | 5.3 | 14.6 | 13.3 | 9.2 | 7.7 | 13.1 | 9.9 | 71 | -25 |
| Florida | 1.8 | 3.0 | 3.1 | 2.6 | 2.4 | 2.6 | 4.8 | 1.3 | 85 | -73 |
| Georgia | 1.6 | 4.3 | 7.0 | 4.0 | 4.0 | 4.1 | 5.6 | 2.0 | 35 | -64 |
| Hawaii | 1.9 | 3.2 | 5.4 | 6.2 | 4.9 | 3.9 | 5.3 | 3.8 | 35 | -28 |
| Idaho | 1.4 | 2.2 | 2.3 | 2.2 | 1.7 | 1.7 | 2.0 | 0.2 | 21 | -89 |
| Illinois | 2.5 | 3.3 | 6.9 | 5.9 | 6.4 | 5.5 | 6.0 | 3.0 | 9 | -50 |
| Indiana | 1.0 | 1.4 | 3.0 | 2.9 | 3.0 | 2.7 | 3.8 | 1.8 | 41 | -52 |
| Iowa | 1.6 | 2.3 | 3.0 | 3.6 | 4.3 | 3.5 | 3.9 | 2.1 | 11 | -47 |
| Kansas | 1.6 | 2.4 | 2.9 | 2.9 | 2.8 | 3.0 | 3.4 | 1.2 | 13 | -64 |
| Kentucky | 2.5 | 4.0 | 4.6 | 4.6 | 4.3 | 4.2 | 5.4 | 2.5 | 28 | -54 |
| Louisiana | 2.9 | 5.6 | 6.1 | 5.0 | 5.2 | 6.5 | 5.8 | 2.5 | -11 | -57 |
| Maine | 1.9 | 3.6 | 7.5 | 5.4 | 4.9 | 4.2 | 5.2 | 2.8 | 25 | -46 |
| Maryland | 2.2 | 3.3 | 5.2 | 5.0 | 4.4 | 3.7 | 4.4 | 1.7 | 19 | -62 |
| Massachusetts | 1.8 | 3.7 | 6.0 | 6.1 | 4.0 | 4.0 | 5.1 | 2.2 | 27 | -58 |
| Michigan | 2.0 | 2.9 | 7.0 | 7.4 | 7.6 | 6.9 | 6.9 | 2.6 | 0 | -62 |
| Minnesota | 1.4 | 2.0 | 3.2 | 3.3 | 3.6 | 3.8 | 4.1 | 2.6 | 9 | -37 |
| Mississippi | 3.6 | 5.2 | 7.8 | 6.9 | 6.0 | 6.9 | 6.0 | 1.4 | -14 | -77 |
| Missouri | 2.4 | 3.0 | 5.4 | 4.0 | 3.9 | 4.0 | 5.0 | 2.4 | 25 | -52 |
| Montana | 1.0 | 1.9 | 2.9 | 2.4 | 2.7 | 3.5 | 4.1 | 1.6 | 18 | -61 |
| Nebraska | 1.1 | 2.0 | 2.5 | 2.2 | 2.8 | 2.6 | 2.8 | 2.0 | 7 | -28 |
| Nevada | 1.2 | 2.4 | 2.3 | 1.5 | 1.4 | 1.8 | 2.6 | 1.1 | 48 | -57 |
| New Hampshire | 0.7 | 1.2 | 3.1 | 2.4 | 1.4 | 1.2 | 2.7 | 1.3 | 133 | -52 |
| New Jersey | 1.5 | 4.0 | 6.0 | 6.2 | 4.9 | 3.9 | 4.2 | 2.0 | 10 | -52 |
| New Mexico | 3.0 | 5.0 | 5.3 | 4.1 | 3.5 | 3.9 | 6.2 | 4.6 | 59 | -26 |
| New York | 2.9 | 5.8 | 6.7 | 6.3 | 6.2 | 5.4 | 6.9 | 4.5 | 27 | -35 |
| North Carolina | 2.2 | 2.4 | 3.1 | 3.4 | 2.6 | 3.1 | 4.7 | 1.8 | 54 | -63 |
| North Dakota | 1.2 | 1.7 | 2.1 | 2.0 | 1.8 | 2.4 | 2.6 | 1.3 | 9 | -49 |
| Ohio | 1.8 | 2.5 | 5.0 | 4.8 | 6.3 | 5.8 | 6.2 | 2.4 | 6 | -60 |
| Oklahoma | 3.0 | 3.7 | 3.5 | 2.9 | 2.5 | 3.3 | 4.0 | 1.7 | 24 | -59 |
| Oregon | 1.6 | 3.6 | 4.3 | 3.9 | 2.8 | 3.1 | 3.7 | 1.3 | 18 | -64 |
| Pennsylvania | 2.6 | 3.6 | 5.3 | 5.3 | 4.8 | 4.4 | 5.1 | 2.5 | 17 | -52 |
| Rhode Island | 2.7 | 4.0 | 5.5 | 5.5 | 4.5 | 4.2 | 6.3 | 5.0 | 51 | -20 |
| South Carolina | 1.2 | 2.0 | 4.6 | 4.9 | 3.6 | 3.1 | 3.8 | 1.1 | 23 | -70 |
| South Dakota | 1.6 | 2.4 | 3.6 | 2.9 | 2.3 | 2.7 | 2.6 | 1.1 | -3 | -58 |
| Tennessee | 2.0 | 3.3 | 4.7 | 3.5 | 3.3 | 4.0 | 5.8 | 2.7 | 44 | -53 |
| Texas | 0.9 | 1.9 | 3.1 | 2.1 | 2.2 | 3.2 | 4.3 | 1.5 | 34 | -64 |
| Utah | 2.2 | 3.1 | 2.8 | 2.5 | 2.3 | 2.6 | 2.6 | 1.4 | 1 | -47 |
| Vermont | 1.4 | 2.6 | 4.4 | 4.4 | 4.2 | 3.5 | 4.8 | 3.0 | 36 | -37 |
| Virginia | 1.0 | 1.9 | 3.4 | 3.1 | 2.7 | 2.4 | 3.0 | 1.3 | 25 | -56 |
| Washington | 2.4 | 3.2 | 4.0 | 3.7 | 4.0 | 4.6 | 5.5 | 3.0 | 18 | -45 |
| West Virginia | 6.4 | 5.3 | 3.7 | 4.0 | 5.5 | 6.0 | 6.3 | 1.8 | 4 | -72 |
| Wisconsin | 1.1 | 1.8 | 3.5 | 4.5 | 6.1 | 5.0 | 4.4 | 0.9 | -12 | -80 |
| Wyoming | 1.1 | 1.5 | 1.8 | 1.4 | 2.0 | 3.0 | 3.4 | 0.4 | 15 | -90 |
| United States | 2.1 | 3.5 | 5.0 | 4.6 | 4.5 | 4.4 | 5.4 | 2.6 | 24 | -52 |
Note: Recipiency rate refers to the average monthly number of AFDC recipients in each State during the given fiscal year expressed as a percent of the total resident population as of July 1 of that year. The numerators are from Table TANF 11.
Sources: U. S. Department of Health and Human Services and U.S. Bureau of the Census, (Resident population by state available on line at http://www.census.gov/population/estimates/state/).
Table TANF 13. Average Number of AFDC/TANF Child Recipients By State, Selected Fiscal Years1965 – 1999 [In thousands]
| 1965 | 1970 | 1975 | 1980 | 1985 | 1989 | 1994 | 1999 | Percent 1989-94 | Change 1994-99 | |
|---|---|---|---|---|---|---|---|---|---|---|
| Alabama | 62 | 96 | 119 | 129 | 105 | 92 | 96 | 38 | 4 | -60 |
| Alaska | 4 | 6 | 9 | 10 | 10 | 13 | 24 | 17 | 90 | -28 |
| Arizona | 31 | 39 | 54 | 38 | 50 | 74 | 136 | 43 | 85 | -69 |
| A rkansas | 23 | 34 | 75 | 62 | 45 | 50 | 49 | 22 | -0 | -57 |
| California | 391 | 816 | 943 | 932 | 1,070 | 1,186 | 1,804 | 1,381 | 52 | -23 |
| Colorado | 33 | 50 | 68 | 53 | 53 | 66 | 80 | 30 | 22 | -63 |
| Connecticut | 43 | 62 | 92 | 97 | 82 | 71 | 111 | 60 | 56 | -46 |
| Delaware | 9 | 15 | 23 | 22 | 16 | 13 | 19 | 13 | 41 | -32 |
| Dist. of Columbia | 16 | 31 | 75 | 59 | 43 | 38 | 51 | 40 | 33 | -21 |
| Florida | 85 | 160 | 200 | 184 | 191 | 235 | 463 | 155 | 97 | -66 |
| Georgia | 54 | 150 | 261 | 161 | 166 | 187 | 274 | 116 | 47 | -58 |
| Guam | 1 | 1 | 2 | 4 | 4 | 3 | 5 | 7 | 63 | 39 |
| Hawaii | 10 | 18 | 33 | 40 | 33 | 28 | 41 | 31 | 45 | -23 |
| Idaho | 7 | 11 | 14 | 14 | 11 | 11 | 16 | 2 | 36 | -86 |
| Illinois | 202 | 283 | 562 | 473 | 493 | 432 | 486 | 277 | 12 | -43 |
| Indiana | 36 | 55 | 119 | 111 | 111 | 100 | 145 | 78 | 45 | -47 |
| Iowa | 32 | 46 | 59 | 69 | 77 | 63 | 72 | 40 | 13 | -44 |
| Kansas | 28 | 41 | 50 | 49 | 45 | 50 | 59 | 24 | 17 | -59 |
| Kentucky | 58 | 93 | 113 | 118 | 107 | 105 | 137 | 72 | 31 | -47 |
| Louisiana | 79 | 157 | 177 | 156 | 163 | 195 | 180 | 105 | -8 | -42 |
| Maine | 14 | 26 | 56 | 40 | 36 | 32 | 40 | 24 | 25 | -39 |
| Maryland | 61 | 100 | 157 | 145 | 126 | 117 | 151 | 64 | 28 | -57 |
| Massachusetts | 71 | 153 | 242 | 228 | 152 | 154 | 197 | 96 | 28 | -51 |
| Michigan | 119 | 190 | 454 | 460 | 441 | 414 | 439 | 201 | 6 | -54 |
| Minnesota | 39 | 58 | 89 | 91 | 95 | 105 | 124 | 89 | 18 | -28 |
| Mississippi | 66 | 93 | 144 | 128 | 112 | 129 | 116 | 33 | -10 | -71 |
| Missouri | 82 | 106 | 193 | 135 | 129 | 134 | 176 | 102 | 31 | -42 |
| Montana | 6 | 10 | 16 | 13 | 15 | 18 | 23 | 9 | 28 | -60 |
| Nebraska | 12 | 23 | 28 | 25 | 29 | 28 | 31 | 23 | 10 | -25 |
| Nevada | 4 | 9 | 10 | 8 | 9 | 14 | 27 | 15 | 89 | -43 |
| New Hampshire | 3 | 7 | 18 | 15 | 9 | 8 | 19 | 11 | 130 | -45 |
| New Jersey | 79 | 209 | 316 | 318 | 247 | 205 | 228 | 125 | 11 | -45 |
| New Mexico | 23 | 39 | 45 | 35 | 34 | 41 | 66 | 53 | 64 | -20 |
| New York | 380 | 759 | 862 | 759 | 729 | 648 | 813 | 568 | 26 | -30 |
| North Carolina | 83 | 94 | 125 | 141 | 113 | 136 | 223 | 102 | 63 | -54 |
| North Dakota | 6 | 8 | 10 | 9 | 8 | 10 | 11 | 6 | 6 | -43 |
| Ohio | 136 | 198 | 373 | 348 | 424 | 411 | 455 | 210 | 11 | -54 |
| Oklahoma | 55 | 71 | 74 | 65 | 57 | 71 | 90 | 37 | 27 | -59 |
| Oregon | 23 | 52 | 67 | 65 | 49 | 58 | 76 | 31 | 30 | -60 |
| Pennsylvania | 217 | 307 | 430 | 432 | 369 | 348 | 417 | 212 | 20 | -49 |
| Puerto Rico | 161 | 166 | 170 | 118 | 116 | 126 | 124 | 78 | -2 | -37 |
| Rhode Island | 18 | 27 | 37 | 36 | 28 | 28 | 41 | 29 | 50 | -31 |
| South Carolina | 24 | 40 | 100 | 109 | 84 | 77 | 102 | 34 | 33 | -67 |
| South Dakota | 8 | 12 | 18 | 15 | 11 | 13 | 14 | 6 | 3 | -54 |
| Tennessee | 58 | 99 | 150 | 115 | 105 | 133 | 203 | 111 | 53 | -45 |
| Texas | 68 | 162 | 292 | 225 | 256 | 378 | 549 | 220 | 45 | -60 |
| Utah | 16 | 23 | 23 | 24 | 24 | 28 | 33 | 19 | 17 | -44 |
| Vermont | 4 | 8 | 14 | 14 | 14 | 12 | 17 | 12 | 39 | -32 |
| Virgin Islands | 1 | 2 | 3 | 2 | 3 | 3 | 3 | 3 | 9 | -2 |
| Virginia | 35 | 66 | 125 | 116 | 103 | 100 | 134 | 64 | 34 | -52 |
| Washington | 50 | 76 | 95 | 97 | 113 | 141 | 187 | 121 | 32 | -35 |
| West Virginia | 80 | 65 | 47 | 58 | 64 | 67 | 72 | 21 | 7 | -71 |
| Wisconsin | 34 | 60 | 116 | 142 | 181 | 161 | 153 | 36 | -5 | -77 |
| Wyoming | 3 | 4 | 5 | 5 | 7 | 9 | 11 | 1 | 22 | -88 |
| United States | 3,242 | 5,483 | 7,952 | 7,320 | 7,165 | 7,370 | 9,611 | 5,319 | 30 | -45 |
Source: U.S. Department of Health and Human Services,Administration for Children and Families, Office of Planning, Research and evaluation, Temporary Assistance for Needy Families (TANF). Program, Third annual Report to Congress, August 2000.
Table TANF 14. AFDC/TANF Recipiency Rates for Children by State, Selected Fiscal Years 1965– 1999 [In percent]
| 1965 | 1970 | 1975 | 1980 | 1985 | 1989 | 1994 | 1999 | Percent | Change | |
|---|---|---|---|---|---|---|---|---|---|---|
| 1989-94 | 1994-99 | |||||||||
| Alabama | 4.6 | 7.7 | 9.9 | 11.1 | 9.7 | 8.6 | 8.9 | 3.6 | 4 | -60 |
| Alaska | 3.1 | 5.0 | 6.2 | 8.0 | 5.9 | 7.3 | 12.8 | 8.8 | 76 | -31 |
| Arizona | 4.8 | 6.0 | 7.2 | 4.8 | 5.9 | 7.6 | 12.1 | 3.2 | 60 | -74 |
| Arkansas | 3.1 | 5.2 | 10.9 | 9.3 | 7.1 | 7.9 | 7.7 | 3.3 | -3 | -58 |
| California | 6.0 | 12.3 | 14.6 | 14.6 | 15.6 | 15.6 | 20.8 | 15.5 | 33 | -26 |
| Colorado | 4.4 | 6.4 | 8.4 | 6.5 | 6.1 | 7.6 | 8.3 | 2.8 | 10 | -66 |
| Connecticut | 4.4 | 6.1 | 9.8 | 11.8 | 10.8 | 9.5 | 14.2 | 7.2 | 49 | -49 |
| Delaware | 4.7 | 7.5 | 12.3 | 13.4 | 10.2 | 8.1 | 10.5 | 6.9 | 30 | -34 |
| Dist. of Columbia | 6.0 | 13.8 | 41.1 | 40.9 | 33.9 | 30.7 | 44.5 | 42.1 | 45 | -5 |
| Florida | 4.3 | 7.6 | 8.4 | 7.8 | 7.6 | 8.4 | 14.1 | 4.4 | 68 | -69 |
| Georgia | 3.2 | 9.1 | 15.5 | 9.8 | 10.1 | 10.8 | 14.6 | 5.6 | 35 | -61 |
| Hawaii | 3.6 | 6.5 | 11.7 | 14.5 | 11.6 | 10.1 | 13.6 | 10.9 | 35 | -20 |
| Idaho | 2.7 | 4.2 | 4.8 | 4.7 | 3.6 | 3.7 | 4.6 | 0.6 | 22 | -87 |
| Illinois | 5.3 | 7.5 | 16.0 | 14.6 | 16.1 | 14.5 | 15.7 | 8.7 | 8 | -45 |
| Indiana | 2.0 | 3.0 | 6.9 | 6.9 | 7.5 | 6.9 | 9.8 | 5.1 | 43 | -48 |
| Iowa | 3.2 | 4.7 | 6.6 | 8.4 | 10.2 | 8.8 | 9.9 | 5.6 | 12 | -44 |
| Kansas | 3.5 | 5.4 | 7.3 | 7.5 | 6.9 | 7.6 | 8.5 | 3.4 | 12 | -60 |
| Kentucky | 4.9 | 8.3 | 10.2 | 10.9 | 10.5 | 10.9 | 14.1 | 7.4 | 29 | -47 |
| Louisiana | 5.5 | 11.3 | 13.2 | 11.8 | 12.2 | 15.5 | 14.6 | 8.8 | -6 | -40 |
| Maine | 3.9 | 7.7 | 16.4 | 12.5 | 11.7 | 10.4 | 13.1 | 8.4 | 26 | -36 |
| Maryland | 4.6 | 7.3 | 11.9 | 12.4 | 11.4 | 10.2 | 12.0 | 4.9 | 18 | -59 |
| Massachusetts | 3.8 | 8.1 | 14.2 | 15.3 | 11.2 | 11.4 | 13.9 | 6.6 | 22 | -53 |
| Michigan | 3.7 | 5.8 | 15.0 | 16.7 | 17.7 | 16.9 | 17.4 | 7.8 | 3 | -55 |
| Minnesota | 2.9 | 4.2 | 7.0 | 7.7 | 8.5 | 9.2 | 10.1 | 7.0 | 10 | -30 |
| Mississippi | 7.0 | 11.1 | 17.3 | 15.7 | 14.0 | 17.1 | 15.3 | 4.4 | -10 | -71 |
| Missouri | 5.2 | 6.9 | 13.2 | 9.9 | 9.8 | 10.2 | 12.9 | 7.3 | 26 | -43 |
| Montana | 2.0 | 4.0 | 6.6 | 5.7 | 6.1 | 7.9 | 9.7 | 4.1 | 22 | -58 |
| Nebraska | 2.3 | 4.4 | 5.8 | 5.5 | 6.8 | 6.5 | 7.0 | 5.2 | 8 | -26 |
| Nevada | 2.5 | 5.2 | 5.4 | 3.8 | 3.9 | 5.0 | 7.1 | 3.1 | 40 | -56 |
| New Hampshire | 1.4 | 2.6 | 6.9 | 5.8 | 3.7 | 3.1 | 6.6 | 3.5 | 118 | -47 |
| New Jersey | 3.4 | 8.8 | 14.1 | 16.0 | 13.5 | 11.3 | 11.7 | 6.2 | 3 | -47 |
| New Mexico | 5.2 | 9.5 | 10.9 | 8.5 | 7.8 | 9.0 | 13.5 | 10.7 | 50 | -21 |
| New York | 6.3 | 13.0 | 16.3 | 16.2 | 16.7 | 15.1 | 18.0 | 12.8 | 19 | -29 |
| North Carolina | 4.4 | 5.3 | 7.2 | 8.5 | 7.1 | 8.5 | 12.6 | 5.3 | 49 | -58 |
| North Dakota | 2.3 | 3.6 | 4.9 | 4.7 | 4.3 | 5.7 | 6.3 | 3.9 | 12 | -39 |
| Ohio | 3.6 | 5.3 | 10.9 | 11.2 | 14.7 | 14.6 | 16.0 | 7.4 | 9 | -54 |
| Oklahoma | 6.4 | 8.5 | 8.7 | 7.6 | 6.3 | 8.3 | 10.4 | 4.2 | 24 | -60 |
| Oregon | 3.3 | 7.4 | 9.6 | 9.0 | 6.9 | 8.2 | 9.7 | 3.7 | 18 | -62 |
| Pennsylvania | 5.5 | 8.0 | 12.3 | 13.8 | 12.9 | 12.4 | 14.4 | 7.4 | 16 | -48 |
| Rhode Island | 5.9 | 9.1 | 13.3 | 14.7 | 12.6 | 12.1 | 17.5 | 11.9 | 44 | -32 |
| South Carolina | 2.3 | 4.2 | 10.4 | 11.6 | 9.1 | 8.3 | 10.8 | 3.5 | 30 | -67 |
| South Dakota | 3.1 | 5.0 | 8.2 | 7.1 | 5.7 | 6.7 | 6.6 | 3.2 | -1 | -52 |
| Tennessee | 4.2 | 7.5 | 11.3 | 8.9 | 8.6 | 10.9 | 15.7 | 8.3 | 44 | -47 |
| Texas | 1.7 | 4.1 | 7.1 | 5.2 | 5.4 | 7.9 | 10.4 | 3.9 | 32 | -63 |
| Utah | 3.7 | 5.4 | 5.0 | 4.4 | 4.0 | 4.5 | 4.9 | 2.6 | 9 | -47 |
| Vermont | 2.7 | 5.4 | 9.3 | 9.9 | 9.9 | 8.8 | 11.7 | 8.4 | 33 | -28 |
| Virginia | 2.2 | 4.1 | 7.9 | 7.9 | 7.1 | 6.7 | 8.4 | 3.9 | 26 | -54 |
| Washington | 4.7 | 6.5 | 8.5 | 8.5 | 9.7 | 11.5 | 13.3 | 8.1 | 16 | -39 |
| West Virginia | 12.2 | 11.2 | 8.4 | 10.4 | 12.6 | 14.8 | 16.8 | 5.1 | 13 | -70 |
| Wisconsin | 2.2 | 3.8 | 7.8 | 10.5 | 14.2 | 12.6 | 11.4 | 2.7 | -9 | -77 |
| Wyoming | 2.1 | 3.2 | 4.1 | 3.4 | 4.1 | 6.6 | 8.1 | 1.0 | 24 | -87 |
| United States | 4.4 | 7.6 | 11.6 | 11.3 | 11.2 | 11.4 | 14.0 | 7.5 | 22 | -47 |
Note: Recipiency rate refers to the average monthly number of AFDC child recipients in each State during the given fiscal year as a percent of the resident population under 18 years of age as of july 1 of that year. The numerators are from Table TANF 13.
Sources: U. S. Department of Health and Human Services and U.S. Bureau of the Census, (Resident population by state available on line at http://www.census.gov/population/estimates/state/).
Endnotes
[1] States are allowed to use TANF funds on a variety of services, including employment and training services, domestic violence services, and child care, transportation, and other support services. Families receiving such services, however, should generally not be counted as recipients of TANF ‘assistance.” Under the final regulations for TANF, “assistance” includes primarily payments directed at ongoing basic needs. It includes payments when individuals are participating in community service and work experience (or other work activities) as a condition of receiving payments (e.g., workfare). In addition to cash assistance, the definition also includes certain child care and transportation benefits (provided the families are not employed). It excludes, however, such things as: non-recurrent, short-term benefits; services without a cash value, such as education and training, case management, job search, and counseling; and benefits such as child care and transportation when provided to employed families.
Food Stamp Program
The Food Stamp Program, administered by the U.S. Department of Agriculture’s (USDA) Food and Nutrition Service, is the largest food assistance program in the country, reaching more poor individuals over the course of a year than any other public assistance program. Unlike many other public assistance programs, the Food Stamp Program has few categorical requirements for eligibility, such as the presence of children, elderly or disabled individuals in a household. As a result, the program offers assistance to a large and diverse population of needy persons, many of whom are not eligible for other forms of assistance.
The Food Stamp Program was designed primarily to increase the food purchasing power of eligible low-income households to the point where they can buy a nutritionally adequate low-cost diet. Participating households are expected to be able to devote 30 percent of their counted monthly cash income (after adjusting for various deductions) to food purchases. Food stamp benefits then make up the difference between the household’s expected contribution to its food costs and an amount judged to be sufficient to buy an adequate low-cost diet. This amount, the maximum food stamp benefit level, is derived from USDA’s lowest-cost food plan, the Thrifty Food Plan (TFP).
The Federal government is responsible for virtually all of the rules that govern the program, and, with limited variations, these rules are nationally uniform, as are the benefit levels. Nonetheless, States, the District of Columbia, Guam, and the Virgin Islands, through their local welfare offices, have primary responsibility for the day-to-day administration of the program. They determine eligibility, calculate benefits, and issue food stamp allotments. The Food Stamp Act provides 100 percent federal funding of food stamp benefits. States and other jurisdictions have responsibility for about half the cost of state and local food stamp agency administration.
In addition to the regular Food Stamp Program, the Food Stamp Act authorizes alternative programs in Puerto Rico, the Northern Mariana Islands, and American Samoa. The largest of these, the Nutrition Assistance Program in Puerto Rico, had an average of 1.2 million participants in 1999, funded under a Federal block grant of $1.2 billion. Unless noted otherwise, the food stamp caseload and expenditure data in this Appendix include costs for the Nutrition Assistance Program in Puerto Rico. Prior to 1982, the regular Food Stamp Program operated in Puerto Rico, under modified eligibility and benefit rules.
The Food Stamp Program has financial, employment/training-related and “categorical” tests for eligibility. The basic food stamp beneficiary unit is the “household.” Generally, individuals living together constitute a single food stamp household if they customarily purchase food and prepare meals together. Members of the same household must apply together, and their income, expenses, and assets normally are aggregated in determining food stamp eligibility and benefits. Except for households composed entirely of TANF, SSI, or general assistance recipients (who generally are automatically eligible for food stamps), monthly cash income is the primary food stamp eligibility determinant. Unless exempt, adult applicants for food stamps must register for work, typically with the welfare agency or a state employment service office. To maintain eligibility, they must accept a suitable job if offered one and fulfill any work, job search, or training requirements established by the administering welfare agencies.
Food stamp benefits are a function of a household’s size, its net monthly income, its assets, and maximum monthly benefit levels. Allotments are not taxable and food stamp purchases may not be charged sales taxes. Receipt of food stamps does not affect eligibility for or benefits provided by other welfare programs, although some programs use food stamp participation as a “trigger” for eligibility and others take into account the general availability of food stamps in deciding what level of benefits to provide.
Recent Legislative and Regulatory Changes.
Title IV and Subtitle A of title VIII of the PRWORA contains major and extensive revisions to the Food Stamp Program, including strong work requirements on able-bodied adults without dependents, restricted benefits for legal immigrants, and a reduction in maximum benefits. These three provisions, and subsequent amendments, are discussed below; their impact on program participation and expenditures begins to appear in food stamp administrative data for 1997, with the fuller impact shown in data for 1998.
First, a new work requirement was added for able-bodied adult food stamp recipients without dependents (ABAWDs). Unless exempt, ABAWDs between the ages of 18 and 50 are not eligible for benefits for more than 3 months in every 36-month period unless they are (1) working at least 20 hours a week; (2) participating in and complying with a work program for at least 20 hours a week; or (3) participating in and complying with a workfare program. Under the original legislation, the Department of Agriculture was authorized to waive application of the work requirement to any group of individuals at the request of the state agency, if a determination is made that the area where they reside has an unemployment rate over 10 percent or does not have a sufficient number of jobs to provide them employment. The provision was further moderated under the Balanced Budget Act of 1997 (Public Law 105-33), which allowed states to exempt up to 15 percent of the ABAWD caseload (beyond those subject to waivers) and which increased funds for the Food Stamp employment and training program for the creation of job slots for able-bodied adults subject to time limits.
Separately, title IV of PRWORA made significant changes in the eligibility of noncitizens for Food Stamp benefits. As first enacted, most qualified aliens (including legal immigrants -- illegal aliens are already ineligible) were barred from Food Stamps until citizenship. Subsequently, the Agriculture Research, Extension and Education Reform Act of 1998 (Public Law 105-185] restored food stamp eligibility to certain groups of qualified aliens who were legally residing in the United States before passage of PRWORA (August 22, 1996). Specifically, the ban on food stamp eligibility was lifted for children, the disabled and people who were 65 on August 22, 1996.
Finally, the 1996 legislation restrained growth in future program expenditures by making changes in the benefit structure for eligible participants, including a reduction in the maximum food stamp allotment. Other provisions of the 1996 act disqualified from eligibility those convicted of drug-related felonies and gave states the option to disqualify individuals, both custodial and noncustodial parents, from food stamps when they do not cooperate with child support agencies or are in arrears in their child support.
Recent regulatory and legislative changes have been made to increase access to food stamps among working poor families. Regulatory changes announced in July 1999 and expanded in November 2000 allow states to reduce reporting requirements and make it easier for working families to report income changes on a semi-annual basis. Under the November 2000 regulations, states also have the option of providing a three-month transitional food stamp benefit to most families leaving TANF. In addition, the Agriculture Appropriations Bill for 2001 (P.L. 106-387) provides states with the option of liberalizing the treatment of vehicle assets to align with the states’ TANF rules on vehicle eligibility. These changes were intended to address concerns that some of the decline in food stamp caseloads may be leaving poor families without nutritional assistance as they make the transition from welfare dependence to full self-sufficiency.
Food Stamp Program Data.
The following six tables and accompanying figure provide information about the Food Stamp Program, including information about the Nutrition Assistance Program in Puerto Rico:
- Tables FSP 1-2 and Figure FSP 1 present national caseload and expenditure trend data on the Food Stamp program, as discussed below;
- Table FSP 3 presents some demographic characteristics of the food stamp caseload; and
- Tables FSP 4-6 present some state-by-state trend data on the Food Stamp program through fiscal year 1999.
Food Stamp Caseload Trends (Tables FSP 1-2). Average monthly food stamp participation (including participants in Puerto Rico’s block grant) has continued to fall from its peak of 28.9 million in an average month in 1994 to an average of 19.3 million persons in 1999. Both in absolute numbers and as a percentage of the population, food stamp recipiency is lower than at any point in the past twenty years. See also Table IND 3b and Table IND 4b in Chapter II for further data on the recent decline in food stamp recipiency and participation rates.
Considerable research has demonstrated that the Food Stamp program is responsive to economic changes, with participation increasing in times of economic downturns and decreasing in times of economic growth (see Figure FSP 1). Economic conditions alone did not explain the caseload growth in the late 1980s and early 1990s, however. A Congressionally mandated study in 1990 concluded that a variety of factors contributed to this caseload growth, including expansions in Medicaid eligibility, and changes in immigration laws, particularly the legalization of undocumented aliens, as well as a rise in unemployment (McConell, 1991). Longer spells of participation also contributed to the caseload increase, according to an analysis of longitudinal data from the Survey on Income and Program Participation. (Gleason, 1998).
Economic conditions were a significant factor in explaining the drop in food stamp caseload since 1994, according to an Economic Research Service review of recent research (ERS, 2000). Several econometric models suggest that economic variables explain between 25 and 44 percent of the decline in caseload. The full effect of the economy may be even higher, to the extent that some of the unexplained variation in the models reflects local economic conditions not captured in state-level economic variables.
Policy changes, most notably the enactment of the Personal Responsibility Act of 1996, have also contributed to the recent decline in food stamp caseload. The most direct impact was the elimination of eligibility for most legal immigrants and for many childless adults aged 18-50. Participation for these two groups fell sharply between 1994 and 1998 (Genser, 1999). In addition, changes in TANF policy may have affected food stamp participation, although these effects are less certain. Many studies of families leaving TANF cash assistance have found that many families leave the Food Stamp Program as well, despite appearing eligible for food stamp benefits. Econometric studies of the effects of specific changes in TANF policy, however, have found that only a small share of the decline in state food stamp caseloads was associated with waviers to AFDC policies. Increased stigma about welfare use and unintentional diversion from the Food Stamp Program may be additional factors affecting food stamp participation. Finally, a study of trends in Food Stamp Program Participation rates (USDA, 2000) found that the program is reaching a smaller percentage of eligible individuals in 1998 than it did during the three previous years.
Food Stamp Expenditures. Total program costs, shown in Table FSP 2, have declined in recent years, along with the decline in caseloads. In fiscal year 1999, total program costs (including Puerto Rico) were $19 billion, reaching their lowest levels since 1980, after adjusting for inflation. (Average monthly participation in fiscal year 1999 was 21.0 million). Average monthly benefits per person have also declined in recent years after adjusting for inflation. Benefits were $72 per person in fiscal year 1999, considerably lower than the $82 per person benefit (in constant dollars) paid in 1992, but higher than the $68 per person paid in 1987.
Food Stamp Household Characteristics. As shown in FSP 3, the proportion of food stamp households with earnings has increased, from about 20 percent for most of the 1980s and early 1990s, to 26 percent in 1998 and 27 percent in 1999. At the same time, the proportion of households with income from AFDC/TANF has declined, from 42 percent in 1982 to 27 percent in 1999, following the dramatic decline in AFDC/TANF caseloads. Over half of all food stamp households have children, although the proportion has declined somewhat from over 60 percent in most of the 1980s and 1990s to 56 percent in 1999. The vast majority (89 percent) of households have incomes below the federal poverty guidelines.
Figure FSP 1. Persons Receiving Food Stamps
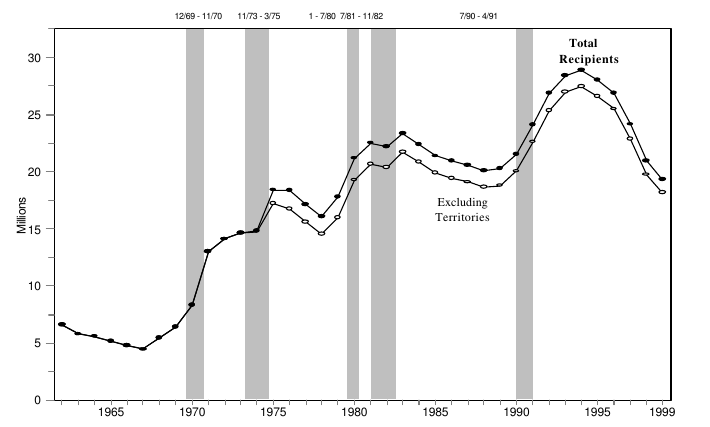
Note: Shaded areas are periods of recession.
Sources: U.S. Department of Agriculture, Food and Nutrition Service, National Data Bank.
Table FSP 1. Trends in Food Stamp Caseloads, Selected Years 1962 – 1999
| FoodStamp Participants 1 | Participants as a Percent of: | Child Participants As a Percent of: | ||||||
|---|---|---|---|---|---|---|---|---|
| Fiscal Year | Including Territories2(in thousands) | Excluding Territories (in thousands) | Children Excld Terr. (in thousands) | Total Population3 | All Poor Persons3 | Pre-transfer Poverty Population4 | Total Child Population3 | Children in Poverty3 |
| 1962 | 6,554 | 6,554 | NA | 3.5 | 17.0 | NA | NA | NA |
| 1965 | 5,166 | 5,166 | NA | 2.7 | 15.5 | NA | NA | NA |
| 1970 | 8,277 | 8,277 | NA | 4.1 | 32.6 | NA | NA | NA |
| 1971 | 13,042 | 13,042 | NA | 6.3 | 51.0 | NA | NA | NA |
| 1972 | 14,102 | 14,102 | NA | 6.7 | 57.7 | NA | NA | NA |
| 1973 | 14,641 | 14,641 | NA | 6.9 | 63.7 | NA | NA | NA |
| 1974 | 14,784 | 14,765 | NA | 6.9 | 63.2 | NA | NA | NA |
| 1975 5 | 18,308 | 17,217 | NA | 8.0 | 66.2 | NA | NA | NA |
| 1976 | 18,240 | 16,733 | 9,126 | 7.7 | 66.7 | NA | 13.8 | 88.8 |
| 1977 | 17,014 | 15,579 | NA | 7.1 | 62.7 | NA | NA | NA |
| 1978 | 15,988 | 14,503 | NA | 6.5 | 58.9 | NA | NA | NA |
| 1979 6 | 17,682 | 15,976 | NA | 7.1 | 60.9 | 57.1 | NA | NA |
| 1980 | 21,082 | 19,253 | 9,493 | 8.5 | 65.5 | 60.7 | 15.5 | 85.6 |
| 1981 | 22,430 | 20,654 | 9,674 | 9.0 | 64.6 | 60.8 | 15.5 | 78.4 |
| 1982 | 22,055 | 20,392 | 9,545 | 8.8 | 59.0 | 56.3 | 15.3 | 70.3 |
| 1983 | 23,195 | 21,667 | 10,783 | 9.3 | 61.1 | 58.5 | 17.4 | 78.4 |
| 1984 | 22,384 | 20,796 | 10,372 | 8.8 | 61.7 | 58.5 | 16.8 | 78.2 |
| 1985 | 21,379 | 19,847 | 9,824 | 8.3 | 60.0 | 56.6 | 15.8 | 76.1 |
| 1986 | 20,909 | 19,381 | 9,846 | 8.1 | 59.9 | 56.2 | 15.7 | 76.5 |
| 1987 | 20,583 | 19,072 | 9,765 | 7.9 | 59.2 | 55.6 | 15.5 | 75.4 |
| 1988 | 20,095 | 18,613 | 9,363 | 7.6 | 58.6 | 55.2 | 14.8 | 75.1 |
| 1989 | 20,266 | 18,778 | 9,429 | 7.6 | 59.6 | 55.6 | 14.9 | 74.9 |
| 1990 | 21,547 | 20,038 | 10,127 | 8.0 | 59.7 | 55.7 | 15.8 | 75.4 |
| 1991 | 24,115 | 22,599 | 11,952 | 9.0 | 63.3 | 59.3 | 18.4 | 83.3 |
| 1992 | 26,886 | 25,369 | 13,349 | 9.9 | 66.7 | 64.0 | 20.2 | 87.3 |
| 1993 | 28,422 | 26,952 | 14,196 | 10.5 | 68.6 | 63.8 | 21.2 | 90.3 |
| 1994 | 28,879 | 27,434 | 14,391 | 10.5 | 72.2 | 66.9 | 21.2 | 94.1 |
| 1995 | 27,989 | 26,579 | 13,860 | 10.1 | 73.0 | 67.6 | 20.2 | 94.5 |
| 1996 | 26,872 | 25,494 | 13,189 | 9.6 | 69.9 | 64.7 | 19.1 | 91.2 |
| 1997 | 24,148 | 22,820 | 11,847 | 8.5 | 64.3 | 60.0 | 17.0 | 83.9 |
| 1998 | 20,970 | 19,746 | 10,524 | 7.3 | 57.4 | 57.9 | 15.1 | 78.1 |
| 1999 | 19,322 | 18,149 | 9,354 | 6.7 | 56.4 | 52.6 | 13.3 | 77.2 |
1 Total participants includes all participating States, the District of Columbia, and the territories (including Puerto Rico). The number of child participants includes only the participating States and D.C. (the territories are not included). From 1962 to 1983 the number of participants includes the Family Food Assistance Program (FFAP) which was largely replaced by the Food Stamp program in 1975. The FFAP participants (as of December) for the seven years shown during the period from 1962 to 1974 were respectively: 6,411; 4,742; 3,977; 3,642; 3,002; 2,441; and 1,406 (all in thousands). From 1975 to 1983 the number of FFAP participants averaged only 88 thousand. The monthly average number of participants for 1970-76 is computed as an average from October of the prior calendar year to September, the span of the fiscal year since 1977.
2 Participation figures in column 1 from 1982 on include enrollment in Puerto Rico’s Nutrition Assistance Program (averaging 1.2 to 1.5 million persons a month under the nutrition assistance grant and higher figures in earlier years under Food Stamps) as shown in Table FSP 5.
3 Includes all participating States and the District of Columbia only — the territories are excluded from both numerator and denominator. Population numbers used as denominators are the resident population — see Current Population Reports, Series P25-1106. For the persons living in poverty used as denominators, see Current Population Reports, Series P60-210.
4 The pretransfer poverty population used as denominator is the number of all persons in families or living alone whose income (cash income plus social insurance plus Social Security but before taxes and means-tested transfers) falls below the appropriate poverty threshold. See Appendix J, Table 20, 1992 Green Book; data for subsequent years are unpublished Congressional Budget Office tabulations.
5 The first fiscal year in which food stamps were available nationwide.
6 The fiscal year in which the food stamp purchase requirement was eliminated, on a phased in basis.
Sources: U.S. Department of Agriculture, Food and Nutrition Service, National Data Bank, the 1996 Green Book, and U.S. Bureau of the Census, “Poverty in the United States: 1999,” Current Population Reports, Series P60-210 and earlier years.
Table FSP 2.Trends in Food Stamp Expenditures, Selected Years 1975 – 1999
| Fiscal Year | Total Federal Cost | Benefits2 (Federal) |
Administration1 | Total Cost |
Average Monthly Benefit per Person |
|||
|---|---|---|---|---|---|---|---|---|
| Current Dollars | 1999 Dollars3 | Federal | State & Local | Current Dollars | 1999 Dollars3 | |||
| [In millions] | [In millions] | [In millions] | [In millions] | [In millions] | [In millions] | |||
| 1975....................... | $5,037 | $15,379 | $4,798 | $238 | $180 | $5,217 | $19.60 | $59.80 |
| 1976....................... | 5,641 | 16,124 | 5,276 | 365 | 275 | 5,934 | 23.90 | 68.30 |
| 1977....................... | 5,463 | 14,536 | 5,061 | 402 | 300 | 5,775 | 24.00 | 63.90 |
| 1978....................... | 5,546 | 13,844 | 5,112 | 434 | 325 | 5,883 | 25.70 | 64.20 |
| 1979 4..................... | 6,965 | 15,988 | 6,450 | 515 | 388 | 7,388 | 30.10 | 69.10 |
| 1980....................... | 9,224 | 19,034 | 8,721 | 503 | 375 | 9,633 | 34.30 | 70.80 |
| 1981....................... | 11,308 | 21,218 | 10,630 | 678 | 504 | 11,906 | 39.50 | 74.10 |
| 1982....................... | 11,117 | 19,491 | 10,408 | 709 | 557 | 11,697 | 39.20 | 68.70 |
| 1983....................... | 12,708 | 21,309 | 11,930 | 778 | 612 | 13,343 | 43.10 | 72.30 |
| 1984....................... | 12,446 | 20,018 | 11,475 | 971 5 | 805 | 13,251 | 42.90 | 69.00 |
| 1985....................... | 12,573 | 19,520 | 11,530 | 1,043 | 871 | 13,444 | 45.10 | 70.00 |
| 1986....................... | 12,510 | 18,943 | 11,397 | 1,113 | 935 | 13,445 | 45.60 | 69.00 |
| 1987....................... | 12,512 | 18,423 | 11,317 | 1,195 | 996 | 13,508 | 45.90 | 67.60 |
| 1988....................... | 13,281 | 18,787 | 11,991 | 1,290 | 1,080 | 14,361 | 49.90 | 70.60 |
| 1989....................... | 13,904 | 18,769 | 12,572 | 1,332 | 1,101 | 15,005 | 51.90 | 70.10 |
| 1990....................... | 16,503 | 21,221 | 15,081 | 1,422 | 1,174 | 17,677 | 59.00 | 75.90 |
| 1991....................... | 19,790 | 24,225 | 18,274 | 1,516 | 1,247 | 21,037 | 63.90 | 78.20 |
| 1992....................... | 23,535 | 27,961 | 21,879 | 1,656 | 1,375 | 24,910 | 68.70 | 81.60 |
| 1993....................... | 24,733 | 28,525 | 23,017 | 1,716 | 1,572 | 26,305 | 68.00 | 78.40 |
| 1994....................... | 25,587 | 28,748 | 23,798 | 1,789 | 1,643 | 27,230 | 69.10 | 77.60 |
| 1995....................... | 25,776 | 28,177 | 23,859 | 1,917 | 1,748 | 27,524 | 71.40 | 78.00 |
| 1996....................... | 25,527 | 27,152 | 23,543 | 1,984 | 1,842 | 27,369 | 73.40 | 78.10 |
| 1997....................... | 22,750 | 23,562 | 20,692 | 2,058 | 1,904 | 24,654 | 71.40 | 73.90 |
| 1998....................... | 20,224 | 20,610 | 18,055 | 2,169 | 1,988 | 22,212 | 71.30 | 72.70 |
| 1999....................... | 19,045 | 19,045 | 16,945 | 2,100 | 1,874 | 22,919 | 72.40 | 72.40 |
1 Amounts include the Federal share of state administrative and employment and training costs (including administrative costs of Puerto Rico's block grant) and certain direct Federal administrative costs. They do not generally include approximately $60 million in food-stamp related federal administrative costs budgeted under a separate appropriation account (although estimates prior to 1989 do include estimates of food stamp related Federal administrative expenses paid out of other Agriculture Department accounts). State and local costs are estimated based on the known Federal shares and represent an estimate of all administrative expenses of participating states (including Puerto Rico).
2 Benefit costs include the Food Stamp Program and Puerto Rico's nutritional assistance program and are based on unpublished data from the USDA, Food and Nutrition Service, National Data Bank (see Table FSP 4).
3 Constant dollar adjustments to 1999 level were made using a CPI-U-X1 fiscal year average price index.
4 The fiscal year in which the food stamp purchase requirement was eliminated, on a phased in basis.
5 Beginning 1984 USDA took over from DHHS the administrative cost of certifying public assistance households for food stamps.
Note: Total federal cost includes food stamps in Puerto Rico (1975-1981) and funding for Puerto Rico's nutrition assistance grant (1982-present). Average benefit figures, however, do not reflect the lower benefits in Puerto Rico under either the food stamp program from 1975 to 1981 or its nutrition assistance program since 1982.
Source: USDA, Food and Nutrition Service unpublished data from the National Data Bank; and the 2000 Green Book.
Table FSP 3. Characteristics of Food Stamp Households, 1980 - 1999 [In percent]
| Year 1 | ||||||||||
|---|---|---|---|---|---|---|---|---|---|---|
| 1980 | 1984 | 1988 | 1990 | 1992 | 1994 | 1996 | 1997 | 1998 | 1999 | |
| With Gross Monthly Income: | ||||||||||
| Below the Federal Poverty Levels..... | 87 | 93 | 92 | 92 | 92 | 90 | 91 | 91 | 90 | 89 |
| Between the Poverty Levels and 130 | ||||||||||
| Percent of the Poverty Levels............ | 10 | 6 | 8 | 8 | 8 | 9 | 8 | 8 | 9 | 10 |
| Above 130 Percent of Poverty........... | 2 | 1 | * | * | * | 1 | 1 | 1 | 1 | 1 |
| With Earnings........................................ | 19 | 19 | 20 | 19 | 21 | 21 | 23 | 24 | 26 | 27 |
| With Public Assistance Income 2........... | 65 | 71 | 72 | 73 | 66 | 69 | 67 | 67 | 65 | 63 |
| With AFDC/TANF Income............... | NA | 42 | 42 | 43 | 40 | 38 | 37 | 35 | 31 | 27 |
| With SSI Income............................... | 18 | 18 | 20 | 19 | 19 | 23 | 24 | 26 | 28 | 30 |
| With Children........................................ | 60 | 61 | 61 | 61 | 62 | 61 | 60 | 58 | 58 | 56 |
| And Female Heads of Household...... | NA | 47 | 50 | 51 | 51 | 51 | 50 | 49 | 47 | 46 |
| With No Spouse Present ............ | NA | NA | 39 | 37 | 44 | 43 | 43 | 42 | 41 | 40 |
| With Elderly Members 3...................... | 23 | 22 | 19 | 18 | 15 | 16 | 16 | 18 | 18 | 20 |
| With Elderly Female Heads of | ||||||||||
| Household 3..................................... | NA | 16 | 14 | 11 | 9 | 11 | NA | NA | NA | NA |
| Average Household Size........................ | 2.8 | 2.8 | 2.8 | 2.7 | 2.6 | 2.6 | 2.5 | 2.4 | 2.4 | 2.4 |
1 Data were gathered in August in the years 1980-84 and during the summer in the years from 1986 to 1994. Reports from 1995 to the present are based on fiscal year averages.
2 Public assistance income includes AFDC, SSI, and general assistance.
3 Elderly members and heads of household include those of age 60 or older.
* Less than 0.5 percent.
Source: U.S. Department of Agriculture, Food and Nutrition Service, Office of Analysis, Nutrition, and Evaluation, Characteristics of Food Stamp Households, Fiscal Year 1999 and earlier years.
Table FSP 4. Value of Food Stamps Issued by State, Selected Fiscal Years 1975 – 1999 [Millions of dollars]
| 1975 | 1980 | 1985 | 1990 | 1995 | 1997 | 1998 | 1999 | |
|---|---|---|---|---|---|---|---|---|
| Alabama | $108 | $246 | $318 | $328 | $441 | $393 | $357 | $346 |
| Alaska | 7 | 27 | 25 | 25 | 50 | 52 | 50 | 49 |
| Arizona | 45 | 97 | 121 | 239 | 414 | 316 | 253 | 233 |
| Arkansas | 78 | 122 | 126 | 155 | 212 | 214 | 206 | 210 |
| California | 374 | 530 | 639 | 968 | 2,473 | 2,372 | 2,020 | 1,796 |
| Colorado | 48 | 71 | 94 | 156 | 217 | 182 | 157 | 145 |
| Connecticut | 38 | 59 | 62 | 72 | 169 | 170 | 161 | 150 |
| Delaware | 8 | 21 | 22 | 25 | 47 | 41 | 34 | 32 |
| Dist. of Columbia | 32 | 41 | 40 | 43 | 92 | 91 | 85 | 82 |
| Florida | 236 | 421 | 368 | 609 | 1,307 | 1,061 | 845 | 813 |
| Georgia | 144 | 264 | 290 | 382 | 700 | 597 | 538 | 514 |
| Guam | 3 | 15 | 18 | 15 | 24 | 27 | 34 | 31 |
| Hawaii | 26 | 60 | 93 | 81 | 177 | 189 | 178 | 180 |
| Idaho | 12 | 29 | 36 | 40 | 59 | 53 | 47 | 45 |
| Illinois | 259 | 394 | 713 | 835 | 1,056 | 933 | 844 | 767 |
| Indiana | 64 | 154 | 242 | 226 | 382 | 293 | 263 | 255 |
| Iowa | 29 | 54 | 107 | 109 | 142 | 125 | 109 | 103 |
| Kansas | 13 | 38 | 64 | 96 | 144 | 112 | 83 | 80 |
| Kentucky | 138 | 211 | 332 | 334 | 413 | 372 | 345 | 337 |
| Louisiana | 149 | 243 | 365 | 549 | 629 | 512 | 467 | 463 |
| Maine | 36 | 60 | 62 | 63 | 112 | 103 | 100 | 89 |
| Maryland | 79 | 140 | 171 | 203 | 365 | 319 | 282 | 237 |
| Massachusetts | 104 | 171 | 173 | 207 | 315 | 262 | 222 | 205 |
| Michigan | 132 | 263 | 541 | 663 | 806 | 678 | 588 | 515 |
| Minnesota | 43 | 62 | 105 | 165 | 240 | 193 | 181 | 172 |
| Mississippi | 115 | 199 | 264 | 352 | 383 | 313 | 254 | 232 |
| Missouri | 85 | 142 | 212 | 312 | 488 | 401 | 345 | 348 |
| Montana | 11 | 18 | 31 | 41 | 57 | 55 | 52 | 52 |
| Nebraska | 12 | 25 | 44 | 59 | 77 | 72 | 68 | 66 |
| Nevada | 11 | 15 | 22 | 41 | 91 | 74 | 63 | 56 |
| New Hampshire | 14 | 22 | 15 | 20 | 44 | 35 | 30 | 31 |
| New Jersey | 136 | 226 | 260 | 289 | 506 | 449 | 384 | 346 |
| New Mexico | 49 | 81 | 88 | 117 | 196 | 168 | 144 | 144 |
| New York | 233 | 726 | 938 | 1,086 | 2,065 | 1,778 | 1,505 | 1,464 |
| North Carolina | 139 | 234 | 237 | 282 | 495 | 478 | 421 | 435 |
| North Dakota | 5 | 9 | 16 | 25 | 32 | 29 | 25 | 26 |
| Ohio | 268 | 382 | 697 | 861 | 1,017 | 744 | 613 | 535 |
| Oklahoma | 40 | 73 | 134 | 186 | 315 | 256 | 231 | 221 |
| Oregon | 58 | 80 | 142 | 168 | 254 | 216 | 198 | 190 |
| Pennsylvania | 190 | 373 | 547 | 661 | 1,006 | 865 | 764 | 704 |
| Puerto Rico | 366 | 828 | 786 | 894 | 1,095 | 1,142 | 1,166 | 1,190 |
| Rhode Island | 19 | 31 | 35 | 42 | 82 | 70 | 57 | 61 |
| South Carolina | 126 | 181 | 194 | 240 | 297 | 281 | 264 | 251 |
| South Dakota | 8 | 18 | 26 | 35 | 40 | 39 | 37 | 37 |
| Tennessee | 126 | 282 | 280 | 372 | 554 | 475 | 437 | 425 |
| Texas | 319 | 514 | 701 | 1,429 | 2,246 | 1,765 | 1,425 | 1,255 |
| Utah | 13 | 22 | 40 | 71 | 90 | 78 | 75 | 73 |
| Vermont | 10 | 18 | 20 | 22 | 46 | 40 | 34 | 34 |
| Virgin Islands | 9 | 19 | 23 | 18 | 28 | 25 | 22 | 22 |
| Virginia | 70 | 158 | 189 | 247 | 450 | 379 | 307 | 282 |
| Washington | 71 | 90 | 140 | 229 | 417 | 386 | 308 | 260 |
| West Virginia | 57 | 87 | 159 | 192 | 253 | 239 | 224 | 208 |
| Wisconsin | 33 | 68 | 148 | 180 | 220 | 158 | 130 | 124 |
| Wyoming | 3 | 6 | 15 | 21 | 28 | 23 | 21 | 19 |
| United States | $4,798 | $8,721 | $11,530 | $15,081 | $23,859 | $20,692 | $18,055 | $16,945 |
Source: U.S. Department of Agriculture, Food and Nutrition Service, unpublished data from the Food Stamp National Data Bank.
Table FSP 5. Average Number of Food Stamp Recipients by State, Selected Fiscal Years 1977 – 1999 [In thousands]
| 1977 | 1981 | 1985 | 1989 | 1992 | 1994 | 1996 | 1999 | Percent Change | ||
|---|---|---|---|---|---|---|---|---|---|---|
| 1989-94 | 1994-99 | |||||||||
| Alabama | 316 | 605 | 588 | 436 | 550 | 545 | 509 | 405 | 25 | -26 |
| Alaska | 11 | 32 | 22 | 26 | 38 | 46 | 46 | 41 | 76 | -10 |
| Arizona | 140 | 210 | 206 | 264 | 457 | 512 | 427 | 257 | 94 | -50 |
| Arkansas | 213 | 305 | 253 | 227 | 277 | 283 | 274 | 253 | 24 | -10 |
| California | 1,345 | 1,605 | 1,615 | 1,776 | 2,558 | 3,155 | 3,143 | 2,027 | 78 | -36 |
| Colorado | 147 | 175 | 170 | 211 | 260 | 268 | 244 | 173 | 27 | -35 |
| Connecticut | 178 | 175 | 145 | 114 | 202 | 223 | 223 | 178 | 96 | -20 |
| Delaware | 26 | 56 | 40 | 30 | 51 | 59 | 58 | 39 | 99 | -35 |
| Dist. of Columbia | 98 | 101 | 72 | 58 | 82 | 91 | 93 | 84 | 55 | -7 |
| Florida | 728 | 957 | 630 | 668 | 1,404 | 1,474 | 1,371 | 933 | 121 | -37 |
| Georgia | 459 | 654 | 567 | 485 | 754 | 830 | 793 | 617 | 71 | -26 |
| Guam | 22 | 25 | 20 | 13 | 20 | 15 | 18 | 20 | 21 | 30 |
| Hawaii | 108 | 104 | 99 | 78 | 94 | 115 | 130 | 125 | 47 | 9 |
| Idaho | 33 | 64 | 59 | 61 | 72 | 82 | 80 | 57 | 34 | -30 |
| Illinois | 922 | 984 | 1,110 | 990 | 1,156 | 1,189 | 1,105 | 820 | 20 | -31 |
| Indiana | 196 | 405 | 406 | 285 | 448 | 518 | 390 | 298 | 82 | -42 |
| Iowa | 108 | 163 | 203 | 168 | 192 | 196 | 177 | 129 | 16 | -34 |
| Kansas | 62 | 108 | 119 | 128 | 175 | 192 | 172 | 115 | 50 | -40 |
| Kentucky | 394 | 519 | 560 | 447 | 529 | 522 | 486 | 396 | 17 | -24 |
| Louisiana | 425 | 574 | 644 | 725 | 779 | 756 | 670 | 516 | 4 | -32 |
| Maine | 101 | 140 | 114 | 84 | 133 | 136 | 131 | 109 | 61 | -20 |
| Maryland | 255 | 346 | 287 | 249 | 342 | 390 | 375 | 264 | 57 | -32 |
| Massachusetts | 579 | 437 | 337 | 314 | 429 | 442 | 374 | 261 | 40 | -41 |
| Michigan | 635 | 942 | 985 | 874 | 994 | 1,031 | 935 | 683 | 18 | -34 |
| Minnesota | 158 | 202 | 228 | 245 | 309 | 318 | 295 | 208 | 30 | -35 |
| Mississippi | 333 | 514 | 495 | 493 | 536 | 511 | 457 | 288 | 4 | -44 |
| Missouri | 221 | 378 | 362 | 404 | 549 | 593 | 554 | 408 | 47 | -31 |
| Montana | 27 | 47 | 58 | 56 | 66 | 71 | 71 | 61 | 28 | -15 |
| Nebraska | 40 | 75 | 94 | 92 | 107 | 111 | 102 | 92 | 20 | -17 |
| Nevada | 18 | 37 | 32 | 41 | 80 | 97 | 97 | 62 | 134 | -36 |
| New Hampshire | 44 | 54 | 28 | 22 | 58 | 62 | 53 | 37 | 182 | -39 |
| New Jersey | 493 | 608 | 464 | 353 | 494 | 545 | 540 | 385 | 54 | -29 |
| New Mexico | 118 | 183 | 157 | 151 | 221 | 244 | 235 | 178 | 62 | -27 |
| New York | 1,646 | 1,851 | 1,834 | 1,463 | 1,885 | 2,154 | 2,099 | 1,541 | 47 | -28 |
| North Carolina | 428 | 605 | 474 | 390 | 597 | 630 | 631 | 505 | 61 | -20 |
| North Dakota | 15 | 29 | 33 | 39 | 46 | 45 | 40 | 33 | 17 | -26 |
| Ohio | 803 | 976 | 1,133 | 1,068 | 1,251 | 1,245 | 1,045 | 640 | 17 | -49 |
| Oklahoma | 158 | 206 | 263 | 261 | 346 | 376 | 354 | 271 | 44 | -28 |
| Oregon | 153 | 232 | 228 | 213 | 265 | 286 | 288 | 224 | 34 | -22 |
| Pennsylvania | 843 | 1,071 | 1,032 | 916 | 1,137 | 1,208 | 1,124 | 835 | 32 | -31 |
| Puerto Rico | 1,472 | 1,805 | 1,480 | 1,460 | 1,480 | 1,410 | 1,330 | 1,139 | -3 | -19 |
| Rhode Island | 79 | 88 | 69 | 57 | 87 | 94 | 91 | 76 | 65 | -19 |
| South Carolina | 280 | 443 | 373 | 272 | 369 | 385 | 358 | 309 | 42 | -20 |
| South Dakota | 26 | 46 | 48 | 50 | 55 | 53 | 49 | 44 | 6 | -17 |
| Tennessee | 392 | 677 | 518 | 500 | 702 | 735 | 638 | 511 | 47 | -30 |
| Texas | 823 | 1,226 | 1,263 | 1,634 | 2,454 | 2,726 | 2,372 | 1,401 | 67 | -49 |
| Utah | 36 | 65 | 75 | 95 | 123 | 128 | 110 | 88 | 34 | -31 |
| Vermont | 46 | 48 | 44 | 34 | 54 | 65 | 56 | 44 | 90 | -31 |
| Virgin Islands | 25 | 34 | 32 | 16 | 16 | 20 | 31 | 17 | 23 | -15 |
| Virginia | 240 | 432 | 360 | 333 | 495 | 547 | 538 | 362 | 65 | -34 |
| Washington | 212 | 271 | 281 | 321 | 431 | 468 | 478 | 307 | 46 | -34 |
| West Virginia | 199 | 252 | 278 | 259 | 310 | 321 | 300 | 247 | 24 | -23 |
| Wisconsin | 175 | 269 | 363 | 291 | 334 | 330 | 283 | 182 | 13 | -45 |
| Wyoming | 9 | 15 | 27 | 27 | 33 | 34 | 33 | 23 | 25 | -31 |
| United States | 17,014 | 22,430 | 21,379 | 20,266 | 26,886 | 28,879 | 26,872 | 19,322 | 42 | -33 |
Source: U.S. Department of Agriculture, Food and Nutrition Service, unpublished data from the National Data Bank.
Table FSP 6. Food Stamp Recipiency Rates by State, Selected Fiscal Years 1977 – 1999 [In percent]
| 1977 | 1981 | 1985 | 1989 | 1992 | 1994 | 1996 | 1999 |
Percent Change |
||
|---|---|---|---|---|---|---|---|---|---|---|
| 1989-94 | 1994-99 | |||||||||
| Alabama | 8.4 | 15.4 | 14.8 | 10.8 | 13.3 | 12.9 | 11.9 | 9.3 | 19 | -28 |
| Alaska | 2.7 | 7.7 | 4.1 | 4.8 | 6.4 | 7.6 | 7.6 | 6.7 | 60 | -13 |
| Arizona | 5.8 | 7.5 | 6.5 | 7.3 | 11.8 | 12.3 | 9.6 | 5.4 | 69 | -56 |
| Arkansas | 9.7 | 13.3 | 10.9 | 9.7 | 11.6 | 11.5 | 10.9 | 9.9 | 19 | -14 |
| California | 6.0 | 6.6 | 6.1 | 6.1 | 8.3 | 10.1 | 9.9 | 6.1 | 66 | -39 |
| Colorado | 5.5 | 5.9 | 5.3 | 6.5 | 7.5 | 7.3 | 6.4 | 4.3 | 14 | -42 |
| Connecticut | 5.8 | 5.6 | 4.5 | 3.5 | 6.2 | 6.8 | 6.8 | 5.4 | 97 | -20 |
| Delaware | 4.5 | 9.3 | 6.5 | 4.5 | 7.3 | 8.4 | 8.0 | 5.1 | 85 | -39 |
| Dist. of Columbia | 14.5 | 15.9 | 11.4 | 9.4 | 14.1 | 16.0 | 17.2 | 16.2 | 71 | 1 |
| Florida | 8.2 | 9.4 | 5.5 | 5.3 | 10.4 | 10.6 | 9.5 | 6.2 | 100 | -42 |
| Georgia | 8.8 | 11.7 | 9.5 | 7.6 | 11.2 | 11.8 | 10.8 | 7.9 | 56 | -33 |
| Hawaii | 11.8 | 10.6 | 9.5 | 7.1 | 8.2 | 9.8 | 11.0 | 10.6 | 37 | 8 |
| Idaho | 3.8 | 6.7 | 5.9 | 6.1 | 6.7 | 7.2 | 6.7 | 4.6 | 17 | -36 |
| Illinois | 8.1 | 8.6 | 9.7 | 8.7 | 10.0 | 10.1 | 9.3 | 6.8 | 16 | -33 |
| Indiana | 3.6 | 7.4 | 7.4 | 5.2 | 7.9 | 9.0 | 6.7 | 5.0 | 75 | -44 |
| Iowa | 3.7 | 5.6 | 7.2 | 6.1 | 6.9 | 6.9 | 6.2 | 4.5 | 14 | -35 |
| Kansas | 2.7 | 4.5 | 4.9 | 5.2 | 6.9 | 7.5 | 6.6 | 4.3 | 44 | -42 |
| Kentucky | 11.0 | 14.2 | 15.2 | 12.1 | 14.1 | 13.7 | 12.3 | 10.0 | 13 | -27 |
| Louisiana | 10.6 | 13.4 | 14.6 | 17.0 | 18.2 | 17.6 | 15.4 | 11.8 | 3 | -33 |
| Maine | 9.2 | 12.4 | 9.8 | 6.9 | 10.7 | 11.0 | 10.6 | 8.7 | 59 | -21 |
| Maryland | 6.1 | 8.1 | 6.5 | 5.3 | 7.0 | 7.8 | 7.4 | 5.1 | 49 | -35 |
| Massachusetts | 10.1 | 7.6 | 5.7 | 5.2 | 7.2 | 7.3 | 6.1 | 4.2 | 40 | -42 |
| Michigan | 6.9 | 10.2 | 10.8 | 9.4 | 10.5 | 10.8 | 9.6 | 6.9 | 14 | -36 |
| Minnesota | 4.0 | 4.9 | 5.5 | 5.7 | 6.9 | 7.0 | 6.3 | 4.4 | 23 | -37 |
| Mississippi | 13.5 | 20.3 | 19.1 | 19.1 | 20.5 | 19.2 | 16.9 | 10.4 | 0 | -46 |
| Missouri | 4.5 | 7.7 | 7.2 | 7.9 | 10.6 | 11.2 | 10.3 | 7.5 | 42 | -34 |
| Montana | 3.6 | 5.9 | 7.1 | 7.0 | 8.1 | 8.3 | 8.1 | 6.9 | 20 | -17 |
| Nebraska | 2.6 | 4.7 | 5.9 | 5.9 | 6.7 | 6.8 | 6.2 | 5.5 | 17 | -19 |
| Nevada | 2.7 | 4.4 | 3.4 | 3.6 | 6.0 | 6.6 | 6.0 | 3.4 | 83 | -49 |
| New Hampshire | 5.1 | 5.8 | 2.8 | 2.0 | 5.2 | 5.4 | 4.6 | 3.1 | 174 | -43 |
| New Jersey | 6.7 | 8.2 | 6.1 | 4.6 | 6.3 | 6.9 | 6.8 | 4.7 | 51 | -31 |
| New Mexico | 9.7 | 13.7 | 10.9 | 10.0 | 14.0 | 14.7 | 13.8 | 10.3 | 47 | -30 |
| New York | 9.2 | 10.5 | 10.3 | 8.1 | 10.4 | 11.9 | 11.6 | 8.5 | 46 | -29 |
| North Carolina | 7.5 | 10.2 | 7.6 | 5.9 | 8.7 | 8.9 | 8.6 | 6.6 | 50 | -26 |
| North Dakota | 2.4 | 4.4 | 4.9 | 6.0 | 7.2 | 7.1 | 6.2 | 5.3 | 19 | -26 |
| Ohio | 7.5 | 9.1 | 10.6 | 9.9 | 11.4 | 11.2 | 9.4 | 5.7 | 14 | -49 |
| Oklahoma | 5.5 | 6.7 | 8.0 | 8.3 | 10.8 | 11.6 | 10.7 | 8.1 | 40 | -30 |
| Oregon | 6.3 | 8.7 | 8.5 | 7.6 | 8.9 | 9.3 | 9.0 | 6.8 | 21 | -27 |
| Pennsylvania | 7.1 | 9.0 | 8.8 | 7.7 | 9.5 | 10.0 | 9.3 | 7.0 | 30 | -31 |
| Rhode Island | 8.3 | 9.3 | 7.2 | 5.7 | 8.7 | 9.4 | 9.2 | 7.7 | 66 | -18 |
| South Carolina | 9.4 | 13.9 | 11.3 | 7.9 | 10.3 | 10.5 | 9.6 | 7.9 | 34 | -24 |
| South Dakota | 3.8 | 6.6 | 6.9 | 7.2 | 7.6 | 7.3 | 6.6 | 6.0 | 2 | -18 |
| Tennessee | 8.9 | 14.6 | 11.0 | 10.3 | 14.0 | 14.2 | 12.0 | 9.3 | 38 | -35 |
| Texas | 6.2 | 8.3 | 7.8 | 9.7 | 13.9 | 14.8 | 12.5 | 7.0 | 53 | -53 |
| Utah | 2.7 | 4.3 | 4.6 | 5.6 | 6.8 | 6.6 | 5.4 | 4.1 | 19 | -37 |
| Vermont | 9.4 | 9.4 | 8.2 | 6.1 | 9.4 | 11.1 | 9.6 | 7.5 | 83 | -33 |
| Virginia | 4.6 | 7.9 | 6.3 | 5.4 | 7.8 | 8.4 | 8.1 | 5.3 | 54 | -37 |
| Washington | 5.6 | 6.4 | 6.4 | 6.8 | 8.4 | 8.8 | 8.6 | 5.3 | 30 | -39 |
| West Virginia | 10.4 | 12.9 | 14.6 | 14.3 | 17.1 | 17.7 | 16.5 | 13.7 | 23 | -23 |
| Wisconsin | 3.8 | 5.7 | 7.6 | 6.0 | 6.7 | 6.5 | 5.5 | 3.5 | 8 | -46 |
| Wyoming | 2.1 | 3.0 | 5.4 | 6.0 | 7.2 | 7.2 | 6.9 | 4.9 | 20 | -32 |
| United States | 7.1 | 9.0 | 8.3 | 7.6 | 9.9 | 10.5 | 9.6 | 6.7 | 39 | -37 |
Note: Recipiency rate refers to the average monthly number of food stamp recipients in each State during the particular fiscal year expressed as a percent of the total resident population as of July 1 of that year. The numerator is from Table A-18.
Source: U.S. Department of Agriculture, Food and Nutrition Service, unpublished data from the National Data Bank and U.S. Bureau of the Census, (Resident population by state available online at http://www.census.gov/population/estimates/state/).
Supplemental Security Income (SSI)
The Supplemental Security Income (SSI) Program is a means tested, federally administered income assistance program authorized by title XVI of the Social Security Act. Established in 1972 (Public Law 92-603) and begun in 1974, SSI provides monthly cash payments in accordance with uniform, nationwide eligibility requirements to needy aged, blind and disabled persons. To qualify for SSI payments, a person must satisfy the program criteria for age, blindness or disability. Children may qualify for SSI if they are under age 18, unmarried, and meet the applicable SSI disability or blindness, income and resource requirements. Individuals and couples are eligible for SSI if their countable incomes fall below the Federal maximum monthly SSI benefit levels, which were $532 for an individual and $789 for a couple in fiscal year 2000. SSI eligibility is restricted to qualified persons who have countable resources/assets of not more than $2,000, or $3,000 for a couple.
SSI law requires that SSI applicants file for all other money benefits for which they may be entitled. Since its inception, SSI has been viewed as the “program of last resort”-- after evaluating all other income, SSI pays what is necessary to bring an individual to the statutorily prescribed income “floor.” (The Social Security Administration, which administers the SSI program, works with recipients and helps them get any other benefits for which they are eligible.) As of December 1999, 36 percent of all SSI recipients also received Social Security benefits; Social Security benefits are the single highest source of income for SSI recipients.
No individual could receive both SSI payments and AFDC benefits; if eligible for both, the individual was required to choose which benefit to receive. Generally, the AFDC agency encouraged individuals to file for SSI and, once the SSI payments had started, the individual was removed from the AFDC filing unit. The PRWORA does not specifically prohibit an individual’s receipt of both TANF benefits and SSI; states have complete authority to set TANF eligibility standards and benefit levels.
Except in California, which converted food stamp benefits to cash that is included in the State supplementary payment, SSI recipients may be eligible to receive food stamps. If all household members receive SSI, they do not need to meet the Food Stamp Program financial eligibility standards to participate in the program because they are categorically eligible. If SSI beneficiaries live in households where other household members do not receive SSI benefits, the household must meet the net income eligibility standard of the Food Stamp Program to be eligible for food stamp benefits.
Recent Legislative Changes
Several legislative changes made in the 104th Congress are likely to affect Supplemental Security Income (SSI) participation and expenditures. Public Law 104-121, the Contract with America Advancement Act of 1996, prohibits SSI eligibility to individuals whose drug addiction and/or alcoholism (DAA) is a contributing factor material to the finding of disability. This provision applied to individuals who filed for benefits on or after the date of enactment (March 29, 1996) and to individuals whose claims were finally adjudicated on or after the date of enactment. It applied to current beneficiaries on January 1, 1997.
The PRWORA made several changes designed to maintain the SSI program’s goal of providing benefits for severely disabled children while preventing children without serious impairments from receiving benefits. First, the act replaced the former law “comparable severity” test with a new definition of childhood disability based on a medically determinable physical or mental impairment. Second, it discontinued use of the Individualized Functional Assessment (IFA) which authorized subjective judgment to determine children’s eligibility for SSI. Third, it eliminated references to “maladaptive behavior” in the Listings of Impairments (among medical criteria for evaluation of mental and emotional disorders in the domain of personal/behavioral function). The latter two provisions were effective for all new and pending applications upon enactment (August 22, 1996). Current beneficiaries receiving benefits due to an IFA or maladaptive behavior listing received notice no later than January 1, 1997, that their benefits might end when their case is redetermined. All currently receiving benefits are subject to redetermination using the new eligibility criteria by February 28, 1998 (per P.L. 105-33, enacted August 5, 1997).
Title IV of PRWORA also made significant changes in the eligibility of noncitizens for SSI benefits. Essentially, qualified aliens (including legal immigrants) are barred from SSI. Some of the restrictions were subsequently moderated, most notably by the Balanced Budget Act of 1997 (Public Law 105-33), which grandfathered immigrants who were receiving SSI at the time of enactment of the PRWORA.
Several provisions aimed at reducing SSI fraud and improving recovery of overpayments were enacted in 1999, as part of the Foster Care Independence Act of 1999 (P. L. 106-169). Other legislation enacted in 1999 provides additional work incentives for disabled beneficiaries of SSI.
SSI Program Data
The following set of tables and figures provide SSI program data:
- Tables SSI-1 through SSI-4 present national caseload and expenditure trend data on the SSI program;
- Table SSI-5 presents some demographic characteristics of the SSI caseload; and
- Tables SSI 6-8 present some state-by-state trend data on the SSI program through fiscal year 1999.
From 1990 to 1995, the program increased from 4.8 million beneficiaries to 6.5 million beneficiaries, an average growth rate of over 6 percent per year. Since 1995, the number of beneficiaries has stabilized, fluctuating between 6.5 and 6.6 million persons. In December 1999, there were nearly 6.6 million beneficiaries. Table SSI 1 presents information on the number of persons receiving SSI payments in December of each year from 1974 through 1999. In addition to data on the total number of SSI recipients, Table SSI 1 also shows recipients by eligibility category (aged, blind and disabled) and by type of recipient (child, adult age 18-64, and adult age 65 or older). See also Table IND 9a and Table IND 9b in Chapter II for further data on trends in recipiency and participation rates.
The composition of the SSI caseload has been shifting over time, as shown in Table A-20. The number of beneficiaries eligible because of age has been declining steadily, from a high of 2.3 million persons in December 1975 to 1.3 million persons in December 1998. At the same time there has been a strong growth in disabled beneficiaries, from 1.6 million in December 1974 to 5.2 million in December 1999. Moreover, the number of disabled children has increased dramatically, particularly in the 1990s, when the number of disabled children receiving SSI increased from 340,000 in December 1990 to 955,000 in December 1996. The number of disabled children has fallen in the past three years, declining to 847,000 in December 1999.[1]
Several factors have contributed to the growth of the Supplemental Security Income program. Expansions in disability eligibility (particularly for mentally impaired adults and for children), increased outreach, overall growth in immigration, and transfers from state programs were among the key factors identified in a 1995 study by the General Accounting Office (GAO). GAO concluded that three groups – adults with mental impairments, children, and non-citizens – accounted for nearly 90 percent of the SSI program’s growth in the early 1990s. The growth in disabled children beneficiaries is generally believed to be due to outreach activities, the Supreme Court decision in the Zebley case[2], expansion of the medical impairment category, and reduction in reviews of continuing eligibility.
Figure SSI 1. SSI Recipients by Age, 1974 – 1999
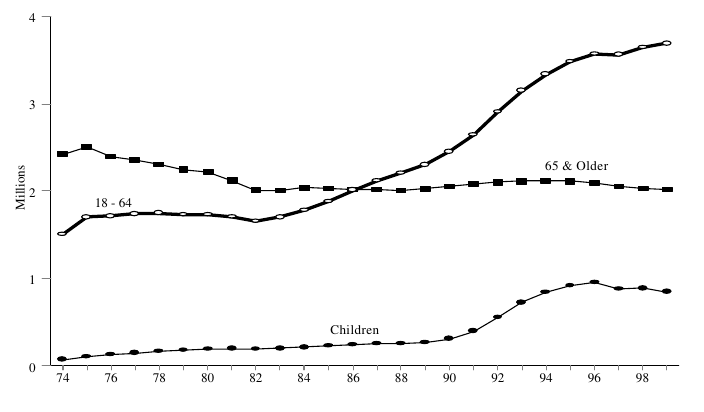
Source: Social Security Administration, Office of Research, Evaluation, and Statistics, (Data available online at http://www.ssa.gov/statistics/ores_home.html).
Table SSI 1. Number of Persons Receiving Federally Administered SSI Payments
1974 – 1999 [In thousands]
| Eligibility Category | Type of Recipient | |||||||
|---|---|---|---|---|---|---|---|---|
| Blind and Disabled | Adults | |||||||
| Date | Total | Aged | Total | Blind | Disabled | Children | Age 18-64 | 65 or Older |
| Dec 1974 | 3,996 | 2,286 | 1,710 | 75 | 1,636 | 71 1 | 1,503 | 2,422 |
| Dec 1975 | 4,314 | 2,307 | 2,007 | 74 | 1,933 | 107 | 1,699 | 2,508 |
| Dec 1976 | 4,236 | 2,148 | 2,088 | 76 | 2,012 | 125 | 1,714 | 2,397 |
| Dec 1977 | 4,238 | 2,051 | 2,187 | 77 | 2,109 | 147 | 1,738 | 2,353 |
| Dec 1978 | 4,217 | 1,968 | 2,249 | 77 | 2,172 | 166 | 1,747 | 2,304 |
| Dec 1979 | 4,150 | 1,872 | 2,278 | 77 | 2,201 | 177 | 1,727 | 2,246 |
| Dec 1980 | 4,142 | 1,808 | 2,334 | 78 | 2,256 | 190 | 1,731 | 2,221 |
| Dec 1981 | 4,019 | 1,678 | 2,341 | 79 | 2,262 | 195 | 1,703 | 2,121 |
| Dec 1982 | 3,858 | 1,549 | 2,309 | 77 | 2,231 | 192 | 1,655 | 2,011 |
| Dec 1983 | 3,901 | 1,515 | 2,386 | 79 | 2,307 | 198 | 1,700 | 2,003 |
| Dec 1984 | 4,029 | 1,530 | 2,499 | 81 | 2,419 | 212 | 1,780 | 2,037 |
| Dec 1985 | 4,138 | 1,504 | 2,634 | 82 | 2,551 | 227 | 1,879 | 2,031 |
| Dec 1986 | 4,269 | 1,473 | 2,796 | 83 | 2,713 | 241 | 2,010 | 2,018 |
| Dec 1987 | 4,385 | 1,455 | 2,930 | 83 | 2,846 | 251 | 2,119 | 2,015 |
| Dec 1988 | 4,464 | 1,433 | 3,030 | 83 | 2,948 | 255 | 2,203 | 2,006 |
| Dec 1989 | 4,593 | 1,439 | 3,154 | 83 | 3,071 | 265 | 2,302 | 2,026 |
| Dec 1990 | 4,817 | 1,454 | 3,363 | 84 | 3,279 | 309 | 2,450 | 2,059 |
| Dec 1991 | 5,118 | 1,465 | 3,654 | 85 | 3,569 | 397 | 2,642 | 2,080 |
| Dec 1992 | 5,566 | 1,471 | 4,095 | 85 | 4,010 | 556 | 2,910 | 2,100 |
| Dec 1993 | 5,984 | 1,475 | 4,509 | 85 | 4,424 | 723 | 3,148 | 2,113 |
| Dec 1994 | 6,296 | 1,466 | 4,830 | 85 | 4,745 | 841 | 3,335 | 2,119 |
| Dec 1995 | 6,514 | 1,446 | 5,068 | 84 | 4,984 | 917 | 3,482 | 2,115 |
| Dec 1996 | 6,614 | 1,413 | 5,201 | 82 | 5,119 | 955 | 3,568 | 2,090 |
| Dec 1997 | 6,495 | 1,362 | 5,133 | 81 | 5,052 | 880 | 3,562 | 2,054 |
| Dec 1998 | 6,566 | 1,332 | 5,234 | 80 | 5,154 | 887 | 3,646 | 2,033 |
| Dec 1999 | 6,557 | 1,308 | 5,249 | 79 | 5,169 | 847 | 3,691 | 2,019 |
1 Includes students 18-21 in 1974 only.
Source: Social Security Administration, Office of Research, Evaluation, and Statistics, Social Security Bulletin · Annual Statistical Supplement · 2000, (Data available online at http://www.ssa.gov/statistics).
Table SSI 2. SSI Recipiency Rates, 1974 – 1999 [In percent]
| Elderly Recipients (Persons 65 & Older) as a Percent of | ||||||
|---|---|---|---|---|---|---|
| All Recipients as a Percent of Total Population1 | Adults 18-64 as a Percent of 18-64 Population1 | Child Recipients as a Percent of All Children1 | All Persons 65 & Older1 | All Elderly Poor2 | Pretransfer Elderly Poor3 | |
| Dec 1974 | 1.9 | 1.2 | 0.1 | 10.8 | 78.5 | NA |
| Dec 1975 | 2.0 | 1.3 | 0.2 | 10.9 | 75.6 | NA |
| Dec 1976 | 1.9 | 1.3 | 0.2 | 10.2 | 72.4 | NA |
| Dec 1977 | 1.9 | 1.3 | 0.2 | 9.7 | 74.1 | NA |
| Dec 1978 | 1.9 | 1.3 | 0.3 | 9.3 | 71.5 | NA |
| Dec 1979 | 1.8 | 1.3 | 0.3 | 8.8 | 61.3 | 66.8 |
| Dec 1980 | 1.8 | 1.2 | 0.3 | 8.6 | 57.5 | 64.7 |
| Dec 1981 | 1.7 | 1.2 | 0.3 | 8.0 | 55.0 | 63.3 |
| Dec 1982 | 1.7 | 1.2 | 0.3 | 7.4 | 53.6 | 62.3 |
| Dec 1983 | 1.7 | 1.2 | 0.3 | 7.3 | 55.2 | 61.9 |
| Dec 1984 | 1.7 | 1.2 | 0.3 | 7.2 | 61.2 | 66.3 |
| Dec 1985 | 1.7 | 1.3 | 0.4 | 7.1 | 58.7 | 64.5 |
| Dec 1986 | 1.8 | 1.3 | 0.4 | 6.9 | 57.9 | 63.4 |
| Dec 1987 | 1.8 | 1.4 | 0.4 | 6.7 | 56.5 | 64.7 |
| Dec 1988 | 1.8 | 1.5 | 0.4 | 6.6 | 57.6 | 64.3 |
| Dec 1989 | 1.9 | 1.5 | 0.4 | 6.5 | 60.3 | 64.6 |
| Dec 1990 | 1.9 | 1.6 | 0.5 | 6.5 | 56.3 | 63.3 |
| Dec 1991 | 2.0 | 1.7 | 0.6 | 6.5 | 55.0 | 61.1 |
| Dec 1992 | 2.2 | 1.9 | 0.8 | 6.5 | 53.5 | 59.8 |
| Dec 1993 | 2.3 | 2.0 | 1.1 | 6.4 | 56.3 | 63.3 |
| Dec 1994 | 2.4 | 2.1 | 1.2 | 6.4 | 57.9 | 65.6 |
| Dec 1995 | 2.5 | 2.2 | 1.3 | 6.4 | 63.7 | 71.4 |
| Dec 1996 | 2.5 | 2.2 | 1.4 | 6.2 | 61.0 | 69.3 |
| Dec 1997 | 2.4 | 2.2 | 1.3 | 6.0 | 60.8 | 69.1 |
| Dec 1998 | 2.4 | 2.2 | 1.3 | 5.9 | 60.0 | 69.1 |
| Dec 1999 | 2.4 | 2.2 | 1.2 | 5.8 | 63.7 | 72.4 |
1 Population numbers used for the denominators are Census resident population estimates adjusted to the December date by averaging the July 1 population of the current year with the July 1 population of the following year; see Current Population Reports, Series P25-1106 and Resident Population Estimates of the United States by Age and Sex, April 1, 1990 to July 1, 2000, Internet release date January 2, 2001 (Available online at http://www.census.gov).
2 For the number of persons (65 years of age and older living in poverty) used as the denominator, see Current Population Reports, Series P60-210.
3 The pretransfer poverty population used as the denominator is the number of all elderly persons living in elderly-only units whose income (cash income plus social insurance plus Social Security but before taxes and means-tested transfers) falls below the appropriate poverty threshold. See Appendix J, Table 20, 1992 Green Book; data for subsequent years are unpublished Congressional Budget Office tabulations.
Notes: Numerators for these ratios are from Table A-20. Rates computed by DHHS.
Source: 1994 Green Book and U.S. Bureau of the Census, “Poverty in the United States: 1999," Current Population Reports, Series P60-210, and earlier years, (Available online at http://www.census.gov/hhes/www/poverty.html).
Table SSI 3. Total, Federal, and State SSI Benefits and Administration, 1974 – 19991 [In millions of dollars]
| Total Benefits | Federal Payments | State Supplementation | Administrative Costs (fiscal year) |
||||
|---|---|---|---|---|---|---|---|
| Calendar Year | 19992 Dollars | Current Dollars | Total | Federally Administered | State Administered | ||
| 1974............. | $16,839 | $5,246 | $3,833 | $1,413 | $1,264 | $149 | $285 |
| 1975............. | 17,425 | 5,878 | 4,314 | 1,565 | 1,403 | 162 | 399 |
| 1976............. | 17,013 | 6,066 | 4,512 | 1,554 | 1,388 | 166 | 500 |
| 1977............. | 16,623 | 6,306 | 4,703 | 1,603 | 1,431 | 172 | NA |
| 1978............. | 16,171 | 6,552 | 4,881 | 1,671 | 1,491 | 180 | 539 |
| 1979............. | 15,928 | 7,075 | 5,279 | 1,797 | 1,590 | 207 | 610 |
| 1980............. | 16,074 | 7,941 | 5,866 | 2,074 | 1,848 | 226 | 668 |
| 1981............. | 15,889 | 8,593 | 6,518 | 2,076 | 1,839 | 237 | 718 |
| 1982............. | 15,651 | 8,981 | 6,907 | 2,074 | 1,798 | 276 | 779 |
| 1983............. | 15,730 | 9,404 | 7,423 | 1,982 | 1,711 | 270 | 830 |
| 1984............. | 16,631 | 10,372 | 8,281 | 2,091 | 1,792 | 299 | 864 |
| 1985............. | 17,125 | 11,060 | 8,777 | 2,283 | 1,973 | 311 | 953 |
| 1986............. | 18,364 | 12,081 | 9,498 | 2,583 | 2,243 | 340 | 1,022 |
| 1987............. | 18,993 | 12,951 | 10,029 | 2,922 | 2,563 | 359 | 976 |
| 1988............. | 19,415 | 13,786 | 10,734 | 3,052 | 2,671 | 381 | 975 |
| 1989............. | 20,126 | 14,980 | 11,606 | 3,374 | 2,955 | 419 | 1,051 |
| 1990............. | 21,158 | 16,599 | 12,894 | 3,705 | 3,239 | 466 | 1,075 |
| 1991............. | 22,659 | 18,524 | 14,765 | 3,759 | 3,231 | 529 | 1,257 |
| 1992............. | 26,400 | 22,233 | 18,247 | 3,986 | 3,435 | 550 | 1,538 |
| 1993............. | 28,313 | 24,557 | 20,722 | 3,835 | 3,270 | 566 | 1,467 |
| 1994............. | 29,089 | 25,877 | 22,175 | 3,701 | 3,116 | 585 | 1,775 |
| 1995............. | 30,202 | 27,628 | 23,919 | 3,708 | 3,118 | 590 | 1,973 |
| 1996............. | 30,572 | 28,792 | 25,265 | 3,527 | 2,988 | 539 | 1,949 |
| 1997............. | 30,156 | 29,052 | 25,457 | 3,595 | 2,913 | 682 | 2,055 |
| 1998............. | 30,884 | 30,216 | 26,405 | 3,812 | 3,003 | 808 | 2,304 |
| 1999............. | 30,959 | 30,959 | 26,805 | 4,154 | 3,301 | 853 | 2,493 |
1 Payments and adjustments during the respective year but not necessarily accrued for that year.
2 Data adjusted for inflation by ASPE using the CPI-U-X1.
Source: Social Security Administration, Office of Research, Evaluation, and Statistics, Social Security Bulletin · Annual Statistical Supplement · 2000, (Data available online at http://www.ssa.gov/statistics).
Table SSI 4. Average Monthly SSI Benefit Payments, 1974 – 1999
| Total 1 | Federal Payments | State Supplementation | ||||
|---|---|---|---|---|---|---|
| Calendar Year | 1999 Dollars | Current Dollars | Total | Federally Administered | State Administered | |
| 1974............. | $459 | $135 | $108 | $64 | $71 | $35 |
| 1975............. | 327 | 112 | 92 | 66 | 69 | 45 |
| 1980............. | 310 | 158 | 133 | 89 | 91 | 76 |
| 1984............. | 337 | 211 | 187 | 93 | 93 | 93 |
| 1985............. | 338 | 219 | 193 | 99 | 99 | 102 |
| 1986............. | 353 | 232 | 202 | 107 | 108 | 101 |
| 1987............. | 353 | 242 | 208 | 117 | 118 | 110 |
| 1988............. | 353 | 253 | 219 | 118 | 118 | 118 |
| 1989............. | 357 | 267 | 230 | 126 | 126 | 127 |
| 1990............. | 356 | 283 | 244 | 132 | 131 | 136 |
| 1991............. | 362 | 297 | 260 | 125 | 122 | 143 |
| 1992............. | 389 | 328 | 292 | 124 | 121 | 147 |
| 1993............. | 389 | 337 | 306 | 112 | 107 | 150 |
| 1994............. | 380 | 338 | 310 | 105 | 99 | 152 |
| 1995............. | 384 | 350 | 322 | 110 | 103 | 164 |
| 1996............. | 381 | 359 | 333 | 108 | 103 | 145 |
| 1997............. | 385 | 369 | 342 | 99 | 102 | 86 |
| 1998............. | 389 | 379 | 350 | 103 | 104 | 102 |
| 1999............. | 388 | 388 | 356 | 111 | 113 | 105 |
1 Total is a weighted average of the Federal plus State average benefit, the Federal-only average benefit, and State-only average benefit.
Note: The numerators for these averages are given in Table SSI 3 and the denominators are given in Table SSI 5. Averages were computed by DHHS. Data adjusted for inflation using the monthly values of the CPI-U-X1 index.
Source: Number of persons receiving payments obtained from Social Security Administration, Office of Research, Evaluation, and Statistics, Social Security Bulletin · Annual Statistical Supplement · 2000.
Table SSI 5. Number of Persons Receiving SSI Payments by Type of Payment, 1974 – 1999 (in thousands)
| Calendar | State Supplementation | ||||
|---|---|---|---|---|---|
| Total | Federal | Total | Federally Administered | State Administered | |
| Year Jan 1974...... | 3,249 | 2,956 | 1,839 | 1,480 | 358 |
| Dec 1975...... | 4,360 | 3,893 | 1,987 | 1,684 | 303 |
| Dec 1980...... | 4,194 | 3,682 | 1,934 | 1,685 | 249 |
| Dec 1984...... | 4,094 | 3,699 | 1,875 | 1,607 | 268 |
| Dec 1985...... | 4,200 | 3,799 | 1,916 | 1,661 | 255 |
| Dec 1986...... | 4,347 | 3,922 | 2,003 | 1,723 | 279 |
| Dec 1987...... | 4,458 | 4,019 | 2,079 | 1,807 | 272 |
| Dec 1988...... | 4,541 | 4,089 | 2,155 | 1,885 | 270 |
| Dec 1989...... | 4,673 | 4,206 | 2,224 | 1,950 | 275 |
| Dec 1990...... | 4,888 | 4,412 | 2,344 | 2,058 | 286 |
| Dec 1991...... | 5,200 | 4,730 | 2,512 | 2,204 | 308 |
| Dec 1992...... | 5,647 | 5,202 | 2,684 | 2,372 | 313 |
| Dec 1993...... | 6,065 | 5,636 | 2,850 | 2,536 | 314 |
| Dec 1994...... | 6,377 | 5,965 | 2,950 | 2,628 | 322 |
| Dec 1995...... | 6,576 | 6,194 | 2,817 | 2,518 | 300 |
| Dec 1996...... | 6,677 | 6,326 | 2,732 | 2,421 | 310 |
| Dec 1997...... | 6,565 | 6,212 | 3,029 | 2,372 | 657 |
| Dec 1998...... | 6,649 | 6,289 | 3,072 | 2,412 | 661 |
| Dec 1999...... | 6,641 | 6,275 | 3,116 | 2,441 | 675 |
Source: Number of persons receiving payments obtained from Social Security Administration, Office of Research, Evaluation, and Statistics, Social Security Bulletin · Annual Statistical Supplement · 2000.
Table SSI 6. Characteristics of SSI Recipients, by Age, Sex, Earnings/Income, and Citizenship: Selected Years, 1980-1999
| 1980 | 1985 | 1990 | 1992 | 1994 | 1996 | 1998 | 1999 | |
|---|---|---|---|---|---|---|---|---|
| Total | ||||||||
| Ages | 100.0 | 100.0 | 100.0 | 100.0 | 100.0 | 100.0 | 100.0 | 100.0 |
| under 18 | 5.5 | 5.5 | 6.4 | 10.0 | 13.4 | 14.4 | 13.5 | 12.9 |
| 18-64 | 40.9 | 45.4 | 50.9 | 52.3 | 53.0 | 54.0 | 55.5 | 56.2 |
| 65 or older | 53.6 | 49.1 | 42.7 | 37.7 | 33.7 | 31.6 | 31.0 | 30.9 |
| Sex | ||||||||
| Male | 34.4 | 35.2 | 37.2 | 39.0 | 41.3 | 41.9 | 41.3 | 41.4 |
| Female | 65.5 | 64.8 | 62.8 | 61.0 | 58.7 | 58.1 | 58.7 | 58.6 |
| Selected Sources of Income | ||||||||
| Earnings | 3.2 | 3.8 | 4.7 | 4.4 | 4.2 | 4.4 | 4.5 | 4.5 |
| Social Security | 51.0 | 49.4 | 45.9 | 42.1 | 39.1 | 37.0 | 36.5 | 36.3 |
| No other income | 34.8 | 34.5 | 36.4 | 38.7 | 43.6 | 46.2 | 47.3 | 47.5 |
| Noncitizens | NA | 5.1 | 9.0 | 10.8 | 11.7 | 11.0 | 10.2 | 10.4 |
| Eligibility Category | ||||||||
| Aged | 43.6 | 36.4 | 30.2 | 26.4 | 23.3 | 21.4 | 20.3 | 20.0 |
| Blind | 1.9 | 2.0 | 1.7 | 1.5 | 1.4 | 1.2 | 1.2 | 1.2 |
| Disabled | 54.5 | 61.7 | 68.1 | 72.0 | 75.4 | 77.4 | 78.5 | 78.8 |
| Aged | ||||||||
| Ages | 100.0 | 100.0 | 100.0 | 100.0 | 100.0 | 100.0 | 100.0 | 100.0 |
| 65-69 | 14.0 | 14.9 | 19.4 | 20.7 | 20.5 | 19.1 | 16.6 | 16.0 |
| 70-79 | 51.5 | 45.6 | 41.3 | 42.5 | 44.3 | 47.0 | 49.4 | 49.9 |
| 80 or older | 34.5 | 39.5 | 39.2 | 36.8 | 35.1 | 33.9 | 34.1 | 34.0 |
| Sex | ||||||||
| Male | 27.3 | 25.5 | 25.1 | 25.6 | 26.8 | 27.6 | 28.2 | 28.6 |
| Female | 72.6 | 74.5 | 74.9 | 74.4 | 73.2 | 72.4 | 71.8 | 71.4 |
| Noncitizens | NA | 9.7 | 19.4 | 25.4 | 30.0 | 29.5 | 27.4 | 28.2 |
| Blind and Disabled | ||||||||
| Ages | 100.0 | 100.0 | 100.0 | 100.0 | 100.0 | 100.0 | 100.0 | 100.0 |
| 18-64 | 80.2 | 77.7 | 80.0 | 82.0 | 83.4 | 83.8 | 83.9 | 83.9 |
| 65 or older | 19.8 | 22.3 | 20.0 | 18.0 | 16.6 | 16.2 | 16.1 | 16.1 |
| Sex 1 | ||||||||
| Male | 39.8 | 40.8 | 42.4 | 43.9 | 41.8 | 41.4 | 41.0 | 40.9 |
| Female | 60.2 | 59.2 | 57.6 | 56.1 | 58.2 | 58.6 | 59.0 | 59.1 |
| Noncitizens | NA | 2.4 | 4.6 | 5.6 | 6.2 | 5.9 | 5.8 | 6.0 |
| Children | ||||||||
| Ages | 100.0 | 100.0 | 100.0 | 100.0 | 100.0 | 100.0 | 100.0 | 100.0 |
| Under 5 | 11.7 | NA | NA | 16.0 | 15.8 | 14.5 | 14.8 | 15.1 |
| 5-9 | 20.9 | NA | NA | 26.9 | 28.5 | 28.1 | 29.8 | 29.1 |
| 10-14 | 28.8 | NA | NA | 30.6 | 32.7 | 32.8 | 35.4 | 35.9 |
| 15-17 | 21.7 | NA | NA | 15.7 | 17.3 | 18.4 | 19.9 | 19.9 |
| 18-21 2 | 16.8 | 14.3 | 9.3 | 10.8 | 5.7 | 6.2 | – | – |
| Sex | ||||||||
| Male | NA | NA | NA | 62.0 | 63.0 | 63.4 | 63.3 | 63.4 |
| Female | NA | NA | NA | 38.0 | 37.0 | 36.6 | 36.7 | 36.6 |
Note: Data are for December of the year.
1 For 1980-1992 male-female classification reflects all blind and disabled, both children and adults; thereafter, it is based on adults only.
2 In this table, students 18-21 are classified as children prior to 1998.
Source: Social Security Administration, Social Security Bulletin · Annual Statistical Supplement · 2000 and prior years.
Table SSI 7. Total SSI Payments, Federal SSI Payments And State Supplementary Payments Calendar Year 1999 (In thousands)
| State Supplementation | |||||
|---|---|---|---|---|---|
| State | Total | Total Federal | Federal SSI | Administered | State |
| Total | $30,959,475 | $30,106,532 | $26,805,157 | $3,300,975 | $853,343 |
| Alabama | 659,976 | 659,321 | 659,321 | – | 655 |
| Alaska | 51,354 | 34,663 | 34,663 | – | 16,691 |
| Arizona | 340,568 | 340,318 | 340,318 | – | 250 |
| Arkansas | 339,065 | 339,065 | 339,065 | – | – |
| California | 6,167,642 | 6,167,642 | 3,900,708 | 2,266,934 | – |
| Colorado | 301,021 | 229,519 | 229,519 | – | 71,502 |
| Connecticut | 301,672 | 210,934 | 210,934 | – | 90,738 |
| Delaware | 49,523 | 49,523 | 48,583 | 940 | – |
| District of Columbia | 91,130 | 91,130 | 87,884 | 3,246 | – |
| Florida | 1,588,501 | 1,564,230 | 1,564,220 | 10 | 24,271 |
| Georgia | 772,792 | 772,789 | 772,782 | 10 | – |
| Hawaii | 97,546 | 97,546 | 84,722 | 12,824 | – |
| Idaho | 83,951 | 73,216 | 73,216 | – | 10,735 |
| Illinois | 1,205,453 | 1,177,260 | 1,177,260 | – | 28,193 |
| Indiana | 384,576 | 380,000 | 380,000 | – | 4,576 |
| Iowa | 173,432 | 156,590 | 153,845 | 2,745 | 16,842 |
| Kansas | 150,723 | 150,723 | 150,723 | – | – |
| Kentucky | 736,917 | 719,935 | 719,935 | – | 16,982 |
| Louisiana | 727,754 | 727,238 | 727,238 | – | 516 |
| Maine | 119,450 | 110,690 | 110,690 | – | 8,760 |
| Maryland | 395,695 | 389,027 | 389,015 | 12 | 6,668 |
| Massachusetts | 788,296 | 788,296 | 623,107 | 165,189 | – |
| Michigan | 1,077,231 | 982,648 | 953,887 | 28,761 | 94,583 |
| Minnesota | 336,541 | 266,246 | 266,246 | – | 70,295 |
| Mississippi | 517,090 | 517,090 | 517,081 | 9 | – |
| Missouri | 488,832 | 463,435 | 463,435 | – | 25,397 |
| Montana | 55,593 | 55,593 | 54,810 | 783 | – |
| Nebraska | 89,823 | 83,622 | 83,622 | – | 6,201 |
| Nevada | 100,977 | 100,977 | 96,147 | 4,830 | – |
| New Hampshire | 58,190 | 46,972 | 46,972 | – | 11,218 |
| New Jersey | 665,113 | 665,113 | 586,359 | 78,754 | – |
| New Mexico | 187,105 | 186,871 | 186,871 | – | 234 |
| New York | 3,118,358 | 3,118,358 | 2,573,094 | 545,264 | – |
| North Carolina | 843,399 | 719,909 | 719,909 | – | 123,490 |
| North Dakota | 31,708 | 29,683 | 29,683 | – | 2,025 |
| Ohio | 1,124,699 | 1,124,699 | 1,124,684 | 15 | – |
| Oklahoma | 334,708 | 297,354 | 297,354 | – | 37,354 |
| Oregon | 239,459 | 219,117 | 219,117 | – | 20,342 |
| Pennsylvania | 1,339,319 | 1,339,319 | 1,208,955 | 130,364 | – |
| Rhode Island | 123,595 | 123,595 | 101,043 | 22,552 | – |
| South Carolina | 436,684 | 423,301 | 423,301 | – | 13,383 |
| South Dakota | 50,961 | 48,660 | 48,653 | 7 | 2,301 |
| Tennessee | 666,082 | 666,082 | 666,080 | 2 | – |
| Texas | 1,556,804 | 1,556,804 | 1,556,804 | – | – |
| Utah | 86,511 | 86,511 | 86,456 | 55 | – |
| Vermont | 51,130 | 51,130 | 41,954 | 9,176 | – |
| Virginia | 551,881 | 529,962 | 529,962 | – | 21,919 |
| Washington | 469,541 | 469,193 | 440,462 | 28,731 | 348 |
| West Virginia | 315,748 | 315,748 | 315,748 | – | – |
| Wisconsin | 488,907 | 362,718 | 362,718 | – | 126,189 |
| Wyoming | 23,916 | 23,230 | 23,230 | – | 686 |
| Other: N. Mariana Islands | 2,937 | 2,937 | 2,937 | – | – |
| Unknown | – | – | -165 | -238 1 | – |
1 Represents recovered State payments not yet credited to the states.
Source: Number of persons receiving payments obtained from Social Security Administration, Office of Research, Evaluation, and Statistics, Social Security Bulletin · Annual Statistical Supplement · 2000.
Table SSI 8. SSI Recipiency Rates by State And Program Type for 1979 and 1999 [In percent]
| Total Recipiency Rate | Rate for Adults 18-64 | Rate for Adults 65 & Over | |||||||
|---|---|---|---|---|---|---|---|---|---|
| 1979 | 1999 | Percent Change 1979-99 | 1979 | 1999 | Percent Change 1979-99 | 1979 | 1999 | Percent Change 1979-99 | |
| Alabama | 3.6 | 3.7 | 4 | 1.8 | 3.3 | 80 | 21.0 | 8.3 | -60 |
| Alaska | 0.8 | 1.3 | 69 | 0.5 | 1.4 | 159 | 14.0 | 5.7 | -59 |
| Arizona | 1.1 | 1.7 | 53 | 0.9 | 1.6 | 80 | 5.0 | 3.4 | -32 |
| Arkansas | 3.5 | 3.4 | -3 | 1.9 | 3.1 | 66 | 17.1 | 7.2 | -58 |
| California | 3.0 | 3.2 | 6 | 2.1 | 2.5 | 22 | 16.4 | 12.8 | -22 |
| Colorado | 1.1 | 1.3 | 18 | 0.8 | 1.3 | 69 | 6.7 | 3.4 | -49 |
| Connecticut | 0.8 | 1.5 | 100 | 0.6 | 1.5 | 138 | 2.7 | 2.5 | -7 |
| Delaware | 1.2 | 1.6 | 34 | 0.9 | 1.4 | 49 | 5.4 | 2.6 | -52 |
| District of Columbia | 2.3 | 3.9 | 71 | 1.9 | 3.4 | 77 | 8.6 | 7.1 | -17 |
| Florida | 1.8 | 2.4 | 35 | 1.1 | 2.0 | 75 | 6.2 | 4.8 | -23 |
| Georgia | 2.9 | 2.5 | -13 | 1.9 | 2.2 | 16 | 17.7 | 8.0 | -55 |
| Hawaii | 1.1 | 1.7 | 62 | 0.7 | 1.4 | 103 | 7.6 | 5.6 | -26 |
| Idaho | 0.8 | 1.4 | 77 | 0.6 | 1.5 | 134 | 3.8 | 2.1 | -44 |
| Illinois | 1.1 | 2.1 | 94 | 1.0 | 2.1 | 121 | 4.3 | 3.8 | -11 |
| Indiana | 0.8 | 1.5 | 100 | 0.6 | 1.6 | 162 | 3.3 | 1.8 | -46 |
| Iowa | 0.9 | 1.4 | 57 | 0.6 | 1.6 | 158 | 3.5 | 1.9 | -46 |
| Kansas | 0.9 | 1.4 | 57 | 0.6 | 1.5 | 138 | 3.5 | 2.0 | -42 |
| Kentucky | 2.5 | 4.3 | 69 | 1.8 | 4.5 | 151 | 12.5 | 7.7 | -39 |
| Louisiana | 3.4 | 3.8 | 13 | 2.0 | 3.5 | 72 | 20.1 | 9.0 | -55 |
| Maine | 2.0 | 2.3 | 18 | 1.4 | 2.6 | 87 | 8.6 | 3.6 | -58 |
| Maryland | 1.2 | 1.7 | 48 | 0.9 | 1.5 | 60 | 5.4 | 4.1 | -24 |
| Massachusetts | 2.2 | 2.7 | 21 | 1.3 | 2.6 | 103 | 10.8 | 5.8 | -46 |
| Michigan | 1.3 | 2.1 | 67 | 1.1 | 2.3 | 115 | 5.9 | 3.1 | -47 |
| Minnesota | 0.8 | 1.3 | 60 | 0.6 | 1.4 | 155 | 3.7 | 2.6 | -30 |
| Mississippi | 4.5 | 4.7 | 5 | 2.4 | 4.2 | 74 | 26.0 | 12.3 | -53 |
| Missouri | 1.8 | 2.0 | 14 | 1.1 | 2.1 | 91 | 7.9 | 3.2 | -59 |
| Montana | 0.9 | 1.6 | 80 | 0.7 | 1.7 | 136 | 3.8 | 2.2 | -42 |
| Nebraska | 0.9 | 1.3 | 48 | 0.6 | 1.4 | 119 | 3.4 | 1.8 | -47 |
| Nevada | 0.8 | 1.3 | 55 | 0.5 | 1.2 | 126 | 5.9 | 3.5 | -40 |
| New Hampshire | 0.6 | 0.9 | 55 | 0.4 | 1.0 | 127 | 2.5 | 1.3 | -49 |
| New Jersey | 1.1 | 1.8 | 58 | 0.9 | 1.5 | 74 | 4.7 | 4.5 | -4 |
| New Mexico | 2.0 | 2.6 | 32 | 1.4 | 2.4 | 75 | 12.4 | 7.5 | -39 |
| New York | 2.1 | 3.3 | 56 | 1.6 | 2.9 | 82 | 8.3 | 8.9 | 8 |
| North Carolina | 2.4 | 2.5 | 4 | 1.6 | 2.1 | 33 | 13.6 | 6.4 | -53 |
| North Dakota | 1.0 | 1.3 | 31 | 0.6 | 1.3 | 128 | 5.1 | 2.5 | -50 |
| Ohio | 1.1 | 2.2 | 98 | 1.0 | 2.4 | 142 | 4.2 | 2.5 | -40 |
| Oklahoma | 2.3 | 2.2 | -5 | 1.3 | 2.1 | 58 | 11.6 | 4.5 | -61 |
| Oregon | 0.9 | 1.5 | 74 | 0.7 | 1.6 | 129 | 3.3 | 2.6 | -21 |
| Pennsylvania | 1.4 | 2.3 | 64 | 1.1 | 2.4 | 114 | 5.0 | 3.5 | -29 |
| Rhode Island | 1.6 | 2.7 | 70 | 1.1 | 2.7 | 150 | 6.4 | 5.0 | -22 |
| South Carolina | 2.7 | 2.8 | 4 | 1.8 | 2.4 | 35 | 17.0 | 6.8 | -60 |
| South Dakota | 1.1 | 1.7 | 49 | 0.7 | 1.7 | 136 | 5.0 | 3.2 | -36 |
| Tennessee | 2.9 | 3.0 | 5 | 1.9 | 2.9 | 55 | 14.8 | 6.6 | -55 |
| Texas | 1.9 | 2.0 | 6 | 1.0 | 1.6 | 68 | 12.7 | 8.1 | -36 |
| Utah | 0.6 | 0.9 | 64 | 0.5 | 1.1 | 116 | 3.0 | 1.9 | -37 |
| Vermont | 1.8 | 2.1 | 19 | 1.3 | 2.2 | 68 | 8.1 | 4.2 | -48 |
| Virginia | 1.5 | 1.9 | 27 | 1.0 | 1.6 | 57 | 8.5 | 5.1 | -40 |
| Washington | 1.2 | 1.7 | 47 | 1.0 | 1.8 | 84 | 4.8 | 3.5 | -28 |
| West Virginia | 2.1 | 3.9 | 83 | 1.9 | 4.4 | 137 | 8.0 | 4.9 | -38 |
| Wisconsin | 1.4 | 1.6 | 11 | 1.0 | 1.7 | 77 | 6.5 | 2.5 | -62 |
| Wyoming | 0.4 | 1.2 | 186 | 0.3 | 1.3 | 348 | 2.7 | 1.7 | -38 |
| Total | 1.9 | 2.4 | 30 | 1.3 | 2.2 | 75 | 9.0 | 5.8 | -35 |
Note: Recipiency rates for 1999 are the ratios of the number of SSI recipients (in the respective age groups) as of the month of December to the population in the respective age group as of the month of July; calculations by DHHS. The 1979 rates are based on the average number of recipients during the year.
Source: Social Security Administration and U.S. Bureau of the Census, (Resident population by state available online at http://www.census.gov/population/estimates/state/).
Table SSI 9. SSI Recipiency Rates by State, Selected Fiscal Years 1975 – 1999 [In percent]
| 1975 | 1980 | 1985 | 1990 | 1992 | 1994 2 | 1996 2 | 1999 2 | |
|---|---|---|---|---|---|---|---|---|
| Alabama | 4.0 | 3.4 | 3.3 | 3.3 | 3.4 | 3.8 | 3.9 | 3.7 |
| Alaska | 0.8 | 0.8 | 0.7 | 0.8 | 0.9 | 1.1 | 1.2 | 1.3 |
| Arizona | 1.2 | 1.1 | 1.0 | 1.2 | 1.4 | 1.7 | 1.7 | 1.7 |
| Arkansas | 4.1 | 3.4 | 3.1 | 3.2 | 3.5 | 3.8 | 3.8 | 3.4 |
| California | 3.1 | 3.0 | 2.6 | 2.9 | 3.1 | 3.2 | 3.3 | 3.2 |
| Colorado | 1.4 | 1.0 | 0.9 | 1.1 | 1.3 | 1.5 | 1.5 | 1.3 |
| Connecticut | 0.8 | 0.8 | 0.8 | 1.0 | 1.1 | 1.3 | 1.4 | 1.5 |
| Delaware | 1.2 | 1.2 | 1.2 | 1.2 | 1.3 | 1.5 | 1.6 | 1.6 |
| District of Columbia | 2.2 | 2.4 | 2.5 | 2.7 | 3.0 | 3.5 | 3.7 | 3.9 |
| Florida | 1.9 | 1.8 | 1.6 | 1.7 | 1.9 | 2.3 | 2.4 | 2.4 |
| Georgia | 3.3 | 2.8 | 2.6 | 2.5 | 2.6 | 2.8 | 2.7 | 2.5 |
| Hawaii | 1.1 | 1.1 | 1.1 | 1.3 | 1.3 | 1.5 | 1.6 | 1.7 |
| Idaho | 1.1 | 0.8 | 0.8 | 1.0 | 1.2 | 1.4 | 1.5 | 1.4 |
| Illinois | 1.2 | 1.1 | 1.2 | 1.6 | 1.8 | 2.2 | 2.3 | 2.1 |
| Indiana | 0.8 | 0.8 | 0.9 | 1.1 | 1.3 | 1.5 | 1.6 | 1.5 |
| Iowa | 1.0 | 0.9 | 1.0 | 1.2 | 1.3 | 1.4 | 1.5 | 1.4 |
| Kansas | 1.1 | 0.9 | 0.9 | 1.0 | 1.1 | 1.4 | 1.5 | 1.4 |
| Kentucky | 2.8 | 2.6 | 2.7 | 3.1 | 3.4 | 4.1 | 4.4 | 4.3 |
| Louisiana | 3.9 | 3.2 | 2.9 | 3.2 | 3.5 | 4.1 | 4.2 | 3.8 |
| Maine | 2.3 | 1.9 | 1.9 | 1.9 | 2.0 | 2.4 | 2.2 | 2.3 |
| Maryland | 1.2 | 1.1 | 1.2 | 1.3 | 1.4 | 1.6 | 1.7 | 1.7 |
| Massachusetts | 2.3 | 2.2 | 1.9 | 2.0 | 2.2 | 2.6 | 2.7 | 2.7 |
| Michigan | 1.3 | 1.2 | 1.4 | 1.5 | 1.7 | 2.2 | 2.2 | 2.1 |
| Minnesota | 1.0 | 0.8 | 0.8 | 0.9 | 1.1 | 1.3 | 1.4 | 1.3 |
| Mississippi | 5.2 | 4.4 | 4.3 | 4.4 | 4.7 | 5.2 | 5.2 | 4.7 |
| Missouri | 2.1 | 1.7 | 1.6 | 1.7 | 1.8 | 2.1 | 2.2 | 2.0 |
| Montana | 1.1 | 0.9 | 0.9 | 1.3 | 1.4 | 1.6 | 1.6 | 1.6 |
| Nebraska | 1.1 | 0.9 | 0.9 | 1.0 | 1.1 | 1.3 | 1.3 | 1.3 |
| Nevada | 1.0 | 0.8 | 0.9 | 1.0 | 1.0 | 1.3 | 1.4 | 1.3 |
| New Hampshire | 0.7 | 0.6 | 0.6 | 0.6 | 0.7 | 0.8 | 0.9 | 0.9 |
| New Jersey | 1.1 | 1.2 | 1.2 | 1.4 | 1.5 | 1.8 | 1.8 | 1.8 |
| New Mexico | 2.3 | 1.9 | 1.8 | 2.1 | 2.3 | 2.6 | 2.7 | 2.6 |
| New York | 2.2 | 2.1 | 2.0 | 2.3 | 2.6 | 3.1 | 3.3 | 3.3 |
| North Carolina | 2.7 | 2.4 | 2.2 | 2.2 | 2.4 | 2.6 | 2.7 | 2.5 |
| North Dakota | 1.3 | 1.0 | 1.0 | 1.2 | 1.3 | 1.4 | 1.4 | 1.3 |
| Ohio | 1.2 | 1.1 | 1.2 | 1.4 | 1.6 | 2.1 | 2.3 | 2.2 |
| Oklahoma | 3.0 | 2.2 | 1.8 | 1.9 | 2.0 | 2.2 | 2.3 | 2.2 |
| Oregon | 1.1 | 0.8 | 1.0 | 1.1 | 1.2 | 1.5 | 1.5 | 1.5 |
| Pennsylvania | 1.2 | 1.4 | 1.4 | 1.6 | 1.8 | 2.1 | 2.2 | 2.3 |
| Rhode Island | 1.7 | 1.6 | 1.6 | 1.7 | 1.9 | 2.3 | 2.6 | 2.7 |
| South Carolina | 2.8 | 2.7 | 2.6 | 2.6 | 2.7 | 3.0 | 3.0 | 2.8 |
| South Dakota | 1.3 | 1.2 | 1.2 | 1.5 | 1.6 | 1.8 | 1.9 | 1.7 |
| Tennessee | 3.2 | 2.8 | 2.7 | 2.9 | 3.1 | 3.4 | 3.4 | 3.0 |
| Texas | 2.2 | 1.8 | 1.6 | 1.7 | 1.9 | 2.1 | 2.2 | 2.0 |
| Utah | 0.8 | 0.5 | 0.5 | 0.7 | 0.8 | 1.0 | 1.1 | 0.9 |
| Vermont | 1.9 | 1.7 | 1.8 | 1.8 | 2.0 | 2.2 | 2.2 | 2.1 |
| Virginia | 1.5 | 1.5 | 1.5 | 1.5 | 1.7 | 1.9 | 2.0 | 1.9 |
| Washington | 1.5 | 1.1 | 1.1 | 1.3 | 1.4 | 1.6 | 1.7 | 1.7 |
| West Virginia | 2.4 | 2.1 | 2.2 | 2.6 | 2.9 | 3.5 | 3.8 | 3.9 |
| Wisconsin | 1.4 | 1.4 | 1.5 | 1.8 | 1.9 | 2.2 | 1.8 | 1.6 |
| Wyoming | 0.7 | 0.4 | 0.5 | 0.8 | 0.9 | 1.2 | 1.2 | 1.2 |
| Total 1 | 2.0 | 1.8 | 1.7 | 1.9 | 2.1 | 2.4 | 2.5 | 2.4 |
1 The number of SSI recipients used to calculate the total recipiency rate includes a certain number of recipients whose State is unknown. For 1975, 1985, and 1992, the numbers of unknown (in thousands) were 256, 14, and 71 respectively.
2 For 1975-92 the percentages are calculated as the average number of monthly SSI recipients over the total population of each State in July of that year. For 1994-1999 the number of recipients is from the month of December; calculations by DHHS.
Source: Social Security Administration and Bureau of the Census, (Resident population by state available online at http://www.census.gov/population/estimates/state/).
Endnotes
[1] Earlier editions of Indicators of Welfare Dependence included students 18-21 in the count of children and so reported about 50 thousand more disabled children.
[2] On February 20, 1990, the Supreme Court ruled that the individual functional assessment (or a residual functional capacity assessment) applied to adults whose condition did not meet or equal a listing of medical impairments to determine eligibility should also be applied to children whose condition did not meet or equal the medical listing of impairments. The GAO study estimated that 87,000 children were added to the SSI caseload after the individual functional assessments for children were initiated.
Appendix B: Alternative Definition of Dependence Based on Income from AFDC/TANF and Food Stamps
As directed by the Welfare Indicators Act of 1994 (Pub. L. 103-432), this annual report on Indicators of Welfare Dependence focuses on dependence on three programs: the Aid to Families with Dependent Children (AFDC) program, now Temporary Assistance to Needy Families (TANF); the Food Stamp Program; and the Supplemental Security Income (SSI) program. The summary measure of dependence proposed by the Advisory Board includes income from all three programs in its definition:
A family is dependent on welfare if more than 50 percent of its total income in a one-year period comes from AFDC, food stamps and/or SSI, and this welfare income is not associated with work activities.
This appendix examines an alternative definition of dependence that considers AFDC and food stamps alone, excluding SSI. One indicator in the report, Indicator 9, measuring long-term dependence, is based on this alternative definition.
As shown in Table B-1, dependency would be only 2.1 percent if based on income from AFDC and food stamps, as opposed to 3.8 percent when counting income from all three programs (AFDC/TANF, food stamps, and SSI). In general, 50 to 60 percent of individuals who are dependent under the standard definition also are dependent under the alternative definition that considers AFDC and food stamps alone.Table B-1. Percentage of the Total Population with More than 50 Percent of Income from Various Means-Tested Assistance Programs, by Race and Age: 1998
| AFDC, SSI, & Food Stamps | AFDC & Food Stamps | SSI only | |
|---|---|---|---|
| All Persons | 3.8 | 2.1 | 1.3 |
| Non-HispanicWhite | 2.1 | 1.1 | 0.8 |
| Non-HispanicBlack | 10.5 | 6.3 | 3.0 |
| Hispanic | 6.6 | 3.9 | 1.9 |
| Age Categories | |||
| Children Ages 0-5 | 7.8 | 5.8 | 1.2 |
| Children Ages 6-10 | 6.7 | 5.0 | 1.0 |
| Children Ages 11-15 | 5.7 | 3.7 | 1.2 |
| Women Ages 16-64 | 3.9 | 2.1 | 1.3 |
| Men Ages 16-64 | 2.1 | 0.8 | 1.1 |
| Adults Age 65 and over R | 2.1 | 0.2 | 1.8 |
Note: Income is measured as total family annual income.
Source: March CPS data, analyzed using the TRIM3 microsimulation model.
Table C-1. Percentage of Births to Unmarried Women Within Age Groups, by Race: 1940-1999
| White | Black | |||||||||
|---|---|---|---|---|---|---|---|---|---|---|
| Under Age 15 | Ages 15 - 17 | Ages 18 - 19 | All Teens | All Women | Under Age 15 | Ages 15 - 17 | Ages 18 - 19 | All Teens | All Women | |
| 1940 | 44.4 | NA | NA | 7.2 | 1.9 | NA | NA | NA | NA | NA |
| 1941 | 44.9 | NA | NA | 7.0 | 1.9 | NA | NA | NA | NA | NA |
| 1942 | 40.5 | NA | NA | 6.4 | 1.7 | NA | NA | NA | NA | NA |
| 1943 | 45.2 | NA | NA | 6.5 | 1.6 | NA | NA | NA | NA | NA |
| 1944 | 41.3 | NA | NA | 8.4 | 2.0 | NA | NA | NA | NA | NA |
| 1945 | 50.7 | NA | NA | 10.0 | 2.4 | NA | NA | NA | NA | NA |
| 1946 | 52.4 | NA | NA | 8.4 | 2.1 | NA | NA | NA | NA | NA |
| 1947 | 45.1 | NA | NA | 6.6 | 1.8 | NA | NA | NA | NA | NA |
| 1948 | 39.9 | 10.3 | 4.6 | 6.3 | 1.8 | NA | NA | NA | NA | NA |
| 1949 | 40.4 | 10.0 | 4.5 | 6.1 | 1.7 | NA | NA | NA | NA | NA |
| 1950 | 41.9 | 10.2 | 4.8 | 6.4 | 1.7 | NA | NA | NA | NA | NA |
| 1951 | 34.9 | 9.7 | 4.4 | 5.9 | 1.6 | NA | NA | NA | NA | NA |
| 1952 | 40.4 | 9.6 | 4.4 | 6.0 | 1.6 | NA | NA | NA | NA | NA |
| 1953 | 43.1 | 9.6 | 4.5 | 6.1 | 1.7 | NA | NA | NA | NA | NA |
| 1954 | 36.8 | 10.2 | 4.9 | 6.5 | 1.8 | NA | NA | NA | NA | NA |
| 1955 | 42.1 | 10.2 | 4.9 | 6.6 | 1.9 | NA | NA | NA | NA | NA |
| 1956 | 42.6 | 10.2 | 4.8 | 6.5 | 1.9 | NA | NA | NA | NA | NA |
| 1957 | 41.5 | 10.4 | 4.7 | 6.5 | 2.0 | NA | NA | NA | NA | NA |
| 1958 | 45.3 | 10.8 | 4.9 | 6.8 | 2.1 | NA | NA | NA | NA | NA |
| 1959 | 46.7 | 11.4 | 5.2 | 7.2 | 2.2 | NA | NA | NA | NA | NA |
| 1960 | 47.5 | 11.7 | 5.4 | 7.4 | 2.3 | NA | NA | NA | NA | NA |
| 1961 | 49.9 | 12.4 | 6.0 | 7.9 | 2.5 | NA | NA | NA | NA | NA |
| 1962 | 48.3 | 13.4 | 6.1 | 8.2 | 2.8 | NA | NA | NA | NA | NA |
| 1963 | 50.3 | 15.1 | 7.0 | 9.4 | 3.1 | NA | NA | NA | NA | NA |
| 1964 | 52.3 | 16.0 | 7.6 | 10.4 | 3.4 | NA | NA | NA | NA | NA |
| 1965 | 57.3 | 17.3 | 9.1 | 11.7 | 4.0 | NA | NA | NA | NA | NA |
| 1966 | 52.5 | 19.5 | 9.9 | 12.6 | 4.4 | NA | NA | NA | NA | NA |
| 1967 | 61.6 | 21.0 | 11.2 | 14.2 | 4.9 | NA | NA | NA | NA | NA |
| 1968 | 61.0 | 23.4 | 12.7 | 16.1 | 5.3 | NA | NA | NA | NA | NA |
| 1969 | 57.0 | 24.0 | 12.9 | 16.6 | 5.5 | 91.7 | 72.1 | 48.3 | 60.0 | 34.9 |
| 1970 | 57.9 | 25.2 | 13.5 | 17.5 | 5.7 | 93.5 | 76.0 | 52.1 | 64.0 | 37.6 |
| 1971 | 60.5 | 25.2 | 13.2 | 17.4 | 5.6 | 95.0 | 79.6 | 56.0 | 68.1 | 40.5 |
| 1972 | 59.0 | 26.4 | 13.7 | 18.5 | 6.0 | 96.4 | 81.0 | 59.0 | 70.7 | 43.9 |
| 1973 | 65.2 | 27.6 | 14.3 | 19.6 | 6.4 | 96.4 | 82.6 | 60.4 | 72.1 | 45.7 |
| 1974 | 65.3 | 29.4 | 15.0 | 20.8 | 6.5 | 97.4 | 84.8 | 63.8 | 74.7 | 47.1 |
| 1975 | 71.0 | 33.0 | 17.2 | 23.5 | 7.3 | 98.4 | 87.4 | 67.6 | 77.8 | 48.8 |
| 1976 | 69.3 | 35.7 | 18.8 | 25.4 | 7.7 | 99.1 | 89.7 | 70.9 | 80.5 | 50.3 |
| 1977 | 72.8 | 38.9 | 21.0 | 27.8 | 8.2 | 98.8 | 90.6 | 74.6 | 82.6 | 51.7 |
| 1978 | 73.1 | 40.1 | 22.5 | 29.1 | 8.7 | 97.2 | 90.9 | 76.5 | 83.5 | 53.2 |
| 1979 | 75.0 | 42.4 | 24.3 | 30.8 | 9.4 | 99.4 | 92.9 | 78.9 | 85.7 | 54.7 |
| 1980 | 75.4 | 45.4 | 27.1 | 33.6 | 11.2 | 98.6 | 93.1 | 79.9 | 86.2 | 56.1 |
| 1981 | 76.5 | 48.0 | 28.7 | 35.5 | 11.8 | 98.9 | 93.9 | 81.3 | 87.2 | 56.9 |
| 1982 | 77.7 | 50.1 | 30.3 | 37.2 | 12.3 | 98.4 | 94.2 | 82.4 | 87.9 | 57.7 |
| 1983 | 79.9 | 53.1 | 32.7 | 39.8 | 12.9 | 98.5 | 95.1 | 84.4 | 89.4 | 59.2 |
| 1984 | 80.8 | 55.4 | 35.1 | 42.2 | 13.6 | 98.6 | 95.3 | 85.4 | 90.0 | 60.3 |
| 1985 | 82.4 | 58.0 | 38.2 | 45.3 | 14.7 | 98.8 | 95.6 | 86.2 | 90.6 | 61.2 |
| 1986 | 83.6 | 61.3 | 41.7 | 48.8 | 15.9 | 99.0 | 95.7 | 86.9 | 91.1 | 62.4 |
| 1987 | 84.6 | 64.6 | 44.4 | 51.8 | 16.9 | 99.1 | 96.1 | 87.6 | 91.7 | 63.4 |
| 1988 | 86.5 | 66.2 | 47.3 | 54.1 | 18.0 | 98.9 | 96.4 | 88.5 | 92.3 | 64.7 |
| 1989 | 84.7 | 67.2 | 49.5 | 55.7 | 19.2 | 98.4 | 96.1 | 89.0 | 92.3 | 59.2 |
| 1990 | 83.6 | 67.9 | 50.8 | 56.8 | 20.4 | 98.5 | 95.6 | 89.4 | 92.2 | 59.8 |
| 1991 | 75.5 | 69.7 | 53.2 | 59.0 | 21.8 | 98.1 | 95.7 | 89.8 | 92.5 | 60.3 |
| 1992 | 76.2 | 70.6 | 54.9 | 60.6 | 22.6 | 97.6 | 95.6 | 90.4 | 92.8 | 68.1 |
| 1993 | 83.2 | 71.7 | 57.2 | 62.7 | 23.6 | 98.1 | 95.7 | 90.8 | 93.1 | 68.7 |
| 1994 | 90.4 | 77.5 | 61.9 | 68.0 | 25.4 | 99.1 | 97.8 | 93.4 | 95.5 | 70.4 |
| 1995 | 88.8 | 77.4 | 62.1 | 68.0 | 25.3 | 99.1 | 97.7 | 93.2 | 95.3 | 69.9 |
| 1996 | 90.1 | 78.8 | 63.3 | 69.2 | 25.7 | 99.1 | 97.9 | 93.6 | 95.6 | 69.8 |
| 1997 | 92.2 | 81.6 | 65.3 | 71.4 | 25.8 | 99.4 | 98.3 | 93.8 | 95.8 | 69.2 |
| 1998 | 94.0 | 82.7 | 66.5 | 72.4 | 26.3 | 99.6 | 98.3 | 93.9 | 95.7 | 69.1 |
| 1999 | 93.9 | 83.2 | 67.3 | 72.9 | 26.7 | 99.5 | 98.3 | 93.7 | 95.6 | 68.8 |
Appendix D. Sources of Data
In an attempt to address these concerns, several indicators in this report are based on CPS data that have been analyzed by the Transfer Income Model (TRIM3), a microsimulation model developed by the Urban Institute under contract to the Office of the Assistant Secretary for Planning and Evaluation. Although its primary purpose is to simulate program eligibility for various government programs and the impact of policy proposals, the TRIM model has also been used to correct for underreporting (Wheaton and Giannarelli, 2000. “Underreporting of Means-Tested Transfer Programs in the March CPS”). In building its caseloads for AFDC/TANF, food stamps and SSI, the TRIM3 model starts with households reported as participants in the CPS and then adds additional households from the simulated eligible population until caseloads match the overall size and administrative characteristics of caseloads reported in administrative data. In addition to adjusting for underreporting, the TRIM3 model converts annual variables on welfare receipt and income in the CPS to monthly measures, through a process of allocating annual earnings and income over twelve months, based on the reported number of weeks worked and months of welfare receipt. The TRIM monthly measures of receipt and income, typically averaged across a calendar year, can then be compared to monthly measures from administrative data or the SIPP. The simulation process is controlled so that monthly caseloads track administrative records; monthly employment trends track those reported by the Bureau of Labor Statistics; and certain characteristics of recipients, including employment status, match those in administrative records.[1]
The TRIM-adjusted CPS data are used for indicators relating to Degree of Dependence (SUM1 and IND 1a and 1b), Receipt and Labor Force Attachment (IND 2), and Multiple Program Receipt (IND 5). A labor force attachment risk factor previously measured with SIPP data (WORK 1), is now measured with regular CPS data, unadjusted. In contrast to previous reports, this measure now examines labor force attachment over an annual rather than a monthly period. Other indicators and risk factors in the report continue to rely on the same data sources as in past reports. As shown in Table D-1, these measures include one indicator that has always been based on the TRIM model (Rates of Participation, IND 4a and 4c), nearly a dozen risk factors that have always been based on CPS data, including measures of poverty, and several indicators that continue to use longitudinal data from the SIPP and PSID.
Changes in data source, use of the TRIM model, and changes from monthly to annual data all cause disruptions in the measurement of trends of recipiency and dependency over time. Therefore, the indicators using the TRIM-adjusted CPS data were analyzed over a six-year period – 1993 to 1998 – providing a new time series of dependency indicators from a consistent data source.[2] Readers were cautioned in Chapter I against making simple comparisons between the historic SIPP data and the more current CPS data. Still, some readers may be interested in comparing how different data sources measured certain indicators over the same time period. This appendix provides tabulations from both SIPP and CPS for a common year (1995) or across several years (with an overlap in 1993-1995). Some indicators that were measured using TRIM-adjusted CPS data include a third tabulation showing the CPS data without the TRIM adjustments. Specifically, the remainder of this appendix includes brief text and sets of tables for the following indicators:
- Recipiency and Dependency Rates SUM 1 SIPP, TRIM, CPS
- Degrees of Dependence IND 1a and 1b SIPP, TRIM, CPS
- Receipt and Labor Force Attachment IND 2a and 2b SIPP, TRIM
- Multiple Program Receipt IND 5a and 5b SIPP, TRIM
- Labor-Force Attachment WORK 1a and 1b SIPP, CPS
Table D-1. Data Sources for Indicators, Highlighting Those with Changes in 2001 Report
| 2001 Report | 2000 Report | Title | Data Source | New Data Source, if Different in 2001 |
|---|---|---|---|---|
| SUM 1 | SUM 1 | Recipiency and Dependency Rates | SIPP (Annual) | CPS/TRIM (Annual) |
| IND 1a, 1b | IND 1a, 1c | Degree of Dependence | SIPP (Annual) | CPS/TRIM (Annual) |
| IND 2 | IND 4 | Receipt of Means-Tested Assistance and Labor Force Attachment | SIPP (Monthly) | CPS/TRIM (Monthly) |
| IND 3 | IND 9 | Rates of Receipt of Means-Tested Assistance | Administrative | |
| IND 4 | IND 10 | Rates of Participation in Means-Tested Assistance Programs | CPS/TRIM | |
| IND 5 | IND 7 | Multiple Program Receipt | SIPP (Monthly) | CPS/TRIM (Monthly) |
| IND 6 | IND 2 | Dependence Transitions | SIPP | |
| IND 7 | IND 3 | Dependence Spell Duration | SIPP | |
| IND 8 | IND 5 | Program Spell Duration | SIPP | |
| IND 9 | IND 1b | Long-Term Dependency | PSID | |
| IND 10 | IND 6 | Long-Term Receipt | PSID | |
| IND 11 | IND 8 | Events Associated with the Beginning an Ending of Program Spells | PSID | |
| ECON 1 | ECON 1a | Poverty Rates | CPS | |
| ECON 2 | ECON 1b | Deep Poverty Rates | CPS | |
| ECON 3 | (new) | Alternative Poverty Measures | CPS | |
| ECON 4 | SUM 4 | Poverty Rates with Various Means-Teste Benefits Included | CPS | |
| ECON 5 | ECON 2 | Poverty Spells | SIPP | |
| ECON 6 | ECON 3 | Long-Term Poverty | PSID | |
| ECON 7 | ECON 4 | Child Support | CPS | |
| ECON 8 | ECON 5 | Food Insecurity | CPS | |
| ECON 9 | ECON 6 | Lack of Health Insurance | CPS | |
| WORK 1 | Labor Force Attachment | SIPP (Monthly) | CPS (Annual) | |
| WORK 1 | ||||
| WORK 2 | WORK 2 | Employment Among the Low-Skilled | CPS | |
| WORK 3 | WORK 3 | Earnings of Low-Skilled Workers | CPS | |
| WORK 4 | WORK 8 | Educational Attainment | CPS | |
| WORK 5 | WORK 9 | High School Dropout Rates | CPS | |
| WORK 6 | WORK 5 | Adult Alcohol and Substance Abuse | NHSDA | |
| WORK 7 | WORK 4 | Adult/Child Disability | NHIS-D | |
| WORK 8 | WORK 6 | Children=s Health Conditions | NHIS | |
| WORK 9 | WORK 7 | Child Care Expenditures | SIPP | |
| BIRTH 1 | BIRTH 1 | Births to Unmarried Women | Vital Statistics | |
| BIRTH 2 | BIRTH 2 | Births to Unmarried Teens | Vital Statistics | |
| BIRTH 3 | BIRTH 3 | Unmarried Teen Birth Rates within Age Groups | Vital Statistics | |
| BIRTH 4 | BIRTH 4 | Never-Married Family Status | CPS |
Recipiency and Dependency Rates (SUM 1).
The three tabulations of SUM 1 use SIPP data, TRIM-adjusted CPS data, and regular CPS data (see pages D-5 through D-8). The three tables use very similar definitions of recipiency and dependency: recipiency and dependency are measured on an annual basis and the recipiency rates measure the receipt of any amount of AFDC/TANF, SSI or food stamps by any family member at any point in the year.[3] One difference, which only affects a small number of cases, is that the SIPP data include general assistance income within AFDC income when measuring percentage of income from welfare sources. The CPS data, with and without TRIM adjustments, focus on AFDC/TANF, food stamps and SSI only.
The SIPP and TRIM-adjusted CPS data show quite similar measures of recipiency in 1993, 1994, and 1995, as depicted in Figure D-1. In contrast, recipiency rates in the regular CPS data are considerably lower in all three years. In 1995, for example, the recipiency rate is 17.0 percent in the SIPP data and 16.9 percent in the TRIM-adjusted CPS data, compared to only 13.3 percent in the CPS data. Although all three sources show a decline in recipiency between 1993 and 1995, the decline is larger in the CPS data than in the other two data sets.
Dependency rates are also much higher in the TRIM-adjusted CPS data and the SIPP data than in the CPS data, as shown in Figure D-2. All three data sources are consistent in showing a decline in dependency between 1993 and 1994 and again between 1994 and 1995.
Figure D-1. Recipiency Rates from Three Data Sources, 1993-1998
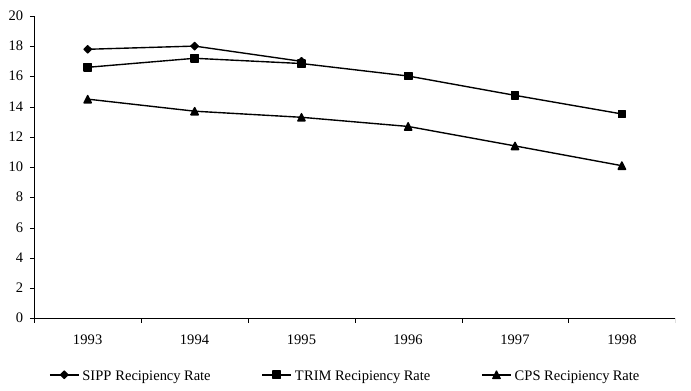
Notes and source: See Tables SUM1_SIPP, SUM1_TRIM, and SUM1_CPS.
Figure D-2. Dependency Rates from Three Data Sources, 1993-1998
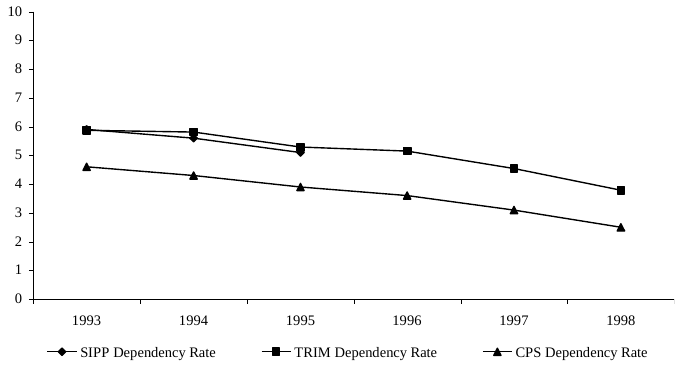
Notes and source: See Tables SUM1_SIPP, SUM1_TRIM, and SUM1_CPS.
Table SUM 1_SIPP. Recipiency and Dependency Rates: 1993-1995
| 1993 | 1994 | 1995 | |
|---|---|---|---|
| Recipiency Rates (Rates of Any Amount of AFDC/TANF, Food Stamps, or SSI) | |||
| All Persons | 17.8 | 18.0 | 17.0 |
| Racial Categories | |||
| Non-Hispanic White | 10.9 | 11.1 | 10.4 |
| Non-Hispanic Black | 41.8 | 43.2 | 40.9 |
| Hispanic | 33.9 | 37.1 | 34.6 |
| Age Categories | |||
| Children Ages 0-5 | 29.0 | 32.4 | 27.6 |
| Children Ages 6-10 | 24.0 | 28.6 | 28.7 |
| Children Ages 11-15 | 22.6 | 24.9 | 23.6 |
| Women Ages 16-64 | 17.3 | 17.5 | 16.8 |
| Men Ages 16-64 | 12.0 | 12.3 | 11.5 |
| Adults Age 65 and over | 12.2 | 12.3 | 12.2 |
| Dependency Rates (More than 50 Percent of Income from Means-Tested Assistance) | |||
| All Persons | 5.9 | 5.6 | 5.1 |
| Racial Categories | |||
| Non-Hispanic White | 2.8 | 2.6 | 2.3 |
| Non-Hispanic Black | 16.7 | 16.8 | 15.2 |
| Hispanic | 14.2 | 12.9 | 12.2 |
| Age Categories | |||
| Children Ages 0-5 | 13.3 | 12.5 | 10.6 |
| Children Ages 6-10 | 12.3 | 12.0 | 11.6 |
| Children Ages 11-15 | 10.5 | 9.3 | 9.1 |
| Women Ages 16-64 | 5.8 | 5.5 | 5.2 |
| Men Ages 16-64 | 2.7 | 2.5 | 2.3 |
| Adults Age 65 and over | 2.0 | 2.2 | 1.8 |
Note: Recipiency is defined as living in a family with receipt of any amount of AFDC, SSI, or food stamps during year. Dependency is defined as having more than 50 percent of annual family income from AFDC, SSI and/or food stamps. While only affecting a small number of cases, general assistance income is included within AFDC income. Dependency rates would be lower if adjusted to exclude welfare assistance associated with working. Because full calendar year data for 1995 were not available for all SIPP respondents, 1995 estimates are based on a weighting adjustment to account for those who were not interviewed for the entire year.
Source: Indicators of Welfare Dependence (2000), Table SUM 1, which drew on unpublished data from the SIPP, 1992 and 1993 panels.
Table SUM 1_TRIM. Recipiency and Dependency Rates: 1993-1998
| 1993 | 1994 | 1995 | 1996 | 1997 | 1998 | |
|---|---|---|---|---|---|---|
| Recipiency Rates (Rates of Any Amount of AFDC/TANF, Food Stamps, or SSI) | ||||||
| All Persons | 16.6 | 17.2 | 16.9 | 16.0 | 14.8 | 13.5 |
| Racial Categories | ||||||
| Non-Hispanic White | 10.3 | 10.9 | 10.0 | 9.9 | 9.7 | 8.6 |
| Non-Hispanic Black | 38.0 | 38.3 | 38.6 | 35.6 | 30.2 | 29.6 |
| Hispanic | 34.6 | 34.9 | 35.0 | 32.0 | 28.0 | 24.5 |
| Age Categories | ||||||
| Children Ages 0-5 | 30.5 | 31.5 | 31.6 | 28.2 | 25.1 | 22.4 |
| Children Ages 6-10 | 24.9 | 26.8 | 26.5 | 24.2 | 21.2 | 20.0 |
| Children Ages 11-15 | 22.1 | 23.6 | 21.7 | 21.1 | 19.4 | 17.0 |
| Women Ages 16-64 | 16.4 | 16.9 | 16.6 | 16.0 | 14.7 | 13.6 |
| Men Ages 16-64 | 11.5 | 11.9 | 11.8 | 11.7 | 11.1 | 10.0 |
| Adults Age 65 and over | 11.2 | 10.9 | 10.6 | 10.3 | 10.2 | 9.9 |
| Dependency Rates (More than 50 Percent of Income from Means-Tested Assistance) | ||||||
| All Persons | 5.9 | 5.8 | 5.3 | 5.2 | 4.5 | 3.8 |
| Racial Categories | ||||||
| Non-Hispanic White | 3.0 | 2.9 | 2.3 | 2.6 | 2.5 | 2.1 |
| Non-Hispanic Black | 17.8 | 16.7 | 15.5 | 13.8 | 11.4 | 10.5 |
| Hispanic | 11.8 | 12.5 | 12.2 | 10.9 | 9.1 | 6.6 |
| Age Categories | ||||||
| Children Ages 0-5 | 13.9 | 13.7 | 12.9 | 11.2 | 9.3 | 7.8 |
| Children Ages 6-10 | 11.2 | 11.2 | 10.5 | 9.5 | 8.4 | 6.7 |
| Children Ages 11-15 | 9.3 | 9.2 | 7.6 | 8.1 | 7.4 | 5.7 |
| Women Ages 16-64 | 5.9 | 5.7 | 5.2 | 5.2 | 4.6 | 3.9 |
| Men Ages 16-64 | 2.7 | 2.7 | 2.5 | 2.7 | 2.5 | 2.1 |
| Adults Age 65 and over | 2.4 | 2.7 | 2.2 | 2.4 | 2.1 | 2.1 |
Note: Recipiency is defined as living in a family with receipt of any amount of AFDC/TANF, SSI, or food stamps during year. Dependency is defined as having more than 50 percent of annual family income from AFDC/TANF, SSI and/or food stamps. Dependency rates would be lower if adjusted to exclude welfare assistance associated with working.
Source: Indicators of Welfare Dependence (2001), Table SUM 1, which drew on March CPS data, analyzed using the TRIM3 microsimulation model.
Table SUM 1_CPS. Recipiency and Dependency Rates: 1993-1998
| 1993 | 1994 | 1995 | 1996 | 1997 | 1998 | |
|---|---|---|---|---|---|---|
| Recipiency Rates (Rates of Any Amount of AFDC, Food Stamps, or SSI) | ||||||
| All Persons | 14.4 | 13.7 | 13.3 | 12.7 | 11.4 | 10.1 |
| Racial Categories | ||||||
| Non-Hispanic White | 9.1 | 8.4 | 7.9 | 7.9 | 7.1 | 6.0 |
| Non-Hispanic Black | 35.0 | 33.1 | 32.4 | 30.3 | 26.6 | 25.5 |
| Hispanic | 27.5 | 27.2 | 26.1 | 23.7 | 21.3 | 17.5 |
| Age Categories | ||||||
| Children Ages 0-5 | 27.0 | 25.6 | 24.7 | 22.6 | 19.7 | 17.1 |
| Children Ages 6-10 | 22.3 | 21.8 | 21.7 | 20.2 | 17.7 | 16.7 |
| Children Ages 11-15 | 19.9 | 18.4 | 17.6 | 16.8 | 16.5 | 14.0 |
| Women Ages 16-64 | 14.3 | 13.5 | 13.1 | 12.6 | 11.3 | 10.0 |
| Men Ages 16-64 | 9.9 | 9.4 | 9.3 | 9.0 | 7.9 | 6.9 |
| Adults Age 65 and over | 8.7 | 8.6 | 7.9 | 8.5 | 7.6 | 7.1 |
| Dependency Rates (More than 50 Percent of Income from Means-Tested Assistance) | ||||||
| All Persons | 4.6 | 4.3 | 3.9 | 3.6 | 3.1 | 2.5 |
| Racial Categories | ||||||
| Non-Hispanic White | 2.3 | 2.1 | 1.7 | 1.7 | 1.6 | 1.3 |
| Non-Hispanic Black | 14.9 | 12.5 | 11.7 | 10.6 | 8.2 | 7.5 |
| Hispanic | 8.4 | 8.9 | 8.5 | 7.2 | 6.3 | 4.3 |
| Age Categories | ||||||
| Children Ages 0-5 | 10.9 | 10.1 | 9.5 | 7.2 | 6.2 | 4.9 |
| Children Ages 6-10 | 9.0 | 8.5 | 7.6 | 6.8 | 5.7 | 4.5 |
| Children Ages 11-15 | 7.6 | 6.7 | 5.8 | 5.6 | 5.1 | 3.8 |
| Women Ages 16-64 | 4.8 | 4.4 | 4.0 | 3.8 | 3.3 | 2.6 |
| Men Ages 16-64 | 2.1 | 2.0 | 1.8 | 1.9 | 1.7 | 1.4 |
| Adults Age 65 and over | 1.4 | 1.6 | 1.4 | 1.7 | 1.4 | 1.3 |
Note: Recipiency is defined as living in a family with receipt of any amount of AFDC/TANF, SSI, or food stamps during year. Dependency is defined as having more than 50 percent of annual family income from AFDC/TANF, SSI and/or food stamps. Dependency rates would be lower if adjusted to exclude welfare assistance associated with working.
Source: Unpublished March CPS data.
Degree of Dependence (Indicators 1a and 1b, formerly 1a and 1c).
The SUM 1 tables are drawn directly from the Indicator 1a tables, and so the same notes as above apply to the three tabulations of Indicator 1a (see pages D-10 to D-12). The same concepts of recipiency and income are used in Indicator 1b, which examine percentages of total family income from various sources by poverty status as well as by race and age (see pages D-13 through D-18). In these tables, annual family income is defined to include the value of food stamps.
The SIPP and TRIM-adjusted CPS data for Indicator 1b are very similar for those under 100 percent or 200 percent of the Federal poverty threshold (see Tables IND 1b_SIPP and IND 1b_TRIM). For example, the percentage of total annual family income from AFDC, SSI and food stamps for all person below the poverty threshold was 42 and 41 percent according SIPP and TRIM-adjusted CPS, respectively. Earnings contributed between 40 percent, with 18 percent from other income according to both data sources. The data sets showed more divergence in results for individuals under 50 percent of poverty, a result which may be partially explained by the small sample size and heterogeneity of this subgroup of the poverty population.
The CPS data capture much less income from AFDC, SSI and food stamps, as shown in Table IND 1b_CPS. For example, CPS data suggest that these sources amount to only 26 percent of family income for individuals below the poverty threshold in 1995, rather than the 41 to 42 percent found in SIPP and TRIM-adjusted CPS. This under-reporting of welfare income in CPS indicates why the unadjusted CPS data were not used to report recipiency and dependency rates in the body of the report.
Table IND 1a_SIPP. Percentage of Total Income from Means-Tested Assistance Programs, by Race and Age: 1993-1995
| 0% | >0% and <= 50% | Total > 50% | |
|---|---|---|---|
| 1995 | |||
| All Persons | 83.0 | 11.9 | 5.1 |
| Non-Hispanic White | 89.6 | 8.3 | 2.3 |
| Non-Hispanic Black | 59.1 | 25.8 | 15.2 |
| Hispanic | 65.4 | 22.4 | 12.2 |
| Children Ages 0-5 | 72.4 | 17.0 | 10.6 |
| Children Ages 6-10 | 71.3 | 14.9 | 11.6 |
| Children Ages 11-15 | 76.4 | 14.5 | 9.1 |
| Women Ages 16-64 | 82.7 | 11.5 | 5.2 |
| Men Ages 16-64 | 88.5 | 9.3 | 2.3 |
| Adults Age 65 and over | 87.8 | 10.4 | 1.8 |
| 1994 | |||
| All Persons | 82.0 | 12.4 | 5.6 |
| Non-Hispanic White | 88.9 | 8.5 | 2.6 |
| Non-Hispanic Black | 56.8 | 26.3 | 16.8 |
| Hispanic | 62.9 | 24.2 | 12.9 |
| Children Ages 0-5 | 67.6 | 19.9 | 12.5 |
| Children Ages 6-10 | 71.4 | 16.6 | 12.0 |
| Children Ages 11-15 | 75.1 | 15.7 | 9.3 |
| Women Ages 16-64 | 82.5 | 12.0 | 5.5 |
| Men Ages 16-64 | 87.7 | 9.8 | 2.5 |
| Adults Age 65 and over | 87.7 | 10.2 | 2.2 |
| 1993 | |||
| All Persons | 82.2 | 12.0 | 5.9 |
| Non-Hispanic White | 88.8 | 8.4 | 2.8 |
| Non-Hispanic Black | 58.6 | 24.6 | 16.7 |
| Hispanic | 62.9 | 21.9 | 14.2 |
| Children Ages 0-5 | 68.5 | 18.2 | 13.3 |
| Children Ages 6-10 | 72.8 | 15.0 | 12.3 |
| Children Ages 11-15 | 75.9 | 13.6 | 10.5 |
| Women Ages 16-64 | 82.2 | 12.0 | 5.8 |
| Men Ages 16-64 | 87.7 | 9.6 | 2.7 |
| Adults Age 65 and over | 88.1 | 10.0 | 2.0 |
Note: Means-tested assistance includes AFDC, SSI and food stamps. While only affecting a small number of cases, general assistance income is included under AFDC. Total > 50% includes all persons with more than 50 percent of their total annual family income from these means-tested programs. Income includes cash income and the value of food stamps. Because full calendar year data for 1995 were not available for all SIPP respondents, 1995 estimates are based on a weighting adjustment to account for those who were not interviewed for the entire year.
Source: Indicators of Welfare Dependence (2000), Table IND 1a, which drew on unpublished data from the SIPP, 1993 panel.
Table IND 1a_TRIM. Percentage of Total Income from Means-Tested Assistance Programs, by Race and Age: 1993-1995
| 0% | >0% and <= 50% | Total > 50% | |
|---|---|---|---|
| 1995 | |||
| All Persons | 83.2 | 11.6 | 5.3 |
| Non-Hispanic White | 90.0 | 7.7 | 2.3 |
| Non-Hispanic Black | 61.4 | 23.1 | 15.5 |
| Hispanic | 65.0 | 22.8 | 12.2 |
| Children Ages 0-5 | 68.4 | 18.6 | 12.9 |
| Children Ages 6-10 | 73.5 | 16.0 | 10.5 |
| Children Ages 11-15 | 78.3 | 14.1 | 7.6 |
| Women Ages 16-64 | 83.4 | 11.3 | 5.2 |
| Men Ages 16-64 | 88.2 | 9.3 | 2.5 |
| Adults Age 65 and over | 89.4 | 8.3 | 2.2 |
| 1994 | |||
| All Persons | 82.8 | 11.4 | 5.8 |
| Non-Hispanic White | 89.1 | 8.0 | 2.9 |
| Non-Hispanic Black | 61.7 | 21.6 | 16.7 |
| Hispanic | 65.1 | 22.4 | 12.5 |
| Children Ages 0-5 | 68.5 | 17.8 | 13.7 |
| Children Ages 6-10 | 73.2 | 15.6 | 11.2 |
| Children Ages 11-15 | 76.5 | 14.3 | 9.2 |
| Women Ages 16-64 | 83.1 | 11.2 | 5.7 |
| Men Ages 16-64 | 88.1 | 9.3 | 2.7 |
| Adults Age 65 and over | 89.1 | 8.2 | 2.7 |
| 1993 | |||
| All Persons | 83.4 | 10.7 | 5.9 |
| Non-Hispanic White | 89.7 | 7.3 | 3.0 |
| Non-Hispanic Black | 62.0 | 20.3 | 17.8 |
| Hispanic | 65.4 | 22.8 | 11.8 |
| Children Ages 0-5 | 69.5 | 16.6 | 13.9 |
| Children Ages 6-10 | 75.1 | 13.7 | 11.2 |
| Children Ages 11-15 | 77.9 | 12.8 | 9.3 |
| Women Ages 16-64 | 83.6 | 10.5 | 5.9 |
| Men Ages 16-64 | 88.5 | 8.8 | 2.7 |
| Adults Age 65 and over | 88.8 | 8.8 | 2.4 |
Note: Means-tested assistance includes AFDC, SSI, and food stamps. Total >50% includes all persons with more than 50 percent of their total annual family income from these means-tested programs. Income includes cash income and the value of food stamps.
Source: Indicators of Welfare Dependence (2001), Table IND 1a, which drew on March CPS data, analyzed using the TRIM3 microsimulation model.
Table IND 1a_CPS. Percentage of Total Income from Means-Tested Assistance Programs, by Race and Age: 1993-1995
| 0% | >0% and <= 50% | Total > 50% | |
|---|---|---|---|
| 1995 | |||
| All Persons | 86.7 | 9.4 | 3.9 |
| Non-Hispanic White | 92.1 | 6.2 | 1.7 |
| Non-Hispanic Black | 67.6 | 20.7 | 11.7 |
| Hispanic | 73.9 | 17.6 | 8.5 |
| Children Ages 0-5 | 75.3 | 15.2 | 9.5 |
| Children Ages 6-10 | 78.3 | 14.1 | 7.6 |
| Children Ages 11-15 | 82.4 | 11.8 | 5.8 |
| Women Ages 16-64 | 86.9 | 9.1 | 4.0 |
| Men Ages 16-64 | 90.7 | 7.5 | 1.8 |
| Adults Age 65 and over | 92.1 | 6.5 | 1.4 |
| 1994 | |||
| All Persons | 86.3 | 9.4 | 4.3 |
| Non-Hispanic White | 91.6 | 6.2 | 2.1 |
| Non-Hispanic Black | 66.9 | 20.6 | 12.5 |
| Hispanic | 72.8 | 18.3 | 8.9 |
| Children Ages 0-5 | 74.4 | 15.6 | 10.1 |
| Children Ages 6-10 | 78.2 | 13.3 | 8.5 |
| Children Ages 11-15 | 81.6 | 11.6 | 6.7 |
| Women Ages 16-64 | 86.5 | 9.1 | 4.4 |
| Men Ages 16-64 | 90.6 | 7.5 | 2.0 |
| Adults Age 65 and over | 91.4 | 7.0 | 1.6 |
| 1993 | |||
| All Persons | 85.6 | 9.8 | 4.6 |
| Non-Hispanic White | 90.9 | 6.8 | 2.3 |
| Non-Hispanic Black | 65.0 | 20.1 | 14.9 |
| Hispanic | 72.5 | 19.0 | 8.4 |
| Children Ages 0-5 | 73.0 | 16.1 | 10.9 |
| Children Ages 6-10 | 77.7 | 13.3 | 9.0 |
| Children Ages 11-15 | 80.1 | 12.3 | 7.6 |
| Women Ages 16-64 | 85.7 | 9.5 | 4.8 |
| Men Ages 16-64 | 90.1 | 7.8 | 2.1 |
| Adults Age 65 and over | 91.3 | 7.3 | 1.4 |
Note: Means-tested assistance includes AFDC, SSI, and food stamps. Total >50% includes all persons with more than 50 percent of their total annual family income from these means-tested programs. Income includes cash income and the value of food stamps.
Source: Unpublished March CPS data.
Table IND1b_SIPP. Percentage of Total Income from Various Sources, by Poverty Status, Race, and Age: 1995
| <50% of poverty | <100% of poverty | <200% of poverty | 200%+ of poverty | |
|---|---|---|---|---|
| All Persons | ||||
| AFDC, SSI, and Food Stamps | 71.2 | 41.7 | 13.4 | 0.2 |
| Earnings | 19.3 | 39.8 | 65.0 | 84.9 |
| Other Income | 9.5 | 18.4 | 21.7 | 14.8 |
| Racial Categories | ||||
| Non-Hispanic White | ||||
| AFDC, SSI, and Food Stamps | 54.7 | 32.0 | 8.1 | 0.2 |
| Earnings | 34.7 | 44.5 | 64.9 | 84.1 |
| Other Income | 10.5 | 23.5 | 27.0 | 15.7 |
| Non-Hispanic Black | ||||
| AFDC, SSI, and Food Stamps | 83.0 | 51.8 | 23.0 | 1.0 |
| Earnings | 8.4 | 29.3 | 58.4 | 88.2 |
| Other Income | 8.6 | 18.8 | 18.5 | 10.8 |
| Hispanic | ||||
| AFDC, SSI, and Food Stamps | 71.7 | 43.2 | 16.7 | 0.5 |
| Earnings | 18.9 | 45.1 | 71.6 | 89.6 |
| Other Income | 9.4 | 11.7 | 11.7 | 9.9 |
| Age Categories | ||||
| Children Ages 0-5 | ||||
| AFDC, SSI, and Food Stamps | 81.9 | 49.4 | 18.9 | 0.3 |
| Earnings | 11.6 | 39.3 | 71.3 | 93.5 |
| Other Income | 6.5 | 11.2 | 9.9 | 6.2 |
| Children Ages 6-10 | ||||
| AFDC, SSI, and Food Stamps | 77.1 | 46.8 | 18.2 | 0.3 |
| Earnings | 15.4 | 41.8 | 70.1 | 92.9 |
| Other Income | 7.5 | 11.5 | 11.7 | 6.8 |
| Children Ages 11-15 | ||||
| AFDC, SSI, and Food Stamps | 67.8 | 44.6 | 16.0 | 0.2 |
| Earnings | 24.5 | 40.2 | 68.1 | 92.5 |
| Other Income | 7.7 | 15.3 | 15.9 | 7.3 |
| Women Ages 16-64 | ||||
| AFDC, SSI, and Food Stamps | 68.9 | 42.0 | 13.6 | 0.2 |
| Earnings | 21.1 | 40.6 | 68.5 | 87.7 |
| Other Income | 18.2 | 17.3 | 17.9 | 12.0 |
| Men Ages 16-64 | ||||
| AFDC, SSI, and Food Stamps | 46.4 | 31.3 | 8.4 | 0.2 |
| Earnings | 35.4 | 48.4 | 74.3 | 89.0 |
| Other Income | 9.9 | 20.3 | 17.3 | 10.8 |
| Adults Age 65 and over | ||||
| AFDC, SSI, and Food Stamps | 29.7 | 21.3 | 6.2 | 0.4 |
| Earnings | 10.8 | 3.3 | 8.1 | 24.6 |
| Other Income | 59.5 | 75.4 | 85.6 | 75.0 |
Note: Total income is total annual family income, including the value of food stamps. While only affecting a small number of cases, general assistance income is included in AFDC income. Other income is non-means-tested, non-earnings income such as child support, alimony, pensions, Social Security benefits, interest, and dividends. Poverty status categories are not mutually exclusive. Because full calendar year data for 1995 were not available for all SIPP respondents, 1995 estimates are based on a weighting adjustment to account for those who were not interviewed for the entire year.
Source: Indicators of Welfare Dependence (2000), Table IND 1c, which drew on unpublished data from the SIPP, 1993 panel.
Table IND 1b_TRIM. Percentage of Total Income from Various Sources, by Poverty Status, Race, and Age: 1995
| < 50% poverty | <100% of poverty | <200% of poverty | 200%+ of poverty | |
|---|---|---|---|---|
| All Persons | ||||
| AFDC, SSI, and Food Stamps | 65.9 | 41.3 | 14.2 | 0.3 |
| Earnings | 22.5 | 40.4 | 64.8 | 85.4 |
| Other Income | 11.6 | 18.3 | 21.0 | 14.3 |
| Racial Categories | ||||
| Non-Hispanic White | ||||
| AFDC, SSI, and Food Stamps | 55.5 | 30.3 | 8.1 | 0.2 |
| Earnings | 27.6 | 43.8 | 65.3 | 84.7 |
| Other Income | 16.9 | 25.8 | 26.6 | 15.2 |
| Non-Hispanic Black | ||||
| AFDC, SSI, and Food Stamps | 73.8 | 52.4 | 24.6 | 1.0 |
| Earnings | 16.2 | 30.3 | 57.6 | 87.6 |
| Other Income | 10.0 | 17.3 | 17.8 | 11.4 |
| Hispanic | ||||
| AFDC, SSI, and Food Stamps | 64.4 | 43.0 | 18.7 | 0.9 |
| Earnings | 28.2 | 47.5 | 70.8 | 90.2 |
| Other Income | 7.4 | 9.5 | 10.6 | 9.0 |
| Age Categories | ||||
| Children Ages 0-5 | ||||
| AFDC, SSI, and Food Stamps | 76.8 | 52.0 | 21.6 | 0.4 |
| Earnings | 16.3 | 38.2 | 69.4 | 93.2 |
| Other Income | 6.9 | 9.8 | 9.0 | 6.3 |
| Children Ages 6-10 | ||||
| AFDC, SSI, and Food Stamps | 70.8 | 46.7 | 17.7 | 0.3 |
| Earnings | 19.2 | 41.2 | 71.0 | 92.3 |
| Other Income | 10.0 | 12.1 | 11.3 | 7.3 |
| Children Ages 11-15 | ||||
| AFDC, SSI, and Food Stamps | 68.4 | 42.4 | 15.5 | 0.2 |
| Earnings | 20.1 | 43.3 | 71.7 | 91.1 |
| Other Income | 11.5 | 14.4 | 12.8 | 8.7 |
| Women Ages 16-64 | ||||
| AFDC, SSI, and Food Stamps | 63.6 | 41.6 | 14.6 | 0.3 |
| Earnings | 23.6 | 40.6 | 68.6 | 88.4 |
| Other Income | 12.7 | 17.8 | 16.7 | 11.3 |
| Men Ages 16-64 | ||||
| AFDC, SSI, and Food Stamps | 46.6 | 30.8 | 10.0 | 0.3 |
| Earnings | 38.6 | 50.8 | 73.9 | 89.4 |
| Other Income | 14.9 | 18.4 | 16.1 | 10.3 |
| Adults Age 65 and over | ||||
| AFDC, SSI, and Food Stamps | 27.7 | 21.5 | 6.8 | 0.4 |
| Earnings | 3.9 | 3.4 | 8.9 | 33.6 |
| Other Income | 68.5 | 75.2 | 84.3 | 66.0 |
Note: Total income is total annual family income, including the value of food stamps. Other income is non means-tested, non-earnings income such as child support, alimony, pensions, Social Security benefits, interest, and dividends. Poverty status categories are not mutually exclusive.
Source: March CPS data, analyzed using the TRIM3 microsimulation model.
Table IND 1b_CPS. Percentage of Total Income from Various Sources, by Poverty Status, Race, and Age: 1995
| < 50% poverty | <100% of poverty | <200% of poverty | 200%+ of poverty | |
|---|---|---|---|---|
| All Persons | ||||
| AFDC, SSI, and Food Stamps | 44.9 | 25.9 | 8.6 | 0.2 |
| Earnings | 36.7 | 52.1 | 69.2 | 85.5 |
| Other Income | 18.4 | 22.0 | 22.1 | 14.3 |
| Racial Categories | ||||
| Non-Hispanic White | ||||
| AFDC, SSI, and Food Stamps | 33.2 | 18.2 | 5.1 | 0.2 |
| Earnings | 40.0 | 52.9 | 67.7 | 84.7 |
| Other Income | 26.8 | 28.9 | 27.3 | 15.2 |
| Non-Hispanic Black | ||||
| AFDC, SSI, and Food Stamps | 57.8 | 37.0 | 16.4 | 0.8 |
| Earnings | 25.1 | 41.2 | 64.4 | 87.7 |
| Other Income | 17.2 | 21.8 | 19.2 | 11.5 |
| Hispanic | ||||
| AFDC, SSI, and Food Stamps | 42.3 | 23.3 | 9.8 | 0.4 |
| Earnings | 46.6 | 64.1 | 78.7 | 90.5 |
| Other Income | 11.0 | 12.6 | 11.5 | 9.1 |
| Age Categories | ||||
| Children Ages 0-5 | ||||
| AFDC, SSI, and Food Stamps | 55.9 | 31.9 | 12.0 | 0.2 |
| Earnings | 31.0 | 54.6 | 78.1 | 93.4 |
| Other Income | 13.1 | 13.5 | 9.9 | 6.4 |
| Children Ages 6-10 | ||||
| AFDC, SSI, and Food Stamps | 50.2 | 30.0 | 10.5 | 0.2 |
| Earnings | 34.5 | 54.8 | 77.3 | 92.4 |
| Other Income | 15.3 | 15.2 | 12.2 | 7.4 |
| Children Ages 11-15 | ||||
| AFDC, SSI, and Food Stamps | 45.8 | 27.9 | 10.6 | 0.2 |
| Earnings | 37.1 | 54.6 | 76.1 | 91.0 |
| Other Income | 17.1 | 17.5 | 13.4 | 8.7 |
| Women Ages 16-64 | ||||
| AFDC, SSI, and Food Stamps | 44.3 | 27.3 | 9.3 | 0.2 |
| Earnings | 36.0 | 51.8 | 73.3 | 88.4 |
| Other Income | 19.6 | 20.9 | 17.4 | 11.4 |
| Men Ages 16-64 | ||||
| AFDC, SSI, and Food Stamps | 28.2 | 18.5 | 6.3 | 0.2 |
| Earnings | 51.5 | 61.1 | 77.2 | 89.5 |
| Other Income | 20.3 | 20.3 | 16.5 | 10.4 |
| Adults Age 65 and over | ||||
| AFDC, SSI, and Food Stamps | 18.3 | 14.2 | 4.0 | 0.3 |
| Earnings | 10.0 | 6.0 | 9.9 | 33.5 |
| Other Income | 71.7 | 79.7 | 86.0 | 66.2 |
Note: Total income is total annual family income, including the value of food stamps. Other income is non means-tested, non-earnings income such as child support, alimony, pensions, Social Security benefits, interest, and dividends. Poverty status categories are not mutually exclusive.
Source: Unpublished March CPS data.
Receipt and Labor-Force Attachment (Indicators 2a and 2b, formerly Indicators 4a and 4b):
In Indicator 2, receipt is measured on a monthly basis for the individual or individuals in a family or household who are direct beneficiaries of AFDC/TANF, SSI or food stamp benefits. This measure of receipt differs from the annual measure of receipt by any member of the family used in Indicator 1 and SUM 1. Some family members may be recipients while others are not, particularly in the case of SSI benefits, which are limited to individuals or couples. In SIPP, recipients are those in the family who the survey respondent reports as “covered” by the benefit; in TRIM, recipients are those in the family who the model simulates as eligible for participation under programmatic rules. Labor force attachment is examined in the same month as receipt. Because the measure looks at recipients of all ages, not just adults, labor force attachment is measured as the presence of a family member in the labor force, whether or not the family member is the same person as the recipient. Tables IND 2a_SIPP and IND 2a_TRIM examine receipt and labor force attachment in one year (1995 in this appendix) and Tables IND 2b_SIPP and IND 2b_TRIM examine trends over several years.
The SIPP and TRIM-adjusted CPS data show similar overall results in 1993; both reported 57 percent of AFDC recipients lived in families with no labor force participants and 18 to 19 percent in families with a full-time worker (see Tables IND 2b_SIPP and IND 2b_TRIM). The data are not quite as consistent in 1995, however. Although both data sets show increased labor force participation among families with AFDC recipients between 1993 and 1995, the increase is more pronounced in the TRIM data. The TRIM data indicate that 25 percent of AFDC recipients are in families with a full-time labor force participant, compared to 22 percent in the SIPP. Similar differences are found for food stamp and SSI recipients and across racial and age categories. Although not large, these differences suggest the importance of examining SIPP data for 1996-1998, once available.
It is important to note that both data sources show rising labor force participation among welfare recipients, despite different estimates of the precise level in 1995. Moreover, other data sources, including administrative data and regular CPS data (not shown here because the CPS data are limited to annual measures, which cannot be easily compared to the monthly measures in SIPP and TRIM), are consistent in showing that the increase in labor force attachment has continued since 1995.
Table IND 2a_SIPP. Percentage of Recipients in Families with Labor Force Participants, by Program, Race, and Age: 1995
| No one in LF | At least one in LF No one FT | At least one FT LF participant | ||
|---|---|---|---|---|
| AFDC | All Persons | 54.1 | 23.8 | 22.1 |
| Non-Hispanic White | 52.4 | 22.1 | 25.6 | |
| Non-Hispanic Black | 53.2 | 23.6 | 23.2 | |
| Hispanic | 58.4 | 23.0 | 18.6 | |
| Children Ages 0-5 | 55.0 | 21.3 | 23.7 | |
| Children Ages 6-10 | 59.0 | 21.1 | 19.9 | |
| Children Ages 11-15 | 55.6 | 26.9 | 17.5 | |
| Women Ages 16-64 | 52.1 | 24.0 | 23.9 | |
| Men Ages 16-64 | 41.6 | 33.9 | 24.5 | |
| Adults Age 65 and over | 51.0 | 15.3 | 32.9 | |
| SSI | All Persons | 62.6 | 11.3 | 26.1 |
| Non-Hispanic White | 63.4 | 10.5 | 26.1 | |
| Non-Hispanic Black | 64.4 | 13.7 | 21.9 | |
| Hispanic | 60.9 | 9.5 | 29.6 | |
| Children Ages 0-5 | N/A | N/A | N/A | |
| Children Ages 6-10 | N/A | N/A | N/A | |
| Children Ages 11-15 | N/A | N/A | N/A | |
| Women Ages 16-64 | 57.9 | 17.0 | 25.1 | |
| Men Ages 16-64 | 56.8 | 10.1 | 33.1 | |
| Adults Age 65 and over | 73.9 | 4.2 | 22.0 | |
| FOODSTAMPS | All Persons | 46.1 | 22.7 | 31.2 |
| Non-Hispanic White | 43.8 | 20.4 | 35.8 | |
| Non-Hispanic Black | 50.8 | 23.7 | 25.5 | |
| Hispanic | 44.2 | 22.6 | 33.2 | |
| Children Ages 0-5 | 43.8 | 20.8 | 35.3 | |
| Children Ages 6-10 | 47.8 | 22.2 | 30.0 | |
| Children Ages 11-15 | 46.1 | 26.1 | 27.8 | |
| Women Ages 16-64 | 45.9 | 23.8 | 30.3 | |
| Men Ages 16-64 | 35.3 | 26.9 | 37.8 | |
| Adults Age 65 and over | 82.0 | 4.2 | 13.7 |
Note: Recipients are limited to those individuals or family members covered by benefits in a month. Full-time labor force participants are defined as those who usually work 35 hours or more per week. Part-time labor force participation includes those who are unemployed, laid off, and/or looking for work. This indicator measures, on an average monthly basis, the combination of individual benefit receipt and labor force participation by any family member in the same month. Data on receipt of SSI for young children are not available (N/A). Because full calendar year data for 1995 were not available for all SIPP respondents, estimates are based on a weighting adjustment to account for those who were not interviewed for the entire year.
Source: Indicators of Welfare Dependence (2000), Table IND 4a, which drew on unpublished data from the SIPP, 1993 panel.
Table IND 2a_TRIM. Percentage of Recipients in Families with Labor Force Participants, by Program, Race, and Age: 1995
| No one in LF | At least one in LF, No one FT | At least one FT LF participant | ||
|---|---|---|---|---|
| AFDC | All Persons | 50.6 | 24.3 | 25.1 |
| Non-Hispanic White | 43.4 | 28.0 | 28.6 | |
| Non-Hispanic Black | 57.5 | 22.4 | 20.2 | |
| Hispanic | 50.2 | 22.7 | 27.2 | |
| Children Ages 0-5 | 53.4 | 20.9 | 25.7 | |
| Children Ages 6-10 | 55.7 | 22.8 | 21.5 | |
| Children Ages 11-15 | 51.9 | 25.0 | 23.1 | |
| Women Ages 16-64 | 49.5 | 24.8 | 25.7 | |
| Men Ages 16-64 | 30.5 | 37.1 | 32.3 | |
| Adults Age 65 and over | 46.9 | 5.5 | 47.6 | |
| SSI | All Persons | 62.0 | 10.4 | 27.5 |
| Non-Hispanic White | 64.7 | 10.1 | 25.2 | |
| Non-Hispanic Black | 61.2 | 11.3 | 27.5 | |
| Hispanic | 57.8 | 10.1 | 32.1 | |
| Children Ages 0-5 | 36.3 | 15.4 | 48.3 | |
| Children Ages 6-10 | 33.2 | 20.3 | 46.5 | |
| Children Ages 11-15 | 36.6 | 21.8 | 41.6 | |
| Women Ages 16-64 | 65.7 | 11.3 | 23.0 | |
| Men Ages 16-64 | 64.3 | 8.5 | 27.2 | |
| Adults Age 65 and over | 67.8 | 7.4 | 24.8 | |
| FOODSTAMPS | All Persons | 42.3 | 24.0 | 33.7 |
| Non-Hispanic White | 41.6 | 26.3 | 32.1 | |
| Non-Hispanic Black | 45.8 | 23.8 | 30.5 | |
| Hispanic | 37.0 | 21.5 | 41.5 | |
| Children Ages 0-5 | 40.0 | 22.0 | 38.0 | |
| Children Ages 6-10 | 40.7 | 25.8 | 33.5 | |
| Children Ages 11-15 | 38.6 | 25.7 | 35.6 | |
| Women Ages 16-64 | 42.9 | 24.4 | 32.7 | |
| Men Ages 16-64 | 34.5 | 28.4 | 37.1 | |
| Adults Age 65 and over | 83.8 | 7.5 | 8.7 |
Note: Recipients are limited to those individuals or family members directly receiving benefits in a month. Full-time workers are those who usually work 35 hours or more per week. Part-time labor force participation includes those who are unemployed, laid off, and/or looking for work. This indicator measures, on an average monthly basis, the combination of individual benefit receipt and labor force participation by any family member in the same month.
Source: March CPS data, analyzed using the TRIM3 microsimulation model.
Table IND 2b_SIPP. Percentage of AFDC Recipients in Families with Labor Force Participants: 1993-1995
| No one In LF | At least one in LF, No one FT | At least one FT LF Participant | |
|---|---|---|---|
| 1993 | 56.5 | 25.7 | 17.8 |
| 1994 | 54.5 | 25.3 | 20.2 |
| 1995 | 54.1 | 23.8 | 22.1 |
Note: Recipients are limited to those individuals or family members covered by benefits in a month. Full-time labor force participants are defined as those who usually work 35 hours or more per week. Part-time labor force participation includes those who are unemployed, laid off, and/or looking for work. This indicator measures, on an average monthly basis, the combination of individual benefit receipt and labor force participation by any family member in the same month. Because full calendar year data for 1995 were not available for all SIPP respondents, estimates are based on a weighting adjustment to account for those who were not interviewed for the entire year.
Source: Indicators of Welfare Dependence (2001), Table IND4b, which drew on unpublished data from the SIPP, 1992 and 1993 panels.
Table IND 2b_TRIM. Percentage of AFDC/TANF Recipients in Families with Labor Force Participants: 1993-1998
| No one in LF | At least one in LF, No one FT | At least one FT worker | |
|---|---|---|---|
| 1993 | 57.0 | 24.2 | 18.8 |
| 1994 | 54.8 | 24.8 | 20.4 |
| 1995 | 50.6 | 24.3 | 25.1 |
| 1996 | 50.1 | 25.6 | 24.3 |
| 1997 | 47.6 | 28.0 | 24.4 |
| 1998 | 44.3 | 25.8 | 29.9 |
Note: Recipients are limited to those individuals or family members directly receiving benefits in a month. Full-time workers are those who usually work 35 hours or more per week. Part-time labor force participation includes those who are unemployed, laid off, and/or looking for work. This indicator measures, on an average monthly basis, the combination of individual benefit receipt and labor force participation by any family member in the same month.
Source: Indicators of Welfare Dependence (2001), Table IND 4b, which drew on March CPS data, analyzed using the TRIM3 microsimulation model.
Multiple Program Receipt (Indicators 5a and 5b, formerly Indicators 7a and 7b):
As in Indicator 2 above, receipt in Indicator 5 is based on average monthly receipt over a year, by those in the family who were “covered” by the benefit according to the SIPP respondent or the TRIM model’s eligibility simulation. Although these two definitions are quite similar, they are not identical. In particular, TRIM does not show any individual as receiving both AFDC and SSI in the same month, consistent with program rules barring receipt of both types of benefits by the same individual. SIPP, however, shows a few individuals as covered by both SSI and AFDC (and in many cases food stamps), a result which may reflect errors in survey reporting or benefit administration. Tables IND 5a_SIPP and IND 5a_TRIM examine multiple program receipt in 1995 and Tables IND 5b_SIPP and IND 5b_TRIM examine trends over several years.
The percentage of the population receiving benefits from AFDC, food stamps or SSI is consistently higher in the TRIM-adjusted CPS data as compared with the SIPP data. In 1995, for example, 12.3 percent of the population had any receipt according to TRIM, compared with only 10.7 percent of the population in the SIPP data. In particular, TRIM identifies more individuals as receiving food stamps, particularly food stamps alone or food stamps in combination with SSI.
No comparison is provided to CPS data because of the difficulty of comparing the CPS annual measures with the average monthly measures from SIPP and TRIM.
Table IND 5a_SIPP. Percentage of Population Receiving Assistance from One, Two, or Three Programs (AFDC, Food Stamps, SSI), by Race and Age: 1995)
| Any Receipt | One Program Only | Two Programs | All Three Programs | |||||
|---|---|---|---|---|---|---|---|---|
| AFDC | FS | SSI | AFDC & FS | AFDC & SSI | FS & SSI | AFDC, FS & SSI | ||
| All Persons | 10.7 | 0.5 | 3.9 | 1.1 | 4.3 | N/A | 0.7 | 0.2 |
| Racial Categories | ||||||||
| Non-Hispanic White | 7.9 | 0.3 | 3.3 | 0.9 | 2.7 | N/A | 0.5 | 0.1 |
| Non-Hispanic Black | 27.2 | 1.4 | 8.1 | 2.5 | 12.8 | 0.1 | 1.7 | 0.6 |
| Hispanic | 23.4 | 1.0 | 8.9 | 1.4 | 10.6 | N/A | 1.1 | 0.4 |
| Age Categories | ||||||||
| Children Ages 0-5 | 21.4 | 1.1 | 7.7 | 0.0 | 12.5 | N/A | N/A | N/A |
| Children Ages 6-10 | 21.1 | 1.5 | 7.4 | 0.0 | 12.2 | N/A | N/A | N/A |
| Children Ages 11-15 | 16.5 | 0.8 | 6.4 | 0.0 | 9.3 | N/A | N/A | N/A |
| Women Ages 16-64 | 10.5 | 0.5 | 3.5 | 1.3 | 3.8 | N/A | 0.9 | 0.5 |
| Men Ages 16-64 | 5.3 | 0.1 | 2.7 | 1.1 | 0.9 | N/A | 0.4 | N/A |
| Adults Age 65 and over | 6.9 | 0.1 | 1.6 | 3.0 | N/A | N/A | 2.2 | N/A |
Notes: See Table IND 5b_SIPP on next page.
Source: Indicators of Welfare Dependence (2000), Table IND 7a.
Table IND 5a_TRIM. Percentage of Population Receiving Assistance from One, Two or Three Programs (AFDC, Food Stamps, SSI), by Race and Age: 1995
| Any Receipt | One Program Only | Two Programs | All Three Programs | |||||
|---|---|---|---|---|---|---|---|---|
| AFDC | FS | SSI | AFDC & FS | AFDC & SSI | FS & SSI | AFDC, FS & SSI | ||
| All Persons | 12.3 | 0.4 | 5.0 | 1.2 | 4.5 | N/A | 1.1 | N/A |
| Racial Categories | ||||||||
| Non-Hispanic White | 6.8 | 0.3 | 2.9 | 0.9 | 2.0 | N/A | 0.7 | N/A |
| Non-Hispanic Black | 30.3 | 0.9 | 11.8 | 2.1 | 12.6 | N/A | 2.9 | N/A |
| Hispanic | 26.8 | 0.8 | 11.1 | 2.0 | 11.1 | N/A | 1.8 | N/A |
| Age Categories | ||||||||
| Children Ages 0-5 | 26.9 | 1.4 | 9.2 | 0.5 | 15.0 | N/A | 0.8 | N/A |
| Children Ages 6-10 | 21.9 | 1.1 | 8.4 | 0.7 | 11.1 | N/A | 0.6 | N/A |
| Children Ages 11-15 | 17.3 | 1.0 | 7.2 | 0.8 | 7.7 | N/A | 0.7 | N/A |
| Women Ages 16-64 | 11.6 | 0.3 | 4.9 | 1.0 | 4.1 | N/A | 1.3 | N/A |
| Men Ages 16-64 | 6.7 | 0.2 | 3.8 | 1.0 | 1.1 | N/A | 0.7 | N/A |
| Adults Age 65 and over | 8.5 | 0.0 | 2.0 | 3.7 | 0.1 | N/A | 2.7 | N/A |
Notes: See Table IND 5b_TRIM on next page.
Source: March CPS data, analyzed using the TRIM 3 microsimulation model.
Table IND 5b_SIPP. Percentage of Population Receiving Assistance from One, Two or Three Programs (AFDC, Food Stamps, SSI): 1993-1995
| Any Receipt | One Program Only | Two Programs | All Three Programs | |||||
|---|---|---|---|---|---|---|---|---|
| AFDC | FS | SSI | AFDC & FS | AFDC & SSI | FS & SSI | AFDC, FS, & SSI | ||
| 1993 | 11.4 | 0.4 | 4.4 | 1.1 | 4.8 | N/A | 0.7 | 0.2 |
| 1994 | 11.2 | 0.4 | 4.3 | 1.1 | 4.6 | N/A | 0.7 | 0.2 |
| 1995 | 10.7 | 0.5 | 3.9 | 1.1 | 4.3 | N/A | 0.7 | 0.2 |
Note: Categories are mutually exclusive. SSI receipt based on individual receipt; AFDC and food stamp receipt based on those in the family covered by the benefit. Although individuals may not receive both AFDC and SSI, some individuals are reported in the SIPP data as being covered by both AFDC and SSI benefits. For certain categories, data are not available (N/A) because of insufficient sample size and because SSI recipiency data are not available for children. Because full calendar year data for 1995 were not available for all SIPP respondents, 1995 estimates are based on a weighting adjustment to account for those who were not interviewed for the entire year. The percentage of individuals receiving assistance from any one program in an average month (shown here) is lower than the percentage residing in families receiving any assistance over the course of a year (shown in Table SUM 1 in Chapter I).
Source: Indicators of Welfare Dependence (2000), Table IND 7b, which drew from unpublished data from the SIPP, 1992 and 1993 panels.
Table IND 5b_TRIM. Percentage of Population Receiving Assistance from Multiple Programs (AFDC/TANF, Food Stamps, SSI): 1993-1998
| Any Receipt | One Program Only | Two Programs | All Three Programs | |||||
|---|---|---|---|---|---|---|---|---|
| AFDC/ TANF | FS | SSI | AFDC/ TANF & FS | AFDC/ TANF & SSI | FS & SSI | AFDC, FS, & SSI | ||
| 1993 | 12.6 | 0.6 | 5.2 | 1.1 | 4.8 | N/A | 1.0 | N/A |
| 1994 | 12.8 | 0.5 | 5.3 | 1.2 | 4.6 | N/A | 1.1 | N/A |
| 1995 | 12.3 | 0.4 | 5.0 | 1.2 | 4.5 | N/A | 1.1 | N/A |
| 1996 | 12.0 | 0.3 | 5.3 | 1.2 | 4.0 | N/A | 1.1 | N/A |
| 1997 | 10.2 | 0.4 | 4.3 | 1.3 | 3.1 | N/A | 1.0 | N/A |
| 1998 | 9.0 | 0.4 | 3.9 | 1.4 | 2.4 | N/A | 0.9 | N/A |
Note: Categories are mutually exclusive. SSI receipt based on individual receipt; AFDC and food stamp receipt based on full recipient unit. By definition, individuals may not receive both AFDC and SSI; hence, no individual receives benefits from all three programs. The percentage of individuals receiving assistance from any one program in an average month (shown here) is lower than the percentage residing in families receiving assistance over the course of a year (shown in Table SUM 1 in Chapter I and Table IND 1a in Chapter II).
Source: March CPS data, analyzed using the TRIM3 microsimulation model.
Labor-Force Attachment (WORK 1)
The first work-related risk factor, WORK 1, examines labor force attachment of the overall population. Because this measure does not involve welfare receipt, and because the CPS is, by design, one of the best sources of data on labor force attachment, these data were not adjusted by the TRIM model. The tabulations in this Appendix, therefore, are simply of CPS and SIPP data. Data for 1995 are shown in Tables WORK 1a_SIPP and WORK 1a_CPS; the time series data are shown in Tables WORK 1b_SIPP and WORK 1b_CPS. Comparisons are difficult, however, because the CPS tabulations of this work-related risk factor are based on annual measures of labor force attachment. In contrast, the SIPP tabulations were based on average monthly measures of labor force attachment.
As expected, CPS data on labor force participation found fewer individuals with no family members in the labor force over the entire year as compared with the SIPP measures of labor force participation in the past month. Full-time work throughout the year was also less common than full-time work for the past month. Finally, part-time work (including part-year work), was more common when measured on an annual as opposed to a monthly basis.
Table WORK 1a_SIPP. Percentage of Individuals in Families with Labor Force Participants in an Average Month, by Race and Age: 1995
| No one in LF | At least one in LF No one FT | At least one FT LF Participant | |
|---|---|---|---|
| All Persons | 16.6 | 8.5 | 74.9 |
| Racial Categories | |||
| Non-Hispanic White | 16.1 | 7.5 | 76.4 |
| Non-Hispanic Black | 21.7 | 12.3 | 66.0 |
| Hispanic | 16.6 | 10.0 | 73.4 |
| Age Categories | |||
| Children Ages 0-5 | 11.4 | 8.3 | 80.3 |
| Children Ages 6-10 | 11.9 | 8.7 | 79.4 |
| Children Ages 11-15 | 9.9 | 9.1 | 81.0 |
| Women Ages 16-64 | 10.1 | 9.0 | 80.9 |
| Men Ages 16-64 | 6.5 | 7.1 | 86.4 |
| Adults Age 65 and over | 72.0 | 10.1 | 17.8 |
Notes: See Table WORK 1b_SIPP on next page.
Source: Indicators of Welfare Dependence (2000), Table WORK 1a.
Table WORK 1a_CPS. Percentage of Individuals in Families with Labor Force Participants, by Race and Age: 1995
| No one in LF During Year | At least one in LF No one FT/FY | At least one FT/FY LF participant | |
|---|---|---|---|
| All Persons | 13.8 | 17.0 | 69.2 |
| Racial Categories | |||
| Non-Hispanic White | 13.8 | 15.4 | 70.9 |
| Non-Hispanic Black | 16.6 | 22.7 | 60.7 |
| Hispanic | 11.8 | 21.5 | 66.7 |
| Age Categories | |||
| Children Ages 0-5 | 7.9 | 19.1 | 73.1 |
| Children Ages 6-10 | 7.3 | 17.9 | 74.8 |
| Children Ages 1-15 | 5.9 | 16.2 | 77.9 |
| Women Ages 16-64 | 7.6 | 17.7 | 74.7 |
| Men Ages 16-64 | 5.3 | 16.0 | 78.7 |
| Adults Age 65 and over | 66.6 | 16.0 | 17.4 |
Notes: See Table WORK 1b_TRIM on next page.
Source: Unpublished tabulations of March CPS data
WORK 1b_SIPP. Percentage of Individuals in Families with Labor Force Participants in an Average Month: 1990-1995
| No one in LF | At least one in LF No one FT | At least one FT LF Participant | |
|---|---|---|---|
| 1990 | 15.8 | 7.8 | 76.4 |
| 1991 | 16.2 | 8.6 | 75.2 |
| 1992 | 16.0 | 9.7 | 74.2 |
| 1993 | 16.3 | 9.5 | 74.2 |
| 1994 | 16.7 | 9.1 | 74.3 |
| 1995 | 16.6 | 8.5 | 74.9 |
Note: Full-time labor force participants are defined as those who usually work 35 or more hours per week. Part-time labor force participation includes individuals who are unemployed, laid off, and/or looking for work. Because full calendar year data for 1995 were not available for all SIPP respondents, 1995 estimates are based on a weighting adjustment to account for those who were not interviewed for the entire year.
Source: Indicators of Welfare Dependence (2001), which drew on unpublished data from the 1992 and 1993 SIPP panels.
Table WORK 1b_CPS. Percentage of Individuals in Families with Labor Force Participants: 1990-1999
| No one in LF During Year | At least one in LF No one FT/FY | At least one FT/FY LF participant | |
|---|---|---|---|
| 1990 | 13.7 | 18.1 | 68.3 |
| 1991 | 14.3 | 18.7 | 67.0 |
| 1992 | 14.3 | 18.6 | 67.1 |
| 1993 | 14.2 | 18.6 | 67.3 |
| 1994 | 14.0 | 17.7 | 68.3 |
| 1995 | 13.8 | 17.0 | 69.2 |
| 1996 | 13.6 | 16.7 | 69.7 |
| 1997 | 13.5 | 16.3 | 70.2 |
| 1998 | 13.3 | 15.3 | 71.4 |
| 1999 | 13.1 | 14.6 | 72.3 |
Note: Full-time full-year workers are defined as those who usually worked for 35 or more hours per week, for at least 50 weeks in a given year. Part-time and part-year labor force participation includes individuals who are unemployed, laid off, and/or looking for work. This indicator represents annual measures of labor force participation, and thus cannot be compared to monthly measures of labor force participation in Indicator 2 and published in previous Indicators of Welfare Dependence reports.
Source: Indicators of Welfare Dependence (2001), Table WORK 1b, which drew on unpublished tabulations of March CPS data.
Endnotes
[1] For further details about the TRIM microsimulation model, see the TRIM web site at http://trim3.urban.org.
[2] Refinements to the TRIM model during the six-year time period may affect the consistency of the time series. Most notably, improvements to modeling participation of children in SSI from 1994 onward may be responsible for some of the increase in recipiency rates between 1993 and 1994. In addition, refinements in modeling eligibility of certain non-citizen immigrants in 1997 and 1998 may decrease the number of Hispanic recipients but should have no net impact on recipiency or dependency rates.
[3] For all these indicators, family is defined following the broad Census Bureau definition of family – all persons related by blood, marriage, or adoption. Related subfamilies in multi-generational households are included in the family of the householder. Individuals are treated as one-person families.
Microsoft Word version of report (contains raw data for tables)
(All files below are in Microsoft Word format)
- Title Page
- Table of Contents and Executive Summary
- Chapter 1
- Chapter 2
- Chapter 3
- Appendix A-TANF
- Appendix A-Food Stamps
- Appendix A-SSI
- Appendix B: Alternative Definition of Dependence Based on Income from AFDC/TANF and Food Stamps
- Appendix C: Additional Non-Marital Birth Data
- Appendix D: Sources of Data