Margo Rosenbach
Kimball Lewis
Brian Quinn
Submitted to:
U.S. Department of Health and Human Services
Office of the Assistant Secretary for Planning and Evaluation
200 Independence Avenue, SW, Room 450G
Washington, DC 20201
Project Officer:
Laura Feig Radel
Submitted by:
Mathematica Policy Research, Inc.
50 Church Street, Fourth Floor
Cambridge, MA 02138
617-491-7900
Project Director:
Margo Rosenbach
Contract No.: 100-97-0013 (09)
MPR Reference No.: 8551-600
Acknowledgments
This report benefitted immeasurably from the contributions of many individuals at Mathematica Policy Research, Inc. (MPR). Marilyn Ellwood, Sue Dodds, and Mei-Ling Mason shared their vast knowledge of Medicaid data and the intricacies of the State Medicaid Research Files (SMRF). Keith Rathbun led a team of programmers in extracting the data from the SMRF files, while Terry Nguyen and Wendy Coupe helped in developing health status and utilization variables for the analysis. Embry Howell reviewed the reports and provided helpful suggestions to refine the analysis. Patricia Ciaccio, Roy Grisham, and Loriann Fell edited the report, often under tight time pressure, and we appreciate their good humor and attention to detail. We also thank Besaida Rosado for her tireless efforts in producing the text and tables in this report.
Our project officer, Laura Radel, of the Office of the Assistant Secretary for Planning and Evaluation (ASPE), provided significant insights about our findings and their implications for policy makers and practitioners. She also facilitated the acquisition of data from the Health Care Financing Administration (HCFA) for this project. We appreciate her patience and support. We also thank the ASPE, HCFA, and ACF staff who reviewed a draft of this report. Our report greatly benefitted from their effort.
Introduction
Little is known about many of the health-related characteristics of children in foster care, such as their health status, health care utilization, and expenditures. Existing data provide only a limited snapshot of children in foster care, due to incomplete and inconsistent reporting across states (U.S. House of Representatives 1996). Ongoing concerns, however, about the adequacy of health care services for children in foster care make such information essential, especially with the increasing role of managed care organizations in providing health care to this population (National Academy for State Health Policy 1999).
Most children in foster care are eligible for Medicaid coverage although such coverage is by no means automatic for a large share of children. Instead, Medicaid eligiblity is based on a patchwork of provisions that varies across states (English and Freundlich 1997). The most direct pathway is through the "IV-E linkage." Children in foster care automatically are eligible for Medicaid coverage if they receive Title IV-E foster care assistance.(1) Similarly, children receiving Title IV-E adoption assistance due to special needs are automatically eligible for Medicaid, but the adoptive parents must apply for coverage.(2)
Foster care children who are not "IV-E eligible" can qualify for Medicaid through one of the other mandatory eligibility categories (such as the poverty-related Medicaid expansions) or through one of the optional categories (for example, qualifying as medically needy after "spending down" to meet Medicaid income requirements). According to English and Freundlich (1997), "there is no consistency concerning the degree to which children in foster care or receiving adoption assistance are assured of having Medicaid coverage."
Children in foster care are of special concern to policymakers because they are a particularly vulnerable population. Many of these children have physical, emotional, or developmental problems, frequently stemming from abuse or neglect, substance abuse by their mothers during pregnancy and beyond, or their own substance abuse. This means that the foster care population often has special health care needs, needs that are often "unknown and unmet" (General Accounting Office 1995).
Recognizing the special and largely unmet health care needs of this population, the Child Welfare League of America (CWLA), in collaboration with the American Academy of Pediatrics (AAP), developed Standards for Health Care Services for Children in Out-of-Home Care (CWLA 1988). The introduction to the standards states:
As a society we have failed to meet the health needs of many of the children in out-of-home care. Most of these children have been medically neglected or abused before placement and suffer from a higher than average incidence of serious health problems when they enter the out-of-home care system. Failure to diagnose and treat these children adequately upon their entry into the out-of-home care system may mean community neglect is allowed to replace parental abuse or neglect.
A recent task force report concerning the state of health care for foster care children in California reinforced this assessment, declaring that the health system for foster children is "code blue." The task force found that health care assessments are not routinely performed, that providers are not willing to serve this population, and that treatment frequently is delayed due to red tape and paperwork. These problems are compounded by inadequate documentation of children's medical histories (California State University 1998).
A recent review of the health care needs of children in foster care identified a variety of obstacles that impede access to care (Simms and Halfon 1994). These include:
- Lack of health care policies among child welfare agencies that result in "poor quality, crisis-oriented care"
- Barriers in financing health care despite Medicaid coverage, such as lack of providers willing to accept Medicaid, delays in obtaining Medicaid cards, and delays in obtaining authorization for services
- Lack of a "medical home" and continuity of relationships with the same providers
- Complexity of required services, such as multiple evaluation and treatment services, and the burden of coordinating multiple appointments
- Lack of stable and continuing relationships with adults who are familiar with and can advocate for children's needs
Simms and Halfon identified a broad research agenda for evaluating the services provided to children in foster care. At the top of their agenda was the recommendation that future studies provide a clearer understanding of the "health status, utilization of health care services, and the natural history of children's health care" in out-of-home care. This study attempts to address this research priority.
In addition, past research on the health conditions and utilization of health care services for foster care children has generally focused on a small number of children in a few locations. This study expands on previous research by using State Medicaid Research Files (SMRF) from three states (California, Florida, and Pennsylvania).
Anecdotal evidence suggests that there is a high level of dependence on Medicaid to meet the health care needs of children in foster care; yet some suggest that there is a high degree of variability across states in the extent to which children in foster care utilize Medicaid-reimbursable services (English and Freundlich 1997). Among the factors that may contribute to state level variation are: (1) variations in the types of services covered by Medicaid, particularly optional services; (2) the extent to which states have implemented the early and periodic screening, diagnosis, and treatment (EPSDT) program under Medicaid; (3) the level of understanding the among child welfare workers about the potential role of Medicaid in serving the foster care population; and (4) the effectiveness of child welfare workers and foster parents in advocating for the needs of children (English and Freundlich 1997).
This study was funded by the Office of the Assistant Secretary for Planning and Evaluation (ASPE) in the Department of Health and Human Services to inform policymakers about the health care of children in foster care who were enrolled in Medicaid. The following research topics were addressed by this study:
- What are the demographic characteristics of children in foster care, and how do they differ from those of other low-income children?
- What are the Medicaid eligibility dynamics among children in foster care, and how do they differ from those of other low-income children?
- What are the diagnosed health conditions among children in foster care, and how do they differ from those of other low-income children?
- What are the Medicaid expenditure and utilization patterns of children in foster care, and how do they differ from those of other low-income children?
- How do the diagnosed health conditions, utilization, and expenditure patterns differ within subgroups of the foster care population?
This report contains three additional chapters. Chapter II describes the data source and methods. Chapter III presents the results and Chapter IV discusses the implications of our findings.
Footnotes
1. Title IV-E of the Social Security Act provides federal matching funds to states for payments on behalf of children who have been removed from their homes, provided they were receiving cash assistance prior to placement (or were eligible for assistance) and provided that reasonable efforts were made to prevent removal (English and Freundlich 1997; Schneider and Fennel 1999).
2. Children may have special needs because of their age, race, ethnicity, membership in a sibling group, or health status (such as a physical, mental, or emotional condition) (English and Freundlich 1997).
Data and Methods
Data Source
The data source for this study is the State Medicaid Research Files (SMRF), a series of analytic data files created from the Medicaid Statistical Information System (MSIS) data that are submitted by states to the Health Care Financing Administration (HCFA) on a quarterly basis. The SMRF files have several advantages over data from MSIS and individual state Medicaid management information systems (Dodds 1997):
- SMRF files are organized by calendar year date of service rather than quarterly date of payment.
- SMRF claims are adjusted to reflect final bills and include hospital stay records created from multiple interim bills.
- A person summary file contains monthly eligibility information in a single record, together with annual utilization and expenditure information.
- Analytic variables, such as condition flags, type of service indicators, and eligibility categories, are created for research purposes.
- Enhanced editing and verification procedures are performed to identify and document problems and to ascertain the validity of data for particular applications
The SMRF data are organized into five files, including the person summary file and four claims files: inpatient, long-term care, drug, and other (which comprises claims for professional services, outpatient clinics, and premium payments). We used the person summary file for descriptive analyses of the dynamics of Medicaid eligibility and distribution of Medicaid expenditures. We used the claims files primarily to compare patterns of diagnoses and utilization.
Mathematica Policy Research (MPR) obtained SMRF files from three states for two years. These data were obtained from HCFA solely for the purpose of this study through a data use agreement between HCFA, ASPE, and MPR. The states and study periods are as follows:
| State | Study Period |
|---|---|
| California | 1994 - 1995 |
| Florida | 1994 - 1995 |
| Pennsylvania | 1993 - 1994 |
These study periods represent the most recent SMRF data available for each state that met our selection criteria. The next section explains the criteria used to select the three states for the study.
Selection of Study States
We used the following hierarchical criteria to aid in the selection process:
- Availability of Medicaid claims and enrollment data in the SMRF files
- Ability to identify foster care children in the SMRF files
- Identifiable foster care population of at least 10,000 children, to detect significant health conditions that are relatively rare events
- Degree to which children are enrolled in Medicaid managed care
- Variation in features of state foster care systems
As of August 1998, 34 states were participating in SMRF in 1995; 27 of these states were able to identify children who qualify for Medicaid because they are in some form of foster care or receive adoption assistance (Table II.1).(1)
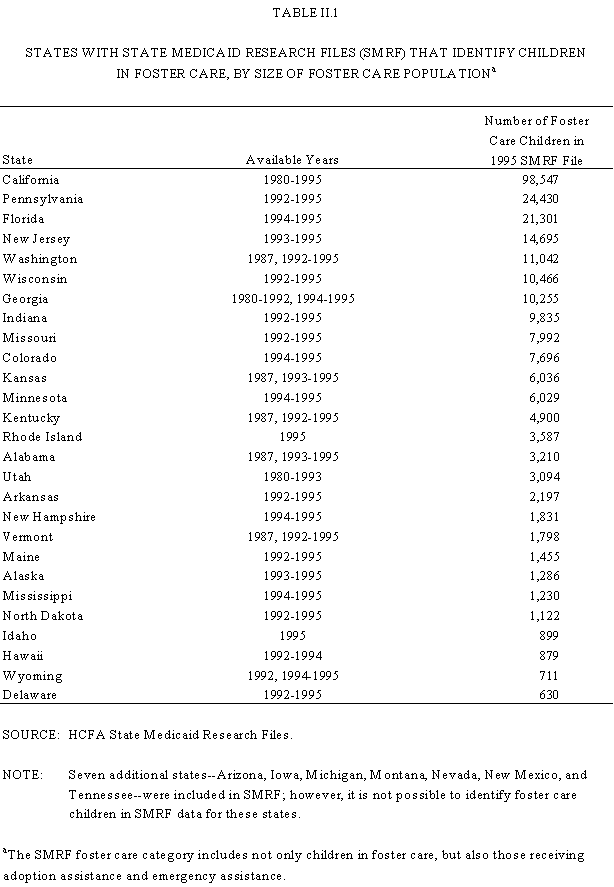
Seven of the 27 states California, Pennsylvania,(2) Florida, New Jersey, Washington, Wisconsin, and Georgia(3) had foster care populations of more than 10,000 children, and Indiana had a population of nearly 10,000 children. Four additional states Missouri, Colorado, Kansas, and Minnesota each had populations between 6,000 and 8,000 children. The remaining states all had foster care populations of less than 5,000 children.
After we narrowed the list of states to the seven with at least 10,000 children in foster care, we considered two additional factors, namely the extent of Medicaid managed care enrollment and variations in state program characteristics. We now turn to a discussion of each factor.
Use of Medicaid Managed Care
There has been a trend in recent years toward the use of managed care for Medicaid-eligible children in general and foster care children in particular (Battistelli 1997). By 1996, 22 states had enrolled at least some foster care children into capitated (prepaid) Medicaid managed care, and 17 of these states required at least some of these children to enroll in managed care (NASHP 1997). The use of Medicaid managed care poses significant challenges for this study because the claims data for children in capitated managed care plans are missing from the SMRF files. And without claims data, we cannot answer the research questions posed in this study.
Of the seven states with at least 10,000 Medicaid foster care children, all but one had overall Medicaid managed care penetration rates of 20 percent or less in 1994:
| State | Managed Care Enrollment* | Medicaid Eligibles | Managed Care Penetration Rate |
|---|---|---|---|
| California | 811,838 | 6,778,152 | 12.0 % |
| Pennsylvania | 348,409 | 1,728,068 | 20.2 |
| Florida | 351,885 | 2,202,774 | 16.0 |
| New Jersey | 35,343 | 859,628 | 4.1 |
| Washington | 319,966 | 792,441 | 40.4 |
| Wisconsin | 124,280 | 642,240 | 19.4 |
| Georgia | 2,400 | 1,169,937 | 0.2 |
| * Includes enrollment in capitated plans. Excludes primary care case management (PCCM) enrollment. Sources: National Institute for Health Care Management 1995; U.S. Department of Health and Human Services 1995. | |||
One caveat is that the managed care penetration rate was likely to vary across age groups and eligibility categories and children may have had above average rates of managed care enrollment. Our strategy, therefore, was to choose the three states with the largest foster care populations California, Pennsylvania, and Florida to ensure adequate sample sizes for the foster care analyses, while recognizing that the sample sizes in the other categories of eligibility would be more than adequate for our purposes.
California had by far the largest foster care population (nearly 100,000 in 1995), and, for that reason alone, was of great interest as a potential study state. Pennsylvania and Florida were next in size of foster care population, with 24,000 and 21,000 Medicaid children in foster care, respectively. We concluded that the relatively large size of the foster care population compensated for the level of managed care enrollment in these two states (20 percent in Pennsylvania, 16 percent in Florida). These large sample sizes have afforded us the opportunity to compare patterns of utilization and expenditures within the foster care population.
Variation in State Program Characteristics
We researched two key program characteristics to ensure that the three states varied on important factors. The first is whether the foster care programs are administered at the state or county level. The foster care programs in two of the states, California and Pennsylvania, are state supervised and county administered, while the program in Florida is state-administered (Child Welfare League of America 1999). Thus, we might expect to see more intrastate variation in utilization patterns in the two county-administered programs.
The second characteristic is the presence of a health passport program.(4) All three states have implemented health passport programs statewide, with Florida's and Pennsylvania's passports dating back to 1989 and 1990, respectively. California's health passport program was implemented statewide in February 1995. None of the states use an electronic (computerized) passport record (Lutz and Horvath 1997).
Selection of Study Sample
An important step in the file construction phase involved the selection of the study sample. The selection of the study sample took place in several steps, as follows:
Step 1: Create a Subset by Age
We created a subset of the administrative data containing records for children under the age of 19.
Step 2: Identify Foster Care Children
The SMRF person summary file contains SMRF eligibility codes that identify both the monthly Medicaid eligibility categories and the primary Medicaid eligibility category during the year. The SMRF eligibility codes were created by classifying state-specific eligibility codes according to the standardized set of eligibility codes that make up the SMRF coding system. During the file construction phase, we discovered a problem with the original mapping of Florida's state-specific eligibility codes into the SMRF eligibility code. We remapped the eligibility codes in Florida to correctly identify categories of Medicaid eligibility. We also discovered that the SMRF foster care category includes children receiving adoption assistance as well as those receiving emergency assistance in conjunction with child welfare services.
Table II.2 shows, for each of our three study states, the state-specific codes that identify which children are receiving foster care assistance, adoption assistance, or emergency assistance, and the number of children in each category of Medicaid eligibility (based on the main category of eligibility for the year).
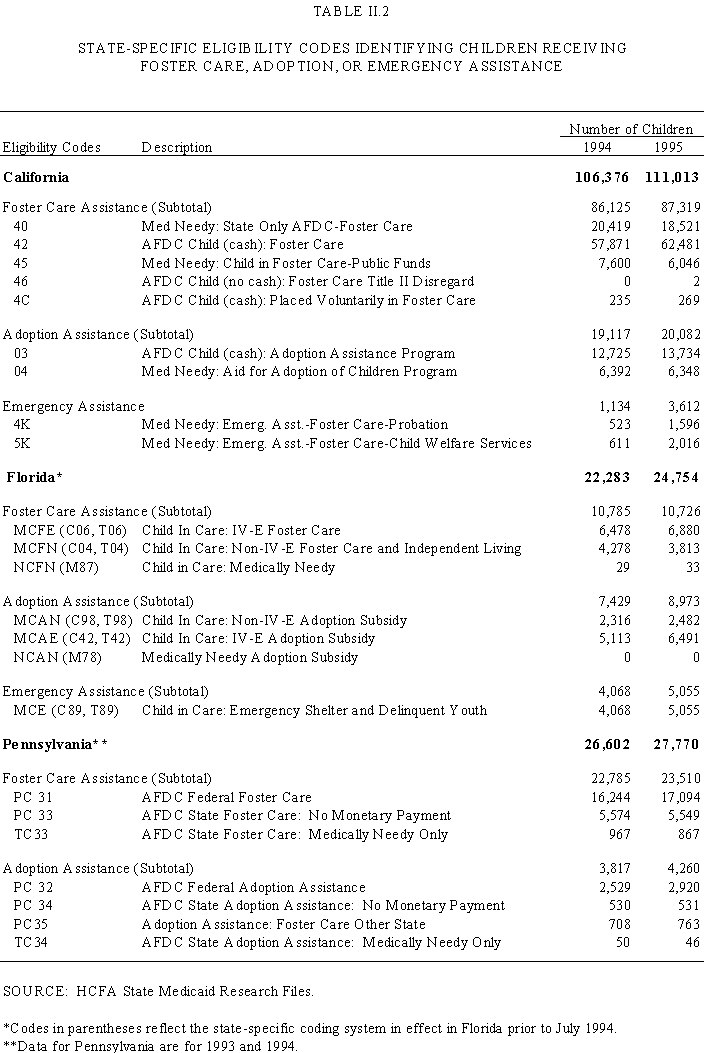
Table II.3 presents additional information on the number of children eligible for Medicaid due to foster care, adoption assistance, or emergency assistance. This table shows that the primary SMRF eligibility code which reflects the main category of Medicaid eligibility for a child understates the number of children who were eligible for Medicaid due to an out-of-home placement at any time during a given year. The number of children with any period of foster care ranges from 15 percent to 23 percent higher than the number of children whose main category of Medicaid eligibility was some form of foster care.
| State/Year | Foster Care is Main Category of Eligibility During the Year |
Any Foster Care Eligibility During the Year |
Percent Difference |
|---|---|---|---|
| California | |||
| 1994 | 106,376 | 130,992 | 23.1 |
| 1995 | 111,013 | 134,833 | 21.5 |
| Florida | |||
| 1994 | 22,283 | 25,876 | 16.1 |
| 1995 | 34754 | 28525 | 15.2 |
| Pennsylvania | |||
| 1993 | 26,602 | 30,969 | 16.4 |
| 1994 | 27,770 | 32,237 | 16.1 |
| SOURCE: HCFA State Medicaid Research Files.
a. Includes children receiving adoption assistance or emergency assistance. |
|||
For the purpose of this study, we reconstructed variables related to Medicaid eligibility, to show whether a child had any period of foster care, adoption assistance, or emergency assistance. All results are shown separately for children in foster care and for those receiving adoption assistance. Children receiving emergency assistance are excluded from the main analysis, but basic descriptive information about this group is presented in Appendix A.
Step 3: Create Comparison Groups
Next, we defined three comparison groups of children enrolled in Medicaid: those receiving adoption assistance through Title IV-E or other sources, those receiving cash assistance through Aid to Families with Dependent Children (AFDC), and those receiving Supplemental Security Income (SSI) benefits.(5)
These groups were chosen to compare to the foster care population because they are of interest to policymakers. The SSI population includes children with disabilities, and there is considerable interest in understanding how this population is similar to or differs from foster care children. The AFDC population includes children receiving public assistance and, as we shall see in Chapter III, there is substantial overlap between the foster care and AFDC groups. Many of the foster care children were eligible for Medicaid through AFDC either before or after their foster care eligibility. Children receiving adoption assistance are also of interest to policymakers who would like to know to what extent these children are similar to or different from those who remain in foster care in terms of diagnoses, utilization, and costs.
In earlier work, we included a broader set of comparison groups, namely children eligible for Medicaid through poverty-related expansions, children who are medically needy, and children in other categories of Medicaid eligibility. Based on a preliminary assessment of the data, we decided (in consultation with ASPE and HCFA staff) to streamline the tabular displays to include only comparisons with children receiving adoption assistance, AFDC, or SSI. The totals, however, include all Medicaid children, regardless of category of Medicaid eligibility.
Step 4: Exclude Children Enrolled in Managed Care
Because providers do not submit individual claims for services provided to children enrolled in prepaid managed care, it was necessary to omit managed care enrollees from the analyses of diagnoses, utilization, and costs. Therefore, we developed specifications to identify children enrolled in prepaid, or capitated, managed care.
Identifying this group proved more complex than we anticipated because there is no direct, accurate approach to measuring managed care enrollment based on the SMRF eligibility or claims data. We developed state-specific algorithms to utilize the data available in each state. In Florida and Pennsylvania, we excluded children who had any premium payment during the year, that is, one or more claims reflecting a capitation payment to a managed care organization. In California, we were unable to use this approach because a large number of children had premium payments, but only for dental care. Thus, we relied on plan identifiers to exclude children enrolled for one or more months in managed care organizations. Children enrolled only in prepaid dental plans remained in the sample. Fortunately, the California Medicaid program, known as Medi-Cal, receives shadow claims for dental services from dental plans, which allowed us to analyze dental utilization in California even for those enrolled in prepaid dental plans.
Children enrolled in managed care plans are included in the demographic analyses and the analyses of Medicaid eligibility dynamics. They are excluded, however, from all analyses related to diagnoses, utilization, and costs. Managed care participation rates are discussed further in Chapter III.
Construction of the Analytic File
Once we selected the study sample, we created analytic files reflecting demographics, health status, utilization, and expenditures.
Demographic Characteristics
Demographic variables available on the SMRF files include age, gender, and race/ethnicity. We created a measure of urbanicity by merging ZIP codes from the SMRF person summary file to the Area Resource File to identify large urban, small urban, and rural areas. Large urban areas are metropolitan statistical areas (MSAs) with one million or more residents, small urban areas are MSAs with less than one million residents, and rural areas are those located outside of an MSA.
Diagnostic Conditions
We explored various approaches to classifying diagnoses within the Medicaid population. Our goal was to identify an algorithm that would classify the types of diagnoses found within the foster care population and then allow us to compare the distributions of diagnoses to those found in the general Medicaid population. Specifically, we wanted to be able to differentiate between physical and mental conditions. If possible, we also wanted to distinguish the level of severity within diagnostic groups. We explored approaches developed by Kronick et al. (2000), Burwell et al. (1997), and Perrin et al. (1999), as well as the crosswalk used by the Social Security Administration (SSA 1998).
We selected the Chronic Illness and Disability Payment System (CDPS), because it not only identifies severe and chronic conditions among children but also differentiates according to the severity or complexity of the case within a given diagnostic category (Kronick et al. 2000). Specifically, the CDPS identifies 20 diagnostic categories and identifies gradients of high-, medium- and low-cost subcategories within each.(6)
For our purposes, the approach by Burwell et al. (1997) was more limited because it did not define specific diagnostic groups (beyond physical and mental conditions in the aggregate) and did not allow for differentiation of severity within the broad categories. Nor did the crosswalk by Perrin et al. (1999) allow for as fine a breakdown of diagnostic groups. Although the SSA crosswalk contains a wide range of diagnostic codes to classify those receiving SSI benefits into broad diagnostic categories, it is not appropriate for identifying chronic or disabling conditions within the general population.
Outpatient diagnostic data were only available for two of the three states; Florida did not report diagnostic information on its outpatient SMRF files. Therefore, the diagnostic comparisons were performed only for California and Pennsylvania.
In addition to examining chronic illness and disability among low-income children, we also compared the prevalence of deliveries across each of the Medicaid eligibility categories. We developed a measure of the number of girls, ages 15 to 17, who delivered a baby in 1994. We used the SMRF delivery indicator, which was based on ICD-9-CM codes signifying a live birth.(7) Age was measured as of the end of the year (December 31, 1994). We restricted the measure to include only girls ages 15-17, to compare these rates with national benchmarks from vital statistics (Ventura et al. 1996).
Medicaid Expenditures
The analysis of Medicaid expenditures is based on data reported in the SMRF person summary file, which aggregates annual amounts paid by Medicaid within 24 types of service (TOS) categories.(8) These categories were further aggregated into four service groups to create subtotals of analytic interest. The TOS classification is shown in Table II.4. For most analyses, we compare average (mean) monthly expenditures across groups, which were derived by dividing total expenditures for the year by the number of months of enrollment. As we will discuss in the next chapter, there are some inconsistencies in how states classify claims by type of service. Most notable for the purpose of this study is state variation in the classification of mental health services.
| Service Group | SMRF Type of Service Code |
SMRF Type of Service Category |
|---|---|---|
| Institutional Services | 01 | Inpatient hospital |
| 04 | Inpatient psychiatric services for children | |
| 05 | Intermediate care facility for the mentally retarded (ICF-MR) | |
| 07 | All other nursing facilities | |
| Outpatient Services | 08 | Physicians |
| 09 | Dental(a) | |
| 10 | Other practitioners | |
| 11 | Outpatient hospital | |
| 12 | Clinic | |
| 14 | Family planning services | |
| 17 | Early and periodic screening, diagnosis, and treatment (EPSDT) | |
| 18 | Rural health clinic services | |
| Anciliary Services | 13 | Home health services |
| 15 | Lab and x-ray services | |
| 16 | Prescribed drugs | |
| 21 | Equipment and supplies | |
| 22 | Transportation | |
| 23 | Case management services | |
| 19, 22 | Other services, unknown | |
| a. For California, this category includes premiums paid for prepaid dental coverage. | ||
Health Care Utilization
To analyze health care utilization patterns, we created indicators of the probability and level of service use. In general, we used definitions developed as part of the Health Plan Employer Data & Information Set (NCQA 1998). Our goal was to create a parsimonious set of measures, while still capturing the range of variation within and among groups. Table II.5 lists the measures, the SMRF source file, and the method used to construct each measure.
Where possible, we included state-specific procedure codes to classify emergency room, preventive, and mental health/substance abuse services. These codes were obtained from internal files as well as from follow-up discussions with states.
Separate utilization measures were constructed for mental health and substance abuse services. As discussed earlier, Florida's outpatient SMRF file did not contain any diagnostic data. As a result, we were unable to distinguish between mental health and substance abuse services in Florida; we therefore decided to combine these services into a broader measure reflecting behavioral healthcare.
| Utilitation Measures | SMRF Source File | Comments |
|---|---|---|
| Access Measures | ||
| Percent with a hospital stay | Inpatient | Number of children with one or more hospital stays; excludes maternity stays, newborn stays, mental health/substance abuse-related stays, and those with same-day stays (no overnight) |
| Percent with an outpatient provider visit | Other | Number of children with one or more outpatient provider visits; includes visits with following types of service: physician, other practitioners, outpatient hospital, family planning, clinic, EPSDT, rural health clinic; excludes visits with place of service inpatient or nursing home; excludes emergency room visits |
| Percent with an emergency room visit | Inpatient and other | Number of children with one or more emergency room visits; includes visits with CPT-4 or state-specific service code signifying emergency room (ER) visit AND place of service = outpatient, clinic, or ER. |
| Percent with a preventive visit | Other | Number of children with one or more preventive visits; includes visits with type of service = EPSDT, with primary/secondary diagnoses of V20-20.2, V70.0, V70.3-V70.9, or with state-specific procedure codes signifying preventive visit; excludes visits with place of service = inpatient, with mental health/substance abuse service code, or with emergency room service code |
| Percent with a dental visit | Other | Number of children (over age 3) with one or more dental visits; includes visits with type of service dental, or procedure codes Y2020 or Y2030 |
| Percent with a prescribed drug | Person summary file | Number of children with one or more prescribed drug claims (type of service = prescribed drugs) |
| Utilization Intensity Measures | ||
| Hospital days per 1,000 children | Inpatient | Number of hospital days divided by number of children(a) and multiplied by 1,000 |
| Outpatient provider visits per 1,000 children | Other | Number of outpatient provider visits divided by number of children and multiplied by 1,000 |
| Emergency room visits per 1,000 children | Inpatient and other | Number of emergency room visits divided by number of children and multiplied by 1,000 |
| Dental visits per 1,000 children | Other | Number of dental visits divided by number of children and multiplied by 1,000 |
| Mental Health/Substance Abuse Treatment Measures | ||
| Percent with any mental health/substance abuse treatment | Inpatient, other, long-term care | Percent with any inpatient or outpatient treatment (as defined below) |
| Percent with any outpatient mental health/substance abuse treatment | Other | Number of children with mental health/substance abuse treatment in outpatient setting; includes services with CPT-4 or state-specific procedure codes signifying mental health/substance abuse service; excludes place of service = inpatient hospital |
| Percent with any inpatient mental health/substance abuse treatment | Inpatient | Number of children with mental health/substance abuse treatment in inpatient setting; includes stays with ICD-9-CM primary diagnoses = 290, 293-302, 306-316, 291-292, 303-305, 965.0, 965.8, 969 OR (primary diagnosis = 967 and secondary diagnosis = 291-292, 303, 305) |
| Average number of outpatient mental health/substance abuse visits per user | Other | Mean number of outpatient mental health/substance abuse visits; mean derived based on service users only |
| Average number of inpatient mental health/substance abuse days per user | Inpatient | Mean number of inpatient mental health/substance abuse days; mean derived based on service users only |
| a. To account for part-year eligibility, denominators for all utilization rates were measured in terms of number of full-year equivalents (calculated as the total number of eligible months divided by 12). | ||
1. This can include children receiving foster care assistance (both Title IV-E and non-Title IV-E), adoption subsidies (both Title IV-E and non-Title IV-E), and children in group homes or those who are otherwise wards of the state. The remaining seven states either do not identify foster care children or have problems with their eligibility data that make the states unsuitable for this study.
2. Data for Pennsylvania are from 1994. A SMRF file for 1995 is available, but it has significant data quality problems which prohibit it from being used for this study.
3. One of the limitations of the Georgia data was the omission of eligibility data for the first three months of 1994. This would censor the data to less than two full years of eligibility and claims history.
4. A health passport is a traveling medical record for children in foster care, which tracks their medical history and documents their health care utilization.
5. The SMRF file shows only one Medicaid eligibility category per month. Children were classified according to the eligibility category accounting for the majority of the eligibility period, with the exception of children in foster care who were classified in the foster care category if they were "even enrolled" in foster care during the year. Foster care children who received SSI benefits were counted in the foster care category only if the SMRF file identified one or more months of foster care eligibility. It is possible that some foster care children are counted in the SSI category if states code only their SSI eligibility on the SMRF file.
6. For this study, we excluded the pregnancy and newborn complications categories included in the CDPS. While these categories are relevant for purposes of risk adjustment (predicting higher costs in a subsequent year), they are not reflective of chronic illness or disability per se.
7. The diagnostic codes are: 650, 646.0-656.3 (fifth digit 1, 2), 656.5-676.9 (fifth digit 1, 2),V27.0, V27.2, V27.3, V27.5, V27.6, V27.9, V30-V39.21.
8. Two categories mental hospital for aged and skilled nursing facility/intermediate care facility (SNF/ICF) mental health services for aged were not applicable to this study. Another category ICF-all other was no longer in use. The premium payment category was not applicable since children enrolled in managed care were excluded from this study, and dental premiums in California were reported under the dental type of service.
Results
This chapter presents a profile of children in foster care in three statesВ California, Florida, and PennsylvaniaВ who were enrolled in Medicaid.(1) Children in foster care comprised between 1.1 and 3.3 percent of the children enrolled in Medicaid in 1994, but accounted for a disproportionate share of Medicaid expenditures, ranging from 3.6 to 7.8 percent (Table III.1 and Figure III.1).
| В | Enrollment in 1994 | Expenditures in 1994 | ||
|---|---|---|---|---|
| Number of Children |
Percent of Total |
Expenditures (in millions) |
Percent of Total |
|
| California | ||||
| Total | 3,603,056 | 100.0% | $2,375.3 | 100.0% |
| Foster Care | 111,236 | 3.1 | 161.1 | 6.8 |
| Adoption Assistance | 18,922 | 0.5 | 7.5 | 0.3 |
| AFDC | 2,095,890 | 58.2 | 1,197.1 | 50.4 |
| SSI | 68,667 | 1.9 | 366.2 | 15.4 |
| Other | 1,308,341 | 36.3 | 643.4 | 27.1 |
| Florida | ||||
| Total | 1,247,470 | 100.0% | $1,419.10 | 100.0% |
| Foster Care | 14,011 | 1.1 | 50.6 | 3.6 |
| Adoption Assistance | 6,545 | 0.5 | 9.4 | 0.7 |
| AFDC | 638,259 | 51.2 | 540.2 | 38.1 |
| SSI | 60,813 | 4.9 | 376.7 | 26.5 |
| Other | 527,842 | 42.3 | 442.1 | 31.2 |
| Pennsylvania | ||||
| Total | 860,223 | 100.0% | $1,160.70 | 100.0% |
| Foster Care | 28,390 | 3.3 | 90.5 | 7.8 |
| Adoption Assistance | 3,847 | 0.4 | 6.2 | 0.5 |
| AFDC | 456,127 | 53.0 | 567.0 | 48.8 |
| SSI | 38,177 | 4.4 | 196.7 | 16.9 |
| Other | 333,682 | 38.8 | 300.4 | 25.9 |
| SOURCE: HCFA State Medicaid Research Files. | ||||
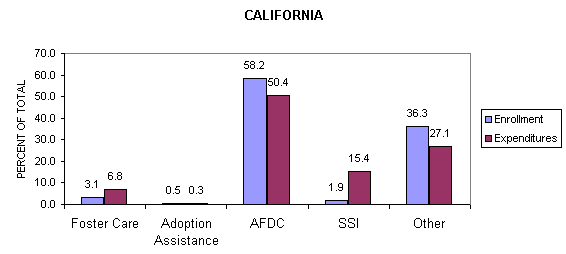
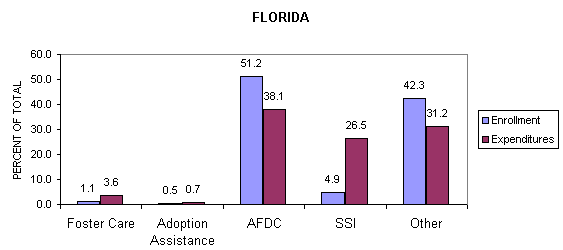
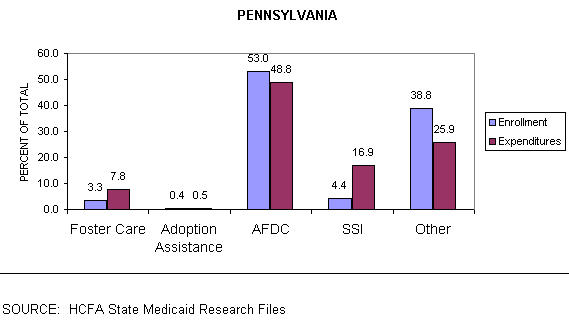
California had the highest number of children in foster care per 1,000 children in the state (12.8 per 1,000) followed by Pennsylvania (9.8 per 1,000), and finally, Florida (4.3 per 1,000). Children receiving SSI benefits due to disability also were a relatively small proportion of the enrolled population (2 to 5 percent), but were responsible for between 15 and 27 percent of total expenditures. Children receiving AFDC comprised the largest share of children (51 to 58 percent across the three states), but represented a far smaller share of expenditures (38 to 50 percent). Children receiving adoption assistance accounted for one-half of 1 percent of the enrolled children and less than 1 percent of expenditures.(2)
Because children in foster care account for a small share of both Medicaid enrollment and expenditures, few studies highlight their health care experiences under Medicaid. Yet, this is a highly vulnerable population about which little is known. This chapter describes their demographic characteristics, the dynamics of Medicaid enrollment, utilization patterns, and Medicaid expenditures. Children in foster care are compared to children receiving adoption assistance, AFDC, and SSI. In general, we present findings first for the foster care population, then we compare these children to other Medicaid children, and finally, we examine subgroups within the foster care population. Most of our results are for 1994 (the common year of data across the three states), except for analyses involving the construction of episodes of enrollment and utilization across the two-year study period.
Demographic Characteristics
Next, we present a demographic profile of children in foster care and compare their characteristics to those of children in other categories of Medicaid eligibility (Tables III.2A, Table III.2B, and Table III.2C and Figure III.2). As shown in Tables III.2A, foster care children averaged 9 years of age in California, similar to children receiving adoption assistance. AFDC children were younger on average (7 years), while SSI children were older on average (10 years). Despite similarities in the average age between children in foster care and adoption assistance, the age distribution was quite different; more infants and adolescents were in foster care and more 5- to 14-year old children received adoption assistance.
The overall age distributions were similar in Florida, although we observed a wider age gap between children in foster care and children receiving adoption assistance, due to a concentration of infants and preschool age children in the foster care group and 5- to 9-year-olds in the adopted group (Table III.2B). In Pennsylvania, the average age of foster care children was almost 11, nearly two years higher than the other two states (Table III.2C). Two in five foster care children in Pennsylvania were adolescents (39 percent), versus 21 to 25 percent in the other two states.
| Category of Medicaid Eligibility | |||||
|---|---|---|---|---|---|
| All Children(a) (N=3,603,056) | Foster care (N=111,236) | Adoption Assistance (N=18,922) | AFDC (N=2,095,890) | SSI (N=68,667) | |
| Total | 100.0% | 100.0% | 100.0% | 100.0% | 100.0% |
| Age | |||||
| Less than 1 | 7.9 | 5.1 | 0.2 | 6.3 | 1.2 |
| 1 to 4 | 31.3 | 24.2 | 14.4 | 31.3 | 16.8 |
| 5 to 9 | 27.1 | 23.9 | 43.2 | 29.2 | 29.3 |
| 10 to 14 | 19.8 | 22.3 | 29.8 | 21.2 | 30.3 |
| 15 to 18 | 13.9 | 24.5 | 12.5 | 12.0 | 22.5 |
| Mean | 7.3 | 9.0 | 9.0 | 7.3 | 9.9 |
| Gender | |||||
| Male | 50.2 | 51.9 | 49.7 | 50.2 | 60.7 |
| Female | 49.8 | 48.1 | 50.4 | 49.8 | 39.3 |
| Race/Ethnicity | |||||
| White | 25.0 | 60.5 | 48.6 | 27.6 | 29.7 |
| Black | 13.3 | 19.0 | 25.8 | 18.0 | 23.7 |
| Hispanic | 50.1 | 15.9 | 21.9 | 41.9 | 0.2 |
| Other/Unknown | 11.6 | 4.7 | 3.9 | 12.5 | 46.5 |
| Urban/Rural Location | |||||
| Large MSA | 77.6 | 83.7 | 80.4 | 76.2 | 74.6 |
| Small MSA | 18.8 | 13.4 | 16.6 | 20.0 | 21.4 |
| Non-MSA | 3.6 | 3.0 | 3.0 | 3.8 | 4.0 |
| Source: HCFA State Medicaid Research Files. Note: Numbers may not sum to total due to rounding. a. Includes children in other categories of Medicaid eligibility. | |||||
| Category of Medicaid Eligibility | |||||
|---|---|---|---|---|---|
| All Children(a) (N=1,247,470) | Foster care (N=14, 011) | Adoption Assistance (N=6,545) | AFDC (N=638,259) | SSI (N=60,813) | |
| Total | 100.0% | 100.0% | 100.0% | 100.0% | 100.0% |
| Age | |||||
| Less than 1 | 8.4 | 4.2 | 0.3 | 4.7 | 2.2 |
| 1 to 4 | 32.3 | 26.4 | 11.8 | 30.9 | 15.2 |
| 5 to 9 | 29.6 | 24.9 | 37.3 | 29.6 | 29.4 |
| 10 to 14 | 18.4 | 23.4 | 33.3 | 21.8 | 33.0 |
| 15 to 18 | 11.3 | 21.0 | 17.3 | 13.0 | 20.1 |
| Mean | 6.8 | 8.6 | 9.8 | 7.5 | 9.8 |
| Gender | |||||
| Male | 50.6 | 50.5 | 52.1 | 49.5 | 63.3 |
| Female | 49.4 | 49.5 | 47.9 | 50.5 | 36.7 |
| Race/Ethnicity | |||||
| White | 39.7 | 46.7 | 54.6 | 34.2 | 29.9 |
| Black | 38.8 | 45.8 | 39.1 | 47.3 | 38.1 |
| Hispanic | 18.3 | 5.7 | 4.5 | 17.1 | 0.1 |
| Other/Unknown | 3.3 | 1.9 | 1.7 | 1.4 | 31.9 |
| Urban/Rural Location | |||||
| Large MSA | 51.3 | 52.6 | 44.5 | 52.8 | 48.3 |
| Small MSA | 39.9 | 42.1 | 51.8 | 38.8 | 43.6 |
| Non-MSA | 8.8 | 5.3 | 3.7 | 8.5 | 8.1 |
| Source: HCFA State Medicaid Research Files. Note: Numbers may not sum to total due to rounding. a. Includes children in other categories of Medicaid eligibility. | |||||
| Category of Medicaid Eligibility | |||||
|---|---|---|---|---|---|
| All Children(a) (N=860,223) | Foster care (N=28,390) | Adoption Assistance (N=3,847) | AFDC (N=456,127) | SSI (N=38,177) | |
| Total | 100.0% | 100.0% | 100.0% | 100.0% | 100.0% |
| Age | |||||
| Less than 1 | 7.4 | 2.6 | 0.1 | 7.2 | 0.9 |
| 1 to 4 | 29.3 | 18.3 | 7.1 | 29.9 | 12.4 |
| 5 to 9 | 29.1 | 18.9 | 32.3 | 29.9 | 29.1 |
| 10 to 14 | 20.1 | 21.1 | 36.3 | 20.7 | 33.5 |
| 15 to 18 | 14.1 | 39.3 | 24.2 | 12.4 | 24.1 |
| Mean (in months) | 7.4 | 10.8 | 10.9 | 7.3 | 10.4 |
| Gender | |||||
| Male | 50.9 | 59.8 | 53.6 | 49.7 | 63.5 |
| Female | 49.1 | 40.2 | 46.4 | 50.3 | 36.5 |
| Race/Ethnicity | |||||
| White | 56.9 | 42.8 | 59.0 | 42.2 | 59.7 |
| Black | 32.2 | 50.6 | 32.2 | 44.4 | 26.7 |
| Hispanic | 8.6 | 5.3 | 5.7 | 11.1 | 12.0 |
| Other/Unknown | 3.3 | 1.2 | 3.0 | 2.2 | 1.6 |
| Urban/Rural Location | |||||
| Large MSA | 57.0 | 65.1 | 52.1 | 67.0 | 51.6 |
| Small MSA | 27.3 | 25.1 | 34.8 | 22.9 | 32.0 |
| Non-MSA | 15.7 | 9.8 | 13.1 | 10.1 | 16.5 |
| Source: HCFA State Medicaid Research Files. Note: Numbers may not sum to total due to rounding. a. Includes children in other categories of Medicaid eligibility. | |||||
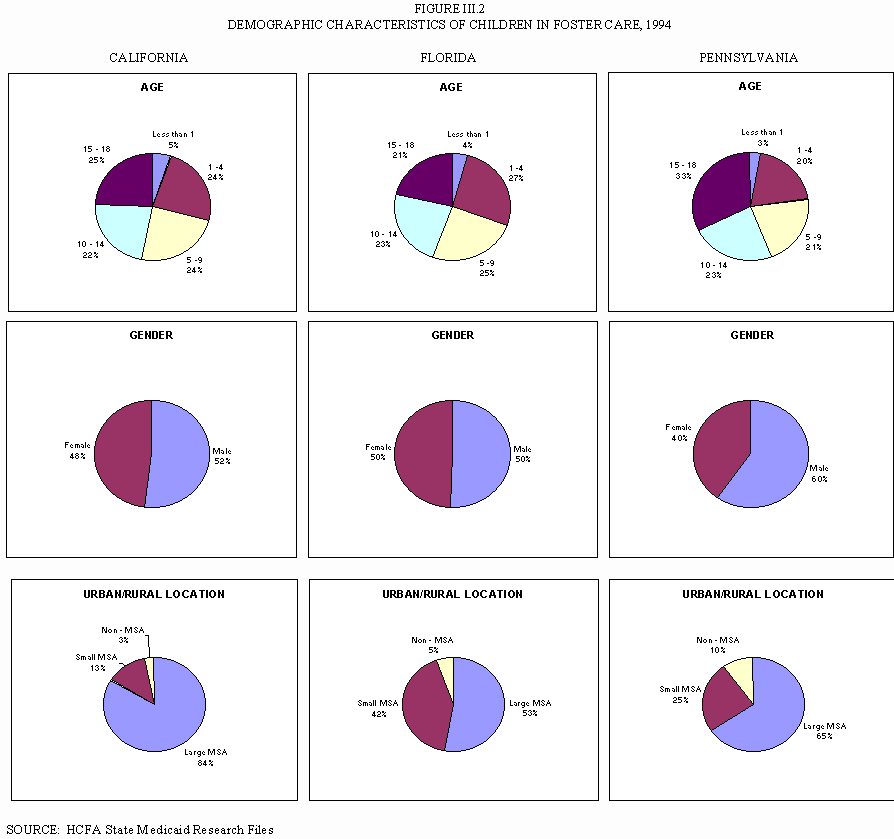
The gender distribution was generally consistent across states and across categories of Medicaid eligibility, with a fairly even split between boys and girls. There were two exceptions, however. In Pennsylvania, the foster care population was dominated by boys (60 percent of the total), and across all three states, there were three boys for every two girls in the SSI population.
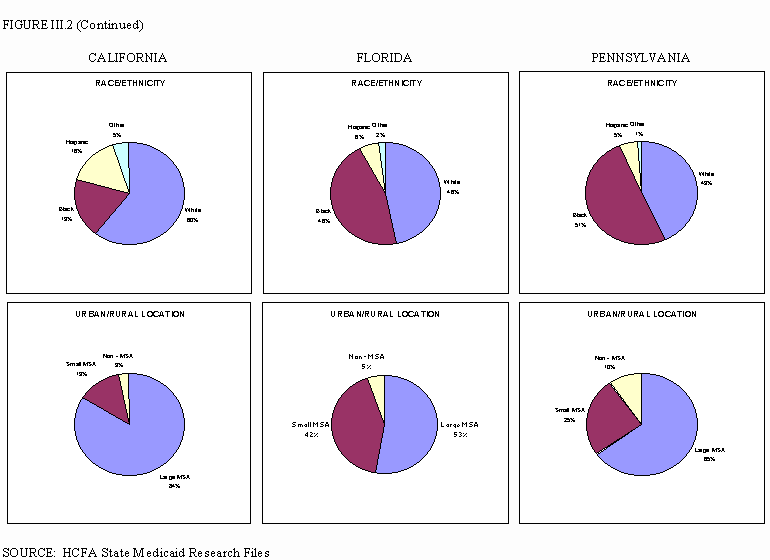
The race/ethnicity of foster care children varied considerably across the three states, compared to children in other categories of Medicaid eligibility. Sixty percent of the foster care population in California was white, while half of the adoption assistance children and only about a fourth of the AFDC children were white. We see a different pattern in Florida where black and white children represented nearly equal shares of the foster care population, but the adoption assistance children were disproportionately white and AFDC children were disproportionately black. In Pennsylvania, we see an even sharper contrast in the racial/ethnic distribution between foster care and adoption assistance children; 43 percent of the foster care children were white versus 59 percent of the adopted children. These results suggest that children receiving adoption assistance in Florida and Pennsylvania were disproportionately white, while those remaining in foster care were more likely to be from minority backgrounds. In California, however, just the opposite was found: a higher proportion of foster care children were white compared to those who were adopted.
Foster care children were concentrated in large metropolitan areas, just like the Medicaid population as a whole. Compared to foster care children, adopted children were more likely to reside in small urban areas, especially in Florida and Pennsylvania.
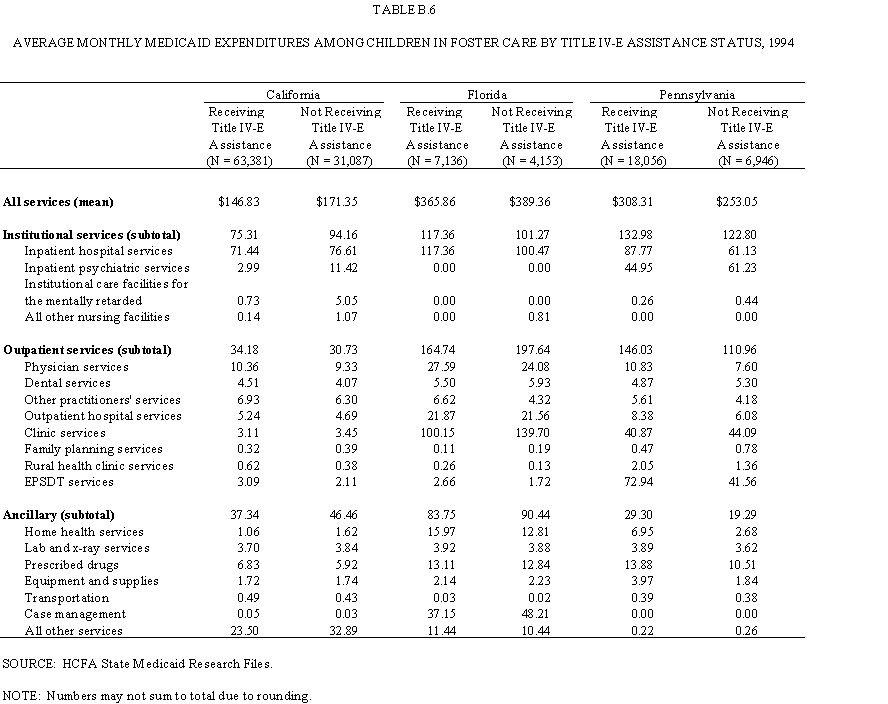
We also compared the demographic characteristics of foster care children according to whether they received assistance through Title IV-E. Across all three states, Title IV-E children were younger, on average, than those not receiving Title IV-E assistance (Table III.3). Adolescents between the ages of 15 and 18 comprised a much larger share of non-Title IV-E foster care children, accounting for 67 percent in Pennsylvania, 40 percent in California, and 31 percent in Florida. In general, boys dominated girls in the non-Title IV-E group, especially in Pennsylvania.
| Characteristic | California | Florida | Pennsylvania | |||
|---|---|---|---|---|---|---|
| Receiving Title IV-E Assistance (N=77,875) | Not Receiving Title IV-E Assistance (N=33,361) | Receiving Title IV-E Assistance (N=9,211) | Not Receiving Title IV-E Assistance (N=4,800) | Receiving Title IV-E Assistance (N=21,075) | Not Receiving Title IV-E Assistance (N=7,315) | |
| Total | 100.0% | 100.0% | 100.0% | 100.0% | 100.0% | 100.0% |
| Age | ||||||
| Less than 1 | 5.2 | 4.8 | 4.3 | 4.0 | 3.0 | 1.3 |
| 1 to 4 | 27.8 | 15.7 | 29.3 | 21.0 | 22.3 | 6.5 |
| 5 to 9 | 26.8 | 17.1 | 27.6 | 19.8 | 23.1 | 6.8 |
| 10 to 14 | 22.3 | 22.3 | 23.1 | 24.0 | 22.0 | 18.4 |
| 15 to 18 | 17.8 | 40.1 | 15.7 | 31.2 | 29.6 | 67.0 |
| Mean | 8.1 | 10.9 | 7.9 | 10.0 | 9.7 | 14.1 |
| Gender | ||||||
| Male | 51.1 | 53.6 | 49.8 | 52.0 | 57.9 | 65.3 |
| Female | 48.9 | 46.4 | 50.2 | 48.0 | 42.1 | 34.7 |
| Race/Ethnicity | ||||||
| White | 61.5 | 58.1 | 42.3 | 55.2 | 37.1 | 59.1 |
| Black | 20.3 | 15.9 | 50.3 | 37.0 | 56.4 | 34.0 |
| Hispanic | 14.3 | 19.4 | 5.8 | 5.5 | 5.6 | 4.5 |
| Other/Unknown | 3.9 | 6.6 | 1.6 | 2.3 | 0.9 | 2.4 |
| Urban/Rural Location | ||||||
| Large MSA | 82.9 | 85.4 | 51.9 | 54.1 | 68.9 | 54.2 |
| Small MSA | 14.1 | 11.7 | 42.5 | 41.3 | 22.5 | 32.5 |
| Non-MSA | 3.0 | 2.9 | 5.6 | 4.7 | 8.6 | 13.3 |
| Source: HCFA State Medicaid Research Files. Note: Numbers may not sum to total due to rounding. | ||||||
The racial/ethnic composition differed between the two groups, with white children disproportionately eligible through non-Title IV-E categories in Florida and Pennsylvania. There were few differences in the urban/rural distribution, except in Pennsylvania, where children from small urban and rural areas were disproportionately represented in the non-Title IV-E group. These results suggest that in Pennsylvania, more than in the other two states, state foster care assistance (non-Title IV-E funds) was targeted toward adolescents, boys, whites, and residents of small urban or rural areas.
Medicaid Eligibility Dynamics
Research has shown that continuous health insurance coverage improves access to health care among low-income children (Weissman et al. 1999; Burstin et al. 1998/99; Berman et al. 1999). Lack of continuity in coverage, that is, coverage for less than the full year, can lead to discontinuities in access to health care, including both primary and specialty care. For foster care children, transitions in health insurance coverage (or discontinuation of coverage altogether) can lead to changes in providers, which in turn can lead to duplication of tests and immunizations, changes in treatment protocols, and missed opportunities for care.
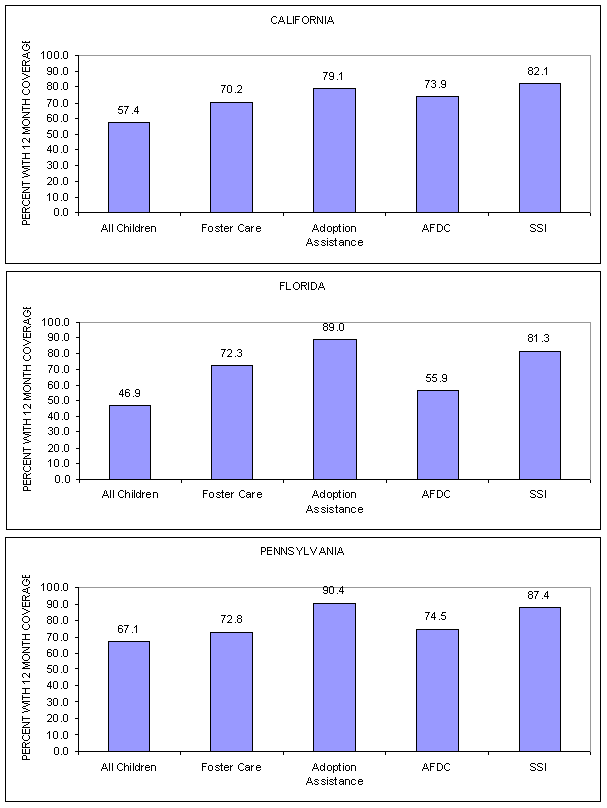
We examined the continuity of Medicaid coverage for foster care children, compared to that of children in other groups (Table III.4 and Figure III.3). (We cannot discern from Medicaid enrollment data whether children who disenrolled from Medicaid obtained other coverage or became uninsured.) Across the three states, about 7 in 10 foster care children were enrolled continuously in Medicaid for all of 1994. Only about 1 in 10 were enrolled for less than half the year. The average length of enrollment was 10.3 to 10.6 months. Children receiving SSI benefits and those in families receiving adoption assistance more often had continuous Medicaid coverage than foster care children. Eighty to 90 percent of SSI and adoption assistance children were enrolled for 12 months. In general, continuity of Medicaid coverage among foster care children was similar to that among AFDC children, except in Florida, where turnover among AFDC children was quite high (only 56 percent were enrolled the full year).(3) These results reflect the orientation of AFDC and foster care to provide temporary services during times of crisis, whereas SSI and adoption assistance are targeted to children who stay eligible for long periods of time (SSI due to disability and adoption assistance usually until the child reaches age 18).
| Category of Medicaid Eligibility | |||||
|---|---|---|---|---|---|
| All Children(a) | Foster care | Adoption Assistance | AFDC | SSI | |
| Length of Medicaid Eligibility in 1994 | |||||
| California | (N=3,603,056) | (N=111,236) | (N=18,922) | (N=2,095,890) | (N=68,667) |
| Total | 100.0% | 100.0% | 100.0 | 100.0 | 100.0 |
| 1 to 5 months | 19.7 | 12.7 | 8.6 | 9.7 | 7.3 |
| 6 to 11 months | 22.8 | 17.1 | 12.3 | 16.4 | 10.5 |
| 12 months | 57.4 | 70.2 | 79.1 | 73.9 | 82.1 |
| Mean (in months) | 9.4 | 10.3 | 10.8 | 10.6 | 11.0 |
| Florida | (N=1,247,470) | (N=14,011) | (N=6,545) | (N=638,259) | (N=60,813) |
| Total | 100.0% | 100.0% | 100.0% | 100.0% | 100.0% |
| 1 to 5 months | 25.0 | 9.5 | 5.0 | 19.3 | 8.1 |
| 6 to 11 months | 28.2 | 18.2 | 6.0 | 24.8 | 10.7 |
| 12 months | 46.9 | 72.3 | 89.0 | 55.9 | 81.3 |
| Mean (in months) | 8.8 | 10.6 | 11.3 | 9.5 | 10.9 |
| Pennsylvania | (N=860,223) | (N=28,390) | (N=3,847) | (N=456,127) | (N=38,177) |
| Total | 100.0% | 100.0% | 100.0% | 100.0% | 100.0% |
| 1 to 5 months | 14.5 | 9.5 | 3.8 | 11.3 | 4.7 |
| 6 to 11 months | 18.4 | 17.7 | 5.9 | 14.2 | 7.9 |
| 12 months | 67.1 | 72.8 | 90.4 | 74.5 | 87.4 |
| Mean (in months) | 10.1 | 10.6 | 11.5 | 10.5 | 11.3 |
| Percent with 12 Months Continuous Coverage Over a 24-month Period | |||||
| California | 73.0 | 83.1 | 87.8 | 83.9 | 89.2 |
| Florida | 64.5 | 84.8 | 92.6 | 70.5 | 87.7 |
| Pennsylvania | 77.6 | 77.6 | 94.8 | 82.2 | 91.9 |
| Source: HCFA State Medicaid Research Files. Note: Numbers may not sum to total due to rounding. a. Includes children in other categories of Medicaid eligibility. | |||||
Figure III.3
Continuous 12-Month Medicaid Coverage, by Category of Medicaid Eligibility, 1994
We also examined continuity of Medicaid coverage over a 24-month period to determine whether patterns of coverage differed over a longer time horizon. As expected, continuity improved over a two-year period, such that 83 percent of foster care children in California, 85 percent in Florida, and 78 percent in Pennsylvania had 12 months of continuous coverage within a 24-month period. Nevertheless, foster care children were less likely to have continuous coverage than the other groups, with the exception of AFDC children in Florida who still had a very high rate of turnover. When children entered foster care, were they newly enrolled in Medicaid or did they have Medicaid coverage through another eligibility category? The percent without prior Medicaid coverage when foster care eligibility began ranged from 27 percent in Florida to 45 percent in California (Table III.5). Among those with prior Medicaid coverage, the largest share across all three states came from AFDC. Thus, the majority of foster care children were known to the "Medicaid system" at the time their foster care eligibility began.
| California (N = 44,525) | Florida (N = 5,383) | Pennsylvania (N = 10,979) | ||||||||||
|---|---|---|---|---|---|---|---|---|---|---|---|---|
| Medicaid Status Before Entering Foster Care | Month 1 | Month 3 | Month 6 | Month 12 | Month 1 | Month 3 | Month 6 | Month 12 | Month 1 | Month 3 | Month 6 | Month 12 |
| Total | 100.0% | 100.0% | 100.0% | 100.0% | 100.0% | 100.0% | 100.0% | 100.0% | 100.0% | 100.0% | 100.0% | 100.0% |
| Not Enrolled in Medicaid | 44.6 | 40.5 | 41.5 | 45.6 | 27.1 | 31.1 | 36.5 | 42.3 | 30.8 | 35.6 | 38.1 | 40.1 |
| Enrolled in Medicaid | ||||||||||||
| -- | 4.5 | 8.7 | 9.4 | -- | 1.5 | 4.5 | 5.2 | -- | 2.0 | 5.7 | 8.1 |
| 0.1 | 0.1 | 0.1 | 0.1 | 1.3 | 1.3 | 1.2 | 0.9 | 0.4 | 0.4 | 0.4 | 0.4 |
| 29.2 | 37.2 | 37.8 | 36.5 | 36.1 | 41.8 | 39.6 | 37.8 | 38.5 | 42.4 | 41.2 | 38.4 |
| 0.7 | 1.0 | 0.9 | 0.8 | 0.6 | 0.7 | 0.7 | 0.7 | 3.6 | 3.7 | 3.6 | 3.1 |
| 25.3 | 16.6 | 10.9 | 7.7 | 34.9 | 23.5 | 17.5 | 13.1 | 26.7 | 16.1 | 11.1 | 9.8 |
| California (N = 43,315) | Florida (N = 5,044) | Pennsylvania (N = 10,075) | ||||||||||
| Medicaid Status After Leaving Foster Care | Month 1 | Month 3 | Month 6 | Month 12 | Month 1 | Month 3 | Month 6 | Month 12 | Month 1 | Month 3 | Month 6 | Month 12 |
| Total | 100.0% | 100.0% | 100.0% | 100.0% | 100.0% | 100.0% | 100.0% | 100.0% | 100.0% | 100.0% | 100.0% | 100.0% |
| Not Enrolled in Medicaid | 36.5 | 38.4 | 42.4 | 51.4 | 48.4 | 43.5 | 42.0 | 42.8 | 52.2 | 51.1 | 49.8 | 51.7 |
| Enrolled in Medicaid | ||||||||||||
| -- | 4.2 | 9.2 | 10.6 | -- | 1.3 | 5.2 | 7.6 | -- | 2.1 | 6.3 | 9.4 |
| 0.7 | 0.8 | 0.8 | 0.8 | 17.2 | 17.2 | 17.1 | 17.1 | 4.6 | 4.6 | 4.6 | 4.5 |
| 16.0 | 19.8 | 20.1 | 18.9 | 24.1 | 26.5 | 25.2 | 22.4 | 27.5 | 28.2 | 26.1 | 21.9 |
| 3.3 | 3.5 | 3.5 | 3.5 | 3.7 | 4.2 | 4.6 | 5.1 | 3.3 | 3.6 | 4.0 | 4.5 |
| 43.5 | 33.4 | 24.1 | 15.0 | 6.6 | 7.2 | 6.0 | 4.9 | 12.4 | 10.4 | 9.3 | 8.0 |
| Source: HCFA State Medicaid Research Files. Note: Numbers may not sum to total due to rounding. a. Data for Pennsylvania are for 1993-1994. | ||||||||||||
At the other end of the continuum, when children left foster care, what happened to their Medicaid eligibility? We see from the bottom panel of Table III.5 that one-third to one-half were not enrolled in Medicaid the month after their foster care eligibility ceased. Among those remaining on Medicaid, most became eligible for AFDC (or resumed AFDC), except in California, where most entered an "other" category while awaiting a final eligibility determination. In California, we observe a gradual increase in the number not enrolled in Medicaid following the end of foster care eligibility as a final eligibility determination was made. Additionally, 11 percent returned to foster care by the end of the 12- month period.
In Florida, discontinuation of Medicaid coverage among foster care children held steady at 42 to 48 percent over the 12-month period. About one in seven appear to have been adopted and were receiving adoption assistance. One in four obtained AFDC coverage. At the end of the 12-month period, foster care children in Florida were more likely than those in other states to be enrolled in Medicaid. That seems to be due to the higher rate of eligibility due to adoption assistance in Florida, compared to the other two states.
In Pennsylvania, about half of those leaving foster care were not enrolled in Medicaid the month after foster care eligibility ended, and this pattern held throughout the 12-month period. In general, the patterns after 12 months were similar to those in California.
Managed Care Participation
Managed care participation rates varied widely across states and by category of Medicaid eligibility within states (Table III.6). About 1 in 10 foster care children in California and Pennsylvania and one in five in Florida were enrolled in Medicaid managed care in 1994. Across all categories of Medicaid eligibility, Florida had the highest level of managed care penetration in 1994 (35 percent), followed by Pennsylvania (30 percent), and California (20 percent). In all three states, the AFDC population was most likely to be enrolled in managed care (27-45 percent) and SSI children had the second-highest participation rates (12-25 percent). The rate was by far the lowest among children receiving adoption assistance.(4)
| Category of Medicaid Eligibility | |||||
|---|---|---|---|---|---|
| All Children(a) | Foster Care | Adoption Assistance | AFDC | SSI | |
| California | 19.8 | 10.6 | 2.3 | 27.3 | 11.6 |
| Florida | 34.8 | 19.4 | 10.0 | 44.9 | 24.7 |
| Pennsylvania | 30.3 | 11.9 | 1.4 | 43.1 | 18.6 |
| Source: HCFA State Medicaid Research Files. a. Includes children in other categories of Medicaid eligibility. | |||||
How did managed care participation rates vary within the foster care population? The patterns varied by state, presumably reflecting variations in program rules (Table III.7). In California and Florida, the rate was lowest among infants, whereas in Pennsylvania, the opposite was found (one in five infants in foster care were enrolled in managed care). In Florida, the rate peaked among children between the ages of one and nine, and in California, among children ages five to nine. Adolescents (ages 15 to 18) had the lowest participation rates in all three states. As might be expected, there were no major gender differences.
| California (N=111,236) | Florida (N=14,011) | Pennsylvania (N=28,390) | |
|---|---|---|---|
| Total | 10.6% | 19.4% | 11.9% |
| Age | |||
| Less than 1 | 1.7 | 2.0 | 20.0 |
| 1 to 4 | 11.0 | 24.6 | 15.4 |
| 5 to 9 | 14.2 | 24.4 | 11.2 |
| 10 to 14 | 11.5 | 17.5 | 10.5 |
| 15 to 18 | 7.7 | 11.2 | 10.9 |
| Gender | |||
| Male | 10.1 | 19.2 | 12.2 |
| Female | 11.1 | 19.6 | 11.6 |
| Race/Ethnicity | |||
| White | 9.4 | 16.4 | 4.2 |
| Black | 14.6 | 22.5 | 18.5 |
| Hispanic | 11.5 | 20.2 | 12.9 |
| Other/Unknown | 6.7 | 17.3 | 7.7 |
| Urban/Rural Location | |||
| Large MSA | 11.6 | 22.3 | 17.1 |
| Small MSA | 6.5 | 17.1 | 3.2 |
| Rural-MSA | 0.6 | 9.2 | 0.0 |
| Source: HCFA State Medicaid Research Files. | |||
In all three states, managed care participation rates were highest among foster care children who were black or Hispanic and lowest among those who were white. In Pennsylvania, for example, 19 percent of black foster care children and 13 percent of Hispanic foster care children were enrolled in managed care, compared to 4 percent of white foster care children. One possible explanation is that a disproportionate share of black and Hispanic foster care children resided in communities with above-average Medicaid managed care penetration.
Managed care participation rates also followed a consistent pattern across geographic areas; the highest rates in all three states were observed in large urban areas and the lowest rates in rural areas. As an example, 22 percent of foster care children in large urban areas in Florida, but only 9 percent in rural areas, were enrolled in managed care. This reflects the focus of state Medicaid managed care programs in large urban areas due to the challenges of developing capitated programs in rural areas.
Subsequent analyses of patterns of diagnoses, utilization, and expenditures are based on claims data and exclude children enrolled in managed care. This is because managed care organizations are paid on a prospective, capitated basis, and thus, do not submit claims data to Medicaid for reimbursement for individual services. Only children enrolled in Medicaid on a fee-for-service basis have complete claims data; therefore, these children are the basis of all remaining analyses in this report.
Diagnosed Health Conditions
1. Chronic Illness and Disability
Previous research has shown that children in foster care have a high prevalence of mental health conditions (Halfon et al. 1992(b); Chernoff et al. 1994; Takayama 1994), but no studies, to our have knowledge systematically compared the diagnoses among children in foster care to those of other children enrolled in Medicaid. Differences in the diagnostic mix could have implications for service delivery under Medicaid (especially with ongoing transitions to managed care). For example, higher levels of mental health conditions may require access to a specialized set of services and providers that most Medicaid programs do not traditionally offer. Likewise, management of complex physical disabilities in a community-based setting may involve personal nursing, medical equipment, transportation, and other ancillary services.
In recent years, with the expansion of Medicaid managed care, advocates have acknowledged the challenges of placing foster care children in managed care due to their special health care needs (Battistelli 1996; Battistelli 1997). Their needs involve multiple systems of care (medical, mental health, juvenile justice, special education), and managed care networks often exclude the necessary providers or are not equipped to facilitate the linkages across systems of care. Dreyfus and Tobias (1998) stress the importance of developing financing mechanisms to create appropriate incentives for the delivery of services to this population.
To measure the frequency of chronic illness and disability in the Medicaid population, we used the Chronic Illness and Disability Payment System (CDPS).(5) The CDPS classifies selected diagnoses into hierarchical cost categories, based on Medicaid claims data. Because Florida did not include diagnoses on outpatient claims, we were able to produce this information only for California and Pennsylvania. Table III.8 shows the diagnostic categories included in the CDPS and provides examples of diagnoses within each category. For purposes of analysis, we have grouped the diagnoses into two broad categories: mental health conditions, which include psychiatric and substance abuse conditions; and physical conditions, which cover all other conditions, including developmental disabilities.
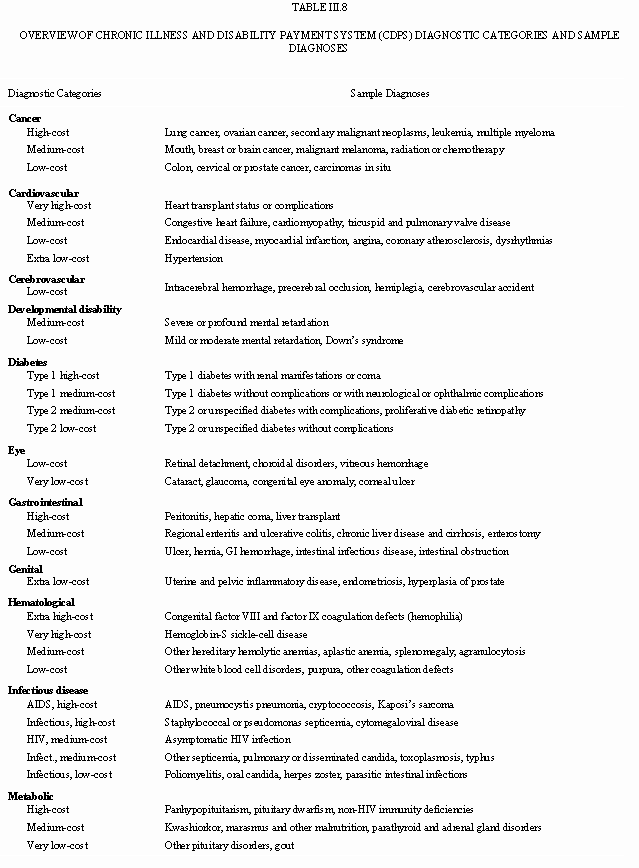
| Diagnostic Categories | Sample Diagnoses |
|---|---|
| Nervous system | |
| High-cost | Quadriplegia, amyotrophic lateral sclerosis and other motor neuron disease |
| Medium-cost | Paraplegia, muscular dystrophy, multiple sclerosis |
| Low-cost | Epilepsy, Parkinson's disease, cerebral palsy, migraine, cerebral degeneration |
| Pregnancy | |
| Incomplete | Normal pregnancy, complications of pregnancy |
| Complete | Normal delivery, multiple delivery, delivery with complications |
| Psychiatric | |
| High-cost | Schiophrenia |
| Medium-cost | Biplorar affective disorder |
| Low-cost | Other depression, panic disorder, phobic disorder |
| Pulmonary | |
| Very high-cost | Cystic fibrosis, lung transplant, tracheostomy status, respirator dependence |
| High-cost | Respiratory arrest or failure, primary pulmonary hypertension, selected bacterial pneumonias |
| Medium-cost | Other bacterial pneumonnias, chronic obstructive asthma, adult respiratory distress syndrome |
| Low-cost | Viral pneumonias, chronic bronchitis, asthma, COPD, emphysema |
| Renal | |
| Very high-cost | Chrinic renal failure, kidney transplant status or complications |
| Medium-cost | Acute renal failure, chronic nephritis, urinary incontinence, cystostomy or urinostomy |
| Low-cost | Kidney infection, kidney stones, hematuria, urethral stricture, bladder disorders |
| Skeletal and connective | |
| Medium-cost | Chronic osteomyelitis, aseptic necrosis of bone |
| Love-cost | Rheumatoid arthritis, osteomyelitis, systemic lupus, traumatic amputation of foot or leg |
| Very low-cost | Osteoporosis, musculoskeletal anomalies, thoracic and lumbar disc degeneration |
| Extra low-cost | Osteoarthrosis, skul fractures, other disc and vertebral disorders |
| Skin | |
| High-cost | Decubitus ulcer |
| Low-cost | Other chronic ulcer of skin |
| Very low-cost | Cellulitis, burn, lupus erythematosus |
| Substance abuse | |
| Low-cost | Opioid, barbiturate, cocaine, amphetamine abuse or dependence, drug psychoses |
| Very low-cost | Alcohol abuse, dependence or psychosis |
| Note: COPD is chronic obstructive pulmonary disease. AIDS is acquired immunodeficiency syndrome. HIV is human immunodeficiency virus. A complete description of CDPS diagnostic categories by ICD codes is available at http://medicine.ucsd.edu/fpm/cdps/. | |
As shown in Table III.9 and Figure III.4, about one in three foster care children in California had a CDPS condition in the Medicaid claims (32 percent), versus two in five in Pennsylvania (41 percent).(6) The rate of CDPS conditions in the foster care population was nearly double the level in the general Medicaid population (16 percent in California and 24 percent in Pennsylvania).(7)

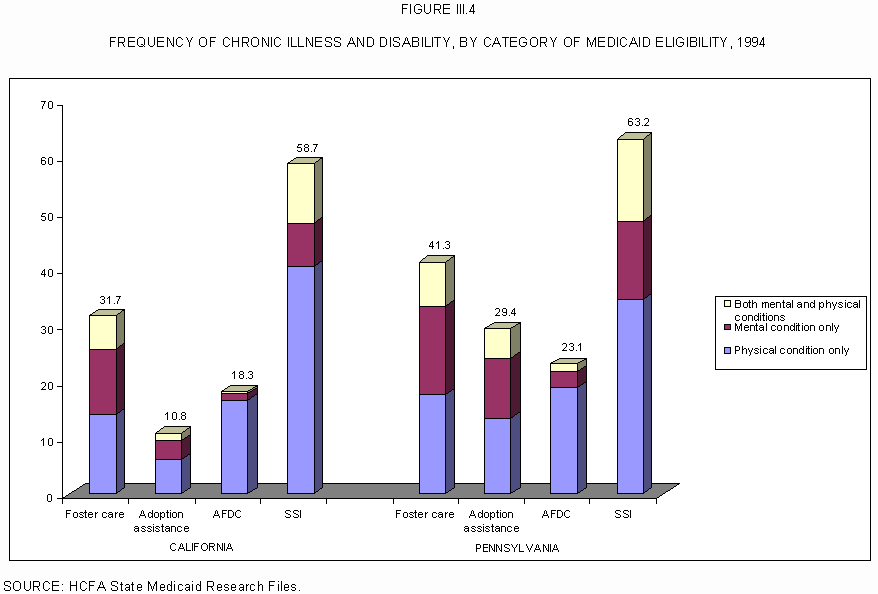
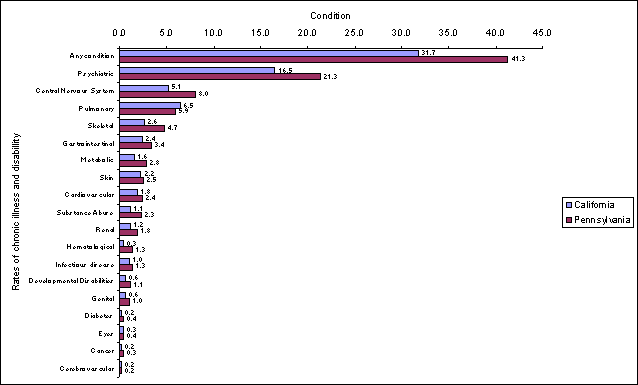
Table III.10 and Figure III.5 present further detail on the types of mental and physical conditions affecting foster care children. Psychiatric conditions were the single most common diagnostic condition among children in foster care; of the children with a CDPS condition, about half had a mental health condition, either alone or in combination with a physical condition (17 percent in California; 21 percent in Pennsylvania). The most common physical conditions within the foster care population were those associated with the central nervous system (5 percent) and pulmonary conditions (6.5 percent). The rate of substance abuse diagnoses (1.1 percent) was highest in the foster care population, although the rate was still very low.(8)
| Condition | California | Pennsylvania | ||||||||
|---|---|---|---|---|---|---|---|---|---|---|
| All Childrena (N=2,891,620) | Foster Care (N=99,468) | Adoption Assistance (N=18,495) | AFDC (N=1,523,080) | SSI (N=60,705) | All Children(a) (N=99,508) | Adoption Assistance (N=5,002) | Adoption Assistance (N=3,792) | AFDC (N=259,428) | SSI (N=19,628) | |
| Percent with chronic illness or disability | 16.4 | 31.7 | 10.8 | 18.3 | 58.7 | 24.1 | 41.3 | 29.4 | 23.1 | 63.2 |
| Cancer | 0.2 | 0.2 | 0.1 | 0.1 | 2.7 | 0.3 | 0.3 | 0.2 | 0.2 | 1.6 |
| Cardiovascular | 1.3 | 1.8 | 0.7 | 1.4 | 7.3 | 1.7 | 2.4 | 1.4 | 1.6 | 5.7 |
| Cerebrovascular | 0.1 | 0.2 | 0.1 | 0.1 | 1.2 | 0.1 | 0.2 | 0.1 | 0.1 | 0.7 |
| Central nervous system | 2.2 | 5.1 | 2.6 | 1.8 | 27.2 | 4.8 | 8.0 | 7.4 | 3.5 | 27.5 |
| Diabetes | 0.2 | 0.2 | 0.1 | 0.2 | 0.8 | 0.3 | 0.4 | 0.3 | 0.3 | 0.9 |
| Developmental disabilities | 0.3 | 0.6 | 0.4 | 0.1 | 8.3 | 0.7 | 1.1 | 1.7 | 0.2 | 8.0 |
| Eyes | 0.2 | 0.3 | 0.1 | 0.2 | 1.4 | 0.2 | 0.4 | 0.3 | 0.2 | 0.7 |
| Genital | 0.3 | 0.6 | 0.1 | 0.4 | 0.8 | 0.6 | 1.0 | 0.3 | 0.6 | 0.9 |
| Gastrointestinal | 2.5 | 2.4 | 0.8 | 2.9 | 6.8 | 3.4 | 3.4 | 1.6 | 3.5 | 5.9 |
| Hematological | 0.3 | 0.3 | 0.1 | 0.3 | 2.2 | 0.7 | 1.3 | 0.5 | 0.8 | 2.7 |
| Infectious disease | 1.1 | 1.0 | 0.2 | 1.3 | 2.4 | 1.2 | 1.3 | 0.5 | 1.3 | 1.5 |
| Metabolic | 0.7 | 1.6 | 0.6 | 0.6 | 6.7 | 1.1 | 2.8 | 1.6 | 0.8 | 4.9 |
| Psychiatric | 2.0 | 16.5 | 4.4 | 1.6 | 10.9 | 5.2 | 21.3 | 14.4 | 3.8 | 21.7 |
| Pulmonary | 5.0 | 6.5 | 2.1 | 6.1 | 11.6 | 5.0 | 5.9 | 4.3 | 5.5 | 9.8 |
| Renal | 0.8 | 1.2 | 0.4 | 0.8 | 3.1 | 1.2 | 1.8 | 1.8 | 1.0 | 4.5 |
| Skeletal | 1.9 | 2.6 | 1.0 | 2.0 | 9.2 | 3.3 | 4.7 | 2.9 | 3.1 | 8.7 |
| Skin | 1.8 | 2.2 | 0.5 | 2.3 | 3.8 | 2.5 | 2.5 | 1.1 | 2.7 | 4.2 |
| Substance abuse | 0.1 | 1.1 | 0.1 | 0.1 | 0.4 | 0.3 | 2.3 | 0.3 | 0.2 | 0.7 |
| Source: HCFA State Medicaid Research Files. Note: Numbers may not sum to total due to rounding. Excludes children enrolled in Medcaid managed care. a. Includes children in other categories of Medicaid eligibility. | ||||||||||
In general, the rate of CDPS conditions among adoption assistance children was quite a bit lower than the rate among foster care children, especially in California. This would suggest that children who were adopted had fewer medical conditions than those who remained in foster care.(9) This could be a function of either the risk selection in the adoption process (that is, healthier children are adopted) or the more stable risk profile of children who have been in adoptive families for several years.
The AFDC population was less likely to have a CDPS condition as well; the rate was nearly half that of the foster care population. However, this was entirely due to lower rates of mental health/substance abuse conditions diagnosed in the AFDC population, given that the rate of physical conditions was somewhat higher.
Finally, as expected, the likelihood of having a CDPS condition was higher for the SSI population than the foster care population, which largely is a function of the higher rate of physical conditions and developmental disabilities among SSI children. SSI children were more likely to have conditions associated with the central nervous system, such as cerebral palsy and epilepsy; pulmonary conditions, such as cystic fibrosis and asthma; and skeletal conditions, such as arthritis. In addition, about 8 percent of SSI children had a diagnosis of mental retardation or developmental disability (MR/DD), versus 1 percent or less in the foster care population.(10)
We also considered the frequency of comorbidities among those with at least one CDPS condition. (Comorbidity is defined as having a condition in more than one diagnostic group.) Multiple diagnoses add significantly to the complexity and cost of care (Kronick et al. forthcoming). Of the foster care children with at least one CDPS condition, about 30 percent had more than one type of condition (Table III.11). Not surprisingly, the rate of comorbidities was higher among SSI children; nearly half of those with a condition had more than one. The rate of comorbidity was lower in the adoption assistance and AFDC groups.
| Number of Diagnostic Categories | All Childrena | Category of Medicaid Eligibility | |||
|---|---|---|---|---|---|
| Foster Care | Adoption Assistance | AFDC | SSI | ||
| California | (N=474,895) | (N=31,513) | (N=1,982) | (N=278,701) | (N= 35,623) |
| 1 | 80.0% | 70.8% | 77.1% | 82.8% | 52.8% |
| 2 | 15.3 | 21.2 | 17.0 | 14.2 | 26.8 |
| 3 or more | 4.7 | 8.0 | 5.9 | 3.0 | 20.5 |
| Pennsylvania | (N=144,606) | (N=10,315) | (N=1,114) | (N=59,792) | (N=19,628) |
| 1 | 75.4% | 67.8% | 73.4% | 78.7% | 55.0% |
| 2 | 18.0 | 22.2 | 18.6 | 16.8 | 26.8 |
| 3 or more | 6.6 | 10.0 | 8.0 | 4.5 | 18.2 |
| Source: HCFA State Medicaid Research Files. Note: Numbers may not sum to 100% due to rounding. a. Includes children in other categories of Medicaid eligibility. | |||||
Given the frequency of mental conditions within the foster care population, we performed a more detailed analysis of the severity of mental conditions. The CDPS creates a hierarchical distribution of conditions within a diagnostic category, permitting an analysis of case mix variations. Table III.12 shows the hierarchy and types of diagnoses included in each of the psychiatric categories. The CDPS also includes two categories known as "extra low" and "not well defined," which are not counted in the CDPS classification of chronic illness and disability, either because these conditions are not considered to add significantly to costs or because there is no general agreement about the diagnosis and/or treatment of these conditions. As such, the "extra low" and "not well defined" conditions were excluded from previous frequencies. We include these conditions here to show the full magnitude of mental health conditions in the foster care population.
| Psychiatric Cost Categories | ICD-9 Codes | Code Descriptions |
|---|---|---|
| High | ||
| 295.xx | Schizophrenic disorders | |
| 301.83 | Borderline personality disorder | |
| Medium | ||
| 296.4x-296.7x | Bipolar affective disorder-manic, depressed, mixed, unspecified | |
| 307.1x | Anorexia nervosa | |
| 307.5x | Other and unspecified disorders of eating | |
| Low | ||
| 293.0 | Acute delerium | |
| 293.1 | Subacute delerium | |
| 293.83 | Organic affective syndrome | |
| 296.0x-296.1x | Manic disorder, single and recurrent episodes | |
| 296..2x-296.3x | Major depressive disorder, single and recurrent episodes | |
| 296.8x | Manic-depressive psychosis, other and unspecified | |
| 296.9x | Other and unspecified affective psychoses | |
| 297.xx | Paranoid states | |
| 298.xx | Other nonorganic psychoses | |
| 299.xx | Psychoses with origin specific to childhood | |
| 300.01 | Panic disorder | |
| 300.2x | Phobic disorders | |
| 300.3 | Obsessive-compulsive disorders | |
| 300.4 | Neurotic depression | |
| 300.5 | Neurasthenia | |
| 300.6 | Depersonalization sydrome | |
| 300.7 | Hypochondriasis | |
| 300.8 | Other neurotic disorders | |
| 300.9 | Unspecified neurotic disorder | |
| 309.xx | Adjustment reaction(a) | |
| 310.xx | Specific nonpsychotic mental disorders due to organic brain damage | |
| 311.xx | Depressive disorder, not elsewhere classified | |
| 314.0x | Hyperkinetic syndrome of childhood | |
| 780.1x | Hallucinations | |
| Extra low | ||
| 293.8x | Other specified transient organic mental disorders(b) | |
| 306.xx | Physiological malfunction arising from mental factors | |
| Not well defined | ||
| 293.9x | Unspecified transient organic mental disorder | |
| 294.xx | Other organic psychotic conditions(c) | |
| 300.0x | Anxiety states(d) | |
| 300.1x | Hysteria | |
| 301.xx | Personality disorders | |
| 302.xx | Sexual deviations and disorders | |
| 307.xx | Special symptoms or syndromes, not elsewhere classified(e) | |
| 308.xx | Acute reaction to stress | |
| 309.0x | Brief depressive reaction | |
| 309.9x | Unspecified adjustment reaction | |
| 312.xx | Disturbance of conduct not elsewhere classified | |
| 313.xx | Disturbance of emotions specific to childhood and adolescence | |
| 314.xx | Hyperkinetic syndrome of childhood(f) | |
| 316.xx | Psychic factors associated with diseases classified elsewhere | |
| NOTE: The "extra low" and "not well defined" categories are not counted in the CDPS due to lack of clinical certainty regarding diagnosis and treatment. a. Excluding 309.9 Unspecified adjustment reaction. This is classified as "not well defined." b. Excluding 293.83 Organic affective syndrome. This is classified as "low." c. Excluding 294.1 Dementia. This is classified elsewhere. d. Excluding 300.01 Panic disorder. This is classified as "low." e. Excluding 307.1, Anorexia nervosa and 307.5 Other and unspecified disorders of eating. These are classifed as "medium." f. Excluding 314.0x Attention deficit disorder. This is classified as "low." | ||
As shown in Table III.13, most children had psychiatric diagnoses that were classified in the low-cost category (such as panic disorder and adjustment reaction). Less than 1 percent had high-cost psychiatric diagnoses (such as schizophrenia). Below the dotted line, we show the frequency of "extra low" and "not well defined" psychiatric diagnoses (such as conduct disorder and acute reaction to stress). When these conditions are included, the differential in the frequency of psychiatric diagnoses widens between foster care children and those in other groups (increasing to 24.2 percent of all foster care children in California and 31.5 percent in Pennsylvania). These "extra low" and "not well defined" diagnoses are clearly more prevalent in the foster care population. Within the foster care population, we see considerable variation among subgroups in the frequency of CDPS conditions (Table III.14). Beginning with California, the rate increased with age, doubling from 17 percent among infants to 35-37 percent among those age 10 and up. This increase was attributable to the manifestation of psychiatric and substance abuse conditions in the preteen and teenage years. It is unknown whether these conditions are a cause or consequence of or unrelated to foster care placement. The higher rate of mental health conditions among adolescents is consistent with previous research by Halfon and colleagues (1992b), also based on California Medi-Cal claims data. The age-related patterns were slightly different in Pennsylvania. The absolute rates were quite a bit higher than in California across all age groups, except that they converged in the adolescent age group (15 to 18).
| All Children(a) | Category of Medicaid Eligibility | ||||
|---|---|---|---|---|---|
| Foster Care | Adoption Assistance | AFDC | SSI | ||
| California 1994 | (N = 2,891,620) | (N = 99,468) | (N = 18,495) | (N = 1,523,080) | (N = 60,705) |
| Total Psychiatric | 2.1% | 16.5% | 4.3% | 1.6% | 11.0% |
| High | 0.1 | 0.3 | 0.1 | # | 0.6 |
| Medium | 0.1 | 0.4 | 0.1 | # | 0.4 |
| Low | 1.9 | 15.8 | 4.1 | 1.6 | 10.0 |
| Extra Low/Not Well Defined(b) | 1.1 | 7.7 | 1.4 | 1.1 | 3.8 |
| Pennsylvania 1994 | (N = 599,508) | (N = 25,002) | (N = 3,792) | (N = 259,428) | (N = 31,076) |
| Total Psychiatric | 5.2% | 21.4% | 14.5% | 3.9% | 21.7% |
| High | 0.1 | 0.8 | 0.3 | 0.1 | 0.9 |
| Medium | 0.2 | 0.7 | 0.4 | 0.1 | 0.9 |
| Low | 4.9 | 19.9 | 13.8 | 3.7 | 19.9 |
| Extra Low/Not Well Defined(b) | 1.8 | 10.1 | 3.1 | 1.6 | 5.1 |
| Source: HCFA State Medicaid Research Files. Note: Numbers may not sum to total due to rounding. a. Includes children in other categories of Medicaid eligibility. b. "Extra low" and "not well defined" are not counted in CDPS, and are not included in the total for psychiatric diagnoses. | |||||
| California (N = 99,468) | Pennsylvania (N = 25,002) | |||||||
|---|---|---|---|---|---|---|---|---|
| Characteristic | Any Condition (Percent) | Physical Only (Percent) | Mental Only (Percent) | Both (Percent) | Any Condition (Percent) | Physical Only (Percent) | Mental Only (Percent) | Both (Percent) |
| Total | 31.7 | 14.1 | 11.7 | 5.9 | 41.3 | 17.7 | 15.7 | 7.9 |
| Age | ||||||||
| Less than 1 | 16.7 | 15.3 | 0.8 | 0.6 | 43.9 | 40.7 | 0.9 | 2.4 |
| 1 to 4 | 27.4 | 21.6 | 3.2 | 2.6 | 43.5 | 36.3 | 3.3 | 4.0 |
| 5 to 9 | 31.0 | 12.5 | 12.6 | 6.0 | 45.9 | 15.8 | 20.0 | 10.1 |
| 10 to 14 | 36.7 | 10.8 | 17.9 | 8.0 | 48.2 | 12.0 | 24.9 | 11.3 |
| 15 to 18 | 35.3 | 11.0 | 16.1 | 8.3 | 34.1 | 12.0 | 15.0 | 7.2 |
| Gender | ||||||||
| Male | 33.2 | 14.5 | 12.5 | 6.3 | 39.9 | 16.9 | 15.3 | 7.7 |
| Female | 30.0 | 13.7 | 10.9 | 5.4 | 43.3 | 18.8 | 16.2 | 8.3 |
| Race/Ethnicity | ||||||||
| White | 32.1 | 12.6 | 13.1 | 6.5 | 43.2 | 16.1 | 17.8 | 9.3 |
| Black | 33.9 | 19.0 | 9.4 | 5.5 | 39.4 | 19.3 | 13.5 | 6.6 |
| Hispanic | 29.1 | 14.3 | 10.4 | 4.4 | 43.1 | 17.2 | 16.9 | 9.0 |
| Other/Unknown | 26.5 | 13.5 | 8.1 | 4.9 | 32.6 | 15.4 | 13.5 | 3.7 |
| Urban/Rural Location | ||||||||
| Large MSA | 30.9 | 13.3 | 11.7 | 5.9 | 40.3 | 17.6 | 15.3 | 7.4 |
| Small MSA | 34.5 | 17.5 | 11.4 | 5.6 | 41.5 | 17.6 | 15.8 | 8.1 |
| Non-MSA | 39.5 | 18.3 | 14.8 | 6.4 | 45.9 | 18.2 | 17.4 | 10.4 |
| Length of Medicaid Eligibility | ||||||||
| 1 to 5 months | 10.4 | 4.7 | 4.7 | 1.0 | 11.6 | 5.5 | 5.6 | 0.6 |
| 6 to 11 months | 28.6 | 13.6 | 10.8 | 4.2 | 31.0 | 13.4 | 12.7 | 4.9 |
| 12 months | 36.8 | 16.1 | 13.4 | 7.3 | 48.2 | 20.5 | 17.9 | 9.8 |
| SSI Eligibility | ||||||||
| SSI eligibility | 71.9 | 25.3 | 24.3 | 22.3 | 74.0 | 23.5 | 26.5 | 24.1 |
| No SSI eligibility | 31.0 | 13.9 | 11.5 | 5.6 | 40.5 | 17.5 | 15.4 | 7.5 |
| Type of Foster Care Assistance | ||||||||
| Title IV-E Assistance | 33.7 | 15.9 | 11.8 | 6.1 | 45.1 | 20.2 | 16.1 | 8.8 |
| No Title IV-E Assistance | 27.2 | 10.2 | 11.6 | 5.5 | 31.4 | 11.2 | 14.6 | 5.6 |
| Source: HCFA State Medicaid Research Files. | ||||||||
There was little difference in the overall rate of CDPS conditions by gender in both states. White foster care children were slightly more likely to have mental conditions, and black foster care children were slightly more likely to have physical conditions than other children (apparently due to a higher rate of asthma among black foster care children).(11) In both states, foster care children in rural areas had a slightly higher frequency of chronic illness and disability, compared to children in urban areas. Children who were enrolled in Medicaid the full year were more likely to have a chronic condition than those enrolled at least half the year (but not the full year); these children in turn, were more likely to have chronic conditions than children enrolled less than half the year. This pattern persists across the three diagnostic groups (physical only, mental only, and both). One possible explanation is that foster care children who are often ill have more continuous Medicaid coverage. On the other hand, this could be endogenous, in that the longer children are enrolled, the more likely they are to have a Medicaid claim with a CDPS diagnosis.
There were differences in the diagnostic profile according to type of benefits received. Foster care children who also received SSI benefits had a substantially higher likelihood of a CDPS condition; indeed, they were three to four times more likely to have both physical and mental conditions than those who were not eligible for SSI. In addition, those receiving Title IV-E assistance were more likely to have a condition than those not receiving such assistance; this was mostly attributable to the higher likelihood of having a physical condition.
2. Comparison of Delivery Rates
In addition to examining variations in chronic illness and disability within the Medicaid population, we compared the rate of deliveries among teenage girls. Little is known about the birth rate among girls in foster care compared to that of girls in other categories of Medicaid eligibility and the general population.
As shown in Figure III.6, the delivery rate for girls in foster care ranged from 35.4 per 1,000 in California to 67.6 per 1,000 in Florida. The foster care delivery rate was substantially lower than the rate in the AFDC population but higher than that in the SSI population.
Figure III.6
Deliveries per 1,000 Girls Age 15-17,
by Category of Medicaid Eligibility, 1994
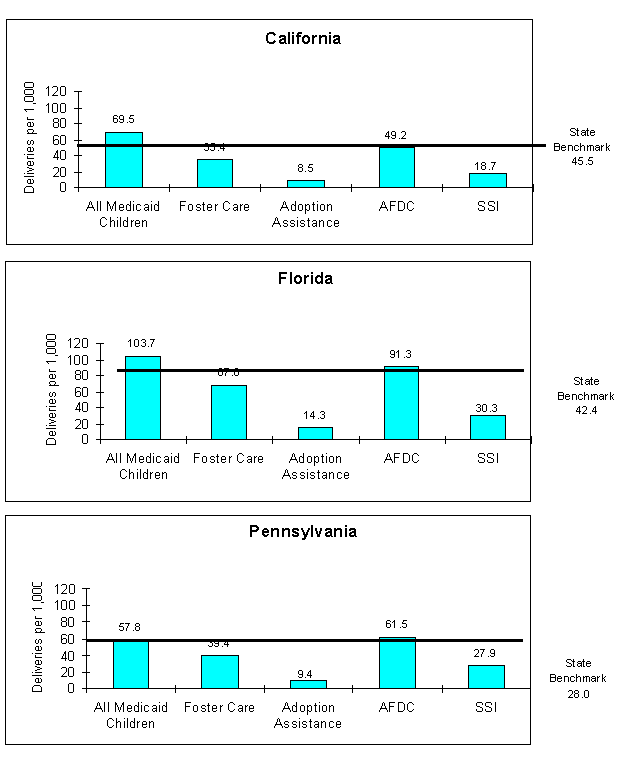
Sources: Medicaid reates derived from 1994 State Medicaid Research Files. State benchmarks from Ventura, et al (1996).
Note: State benchmarks reflect births per 1,000 while Medicaid rates reflect deliveries per 1,000.
Compared to the state benchmarks, the delivery rate among girls in foster care was lower than the general population in California, but higher than the general population in Florida and Pennsylvania. These findings should be considered illustrative (rather than definitive) because of differences in the way the rates are constructed using claims data versus birth certificates.(12)
Utilization of Health Care Services
Previous studies have shown that children in foster care utilize more mental health services, on average, than do other children covered by Medicaid (Takayama et al. 1994; Halfon et al. 1992(b), 1995). Studies have differed in their findings as to whether children in foster care utilize more physical health services. For example, Chernoff et al. (1994) and Halfon et al. (1995) found that foster children had higher health care costs than other children, whereas Takayama et al. (1994) found that they did not.
This section explores patterns of health care utilization among foster care children and children in other categories of Medicaid eligibility. Utilization is measured in two ways: first, in terms of initial access to care (initial entry into the health care system); and, second, in terms of the intensity of use. The access to care measures reflect the percentage of children with one or more inpatient stays or one or more visits of a particular type, while the intensity measures capture the number of inpatient days or outpatient visits per 1,000 children. We analyze patterns of mental health and substance abuse treatment separately, given the importance of this type of care for the foster care population. The utilization measures were defined in Chapter II (Table II.5).
1. Access to Care and Intensity of Use
a. Inpatient Care
Children in foster care had above-average rates of hospitalization compared to the general population of Medicaid children (Table III.15 and Figure III.7). Among the three states, foster care children in Florida were slightly more likely to have a stay (4.1 percent in Florida versus 3.2 percent in the other two states). As expected, SSI children had the highest likelihood of a hospital stay (7 to 12 percent in 1994), and correspondingly, the number of hospital days per 1,000 children was dramatically higher among SSI children than foster care children, ranging from three times higher in Pennsylvania to 14 times higher in California. Compared to the AFDC children, those in foster care were more likely to be admitted to the hospital and they had two to three times more inpatient days per 1,000 children. Children receiving adoption assistance had by far the lowest rate of inpatient use.(13)
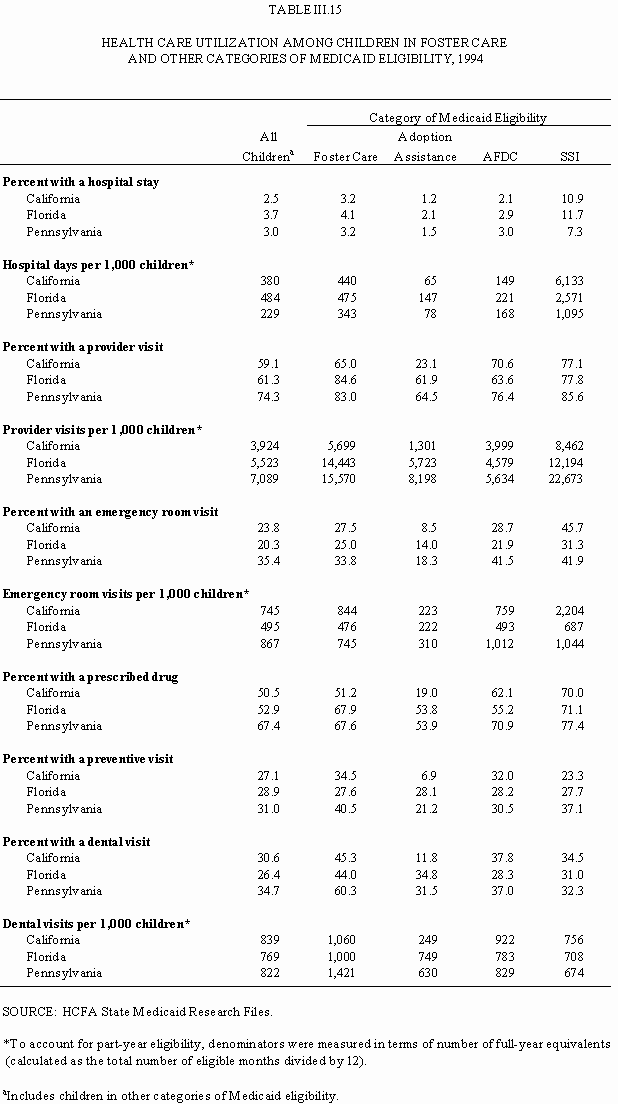
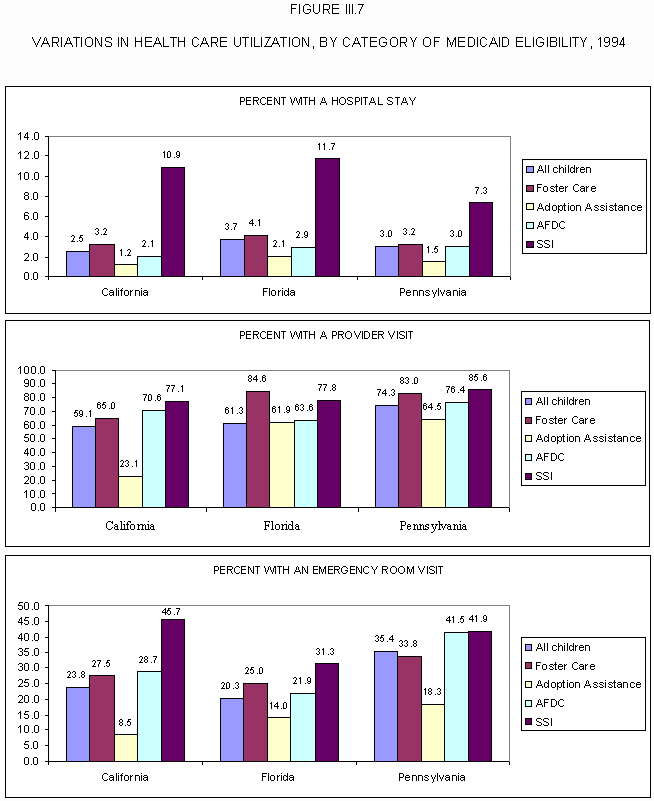
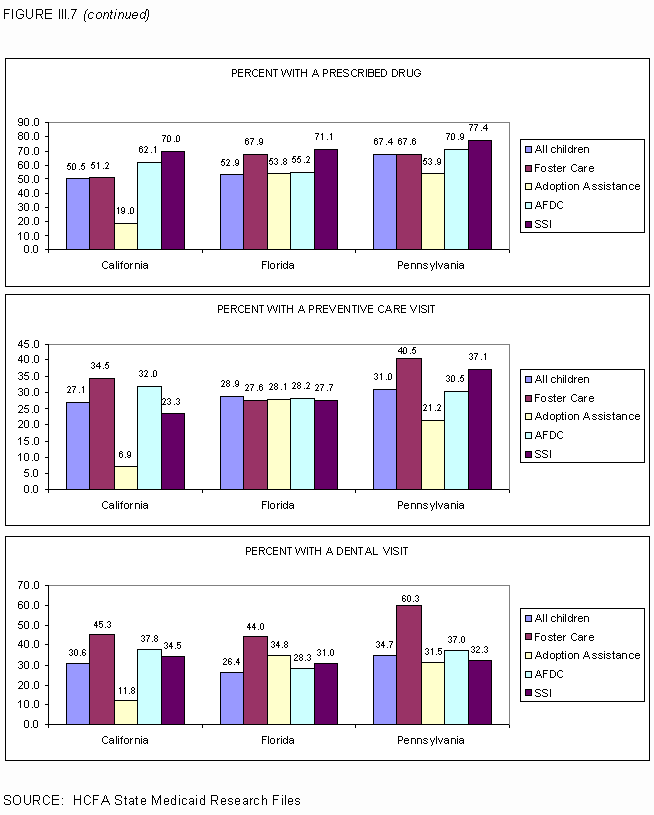
b. Outpatient Provider Visits
We observed considerable variation in patterns of outpatient provider visits, both across states and among groups of Medicaid children within each state. Over 80 percent of the foster care children in Florida and Pennsylvania had at least one provider visit in 1994 (excluding visits to emergency rooms), compared to 65 percent in California. Nationally, 74 percent of children had at least one ambulatory medical care visit in 1996 (McCormick et al. 2000), suggesting that utilization by foster care children in California was lower than the national average for all children.(14)
Not only was the likelihood of a provider visit among foster care children lower in California than in the other two states, but it was also lower relative to the AFDC and SSI children within that state (71 and 77 percent, respectively). On the other hand, foster care children in California had a higher intensity of provider contact than AFDC children (as measured by visits per 1,000 children), signifying that once they were in the system, they received more care. Nevertheless, these comparisons echo the conclusions of a task force in California, which cited the lack of a "system of health care for foster children, but rather an unplanned, often uncoordinated set of services" (California State University 1998).
In Florida, we found that the rate of provider visits among foster care children was higher than that of SSI children (85 percent versus 78 percent) and moreover, the intensity of visits was higher (14,400 versus 12,200 per 1,000). In Pennsylvania, the likelihood of a visit was relatively comparable (83 percent versus 86 percent), but SSI children had more visits (22,700 versus 15,600 per 1,000). Not surprisingly, in both states foster care children had substantially higher utilization than AFDC children (averaging three times more visits per 1,000 children).
c. Emergency Room Utilization
Between one-fourth and one-third of all foster care children visited an emergency room (ER) at least once in 1994. Nationally, the self-reported rate was much lower, at 13 percent overall, and 15.5 percent among those with public insurance coverage (McCormick et al. 2000). Across all three states, foster care children were less likely than SSI children to use the ER. The patterns of ER use varied, however, relative to the AFDC population. The likelihood of an ER visit among foster care children was similar to that of AFDC children in California (28-29 percent), slightly higher in Florida (25 percent versus 22 percent), and quite a bit lower in Pennsylvania (34 percent versus 42 percent). Indeed, in Pennsylvania, the number of ER visits per 1,000 children was one-third lower among foster care children than AFDC children. It is unclear what is driving these variations in patterns of ER use across states and among populations within states.
d. Prescribed Drugs
We found that one-half to two-thirds of foster care children had one or more prescriptions in 1994, with the lowest rate observed in California (51 percent). The rate in the general population nationally was 55 percent in 1996, so foster care children in California were below the national rate (McCormick et al. 2000).
Not surprisingly, across all three states SSI children were more likely than foster care children to receive one or more prescribed drugs. We were surprised, however, to find that in two states California and Pennsylvania the AFDC population also had higher prescription drug utilization than the foster care population. We would expect these differences to be driven by case mix (such as differences in the prevalence of otitis media or asthma), but we were not able to explore what drugs or diagnoses account for the variation.
e. Preventive Care
Turning now to preventive checkups, foster care children in Pennsylvania had the highest rate of preventive care (41 percent), compared to 35 percent in California and 28 percent in Florida. Indeed, in Florida, the rate was similarly low across all categories of Medicaid eligibility. In the other two states, foster care children had the highest levels of preventive care compared to children in other groups. In California, for example, one-third of the foster care children but only one-fourth of the SSI children had a preventive visit in 1994.
Despite somewhat more favorable levels of preventive care among foster care children in two of the three states, it is nevertheless apparent that many foster care children do not receive routine check-ups in a given year, despite the recommendations for preventive health examinations every six months for infants and preschoolers in foster care, and annual exams thereafter (CWLA 1988).(15)
f. Dental Care
Foster care children were more likely to receive dental care than any other group of Medicaid children. Sixty percent of the foster care children in Pennsylvania and 44-45 percent in California and Florida had at least one dental visit in 1994, compared to 28-38 percent in the AFDC population and 31-35 percent in the SSI population. Moreover, the number of visits per 1,000 foster care children exceeded the number for the other groups, especially in Pennsylvania. In general, the level of dental care observed in the foster care population was comparable to that observed in the general population, with about 43 percent of all children nationally having at least one dental visit in 1996 (McCormick et al. 2000). Other Medicaid children, however, used dental care at rates well below the national average.
2. Utilization of Mental Health and Substance Abuse Services
The likelihood of receiving mental health or substance abuse treatment services varied substantially among foster care children in the three states, ranging from a low of 23 percent in California to a high of 38 percent in Florida, with Pennsylvania in the middle at 33 percent (Table III.16 and Figure III.8).(16) Few foster care children were hospitalized for mental health or substance abuse treatment (only 1.7 to 2.9 percent). Most received treatment on an outpatient basis.
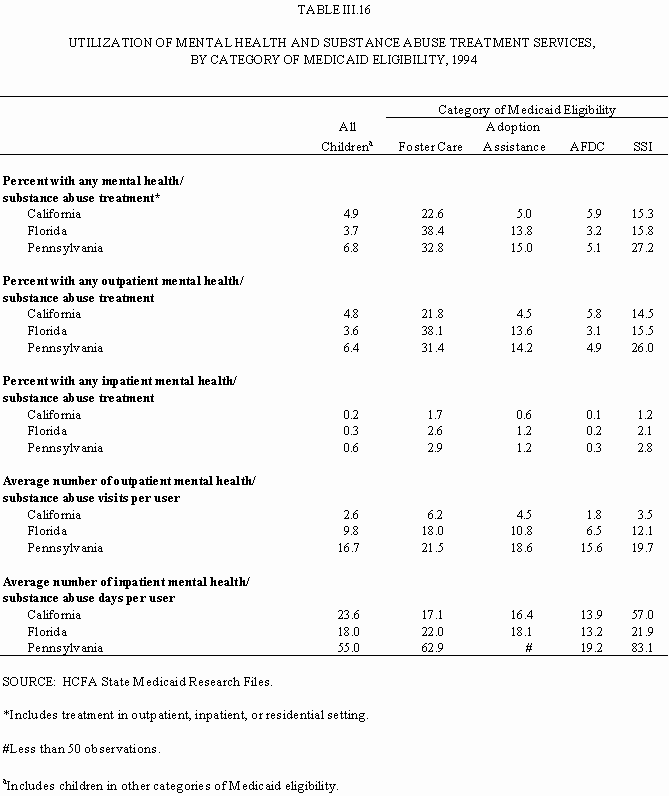
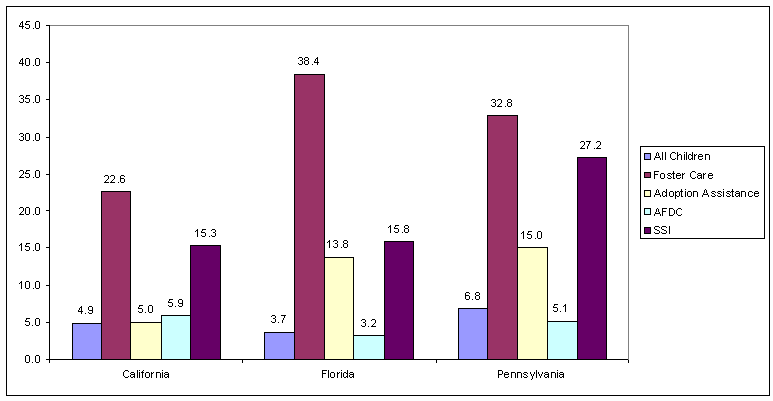
Source: HCFA State Medicaid Research Files.
Among foster care children receiving any services, there was wide variation across states in the average number of services. For example, in Pennsylvania, foster care children averaged nearly 22 visits per user, versus 18 in Florida, and only 6 in California. (17) Thus, not only did foster care children in California have the lowest likelihood of a visit, but those who entered treatment also had fewer visits. In contrast, utilization was highest in Pennsylvania, both in terms of the likelihood of entering treatment and the number of visits once children were in treatment. This pattern is consistent with results on the higher frequency of mental conditions among foster care children in Pennsylvania than in California, as classified in the CDPS (recall Table III.9). What is not clear, however, is whether the level of use is commensurate with clinical need, and moreover, whether children in California are more likely to have an undiagnosed mental health condition due to barriers to care.
How do patterns of use among foster care children compare to those among children in other categories of Medicaid eligibility? As expected, based on our previous analysis of health conditions in the Medicaid population, foster care children had not only the highest likelihood of a visit, but in some cases, a higher intensity as well. In California, for example, 6 percent of AFDC children and 15 percent of SSI children received treatment, compared to 23 percent of the foster care population. Thus, even though the likelihood of use among foster care children was lower in California than in the other two states, it was nevertheless higher than comparison groups within the state. We see an even more substantial difference in Florida, where the likelihood of any mental health or substance abuse treatment was more than two times higher among foster care children than SSI children, and more than 12 times higher than AFDC children.
In general, the intensity of outpatient treatment (captured by the average number of visits per user) was higher among foster care children than among those in the other groups. In Florida, for example, foster care children averaged 18 visits per user, compared to 12 visits among SSI children, and 7 visits among AFDC children. On the other hand, in Pennsylvania, it would appear that once children entered the treatment system, there was a relatively small difference in the number of visits they received (22 visits, foster care children; 20 visits, SSI children; 19 visits, adoption assistance children).
Although foster care children were more likely to be admitted for inpatient treatment in all three states, the average length of stay was typically greater among SSI children than foster care children. This pattern was most pronounced in California, where SSI children averaged 57 days and foster care children averaged 17 days. This is largely a function of a few outlier cases in the SSI population that influence group averages.
3. Variations Within the Foster Care Population
Tables 17A, 17B, and 17C show patterns of health care utilization among foster care children by selected demographic characteristics and Tables 18A, 18B, and 18C show patterns of mental health and substance abuse treatment.
| Inpatient Care | Outpatient Provider Visits | Emergency Room Visits | Percent with a prescribed drug | Percent with a preventive visit | Dental Visits(1) | |||||
|---|---|---|---|---|---|---|---|---|---|---|
| Percent with a stay | Days per 1,000 children | Percent with a visit | Visits per 1,000 children | Percent with a visit | Visits per 1,000 children | Percent with a visit | Visits per 1,000 children | |||
| Total | 3.2 | 440 | 65.0 | 5,699 | 27.5 | 844 | 51.2 | 34.5 | 45.3 | 1,060 |
| Age | ||||||||||
| Less than 1 | 10.2 | 4,043 | 35.3 | 4,419 | 14.8 | 947 | 27.1 | 27.7 | NA | NA |
| 1 to 4 | 5.6 | 801 | 62.9 | 5,079 | 30.6 | 1,041 | 55.7 | 46.5 | 35.6 | 658 |
| 5 to 9 | 1.8 | 128 | 69.1 | 4,621 | 24.8 | 613 | 54.4 | 38.2 | 46.6 | 978 |
| 10 to 14 | 1.4 | 128 | 69.8 | 6,105 | 26.5 | 684 | 51.7 | 31.7 | 50.8 | 1,145 |
| 15 to 18 | 2.2 | 224 | 65.7 | 7,229 | 30.7 | 1,019 | 48.9 | 23.7 | 41.5 | 1,159 |
| Length of Medicaid Eligibility | ||||||||||
| 1 to 5 months | 2.0 | 919 | 29.2 | 4,113 | 8.1 | 590 | 15.0 | 11.9 | 10.9 | 744 |
| 6 to 11 months | 4.4 | 919 | 60.5 | 5,356 | 26.7 | 894 | 45.2 | 30.7 | 36.1 | 1,001 |
| 12 months | 3.2 | 325 | 73.4 | 5,839 | 31.7 | 847 | 60.1 | 40.1 | 53.0 | 1,082 |
| Type of Health Condition | ||||||||||
| No condition | 1.2 | 110 | 50.8 | 2,741 | 17.4 | 425 | 36.9 | 27.1 | 35.6 | 851 |
| Any condition | 7.7 | 1,059 | 95.6 | 11,248 | 49.3 | 1,631 | 81.9 | 50.5 | 64.5 | 1,424 |
| Physical condition only | 13.5 | 1,982 | 95.7 | 9,243 | 57.6 | 2,070 | 84.7 | 55.3 | 60.0 | 1,298 |
| Mental condition only | 1.0 | 59 | 93.5 | 10,528 | 34.0 | 830 | 73.6 | 43.9 | 64.0 | 1,421 |
| Both physical and mental conditions | 7.0 | 833 | 99.4 | 17,284 | 60.1 | 2,148 | 92.0 | 51.6 | 72.9 | 1,635 |
| SSI Eligibility Status | ||||||||||
| SSI eligibility | 8.0 | 2,936 | 89.0 | 12,215 | 49.2 | 2,218 | 78.4 | 41.4 | 59.2 | 1,229 |
| No SSI eligibility | 3.1 | 393 | 64.6 | 5,577 | 27.2 | 818 | 50.7 | 34.4 | 45.1 | 1,056 |
| Type of Foster Care Assistance | ||||||||||
| Title IV-E Assistance | 3.6 | 458 | 70.3 | 5,775 | 30.2 | 884 | 56.8 | 39.7 | 51.0 | 1,116 |
| No Title IV-E Assistance | 2.4 | 390 | 53.3 | 5,498 | 21.5 | 736 | 38.7 | 23.0 | 34.5 | 927 |
| SOURCE: HCFA State Medicaid Research Files. NA = Not Applicable. (1) Dental visits are calculated for children age 4 and over. |
||||||||||
| Inpatient Care | Outpatient Provider Visits | Emergency Room Visits | Percent with a prescribed drug | Percent with a preventive visit | Dental Visits(1) | |||||
|---|---|---|---|---|---|---|---|---|---|---|
| Percent with a stay | Days per 1,000 children | Percent with a visit | Visits per 1,000 children | Percent with a visit | Visits per 1,000 children | Percent with a visit | Visits per 1,000 children | |||
| Total | 4.1 | 475 | 84.6 | 14,443 | 25.0 | 476 | 67.9 | 27.6 | 44.0 | 1,000 |
| Age | ||||||||||
| Less than 1 | 21.5 | 6,462 | 76.7 | 12,096 | 23.0 | 682 | 61.6 | 59.5 | NA | NA |
| 1 to 4 | 6.6 | 614 | 89.6 | 11,722 | 29.7 | 564 | 83.0 | 60.3 | 15.7 | 159 |
| 5 to 9 | 1.8 | 218 | 84.5 | 12,519 | 16.7 | 249 | 67.4 | 37.8 | 46.8 | 957 |
| 10 to 14 | 1.4 | 156 | 84.7 | 17,675 | 22.2 | 369 | 60.7 | 29.0 | 47.7 | 1,117 |
| 15 to 18 | 2.9 | 176 | 80.9 | 16,495 | 31.8 | 721 | 60.9 | 16.9 | 39.4 | 1,018 |
| Length of Medicaid Eligibility | ||||||||||
| 1 to 5 months | 3.4 | 1,331 | 48.7 | 8,921 | 9.0 | 444 | 28.8 | 17.2 | 6.7 | 377 |
| 6 to 11 months | 6.6 | 1,362 | 80.6 | 11,031 | 25.4 | 552 | 61.5 | 35.0 | 22.0 | 511 |
| 12 months | 3.5 | 268 | 91.5 | 15,341 | 27.5 | 463 | 75.9 | 41.4 | 43.6 | 844 |
| SSI Eligibility Status | ||||||||||
| SSI eligibility | 10.0 | 1,957 | 93.5 | 25,631 | 38.3 | 890 | 88.6 | 36.8 | 35.8 | 818 |
| No SSI eligibility | 4.0 | 446 | 84.5 | 14,218 | 24.8 | 468 | 67.5 | 37.5 | 35.4 | 775 |
| Type of Foster Care Assistance | ||||||||||
| Title IV-E Assistance | 4.4 | 534 | 86.7 | 13,923 | 25.3 | 467 | 70.3 | 41.8 | 35.7 | 752 |
| No Title IV-E Assistance | 3.5 | 368 | 81.0 | 15,393 | 24.7 | 493 | 63.7 | 29.9 | 34.8 | 820 |
| SOURCE: HCFA State Medicaid Research Files. NA = Not Applicable. (1) Dental visits are calculated for children age 4 and over. |
||||||||||
| Inpatient Care | Outpatient Provider Visits | Emergency Room Visits | Percent with a prescribed drug | Percent with a preventive visit | Dental Visits(1) | |||||
|---|---|---|---|---|---|---|---|---|---|---|
| Percent with a stay | Days per 1,000 children | Percent with a visit | Visits per 1,000 children | Percent with a visit | Visits per 1,000 children | Percent with a visit | Visits per 1,000 children | |||
| Total | 3.2 | 343 | 83.0 | 15,570 | 33.8 | 745 | 67.6 | 40.5 | 60.3 | 1,421 |
| Age | ||||||||||
| Less than 1 | 18.0 | 3,864 | 88.6 | 11,994 | 37.4 | 1,425 | 75.7 | 70.4 | NA | NA |
| 1 to 4 | 7.1 | 885 | 92.2 | 10,986 | 40.2 | 849 | 83.5 | 63.5 | 62.1 | 1,055 |
| 5 to 9 | 2.2 | 173 | 90.8 | 17,213 | 27.7 | 481 | 71.9 | 46.2 | 68.2 | 1,295 |
| 10 to 14 | 1.8 | 143 | 88.6 | 21,488 | 34.6 | 664 | 67.9 | 40.9 | 68.9 | 1,575 |
| 15 to 18 | 1.8 | 131 | 71.8 | 13,486 | 33.3 | 867 | 57.9 | 25.6 | 51.8 | 1,448 |
| Length of Medicaid Eligibility | ||||||||||
| 1 to 5 months | 1.1 | 305 | 37.5 | 5,832 | 9.6 | 490 | 22.7 | 12.7 | 15.3 | 896 |
| 6 to 11 months | 3.2 | 432 | 74.2 | 9,873 | 29.9 | 740 | 57.3 | 31.2 | 47.0 | 1,269 |
| 12 months | 3.5 | 329 | 91.8 | 16,961 | 38.4 | 756 | 76.8 | 46.9 | 70.6 | 1,469 |
| Type of Health Condition | ||||||||||
| No condition | 0.7 | 24 | 72.3 | 7,177 | 24.3 | 484 | 55.3 | 30.8 | 51.6 | 1,261 |
| Any condition | 6.8 | 737 | 98.2 | 25,950 | 47.4 | 1,068 | 85.1 | 54.3 | 73.1 | 1,621 |
| Physical condition only | 11.3 | 1,236 | 98.0 | 15,743 | 50.7 | 1,192 | 86.9 | 56.8 | 69.5 | 1,524 |
| Mental condition only | 0.7 | 46 | 97.8 | 30,719 | 37.5 | 725 | 78.6 | 48.6 | 73.6 | 1,652 |
| Both physical and mental conditions | 8.9 | 975 | 99.6 | 38,990 | 59.3 | 1,455 | 94.0 | 60.1 | 77.4 | 1,706 |
| SSI Eligibility Status | ||||||||||
| SSI eligibility | 8.7 | 1,727 | 95.7 | 33,760 | 56.1 | 1,368 | 88.0 | 57.7 | 68.5 | 1,540 |
| No SSI eligibility | 3.1 | 305 | 82.6 | 15,066 | 33.3 | 728 | 67.1 | 40.1 | 60.1 | 1,423 |
| Type of Foster Care Assistance | ||||||||||
| Title IV-E Assistance | 3.7 | 384 | 88.3 | 15,996 | 36.7 | 767 | 73.0 | 44.9 | 65.7 | 1,540 |
| No Title IV-E Assistance | 1.9 | 206 | 69.2 | 14,157 | 26.5 | 675 | 53.6 | 29.1 | 48.3 | 1,417 |
| SOURCE: HCFA State Medicaid Research Files. NA = Not Applicable. (1) Dental visits are calculated for children age 4 and over. |
||||||||||
a. Variations by Age
The relationship between age and health care utilization is far from consistent across the various measures of utilization. In general, inpatient use declined with age, although in California and Florida, inpatient rates rose in adolescence.(18) Like the general population of children (McCormick et al. 2000), infants had the highest rate of inpatient use.
The level of outpatient provider visits was highly variable across states. In general, the highest visit rates were among foster care children ages 10 to 14 and 15 to 18, but the number of visits per 1,000 in California was always well below that in the other two states. These data highlight the extensive health care needs of foster care children during the preteen and teenage years.
Patterns of emergency room utilization were more similar across states, with foster care children ages 1 to 4 and 15 to 18 having the highest rates in all three states. (This is consistent with national patterns as well.) Although one in three adolescents in foster care used emergency room services in 1994, the visit rates were highly variable across states: 1,019 visits per 1,000 adolescents in California, versus 721 per 1,000 in Florida, and 867 per 1,000 in Pennsylvania. Among preschool children, 30 to 40 percent had at least one emergency room visit and the number of visits ranged from 564 to 1,041 per 1,000. In general, foster care children in California, regardless of age, had higher levels of emergency room use than those in the other two states, perhaps compensating for the lower level of other provider visits in that state.
The next three measures of utilization prescribed drug use, preventive care, and dental care were highest among preschool children and declined with age. For preventive care, in particular, adolescents had the lowest level of use. One in four adolescents in California and Pennsylvania and only one in six in Florida had a preventive visit in 1994. Clearly, this does not conform to the CWLA/AAP standards, which recommend annual health exams for children in foster care (CWLA 1988; AAP 1994).
Utilization of mental health and substance abuse treatment services generally increased with age (Table III.18A, 18B, and 18C). This was particularly true for inpatient care, where admission rates were highest among those ages 10 to 14 and 15 to 18. The likelihood of an outpatient visit and the average number of outpatient visits per user also was highest in these two age groups, except in Pennsylvania, where children ages 5 to 9 had a higher level of use than the 15- to 18-year-olds. This might be a function of the greater emphasis in Pennsylvania on health screenings and assessments through the early and periodic screening, diagnosis, and treatment (EPSDT) program in Pennsylvania. (Section G discusses variations in expenditures for EPSDT services across states.)
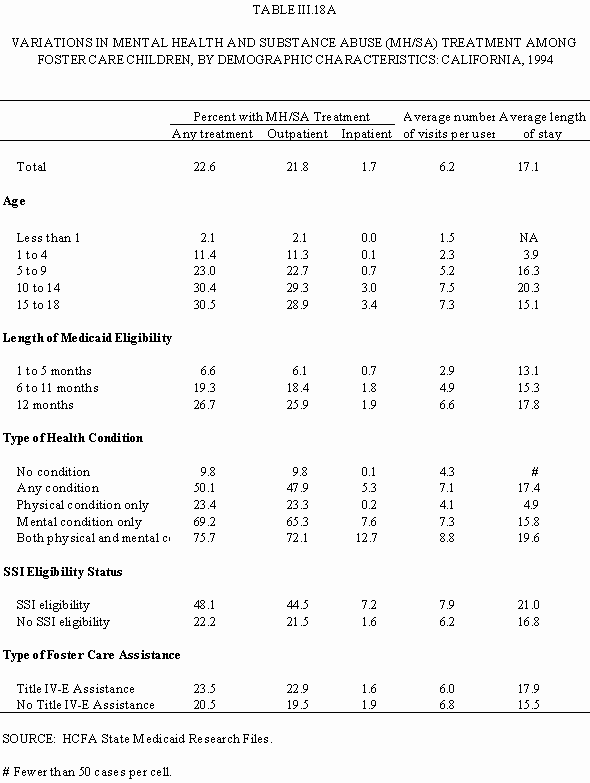

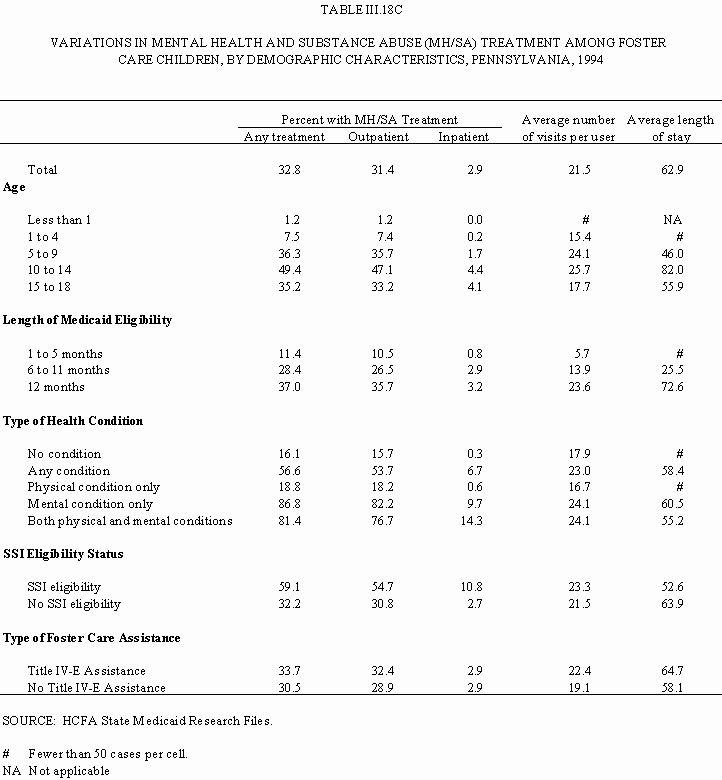
b. Variations by Length of Medicaid Eligibility
In general, health care utilization increased with length of Medicaid eligibility, such that foster care children enrolled for the full 12 months had higher levels of use than those who were enrolled for only part of the year. This was particularly true for provider visits, where the likelihood of a visit as well as the number of visits per 1,000 children was dramatically higher for those enrolled the full year. (The visit rate was adjusted for the number of months of coverage, to control statistically for the number of months of coverage.) As shown in Table III.17B, for example, 49 percent of foster care children in Florida who were enrolled 1 to 5 months had one or more provider visits, compared to 80 percent of those enrolled 6 to 11 months, and 92 percent of those enrolled the full year. Likewise, the number of visits ranged from 8,900 per 1,000 (1 to 5 months of enrollment) to 15,300 per 1,000 (12 months of enrollment). Similar disparities were observed for utilization of preventive care, dental care, and use of prescribed drugs. For example, 23 percent of foster care children in Pennsylvania who were enrolled 1 to 5 months had a prescribed drug in 1994, versus 57 percent of those enrolled 6 to 11 months, and 77 percent of those enrolled all 12 months (Table III.17C).
The one exception to this pattern was the use of inpatient services, where children enrolled the full year tended to have lower levels of inpatient use than those enrolled part of the year. As an example, foster care children in California who were enrolled the full year had one-third fewer days per 1,000 than those enrolled part of the year (Table III.17A). One possible explanation is that hospitalization may be the direct cause or immediate consequence of foster care placement, resulting in higher hospitalization rates at the beginning of the foster care placement.(19) Indeed, children with no Medicaid coverage prior to their foster care placement had nearly a threefold higher likelihood of being hospitalized within two months of placement than those who had been enrolled in Medicaid prior to placement. This is discussed below in the analysis of patterns of use before and after foster care placement.
As shown in Tables III.18A, 18B, and 18C, the likelihood of mental health or substance abuse treatment was dramatically higher among foster care children enrolled the full year. Similarly, the number of visits per user and average length of stay was longer among those enrolled the full year. This could signify a lag in initiating a treatment plan for children newly placed in foster care, or it could reflect case mix differences. (As was shown on Table III.14, foster care children enrolled the full year were more likely to have mental conditions either alone or in combination with physical conditions than children enrolled part of the year.) In any event, such disparities raise concerns that the clinical needs of children in foster care are not being met during the early stages of placement. At a minimum, prevention and evaluation services are recommended to ease the transition into foster care and to identify emotional and behavioral problems (Schneiderman et al. 1998).
c. Variations by Type of Health Condition
As might be expected, foster care children with none of the specified CDPS conditions had lower levels of utilization than those with one or more conditions. This relationship held for all of the utilization measures shown in Tables III.17A, 17B, and 17C and III.18A, 18B, 18C. The observed differentials especially for inpatient care, outpatient provider visits, emergency room visits, and prescribed drugs are consistent with the higher medical needs among those with one or more chronic conditions. Nevertheless, the lower levels of use of preventive care and dental care among children with no chronic or disabling conditions suggest that these children are not receiving the recommended routine care (CWLA 1988; AAP 1994). It is likely that this group of children is less connected to the health care system, and therefore less likely to receive routine care. Indeed, it is possible that some of these children have undiagnosed conditions due to infrequent contact with the health care system. This group of children should be the target of outreach to ensure that they are receiving the necessary preventive care, and that physical or mental health conditions are being diagnosed and treated.
Virtually all foster care children with a CDPS condition had one or more provider contacts during 1994; the likelihood of a visit exceeded 90 percent across all three groups of children with a CDPS condition. Nevertheless, we observed substantial differentials in utilization patterns among those with a CDPS condition. For example, children with physical conditions only had the highest inpatient rates, while those with both physical and mental conditions had by far the highest provider visit rates. In general, those with mental conditions only had the lowest levels of inpatient care, emergency room services, prescribed drugs, and preventive care. Additionally, those with physical conditions only were least likely to receive dental care. Disparities across groups do not automatically signify that certain groups of foster care children are underutilizing services or that other groups are overutilizing services. Nevertheless, lower levels of preventive and dental care among certain children suggests a barrier to obtaining routine care.
As expected, children with mental conditions either alone or in combination with physical conditions were the most likely to receive mental health or substance abuse services (Tables III.18A-C). In California, for example, 69 percent of those with a mental condition only and 76 percent of those with both mental and physical conditions versus only 23 percent of those with a physical condition only received at least one mental health or substance abuse service. Children with both mental and physical conditions had by far the highest rate of inpatient mental health/substance abuse treatment. While these comparisons make intuitive sense, they nevertheless raise two questions: First, are certain children with mental health or substance abuse conditions falling through the cracks and not receiving mental health or substance abuse treatment? And second, are children with physical conditions receiving adequate mental health services following their transition to foster care?
d. Variations by SSI Eligibility Status
Next, we compared utilization patterns between children who were and were not eligible for SSI. Foster care children who are also eligible for SSI are expected to be more vulnerable than those who are not eligible for SSI benefits.(20) Foster care children who were also eligible for SSI had higher utilization across the board than those who were not eligible for SSI (Tables III.17A-C). This pattern held for mental health and substance abuse services as well (Table III.18A-C). Across all three states, the number of provider visits per 1,000 foster care children on SSI was double that of children not on SSI, while the number of inpatient days per 1,000 was four to seven times higher among foster care children receiving SSI benefits. In general, preventive and dental use also was higher among the foster care children receiving SSI (except in Florida). This differential in the use of well child care may be a result of the connectedness of SSI children to the health care system due to their higher health care needs.
e. Variations by Title IV-E Status
In general, foster care children whose Medicaid eligibility was through Title IV-E had higher levels of utilization, although patterns varied slightly across states. One consistent finding is that Title IV-E foster care children had higher levels of preventive care. In addition, although the likelihood of a provider contact was higher among Title IV-E children, the number of visits per 1,000 tended to be quite similar between the two groups of children. It is not clear why we observed such differences but they are likely to be a function of underlying case mix variations. (As was shown in Table III.14, Title IV-E children were more likely than non-Title-IV-E children to have physical conditions.) Patterns of mental health and substance abuse treatment were fairly similar between the two groups, except in Florida, where non-Title IV-E children were more likely than Title IV-E children to receive treatment.
4. Analysis of Utilization Before and After Foster Care Placement
In addition to looking at annual utilization patterns, we explored patterns of use before and after foster care placement. There is considerable concern among policymakers that children do not receive adequate care once they are placed in a foster care setting. Health care needs are often overlooked, accurate health history information is often not available, and caseworkers may not understand the Medicaid system (Rawlings-Sekunda 1999).
The CWLA developed a set of guidelines for health services for children in foster care (CWLA 1988).(21) According to these guidelines, children in foster care should receive the following screening, assessment, and treatment services:
- Immediate health screening. This should be performed prior to placement, if possible, or within 24 hours after placement to identify health problems that may affect placement or that require immediate attention. The evaluation should include a comprehensive health, nutrition, and developmental assessment; complete physical examination; screening for vision, hearing, and dental status; and a mental health screening.
- Comprehensive health assessment. This should be performed within 30 days of placement. The assessment should include tests for anemia, tuberculosis, and developmental delays, as well as a complete blood count and urinalysis. Tests for sickle cell anemia, lead poisoning, HIV infections, hepatitis B, and other communicable diseases should be performed as needed. Immunizations and medications should be provided as necessary. A dental examination should be performed.
- Comprehensive mental health assessment. This should be performed within 30 days of placement by a qualified mental health practitioner.
- Ongoing primary care. This should include preventive care, following the AAP periodicity schedule or the state Medicaid agency's EPSDT schedule.
- Mental health services. These services should be made available to all children in placement, and should include psychiatric services and psychological testing.
- Specialized health services. These services include 24-hour emergency care, referrals for specialized health consultations, and other specialized services, including services for learning disabilities, hearing or vision impairment, orthodontia, plastic surgery, and speech and language problems.
- Transportation services. These services should ensure access to health care.
- Case management services. These services should facilitate continuity and coordination of care.
We analyzed how frequently children placed in foster care received these services, and whether the likelihood of that happening varied depending on whether the child had Medicaid coverage through another eligibility category at the time of placement.
To conduct this analysis, we identified a subset of children who were placed in foster care from January through October 1995 (1994 in Pennsylvania), who had no other period of foster care eligibility in the previous 12 months, and who remained enrolled in Medicaid for two months following the month of initial foster care eligibility. The number of children included in this analysis, including the percent with prior Medicaid coverage, was as follows:
| State | Number of Children Included in Analysis |
Percent with Prior Medicaid Eligibility |
|---|---|---|
| California | 24,983 | 54.7 |
| Florida | 3,512 | 71.7 |
| Pennsylvania | 7,190 | 68.6 |
To assess whether children received health care services on a timely basis in accordance with the CWLA guidelines we examined utilization during the post-placement periods. We recognized, however, that states may lag in designating foster care as the reason for eligibility for those children who were already enrolled in Medicaid. Therefore, we also included a two-month window for utilization prior to the designation of foster care eligibility. We created "windows" for analyzing utilization one and two months prior to foster care eligibility (for those with prior Medicaid coverage), during the month of initial foster care eligibility, and during the two months following. The CWLA guidelines stipulate windows for receipt of certain services, for example, within 24 hours or 30 days of placement. Because the SMRF file indicates only the month in which eligibility began, we were required to use broad windows to examine utilization patterns.
Tables III.19A, 19B, and 19C present the results of this analysis. The tables show, for each measure, the utilization patterns before and after foster care placement. The two pre-placement windows include those children with prior Medicaid eligibility and are designed to be cumulative, showing the percent of children with utilization in the two months prior to placement (as reflected in the Medicaid eligibility record) and then the subset of those who had use in the one month prior to placement. In the post-placement period, we show the percent with use during the month that placement began, and the cumulative effect over time (that is, one and two months after the initial placement). As an example, in California, about one-third of the children had a provider visit during the month foster care eligibility began; two full months after the foster care placement, 54 percent of those with prior Medicaid coverage, but 60 percent of those with no prior Medicaid coverage had at least one visit (Table III.19A). The average number of visits per user was similar between the two groups during the post-placement period.
The use of inpatient care in the pre- and post-placement period varied across the three states (Tables III.19A-C). In California and Florida, foster care children with no prior Medicaid coverage were more likely to be hospitalized during the month of placement, compared to foster care children with prior coverage. The differential persisted over the two-month post-placement period. As mentioned earlier, hospitalization is often the impetus for obtaining Medicaid coverage.
| Utilization Measure | Utilization Before Foster Care Eligibility Began | Utilization After Foster Care Eligibility Began | |||
|---|---|---|---|---|---|
| Within Two Months Before | Within One Month Before | During Month Eligibility Began | Within One Month After | Within Two Months After | |
| Percent with an inpatient stay | |||||
| Medicaid coverage before FC placement | 1.3 | 0.6 | 0.7 | 1.0 | 1.3 |
| No Medicaid coverage before FC placement | - | - | 1.5 | 2.5 | 3.2 |
| Percent with a provider visit | |||||
| Medicaid coverage before FC placement | 39.2 | 28.8 | 32.7 | 46.3 | 53.7 |
| No Medicaid coverage before FC placement | - | - | 31.1 | 51.0 | 60.4 |
| Average number of visits per user | |||||
| Medicaid coverage before FC placement | 2.4 | 1.9 | 1.9 | 2.7 | 3.3 |
| No Medicaid coverage before FC placement | - | - | 1.8 | 2.6 | 3.4 |
| Percent with a preventive visit | |||||
| Medicaid coverage before FC placement | 15.6 | 9.5 | 10.0 | 18.2 | 23.7 |
| No Medicaid coverage before FC placement | - | - | 12.3 | 24.2 | 33.0 |
| Percent with an emergency room visit | |||||
| Medicaid coverage before FC placement | 13.4 | 8.0 | 7.6 | 11.8 | 15.5 |
| No Medicaid coverage before FC placement | - | - | 4.2 | 10.6 | 15.5 |
| Percent with a dental visit | |||||
| Medicaid coverage before FC placement | 9.1 | 5.9 | 8.3 | 16.0 | 21.0 |
| No Medicaid coverage before FC placement | - | - | 6.0 | 11.4 | 15.6 |
| Percent with a mental health/substance abuse service | |||||
| Medicaid coverage before FC placement | 5.9 | 4.1 | 6.3 | 10.1 | 12.8 |
| No Medicaid coverage before FC placement | - | - | 4.6 | 10.4 | 14.3 |
| Percent with case management service | |||||
| Medicaid coverage before FC placement | # | # | # | # | # |
| No Medicaid coverage before FC placement | - | - | 0.0 | # | # |
| Percent with transportation service | |||||
| Medicaid coverage before FC placement | 0.9 | 0.4 | 0.4 | 0.7 | 0.8 |
| No Medicaid coverage before FC placement | - | - | 0.0 | # | # |
| Percent with lab/x-ray service | |||||
| Medicaid coverage before FC placement | 15.8 | 9.9 | 11.5 | 18.3 | 22.8 |
| No Medicaid coverage before FC placement | - | - | 11.0 | 20.3 | 26.7 |
| Source: HCFA State Medicaid Research Files. Note: Numbers may not sum to total due to rounding. # Less than 0.05. |
|||||
| Utilization Measure | Utilization Before Foster Care Eligibility Began | Utilization After Foster Care Eligibility Began | |||
|---|---|---|---|---|---|
| Within Two Months Before | Within One Month Before | During Month Eligibility Began | Within One Month After | Within Two Months After | |
| Percent with an inpatient stay | |||||
| Medicaid coverage before FC placement | 1.9 | 0.9 | 0.4 | 0.6 | 0.8 |
| No Medicaid coverage before FC placement | - | - | 1.0 | 1.5 | 2.0 |
| Percent with a provider visit | |||||
| Medicaid coverage before FC placement | 39.7 | 27.2 | 25.4 | 33.9 | 39.6 |
| No Medicaid coverage before FC placement | - | - | 23.0 | 37.0 | 44.1 |
| Average number of visits per user | |||||
| Medicaid coverage before FC placement | 2.7 | 2.1 | 2.0 | 2.7 | 3.3 |
| No Medicaid coverage before FC placement | - | - | 1.4 | 2.2 | 2.8 |
| Percent with a preventive visit | |||||
| Medicaid coverage before FC placement | 17.5 | 9.2 | 7.2 | 11.6 | 14.5 |
| No Medicaid coverage before FC placement | - | - | 11.8 | 17.7 | 20.6 |
| Percent with an emergency room visit | |||||
| Medicaid coverage before FC placement | 6.5 | 3.2 | 2.5 | 4.3 | 6.0 |
| No Medicaid coverage before FC placement | - | - | 2.2 | 5.0 | 8.0 |
| Percent with a dental visit | |||||
| Medicaid coverage before FC placement | 5.4 | 3.4 | 3.7 | 6.3 | 8.9 |
| No Medicaid coverage before FC placement | - | - | 1.0 | 3.9 | 7.4 |
| Percent with a mental health/substance abuse service | |||||
| Medicaid coverage before FC placement | 4.1 | 2.6 | 2.2 | 2.7 | 3.1 |
| No Medicaid coverage before FC placement | - | - | 0.7 | 1.5 | 2.2 |
| Percent with case management service | |||||
| Medicaid coverage before FC placement | 14.3 | 12.0 | 12.0 | 15.4 | 18.0 |
| No Medicaid coverage before FC placement | - | - | 4.8 | 8.7 | 10.8 |
| Percent with transportation service | |||||
| Medicaid coverage before FC placement | # | 0.0 | # | 0.1 | 0.1 |
| No Medicaid coverage before FC placement | - | - | 0.0 | 0.1 | 0.1 |
| Percent with lab/x-ray service | |||||
| Medicaid coverage before FC placement | 18.5 | 10.4 | 8.9 | 14.4 | 19.1 |
| No Medicaid coverage before FC placement | - | - | 13.8 | 21.6 | 26.0 |
| Source: HCFA State Medicaid Research Files. Note: Numbers may not sum to total due to rounding. # Less than 0.05. |
|||||
| Utilization Measure | Utilization Before Foster Care Eligibility Began | Utilization After Foster Care Eligibility Began | |||
|---|---|---|---|---|---|
| Within Two Months Before | Within One Month Before | During Month Eligibility Began | Within One Month After | Within Two Months After | |
| Percent with an inpatient stay | |||||
| Medicaid coverage before FC placement | 2.0 | 1.4 | 0.4 | 0.8 | 1.1 |
| No Medicaid coverage before FC placement | - | - | 0.4 | 0.9 | 1.2 |
| Percent with a provider visit | |||||
| Medicaid coverage before FC placement | 36.2 | 28.7 | 33.6 | 45.2 | 50.9 |
| No Medicaid coverage before FC placement | - | - | 20.1 | 39.1 | 51.2 |
| Average number of visits per user | |||||
| Medicaid coverage before FC placement | 3.8 | 2.7 | 2.8 | 4.3 | 5.9 |
| No Medicaid coverage before FC placement | - | - | 1.8 | 2.8 | 3.8 |
| Percent with a preventive visit | |||||
| Medicaid coverage before FC placement | 10.8 | 8.4 | 10.7 | 16.7 | 20.4 |
| No Medicaid coverage before FC placement | - | - | 5.5 | 12.9 | 19.4 |
| Percent with an emergency room visit | |||||
| Medicaid coverage before FC placement | 13.3 | 7.9 | 5.6 | 8.8 | 11.8 |
| No Medicaid coverage before FC placement | - | - | 2.9 | 6.3 | 9.6 |
| Percent with a dental visit | |||||
| Medicaid coverage before FC placement | 6.9 | 5.1 | 9.5 | 17.3 | 22.6 |
| No Medicaid coverage before FC placement | - | - | 2.8 | 10.5 | 19.6 |
| Percent with a mental health/substance abuse service | |||||
| Medicaid coverage before FC placement | 11.7 | 9.0 | 9.3 | 12.7 | 15.4 |
| No Medicaid coverage before FC placement | - | - | 7.4 | 12.7 | 17.0 |
| Percent with case management service | |||||
| Medicaid coverage before FC placement | 0.0 | 0.0 | 0.0 | 0.0 | 0.0 |
| No Medicaid coverage before FC placement | - | - | 0.0 | 0.0 | 0.0 |
| Percent with transportation service | |||||
| Medicaid coverage before FC placement | 1.4 | 0.9 | 0.5 | 0.6 | 1.1 |
| No Medicaid coverage before FC placement | - | - | 0.3 | 0.5 | 0.7 |
| Percent with lab/x-ray service | |||||
| Medicaid coverage before FC placement | 15.0 | 10.2 | 11.3 | 16.7 | 21.9 |
| No Medicaid coverage before FC placement | - | - | 8.2 | 16.3 | 20.9 |
| Source: HCFA State Medicaid Research Files. Note: Numbers may not sum to total due to rounding. # Less than 0.05. |
|||||
We would expect almost all children to have had at least one Medicaid-paid provider visit within the two months following foster care placement. (22) This was not the case, however. The highest rates were observed in California, with 54 to 60 percent having a visit, followed by Pennsylvania (51 percent), and lastly, Florida (40 to 44 percent). Only about one-fifth to one-third had a visit during the month of foster care placement. The average number of visits, among those with at least one visit, ranged from 2.8 to 5.9 by two months post-placement. Interestingly, foster care children in California had the highest likelihood of a provider visit within the first two months of placement, despite overall lower levels of utilization on an annual basis (recall Table III.15). The rate of preventive care which includes health screenings and assessments was less than 10 percent during the month of foster care placement. Interestingly, however, the rates in California and Florida were higher among those children with no prior coverage than among those with previous Medicaid coverage, suggesting that providers were more likely to perform assessments on those who were newly enrolled. However, combining the five-month window surrounding the foster care placement for those with prior Medicaid coverage, eliminates the difference, with 35 percent of children having a preventive visit during that period (data not shown). What is not clear is whether some children receive the assessments in the pre-placement period, which is recommended, or whether the dates of placement on the eligibility files are incorrect so that some of the utilization appearing on the claims file before placement is actually occurring after placement. What is clear from these data is that few children were receiving comprehensive assessments reimbursed by Medicaid within the two-month post-placement period.
Although the CWLA guidelines suggest that laboratory tests and x-rays should be performed during the initial assessments, only 20 to 27 of children percent of children had such a claim during the two-month post-placement period. It is possible that such tests were performed in public health clinics and not billed to Medicaid, but this cannot be determined from the available data.
Mental health services were provided to relatively few children following a foster care placement. Only about one in six children received such services in California and Pennsylvania, and only 2 to 3 percent in Florida. It is possible that these services were being provided through the state mental health system and not reimbursed by Medicaid during the initial placement period, but nevertheless, the rates are quite a bit lower than would be expected. It is also possible that evaluations of mental health status were performed in conjunction with a general preventive exam, rather than through a separate mental health evaluation. Dental visit rates were uniformly higher than visits for mental health and substance abuse related services.
The CWLA guidelines mention the need for specialized health services, including 24-hour emergency treatment. In California and Florida, patterns of emergency room use following placement were similar between children with and without prior Medicaid coverage, whereas in Pennsylvania, children with prior Medicaid coverage were slightly more likely to use the emergency room than those with no prior coverage.
Certain services recommended in the CWLA guidelines, especially case management and transportation, were never or only rarely paid for by Medicaid. Case management services were paid through Medicaid only in Florida, with 11 to 18 percent receiving these services in the two-month, post-placement period. Interestingly, those with prior Medicaid coverage were more likely to receive such services through Medicaid, perhaps because they were already linked to a case manager through another program. Transportation services were almost never paid for by Medicaid. That is not to say that families were not receiving these services through another system (such as child welfare), but Medicaid was not the reimbursement mechanism.
The primary observation from this analysis is that few children were receiving services that conform to the CWLA guidelines (to the extent that we have been able to operationalize the standards using claims data). The CWLA guidelines were published in 1988 and these data are from 1994. It seems clear that foster care children were not receiving services at the level envisioned by the guidelines. What cannot be discerned without more recent data is whether the situation has improved in the six years since this study period. Further analysis of more recent claims data would be required. Analysis of medical records also would be desirable, to overcome the coding limitations of administrative data (such as uncertainties concerning the initial date of the foster care placement, limited information on types of health screenings and assessments, and lack of data on referrals for specialty care). Such an analysis would also reveal whether children were receiving services prior to Medicaid coverage or through systems of care not reimbursed by Medicaid (such as public health, mental health, schools, or child welfare).
Level of Medicaid Expenditures
The previous two sections have shown considerable differences across the Medicaid eligibility groups in the frequency of health conditions and patterns of utilization. We now turn to an analysis of Medicaid expenditure patterns. We developed a variety of measures to characterize Medicaid spending, including average monthly spending by eligibility group and distribution of spending by type of service.
Expenditures varied widely not only across states, but also within states among Medicaid eligibility groups. Across all Medicaid eligibility groups combined, average monthly expenditures ranged twofold from $76 in California to $133 and $158 in Pennsylvania and Florida, respectively (Tables III.20A-C and Figure III.9). The range was even wider across states for the foster care population, ranging from $154 in California to $375 in Florida, with Pennsylvania averaging $293. California was consistently lower in average monthly Medicaid expenditures for all groups. As we saw in the previous section, this is consistent with the lower levels of utilization in California relative to the other two states.
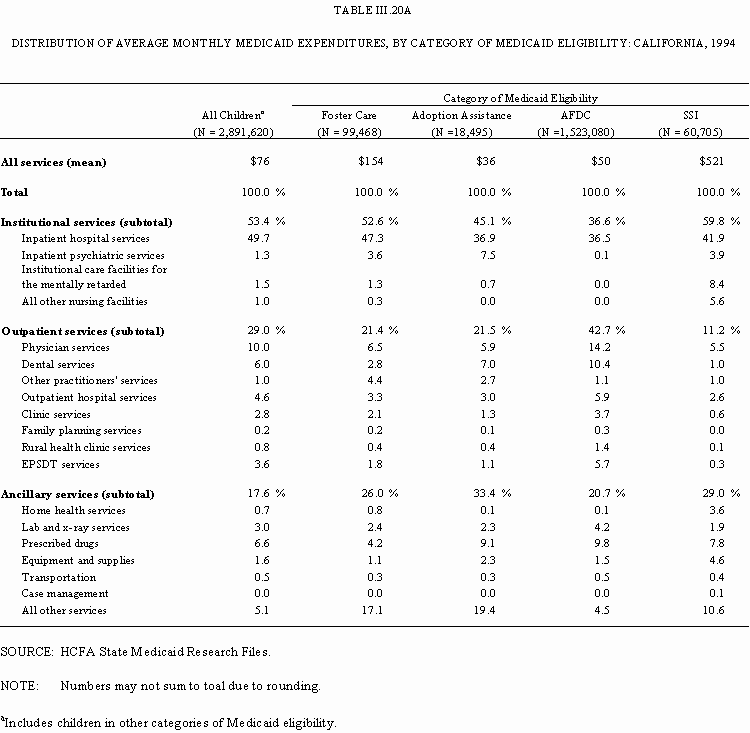
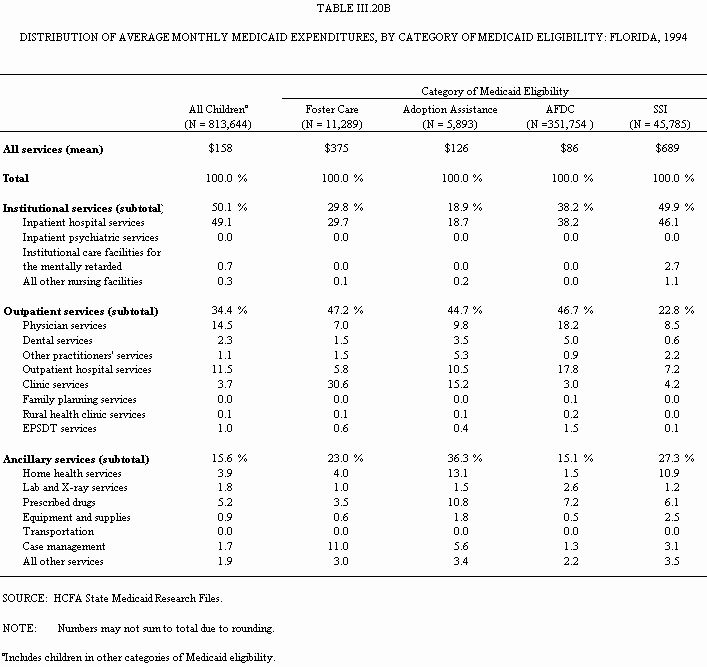
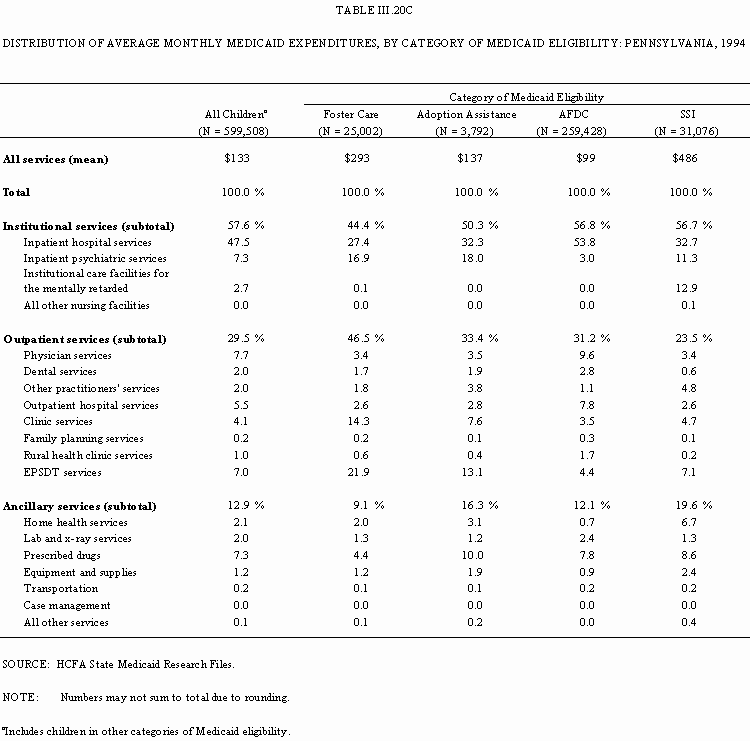
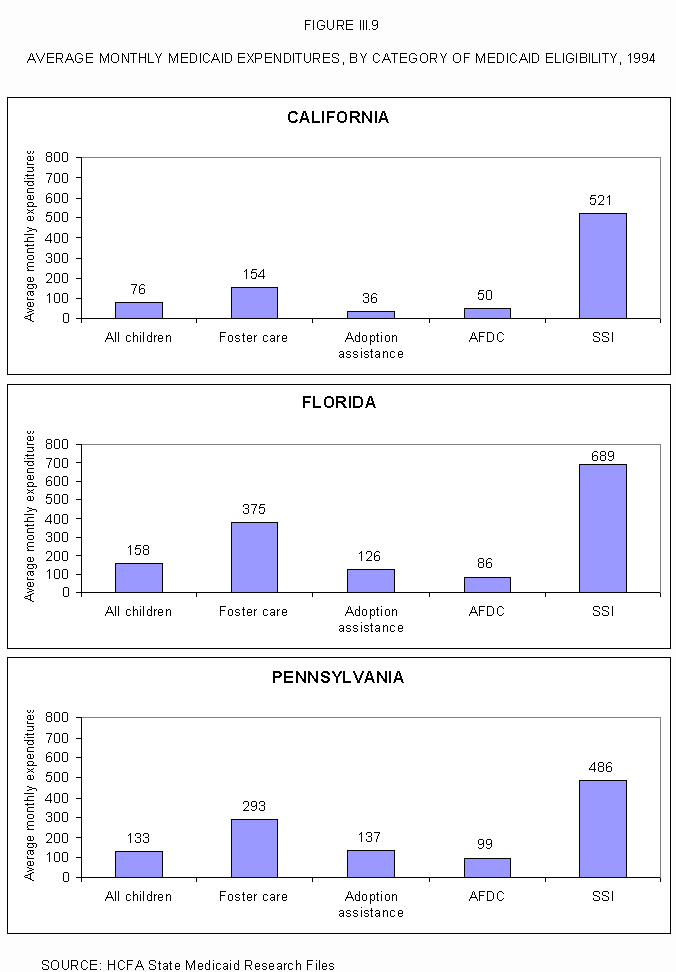
We caution against making direct comparisons in absolute spending levels because we did not adjust for differences in Medicaid payment rates across states. Colby (1993) found wide variations in Medicaid physician fees, which would affect comparisons of expenditures across states, even if utilization patterns were equivalent. As a result, we tend to focus on relative distributions of expenditures (such as the percent of total), rather than absolute differences (that is, the total per se). Appendix B contains detailed expenditure tables on average monthly expenditures by type of service that correspond to the distributions discussed in this section.
1. Variations by Category of Medicaid Eligibility
How do average Medicaid expenditures vary by category of Medicaid eligibility? Foster care children, in general, had average monthly Medicaid expenditures that were two or more times higher than the average for all Medicaid children (Figure III.10). In addition, their expenditures were higher than the adoption assistance and AFDC children, but considerably lower than the SSI children (Tables III.20A-C). Children receiving SSI benefits had average monthly Medicaid expenditures that were one and one-half to more than three times the level of those in foster care.
This pattern also is reflected (and is somewhat more dramatic) at the extremes, that is, when comparing the top 10 percent of spenders in each eligibility group (Table III.21). Each decile represents 10 percent of children, ranked from lowest to highest in their total Medicaid expenditures. For example, average spending in the top decile was $11,319 for foster care children in California versus $44,583 for SSI children.
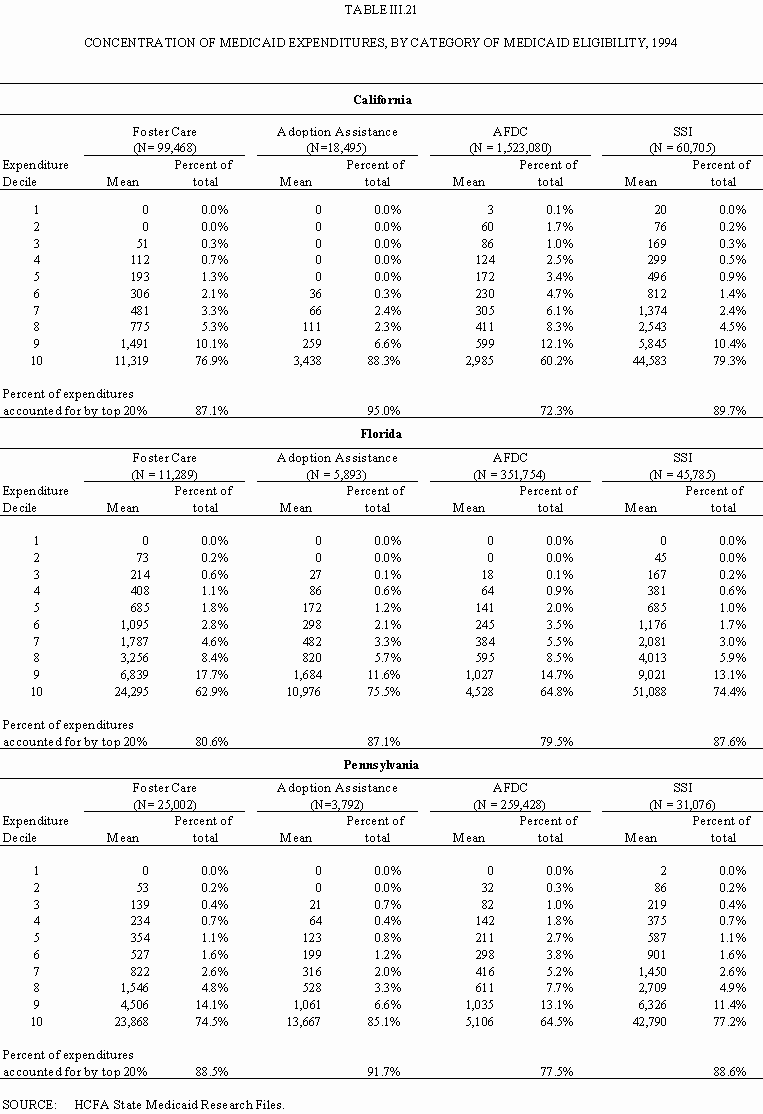
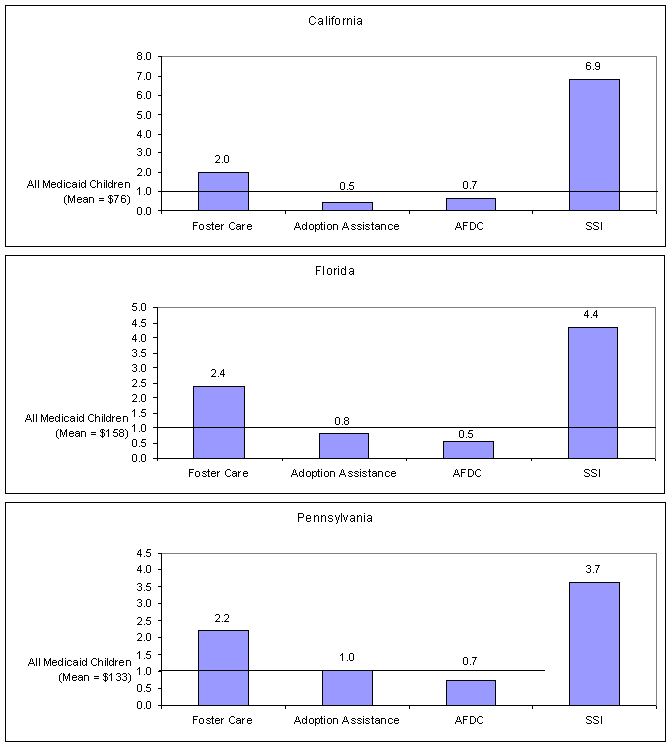
Source: HCFA State Medicaid Research Files.
Note: The ratio reflects average monthly Medicaid expenditures for each Medicaid eligibility group in relation to the average for all Medicaid children.
On the other hand, average monthly Medicaid expenditures for children receiving adoption assistance were one-fourth to one-half lower than those for children in foster care. The lower expenditures among children receiving adoption assistance may in part be a function of case mix differences (recall the differences in chronic illness and disability reported in Table III.9). Another possible explanation is the role that Medicaid may play as the payer of last resort. To the extent that adoptive families have other third-party coverage that serves as the payer of first resort, Medicaid would then pay for services that either are not covered or for which benefit limits have been exhausted. As shown in Table III.21, we see that a substantial proportion of children receiving adoption assistance had no Medicaid expenditures during the year (especially in California). Thus, most of the expenditures (88 percent) were concentrated in only 10 percent of the adopted children in California. A high level of concentration in the adoption assistance group is also observed in the other two states, with 76 to 85 percent of the expenditures clustered among the top 10 percent of children.
Among AFDC children, we see a different pattern of expenditures. In two of the three states, AFDC children had the lowest expenditures of any group, averaging $50 to $100 per month. The AFDC group also had the lowest concentration of expenditures, as reflected by the percent of total expenditures accounted for by the top 20 percent of children. This reflects a tendency for a large number of AFDC children to have a small amount of spending.
2. Variations by Type of Service
In addition to observing differences in the relative levels of spending and the concentration of expenditures, we also found differences in the distribution by major type of service. As shown in Tables III.20A-C and Figure III.11, institutional-based services such as those provided in inpatient hospital settings, psychiatric hospitals, and intermediate care facilities for the mentally retarded (ICF-MR) accounted for 30 to 53 percent of expenditures for the foster care population. The SSI population typically exceeded the foster care population in the share of expenditures attributable to institutional care (50 to 60 percent), due in part to a disproportionate share of spending for ICF-MR services. This is not surprising, given the disproportionate share of the SSI population with MR/DD diagnoses (recall Table III.10).
Otherwise, most of the institutional facility expenditures were for general inpatient hospital services, with one exception. The higher share of spending in Pennsylvania for inpatient psychiatric services is largely attributable to family-based rehabilitation services, which are essentially community support services that include therapeutic, social support, and respite services (Table III.20C).(23) These services averaged $49 per month for foster care children, $25 for adoption assistance children, $3 for AFDC children, and $55 for SSI children. The most common diagnoses among foster care children using these services were attention deficit hyperactivity disorder (ADHD), oppositional disorder, and adjustment reaction. There were no expenditures in this category in Florida, and only minimal expenditures in California.
In both Florida and Pennsylvania, in contrast to California, outpatient services accounted for a higher proportion of spending for foster care children, although the patterns differed in these two states. In Florida, clinic services accounted for the majority of outpatient spending ($115 on average per month in the foster care population), 99 percent of this amount was for mental health clinic services. The top three procedures (which accounted for 50 percent of clinic service spending) included home and community based rehabilitation services, intensive therapeutic onsite services, and individual psychiatric therapy. In Pennsylvania, EPSDT and clinic services combined accounted for the majority of outpatient spending for foster care children. Clinic services included psychiatric partial hospitalization and psychotherapy (individual, group, and family). EPSDT services included both health screens and follow-up therapy (such as physical therapy and occupational therapy).
Figure III.11
Distribution of Average Monthly Medicaid Expenditures, by Type of Service, 1994.
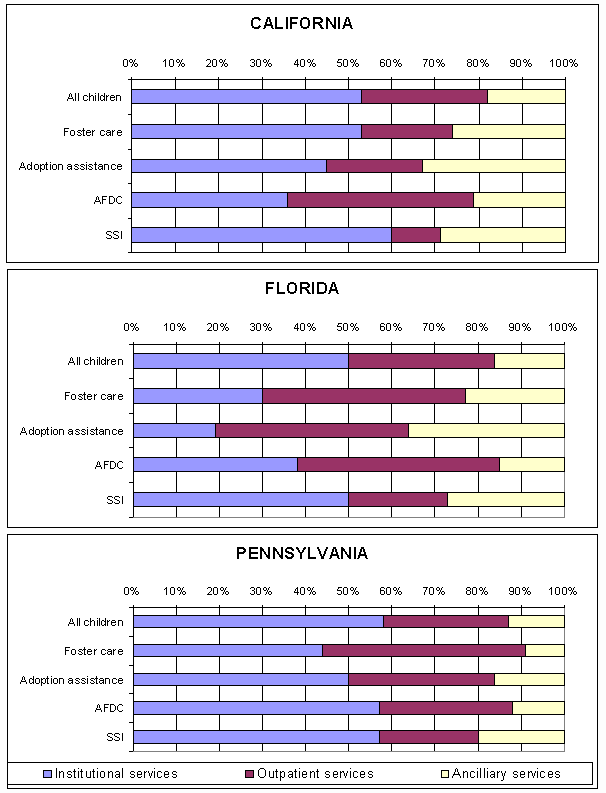
Expenditures for ancillary services such as home health, lab and x-ray, prescribed drugs, equipment and supplies, transportation, and case management were always highest in the SSI population due to their complex needs, but second-highest in the foster care population. (See Appendix Tables B.1A through B.1C for actual expenditures for ancillary services.) There were state-level differences in the most common types of service. In California, "all other services," which was comprised primarily of mental health services, dominated spending, especially for foster care and adoption assistance children. In Florida, case management was the dominant category in the foster care population (averaging $41 per month). Services were provided to many different populations, with 59 percent of case management expenditures for children with chronic mental illness, another 30 percent for children with medical disabilities, 8 percent for children with developmental disabilities, and 3 percent for AIDS waiver clients. Neither California nor Pennsylvania utilized Medicaid funds for case management services for the foster care population. None of the states relied on Medicaid funds to support transportation services that would enable foster care families to obtain nonemergency services.
3. Variations Within the Foster Care Population
a. Variations by Age
As shown in Tables III.22A-C, infants in foster care had by far the highest average monthly expenditures, driven primarily by high inpatient costs. Foster care children between the ages of 10 and 18 usually had the next highest expenditures, although as before, we observed differences across states in the distribution by type of service, due in part to differences in coding practices (particularly for mental health services). For example, about one-fourth of spending for school-age children (ages 5 to 18) in California was for "all other services," largely mental health services. In Florida, 40 to 46 percent was for clinic services, which too, were mostly mental health services, and another 13 to 16 percent was for case management services, primarily for children with serious emotional disturbance. In Pennsylvania, 40 to 45 percent was for family-based rehabilitation services or for EPSDT early intervention services.
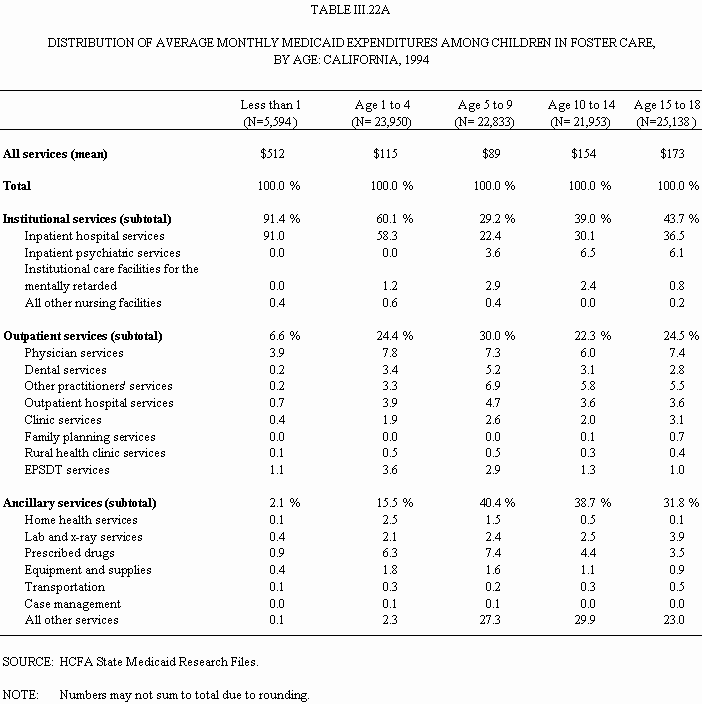
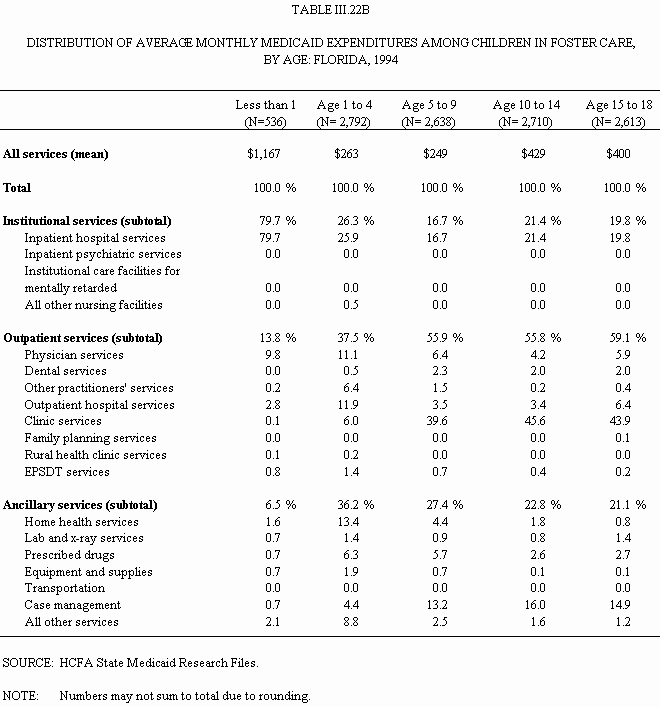
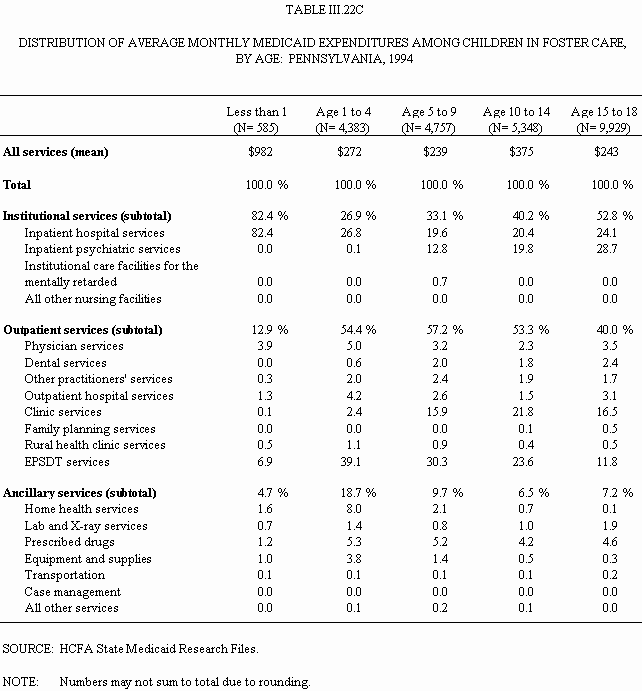
As a rule, EPSDT expenditures were concentrated in the preschool population, although the share varied dramatically across states, from a low of 1.4 percent ($3.68 per month) in Florida and 3.6 percent ($4.14) in California to a high of 39.1 percent ($106) in Pennsylvania. States vary in their implementation of EPSDT for children in foster care (English and Freundlich 1997), and it would appear that Pennsylvania has utilized this mechanism more than the other two states. Florida spent one of every seven dollars on home health services for preschool-age foster care children, including personal care by a home health aide, nursing services by a registered nurse, and private duty nursing by a licensed practical nurse.
b. Variations by Length of Medicaid Eligibility
Although this analysis implicitly controls for length of Medicaid eligibility by presenting average monthly expenditures, we examined whether there were differences in monthly spending levels by length of enrollment. On one hand, shorter periods of eligibility could be associated with higher expenditures if a child received intensive services during a brief period of eligibility. On the other hand, longer periods of eligibility could be associated with higher expenditures if children with full-year coverage were sicker and had more complex health care needs throughout the year. Interestingly, we do not see a consistent pattern across states (Table III.23). In California, average expenditures decreased as length of eligibility increased, while in Pennsylvania, just the opposite was true. In Florida, there was little difference among the three groups.
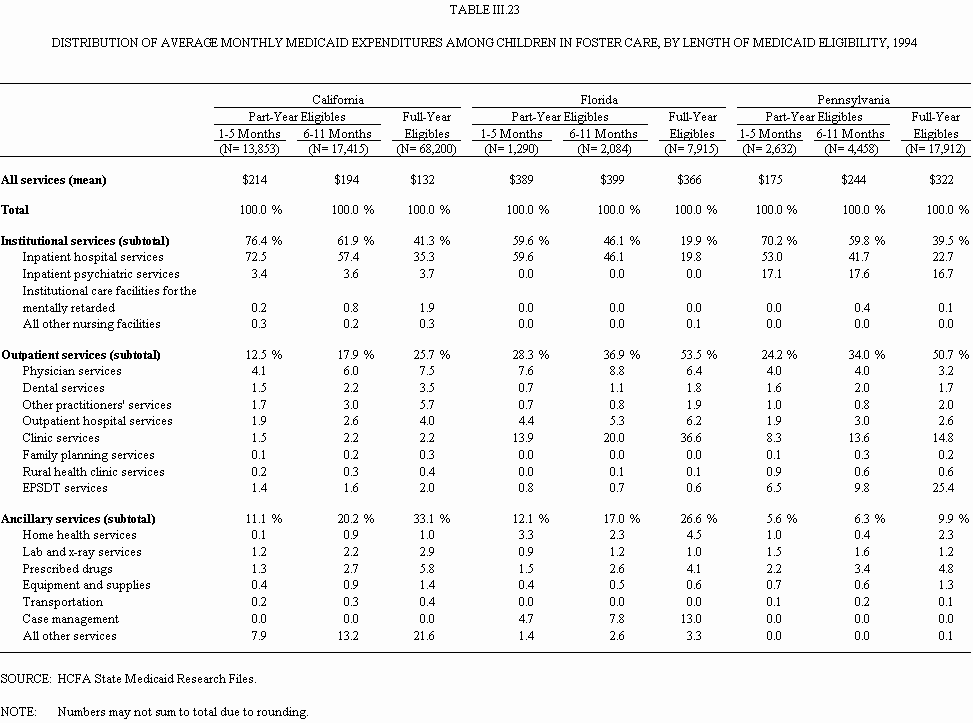
One pattern that is consistent across states is the higher share of expenditures devoted to institutional based care among foster care children with only 1 to 5 months of eligibility (76 percent in California; 60 percent in Florida; and 70 percent in Pennsylvania). This result is also consistent with the analysis of utilization patterns before and after foster care placement in which we found that children with no prior Medicaid coverage had higher rates of hospitalization immediately following placement. In contrast, children with full-year eligibility tended to have a higher share of expenditures for outpatient services (especially clinic services in Florida and EPSDT in Pennsylvania) as well as selected ancillary services ("all other services" in California and case management in Florida).
c. Variations by Type of Health Condition
Next, we compare patterns of spending by type of health condition (as reflected in the CDPS). The results are consistent across the two states with diagnostic data. Compared to those with no chronic condition, spending was 10 to 12 times higher for those with both physical and mental conditions and 5 to 7 times higher for those with either a physical or mental condition (Tables III.24A and 24B; Figure III.12). Spending was considerably higher in Pennsylvania than in California for those with a mental condition (either alone or in combination with a physical condition), due to higher Medicaid spending for specialty psychiatric services (family-based rehabilitation), EPSDT, and clinic-based services.
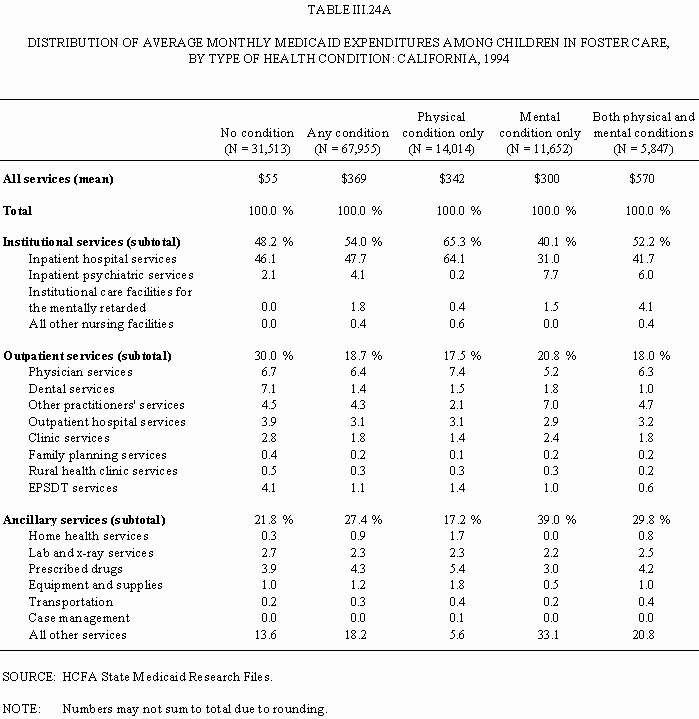
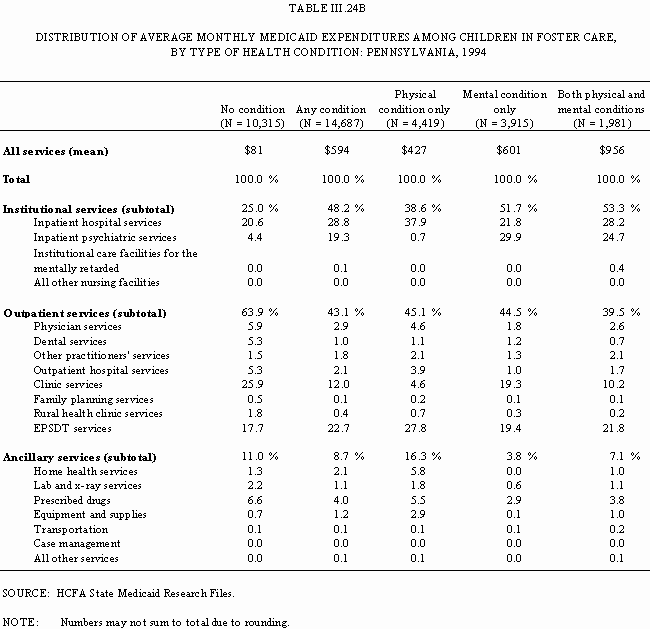
Figure III.12:
Average Monthly Medicaid Expenditures, by Type of Health Condition, 1994
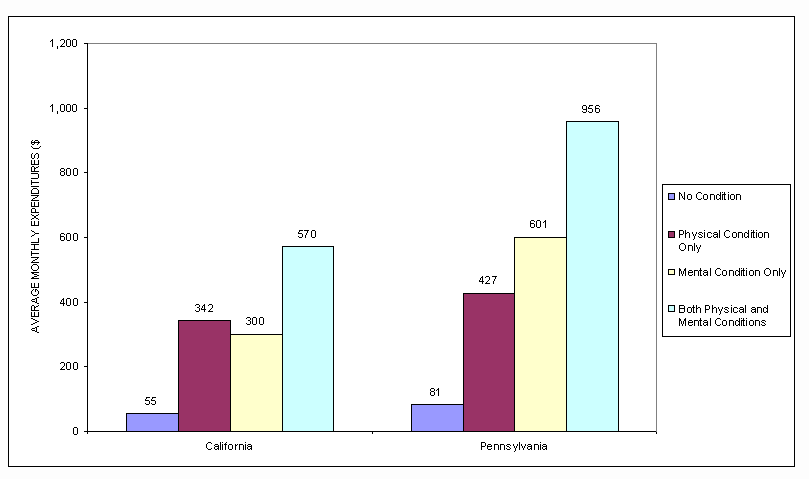
d. Variations by SSI Eligibility Status
Table III.25 compares average monthly Medicaid spending for foster care children receiving SSI benefits versus those with no SSI eligibility during the study period. Average monthly expenditures were 3.5 to 6.5 times higher among foster care children with SSI eligibility relative to those with no SSI eligibility. Higher expenditures were driven principally by higher institutional expenditures, including specialty psychiatric services in California and Pennsylvania. Other services that accounted for a large share of the differential included clinic, home health, and case management services in Florida; "all other services" in California; and EPSDT in Pennsylvania. (See Appendix Table B.5.) These patterns are consistent with a higher frequency of mental health conditions (either alone or in combination with physical conditions) among children in foster care who also receive SSI benefits. Fifty percent of foster care children with SSI had mental health conditions, versus 23 percent of those without SSI eligibility (data not shown).
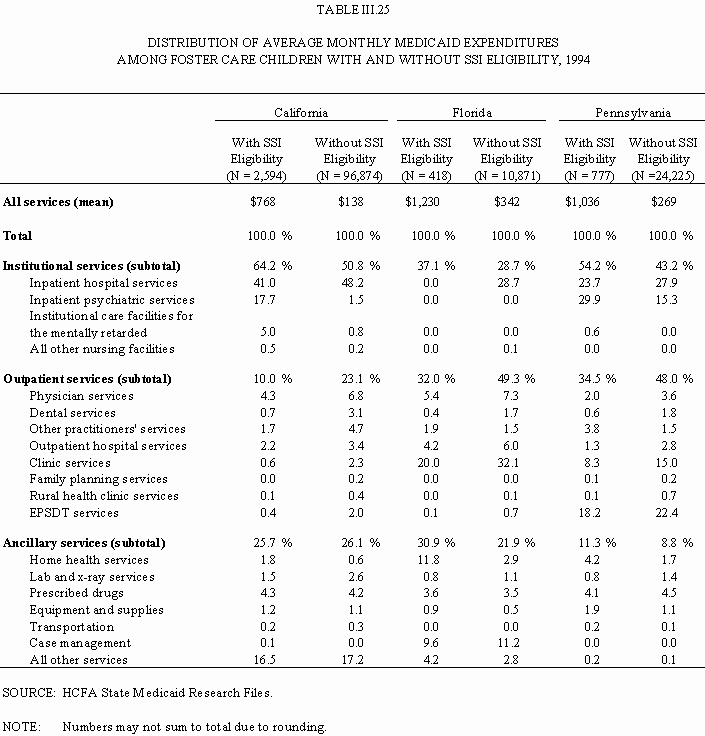
e. Variations by Title IV-E Status
In California and Florida, average monthly expenditures were slightly higher for non-Title IV-E children than for Title IV-E children, with much of the difference attributable to mental health services (clinic services in Florida; inpatient psychiatric and "all other services" in California) (Table III.26). In Pennsylvania, Title IV-E children had higher average monthly expenditures, largely due to higher EPSDT expenditures. Nevertheless, as in the other two states, non-Title IV-E children in Pennsylvania had substantially higher mental health-related expenditures than those eligible under Title IV-E. These services were provided through the family-based rehabilitation program (reported under inpatient psychiatric services in SMRF).
| California | Florida | Pennsylvania | ||||
|---|---|---|---|---|---|---|
| Receiving Title IV-E Assistance (N=63,381) | Not Receiving Title IV-E Assistance (N=31,087) | Receiving Title IV-E Assistance (N=7,136) | Not Receiving Title IV-E Assistance (N=4,153) | Receiving Title IV-E Assistance (N=18,056) | Not Receiving Title IV-E Assistance (N=6,946) | |
| All services (mean) | $147 | $171 | $366 | $389 | $308 | $253 |
| Total | 100.0% | 100.0% | 100.0% | 100.0% | 100.0% | 100.0% |
| Institutional services (subtotal) | 51.3% | 55.0% | 32.1% | 26.0% | 43.1% | 48.5% |
| Inpatient hospital services | 48.7 | 44.7 | 32.1 | 25.8 | 28.5 | 24.2 |
| Inpatient psychiatric services | 2.0 | 6.7 | 0.0 | 0.0 | 14.6 | 24.2 |
| Institutional care facilities for the mentally retarded | 0.5 | 2.9 | 0.0 | 0.0 | 0.1 | 0.2 |
| All other nursing facilities | 0.1 | 0.6 | 0.0 | 0.2 | 0.0 | 0.0 |
| Outpatient services (subtotal) | 23.3% | 17.9% | 45.0% | 50.8% | 47.4% | 43.9% |
| Physician services | 7.1 | 5.4 | 7.5 | 6.2 | 3.5 | 3.0 |
| Dental services | 3.1 | 2.4 | 1.5 | 1.5 | 1.6 | 2.1 |
| Other practitioners' services | 4.7 | 3.7 | 1.8 | 1.1 | 1.8 | 1.7 |
| Outpatient hospital services | 3.6 | 2.7 | 6.0 | 5.5 | 2.7 | 2.4 |
| Clinic services | 2.1 | 2.0 | 27.4 | 35.9 | 13.3 | 17.4 |
| Family planning services | 0.2 | 0.2 | 0.0 | 0.0 | 0.2 | 0.3 |
| Rural health clinic services | 0.4 | 0.2 | 0.1 | 0.0 | 0.7 | 0.5 |
| EPSDT services | 2.1 | 1.2 | 0.7 | 0.4 | 23.7 | 16.4 |
| Ancillary (subtotal) | 25.4% | 27.1% | 22.9% | 23.2% | 9.5% | 7.6% |
| Home health services | 0.7 | 0.9 | 4.4 | 3.3 | 2.3 | 1.1 |
| Lab and x-ray services | 2.5 | 2.2 | 1.1 | 1.0 | 1.3 | 1.4 |
| Prescribed drugs | 4.7 | 3.5 | 3.6 | 3.3 | 4.5 | 4.2 |
| Equipment and supplies | 1.2 | 1.0 | 0.6 | 0.6 | 1.3 | 0.7 |
| Transportation | 0.3 | 0.2 | 0.0 | 0.0 | 0.1 | 0.2 |
| Case management | 0.0 | 0.0 | 10.2 | 12.4 | 0.0 | 0.0 |
| All other services | 16.0 | 19.2 | 3.1 | 2.7 | 0.1 | 0.1 |
| SOURCE: HCFA State Medicaid Research Files. NOTE: Numbers may not sum to total due to rounding. | ||||||
Conclusion
The health care experiences of children in foster care varied widely across the three states in terms of the continuity of their Medicaid coverage and the level and mix of services they received. This study showed that, on average, children in foster care were more likely to have health conditions documented in the Medicaid claims files, were more intensive service users, and had higher health care expenditures than Medicaid children as a whole. The care provided to foster care children through Medicaid was more complex and costly than the care provided through Medicaid to children who received AFDC or adoption assistance. In contrast, children receiving SSI benefits tended to have higher needs, utilization, and expenditures than children in foster care. There was one important exception: children in foster care were more likely than SSI children (and all other Medicaid children) to have mental health or substance abuse conditions and were more likely to receive behavioral healthcare treatment under Medicaid. The higher use of mental health treatment may be a cause, consequence, or unrelated to foster care placement; the relationship and direction of causality are not clear.
These results have important implications for policymakers and, in some cases, raise additional questions for further research. In particular, the findings from this study have implications for the financing and delivery of services in a managed care context and for assuring continuity of health insurance coverage. The next chapter discusses the implications of study results and recaps the limitations of this study.
Footnotes
1. This analysis is based on Medicaid eligibility and claims data and is limited to foster care children enrolled in Medicaid. We compared the number of foster care children enrolled in Medicaid (as reported in SMRF) to the number of foster care children reflected in the Voluntary Cooperative Information System (VCIS). In general, the numbers were very similar, suggesting that most foster care children were enrolled in Medicaid. As of January 1994, there were 9,568 children in foster care in Florida (VCIS) and 9,279 foster care children in Medicaid (SMRF). The numbers were even closer in Pennsyvania: 18,761 (VCIS) versus 18,783 (SMRF). In California, however, it would appear that foster care children living with caretaker relatives were and given AFDC but not foster care assistance and were included in the AFDC category rather than the foster care category of Medicaid eligibility. According to VCIS, there were 87,420 foster care children in California as of January 1994, compared to 72, 345 in Medicaid; the differential appears to reflects the number of children living with caretaker relatives.
2. The other categories of Medicaid eligibility such as poverty-related expansions, medically needy, and all other categories comprised between 36 and 42 percent of enrollment but only 26 to 31 percent of expenditures. The data for these children are included in the totals for all children, and are not analyzed separately in this study.
3. This is consistent with a recent study of enrollment patterns in California and Florida that found a high level of turnover in Medicaid coverage among children leaving AFDC during the year (Ellwood and Lewis 1999).
4. This could be due to a number of factors, including the higher likelihood of out-of-state placement, the presence of other third-party insurance coverage, or variation in program rules.
5. Some diagnoses may not be disabling per se but were considered to reflect health status and increased risk of future expenditures (Kronick et al. forthcoming).
6. By "CDPS condition," we refer to the diagnoses identified in the CDPS, as specified in Table III.8. The rate of CDPS conditions is consistently higher in Pennsylvania than in California. Similarly, utilization and expenditures are consistently higher in Pennsylvania. It is possible that higher utilization in Pennsylvania led to increased diagnosis. It is unclear whether this is due to differences in access, casemix, or other factors. This is discussed further in Chapter IV.
7. About 6.5 percent of children nationally had some degree of disability each year from 1992 through 1994; children living in poverty had a 1.8 higher likelihood of experiencing disability due to chronic conditions (Newacheck and Halfon 1998). This estimate is based on self-reported data collected through the National Health Interview Survey.
8. Among adolescents in foster care (age 15 to 18), the percent with a substance abuse diagnosis was 3.4 percent in California and 4.6 percent in Pennsylvania.
9. One caveat, however, is that the CDPS is calculated on the basis of diagnoses present in claims and, to the extent that children receiving adoption assistance have other third-party coverage, fewer diagnoses may be recorded in claims. As we will see in the next two sections, adoption assistance children have lower health care utilization and expenditures, but it is impossible to tell whether this is due to the presence of other third-party coverage, fewer health care needs, or more barriers to care.
10. The rate of MR/DD in the Medicaid population is undoubtedly understated based on claims data. Children with MR/DD tend to be low users of health services and oftentimes, a diagnosis of MR/DD is not recorded on the claim. This would result in an under-reporting of MR/DD diagnoses based on claims data (Burwell et al. 1997). The Social Security Administration (1998) estimates that 39 percent of children receiving SSI benefits are disabled due to mental retardation. It is also likely that the level of MR/DD in the foster care population is understated. To the extent that foster care children with MR/DD are also receiving SSI benefits, they may not be classified in the foster care category due to the coding limitations on the SMRF file. Only one eligibility category is recorded per month, and SSI may take precedence over foster care.
11. A higher rate of asthma among children in foster care may be due to residual lung disease as a consequence of prematurity. Another possible explanation is that wheezing is associated with stressful life events, especially maternal separation during the first year of life (Halfon et al. 1995).
12. For example, the state benchmarks are constructed based on 100 percent of birth certificates and they count multiple births individually. The claims-based delivery rates do not count multiple births separately. In addition, they are derived from claims that are tied to the mother's record number. In some cases, however, the delivery claim is submitted with the infants' record number and is not linked back to the mother. These methodological differences could result in an understatement of claims-based delivery rates compared to the state benchmarks.
13. This could be a function of better health status (recall Table III.9). Alternatively, adopted children may have other sources of health insurance coverage that serve as the primary payer, and hence, such utilization would not be reflected in the Medicaid claims.
14. National estimates are based on self-reported survey data from the 1996 round of the Medical Expenditure Panel Survey (MEPS). As such, they are not entirely comparable to estimates based on claims, but they provide a useful external benchmark for comparison.
15. Another protocol recommends two assessments during the first year of placement and one visit every year thereafter, unless more frequent reassessment is indicated based on the child's age, a change in foster care placement, or a change in physical or mental health status (AAP 1994).
16. The proportion of foster care children receiving mental health/substance abuse services was higher than the proportion who had a CDPS condition (recall Table III.9). This could reflect services provided to children with a mental condition that was "not well defined" (recall Table III.13) or services to children without a diagnosed mental condition who were in need of emotional support during transitions. (See Schneiderman et al. for a discussion of the continuum of mental health services for children in foster care.)
17. This variation may be due in part to differences in state mental health benefits concerning the number of visits allowed for certain diagnoses.
18. This differential does not appear to be due to maternity care during adolescence, because such admissions were excluded from the inpatient admission rate and days per 1,000.
19. A hospitalization is often a reason for seeking Medicaid coverage especially for uninsured children. That could explain the higher hospitalization rate among foster care children with part-year coverage.
20. Because the SMRF file shows only one eligibility category per month, we undoubtedly are undercounting the number of foster care children with SSI eligibility. The only way that a foster care child could be counted as having SSI eligibility in the SMRF file is if they had at least one month of Medicaid eligibility due to SSI, rather than due to foster care. To maximize the likelihood of identifying SSI eligibility, we used eligibility information for two years. Thus, it is possible that the period of SSI eligibility occurred before or after the period of foster care eligibility. In addition, it is possible that some foster care children are included only in the SSI category and not counted in the foster care category.
21. The AAP (1994) issued a policy statement on health care for children in foster care that is substantially similar to the CWLA guidelines. For a comparison of the two protocols, refer to Rawlings-Sekunda (1999).
22. There are a number of obstacles to providing health care services to foster care children immediately upon placement. Provider shortages often serve as a barrier to obtaining care, with the emergency room as the only alternative for children in crisis. For children enrolled in Medicaid managed care prior to foster care placement, there can be a delay of one month or longer until they are moved to a new provider.
23. These services were classified by the state as inpatient psychiatric services although they are provided in community-based settings.
Discussion
This study has confirmed findings from previous research showing that children in foster care utilize behavioral healthcare services more frequently than other Medicaid children. This study shows clearly that not only were foster care children more likely to be diagnosed with mental health or substance abuse conditions, but they also were more likely to use such services compared to other groups of Medicaid children (including children who were eligible for Medicaid through SSI due to disability).
Children in foster care also were more likely than the Medicaid population as a whole to have physical health conditions documented in Medicaid claims data, but not surprisingly, they had fewer such conditions than children who were eligible for Medicaid coverage through SSI. Levels of utilization in the foster care population generally followed this pattern as well, that is, higher than the Medicaid population overall, but lower than the SSI population. This is consistent with previous research by Rymer and Adler (1987), based on Medicaid data for four states from 1985.
Children in foster care typically were more likely to receive preventive and dental care through Medicaid than other groups of Medicaid children (including those receiving SSI benefits). Nevertheless, the rate of health assessments was still well below the level recommended by the CWLA guidelines, especially during the period immediately following placement (CWLA 1988; AAP 1994). Simms and Halfon (1994) speculate that the reasons for poor compliance with recommendations include limitations in staffing and funding, which impede implementation of the standards; lack of research justifying the recommendations; and a general lack of understanding concerning their rationale.
This chapter discusses the results of this study in terms of the implications for policymakers, areas for further research, and limitations of the research due to data constraints.
Implications of This Study for Policymakers
These findings have important implications for policy and practice aimed at improving the delivery of health care services to children in foster care, especially in the changing health care environment. The first implication of this study is the importance of continuity of health insurance coverage within the foster care population.(1) Children in foster care were less likely to be continuously enrolled in Medicaid for a full year than adoption assistance or SSI children. This may not be surprising given that placement in foster care is often a pathway to Medicaid eligibility for children in crisis. Nevertheless, this result held when we examined the extent of continuous 12-month coverage over a 24-month period and still, foster care children were less likely than other vulnerable populations to be continuously enrolled in Medicaid. (We cannot tell from Medicaid eligibility data whether some children had other forms of public or private coverage during periods in which they were not enrolled in Medicaid.)
There is growing literature documenting the adverse effects of discontinuities of health insurance coverage (see, for example, Weissman et al. 1999; Berman et al. 1999; Burstin et al. 1998/99). Consequently, states are implementing strategies to increase retention rates, including less frequent redeterminations (such as every six months or annually instead of monthly) and less onerous reapplication requirements (such as mail-in or telephone rather than face-to-face procedures). Eleven states are offering 12-month continuous coverage (Ross and Jacobson 1998). It remains to be seen how foster care children will be affected by these policies in terms of their continuity of health insurance coverage and access to health care (both while they are in foster care and during other periods of Medicaid eligibility). In the meantime, policymakers should focus explicitly on ways to improve continuity of health insurance coverage among foster care children. This would include more timely determination of eligibility when children are removed from the home as well as continuation of eligibility when they return home (Rawlings-Sekunda 1999).
A second implication of this study is that states have considerable flexibility in how they use Medicaid to pay for services for children in foster care. Florida, for example, funded case management services through Medicaid. Children in Pennsylvania especially those in foster care had greater access to services through the EPSDT program. Medicaid can fund a comprehensive continuum of care ranging from screening and assessment to follow-up treatment and ongoing therapies to meet the wide-ranging needs of children in foster care. Evidence of state-level variation in Medicaid expenditures suggests that states differ in the use of Medicaid to serve children in foster care.
A third implication of this study is the importance of developing mechanisms to better coordinate services for children in foster care, whether they are receiving care in a managed care or fee-for-service environment. The analysis of utilization before and after foster care placement revealed that the majority of foster care children are not receiving CWLA-recommended services during the initial placement period (or at least these services are not being billed to Medicaid). Care coordination strategies are designed to minimize discontinuities of care during transitions (for example, from one foster care placement to another or from one provider to another). In some states, care coordination may be designed to provide access to both covered and noncovered services (that is, services that are not included in the Medicaid benefit package) (Rosenbach and Young 2000). A broad-based concept of care coordination is especially relevant for foster care families, whose needs may involve multiple systems of care, such as public health, child welfare, mental health, schools, and juvenile justice, to name a few. What often differentiates the care coordination process from traditional case management is the advocacy orientation and creative problem-solving approaches used by care coordinators to ensure that individuals get the care they need, regardless of who pays. In other words, care coordinators can help families navigate the boundaries of Medicaid and obtain services provided through other systems of care. The use of proactive care coordination, however, requires a shift away from controlling access and utilization and toward advocating for the needs of children and their families. Whether such services are provided in a managed care environment or on a fee-for-service basis, care coordination may help foster care families get the care they need for their children. More research is needed, however, about the costs and benefits of care coordination (Rosenbach and Young 2000).
A fourth implication of this study is the critical importance of tailoring managed care programs to meet the special needs of the foster care population. Although they represent only 1 to 3 percent of the child Medicaid population, foster care children clearly have higher needs. Policymakers may lose sight of these needs when they consider the larger and more visible Medicaid populations. Payment mechanisms such as risk adjustment approaches need to take into account the differential utilization and expenditure profile among children in foster care, especially their higher use of mental health services.
The higher level of mental health conditions (as reflected in Medicaid claims data) and more intensive utilization of mental health/substance abuse treatment also have important implications for the design of programs to adequately serve the foster care population, both in terms of the benefit structure and the composition of provider networks. Covered benefits should reflect the full continuum of care, while networks may need to include both public and private providers to ensure continuity of care. Managed care organizations may not be aware of the special needs of this population when developing provider networks or applying their standard medical necessity criteria. Education of managed care providers is essential to ensure that this small, but vulnerable, population does not fall through the cracks.
Additional Research Questions Raised by This Study
This study raised a number of questions that remain unanswered. First, what accounts for the significant variation in diagnoses, utilization, and expenditure patterns across states? Utilization and expenditures, for example, were consistently lower in California than in the other two states. (The level of chronic illness and disability was also lower, but this may be endogenous due to our reliance on claims data for this measure.) This study should motivate policymakers to consider factors that account for such variations within the foster care population. One factor may be the role of child welfare and health agencies in coordinating and advocating for health care services for children in foster care. California, for example, implemented health passports for children in foster care in 1995, well after the other two states (Lutz and Horvath 1997). Another factor may be differential involvement of the courts in mandating evaluation and treatment of physical or mental health conditions (Halfon et al. 1992(b); English and Freundlich 1997). State variation may also be a function of the propensity of states to cover certain services through Medicaid (such as case management in Florida or EPSDT services in Pennsylvania). Other factors that may be associated with state-level variation include the availability of providers to serve this population, their knowledge of services needed by the population, the generosity of reimbursement rates, differences in case mix, or level of stigma about accessing services. This study has taken a first step to document differences across states. Further research is required to explain them.
In addition to observing state-level variation, we observed variation within subgroups of the foster care population (for example, variations by age, length of Medicaid eligibility, health condition, SSI status, and Title IV-E status). More consideration needs to be given to why certain groups of foster care children experience lower levels of utilization and expenditures than others whether they are driven by different levels of need or whether factors other than clinical need account for the variation. One foster care subgroup that appears to be particularly vulnerable and at-risk is adolescents; they have particularly high mental health needs and utilization and lower levels of routine preventive care. Given that, policymakers, providers, and advocates should focus attention on assuring that adolescents in foster care have adequate access to the health care system, particularly to help them prepare for their independence.
Another question raised by this study concerns the extent of unmet need in the foster care population. It is possible that lower rates of utilization among certain groups of foster care children reflect an underutilization of health care services, or conversely, that higher rates in certain groups may reflect inappropriate, or overutilization. Without external benchmarks against which to evaluate patterns of care, together with more detailed clinical assessments, we cannot tell definitively whether lower rates of utilization are indicative of access barriers or simply of lower health care needs. This is of particular concern for those children who ostensibly have "no chronic conditions" according to the approach we used to classify health conditions. Because the classification of chronic health conditions is conditional upon having a claim with a particular set of diagnoses, those who do not use any services de facto cannot be classified as having a chronic condition. Therefore, the lower level of use in the "no condition" group reflects an averaging of utilization patterns among those who truly have none of the specified CDPS conditions, and those who due to access barriers have unmet needs. While it is reassuring to observe substantially higher levels of utilization among those with one or more chronic health conditions, it is unclear whether those with no chronic conditions are receiving an adequate level of care that meets their needs. This is certainly true for preventive and dental care, where we would not expect to observe such disparities between children who have chronic health conditions and those who do not.
Policymakers and researchers might consider various approaches to further explore the extent of unmet need in the foster care population. One approach is to conduct a prospective or retrospective medical record review to ascertain compliance with external standards (CWLA 1988; AAP 1994). Another approach is to survey foster care families and case managers to assess their perceptions of the adequacy of health care received by the children in their custody. Such assessments could be gathered for those receiving services through the fee-for-service sector as well as those enrolled in managed care. This way the two systems of care could be compared.
Another issue raised by this study is how children receiving adoption assistance fare relative to other children, especially those in foster care. Children receiving adoption assistance clearly were different from foster care children, in terms of their demographic characteristics, eligibility dynamics, diagnoses, utilization, and expenditures. In general, adopted children had more continuous Medicaid coverage than those in foster care, fewer diagnosed conditions, and lower expenditures and utilization. More continuous Medicaid coverage would be expected for children receiving adoption assistance since adoption is a lifetime legal relationship and foster care is a temporary service for the protection of a child. To the extent that Medicaid claims accurately represent patterns of diagnoses, utilization, and expenditures among adopted children, it would appear that adopted children are healthier than those in foster care, possibly explaining the lower levels of utilization and expenditures. One caveat, however, is that we cannot tell whether adopted children had other third-party coverage through their adoptive families so that Medicaid served as the payer of last resort, providing coverage when benefits were exhausted or for services not covered by commercial plans. In such cases, diagnoses, utilization, and expenditures would be understated in Medicaid claims. Further investigation is required to better understand the differences. The lower level of preventive care and dental care in the adoption assistance group deserves further exploration as well.
Limitations of This Study
Like all studies, this one has a number of limitations related to generalizability and reliability of results. First, we relied on data from three states. Although this is an improvement over previous studies that used data from only a single state, it still nevertheless cannot be generalized to all states or to the nation as a whole. The value of multiple states, however, is that it demonstrates the extent of variation across the country, and hopefully, can provide useful comparisons to other states. Second, the data are from the early-to mid-1990s (1994-95 for California and Florida and 1993-94 for Pennsylvania). These were the most recent data available through SMRF. Clearly, more recent data would be desirable to ascertain whether patterns of enrollment, diagnosed conditions, utilization, and expenditures have changed.
Third, the analyses of diagnosed conditions, expenditures, and utilization exclude children enrolled in managed care, since SMRF did not gather encounter data for capitated services (the one exception was for dental services provided through prepaid dental plans in California). Therefore, to the extent that there are systematic differences in the utilization patterns among children in foster care who are enrolled in managed care, these will not be captured in the analysis. Ideally, future studies would include encounter data from managed care organizations to allow a comparison of utilization patterns in managed care versus fee-for-service.
Fourth, the analyses rely on Medicaid claims data submitted by providers. The reliability of the CDPS classification hinges on the reliability of diagnostic coding by providers. Likewise, the analysis of Medicaid expenditures and utilization patterns relies on the accuracy of procedure codes. To the extent that there are errors in coding, our results will be less than precise.
We also encountered a number of limitations in using the SMRF data, which other researchers should be aware of. First, there is no indicator of provider specialty on the SMRF files, which precluded us from looking at continuity of care or specialty referral patterns. Second, not all states report basic data such as diagnoses, which precluded us from conducting analyses of diagnosed conditions in Florida.(2) To our knowledge, however, there is no central database that indicates which SMRF files contain which data elements and to what degree of completeness. Third, states often use state-specific procedure codes for such specialized services as case management, EPSDT, and mental health. We were fortunate to have access to state-specific procedure codes, but these are not uniformly available to researchers. Fourth, we found significant inconsistencies in the way states classified services by type of service. This was especially problematic for mental health services, where the three states each used different type-of-service categories. Again, we were fortunate to have access to state-specific procedure codes that enabled us to sort out these inconsistencies. Fifth, the SMRF file contains a single eligibility code for each month, which means that children with dual SSI and foster care eligibility during a given month would only be classified in a single category. This hampered our ability to identify foster care children with SSI coverage, and conversely, to identify SSI children in an out-of-home placement. Our solution was to identify children with any foster care eligibility during the year (our analytic group), and then screen for SSI eligibility during the full 24-month study period. This yielded relatively few children, but was the best we could do under the circumstances. A more desirable solution would be to obtain eligibility information from both child welfare offices and the Social Security Administration and match these records to Medicaid data to more reliably identify the populations of analytic interest. Sixth, it is unclear whether the date of initial foster care placement is reliably identified in Medicaid eligibility files. Anecdotal evidence suggests there are significant lags in obtaining Medicaid coverage for those who are not covered or in switching the reason for eligibility among those with prior Medicaid coverage (Rawlings-Sekunda 1999; Schneider and Fennel 1999). That might explain why we see such low levels of utilization immediately following foster care placement, but we cannot be sure.
Final Comments
Increasing attention currently is being focused on the health care needs of children in foster care. There is considerable interest in developing performance measures to track the effectiveness of child welfare services, including outcomes of child well-being. This study has provided examples of how health care measures can be operationalized using Medicaid enrollment and claims data.
More recent data are required, however, to determine how children in foster care are faring in the "new millennium." States are developing initiatives to improve the continuity and comprehensiveness of care received by children in foster care. A recent survey of 35 states revealed (Rawlings-Sekunda 1999):
- Twenty-four states now have policies or procedures to reduce delays in determining Medicaid eligibility when placing a child in foster care and 25 have policies or procedures to reduce delays in determining Medicaid eligibility when returning a child home.
- Twenty-seven states have screening or treatment standards for children in foster care.
- Thirty-three states provide training to educate case workers and foster parents about the health needs of children in foster care; few provide training to managed care organizations or health care providers.
The effectiveness of these initiatives is unknown. Additional analysis based on more recent data would be useful to determine whether children in foster care are now receiving more continuous coverage and more comprehensive care as a result of recent efforts.
Footnotes
1. A related issue, but one that was not addressed by this study, is the lack of health insurance coverage for the parents of foster care children. Anecdotal evidence suggests that barriers to mental health and substance abuse treatment because parents are uninsured (and not eligible for Medicaid) often serves as an obstacle to preserving or reuniting families.
2. Beginning in 1999, states are submitting claims data through the Medicaid Statistical Information System (MSIS) that conform with UB-92 and HCFA-1500 billing standards. The expanded data reporting will capture more procedures and diagnoses and will be an important data source for future research.
References
American Academy of Pediatrics Committee on Early Childhood, Adoption, and Dependent Care. Health Care for Children in Foster Care (Policy Statement RE9404), Pediatrics, vol. 92, no. 2, February 1994.
Battistelli, Ellen Sittenfeld. Making Managed Health Care Work for Kids in Foster Care: A Guide to Purchasing Services. Washington, DC: Child Welfare League of America, 1997.
Battistelli, Ellen Sittenfeld. Managed Health Care Guide for Caseworkers and Foster Parents. Washington, DC: Child Welfare League of America, 1997.
Berman, Stephen, Jessica Bondy, Dennis Lezotte, Barbara Stone, and Patricia J. Byrnes. The Influence of Having an Assigned Medicaid Primary Care Physician on Utilization of Otitis Media-related Services. Pediatrics, vol. 104, no. 5, November 1999, pp. 1,192-1,197.
Burstin, H.R., Swartz, K., O'Neil, A.C., Orav, E.J., Brennan, T.A. The Effect of Change of Health Insurance on Access to Care. Inquiry 35(4): 389-397, Winter 1998/99.
Burwell, Brian, Bill Crown, and John Drabek. Children with Severe Chronic Conditions on Medicaid. Cambridge, MA: The MEDSTAT Group, November 1997.
California State University Institute for Research on Women and Families. Code Blue: Health Services for Children in Foster Care. Sacramento, CA: Center for California Studies, March 1998.
Chernoff, M.D., T. Combs-Orme, C. Risley-Curtiss, and A. Heisler. Assessing the Health Status of Children Entering Foster Care. Pediatrics, vol. 93, 1994, pp. 594-601.
Child Welfare League of America. Standards for Health Care Services for Children in Out-of-Home Care. Washington, DC: CWLA, 1988.
Child Welfare League of America. Is Child Welfare System State or County Administered? [http://www.ndas.cwla.org/Report.asp]. June 14, 1999.
Colby, David C. Medicaid Physician Fees. Health Affairs, Spring (II) 1994.
Dodds, Suzanne. HCFA's State Medicaid Research Files (SMRF): Information on Contents, Availability, and Access. Washington, DC: Mathematica Policy Research, Inc., June 1997.
Dreyfus, Tony, and Carol Tobias. Financing Managed Care for Children in Foster Care. Portland, ME: National Academy for State Health Policy, May 1998.
Ellwood, Marilyn R., and Kimball Lewis. On and Off Medicaid: Enrollment Patterns for California and Florida in 1995. Occasional paper no. 27. Washington, DC: The Urban Institute, July 1999.
English, Abigail, and Madelyn DeWoody Freundlich. Medicaid: A Key to Health Care for Foster Children and Adopted Children with Special Needs. Clearinghouse Review, July-August 1997, pp. 109-131.
Halfon, N., G. Berkowitz, and L. Klee. Children in Foster Care in California: An Examination of Medicaid Reimbursed Health Services Utilization. Pediatrics, vol. 89, 1992(a), pp. 1,230-1,237.
Halfon, N., G. Berkowitz, and L. Klee. Mental Health Service Utilization by Children in Foster Care in California. Pediatrics, vol. 89, 1992(b), pp. 1238-1244.
Halfon, N., A. Mendonca, and G. Berkowitz. Health Status of Children in Foster Care: The Experience of the Center for the Vulnerable Child. Archives of Pediatric and Adolescent Medicine, vol. 149, 1995, pp. 386-392.
Kaye, Neva, Jane Horvath, and Maureen Booth. Monitoring the Quality of Health Care Provided to Children in Foster Care. Portland, ME: National Academy for State Health Policy, 1998.
Kronick, Richard, Tony Dreyfus, Lora Lee, and Zhiyuan Zhou. Diagnostic Risk Adjustment for Medicaid: The Disability Payment System. Health Care Financing Review, vol. 17, no. 3, Spring 1996.
Kronick, Richard, Todd Gilmer, Tony Dreyfus, and Lora Lee. Improving Payment for TANF and SSI Medicaid Recipients: The Chronic Illness and Disability Payment System. Health Care Financing Review, vol. 21, no. 3, forthcoming spring 2000.
Lutz, Lorrie, and Jane Horvath. Health Care of Children in Foster Care: Who's Keeping Track?
Portland, ME: National Academy for State Health Policy, October 1997.
McCormick, Marie C., Barbara Kass, Anne Elixhauser, Joe Thompson, and Lisa Simpson. Annual Report on Access to and Utilization of Health Care for Children and Youth in the United States 1999. Pediatrics, vol. 105, no. 1, January 2000.
National Academy for State Health Policy. Medicaid Managed Care: A Guide for States. Third Edition. Portland, ME: NASHP, 1997.
National Academy for State Health Policy. Medicaid Managed Care: A Guide for States. Fourth Edition. Portland, ME: NASHP, 1999.
National Committee for Quality Assurance. Health Plan Employer Data & Information Set 3.0/1988 Volume 2: Technical Specifications. Washington, DC: NCQA, 1996.
National Governors' Association. State Coverage of Pregnant Women and Children-Summer 1995. MCH Update. Washington, DC: NGA Center for Policy Research, September 29, 1995.
National Governors' Association. State Coverage of Pregnant Women and Children-January 1994. MCH Update. Washington, DC: NGA Center for Policy Research, February 1994.
National Institute for Health Care Management. States as Payers: Managed Care for Medicaid Populations. Washington, DC: NIHCM, February 1995.
Newacheck, Paul W., and Neil Halfon. Prevalence and Impact of Disabling Chronic Conditions in Childhood. American Journal of Public Health, vol. 88, no. 4, April 1998.
Perrin, James M., Karen Kuhlthau, Thomas J. McLaughlin, Susan L. Ettner, and Steven L. Gortmaker. Changing Patterns of Conditions Among Children Receiving Supplemental Security Income Disability Benefits. Archives of Pediatric Adolescent Medicine, vol. 153, January 1999.
Rawlings-Sekunda, Joanne. The State of the States in Delivering Health Care for Children in Foster Care: Findings of a State Survey. Portland, ME: National Academy for State Health Policy, September 1999.
Ross, D.C., and W. Jacobson. Free and Low-Cost Health Insurance: Children You Know are Missing Out. Washington, DC: Center on Budget and Policy Priorities, 1998.
Rosenbach, Margo, and Cheryl Young. Care Coordination in Medicaid Managed Care: A Primer for States, Managed Care Organizations, Providers, and Advocates. Princeton, NJ: Center for Health Care Strategies, forthcoming.
Rymer, Marilyn, and Gerald Adler. Children and Medicaid: The Experience in Four States. Lexington, MA: SysteMetrics/McGraw-Hill, 1987.
Schneider, Andy, and Kristen Fennel. Medicaid Eligibility Policy for Children in Foster Care. Portland, ME: National Academy for State Health Policy, March 1999.
Schneiderman, Mel, Margaret M. Connors, Anne Fribourg, Len Gries, and Mayu Gonzales. Mental Health Services for Children in Out-of-Home Care. Child Welfare, vol. 77, no. 1, January/February 1998, pp. 29-40.
Simms, Mark, and Neal Halfon. The Health Care Needs of Children in Foster Care: A Research Agenda. Child Welfare, vol. 73, September-October 1994, pp. 505-520.
Social Security Administration. Annual Statistical Supplement. Washington, DC: Social Security Administration, November 1998.
Takayama, J.I., A.B. Bergman, and F.A. Connell. Children in Foster Care in the State of Washington: Health Care Utilization and Expenditures. Journal of the American Medical Association, vol. 271, 1994, pp. 1,811-1,886.
U.S. Department of Health and Human Services, Health Care Financing Administration. Fiscal Year 1994 HCFA 2082 Report.
U.S. General Accounting Office. Foster Care: Health Needs of Many Young Children Are Unknown and Unmet. Washington, DC: GAO, 1995.
U.S. House of Representatives, Committee on Ways and Means. 1996 Green Book. Washington, DC: U.S. Government Printing Office, 1996.
Ventura, Stephanie J., Sally C. Clarke, and T.J. Mathews. Recent Declines in Teenage Birth Rates in the United States: Variations by State, 1990-94. Monthly Vital Statistics Report, vol. 45, no. 5, Supplement, December 19, 1996.
Weissman, J.S., Witzburg, R., Linov, P., Campbell, E.G. Termination from Medicaid: How Does it Affect Access, Continuity of Care, and Willingness to Purchase Insurance? Journal of Health Care for the Poor and Underserved 10(1): 122-137, February 1999.
Appendix A: Characteristics of Children Receiving Emergency Assistance
Title IV-A of the Social Security Act authorized matching funds to states that provide emergency assistance (EA) under approved state plans.(1) State plans were required to designate the types of emergencies eligible for assistance. Potential uses were wide-ranging and included providing aid to those affected by natural disasters (floods, fires, storms); those who were homeless or faced a risk of homelessness (due to eviction or foreclosure, for example); those facing financial crises due to loss of employment or strikes; and those with medical needs such as emergencies, illnesses, accidents, or injuries.
During the decade from 1985 to 1995, spending for emergency assistance grew 20-fold. More states submitted amendments and received approval for emergency assistance programs. Additionally, many states expanded eligibility so that they could use EA funds for juvenile justice, mental health, or child protection (US House of Representatives 1996).
This appendix describes the characteristics of children receiving emergency assistance in conjunction with child welfare services in 1994, and who were covered by Medicaid. The analysis includes 1,301 EA children in California, and 6,898 EA children in Florida. The EA coverage category was used much more frequently in Florida, relative to the number of children in foster care during the year. There were no children in Pennsylvania who were identified in the SMRF file as receiving emergency assistance related to child welfare during this time period.
Demographic Characteristics
As shown in Table A.1, the average age of children receiving emergency assistance was nearly 12 in California and slightly over 10 in Florida. The higher average age (relative to children in foster care) is accounted for by the higher concentration of adolescents in this population, presumably a diversion from the juvenile justice system. Sixty percent were male, a disproportionate rate compared to the 50/50 gender distribution within the foster care population. The racial/ethnic distribution was quite similar between emergency assistance and foster care children. The geographic distribution was similar for the two groups in Florida, whereas in California, emergency assistance was more common among children in smaller urban or rural areas.
| California | Florida | |||
|---|---|---|---|---|
| Emergency Assistance (N=1,301) | Foster Care (N=111,236) | Emergency Assistance (N=6,898) | Foster Care (N=14,011) | |
| Total | 100.0% | 100.0% | 100.0% | 100.0% |
| Age | ||||
| Less than 1 | 9.1 | 5.1 | 7.6 | 4.2 |
| 1 to 4 | 8.3 | 24.2 | 18.6 | 26.4 |
| 5 to 9 | 8.8 | 23.9 | 13.7 | 24.9 |
| 10 to 14 | 25.4 | 22.3 | 19.7 | 23.4 |
| 15 to 18 | 48.4 | 24.5 | 40.4 | 21.0 |
| Mean | 11.9 | 9.0 | 10.4 | 8.6 |
| Gender | ||||
| Male | 60.0 | 51.9 | 62.3 | 50.5 |
| Female | 40.0 | 48.1 | 37.8 | 49.5 |
| Race/Ethnicity | ||||
| White | 61.8 | 60.5 | 48.1 | 46.7 |
| Black | 11.8 | 19.0 | 42.6 | 45.8 |
| Hispanic | 18.7 | 15.9 | 7.6 | 5.7 |
| Other/Unknown | 7.8 | 4.7 | 1.7 | 1.9 |
| Urban/Rural Location | ||||
| Large MSA | 60.7 | 83.7 | 50.2 | 52.6 |
| Small MSA | 29.4 | 13.4 | 44.8 | 42.1 |
| Non-MSA | 9.9 | 3.0 | 5.0 | 5.3 |
| SOURCE: HCFA State Medicaid Research Files. NOTE: Numbers may not sum to total due to rounding. Pennsylvania did not report any children eligible for Medicaid due to emergency assistance in conjunction with child welfare services. MSA is Metropolitan Statistical Area. | ||||
Medicaid Eligibility Dynamics
Children receiving emergency assistance were far less likely to receive Medicaid coverage for the full year than children in foster care. In California, EA children averaged less than six months of coverage during 1994, compared to 10 months for foster care children. The disparity was less pronounced in Florida, where EA children averaged eight months of Medicaid coverage. It would appear that emergency assistance was not only used more often in Florida than in California, but that it also provided a pathway to more stable Medicaid coverage.
| Length of Medicaid Eligibility | California | Florida | ||
|---|---|---|---|---|
| Emergency Assistance (N=1,301) | Foster Care (N=111,236) | Emergency Assistance (N=6,898) | Foster Care (N=14,011) | |
| Total | 100.0 % | 100.0% | 100.0 % | 100.0 % |
| 1 to 5 Months | 52.4 | 9.5 | 27.7 | 9.5 |
| 6 to 11 Months | 35.3 | 18.2 | 34.8 | 17.7 |
| 12 Months | 12.3 | 72.3 | 37.6 | 72.8 |
| Mean (in months) | 5.8 | 10.3 | 8.4 | 10.6 |
Health Conditions
In California, foster care children were more likely than children receiving emergency assistance to have health conditions (reflected in the CDPS), but this is a function primarily of a higher rate of physical conditions in the foster care population.(2) The rate of mental conditions was quite similar between the two groups.
| Condition | Emergency Assistance | Foster Care |
|---|---|---|
| Total | 100.0 % | 100.0 % |
| No condition | 75.4 | 68.3 |
| Any condition | 24.6 | 31.7 |
| 9.9 | 14.1 |
| 11.1 | 11.7 |
| 3.6 | 5.9 |
Expenditures and Utilization
Table A.2 compares the level and distribution of average monthly Medicaid expenditures between children receiving emergency assistance and those in foster care. Children receiving emergency assistance in California had higher average monthly expenditures than those in foster care, due to higher inpatient expenditures. In Florida, the differential was reversed, with foster care children having slightly higher expenditures on average than those receiving emergency assistance, due primarily to higher expenditures for ancillary services (such as case management, prescribed drugs, and home health services).
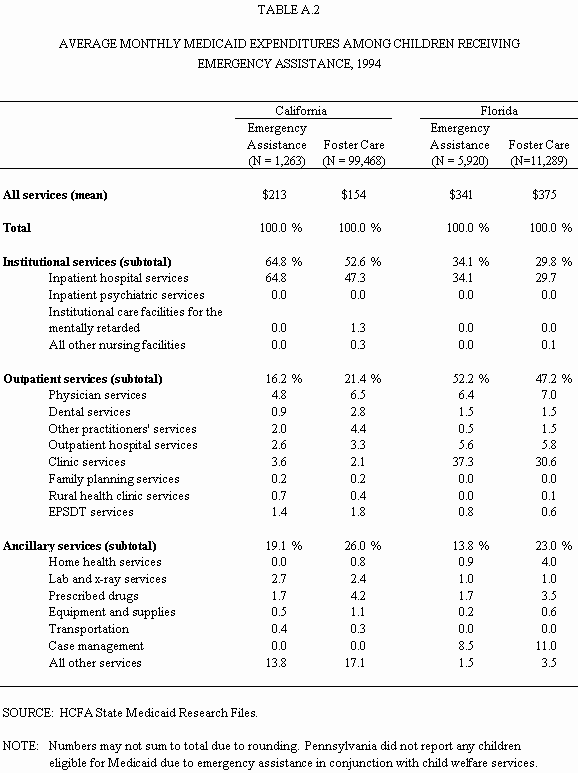
Within the emergency assistance group, average monthly spending was 60 percent higher in Florida than in California. The majority of expenditures for EA children in California were for inpatient services, while most of the expenditures in Florida were for outpatient services. The higher spending in Florida appears to be driven by clinic services (mostly for mental health services) and case management services.
Children receiving emergency assistance not only had higher average monthly expenditures, but were also intense users of health care services relative to their short stays on Medicaid. Because of the differences in dynamics of Medicaid eligibility between the two groups, Table A.3 compares utilization by length of Medicaid eligibility. Beginning with California, EA children with one to five months of Medicaid coverage were more likely to have an inpatient stay (as were those enrolled the full year). This explains the higher average monthly Medicaid expenditures and the greater concentration of Medicaid expenditures in the inpatient sector among EA children. Indeed, EA children in California appear to be higher users than the foster care population on almost all measures of utilization, once we control for length of Medicaid eligibility.
| California | Florida | ||||
|---|---|---|---|---|---|
| Utilization | Emergency Assistance (N=1,263) | Foster Care (N=99,468) | Emergency Assistance (N=5,920) | Foster Care (N=11,289) | |
| Percent with a hospital stay (total) | 2.5 | 3.2 | 4.2 | 4.1 | |
| 1-5 months | 2.7 | 2.0 | 1.9 | 3.4 | |
| 6-11 months | 1.8 | 4.4 | 6.1 | 6.6 | |
| 12 months | 3.4 | 3.2 | 4.5 | 3.5 | |
| Percent with an outpatient provider visit (total) | 51.1 | 65.0 | 68.4 | 84.6 | |
| 1-5 months | 32.8 | 29.2 | 45.7 | 48.7 | |
| 6-11 months | 70.0 | 60.5 | 76.3 | 80.6 | |
| 12 months | 80.1 | 73.4 | 82.3 | 91.5 | |
| Percent with an emergency room visit (total) | 24.1 | 27.5 | 22.8 | 25.0 | |
| 1-5 months | 11.2 | 8.1 | 10.6 | 9.0 | |
| 6-11 months | 35.9 | 26.7 | 24.3 | 25.4 | |
| 12 months | 48.6 | 31.7 | 33.2 | 27.5 | |
| Percent with a prescribed drug (total) | 33.9 | 51.2 | 47.2 | 67.9 | |
| 1-5 months | 15.3 | 15.0 | 23.5 | 28.8 | |
| 6-11 months | 51.7 | 45.2 | 53.0 | 61.5 | |
| 12 months | 67.1 | 60.1 | 64.2 | 75.9 | |
| Percent with a preventive visit (total) | 23.3 | 34.5 | 25.2 | 27.6 | |
| 1-5 months | 11.5 | 11.9 | 13.4 | 17.2 | |
| 6-11 months | 34.3 | 30.7 | 25.6 | 35.0 | |
| 12 months | 45.2 | 40.1 | 35.4 | 41.4 | |
| Percent with a dental visit (total) | 23.7 | 36.1 | 19.4 | 35.4 | |
| 1-5 months | 10.2 | 7.2 | 11.3 | 6.7 | |
| 6-11 months | 38.9 | 56.0 | 21.6 | 22.0 | |
| 12 months | 41.1 | 44.6 | 29.3 | 43.6 | |
| Percent with any mental health/substance abuse treatment (total) | 19.9 | 22.6 | 34.8 | 38.4 | |
| 1-5 months | 11.9 | 6.6 | 21.8 | 16.0 | |
| 6-11 months | 28.8 | 19.3 | 40.1 | 33.3 | |
| 12 months | 30.1 | 26.7 | 42.0 | 43.4 | |
| SOURCE: HCFA State Medicaid Research Files. | |||||
Patterns of use were quite different in Florida; in general, EA children had lower levels of use relative to foster care children, just as they had lower monthly expenditures, on average. The one exception was mental health and substance abuse treatment services, where EA children enrolled part of the year were more likely to receive services than foster care children.
This analysis has shown that children receiving emergency assistance had a different demographic profile than foster care children, had shorter Medicaid stays, and had different patterns of utilization and expenditures. Moreover, this analysis has demonstrated that California and Florida each used EA to serve a different mix of children, and the variations in patterns of utilization and expenditures reflect these differences. Since the termination of emergency assistance under the Welfare Reform Act of 1996, it is unclear what has happened to this highly vulnerable but largely invisible group.
1. The authority, however, was rescinded with the Welfare Reform Act in 1996.
2. Due to lack of diagnostic data on Florida's outpatient SMRF claims, data on health conditions are available only for California.
Appendix B: Detailed Expenditure Tables
| Category of Medicaid Eligibility | |||||
|---|---|---|---|---|---|
| All Children(a) (N=2,891,620 |
Foster Care (N=99,468) |
Adoption Assistance (N=18,495) |
AFDC (N=1,523,080) |
SSI (N=60,705) |
|
| All services (mean) | $76.02 | $154.49 | $35.72 | $50.28 | $521.15 |
| Institutional services (subtotal) | 40.58 | 81.20 | 16.10 | 18.39 | 311.64 |
|
37.75 | 73.06 | 13.18 | 18.33 | 218.46 |
|
0.96 | 5.63 | 2.66 | 0.05 | 20.37 |
|
1.14 | 2.08 | 0.26 | 0.00 | 43.87 |
|
0.74 | 0.43 | 0.00 | 0.01 | 28.93 |
| Outpatient services (subtotal) | 22.02 | 33.10 | 7.67 | 21.49 | 58.32 |
|
7.60 | 10.04 | 2.12 | 7.14 | 28.68 |
|
4.59 | 4.37 | 2.51 | 5.22 | 5.43 |
|
0.78 | 6.73 | 0.96 | 0.55 | 5.14 |
|
3.47 | 5.07 | 1.07 | 2.96 | 13.68 |
|
2.09 | 3.22 | 0.45 | 1.87 | 3.08 |
|
0.16 | 0.34 | 0.04 | 0.15 | 0.16 |
|
0.62 | 0.54 | 0.16 | 0.72 | 0.71 |
|
2.71 | 2.78 | 0.38 | 2.88 | 1.43 |
| Ancillary services (subtotal) | 13.41 | 40.19 | 11.95 | 10.40 | 151.20 |
|
0.54 | 1.23 | 0.02 | 0.06 | 18.71 |
|
2.32 | 3.75 | 0.82 | 2.09 | 10.15 |
|
5.04 | 6.55 | 3.26 | 4.91 | 40.70 |
|
1.25 | 1.73 | 0.82 | 0.78 | 24.18 |
|
0.35 | 0.47 | 0.09 | 0.27 | 1.91 |
|
0.01 | 0.04 | 0.01 | 0.00 | 0.53 |
|
3.91 | 26.43 | 6.92 | 2.28 | 55.02 |
| SOURCE: HCFA State Medicaid Research Files. NOTE: Numbers may not sum to total due to rounding. a. Includes children in other categories of Medicaid eligibility. |
|||||

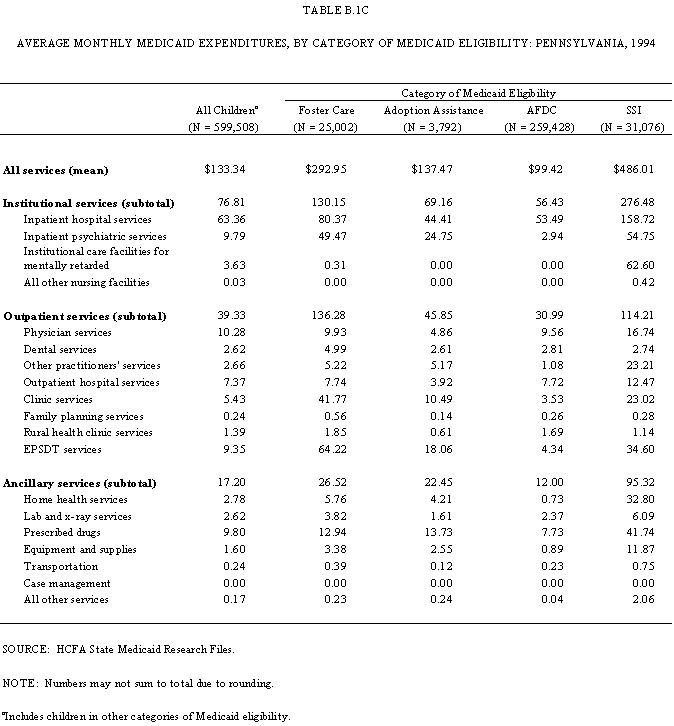
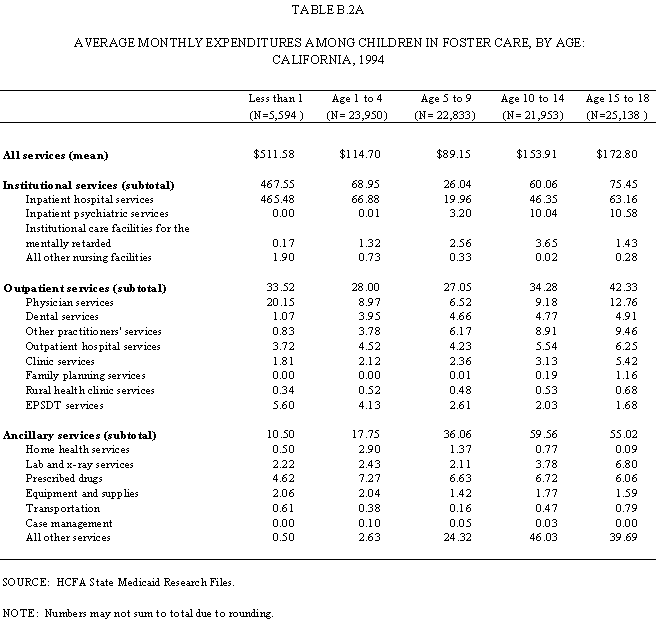
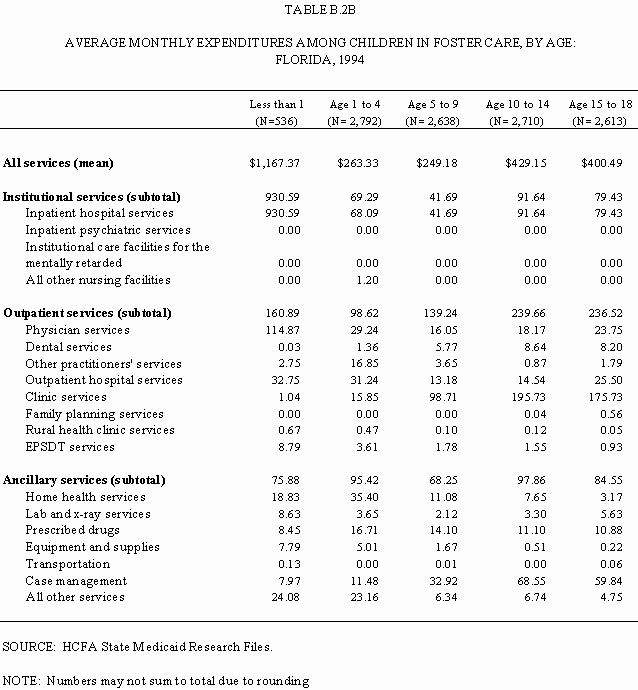
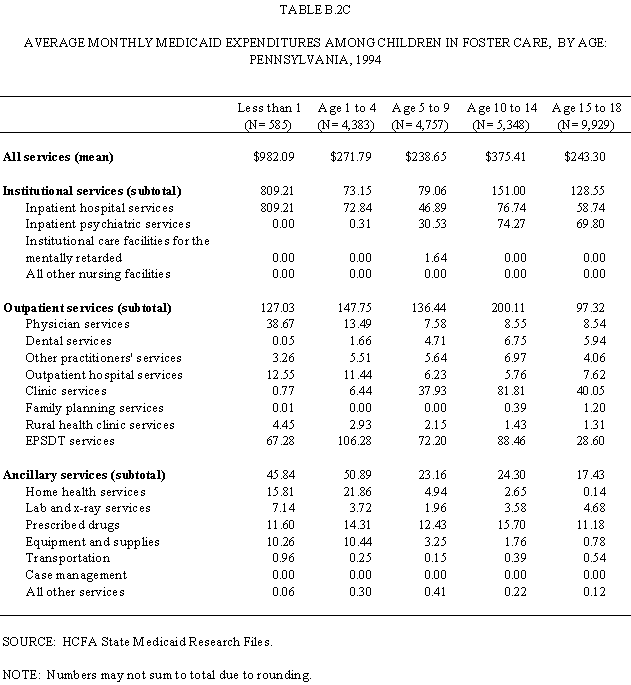
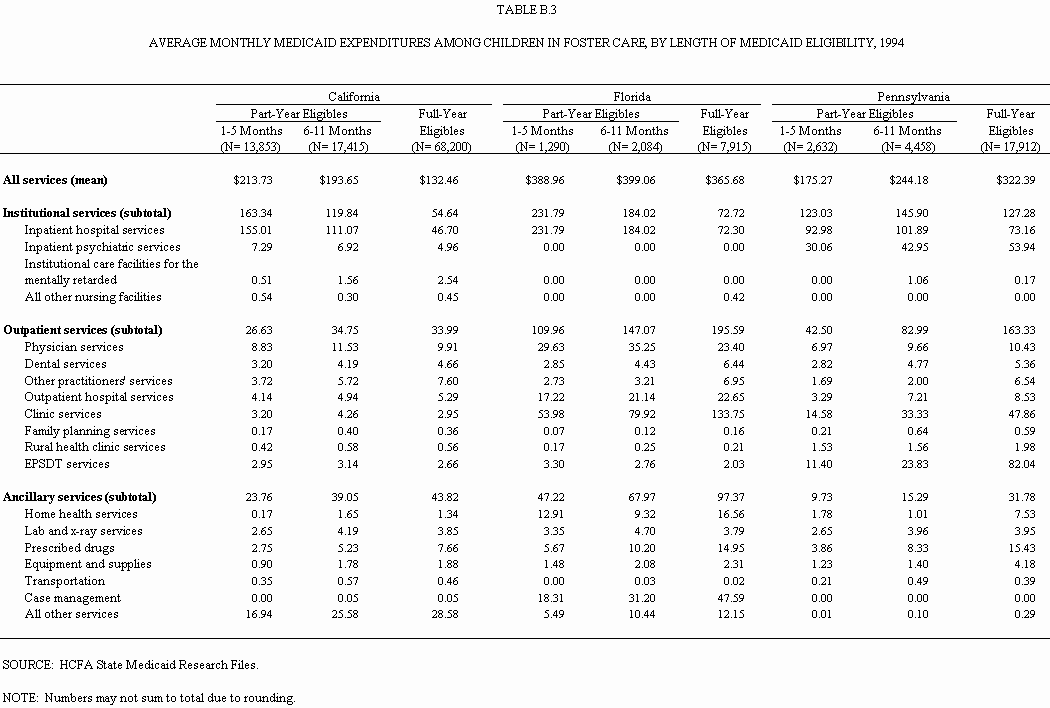
| Services | No Condition (N=31,513) |
Any Condition (N=67,955) |
Physical Condition Only (N=14,014) |
Mental Condtion Only (N=11,652) |
Both Physical and Mental Conditions (N=5,847) |
|
|---|---|---|---|---|---|---|
| All services (mean) | $55.13 | $368.75 | $341.63 | $300.47 | $569.83 | |
| Institutional services (subtotal) | 26.57 | 199.00 | 223.14 | 120.57 | 297.45 | |
| Inpatient hospital services | 25.39 | 175.84 | 218.93 | 93.01 | 237.60 | |
| Inpatient psychiatric services | 1.18 | 15.22 | 0.81 | 23.04 | 34.17 | |
| Institutional care facilities for the mentally retarded | 0.00 | 6.58 | 1.21 | 4.51 | 23.54 | |
| All other nursing facilities | 0.00 | 1.37 | 2.18 | 0.00 | 2.13 | |
| Outpatient services (subtotal) | 16.54 | 68.80 | 59.89 | 65.59 | 102.52 | |
| Physician services | 3.71 | 23.770 | 25.30 | 15.62 | 35.99 | |
| Dental services | 3.93 | 5.34 | 5.23 | 5.42 | 5.44 | |
| Other practitioners' services | 2.46 | 15.94 | 7.24 | 21.02 | 26.68 | |
| Outpatient hospital services | 2.14 | 11.39 | 10.69 | 8.79 | 18.29 | |
| Clinic services | 1.55 | 6.81 | 4.93 | 7.32 | 10.30 | |
| Family planning services | 0.21 | 0.62 | 0.46 | 0.59 | 1.08 | |
| Rural health clinic services | 0.30 | 1.07 | 1.16 | 0.86 | 1.25 | |
| EPSDT services | 2.26 | 3.91 | 4.88 | 2.96 | 3.50 | |
| Ancillary services (subtotal) | 12.01 | 100.96 | 58.60 | 117.32 | 169.86 | |
| Home health services | 0.18 | 3.50 | 5.85 | 0.02 | 4.82 | |
| Lab and x-ray services | 1.51 | 8.56 | 7.85 | 6.53 | 14.33 | |
| Prescribed drugs | 2.16 | 16.02 | 18.40 | 9.08 | 24.13 | |
| Equipment and supplies | 0.54 | 4.29 | 6.00 | 1.58 | 5.59 | |
| Transportation | 0.11 | 1.23 | 1.32 | 0.66 | 2.16 | |
| Case management | 0.00 | 0.12 | 0.21 | 0.00 | 0.15 | |
| All other services | 7.51 | 67.23 | 18.97 | 99.45 | 118.69 | |
| SOURCE: HCFA State Medicaid Research Files. NOTE: Numbers may not sum to total due to rounding. |
||||||