
U.S. Department of Health and Human Services
The Use of Nursing Home and Assisted Living Facilities Among Privately Insured and Non-Privately Insured Disabled Elders
Marc A. Cohen, Ph.D., and Jessica Miller, M.S.
LifePlans, Inc.
April 2000
PDF Version: http://aspe.hhs.gov/daltcp/reports/2000/nhalfuse.pdf (63 PDF pages)
This report was prepared under contract between the U.S. Department of Health and Human Services (HHS), Office of Disability, Aging and Long-Term Care Policy (DALTCP) and LifePlans, Inc. Additional funds were provided by the Robert Wood Johnson Foundation Home Care Research Initiative. For additional information about the study, you may visit the DALTCP home page at http://aspe.hhs.gov/daltcp/home.htm or contact the ASPE Project Officer, Pamela Doty, at HHS/ASPE/DALTCP, Room 424E, H.H. Humphrey Building, 200 Independence Avenue, SW, Washington, DC 20201. Her e-mail address is: Pamela.Doty@osaspe.dhhs.gov.
TABLE OF CONTENTS
- I. BACKGROUND
- II. PURPOSE
- III. METHOD
- A. Sample
- B. Data
- IV. FINDINGS
- A. Profiling Privately Insured Institutionalized Claimants
- B. Demographic Characteristics
- C. Examining Claimant Profiles and HIPAA Benefit Eligibility Criteria
- D. Service Use and Residence Before Current Residency
- E. Service Use and Cost in Long-Term Care Facilities
- F. Benefits Paid Under Insurance Contracts and Insurance Policy Design
- G. Claimant Satisfaction with Insurance Policy and Insurance Company
- H. Impact of Private Long-Term Care Insurance on Claimants
- I. Comparing Privately Insured and Non-Privately Insured Institutional Residents
- LIST OF FIGURES
- FIGURE 1: Distribution of Institutionalized Claimants by Residents
- FIGURE 2: Distribution of Claimants by Residence by Company
- FIGURE 3: Distribution of Claimants by Residence and Unit
- FIGURE 4: Self-Assessment of Health Status by Institutional Residence
- FIGURE 5: Primary Diagnosis at Admission by Residence
- FIGURE 6: Disability Status by Institutional Residence: Limitations in Activities of Daily Living (ADLs)
- FIGURE 7: ADLs for which Assistance is Provided by Residence
- FIGURE 8: Cognitive Impairment by Claimant Residence
- FIGURE 9: Help Received with IADLs by Residence
- FIGURE 10: Percentage of Claimants Meeting HIPAA Triggers by Site of Care
- FIGURE 11: Percentage of Claimants Not Meeting HIPPA Triggers by Company and Residence
- FIGURE 12: Use of Services before Current Institutionalization by Residence
- FIGURE 13: Residence before Current Institutionalization
- FIGURE 14: Average Daily Charges Billed for All Care by Level of Care by Residence
- FIGURE 15: Average Monthly Claims Payments by Residence
- FIGURE 16: Total Amount of Time on Claim by Residence
- FIGURE 17: Ratio of Daily Benefit Amount to Daily Charges by Residence
- FIGURE 18: Satisfaction with Long-Term Care Insurance by Residence
- FIGURE 19: Are Policy Benefits Meeting Current Care Needs?
- FIGURE 20: Ease of Filing Claim for Benefits by Institutional Setting
- FIGURE 21: Actions Insurer Might Have Taken to Help Claimant
- FIGURE 22: Impact of Policy Ownership on Movement between the Community and Current Residence
- FIGURE 23: Number of ADL Dependencies Among Disabled Nursing Home Residents
- FIGURE 24: Presence of Cognitive Impairment Among Disabled Nursing Home Residents
- FIGURE 25: Residence Before Current Institutionalization Among Disabled Nursing Home Residents
- FIGURE 26: Total Charges Billed for Previous Month in Nursing Home
- FIGURE 27: Number of ADL Dependencies Among Assisted Living Residents
- FIGURE 28: ADLs for which ALF Residents Receive Assistance by Insurance Status
- FIGURE 29: Presence of Cognitive Impairment Among Assisted Living Residents
- FIGURE 30: Residence before Current Residence in Assisted Living
- FIGURE 31: Average Monthly Charges for Assisted Living Residents
- LIST OF TABLES
- TABLE 1: Socio-Demographic Characteristics of Privately Insured Institutional Claimants Age 65 and Over
- TABLE 2: Services Received by Claimants Residing in Assisted Living Facilities and Nursing Homes
- TABLE 3: Primary and Secondary Payment Sources by Residence
- TABLE 4: Policy Design Features for Institutional Coverage
- TABLE 5: Socio-Demographic Characteristics of Privately Insured and Non-Privately Insured Disabled Nursing Home Residents Age 65 and Over
- TABLE 6: Services Received by Disabled Nursing Home Residents
- TABLE 7: Primary and Secondary Payment Sources of Nursing Home Residents
- TABLE 8: Socio-Demographic Characteristics of LTC Claimants and All Residents in Assisted Living Facilities
ACKNOWLEDGMENTS
This research could not have been completed without the assistance and guidance of many individuals both inside and outside of the long-term care insurance industry. We would like to gratefully acknowledge the assistance provided by Robert Glowacki, Carolyn Eickenberg, and Sharon O'Dell from Aegon, Roy Christianson and David Rogers from American Travellers, Ray Nelson and Leslie Peters from Bankers Life and Casualty, Carol McBrayer, Melissa Stinson, Steve French and Richard Garner from CNA Insurance, Dan Nitz from Fortis Long-Term Care, Roger Desjardins, Mary Katz and Armando Leiva from G.E. Capital Assurance, Linda Berg-Maney and Peter Bokjov from John Hancock, and Bonnie Davis and Jim DuEst from UnumProvident. All of these individuals devoted a significant amount of time to assure that the sample of home care claimants was representative, that data from administrative systems was uniform and accurate, and that the fieldwork could be completed successfully. We are grateful for their patience and good cheer during the entire research process.
The project's technical advisory group included Susan Morisato, FSA, Bankers Life and Casualty, Bob Yee, FSA, of G.E. Capital Assurance, Christopher Murtaugh, Ph.D., Center for Home Care Policy and Research, Vicki Freeman, Ph.D., Rand Corporation, Randy Brown, Ph.D., Mathematica Policy Research, Inc., Brenda Spillman, Ph.D., Agency for Health Care Policy and Research, Nancy Miller, Ph.D., Health Care Financing Administration. Along with Dr. Laurence Branch of Duke University, the committee provided critical input into the initial design of the project and its sampling strategy.
We would also like to acknowledge the assistance of Beth Jackson, Ph.D., and Laurie Meneades of Medstat in preparation of the 1989 and 1994 National Long-Term Care Survey Datasets.
Finally, we greatly appreciate the patience, guidance, and advice of our two project officers and financial sponsors: Pam Doty, Ph.D., at the Office of Disability, Aging and Long-Term Care Policy of the Department of Health and Human Services, Office of the Assistant Secretary for Planning and Evaluation and Penny Feldman, Ph.D., of the Robert Wood Johnson Foundation Home Care Research Initiative. Their unwavering support and encouragement enabled us to overcome many of the hurdles presented by a study of this magnitude.
Of course the contents of this report are the sole responsibility of its authors. Any errors are the authors alone.
EXECUTIVE SUMMARY
The dramatic growth in the number of Americans over age 75 coupled with the need to minimize the duration of expensive inpatient hospital care, portend continued reliance on nursing home care for a significant portion of the disabled population. Even in the presence of significant expansions in home and community-based care, the nursing home still remains a key provider of long-term care (LTC) services to more than 1.5 million people, most of whom are over age 65. Alternative institutional settings such as assisted living facilities (ALFs) are also growing in popularity. Today there are more than 28,000 such residences housing more than one million people, many of whom have limitations in activities of daily living (ADLs). Thus, institutional-based care has and will remain an important component of the long-term care service delivery system.
The costs associated with receiving long-term care in institutional settings are significant and pose a financial hardship to many individuals. To meet this hardship, a growing number of individuals are purchasing private long-term care insurance. Through a series of actions, the Federal government is also signaling its desire that individuals accept greater personal responsibility for planning and paying for their long- term care needs. Such actions include tax clarification of long-term care insurance contracts, a plan to implement a Federal employees long-term care insurance plan, and expenditures on education related to the risks and costs of long-term care.
While there is a growing body of knowledge about who buys policies and what motivates them to do so, there has been no systematic study of individuals in institutionalized settings who are receiving benefits under their long-term care insurance policies. On an industry-wide basis, no one knows whether claimants and/or their families feel they are getting good value for their premiums, and whether the presence of private insurance influences the type of care people receive in these settings.
The purpose of this report is to provide basic descriptive statistics on disabled private LTC insurance policyholders who have accessed long-term care benefits in institutional settings, and to compare such data and findings to non-privately insured institutionalized elders. We did this by interviewing 480 long-term care insurance claimants from seven participating companies receiving benefits under their policies and residing in nursing homes or assisted living facilities. Key findings of the study are presented below.
The Profile of Long-Term Care Insurance Claimants in Residential Care Facilities (Nursing Homes and Assisted Living Facilities)
-
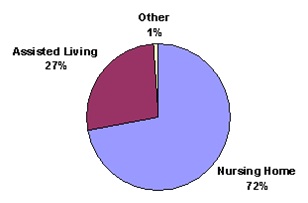
The majority of claimants in residential care facilities -- 72% -- were residing in nursing homes, and 28% were receiving services in assisted living facilities.
-
There are few differences in the socio-demographic profile of nursing home and assisted living claimants.
-
Most claimants in residential care facilities are over age 80, female, unmarried, highly educated and have incomes greater than $30,000.
-
The average income had by these residential facility claimants was about $33,000.
-
Married claimants are more likely to be in nursing homes than in assisted living facilities.
-
Slightly less than one in three claimants with dementia who are in residential care settings receive their care in assisted living facilities. Typically, the costs associated with caring for individuals in these facilities are less than in nursing homes. Thus, for some cognitively impaired individuals, private insurance coverage for assisted living care substitutes for more costly nursing home care.
-
Claimants in assisted living are about twice as likely to assess themselves to be in excellent health compared to those in nursing facilities. A parallel finding is that, compared to assisted living claimants, nursing home claimants are twice as likely to describe their health as poor.
-
The differences in the prevalence of specific diagnoses between residents of nursing homes and assisted living facilities are not statistically significant. This suggests that it is not the underlying primary diagnosis that differentiates individuals in each of these service modalities, but, instead, the way the diagnosis manifests itself.
-
The average number of ADL limitations for nursing home claimants is 4.7, whereas for assisted living claimants, this figure drops to 2.8 -- 79% of current claimants have two or more ADL limitations.
-
Among the participating companies, the average number of ADL limitations among nursing home claimants ranged from 4.0 to 5.2; for assisted living claimants, the range for the average number of ADL limitations was from 2.6 to 4.7.
-
For each ADL, the proportion of nursing home claimants in need of assistance is greater than the corresponding proportion of assisted living claimants.
-
The prevalence of cognitive impairment (as measured by diagnosis and orientation) is higher among nursing home claimants than it is among assisted living claimants. Overall, claimants in the nursing home are 1.3 times more likely to be cognitively impaired than are those found in assisted living facilities.
-
The proportion of claimants with cognitive impairment in the nursing home ranges between 75% and 86%, whereas in assisted living, the range is between 47% and 81%.
Claimants in Residential Care Facilities and HIPAA Eligibility Criteria
-
At the time of the in-person interview, almost all nursing home claimants had two or more ADL limitations or were cognitively impaired.
-
Only 78% of assisted living claimants met the HIPAA benefit eligibility criteria.
-
Individuals who did not meet HIPAA triggers in the assisted living facilities were much more likely to be unmarried, slightly less educated, and had somewhat lower levels of income. They also resided in facilities with lower daily charges -- $86 compared to $92.
-
About half (46%) of the assisted living residents who did not meet HIPAA benefit eligibility triggers had no ADL limitations at all.
Prior Residence and Service Use
-
About three in five (63%) of all nursing home residents and three in four (73%) assisted living residents had either been a previous resident in an assisted living facility or nursing home or had used home care prior to entering their current facility.
-
Almost half of assisted living residents had been in a different assisted living facility or nursing home before moving to their current residence.
-
About one-quarter of the assisted living residents had been transferred to assisted living from a nursing home. This suggests movement in both directions along the continuum of care: from nursing homes to assisted living and from assisted living to nursing homes.
-
About two in five facility residents had accessed formal home care services before their current admission to the facility.
-
The probability of entering a nursing home from a hospital is more than twice as high as entering an assisted living facility directly from a hospital -- 25% compared to 11%.
-
Prior to entering a residential care facility, between 43% and 47% resided in the community either alone or with their families.
Service Use, Costs and Payment Sources in Residential Care Settings
-
Claimants residing in nursing homes receive an average of five types of services each month, compared to four service types for assisted living claimants. This is not surprising, given the greater level of disability among nursing home claimants.
-
Nursing home residents use more medical services, skilled nursing care, nutritional services and social services than do assisted living claimants. In contrast, assisted living residents are much more likely to use transportation services.
-
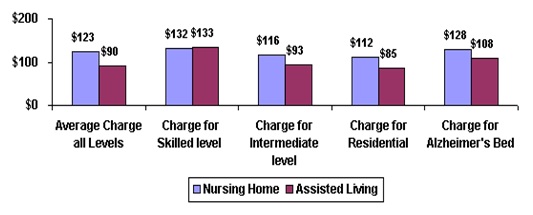
With the exception of charges for skilled care, charges for care provided at the intermediate, residential and Alzheimers level are significantly lower in assisted living facilities -- an average of 27% for these claimants.
-
Assisted living facilities enable Alzheimers patients to be cared for at a lower cost than care provided in a nursing home. For this block of claimants, the associated savings of being able to access cognitive-related care in an assisted living facility instead of a nursing home are16%.
-
Depending on institutional setting, the insurance is the primary payment source for between 70% and 80% of these claimants. What is not paid for by the insurance is typically funded from personal resources.
-
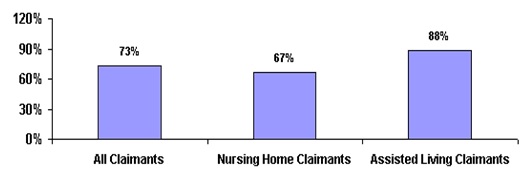
An average of 73% of the long-term care liability is paid for by insurance. For nursing home claimants, 67% of the costs are covered, whereas for assisted living residents, the average daily benefit pays for most (88%) of the incurred costs.
-
In cases where insurance is not the primary payment source for nursing home claimants, the average daily benefit is lower, there is less likelihood of having a policy with inflation protection, and the difference between the daily charge and the daily benefit is greater.
Benefits Paid Under Insurance Contracts and Insurance Policy Designs
-
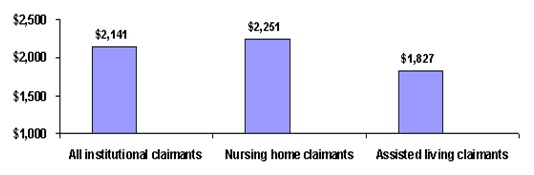
The average monthly insurance benefit paid to claimants is $2,141.
-
Monthly nursing home benefits are about 23% higher than assisted living benefits -- $2,251 versus $1,827.
-
These claimants have already used an average of $29,000 in insurance benefits per person -- $34,000 for nursing home residents and $16,000 for assisted living residents.
-
Most of these individuals (85%) have reimbursement policies covering four or more years of care at around $83 per day.
-
About two in five are eligible to receive over $100 per day in benefits for institutional care services; 45% of the claimants have policies that include some level of inflation protection.
-
The average value of available benefits is $161,000 and these individuals have thus far used up about 18% of their benefits.
-
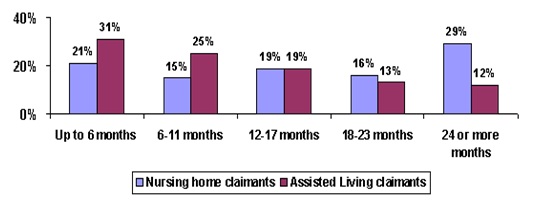
Most individuals have been on claim for about 17 months.
-
About 45% of nursing home residents have been receiving benefits for more than a year-and-a-half; the comparable figure for assisted living residents is 25%.
Claimant Satisfaction with Insurance Policy and Insurance Company
-
The vast majority of claimants are satisfied with their policy, with most being very satisfied.
-
The vast majority (85%) had no difficulty understanding what their policy covered.
-
Roughly four out of five assisted living claimants felt that the benefits were adequate, given their care needs; the corresponding figure for nursing home claimants was about three out of five residents.
-
Most individuals -- more than 70% -- found the process of filing a claim to be easy.
-
Assisted living claimants were more likely -- 1.7 times more likely -- to find the process of filing a claim to be difficult.
-
About 90% of all individuals filing claims had either no disagreements with their insurance companies or had a disagreement(s) that was resolved satisfactorily. About 4% of claimants felt their disagreement was not resolved satisfactorily.
Impact of Private Long-Term Care Insurance on Claimants
-
For about three-quarters of claimants, the presence of insurance was not viewed as having had an influence on service-seeking behavior.
-
One in five assisted living claimants, and one in eight nursing home claimants, indicated that the presence of insurance allowed them to delay their entry into an institution.
-
Roughly one in ten individuals indicated that they entered an institution sooner than they otherwise would have, given the presence of their insurance benefits. An analysis of the profile of these individuals suggests that they are typically older, have higher incomes, and are somewhat less ADL dependent than are those who did not change their behavior and enter an institution sooner.
-
Data suggests that, for some claimants, entry into the institution is motivated by social concerns as well as by a desire to be in a protective environment should additional declines in functioning occur.
Comparing Privately Insured and Non-Privately Insured Institutionalized Disabled Claimants1
Nursing Home Residents
-
On average, disabled nursing home residents with long-term care insurance are somewhat younger than their non-privately insured institutionalized counterparts: the proportion of privately insured claimants age 85 and over is only half that found in the general population of nursing home residents.
-
There also tends to be a greater proportion of privately insured male residents compared to other residents.
-
Residents with private long-term care insurance are 2.8 times more likely to be married than are those without such insurance.
-
Compared to non-privately insured nursing home residents, insured residents are four times as likely to be college educated and about 3.2 times more likely to have incomes greater than $20,000.
-
The privately insured sample is slightly more impaired compared to other residents. The average number of limitations for disabled long-term care insurance claimants is 4.9; this compares to between 4.4 and 4.7 limitations among non-privately insured residents.
-
The vast majority of disabled residents have some degree of cognitive impairment, although insured residents are somewhat less likely to be cognitively impaired.
- Privately insured disabled residents appear to receive fewer services than do other residents -- 5.4 services per month versus 6.7.
-
The non-insured resident population has somewhat greater medical or skilled care needs. This is borne out by their greater use of skilled nursing and medical services.
-
Non-privately insured residents have an average of 4.0 medical diagnoses whereas for claimants, the number is 3.0.
-
Data presented here suggests that, after gaining admission to a nursing home, the privately insured appear to use fewer services than that seen for other residents. Thus, if the costs associated with room and board are similar between privately insured and other residents, the former would be more profitable for two reasons: (1) the daily rate paid is likely to be higher than what is paid by other residents; and (2) service use is lower.
-
In nominal terms, the average charge among privately insured residents ($3,742) was between 27% and 40% higher than for other residents. After accounting for the impact of inflation, the difference narrows somewhat to between 10% and 22%.
-
For the privately insured, long-term care insurance and personal resources account for the major payer sources, whereas for the non-privately insured, Medicaid and personal resources comprise the primary payer sources.
Assisted Living Residents
-
Compared to other residents in assisted living, long-term care insurance claimants are somewhat younger, more likely to be male, and much more likely to be married. They also have somewhat higher income levels.
-
Long-term care insurance claimants in assisted living facilities have more disabilities than do non-privately insured residents. The average number of disabilities among claimants is 2.8, whereas among non-insured residents the comparable figure is 1.7.
-
About 75% of all assisted living residents have two or fewer ADL limitations. Among the privately insured, only 35% have fewer than two limitations.
-
For each ADL, higher proportions of insured residents exhibit dependency.
-
The greatest differences between the two groups relate to continence and toileting where claimants are between 1.8 and 2.8 times more likely to require assistance in these basic activities of daily living.
-
Assisted living residents with long-term care insurance are about twice as likely to be cognitively impaired, compared to all assisted living residents.
-
The monthly costs of care for insured residents ($2,700) are roughly 1.3 to 1.8 times higher than for other residents.
Whereas one might have thought that the continuum of care moves from home care to assisted living to nursing home care, the data present a more complicated picture. For some individuals, assisted living may actually substitute for remaining in the home and relying on formal home care services. Other claimants in assisted living facilities faced the alternative of nursing home care. Either way, it appears that, in the presence of comprehensive insurance coverage, one can expect greater use of lower intensity and more home-like institutional settings like assisted living. This presents opportunities to a sub-set of policyholders who would otherwise face more costly nursing home care.
Given the rapidly changing landscape of the service delivery network, insurers will need to continue to emphasize flexibility in their products. Along with such flexibility, however, is the need to keep consumers informed about the relationship between benefit levels and future service costs. This is particularly true for those accessing costly nursing home services. Here policy benefits cover a smaller fraction of the costs than in either the home or assisted living setting. While the presence of insurance will certainly alter service utilization patterns, few individuals seem to be drawn more quickly to seek institutional alternatives just because they have insurance. What the insurance does allow is the ability for disabled individuals to access a variety of services in alternative settings and to do so in a way that leaves these people very satisfied with their coverage.
I. BACKGROUND
The dramatic growth in the number of Americans over age 75, coupled with the need to minimize the duration of expensive inpatient hospital care, portend continued reliance on nursing home care for a significant portion of the disabled population. Between 1987 and 1996, the number of nursing homes and the number of nursing home beds both increased by almost 20% (Rhoades and Krauss, 1999). Yet, the growth in the elderly population over this time period outpaced the growth in nursing home beds. The fact that the number of beds did not keep pace with the growth in the elderly population is due to a number of factors. These include the imposition of restrictions on supply through Certificate of Need (CON) programs, an expanding home and community-based care network, growth in assisted living facilities, and a decline in age-specific rates of disability (Bishop, 1999; Lewin-VHI, 1991; Wiener, et al, 1998). Even though there has been a decline in nursing home use, however, the nursing home still remains a key provider of long-term care services to more than 1.5 million people, most of whom are over age 65.
Another institutional setting growing in popularity and serving disabled elders is assisted living. Assisted living facilities typically offer a combination of housing, health care, personal assistance and supportive services. The term "assisted living" refers to a type of care that combines housing and services in a homelike environment that strives to maximize the individual functioning and autonomy of the frail elderly and other dependent populations (Lewin-VHI, 1992). Today, there are more than 28,000 assisted living residences in the U.S., housing more than one million people; the typical assisted living resident is 83 years old, female, and slightly disabled, having limitations in 1.7 activities of daily living (National Center for Assisted Living, 1998).
There are substantial variations in the range of services that assisted living facilities provide and in the type of populations they serve. For the most part, individuals living in assisted living facilities are medically stable and do not require 24-hour nursing care. Most facilities provide or arrange for some level of personal care services for those individuals who may require them. In fact, about 70% of assisted living residences contract with a home health agency to provide skilled nursing, and 65% of residences contract with a hospice provider for hospice services (National Center for Assisted Living, 1998).
The growth in assisted living facilities reflects consumer demand for supportive living environments that closely parallel a "home-like" atmosphere. In addition, the growth in the sub-acute market may have begun to create a vacuum in the provision of traditional low-technology, facility-based long-term care that assisted living beds are designed to fill. Assisted living costs can range from 30% up to 100% of skilled nursing care costs (Raskin, 1995). Moreover, recent research suggests that transferring certain Alzheimer's patients from nursing homes to assisted living facilities could save up to 14% of long-term care costs (Leon, et al, 1999). These facilities may also achieve economies of scale in the delivery of home health care to frail elders that would be difficult to achieve if living alone in their own homes. Because elders overwhelmingly prefer to stay in their own homes or reside in congregate living situations compared to nursing homes, the assisted living modality is likely to continue to grow and expand.
Expenditures on institutional care are significant. As of 1997, the average private pay daily rate for nursing home care was $125 and the average nursing home cost approximately $50,000 per year (AARP, 1998). The average daily charge for assisted living was about $60 or $22,000 per year (ALFA, 1998). Not surprisingly, long-term care expenditures on nursing homes and related facilities now account for a growing share of total personal health expenditures. Among people aged 65 and older, expenditures on institutional care account for about 25% of personal health expenditures. The primary payers of long-term care institutional services include disabled elders and their families and the Medicaid program. In 1997, Medicaid spent over $32 billion on nursing home care (Burwell, 1998). This represents roughly 43% of the total nursing home bill, which was nearly $75 billion in that year. Currently, about 35 states cover, or plan to cover, assisted living or board and care as a Medicaid service (NIC, 1997). When the costs of assisted living are included, expenditures on institutional care settings reach $100 billion (Burwell, 1998; National Center for Assisted Living, 1998).
Historically, exposure to catastrophic cost risks of this nature has stimulated demand for private insurance, expanded public financing -- or both. Over the past decade, the potential of private long-term care insurance to become a significant source of financing for formal long-term care services has been much debated (See Cohen et al, 1987; Rivlin and Wiener, 1988; Friedland, 1990; Families USA, 1993; Crown, et al, 1992). Even as the debate continues, the individual and employer-group markets continue to grow significantly. Long-term care insurance is one of the fastest growing health insurance business lines; in 1999 alone, growth in premium from new sales was 13% (LifePlans, Inc. 2000). More than 5.5 million people will have at one time or another acquired a policy (HIAA, 1998).
Recent actions suggest that the federal government has now shifted much of its focus to private insurance to help address the long-term care financing problem. On August 5, 1999, the Senate and the House of Representatives approved the Taxpayer Refund and Relief Act of 1999 (H.R. 2488), which among other things proposed changing the tax status of premiums paid for long-term care (LTC) insurance contracts. Currently, individuals can deduct their insurance premiums if they itemize their deductions and their medical expenses exceed 7.5% of adjusted gross income. Under the new legislation, which was subsequently vetoed by President Clinton, individuals would have been able to take an "above the line deduction" of LTC insurance premiums. Individuals purchasing LTC insurance could have deducted the full amount of their premium payment from adjusted gross income, whether or not they itemized deductions or had medical expenses above the 7.5% threshold. The purpose of the proposed legislation was to use the tax code to encourage individuals to acquire private insurance to cover the potentially catastrophic costs of long-term care.
In his 1999 state of the union message, the President recommended that a new long-term care insurance program be established for federal employees. Moreover, in recognition of the financial burden imposed by informal caregiving, this year the President recommended that a tax credit of up to $3,000 per year be available to those caring for disabled relatives. With these actions, the federal government is continuing to signal its desire that individuals accept personal responsibility for planning and providing for their long-term care needs.
Questions remain, however, about whether private long-term care insurance represents a "good buy." Proponents of private long-term care insurance argue that its purchase is the only viable alternative to out-of-pocket spending or reliance on informal family caregiving for elders with incomes and assets above the means-tested eligibility levels for most publicly-funded long-term care service coverage. Critics question both the affordability of private long-term care insurance to the target market of middle-aged and "young-old" individuals and whether the product will meet the needs of those who purchase it.
Given anticipated changes in Federal policy with respect to Medicare and Medicaid, as well as recent attempts to further clarify the tax status of long-term care insurance, it is likely that the market will continue to expand. Yet, while there is a growing body of knowledge about who buys policies and what motivates them to do so (ACLI, 2000; HIAA, 1992 & 1995), there has been no systematic study of individuals in institutionalized settings who are receiving benefits under their long-term care insurance policies. On an industry-wide basis, no one knows whether claimants and/or their families feel they are getting good value for their premiums, and whether the presence of private insurance influences the type of care people receive in these settings.
The current study of institutionalized claimants is part of a larger study on Long-Term Care Insurance Claimants, funded by the Office of the Assistant Secretary for Planning and Evaluation (ASPE), Office of Disability, Aging and Long-Term Care Policy and the Robert Wood Johnson Foundation. The principal report was completed in April 1999 and is entitled: "A Descriptive Analysis of Patterns of Informal and Formal Caregiving among Privately Insured and Non-Privately Insured Disabled Elders Living in the Community." Two supplemental reports about the informal caregivers of these community-dwelling disabled elders and the use of multivariate modeling to understand service use were completed in December 1999. The current report focuses on the experiences of institutionalized claimants, that is, those who are receiving care in nursing homes and in assisted living facilities.
II. PURPOSE
The purpose of this research is to provide basic descriptive statistics on disabled private LTC insurance policyholders who have accessed long-term care benefits in institutional settings and to compare such data and findings to non-privately insured institutionalized elders. We intend to:
- provide detailed descriptive information on the socio-demographic and service utilization profile of disabled claimants residing in institutions receiving benefits under their LTC insurance policies;
- characterize the level and mix of services among disabled institutionalized claimants and compare this to a nationally representative sample of non-privately insured disabled elders residing in institutions;
- identify any factors associated with observed differences between the insured and non-insured groups in relation to the utilization of services;
- evaluate claimant and or family perceptions regarding the value of the LTC policy; and,
- discuss the implications of findings on the service delivery system as well as on the design of private and public LTC policies and programs.
Obtaining answers to these questions is important from a public policy and regulatory standpoint. The vast majority of LTC policies cover care provided in a variety of modalities. Thus, their proliferation in the market will affect the level and mix of publicly funded long-term care services. In the absence of "hard data" about the experience of claimants, it is difficult to develop targeted regulatory and consumer protection strategies related to claims issues. Also, if state and Federal governments wish to encourage development of the long-term care insurance market, it is important that there be adequate information about how the product is performing from the perspective of claimants and their families. This will assist the government in assessing the future potential of long-term care insurance.
Such information is also of interest to private insurers, who are trying to increase the market for long-term care insurance, and actuaries who are responsible for pricing long-term care insurance products. Often, the only information available to actuaries on a national basis is derived from uninsured experience among the general population of disabled elders (e.g. 1985 and 1995 National Nursing Home Survey and 1994 National Long-Term Care Survey). Information from these surveys may not accurately represent experience in an insured context. Thus, it is important to determine whether, and in what ways, the utilization of institutional services differs in the presence of long-term care insurance. This has implications for the way policies are designed, priced, and marketed.
III. METHOD
A. Sample
The study relied on the development of three analytic samples. These included:
- Privately insured institutionalized individuals who are accessing benefits under their LTC insurance policies (Institutional Claimants);
- Disabled institutionalized Medicare beneficiaries who do not have private LTC insurance (1994 National Long-Term Care Survey -- 1994 NLTCS sample);
- A sample of 1,409 nursing homes and 8,056 of their current residents (1995 National Nursing Home Survey -- 1995 NNHS).
Institutional Claimants
To be included in the privately insured claimant sample, individual claimants had to meet the following criteria:
- They had to be age 65 and over;
- They had to be classified as an active claim with at least one payment for institutional services; and
- They had to have a policy that covered both nursing home care and home and community-based services.
We asked each company to provide a sample of claimants who met these criteria. We focused on individuals with "dual-coverage" policies, rather than on those with policies covering only institutional care, because roughly 80% of all policies currently selling in the market cover services in at least these two modalities. By doing so, we could assure that study findings would be applicable in the future as well as in the present. Together, these eight companies provided an institutional claimant block of 583 eligible institutionalized individuals of whom 82% or 480 participated in the study.
The 1994 National Long-Term Care Survey
The 1994 National Long-Term Care Survey (NLTCS) was designed to collect data about the health and function of the Medicare beneficiary population age 65 and older. The questions were meant to identify persons who had certain disabilities or health problems lasting three months or longer. In general, the institutional section of the survey includes persons who were in the community in previous waves of the survey (i.e. 1982, 1984, 1989), both those screened in as disabled and those who did not pass the disability screen in a previous year. A sample of nursing home residents was included as well, so that the entire sample is representative of nursing home residents nationwide. The total 1994 NLTCS sample of institutionalized elders consisted of 1,335 individuals.
The 1995 National Nursing Home Survey
The 1995 National Nursing Home Survey is a two-stage design with a probability sample of 1,500 nursing facilities in the first stage and up to six current residents per facility in the second stage of sampling. The facilities included in the universe were nursing and related care homes in the United States that had three or more beds, were staffed for use by residents, and routinely provided nursing and personal care services. The sample of current patients was obtained by randomly selecting up to six residents who were on the rolls of nursing homes as of midnight the night prior to the day of the survey. In total, 1,409 nursing homes participated in the study, and there is data available on 8,056 of their residents.
B. Data
Sources of Information
Seven of the largest LTC insurance companies in the U.S. participated in the study and contributed a sample of claimants residing in institutional settings. These companies also provided data from their administrative and claim systems to supplement information collected directly from claimants.
The participating companies included: (1) Aegon; (2) American Travellers; (3) Bankers Life and Casualty; (4) CNA Insurance; (5) Fortis Long-Term Care; (6) G.E. Capital Assurance; and (7) UnumProvident. Together their claimant blocks comprise more than 80% of all open institutional claims. These companies also represent diverse market segments and policy designs, and employ differing underwriting and claims management strategies.
As mentioned, in addition to the information provided by the LTC insurance industry, we analyzed information from the 1994 National Long-Term Care Survey (1994 NLTCS).2 This data allowed us to make comparisons between privately insured and non-privately insured disabled elders living in the community. Questions on the claimant survey were designed to mirror those on the 1994 NLTCS; this assured that accurate comparisons between the privately insured and non-privately insured samples could be made. Many of the questions on the claimant survey were also designed to correspond to those found on the 1995 National Nursing Home Survey. This enabled us to compare the types of facilities and service packages used by the privately insured and the non-privately insured.
Data Collection
We gathered data from all privately insured institutionalized claimants via in-person interviews conducted by trained nurses and social workers with at least two years of geriatric experience. Each interviewer underwent comprehensive training to assure inter-rater reliability. Information garnered from these interviews was then linked to policy design and claim information generated from the administrative systems of the participating insurance companies. Most often, we conducted interviews with proxies, primarily family members including spouses and children. When necessary, we gathered information from a claimant's chart or the nurse most familiar with their care. In some instances, where the claimant was found to be cognitively intact, we conducted the interview with the claimant themselves. We also collected a great deal of administrative and billing information pertaining to charges, bed classification, facility licensure, and payer source. We completed the fieldwork between January 1999 and January 2000. It is important to note that each completed survey underwent a detailed quality review by home-office staff. In some cases, surveys had to be returned to the field either because certain data elements were not complete or because of the presence of clinical discrepancies.
IV. FINDINGS
A. Profiling Privately Insured Institutionalized Claimants
Residence
Figure 1 shows the distribution of claimants by institutional setting. As shown, the majority of individuals (72%) were residing in nursing homes, although a significant percentage was receiving services in assisted living facilities.
| FIGURE 1: Distribution of Institutionalized Claimants by Residence |
 |
| SOURCE: 2000 National Claimant Study. |
Given the fact that the assisted living industry experienced its rapid growth only over the past five to ten years, this represents a particularly high percentage of individuals using this service. Because there are major differences between assisted living facilities and traditional nursing homes, almost all subsequent analyses will distinguish between the two.
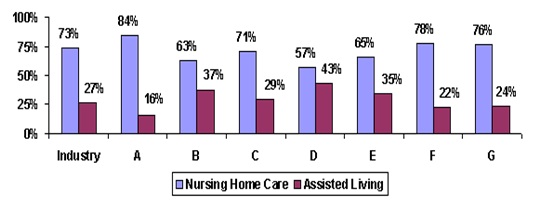
Figure 2 shows that there is a great deal of variation across the participating companies regarding the use of nursing and assisted living facilities among claimants.3, 4
| FIGURE 2: Distribution of Claimants by Residence by Company |
 |
| SOURCE: 2000 National Claimant Study. |
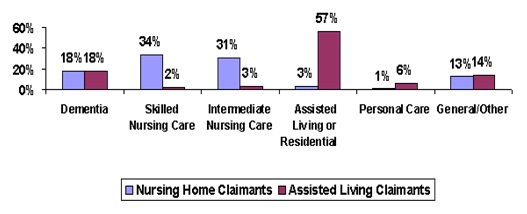
The next figure shows the distribution of claimants by the type of unit in which they reside. Again, data is presented for claimants in nursing homes and in assisted living facilities. Most striking is the fact that about 30% of dementia patients receive their care in assisted living facilities. As shown in Figure 3, about 18% of private long-term care claimants in both nursing homes and assisted living facilities are in specialized dementia units within these facilities. Typically, the costs associated with caring for individuals in these facilities are less than in nursing homes (Leon, et al, 1999). Thus, for some cognitively impaired individuals, private insurance coverage for assisted living care substitutes for more costly nursing home care.
Also noteworthy is the fact that most claimants are not receiving skilled care services but intermediate and personal care services. This finding supports the notion that private long-term care insurance is designed to pay for chronic care needs rather than post-acute recuperative needs. Data on bed classification at the time of assessment also support this proposition -- less than half of all institutional claimants were receiving skilled care or rehabilitation/sub-acute care.
| FIGURE 3: Distribution of Claimants by Residence and Unit |
 |
| SOURCE: 2000 National Claimant Study. |
Not shown in the figure is the fact that 60% of nursing home claimants and 82% of assisted living claimants reside in for-profit facilities.
B. Demographic Characteristics
The table below displays the demographic profile of institutional claimants.
| TABLE 1: Socio-Demographic Characteristics of Privately Insured Institutional Claimants Age 65 and Over | ||
| Socio-Demographic Characteristics | Nursing HomeClaimants(n=338) | Assisted LivingClaimants1(n=128) |
| Average Age | 81 years | 81 years |
| 65-69 | 2% | ---- |
| 70-74 | 13% | 11% |
| 75-79 | 27% | 20% |
| 80-84 | 32% | 38% |
| 85+ | 26% | 31% |
| Gender | ||
| Male | 34% | 28% |
| Female | 66% | 72% |
| Marital Status | ||
| Never married | 5%* | 5% |
| Married | 44% | 34% |
| Divorced/separated | 4% | 2% |
| Widowed | 47% | 59% |
| Race | ||
| White (not Hispanic) | 99%** | 96% |
| Non-White | 1% | 4% |
| Education Level | ||
| Less than High School Graduate | 17% | 11% |
| High School Graduate | 22% | 27% |
| Technical/Trade/Business | 12% | 7% |
| Some College | 17% | 20% |
| College Graduate | 32% | 35% |
| Total Annual Income | (n=228) | (n=92) |
| Up to $20,000 | 30% | 29% |
| $20,000 - $39,999 | 51% | 45% |
| $40,000 - $59,999 | 11% | 9% |
| $60,000 - $74,999 | 3% | 9% |
| $75,000 - $100,000 | 3% | 3% |
| Greater than $250,000 | 4% | 5% |
| Estimated Current Value of Home | (n=137) | (n=38) |
| Less than $75,000 | 20% | 21% |
| $75,000 - $99,999 | 23% | 18% |
| $100,000 - $149,999 | 29% | 34% |
| $150,000 - $199,999 | 13% | 13% |
| $200,000 - $249,999 | 4% | --- |
| Greater than $250,000 | 11% | 13% |
SOURCE: 2000 National Claimant Study.NOTE: * Significant at the .10 level; ** Significant at the .05 level.
| ||
For the most part, there are few differences in the socio-demographic profile of nursing home and assisted living claimants. While it appears that there are slightly more females in assisted living than in nursing homes, the difference is not statistically significant. A surprising finding is that married claimants are more likely to be in nursing homes than in assisted living facilities. This may reflect the fact that if one member of a couple becomes disabled the spouse may choose to remain in their home rather than move to an assisted living facility. For the disabled individual, the difference between being alone in an assisted living facility versus a nursing home may not be so great. Given that most elders who become disabled do experience additional declines, the opportunity to move once, rather than twice, may also be a contributing factor explaining this finding. It may also be the case that married individuals in nursing homes are more disabled than married individuals in assisted living facilities.
Regarding race, a slightly higher proportion of non-white claimants reside in assisted living. Finally, in terms of education level, income and estimated value of housing (for individuals who still own a home), there were few differences between the groups. The average income had by these institutional claimants was about $33,000.
Health Status
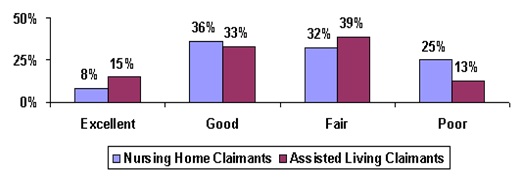
Respondents were asked a number of questions relating to their health status. The figure below illustrates how claimants assessed their health status at the time of the in-person interview. Not surprisingly, claimants in assisted living are about twice as likely to assess themselves to be in excellent health compared to those in nursing facilities. A parallel finding is that compared to assisted living claimants, nursing home claimants are twice as likely to describe their health as poor. These differences are significant at the .01 level.
| FIGURE 4: Self-Assessment of Health Status by Institutional Residence |
 |
| SOURCE: 2000 National Claimant Study.NOTE: Differences are significant at the .01 level. |
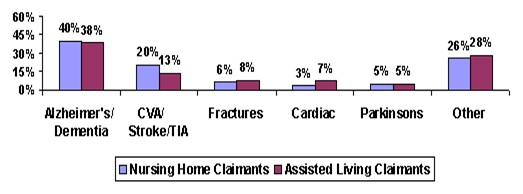
An additional measure for the overall health status of individuals is the presence of particular diagnoses at admission to a facility. Almost all individuals had at least one medical diagnosis at admission to a facility. Figure 5 shows that roughly 70% of claimants in either nursing homes or assisted living facilities had one of five major primary diagnoses. Dementia related diagnoses were present in about 40% of all claimants. The differences in the prevalence of specific diagnoses between residents of nursing homes and assisted living facilities are not statistically significant. This suggests that it is not the underlying primary diagnosis that differentiates individuals in each of these service modalities, but instead the way the diagnosis manifests itself.
| FIGURE 5: Primary Diagnosis at Admission by Residence |
 |
| SOURCE: 2000 National Claimant Study. |
Disability Status
The next three figures illustrate the extent of disability among privately insured institutional claimants. Disability is measured in three ways: (1) the number of limitations in ADLs; (2) whether or not someone is cognitively impaired, as determined by medical diagnosis, or their orientation to person, time and place; and (3) the presence of limitations in higher order functions or selected instrumental activities of daily living (IADLs).
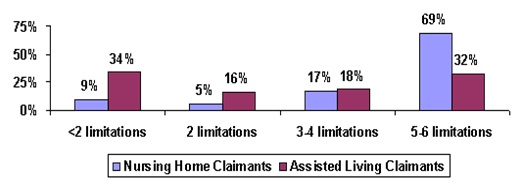
Most currently available LTC policies require an individual have at least two ADL limitations or be cognitively impaired in order to qualify for benefits. All currently issued tax-qualified policies have such a requirement. Older and non-tax qualified policies do, however, enable an individual to access benefits if LTC services were deemed by a physician to be "medically necessary".5 Seventy-nine percent of current claimants in residential facilities have two or more ADL limitations. As shown in Figure 6, 91% of claimants in nursing homes and 66% of claimants in assisted living facilities have at least two ADL limitations. The average number of ADL limitations for nursing home claimants is 4.7, whereas for assisted living claimants this figure drops to 2.8. Not shown in the diagram is the fact that, among the participating companies, the average number of ADL limitations among nursing home claimants ranged from 4.0 to 5.2; for assisted living claimants the range for the average number of ADL limitations was from 2.6 to 4.7.6
| FIGURE 6: Disability Status by Institutional Residence: Limitations in Activities of Daily Living (ADLs) |
 |
| SOURCE: 2000 National Claimant Study.NOTE: Differences are significant at the .01 level. The Activities of Daily Living measured include bathing, dressing, toileting, transferring, continence and feeding. |
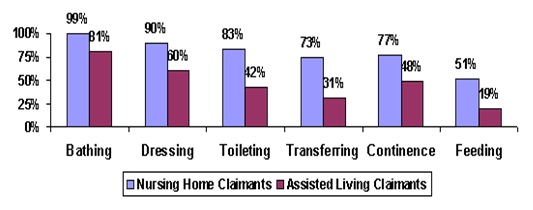
Figure 7 displays the specific ADLs for which assistance is needed. As shown, for each ADL, the proportion of nursing home claimants in need of assistance is greater than the corresponding proportion of assisted living claimants. These differences are statistically significant at the .01 level. The figure also demonstrates the hierarchical nature of ADL loss. With the exception of continence, the typical pattern of loss begins with bathing and then moves to dressing, toileting, transferring and feeding. This is exactly the pattern observed among claimants in each of these institutional residences.
| FIGURE 7: ADLs for which Assistance is Provided by Residence |
 |
| SOURCE: 2000 National Claimant Study. |
It is also important to note that most nursing facilities do not allow individuals to bathe on their own. Therefore, by regulation all residents receive assistance in bathing.
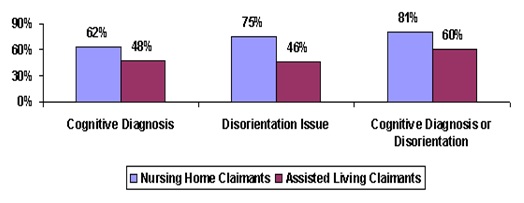
Figure 8 displays the claimant sample by cognitive status. The prevalence of cognitive impairment (as measured by diagnosis and orientation) is higher among nursing home claimants than it is among assisted living claimants. Overall, claimants in the nursing home are 1.3 times more likely to be cognitively impaired than are those found in assisted living facilities. It is also true that orientation problems are less prevalent among assisted living residents.
How does this finding correspond to the earlier result that roughly 18% of claimants in both assisted living and nursing homes are in dementia units? Data presented in Figure 8 suggests that while roughly five in eight assisted living claimants has some level of cognitive impairment, many would only be considered moderately or mildly impaired. Thus, they are not residing in dementia/Alzheimer's units. Regarding the nursing home claimants, many with cognitive impairment are actually treated in other units for medical and personal care issues. Thus, most of them are also not residing in a specialty care unit for the cognitively impaired.
| FIGURE 8: Cognitive Impairment by Claimant Residence |
 |
| SOURCE: 2000 National Claimant Study.NOTES: Differences are significant at the .01 level. Cognitive impairment is measured either by having a cognitive diagnosis at admission or at the time of the interview, or being oriented to person, time or place only sometimes or never. |
Because companies use different underwriting techniques to identify individuals who may be at high risk for becoming cognitively impaired, there is a great deal of variation between companies in the number of claimants with cognitive impairment issues. The proportion of claimants with cognitive impairment in the nursing home ranges between 75% and 86% whereas in assisted living, the range is between 47% and 81%. Some companies conduct more intensive in-person assessments during the policy application process, while others rely more heavily on medical records or phone interviews. Clearly, some companies are more successful than others at identifying the risk of cognitive claims. Also, policy designs and claims adjudication procedures may lead to variability in the number of claimants with cognitive impairment.
Another measure of one's disability status is the ability to perform IADLs. These higher order activities must also be performed as part of independent living. Such activities typically include shopping, laundry, light housework, outdoor mobility, managing medications, managing money, getting to places out of walking distance, and meal preparation. Loss of the ability to perform these activities is usually a precursor to loss of ADL function.
While useful in tracking levels of functional capacity, there are shortcomings with this measure. One difficulty with relying on IADLs to measure disability is that many of them are role-related. That is, an individual may never prepare meals because his or her spouse has always prepared them. Not being able to prepare a meal would not necessarily be indicative of one's lack of ability to do so. Also, in institutional settings, as a matter of routine, many IADLs are performed for individuals by staff. Therefore, a more specialized list has been developed to measure disability in these higher order functions for individuals in institutional settings. We asked claimants whether or not they receive any personal help or supervision in:
- Managing money;
- Caring for personal possessions such as clothing, toiletries, etc.;
- Securing personal items such as newspapers, toilet articles, or snack food; and
- Using the telephone (dialing or receiving calls).
Figure 9 shows that for each of these activities, a greater proportion of nursing home claimants receive help than do assisted living claimants. With the exception of telephone use, the majority of claimants receive some level of assistance in these activities.
| FIGURE 9: Help Received with IADLs by Residence |
 |
| SOURCE: 2000 National Claimant Study.NOTE: Differences are significant at the .01 level. |
C. Examining Claimant Profiles and HIPAA Benefit Eligibility Criteria
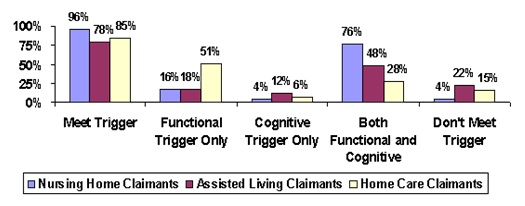
In the HIPAA (i.e. Kennedy-Kassebaum) legislation, long-term care insurance policies are tax qualified if access to benefits is limited to (1) individuals with at least two ADL limitations or (2) individuals who are moderately or severely cognitive impaired. Figure 10 shows that, at the time of the in-person interview, almost all nursing home claimants met these criteria. Only 78% of assisted living claimants met the criteria. Taken together, these findings suggest that, depending on site of care, somewhere between 4% and 22% of claimants would not have met HIPAA triggers at the time of the in-person interview. By way of comparison, we also provide data on home care claimants. Additional analysis does reveal, however, that most of these individuals were either on their way to becoming more disabled or were in the process of improving in function.
| FIGURE 10: Percentage of Claimants Meeting HIPAA Triggers by Site of Care |
 |
| SOURCE: 2000 National Claimant Study. |
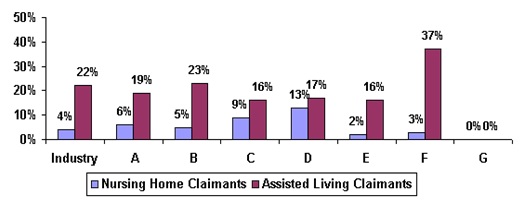
Figure 11 shows that there is a high degree of variation among companies regarding the proportion of institutionalized claimants who at the time of the interview did not meet HIPAA benefit eligibility triggers.7
| FIGURE 11: Percentage of Claimants Not Meeting HIPAA Triggers by Company and Residence |
 |
| SOURCE: 2000 National Claimant Study. |
Individuals who did not meet HIPAA triggers in the assisted living facilities were much more likely to be unmarried, slightly less educated, and had somewhat lower levels of income. They also resided in facilities with lower daily charges -- $86 compared to $92. Finally, 46% of the assisted living residents had no ADL limitations.
D. Service Use and Residence before Current Admission
For the most part, when individuals enter institutional settings it is only after alternatives have been tried in the community. That is, unless there has been a severe acute event (e.g. stroke) that leads to significant functional limitations necessitating immediate institutionalization, many individuals first experience declines in the community before entering an institution. Only after informal support networks or paid care can no longer meet an individual's needs in the community do individuals tend to move to institutional settings.
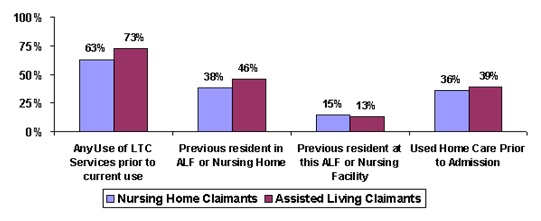
All claimants in this sample have insurance policies that cover home and community-based care services as well as institutional services. We asked whether or not they had received any home or community-based services or whether they had resided in other long-term care institutions prior to their current residence. Figure 12 summarizes results.
| FIGURE 12: Use of Services before Current Institutionalization by Residence |
 |
| SOURCE: 2000 National Claimant Study. |
The majority of individuals had accessed long-term care services before entering their current institution. In fact, 63% of all nursing home residents had either been a previous resident in an assisted living facility or nursing home or had used home care prior to entering their current facility. The comparable figure for assisted living claimants is 73%. Given that entry to a nursing home is often precipitated by an acute incident, it is not surprising that fewer nursing home residents accessed long-term care services before entering a nursing home.
Almost half of assisted living residents had been in a different assisted living facility or nursing home before moving to their current residence; about one-quarter of the assisted living residents had been transferred to assisted living from a nursing home. This suggests movement in both directions along the continuum of care: from nursing homes to assisted living and from assisted living to nursing homes. It also indicates a very high "moving rate" among these individuals.
About two in five institutionalized residents had accessed formal home care services before their current admission to the facility. The proportion is slightly higher among assisted living residents, again suggesting that a greater number of nursing home residents had likely experienced an acute incident that necessitated immediate institutionalization in a nursing facility.
Given that these claimants had policies that covered both home care and institutional care services, it is surprising that less than half had used home care benefits. There are a number of possible explanations for this. First, it may be that these individuals want to conserve their insurance benefits to pay for the care that carries with it the greatest financial risk -- institutional care. They may be able to rely on informal caregivers to provide the level of care needed in the community. Second, although the financing may be in place, the service infrastructure may not be available to provide significant amounts of home and community-based care. Finally, it may also be the case that these claimants did not fully understand that their policies covered home care services.
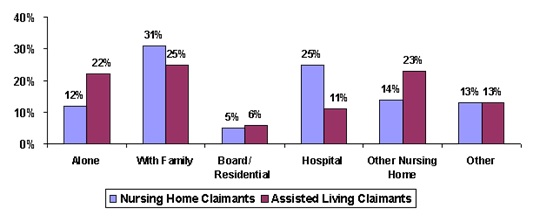
Figure 13 shows that the probability of entering a nursing home from a hospital is more than twice as high as entering an assisted living facility directly from a hospital. Data also indicate that prior to entering an institution, between 43% and 47% resided either alone or with their families.
| FIGURE 13: Residence before Current Institutionalization |
 |
| SOURCE: 2000 National Claimant Study. |
E. Service Use and Cost in Long-Term Care Facilities
Long-term care services are often classified as being either home or community-based or institutional in nature. Analyses of individuals' use of home care services typically focus on the type of service (e.g. home health aide, therapist, nurse, etc) and its frequency and duration of provision. Such is not the case when it comes to institutional alternatives. For the most part, the discussion stops with the observation that an individual has moved into a nursing home or assisted living facility. Few researchers have adequately focused attention on the service packages that are provided -- as opposed to offered -- to residents once in a facility.
In Table 2, we show the proportion of residents receiving various services related to their long-term care, social and acute care needs. Claimants or their proxies were asked the following question:
In the last month (since date one month ago), which of these services did you receive, either inside or outside this facility?
The assessor was also instructed to refer to the insured's medical and administrative chart and verify and/or obtain the information requested. As shown in Table 2, claimants residing in nursing homes received an average of five types of services during the previous month; this compares to about four types for assisted living claimants.
| TABLE 2. Services Received by Claimants Residing in Assisted Living Facilities and in Nursing Homes | ||
| Services | Nursing Home | Assisted Living |
| Average number of services received | 5.4*** | 3.9 |
| Dental care | 22% | 23% |
| Equipment or devices | 41%** | 30% |
| Medical services | 71%*** | 46% |
| Mental health services | 7% | 6% |
| Skilled nursing services | 56%*** | 15% |
| Nutritional Services | 50%*** | 26% |
| Occupational Therapy | 9%* | 5% |
| Personal Care | 87%*** | 64% |
| Physical Therapy | 23%** | 15% |
| Medicines (prescribed or non-prescribed) | 93%*** | 83% |
| Social services | 31%*** | 11% |
| Transportation | 31% | 48%*** |
| SOURCE: 2000 National Claimant Study.NOTE: * Significant at the .10 level; ** Significant at the .05 level; *** Significant at the .01 level. | ||
Given their greater level of disability, this finding is not surprising. The greatest differences relate to nursing home residents' greater use of medical services, skilled nursing care, nutritional services and social services. In contrast, assisted living residents are much more likely to use transportation services. This likely reflects their greater ability to move about outside of their facility. Excluding medications, the most commonly used service among assisted living claimants is personal care.
The charges associated with the services provided in these institutional settings vary greatly.8 Recent data suggests that the average private pay rate in a nursing home is about $125 (AARP, 1998). Figure 14 shows the average charges for these claimants according to the type of bed in which they resided. As shown, the average charge for nursing home claimants is similar to the AARP figure of $125 per day.
| FIGURE 14: Average Daily Charges Billed for All Care by Level of Care by Residence |
 |
| SOURCE: 2000 National Claimant Study. |
The data clearly indicate that with the exception of charges for skilled care, charges for care provided at the intermediate, residential and Alzheimer's level are significantly lower in assisted living facilities -- an average of 27% for these claimants.9 The finding regarding care for Alzheimer's patients is particularly striking, given that such patients have traditionally been cared for in nursing homes and that they represent a significant proportion of institutional claimants. Assisted living facilities have enabled such patients to be cared for at a lower cost to the claimant as well as to the insurance company. Other recent research found that among non-privately insured individuals, care for Alzheimer's patients is cheaper -- by about 14% -- when provided in assisted living facilities as opposed to a nursing home (Leon et al, 1999). For the privately insured claimants in this study, the associated "savings" of being able to access assisted living instead of nursing home care for cognitive-related needs are 16%.
We asked claimants what was their primary source of payment for their previous month's charges. We also asked them about their secondary sources of payment. Table 3 summarizes results.
Long-term care insurance is not the primary payment source at admission to a nursing home or assisted living for most (70%) of these claimants. The insurance is only accessed at a later point either when individuals have completed their elimination period, or when individuals have reached a point of functional or cognitive decline that would allow them to access benefits from the policy. Depending on institutional setting, the insurance does become the primary payment source for between 70% and 80% of these claimants. What is not paid for by the insurance is typically funded from personal resources. Medicare is only a significant payment source for about one-third of nursing home residents, but only at initial admission. Within a few months, Medicare ceases to be a meaningful payer of services in the nursing home.
| TABLE 3. Primary and Secondary Payment Sources by Residence | ||||||
| Sources of Payment | Primary Payment Source at Admission | Primary Payment Source Last Month | Secondary Payment Sources Last Month | |||
| Nursing Home | Assisted Living | Nursing Home | Assisted Living | Nursing Home | Assisted Living | |
| LTC Insurance | 31% | 32% | 71% | 80% | 24% | 20% |
| Other private insurance | 1% | 5% | 1% | 1% | 6% | 6% |
| Own Income and Assets | 37% | 56% | 21% | 19% | 67% | 58% |
| Medicare | 28% | 4% | 2% | ---- | 3% | 4% |
| Other government | ---- | 2% | 2% | ---- | 2% | ---- |
| Other payment source | ---- | ---- | ---- | ---- | 1% | 3% |
| Don't know | 3% | 1% | 2% | 1% | 4% | 6% |
| SOURCE: 2000 National Claimant Study.NOTE: The percentages for the primary and secondary payment sources do not always sum to 100% because some indivduals do not know which is there primary and which is their secondary payment source. | ||||||
It is surprising that for roughly 30% of nursing home claimants, insurance is not their primary payment source. In most of these cases, the insurance benefit represents less than half of the daily charge associated with care. Additional analysis reveals that, in cases where insurance is not the primary payment source for nursing home claimants, the average daily benefit is lower, there is less likelihood of having a policy with inflation protection, and the difference between the daily charge and the daily benefit is greater. These individuals also tend to be somewhat more ADL impaired, are more likely to be cognitively impaired, and are less likely to be married.
F. Benefits paid under Insurance Contracts and Insurance Policy Designs
In these institutional settings, claimants are receiving significant amounts of care. Much of this care is paid for by insurance benefits. In fact, for more than 70% of claimants, insurance pays the majority of the costs of care. Figure 15 shows that the average monthly insurance benefit paid to claimants is $2,141. Monthly nursing home benefits are about 23% higher than assisted living benefits -- $2,251 versus $1,827.
These figures must be viewed with caution, because they are derived by taking the current claim's total dollar expenditure and dividing this by the amount of time that the individual was on claim. The total dollar expenditure is a function of submitted bills by the claimant or the institution. In some cases, claimants (or their families) may aggregate or hold bills for a few months before submitting them for payment to the insurance company. Given our method of calculation, we may actually underestimate the average monthly claim payment by residence. A completely accurate accounting would require us to focus on the experience of closed claims, something that is outside the scope of the current inquiry.
| FIGURE 15: Average Monthly Claims Payments by Residence |
 |
| SOURCE: 2000 National Claimant Study. |
Not shown in the diagram is the fact that, as of the interview date, this sample of claimants had already used an average of $29,000 in insurance benefits per person -- $34,000 for nursing home residents and $16,000 for assisted living residents. Given that most of these individuals (60%) have policies covering four or more years of care at around $83 per day -- about $161,000 in available benefits -- these individuals have thus far used up about 18% of their benefits (see Table 4). There is greater variation in monthly benefit payments among assisted living residents than among nursing home residents. The range in average monthly benefit payments across the companies for nursing home care is from a low of $1,714 to a high of $2,722; for assisted living the range is between $1,207 and $2,575.
Most individuals have been on claim for about 17 months (see distribution in Figure 16). About 45% of nursing home residents have been receiving benefits for more than a year-and-a-half; the comparable figure for assisted living residents is 25%.
| FIGURE 16: Total Amount of Time on Claim by Residence |
 |
| SOURCE: 2000 National Claimant Study. |
Table 4 summarizes the typical policy design features of this study's institutional claimants. In general, there are three types of benefit designs:
-
Indemnity model, which pays a fixed level benefit when an individual becomes disabled and long-term care expenses are incurred. The payment may be larger or smaller than the actual cost of services and bears no direct relationship to such expenses.
-
Reimbursement model, which reimburses costs of covered services for eligible individuals up to a maximum daily amount. In this model, insurance benefits are directly related to the incurred long-term care costs.
-
Disability model, which pays benefits directly to the insured when the individual becomes disabled, whether or not long-term care expenses are incurred. The insured has the freedom to spend the disability payment on whatever services he/she deems appropriate.
| TABLE 4. Policy Design Features for Institutional Coverage | |
| Policy Design Feature | Distribution |
| Payment Method | |
| Reimbursement | 85% |
| Indemnity | 14% |
| Disability | 1% |
| Institutional Care Daily Benefit Amount | |
| $50 | 14% |
| $51 to $74 | 26% |
| $75 to $99 | 22% |
| $100 to $124 | 33% |
| $125 or greater | 5% |
| Average | $83 |
| Institutional Care Coverage Duration | |
| 1 year | 3% |
| 2 year | 16% |
| 3 year | 20% |
| 4 year | 19% |
| 5 year | 7% |
| 6 year | 5% |
| Lifetime Coverage | 30% |
| Average | 5.3 Years |
| Elimination period | |
| 0 day | 26% |
| 1 - 20 days | 18% |
| 30 - 50 days | 15% |
| 60 - 90 days | 18% |
| 100 day | 23% |
| Average | 45 days |
| Percent with Inflation Protection | 45% |
| SOURCE: 2000 National Claimant Study.NOTE: Policies with lifetime coverage are assessed as covering 10 years of service costs. | |
The most conservative -- although from a claims standpoint less predictable -- of these policy designs is the reimbursement model. Almost all of the institutional care benefits in the policies held by these claimants are paid on a reimbursement basis (85%). Almost none of the institutional claimants in this sample have accessed benefits through a disability policy design. Almost all claimants have either a reimbursement or indemnity policy design.
The average daily benefit for institutional coverage in the sample is $83 and about two in five are eligible to receive over $100 per day in benefits for institutional care services. It is also noteworthy that 45% of the claimants have policies that include some level of inflation protection.
In terms of coverage duration, more than half of the claimants have policies that cover the equivalent of daily care for a five-year period. Such durational coverage should provide payments for the total duration of care for all but 15% of nursing home claimants.10 Given the lack of information about the average length of stay in assisted living, we cannot be certain that durations will cover most of these residents.
An important issue is the extent to which the daily benefit amount covers the daily cost of care. Figure 17 shows that among all claimants, an average of 73% of the long-term care liability is paid for by insurance. For nursing home claimants, 67% of the costs are covered, whereas for assisted living residents the average daily benefit pays for most of the incurred costs in this institutional setting.11 In terms of daily costs, this implies that the uncovered liability faced by nursing home residents is about $1,144 per month. The vast majority of individuals use their own income and assets to cover these costs.
| FIGURE 17: Ratio of Daily Benefit Amount to Daily Charges by Residence |
 |
| SOURCE: 2000 National Claimant Study. |
G. Claimant Satisfaction with Insurance Policy and Insurance Company
We asked claimants or their proxies a series of questions related to general satisfaction with their insurance policy as well as with various insurer claims management practices.12 The results are summarized in Figure 18. The vast majority of claimants are satisfied with their policy, with most being very satisfied. On the other hand, while relatively low, the proportion of assisted living claimants who are dissatisfied with their policy is more than double that for nursing home claimants. This difference is statistically significant at the .05 level.
| FIGURE 18: Satisfaction with Long-Term Care Insurance by Residence |
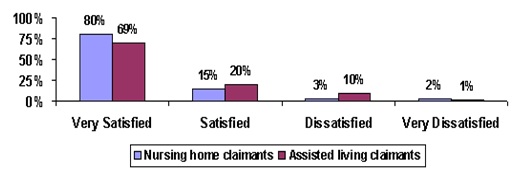 |
| SOURCE: 2000 National Claimant Study. |
Given the relatively complex nature of long-term care insurance contracts, an issue of concern to consumer groups and the industry alike is whether or not claimants actually understand what they are buying. Claimants/proxies were asked whether they had any problems understanding what was and was not covered by their policy. The vast majority (85%) had no difficulty understanding what their policy covered. There were no differences between nursing home and assisted living claimants. Nor were there significant differences across companies.
We asked claimants and their proxies whether the benefits paid by their insurance policy were sufficient to meet their care needs in the institutional setting. This question begins to focus on the issue of adequacy vis-à-vis benefit levels chosen by the insured. Figure 19 shows that roughly three in four assisted living claimants felt that the benefits were adequate, given their care needs. Over half of nursing home claimants considered their benefits enough to meet their care needs. The lower percentage of claimants in nursing homes who feel their benefits are adequate is not surprising, given that nursing home residents have a somewhat smaller proportion of their total costs covered by their insurance benefits.
| FIGURE 19: Are Policy Benefits Meeting Current Care Needs? |
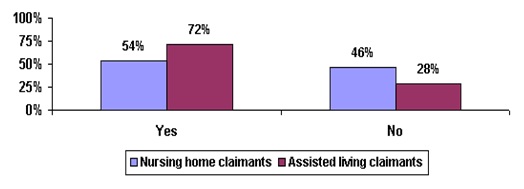 |
| SOURCE: 2000 National Claimant Study. |
Most long-term care insurance policies reimburse expenses incurred for direct service costs, or pay a flat benefit when service costs are incurred. This means that bills must be sent to the insurer in order to process a claim, and one might expect this to be cumbersome, especially for policyholders suffering from dementia or other cognitive ailments. It could also be difficult for claimants entering assisted living facilities where there remains a great deal of confusion around issues related to licensure.
We asked claimants whether it was difficult for them to file their claim and obtain benefits. Figure 20 shows that most individuals -- more than 70% -- found the process to be easy. On the other hand, close to one-in-three claimants did find the process to be somewhat difficult. Assisted living claimants were more likely -- 1.7 times more likely -- to find the process difficult. Across the companies, between 55% and 89% of claimants found the claims filing process to be easy.13
| FIGURE 20: Ease of Filing Claim for Benefits by Institutional Setting |
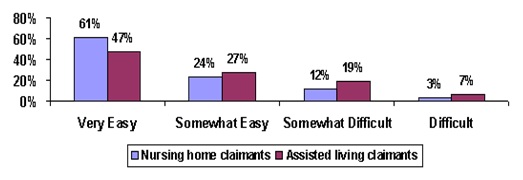 |
| SOURCE: 2000 National Claimant Study. |
We then asked claimants if they had experienced any disagreements with the insurance company over their coverage, and whether such disagreements were resolved to their satisfaction. About 90% of all individuals filing claims had either no disagreements with their insurance companies or had a disagreement(s) that was resolved satisfactorily. About 4% of claimants felt their disagreement was not resolved satisfactorily. There were no significant differences by claimant type or across companies.
Finally, claimants responded to a question about actions that their insurance company might have taken to help them when they needed benefits. This was an open-ended question. As shown below, about six of seven respondents felt there was nothing else that the insurance company should have done. Thirteen percent felt that the company could have provided additional customer support, claims processing, and more advice up front about features of the policy itself (recommended options and benefit levels).
| FIGURE 21: Actions Insurer Might Have Taken to Help Claimant |
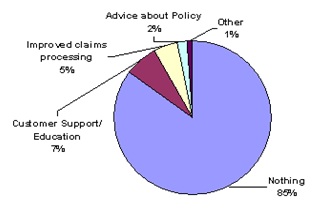 |
| SOURCE: 2000 National Claimant Study. |
H. Impact of Private Long-Term Care Insurance on Claimants
The presence of insurance to cover services that can be close substitutes -- home and community-based care and institutional care -- raises important questions about service utilization in an insured environment. On average, these individuals had their policies about five years before their current use of services. Depending on the income, disability status, availability of informal supports and tastes of the individual, as well as the service system itself, one could imagine two possible scenarios: (1) that the presence of insurance would reduce the net cost of institutional care, thus encouraging individuals to access such services earlier than they otherwise might have in the absence of insurance; or, (2) that insurance coverage for home and community-based care would enable individuals to delay their institutionalization. From the previous study of home care claimants, about half indicated that, in the absence of their policy, they would have to seek institutional care (HHS, 1999).
We asked claimants and their proxies (e.g. primary informal caregivers or powers of attorney) questions about how having a long-term care insurance policy has influenced their movement between the community and their current residence. Figure 22 displays responses to two questions:
-
Did having the long-term care insurance policy allow the insured to remain at home longer than he/she otherwise would have if he/she did not have the policy?
-
Did the insured enter a facility sooner than he/she would have because he/she had a long-term care policy?
| FIGURE 22: Impact of Policy Ownership on Movement between the Community and Current Residence |
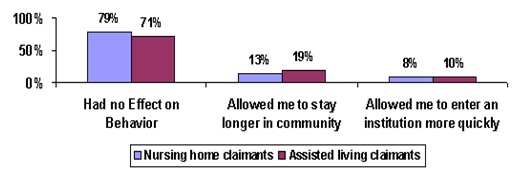 |
| SOURCE: 2000 National Claimant Study. |
The first thing to notice is that for most -- about three in four -- the presence of insurance was not viewed as having had an influence on service seeking behavior. For between one in five assisted living claimants and one in eight nursing home claimants, the presence of insurance allowed them to delay their entry into an institution. These differences are significant at the .01 level. On average, individuals residing in nursing homes have had their policies for about five years, whereas those residing in assisted living facilities have been insured for closer to four years.
On the other hand, roughly one in ten individuals indicated that they entered an institution sooner than they otherwise would have, given the presence of their insurance benefits. An analysis of the profile of these individuals suggests that they are typically older, have higher incomes, and are somewhat less ADL dependent than are those who did not change their behavior and enter an institution sooner. This suggests that for some, entry into the institution is motivated by social concerns as well as by a desire to be in a protective environment should additional declines in functioning occur.
I. Comparing Privately Insured and Non-Privately Insured Institutional Residents
Nursing Home Residents
A primary purpose of this study is to compare privately insured disabled nursing home residents to other residents in nursing homes. Information on other residents was obtained from two data sources: the 1994 National Long-Term Care Survey (NLTCS) and the 1995 National Nursing Home Survey (NNHS). However, the sample inclusion criteria for these two national surveys was more liberal than the criteria for inclusion in the privately insured claimant sample -- service use among individuals with two or more ADL limitations or cognitive impairment. Thus, in order to enable meaningful, direct comparisons of the privately insured and non-privately insured nursing home populations, we applied the same minimum disability threshold to all three surveys and focused our analysis on the subset of residents that met this minimum disability threshold.
The criteria that are applied to individuals in these samples include being:
- disabled in at least two out of six ADLs that require some level of human assistance;14or
- cognitively impaired as measured by the Short Portable Mental Status Questionnaire (SPMSQ);15or
- diagnosed with dementia or Alzheimer's disease.
Once these minimum disability selection criteria are applied, the samples can then be compared one to the other on all dimensions of interest. The sub-samples are comprised of 1,158 residents from the 1994 NLTCS, 6,492 residents from the 1995 NNHS, and 322 residents from the 2000 National Claimant Study. All individuals are age 65 and over.
Socio-Demographic Characteristics
Table 5 displays the socio-demographic profile of insured claimants and other nursing home residents. The data reveals important differences between the claimant sample and the two national samples. On average, disabled nursing home residents with long-term care insurance are somewhat younger than their non-privately insured institutionalized counterparts. In fact, the proportion of privately insured claimants age 85 and over is only half that found in the general population of nursing home residents. There also tends to be a greater proportion of privately insured male residents compared to other residents. This is in spite of the fact that the proportion of males in the general population age 65 and over and in the population of long-term care insurance policyholders is roughly equal. In terms of racial composition, given that the overwhelming majority of policyholders is white, it is not surprising that privately insured claimants are much more likely to be white.
One of the biggest differences in demographic characteristics relates to marital status. Residents with private long-term care insurance are 2.8 times more likely to be married than are those without such insurance. In the general population 53% of elders age 65 and over are married; among long-term care insurance policyholders, 69% are married. Thus, everything else held constant, we would expect a higher proportion of married insured residents -- roughly 1.3 times higher -- than that found among the general resident population. The fact that the difference is so great suggests that other factors, like disability status, may be at play. Additional analysis does reveal that the married residents with private insurance are much more disabled than single residents and non-privately insured married residents. Thus, although they may have informal supports available to them, their needs may be too great to be met in a community setting. The presence of insurance enables them to more easily have their needs met in a nursing home.
| TABLE 5. Socio-Demographic Characteristics of Privately Insured and Non-Privately Insured Disabled Nursing Home Residents Age 65 and Over | |||
| Socio-Demographic Characteristics | 2000 Claimant Study | 1994 NLTCS Study | 1995NNHS Study |
| Average Age | 81 years*** | 84 years | 84 years |
| 65-69 | 2% | 5% | 5% |
| 70-74 | 13% | 9% | 8% |
| 75-79 | 28% | 14% | 14% |
| 80-84 | 34% | 21% | 21% |
| 85+ | 24% | 52% | 51% |
| Gender | |||
| Male | 33%*** | 26% | 24% |
| Female | 67% | 74% | 76% |
| Marital Status | |||
| Married | 45%*** | 16% | 17% |
| Unmarried | 55% | 84% | 83% |
| Race | |||
| White (not Hispanic) | 99%*** | N/A | 88% |
| Non-White | 1% | 12% | |
| Education Level | |||
| Less than High School Graduate | 17%*** | 53% | N/A |
| High School Graduate | 22% | 31% | |
| Technical/Trade/Business/Some College | 28% | 8% | |
| College Graduate | 33% | 8% | |
| Average Annual Income | $26,794 | $12,445 | N/A |
| Up to $20,000 | 35%*** | 81% | |
| $20,000 - $39,999 | 50% | 11% | |
| $40,000 - $59,999 | 11% | 4% | |
| $60,000 - $74,999 | 4% | 4% | |
| SOURCE: 2000 National Claimant Study; 1994 NLTCS; 1995 NNHS.NOTE: * Significant at the .10 level; ** Significant at the .05 level; *** Significant at the .01 level. | |||
Regarding income status, it is well known that long-term care insurance policyholders are more affluent than their counterparts in the general population (ACLI, 2000; HIAA, 1995). The same can be said for disabled claimants in nursing homes. Compared to non-privately insured nursing home residents, they are four times as likely to be college educated and about 3.2 times more likely to have incomes greater than $20,000. In fact, the average income of disabled claimants is more than twice that for non-insured disabled residents -- $26,794 compared to $12,445. When we adjust for the fact that data from the 1994 NLTCS was collected six years earlier, the difference diminished somewhat -- $26,794 to $14,859.16
Disability Status
Given that the comparative resident samples have been selected based on meeting a minimum disability threshold, one would expect variations in disability status to be small. Figure 23 shows that across all of the samples, the majority of residents has limitations in at least five of six ADLs.
| FIGURE 23: Number of ADL Dependencies Among Disabled Nursing Home Residents |
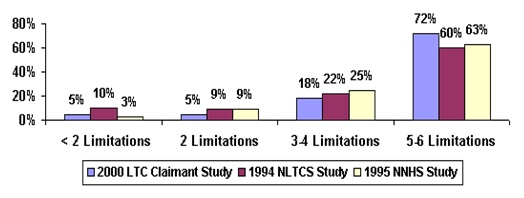 |
| SOURCE: 2000 National Claimant Study; 1994 NLTCS; 1995 NNHS. |
The privately insured sample, is however, slightly more impaired compared to other residents. The average number of limitations for disabled long-term care insurance claimants is 4.9; this compares to between 4.4 and 4.7 limitations among other residents.
There was no implementation of a uniform measure for cognitive impairment across the three surveys. The 2000 National Claimant Study relied on the combination of three measures: (1) the Short Portable Mental Status Questionnaire (SPMSQ); (2) the presence of a cognitive-related diagnosis such as Alzheimer's or Dementia; and, (3) orientation to time, person and place. The 1994 NLTCS relied exclusively on the SPMSQ.17 Because of the differences in measurement, comparative statistics across the samples must be viewed cautiously.
Figure 24 shows that the vast majority of disabled residents have some level of cognitive impairment -- although insured residents are somewhat less likely to be cognitively impaired. If we compare the two samples just on the basis of SPMSQ results, we find somewhat higher levels of cognitive impairment among non-insured residents -- 90% versus 81%.
| FIGURE 24: Presence of Cognitive Impairment Among Disabled Nursing Home Residents |
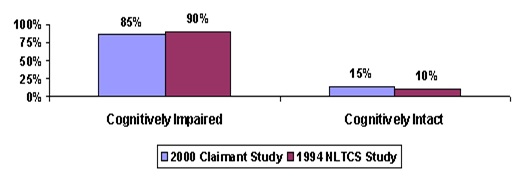 |
| SOURCE: 2000 National Claimant Study; 1994 NLTCS; 1995 NNHS. |
Previous Residency
Figure 25 shows where these disabled residents were living immediately prior to their current residence. Comparing insured claimants to similar individuals in the 1994 NLTCS, a majority of non-privately insured disabled elders living in private homes immediately prior to entering the nursing home where they currently reside. In contrast, a majority of the privately insured claimants in nursing homes came to the nursing home where they currently reside from some other institutional or congregate setting. Insured residents were twice as likely to be living in settings such as retirement communities, in rental units or board and care homes as non-privately insured nursing home as non-privately insured nursing home residents. Compared to all nursing home residents in the 1995 NNHS, the private long-term care insurance claimants residing in nursing homes are considerably less likely to have entered the nursing home directly from a hospital. This is probably because the 1995 NNHS includes a sizable minority of Medicare SNF benefit users.
| FIGURE 25: Residence Before Current Institutionalization Among Disabled Nursing Home Residents |
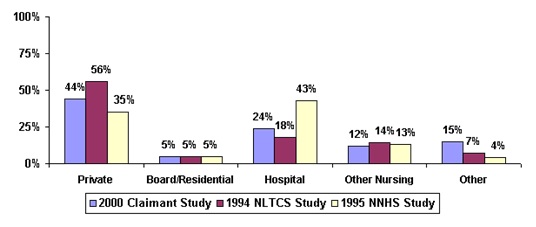 |
| SOURCE: 2000 National Claimant Study; 1994 NLTCS; 1995 NNHS. |
It is difficult to understand the differences in results between the 1994 NLTCS and 1995 NNHS. For almost all other variables, results do not differ substantially. The question on residency was very similar in each of the surveys. The major difference in study design is that the 1994 NLTCS sample was drawn on a random sample of individual residents, whereas the 1995 NNHS sample was drawn from a random sample of institutions within which a random sample of residents was drawn. This may affect results on this variable, but it is not clear why this would be the case.
Service Use and Charges in Institutional Settings
We obtained information about the specific services that were received by residents in the 2000 National Claimant Study and in the 1995 NNHS.18Table 6 shows that, in general, privately insured disabled residents appear to receive fewer services than do other residents -- 5.4 services per month versus 6.7. With the exception of dental care and transportation services, the proportion of privately insured residents receiving medical, mental health, skilled nursing, social services and personal care services is lower than what is observed for other disabled residents. The same is true for occupational therapy services.
Clearly, differences in the service packages received by individuals should reflect underlying care needs. From previous data we learned that for every privately insured claimant who entered a nursing home directly from a hospital, according to the 1995 NNHS, there were 1.8 non-privately insured residents doing so. This suggests that the non-insured resident population has somewhat greater medical or skilled care needs. This is borne out by their greater use of skilled nursing and medical services. Not surprisingly, additional analyses reveal that non-privately insured residents have an average of 4.0 medical diagnoses, whereas for claimants, the number is 3.0. Finally, the greatest proportion of privately insured residents receives personal care services, whereas for other residents, the greatest proportion receives medical services. Somewhat lower use of personal care services among the privately insured, compared to other residents, may reflect the fact that insured residents, who are more likely to be married, may be receiving personal care services from spouses. It is not uncommon for significant amounts of informal care to be provided in nursing homes by family members.
Anecdotal information suggests that having private insurance may improve access to a nursing home. This is because limits on Medicaid reimbursement rates have led many nursing home operators to seek out private pay residents. Data presented here suggests that, after gaining admission to a nursing home, the privately insured appear to use fewer services than that seen for other residents. Thus, if the costs associated with room and board are similar between privately insured and other residents, the former would be more profitable for two reasons: (1) the daily rate paid is likely to be higher than what is paid by other residents; and (2) service use is lower.
| TABLE 6. Services Received by Disabled Nursing Home Residents | ||
| Services | 2000 Claimant Study | 1995 NNHS Study |
| Average number of services received | 5.4*** | 6.7 |
| Dental care | 22%** | 17% |
| Equipment or devices | 39%*** | 50% |
| Medical services | 70%*** | 89% |
| Mental health services | 7%*** | 15% |
| Skilled nursing services | 57%*** | 97% |
| Nutritional Services | 53%*** | 67% |
| Occupational Therapy | 10%*** | 14% |
| Personal Care | 87%** | 93% |
| Physical Therapy | 23% | 25% |
| Prescribed medicines or non-prescribed medicines | 92% | 94% |
| Social services | 31%*** | 64% |
| Transportation | 30%*** | 22% |
| SOURCE: 2000 National Claimant Study; 1995 NNHS.NOTE: * Significant at the .10 level; ** Significant at the .05 level; *** Significant at the .01 level. | ||
An analysis of charge information sheds additional light on this issue. Figure 26 shows the mean charges for services provided to disabled privately insured residents and other disabled residents. Data is presented in both real and nominal terms.
| FIGURE 26: Total Charges Billed for Previous Month in Nursing Home |
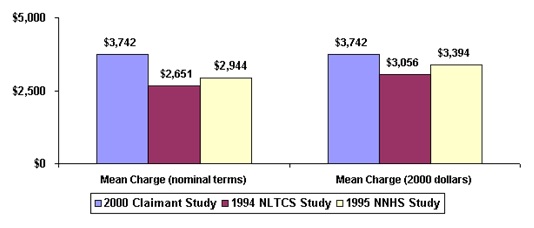 |
| SOURCE: 2000 National Claimant Study; 1994 NLTCS; 1995 NNHS. |
In nominal terms, the average charge among privately insured residents was between 27% and 40% higher than for other residents. After accounting for the impact of inflation, the difference narrows somewhat to between 10% and 22%.19 Given that the service use of these privately insured residents is lower, this finding suggests that the higher charge is likely associated with room and board costs. Alternatively, it may be that the facilities chosen by privately insured are more costly at every level of service provision. It may also be the case that the amenities associated with the facilities chosen by the privately insured are more costly.
These charges are paid by various sources. Table 7 summarizes the payment source for care at admission to the facility, and for the month preceding the interview. As shown, the distribution of payment sources across the samples is quite different. Medicaid is the primary payment source for current residents. At admission to the facility, about two in five non-privately insured disabled residents have Medicaid as a primary payment source. However, over time, Medicaid becomes the primary payment source for about three in five residents.
Personal resources are the major secondary payment source. For the privately insured, long-term care insurance and personal resources account for the major payer sources. Across both samples, Medicare's importance as a payment source declines after initial nursing home admission.
| TABLE 7. Primary and Secondary Payment Source for Nursing Home Residents | ||||||
| Sources of Payment | Primary Payment Source at Admission | Primary Payment Source Last Month | Secondary Payment Sources Last Month | |||
| 2000 Claimants | 1995 NNHS | 2000 Claimants | 1995 NNHS | 2000 Claimants | 1995 NNHS | |
| LTC Insurance | 33% | N/A | 71% | N/A | 24% | N/A |
| Other private insurance | 1%*** | 9% | 1%*** | 7% | 6%*** | 10% |
| Own Income and Assets | 35%*** | 23% | 21%** | 22% | 67%*** | 22% |
| Medicare | 28%*** | 25% | 2%*** | 12% | 3%*** | 15% |
| Medicaid | 0%*** | 39% | 0%*** | 58% | 0%*** | 9% |
| Other government | 0%*** | 0% | 2%*** | 0% | 1% | 0% |
| Don't know | 3%*** | 2% | 2%*** | 0% | 4% | N/A |
| SOURCE: 2000 National Claimant Study; 1995 NNHS.NOTE: * Significant at the .10 level; ** Significant at the .05 level; *** Significant at the .01 level. | ||||||
Assisted Living Residents
To date, there has not been a comprehensive national survey that has collected detailed information on assisted living residents. Thus, in the analyses that follow, we present comparative data drawn from a variety of published sources. Much of the data is based on published reports and studies by the National Center for Assisted Living (NCAL) and the Assisted Living Federation of America (ALFA), working with Coopers and Lybrand. Additional information derives from studies contracted for by the federal government and researchers who have collected information about such facilities.
The sample of assisted living claimants is comprised of 133 claimants. We begin with a summary of basic demographic characteristics.
Compared to other residents in assisted living, long-term care insurance claimants are somewhat younger, more likely to be male and much more likely to be married. They also have somewhat higher income levels, and the distribution of income among them is somewhat more skewed toward the higher end. We know that the median income of claimants is somewhat lower than non-claimants, thus suggesting that a few high-income claimants dominate the average. In fact, slightly less than 10% of claimants have annual incomes greater than $75,000.
| TABLE 8. Socio-Demographic Characteristics of LTC Claimants and All Residents in Assisted Living Facilities | |||
| Characteristic | LTC Claimants | NCAL, 1999 | ALFA and Coopers and Lybrand, 1998 |
| Average Age | 81 years | 83 years | 83 years |
| Gender | |||
| % Male | 28% | 26% | 22% |
| % Female | 72% | 74% | 78% |
| Marital Status | |||
| % Married | 34% | ---- | 3% |
| % Unmarried | 66% | ---- | 97% |
| Income | |||
| Average | $33,797 | ---- | $30,800 |
| Median | $21,793 | ---- | $25,000 |
| SOURCE: 2000 National Claimant Study; NCAL, 1999; ALFA, 1998. | |||
There are a number of studies that present information about the disability status of assisted living residents. Figure 27 compares the profile of residents as reported in a recent NCAL study to the profile of insured assisted living claimants.
| FIGURE 27: Number of ADL Dependencies Among Assisted Living Residents |
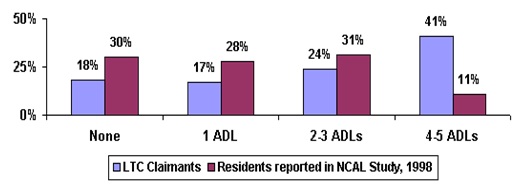 |
| SOURCE: 2000 National Claimant Study; National Council of Assisted Living, 1998. |
As shown, long-term care insurance claimants have more disabilities than non-privately insured residents. In fact, the average number of disabilities among claimants is 2.8 whereas among non-insured residents the comparable figure is 1.7 (NCAL, 1998). Also, in their comprehensive study of the assisted living industry, Hawes et al (1999) report that 76% of assisted living residents have two or fewer ADL limitations; this compares to 35% of privately insured claimants.
In the figure that follows, we compare the specific ADL dependencies among insured assisted living residents and among other residents. The key point is that for each ADL, higher proportions of insured residents exhibit dependency. The greatest differences between the two groups relates to continence and toileting where claimants are between 1.8 and 2.8 times more likely to require assistance in these basic activities of daily living.
| FIGURE 28: ADLs for which ALF Receive Assistance by Insurance Status |
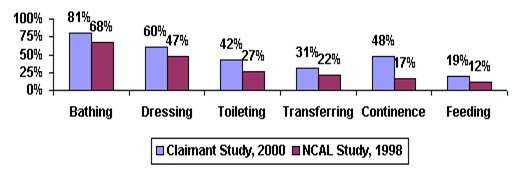 |
| SOURCE: 2000 National Claimant Study; National Council of Assisted Living, 1998. |
This pattern of higher disability level persists in the cognitive domain as well (see Figure 29). Assisted living residents with long-term care insurance are about twice as likely to be cognitively impaired compared to all assisted living residents.20
| FIGURE 29: Presence of Cognitive Impairment Among Assisted Living Residents |
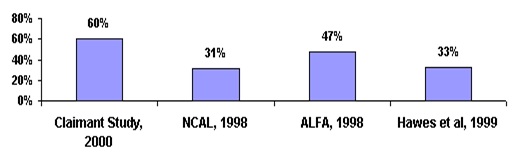 |
| SOURCE: 2000 National Claimant Study; National Council of Assisted Living, 1998; ALFA, 1998; Hawes et al, 1998. |
Given the higher levels of cognitive and ADL impairments, it is perhaps not surprising that a greater percentage of claimants entered the assisted living facility directly from a nursing home. In fact, as shown in Figure 30, prior to entering their current facility, 23% of assisted living claimants were in nursing homes; the comparable figure for non-privately insured residents was only 14%. Claimants were only .8 times as likely to move directly from their home into the assisted living facility as were their non-privately insured counterparts.21
| FIGURE 30: Residence before Current Residence in Assisted Living |
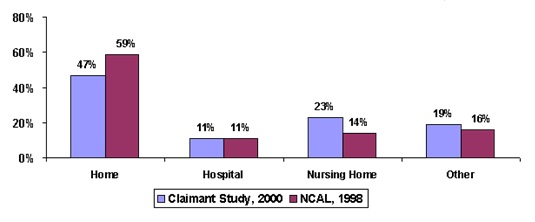 |
| SOURCE: 2000 National Claimant Study; National Council of Assisted Living, 1998. |
Figure 31 below shows the average monthly charges of insured residents compared to the basic costs associated with residence among all assisted living residents. The costs to insured residents are roughly 1.3 to 1.8 times as much as to other residents. There are a number of possible explanations for this finding. First, it may be that the wealth profile of the privately insured (including assets) enables them to access care in more "up-scale" facilities. Second, these claimants are more disabled than the average assisted living resident. Thus, they require more care. As a result, their actual monthly charges may reflect this greater need for care. Finally, the information about average charges from other assisted living residents represents summaries of basic service package charges rather than actual charges on a per-resident basis. Consequently, one cannot make direct comparisons between actual claimant charges and aggregate service package charges for non-insured residents. The former may be "buying up" to account for their disability status whereas we do not have comparable charges for similarly disabled residents who do not have private insurance.
| FIGURE 31: Average Monthly Charges for Assisted Living Residents |
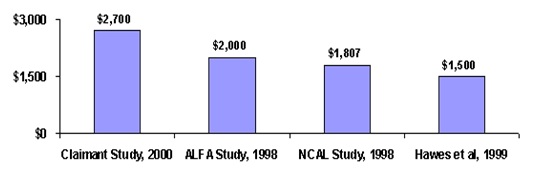 |
| SOURCE: 2000 National Claimant Study; ALFA Study, 1998; NCAL Study, 1998; Hawes et al, 1999. |
V. SUMMARY AND IMPLICATIONS
Despite the fact that long-term care insurance is the primary payer source for 70% of nursing home claimants, only slightly more than half of residents indicate that their policy benefits are meeting their care needs in the facility. When the policy pays a greater proportion of nursing home charges, a significant number of claimants still report that the policy benefits were insufficient to meet current care needs. While there is no comparable data from the non-privately insured resident population, this data does suggest that service delivery issues inside of these nursing homes may exist. That is, even among private pay patients, there appears to be a gap between what is received and what is perceived to be needed. This could relate to how services are provided (e.g. responsiveness, quality and comprehensiveness) or whether they are provided at all (e.g. availability and staffing issues).
Although a greater proportion of individuals in assisted living facilities report that their needs are being met, there still remains a sizeable minority -- 28% -- who do not. The insurance benefits that these people receive cover 96% of the charges that they are assessed. Again, this reinforces the finding that service problems may exist even in the presence of significant financing.
Given the relatively rich benefit packages of these claimants, it is surprising that among nursing home residents the average difference between the monthly benefit paid and the charge in the nursing home is $1,290 -- roughly 30% of the total costs. Even among individuals who had inflation protection built into their policies, out-of-pocket expenses averaged $1,000 per month. If individuals had an expectation that their policy would fund all of their care, they would be disappointed at claim time. On the other hand, if there was an expectation of having a significant co-payment, then their purchase decision would reflect the ultimate reality that they face. Recent research suggests that most policyholders expect their policy to pay for more than half, but less than all, of future long-term care costs (Miller and Cohen, 2000).
This finding has important implications for insurance policy design and marketing. In both the assisted living and home care setting, daily benefit amounts were more than adequate to pay for almost all of the costs of care. In the home care setting, not all benefits are being fully utilized, whereas in the nursing home, there are shortfalls in insurance benefits. Current policies are "fully-integrated", which means that a daily, weekly or monthly limit can be spent in either the community or an institutional setting. It may be worthwhile for companies to move back to separate benefit caps that offer higher levels of institutional coverage and lower levels of community coverage at a similar level of premium as that found for integrated policies. Or perhaps policies could come with inflation protection on the institutional benefit but not necessarily on the community benefit. Finally, making available guaranteed purchase options for benefit upgrades, coupled with education to policyholders regarding the relationship between benefit levels and service costs, would be a particularly important insurer action.
Despite gaps in dollar coverage, claimants are very satisfied with their policy. They experienced few problems filing their claim, had few disagreements with the company, and understood what their policy covered. Levels of satisfaction are even higher in the nursing home than they are for community residences. This may reflect the relative ease with which companies can verify eligibility and charges in the institutional setting.
For the most part, long-term care insurance benefits are well targeted. The vast majority of individuals has significant ADL dependencies or is cognitively impaired. More than four in five institutionalized claimants have over two ADL limitations. With that said, however, up to one in five assisted living claimants did not meet HIPAA benefit eligibility triggers at the time of the interview. It is possible that they were eligible at the time that they applied for benefits or were likely to become eligible in the very near future. Either way, the assisted living population appears to be even less disabled than claimants that are served in home care settings.
Whereas one might have thought that the continuum of care moves from home care to assisted living to nursing home care, the data present a more complicated picture. It appears that for some individuals, assisted living may actually substitute for remaining in the home and relying on formal home care services. In fact, receipt of home care services may not always be an option for many of the individuals found in assisted living, since such a large percentage of them are single and do not have available informal supports. Results from the study of home care claimants showed that most of these individuals could rely both on formal and informal care.
Other claimants in assisted living facilities faced the alternative of nursing home care. Fully one-quarter of assisted living residents had come from nursing homes. Given that the costs of care in assisted living facilities are typically lower, this pattern of use suggests service use efficiency. This is particularly true for Alzheimer's patients where a growing number are being served in assisted living facilities.
The majority of claimants in both the nursing home and assisted living setting indicated that the presence of insurance had little effect on the timing of their decision to enter either service modality. One in ten claimants did indicate, however, that having insurance benefits enabled them to enter an institutional setting somewhat earlier than they otherwise might have. These individuals, who tended to be older, yet less disabled, appear to have been motivated by social concerns and a desire to be in a protective environment.
The profile of disabled nursing home residents with long-term care insurance is very different than the profile of non-privately insured residents. The former tend to be younger, more male, and much more likely to be married. They also tend to have more ADL limitations and fewer skilled care needs. This may explain why insured residents receive fewer services: their care is less medically intensive and they require more palliative care for functional limitations and less curative care.
Given the differential intensity of service use, one might have expected that average charges for privately insured patients would be lower. Such is not the case. In real terms, charges to privately insured residents are 10% to 20% higher. This may reflect the fact that they choose more costly nursing homes or that nursing homes charge them more to offset inadequate Medicaid reimbursement. Either way, it would appear that, given their service use, these residents are among the most profitable to the nursing home.
While we do not have particularly good comparative data on assisted living residents, we do know that those with private insurance tend to be somewhat younger, more male, more likely to be married, and wealthier than their non-privately insured counterparts. They are also more disabled and much more likely to be cognitively impaired. They pay a great deal more for their residency as well. Having insurance enables these individuals to access the full continuum of service options -- from options in the community to institutional settings. The fact that these insured assisted living residents differ so much in profile from non-insured residents does suggest that, when significant and comprehensive insurance coverage is available, very different patterns of service use are likely to emerge. In particular, greater use of lower intensity and more home-like institutional settings is likely to occur.
All of the institutionalized individuals in this sample had the opportunity to use their insurance benefits in the community. That only 40% chose to access home and community-care services before entering their current institutional residence suggests that not all individuals experience a steady decline in functioning that enables them to move seamlessly across the continuum of care. Some experience rapid declines that force them to move from a functionally independent state in the community to a state of dependency in a nursing home. Others may, in fact, try to remain in the community for a short time, and because of either inadequate formal or informal support, need to move into institutional settings. Still others may want to self-pay for services in the community and use their insurance benefits on more costly institutional care. The implication, in terms of insurance policy design, is that greater flexibility in service coverage (i.e. integrated benefit designs) does enable individuals to spend their benefits on the care that they desire. Whether their needs are best met by their choices is a separate matter that requires additional empirical analysis. A final point is that some residents indicated that they did not know that their policy would pay for care in the home. This points to the need for even greater communication between the company and the insured, both at the time of sale and at claim time.
Given the rapidly changing landscape of the service delivery network, insurers will need to continue to emphasize flexibility in their products. Along with such flexibility, however, is the need to keep consumers informed about the relationship between benefit levels and future service costs. While the presence of insurance will certainly alter service utilization patterns, few individuals seem to be drawn more quickly to seek institutional alternatives just because they have insurance. What the insurance does allow, is the ability for disabled individuals to access a variety of services in alternative settings and to do so in a way that leaves these people very satisfied with their coverage.
REFERENCES
Assisted Living Federation of America (1998). Overview of Assisted Living: ALFA-HIAA Long-Term Care Insurance Summit, September 1998, Washington, DC.
AARP (1998). Medicaid and Long-Term Care for Older People. AARP Public Policy Institute, Washington, DC.
AARP (1997). Out-of-Pocket Health Spending by Medicare Beneficiaries Age 65 and Older: 1997 Projections. AARP Public Policy Institute, Washington, DC.
ACLI (2000). Long-Term Care Insurance and Retirement Planning: The Road to Retirement Security. Final Report to the American Council of Life Insurers, Washington, DC., January.
Cohen, M., and N. Kumar (1996). "The Changing Face of Long-Term Care Insurance in 1994: Profiles and Innovations in a Dynamic Market. Inquiry.
Cohen, M., E. Tell, J. Greenberg, and S. Wallack (1987). The Financial Capacity of the Elderly to Insure for Long-Term Care. The Gerontologist, 27.
Bishop, C. (1999). Where are the Missing Elders? The Decline in Nursing Home Use, 1985 and 1995. Health Affairs, 18(4).
Burwell, B. (1998). Medicaid Expenditures on Long-Term Care. The MEDSTAT Group, Cambridge, MA.
Crown, W., W. Leutz, and J. Capitman (1992). Economic Rationality: The Market for Private Long-Term Care Insurance, and the Role for Public Policy. The Gerontologist, 32.
Friedland, R. (1990). Facing the Costs of Long-Term Care. Employee Benefit Research Council, Washington, DC.
Garber, A.B. and T. MaCurdy (1989). Predicting Nursing Home Utilization among the High Risk Elderly. National Bureau of Economic Research. Cambridge MA.
Greene, V., M. Lovely, and J. Ondrich (1993). The Cost-Effectiveness of Community Services in a Frail Elderly Population. The Gerontologist, 33(2).
Hawes, C., M. Rose, and C. Phillips (1999). A National Study of Assisted Living for The Frail Elderly: Results of a National Survey of Facilities (Executive Summary). Report Submitted to the Office of the Assistant Secretary for Planning and Evaluation, DHHS Contract Number HHS-100-94-0024 and HHS-100-98-0013, April 1996. [http://aspe.hhs.gov/daltcp/reports/facres.htm]
Health Insurance Association of America (1998). Term Care Insurance in 1996: Research Findings. Washington, DC.
Health Insurance Association of America (1995). Term Care Insurance in 1994: Profiles and Innovations in a Dynamic Market. Washington, DC.
Health Insurance Association of America (1992). Who Buys Long-Term Care Insurance? Washington, DC.
Jackson, B., and P. Doty (1999). Medicare Home Health Services 1989-1994: Patterns of Benefit Use Among Chronically Disabled Elders. Office of the Assistant Secretary for Planning and Evaluation, Office of Disability, Aging and Long-Term Care Policy, U.S. Department of Health and Human Services, Washington, DC.
Kane, R. (1998). Examining the Efficiency of Home Care. Unpublished manuscript submitted to the Home Care Research Initiative, University of Minnesota.
Ladd, R., R. Kane, and R. Kane (1999). State Long-Term Care Profiles Report, 1996. University of Minnesota at Minneapolis, School of Public Health, Division of Health Services Research and Policy, Table 4. Page. 14. [http://aspe.hhs.gov/daltcp/reports/ltcprof.htm]
LifePlans, Inc. (2000). Analysis of Long-Term Care Individual and Group Association Top Writers Survey Results. Waltham, MA
Leon, J., P. Neuman, and S. Parente (1997). Understanding the Growth in Medicare's Home Health Expenditures. The Kaiser Medicare Policy Project, Henry J. Kaiser Family Foundation.
Leon, J., and D. Moyer (1999). Potential Cost Savings in Residential Care for Alzheimer's Disease Patients. The Gerontologist, 39(4).
Lewin-VHI (1992). Policy Synthesis on Assisted Living for the Frail Elderly. Final Report Submitted to the Office of the Assistant Secretary for Planning and Evaluation, DHHS Contract Number HHS-100-89-0032, December 16, 1992. [http://aspe.hhs.gov/daltcp/reports/polsynes.htm]
Lewin-VHI (1996). National Study of Assisted Living for the Frail Elderly: Literature Review Update. Report Submitted to the Office of the Assistant Secretary for Planning and Evaluation, DHHS Contract Number HHS-100-94-0024, February 1996. [http://aspe.hhs.gov/daltcp/reports/2009/HITlitrev.htm]
Miller, J., and M. Cohen (2000). "Long-term Care Insurance and Retirement Planning: The Road to Retirement Security." Final report to the American Council of Life Insurers. Washington, DC. January.
National Center for Assisted Living (1998). 1998 Facts and Trends: The Assisted Living Sourcebook. Washington, DC.
National Investment Conference for the Senior Living and Long-Term Care Industries (NIC) (1997). National Housing Survey of Adults Age 60+: Opinions, Attitudes, Perceptions and Behaviors 1997.
Rhoades, J.A., and N.A. Krauss (1999). Nursing Home Trends, 1987 and 1996. Rockville (MD): Agency for Health Care Policy and Research; 1999. MEPS Chartbook No. 3. AHCPR Pub. No. 99-0032.
Rivlin, A., J. Wiener, R. Hanley, and D. Spence (1988). Caring for the Disabled Elderly: Who will Pay? Brookings Institution, Washington, DC.
Shapiro, E., and R.B. Tate (1988). Who is Really at Risk of Institutionalization? The Gerontologist, 28.
United States Department of Commerce, Bureau of the Census. Statistical Abstract of the United States, 1994.
United States Department of Commerce, Bureau of the Census. Money Income in the United States: 1997. Washington, DC.
United States Department of Commerce, Bureau of the Census: Educational Attainment in the United States: March 1998. Washington, DC.
Weissert, W. (1985). Seven Reasons why it is so Difficult to Make Home and Community-Based Care Cost Effective. Health Services Research, 20.
Weissert, W., and C. Cready (1989). Toward a Model for Improved Targeting of Aged at Risk of Institutionalization. Health Services Research, 24.
Wiener, J., L. Illston, and R. Hanley (1994). Sharing the Burden: Strategies for Public and Private Long-term Care Insurance. Brookings Institution, Washington, DC.
Wiener, J., D. Stevenson and S. Goldenson (1998). Controlling the Supply of Long-Term Care Providers at the State Level. Assessing the New Federalism, Urban Institute, Occasional Paper Number 22, Washington, DC.
Wolf, D. (1997). Efficiency in the Allocation and Targeting of Community-Based Long-Term Care Resources. Unpublished manuscript submitted to the Home Care Research Initiative. Syracuse University.
NOTES
-
To be included in the comparison sample, the privately insured and non-privately insured had to meet a minimum disability threshold of at least two of six ADL limitations or be cognitively impaired.
-
For more detail on the sampling frame of the 1994 National Long-Term Care Survey see Manton et al, (1997). Chronic Disability Trends in Elderly United States populations: 1982-1994. Procedures of the National Academy of Science, Volume 94, Pages 2593-2598, March 1997.
-
Note that only assisted living and nursing home claimants are included in the analysis.
-
Note that some companies in certain circumstances consider assisted living as a home care claim. These have been excluded from the current analysis.
-
Typically, policies that have benefit access criteria that include medical necessity only require a doctor to certify that an individual needs services. They are, therefore, more liberal than policies that require a demonstrated loss of ADL ability of cognitive impairment.
-
These differences across companies were statistically significant at the .01 level.
-
All the nursing home and assisted living claimants of one company met the HIPAA triggers.
-
Reported charges include services, drugs, and special medical supplies billed to the individual for the previous month. It is important to note that some services included in the charges may not be covered by the individual's insurance policy.
-
Differences across institutional settings are significant at the .001 level for residential care, .05 level for Alzheimer's care, and .10 level for intermediate care. Across all levels of care, the difference in charges is significant at the .001 level.
-
For more information on nursing home utilization, see Spence and Weiner (1990). Nursing Home Length of Stay Patterns: Results from the 1985 National Nursing Home Survey. The Gerontologist, Volume 30, Number 1, February.
-
We make the simplifying assumption that the assisted living benefit equals the nursing home benefit. In some policies, assisted living is only reimbursed at a rate of 80% of the allowable reimbursement maximum for nursing home care.
-
When a claimant was cognitively impaired or unable to respond to the interview, we interviewed the power of attorney or primary informal caregiver about the long-term care insurance policy. In only 15% of the cases was the claimant himself/herself able to answer the question; 85% of the responses derive from proxies such as powers of attorney or primary informal caregivers.
-
These differences across companies were significant at the .01 level.
-
The ADL activities include bathing, dressing, toileting, transferring, continence management, and feeding. A disability is present if an individual requires stand-by, cueing, or hands-on assistance.
-
Having 4 or more errors on the SPMSQ.
-
This is based on the average increase in social security benefits during the period 1994 through 2000.
-
We made a simplifying assumption that if a resident did not complete the SPMSQ, then the person would be considered cognitively impaired. This is because, in most cases, the test is not administered to severely demented patients.
-
Such information was not collected in the 1994 NLTCS.
-
According to the Bureau of Labor Statistics, the consumer price index rose an average of 2.4% between 1994 and 2000 (Bureau of Labor Statistics, 2000 web site).
-
It may be that some of this observed difference in the prevalence of cognitive impairment is explained by the differences in the way that cognitive impairment was measured across the studies.
-
The "Other" residential modalities include board and care home, retirement community, and other residential settings.
To obtain a printed copy of this report, send the full report title and your mailing information to:
U.S. Department of Health and Human ServicesOffice of Disability, Aging and Long-Term Care PolicyRoom 424E, H.H. Humphrey Building200 Independence Avenue, S.W.Washington, D.C. 20201FAX: 202-401-7733Email: webmaster.DALTCP@hhs.gov
RETURN TO:
Office of Disability, Aging and Long-Term Care Policy (DALTCP) Home [http://aspe.hhs.gov/_/office_specific/daltcp.cfm]Assistant Secretary for Planning and Evaluation (ASPE) Home [http://aspe.hhs.gov]U.S. Department of Health and Human Services Home [http://www.hhs.gov]
Other Reports Available
A Descriptive Analysis of Patterns of Informal and Formal Caregiving among Privately Insured and Non-Privately Insured Disabled Elders Living in the Community Executive Summary http://aspe.hhs.gov/daltcp/reports/ifpattes.htm HTML http://aspe.hhs.gov/daltcp/reports/ifpattrn.htm PDF http://aspe.hhs.gov/daltcp/reports/ifpattrn.pdf
Informal Caregivers of Disabled Elders with Long-Term Care Insurance Executive Summary http://aspe.hhs.gov/daltcp/reports/icdeltes.htm HTML http://aspe.hhs.gov/daltcp/reports/icdeltci.htm PDF http://aspe.hhs.gov/daltcp/reports/icdeltci.pdf
Multivariate Analysis of Patterns of Informal and Formal Caregiving among Privately Insured and Non-Privately Insured Disabled Elders Living in the Community Executive Summary http://aspe.hhs.gov/daltcp/reports/2000/multanes.htm HTML http://aspe.hhs.gov/daltcp/reports/2000/multanal.htm PDF http://aspe.hhs.gov/daltcp/reports/2000/multanal.pdf
The Use of Nursing Home and Assisted Living Facilities Among Privately Insured and Non-Privately Insured Disabled Elders Executive Summary http://aspe.hhs.gov/daltcp/reports/2000/nhalfues.htm HTML http://aspe.hhs.gov/daltcp/reports/2000/nhalfuse.htm PDF http://aspe.hhs.gov/daltcp/reports/2000/nhalfuse.pdf