
Marc A. Cohen, Ph.D., Jessica S. Miller, M.S., and Xiaomei Shi, M.A.
LifePlans, Inc.
This report was prepared under contract #HHS-100-02-0014 between the U.S. Department of Health and Human Services (HHS), Office of Disability, Aging and Long-Term Care Policy (DALTCP) and LifePlans, Inc. For additional information about this subject, you can visit the DALTCP home page at http://aspe.hhs.gov/_/office_specific/daltcp.cfm or contact the ASPE Project Officers, Pamela Doty and Hunter McKay, at HHS/ASPE/DALTCP, Room 424E, H.H. Humphrey Building, 200 Independence Avenue, S.W., Washington, D.C. 20201. Their e-mail addresses are: Pamela.Doty@hhs.gov and Hunter.McKay@hhs.gov.
The opinions and views expressed in this report are those of the authors. They do not necessarily reflect the views of the Department of Health and Human Services, the contractor or any other funding organization.
"
Authors
Marc A. Cohen, Ph.D.
President, LifePlans, Inc.
Senior Scientist, Center for Health and Long-Term Care Research
51 Sawyer Road, Suite 340
Waltham, MA 02453
Jessica S. Miller, M.S.
Director of Analytic Services, LifePlans, Inc.
President, Center for Health and Long-Term Care Research
51 Sawyer Road, Suite 340
Waltham, MA 02453
Xiaomei Shi, M.A.
Research Analyst, LifePlans, Inc.
51 Sawyer Road, Suite 340
Waltham, MA 02453
Executive Summary
The statistics are clear: the number of individuals requiring assistance with personal care activities will rise dramatically in the years ahead. Even in the presence of reported declines in age-specific disability rates, the number of individuals age 65 and over who will need assistance with activities of daily living (ADLs) or instrumental activities of daily living will grow from about 5 million (today) to 7 million (by 2020) (The Lewin Group 2002). The implications for families (who provide the bulk of care and must balance caregiving, work, and childcare), service providers (who must figure out how to deliver care in a variety of settings in a context of uncertain payment streams), and payers (who are struggling to contain costs and budgets) are enormous. The challenges ahead require careful planning, information, and service development to assure that the needs of disabled individuals will be met.
Given the availability of national data on the prevalence of various forms of disability, it is possible to estimate the magnitude of overall need for personal care services. However, what is more difficult to predict is how and where people will actually receive care. This uncertainty derives from a number of factors. First, the service system is changing dramatically, constantly and quickly. Second, despite the tremendous amount of research devoted to identifying the factors related to the need for long-term care (LTC) services -- be they paid or unpaid -- we still do not have a good understanding of what influences consumers to choose a particular service modality. While available data does enable one to uncover the factors related to observing someone in a particular state of disability or service modality, it does not facilitate an understanding of the factors behind the decision to begin using a particular service. Finally, given the relatively high costs associated with LTC services -- upwards of $70,000 a year in a nursing home and as much as $15,000 a year for home care services (MetLife 2005) -- most disabled individuals rely exclusively on family caregivers for assistance.
The ability to pay for needed services often confounds our understanding of the level and mix of services that individuals would choose to meet their care needs and maximize their own well being. As states experiment with programs that provide cash payments to disabled elders, it is increasingly important from a planning and infrastructure development perspective to understand the reasons behind the consumer’s choice of paid services at the time of initial and transitional use.
The purpose of this study is to obtain a comprehensive demographic, health and attitudinal profile of individuals with private LTC insurance policies at the time that they begin using paid LTC services in their current service setting. We also seek to understand the factors involved in the decision about how and why to use paid services in particular care settings (i.e., the home, assisted living or nursing facilities). Equally important, we wish to understand how and why people transition between care settings throughout the course of their disability and also assess the role of care management in the process. In order to do this, we focused on an admissions cohort of LTC claimants and traced their experience and service utilization over time and in multiple settings. That is, we completed in-person interviews with LTC insurance policyholders at or near the time they began using paid services (in either a residential care setting or the community) and then followed them telephonically over a roughly two year period. For the purposes of this report, we only discuss findings from the initial in-person interviews. Key findings are presented below.
Sample Distribution
- Thirty-seven percent of people interviewed were receiving paid care at home, 14% were newly admitted to nursing homes, 23% newly admitted to ALFs and 26% were not yet receiving any paid services, but expected to begin in the next two months.
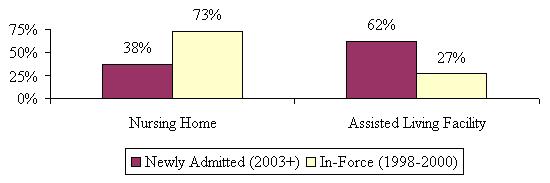
- Findings suggest that the proportion of individuals accessing assisted living has significantly increased over the past 5-6 years. Whereas in the late 1990s 73% of residential care claimants were receiving care in nursing homes, by 2004, more than three in five individuals choosing residential care began their care in ALFs.
Socio-Demographic Characteristics
- With respect to age, individuals newly admitted to ALFs are older than individuals entering all other settings. Over one-third of new entrants to ALFs are over age 85.
- Overwhelmingly the claimants entering the formal service system are female, even in the home care setting.
- Claimants living at home are more likely to be married than are those entering residential care settings. Those newly admitted to ALFs are least likely to be married and in fact, less likely to be married than those in nursing homes.
- Those who have living children are more likely to enter the service system through the home care setting.
- Individuals receiving care at home tend to be more highly educated than those receiving care in alternative settings. In fact, 46% of home care recipients have at least a college degree compared to 36% of those entering nursing homes and 30% of those entering ALFs.
- Higher income, homeownership, and greater home values are all positively associated with individuals receiving paid care at home.
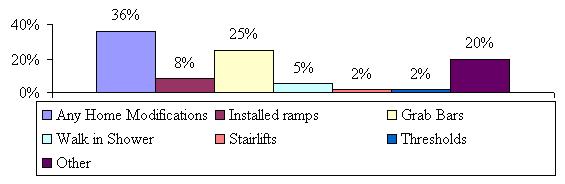
- Almost two in five individuals receiving care at home have made some type of home modification. Most of those who are living at home have installed grab bars.
Functional and Cognitive Characteristics
- Those receiving paid care in a nursing home are the most disabled in their ADLs, with an average of 4.2 limitations.
- Those living at home and currently receiving paid services have more ADL limitations than both those in ALFs and those not yet receiving paid care.
- Those in assisted living and in nursing homes have significantly more limitations than those living at home.
- A high proportion of those living in nursing homes and ALFs are cognitively impaired -- close to two-thirds in each setting. In contrast, only about 28% of those receiving paid care at home are cognitively impaired.
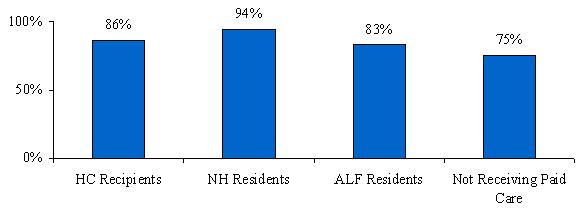
- More than three-quarters of the insured’s in all of the service settings indicated that they were using some form of assistive technology, although the percentage using this technology at home (86%) and in nursing homes (88%) is significantly higher than those using it in assisted living (77%).
Service Use
- Those receiving paid care at home have been receiving such care for the shortest amount of time -- less than one month.
- Individuals interviewed in residential care settings have been receiving care longer than those at home, but about the same as each other.
- Across all service settings the vast majority had been receiving paid care at their current location for less than three months.
- Current nursing home residents were more likely to have received paid LTC care prior to entering the nursing home than current home care users, mostly in a hospital or at home from paid caregivers.
- Current ALF residents were the most likely to have received other LTC services prior to entering the ALF, most from paid caregivers in their home.
- Current ALF residents were also more likely to have received unpaid care prior to entering the ALF than both current home care users and current nursing home residents.
- A little more than one-third of current nursing home residents still receive unpaid help with daily activities from their family members and/or friends.
- The proportion of people living at home, but not yet receiving paid care, and who receive unpaid help is significantly higher than those in all other service settings, including paid home care recipients.
Decision-Making Process
- People in all four service settings indicated that needing more help or the inability to continue to manage on their own was the most common motivational factor behind the decision to begin using paid care.
- The responses given by those currently residing in nursing homes were much more varied (less clustered around a small finite number of issues) than those in the other service settings.
- Having someone available to assist when needed was ranked as most important thing considered when thinking about where to receive care for over half of those surveyed.
- Roughly two in seven saying that feeling safe was the most important when choosing service setting.
- Having someone available to assist when needed was ranked most important most often among all respondents regardless of service setting, followed by the desire to feel safe.
- Nursing home residents were more likely to rank having someone available as the most important issue than those in other service settings.
- Having control over schedules was ranked higher among those living in the community than those in facilities and feeling safe was ranked as most important by ALF residents more often than by those in other service settings.
- Those currently receiving paid care at home were the least likely to have considered alternative care settings.
- ALF residents seem the most likely to have considered all of the other options, with more than one-third stating that they considered staying at home, moving closer to or in with family and almost one third considering moving to a nursing home.
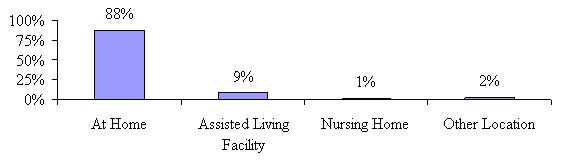
- For those not yet receiving paid care, the majority (88%) intends to receive paid care at home, with another 9% planning to move to an ALF.
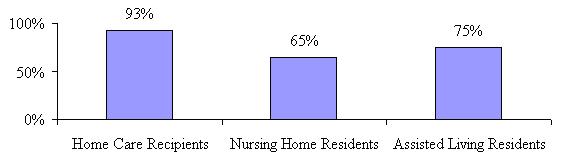
- The overwhelming majority of home care recipients (93%) were receiving care at their first choice location.
- While the majority of nursing home and ALF residents are receiving care at their first choice as well (65% and 75% respectively), the number is significantly lower than for those in the community.
- Over two-thirds of nursing home residents (69%) said having the appropriate level of care was most important, followed by another 12% respectively stating availability of care and proximity to family as important in their decision to choose nursing home care over home care or going to an ALF.
- About two-thirds (36%) of ALF residents said that availability of care was one of the most important things when choosing assisted living over nursing home or home care, while 26% said it was having the appropriate level of care and 23% said safety concerns.
- Eighty-six percent of current ALF residents agreed that they would be most comfortable in an ALF.
- Sixty-three percent of nursing home residents agreed that they would be most comfortable in a nursing home.
- Almost all of nursing home and ALF residents (96% of both) stated that a nursing home was the safest location for them.
- Almost three-quarters of the nursing home residents indicated that there were no other options in the area, while only 29% of ALF residents said the same.
- ALF residents were most likely to shop around before choosing their current ALF.
- Less than one-third of paid home care recipients interviewed more than one paid caregiver or agency.
- We asked if cost was an important consideration when choosing the particular home care provider, nursing home or ALF. A majority of assisted living residents (61%) said cost was an important consideration in their choice of a specific facility.
- Only 26% of nursing home residents stated that cost was an important consideration when choosing their current nursing home.
- Those who have not yet decided on the type of care they are going to receive were the most likely to say cost was an important consideration.
Satisfaction with Service Choices
- Ninety-eight percent of nursing home residents report that their current care needs are being met, while 96% of ALF residents and 82% of paid home care recipients do the same. This pattern persists even when looking at satisfaction levels by disability status and cognitive impairment.
- Those receiving paid care at home (80%) and in ALFs (76%) are more likely to state they are very satisfied with their choice of a particular provider than are those residing in nursing homes (58%).
- There is a high level of satisfaction across all service settings; however those in nursing homes are less likely to indicate that they have enough privacy, the staff spends enough time with them, the nursing home staff is reliable and that they provide quality care all the time. Home care recipients were the most satisfied with their caregivers across almost all of these measures.
- Seventy-seven percent of paid home care recipients reported that the agency they use always sends the same caregiver and in another 21%, the agency sends the same caregiver sometimes.
- Interestingly, 32% of paid home care recipients indicated that they had hired their caregiver privately.
- Home care recipients were less likely to indicate their care needs were being met, but more likely to indicate they were satisfied with their current caregivers and with other aspects of their care experience. Conversely, nursing home residents are most likely to indicate that their care needs are being met and least likely to indicate that they were very satisfied overall and with specific measures of care quality.
Use of Care Management
- At the outset of the study, we interviewed key senior management personnel from each of the participating insurance companies to better understand how they define care management, who provides it and who receives it. We discovered that there was a great deal of variation surrounding the definition of care management services. According to the insurers participating in this study, care management might range anywhere from claim adjudication and assessment, to the full gamut of services including assessment of needs, care plan development and implementation, coordination of services, and reassessment.
- It appears that only a small percentage of study participants (regardless of service setting) used a care manager. The use of a care manager is higher among people in the community than in residential care settings, which is what would be expected; however, it is still only 19% for paid home care recipients.
- Care managers for those residing in nursing homes were more likely to help with the development of a care plan and where to get care, and are less likely to have helped the insured find local providers.
- All of the home care recipients and ALF residents indicated that they followed the care manager’s recommendations, while 94% of nursing home residents stated the same.
- Approximately 60% of nursing home residents stated that their care manager made a recommendation for care in a nursing home and 92% of ALF residents said the same.
- Satisfaction with the services provided by the care manager was very high (95% or higher) across all service settings.
The Effect of Having a Long-Term Care Insurance Policy on Paid Care Use and Choice
- Only 15% of home care recipients seemed to think that they would not be able to receive care at home if they did not have their policy and almost the same for ALF residents (16%). Even fewer nursing home residents (8%) said the same.
- Nursing home residents were least likely to indicate that they would have waited longer before going to their current setting if they did not have their LTC insurance policy (9%), although only a small number in all service settings thought they would have (13% for home care and 16% for ALF).
- Over 90% of respondents did not feel that the insurance restricted their use of specific service providers (regardless of service setting). However, while only a small proportion of each sample answered in the affirmative, a statistically larger percentage of paid home care recipients (9%) did so relative to those in nursing homes (3%) and ALFs (5%).
I. Background
The statistics are clear: the number of individuals requiring assistance with personal care activities will rise dramatically in the years ahead. Even in the presence of reported declines in age-specific disability rates, the number of individuals age 65 and over who will need assistance with activities of daily living (ADLs) or instrumental activities of daily living (IADLs) will grow from about 5 million (today) to 7 million (by 2020) (The Lewin Group 2002). The implications for families (who provide the bulk of care and must balance caregiving, work, and childcare), service providers (who must figure out how to deliver care in a variety of settings in a context of uncertain payment streams), and payers (who are struggling to contain costs and budgets) are enormous. The challenges ahead require careful planning, information, and service development to assure that the needs of disabled individuals will be met.
Given the availability of national data on the prevalence of various forms of disability, it is possible to estimate the magnitude of overall need for personal care services. However, what is more difficult to predict is how and where people will actually receive care. This uncertainty derives from a number of factors. First, the service system is changing dramatically, constantly and quickly. Alternative models of care are being implemented and traditional providers have come to play new roles in the service delivery system. The nursing home of the early 21st century already looks very different from the nursing home of the 1980s. Assisted living facilities (ALFs), new models of home and community-based care delivery, sub-acute care units in nursing homes and the use of home-based assistive technologies have altered the demand for substitute and complementary long-term care (LTC) services. This has led to a blurring of the lines between acute and LTC, between family (informal) and paid (formal) caregiving, and between residential care and home-based care.
Second, despite the tremendous amount of research devoted to identifying the factors related to the need for LTC services -- be they paid or unpaid -- we still do not have a good understanding of what influences consumers to choose a particular service modality. Most of the national data on the prevalence of disability and service use is cross-sectional in nature. While such data does enable one to uncover the factors related to observing someone in a particular state of disability or service modality, it does not facilitate an understanding of the factors behind the decision to begin using a particular service. Nor can we adequately understand the reasons behind various transitions across alternate service modalities. Thus, without a better understanding of consumers’ decision-making process when they perceive they need care and engage providers, it is difficult to make predictions about patterns of service use.
Finally, given the relatively high costs associated with LTC services -- upwards of $70,000 a year in a nursing home and as much as $15,000 a year for home care services (MetLife 2005) -- most disabled individuals rely exclusively on family caregivers for assistance. Recent research suggests that the lifetime costs associated with keeping a disabled individual living at home -- and never having to rely on nursing home care -- are upwards of $175,000 (AARP 2005). According to the 1994 National Long-Term Care Survey, almost half of disabled elders who use formal home care pay for it themselves or their families pay for it out of pocket (ASPE/AoA 1998). Low income elders at risk of nursing home admission may be eligible for paid care financed by Medicaid or other public programs, but availability of such funding varies by state and many states have waiting lists. Moreover, Medicaid coverage of assisted living is currently very limited in most states and federal Medicaid law prohibits states from covering the room and board, as distinct from nursing and personal assistance services costs, in assisted living, although such costs are covered in nursing homes. Because Medicaid coverage for nursing home care is an “entitlement” that is available to all Americans who are judged to need this level of care but are unable to pay privately for it, whereas coverage for assisted living, adult day care, and home-delivered services is more limited, Medicaid is often faulted for creating a purely financial bias toward nursing home use even when alternative services could substitute at lower cost. Thus, the ability to pay confounds our understanding of the level and mix of services that individuals would choose to meet their care needs and maximize their own well being. As states experiment with programs that provide cash payments to disabled elders, it is increasingly important from a planning and infrastructure development perspective to understand the reasons behind the consumer’s choice of paid services at the time of initial and transitional use.
II. Purpose
The purpose of this study is to obtain a comprehensive demographic, health and attitudinal profile of individuals with private LTC insurance policies at the time that they begin using paid LTC services in their current service setting. We also seek to understand the factors involved in the decision about how and why to use paid services in particular care settings (i.e.,the home, assisted living or nursing facilities). Equally important, we wish to understand how and why people transition between care settings throughout the course of their disability and also assess the role of care management in the process. By focusing on an admissions cohort of LTC claimants and tracing their experience and service utilization over time and in multiple settings, we hope to answer the following key policy-relevant questions:
-
In a context where individuals have insurance covering a variety of institutional and non-institutional settings, why do they choose one service option over another and what are the trade-offs that they perceive they are making?
-
Are there barriers to accessing certain types of care, even in the context of adequate private financing?
-
When do people believe that they are disabled enough to begin to access the formal service system?
-
What are the reasons or key factors behind individuals’ transitions between different service settings and how important are quality and cost considerations?
-
How do individuals go about choosing particular providers of care and what are the critical factors affecting their choice of providers?
-
How often is there a mismatch between changing consumer needs and provider capability that necessitates movement between care settings?
-
Do people make use of the care management services that are offered to them and do they find the service useful?
-
What is the influence of care management on the service choices that claimants make?
Obtaining answers to these questions is important for a variety of reasons. As mentioned, we know little about the behavior of individuals at the point that they begin to interface with the formal service network and in particular, when they have the means to pay for services that they desire. A focus on individuals with private insurance would enable us to project patterns of service use if comparable financing were available for home and community-based care services as well as nursing homes and other types of residential LTC services. This is because the dollar amount of coverage that current policyholders can access from their policies likely represents an upper bound on what might be available in the context of a universal public or public/private LTC financing system designed to facilitate equal access to appropriate services based on need instead of income.
Currently, patterns of service use and difficulty accessing alternatives to nursing home care tend to be attributed almost entirely to methods of financing. Problems with the delivery system -- that is, with respect to the availability, reliability, quality, and feasibility of alternatives to nursing home care may be over-looked or under-estimated. A study of the choices that disabled elders make when financing facilitates rather than limits choice will enable us to better understand the extent to which LTC services in various settings are interchangeable or are appropriate for persons with different characteristics and related service needs. We might find, for example, that even when they can afford them, disabled elders do not choose alternatives to nursing home care because these services are not actually available to them where they live or cannot meet their needs. Thus, obtaining information about individuals and their decision-making at the time that they begin using paid services can assist policymakers in identifying the barriers that challenge consumers as they try to obtain the services that will best meet their needs.
Second, as age-specific disability rates continue to decline and use of assistive devises and environmental modifications to lessen the need for human assistance increases, it is important to understand the various points at which individuals choose to begin using formal services. This will help policymakers more accurately project service use during an expected course of disability. Third, there is little opportunity to observe disabled elders over time to understand transitions to and from use of home and community-based services (e.g., in-home aides/attendants and adult day care) and use of residential care settings (e.g., nursing homes, assisted living) as well as movement from one residential care setting to another. We know from previous research that such transitions are not uncommon but we know little about why they occur.1 This is not only because of the confounding effect of income and differential access to third party financing for some service modalities. Research on transitions from informal to formal care and from one type of formal service type to another has also been hindered by the lack of an efficient way to identify and study individuals close to the point at which they begin to use services of various types in various settings. The proposed study of privately insured new claimants will address these issues and provide information to enable better planning of service infrastructure.
Fourth, we know little about what is important to individuals’ choices regarding specific providers. That is, we do not know which provider attributes are most important to consumers. Uncovering these factors can assist providers and policymakers in the planning and development of infrastructure that will be perceived as valuable by consumers. Finally, care management, which is a service offered in these policies, is designed to help individuals access the services that are most appropriate to their needs. Yet, we know little about whether care management services are used, whether consumers believe they are valuable, whether they make a difference to decision-making at initial and transitional service use and whether care plans are actually followed. Finally, many public and private initiatives in LTC financing and service delivery are relying on a strong care management component. Learning about care management in this context presents a unique opportunity to identify the circumstances under which such efforts make a difference and how they can be structured for greater effectiveness.
Strengths and Weaknesses of Reliance on Insurance Sample
There are a number of distinct advantages of coordinating an admissions cohort study of privately insured individuals. First, this sample facilitates identification of a geographically representative sample of admissions cohorts in three distinct service settings, in a very cost-effective manner. Second, given the relatively uniform eligibility criteria used in insurance contracts, it is possible to screen out individuals with short-term post-acute care needs and focus on the true LTC population -- those with limitations in ADLS and IADLs and those with cognitive impairment. Third, previous research demonstrated that the effect of income on service utilization is mitigated in the context of private insurance (Cohen, et al. 1999 & 2000). Thus, a focus on insurance claimants enables an examination of individuals’ choices about how, when and where to utilize services to meet perceived needs, where income is less of a factor in the equation. This allows one to focus on why the service system is or is not able to respond to specific needs of individuals and how it might be configured to better meet such needs. Fourth, the claims systems of private insurance companies collect detailed financial information on service use, which can be linked to information on how and why individuals chose particular service settings. Finally, the data will allow an analysis of the effect of care management on the decision-making process of the claimant and his/her family and obtain an evaluation as to its usefulness.
The focus on those privately insured for LTC is particularly important as growth in the market accelerates and as the states and Federal Government experiment with new ways to finance and deliver LTC. Also, LTC insurance is beginning to pay more of the nation’s LTC bill. Centers for Medicare and Medicaid Services (CMS) estimates that in 2003, LTC insurance paid roughly 10% of the nation’s LTC bill (CMS 2005). Previous research has shown that these policies pay significant benefits in both facility and community settings (Cohen, et al. 1999 & 2000). As more policyholders age, private insurance is expected to play a more meaningful role in financing the nation’s LTC needs.
The major disadvantage of relying on a sample of privately insured individuals is that they are not representative of the disabled elderly population in general. For the most part, individuals claiming benefits under their private insurance policies are more likely to be married, have higher levels of income and assets, and are more highly educated than the general population of disabled individuals (HIAA 2000). On the other hand, in terms of health status, claimants do not look that different from the general population of disabled elders (Cohen, et al. 1999). Thus, it is important to note that the results of the study cannot be generalized to the population as a whole. Even so, what is learned from this sample will be applicable to public initiatives in LTC financing, care management, and service delivery.
III. SAMPLE AND STUDY DESIGN
Ten LTC insurance companies contributed sample to this study. These companies generate in excess of 80% of all LTC claims and are among the major sellers of insurance in the market (LifePlans 2005). These include: (1) Aegon; (2) Aetna; (3) Bankers Life and Casualty; (4) Conseco Senior Health Services; (5) Genworth Financial; (6) John Hancock; (7) MedAmerica; (8) Penn Treaty; (9) Prudential; and (10) UnumProvident. The sample of individuals is therefore representative in that it was drawn from companies accounting for diverse market segments and policy designs that employ differing underwriting and claims management strategies.
In order to qualify for sample inclusion, the following criteria had to be met:
- An individual had to have begun using paid services in their current service setting within the last 120 days or had to anticipate beginning paid service use within 60 days; and,
- They had to have an LTC policy that covered care in all three service modalities, that is, nursing home, home care, and assisted living; and,
- They intended to file a claim or had already filed a claim with their LTC insurance company.
To accomplish sample fulfillment, each of the companies sent referrals of individuals filing a claim or requesting claims packages in order to file a claim. These referrals were received by the company and sent to LifePlans randomly. There was no up-front sample selection. We then called to determine if they met the above criteria. If an individual was “qualified” they were then asked if they would be willing to participate in a national study that involved a series of in-person and telephonic interviews. Of the total qualified sample, 1,474 individuals agreed to participate, this representing an 81% response rate. Table 1 below shows the distribution of the referral sample and ultimate study sample.
| TABLE 1: Referral and Study Sample | |
|---|---|
| Sample Status | Number |
| Total Referrals | 2,523 |
| Non-Qualified Referrals | 700 |
| Qualified Referrals | 1,823 |
| Refused to Participatea | 349 |
| Study Sample | 1,474 |
| Response Rateb | 81% |
|
|
All of these individuals were classified into one of four categories:
- Receiving paid services and making claims for nursing home care;
- Receiving paid services and making claims for assisted living;
- Receiving paid services and making claims for community-based care;
- Not yet receiving paid services but expected to within the next 60 days.
Within two days after an individual agreed to participate in the study, an appointment was scheduled with a nurse to conduct a full in-person assessment. All interviewers were experienced nurses with a minimum of two years of experience in geriatric assessment. All had previous experience in assessing the functional (e.g., ADLs and IADLs) and cognitive (e.g., Short Portable Mental Status Questionnaire (SPMSQ)) status of disabled elders. Moreover, these nurses were trained to administer specific study questions related to service choice, provider evaluation, care management, and other questions related to the attitudes and opinions of the claimant. When a respondent could not answer questions due to cognitive impairment or physical weakness, interviewer nurses worked with proxy respondents, typically a spouse or daughter.2
The major categories of information collected on the admissions cohort of claimants included basic demographic information (i.e., age, gender, marital status, education, income level, presence of children near household, etc.); service use data (i.e., type, intensity, duration, and start date of formal and family care); use of care management (i.e., was it offered, was it used, is there a care plan, developed, etc.); and health and disability data (i.e., ADLs, IADLs, SPMSQ, behavioral assessment, information on number of medications, etc.). We also obtained information on aspects of their current living situation and physical environment.
The interview focused on the reasons why a particular choice was made regarding service use and the extent to which it had to do with the availability and/or quality of existing service infrastructure, family support, insurance coverage, and care manager recommendation. We also asked a series of evaluative questions about the role of the care manager (if indeed one was used) and in cases where an individual opted not to use a care manager, the reasons behind that decision.
After the initial in-person assessment was completed, we began a period of follow-up that consisted of a telephonic interview every four months. The follow-up period was expected to last for approximately a two-year period, that is, seven additional phone interviews after the baseline interview was completed. The purpose of these interviews was to track the functional, cognitive, medical, and service use status of the claimant. In this way, we could gain a “real-time” understanding of the factors behind various transitions, in cases where they occur.
Participating insurers agreed to provide administrative data on LTC policy designs and on claims payments. We have worked with the companies on a common format and many of the computer programs have already been developed so that data transfer can occur electronically. All participants initially agreed to provide data in this jointly developed format.
In this report, we present findings derived from the in-person baseline assessments of individuals entering the LTC system. We have completed two telephone interviews with all of the participants at the writing of this report and are continuing with the remaining follow-up. Another report will be issued on the findings from the first two telephone follow-ups once the data has been cleaned and analyzed.
It is important to note that the findings below are based on weighted data. Once all of the responses were collected, we developed a standard weight based on the in-force market share of each of the participating companies. Most of the data collection for the admissions cohort occurred in 2003 and 2004 (with a small number occurring in 2005), therefore we used the in-force market share of the companies for these two years to compute a weight for each company. These market share numbers were obtained from the 2003 and 2004 National Association of Insurance Commissioners (NAIC) experience exhibits, as well as the 2003 and 2004 Top Writers Survey conducted by LifePlans. In this manner, we assure that we are not giving too much weight to companies with smaller market shares that contributed larger samples to the survey and alternatively, too little weight to companies with larger market shares, but smaller samples. All of the tables and charts that follow are based on analyses done with the weighted sample unless otherwise noted.
For the purposes of this report, the term claimant refers to all LTC insurance policyholders whose names were forwarded by their insurance company for inclusion in the study based on the aforementioned criteria. However, it should be noted that a certain number of these “claimants” will not become paid claimants for reasons such as not meeting their policy’s claim eligibility requirements, getting better before their policy’s elimination period has expired or because they simply changed their mind about filing a claim with the LTC insurance company. During subsequent telephone waves, we will ask each respondent whether or not they have filed a claim with their insurance company and whether or not it has been approved and will report on these findings in future reports. We will also be obtaining insurance company provided claim data and will know from that whether any claims had been paid out under the policy during the study period. We did make the decision to continue to follow everyone, regardless of whether they actually receive payment for covered services under their policy so that we can observe the health status and use of paid services of all those who met the criteria at baseline.
IV. FINDINGS
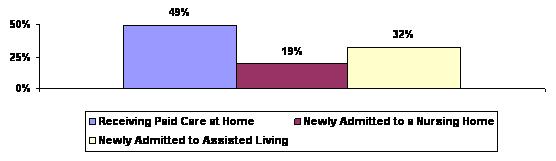
Figure 1 below shows the distribution of the admissions cohort sample in terms of service status at the baseline interview. Over one-third of the sample was using paid care at home at the time of the baseline interview. The smallest proportion was receiving care in nursing homes. About one quarter of the entire sample (26%) notified their insurance company of their intent to begin using paid services and file a claim, but had not yet started at the time of the baseline interview.
| FIGURE 1: Distribution of Sample |
 |
Figure 2 shows the distribution of only those who were already using paid care at the time of the baseline interview. Of all individuals who contacted their insurance company with the intent to file a claim and who were already receiving paid services, half were living at home and the other half were in residential care settings (more in ALFs than in Nursing Homes). Across the participating companies there was a great deal of variation in the distribution of inquiries across service settings.
| FIGURE 2: Distribution of Paid Care Receivers by Service Setting |
 |
Among those entering residential care settings, the percentage moving to ALFs very high, especially when one considers that such facilities developed only within the last 15 years. In a prior study of in-force claimants completed in the late 1990s, 27% of residential care claimants were residing in ALFs (Cohen, et al.1999 & 2000). How does the distribution of in-force residential care claimants, compare to this sample of newly admitted residential care claimants? Figure 3 suggests that the proportion of individuals accessing assisted living has significantly increased over the past 5-6 years. Whereas in the late 1990s 73% of residential care claimants were receiving care in nursing homes, by 2004, more than three in five individuals choosing residential care began their care in ALFs.3
| FIGURE 3: Distribution of Newly Admitted and In-force Residential Care Claimants by Setting |
 |
In the analyses that follow, results are presented separately for each service setting (including in places, those who are not yet receiving paid care).
A. Socio-Demographic Characteristics
Table 2 highlights the socio-demographic characteristics of the admissions cohort by service setting. Each service setting is labeled with a different letter. For example, individuals receiving paid home care are in column (A), whereas those who are living at home but have not yet begun receiving services are labeled as column (D). These letters are assigned so that we can analyze the extent to which there are statistical differences between findings across service settings. If a finding has the letters (BC) by it, this suggests that it is statistically greater/higher than the findings in columns B and C. If a finding has a letter (D) by it, this means that it is statistically greater/higher, than the finding in column D. We report differences that are significant at the 0.05 level.
| TABLE 2: Socio-Demographic Characteristics of Admission Cohort by Service Setting | ||||
|---|---|---|---|---|
| Socio-Demographic Characteristics | Receiving Paid Care at Home (A) |
Nursing Home (B) |
Assisted Living (C) |
Not Yet Receiving Paid Care (D) |
| Age | ||||
| Average Age | 77 | 80 AD | 82 ABD | 78 |
| Below 65 | 8% BC | 2% | 1% | 9% BC |
| 65-74 | 21% C | 15% | 10% | 21% C |
| 75-79 | 27% C | 28% | 19% | 22% |
| 80-84 | 27% | 28% | 35% D | 25% |
| 85 or above | 18% | 27% | 35% AD | 24% |
| Gender | ||||
| Male | 32% | 41% C | 26% | 35% C |
| Female | 68% | 59% | 74% BD | 65% |
| Marital Status | ||||
| Married | 49% BC | 36% C | 24% | 47% C |
| Widowed | 40% | 54% AD | 65% AD | 41% |
| Single | 2% | 4% | 5% | 4% |
| Separated | 2% | 1% | 2% | 2% |
| Divorced | 6% | 6% | 4% | 7% |
| Partner | 1% | --- | --- | --- |
| Spouse’s Employment Status | ||||
| Yes -- full-time | 4% | 1% | 1% | 9% |
| Yes -- part-time | 7% | 8% | 3% | 7% |
| No | 89% | 91% | 97% D | 84% |
| Living Arrangement | ||||
| Alone | 41% | --- | --- | 40% |
| Spouse | 45% BC | 1% | 4% | 42% BC |
| Daughter/Son | 9% BC | 1% | 1% | 11% BC |
| Facility | --- | 98% D | 95% D | 1% |
| Other | 5% C | --- | 1% | 5% C |
| Spouse and child | 1% | --- | --- | 2% |
| Education Level | ||||
| Less than high school | 3% | 6% | 6% | 4% |
| Some high school | 4% | 3% | 6% | 5% |
| High school graduate | 19% | 28% A | 34% A | 31% A |
| Technical/trade/vocational school | 7% | 12% D | 10% | 6% |
| Some college | 22% | 14% | 15% | 18% |
| College graduate | 26% | 23% | 22% | 21% |
| Graduate degree | 20% C | 13% | 8% | 16% C |
| Presence of Children | ||||
| Yes | 91% BC | 83% | 85% | 89% |
| No | 9% | 17% A | 15% A | 11% |
| Any Children Living within 25 Miles | ||||
| Yes | 68% | 73% | 82% AD | 68% |
| No | 32% C | 27% | 18% | 32% C |
| Income | ||||
| Less than $50,000 | 63% | 82% A | 86% AD | 75% A |
| $50,000 or more | 37% BCD | 19% | 14% | 25% C |
| Income | ||||
| Less than $25,000 | 34% | 41% | 50% AD | 30% |
| $25,000 - $34,999 | 17% | 19% | 22% | 24% |
| $35,000 - $49,999 | 14% | 22% | 14% | 19% |
| $50,000 - $74,999 | 20% BC | 9% | 9% | 20% BC |
| $75,000 - $99,999 | 8% C | 4% | 2% | 4% |
| $100,000 - $149,999 | 4% | 4% | 1% | 2% |
| $150,000 or above | 2% | 1% | 2% | 1% |
| Homeownership | ||||
| Yes | 88% BC | 71% | 62% | 86% BC |
| No | 12% | 30% AD | 38% AD | 14% |
| Home Modification within the Last Year | ||||
| Yes | 38% | 32% | ||
| No | 62% | 68% | ||
| Housing Assets | ||||
| Less than $50,000 | 2% | 1% AD | 5% | 2% |
| $50,000 - $99,999 | 18% | 25% | 26% D | 16% |
| $100,000 - $199,999 | 33% | 46% | 45% A | 35% |
| $200,000 - $299,999 | 14% B | 4% | 14% B | 19% B |
| $300,000 - $399,999 | 8% | 8% | 5% | 14% AC |
| $400,000 - $499,999 | 11% C | 5% | 1% | 7% C |
| $500,000 - $799,999 | 7% | 2% | 3% | 5% |
| $800,000 and above | 8% D | --- | --- | 2% |
Age, Gender and Marital Status
With respect to age, the results show that individuals newly admitted to ALFs are older than individuals entering all other settings. Over one-third of new entrants to ALFs are over age 85. This service modality typically serves a less disabled population than what is found in nursing homes (Spillman, et al. 2002). Thus, it may be the case that many of the new private LTC insurance claimants who choose to enter ALFs are making a life-changing move while they are physically able to do so and are preparing for the time when they gradually become more disabled and may require more intensive care. Also, many ALFs now have specialized Dementia Care Units, so that individuals who may be showing early stages of cognitive decline prefer to age in place at an ALF rather than having to move to a nursing home at later stages of dementia. New entrants to nursing homes tend to be older than individuals in home care.
In terms of gender, one statistic stands out: overwhelmingly the claimants entering the formal service system are female, even in the home care setting. Males are less likely to make claims on their policies; while a higher percentage of females have policies -- roughly 55% compared to 45%. However, most of the gender difference in type of service use cannot be explained by policy ownership. Differential mortality and morbidity rates, as well as the availability of family supports likely account for most of the difference in formal service use. Compared to other service settings, the admission cohort entering the nursing home tends to have the highest percentage of males. On the other hand, women represent the highest percentage of new entrants to ALFs. These facilities provide a highly social, as well as protected, environment to individuals capable of independent living.
Regarding marital status, claimants living at home are more likely to be married than are those entering residential care settings. This is not surprising, given that married individuals are able to provide care to each other and the formal service system typically supplements a level of care already being provided by family members. Those newly admitted to ALFs are least likely to be married and in fact, less likely to be married than those in nursing homes. Two-thirds of ALF claimants report being widowed. This further supports the notion that many individuals entering ALFs are doing so to meet both social and “protection” needs; given their advanced age, they may be frail, but as we shall see in the findings that follow, they tend to be the least disabled of the claimant population.
Those who have living children are more likely to enter the service system through the home care setting. Somewhat surprisingly, however, among those who have children living within 25 miles, the highest percentage is entering ALFs. This service modality provides a more protected environment than the home and therefore may be an attractive way for frail independent elders to age in place and access services from the facility, as they need them. Concerns about safety, falls, and social isolation are addressed in ALFs, and nursing homes are still viewed as serving a population that is already highly dependent.
Education and Wealth Status
In general, individuals who purchase LTC insurance tend to have higher levels of education and are wealthier than elders in the general population. Individuals receiving care at home tend to be more highly educated than those receiving care in alternative settings. In fact, 46% of home care recipients have at least a college degree compared to 36% of those entering nursing homes and 30% of those entering ALFs. Higher income, homeownership, and greater home values are all positively associated with individuals receiving paid care at home. Note that 13% of nursing home residents and 34% of ALF residents are in the process of or have already sold their homes (not shown in Table 1). Whereas half of claimants newly entering assisted living have incomes less than $25,000, for those in home care, the figure is closer to one-third. (Given the relatively high cost associated with ALFs, it is surprising that such a high percentage has incomes less than $25,000; on the other hand, it may be that insurance or proceeds from the sale of their homes are financing the bulk of the costs of care for these individuals.)
The findings regarding income status are particularly interesting. Among people purchasing policies in the early to late 1990s -- the individuals who would likely comprise the bulk of claimants in this sample -- roughly 60% had incomes less than $35,000 (HIAA 2000). This is roughly comparable to the income distribution of claimants in this sample. It should be noted that the “lower income” claimants in this sample (those with incomes less than $35,000) would be considered to be in a middle income bracket in a non-insured environment. It would appear that having LTC insurance reduces or even eliminates the effect of income variation on the demand for paid care. This has been documented in previous studies of LTC insurance claimants as well (Cohen, et al. 1999). In this sample, as in previous research, the effect of income on the use of paid services is overwhelmed by the presence of private LTC insurance.
An unexpected finding is the proportion of individuals living in their homes who have made some modification to their home environment within the past 12 months. Almost two in five individuals receiving care at home have made some type of home modification (see Figure 4). Most of those who are living at home have installed grab bars. This may suggest that these claimants have been experiencing a gradual increase in disability prior to deciding to file a claim under their LTC insurance policy. It may be that those who make some modification to their home are planning ahead and have an intention to try to remain in their own homes despite disability.
| FIGURE 4: Home Modification Among those Living at Home |
 |
B. Functional and Cognitive Characteristics
As part of the baseline interview, the trained nurses assessed the functional and cognitive status of the claimants, as well as collected information on medical diagnoses. This included questions on Katz’s ADL scale and Lawton’s scale of IADL. ADLs included bathing, dressing, toileting, transferring, eating and continence. IADLs included housework, laundry, meal preparation, shopping for groceries, managing money, using the telephone, transportation and medication management.4 The nurses also administered the Short Portable Mental Status Questionnaire (SPMSQ) -- a standard test designed to detect dementia.5 Table 3 highlights the functional and cognitive profile of people in each service setting. Figure 5 summarizes key findings in graphic form.
| TABLE 3: Functional and Cognitive Characteristics of Admission Cohort by Service Setting | ||||
|---|---|---|---|---|
| Health Characteristics | Receiving Paid Care at Home (A) |
Nursing Home (B) |
Assisted Living (C) |
Person Not Yet Receiving Paid Care (D) |
| ADL Limitations | ||||
| Under 2 ADL limitations | 18% | 12% | 36% AB | 34% AB |
| 2 ADL limitations | 18% | 11% | 19% | 12% |
| 3-4 ADL limitations | 34% BC | 20% | 25% | 31% B |
| 5-6 ADL limitations | 30% CD | 57% ACD | 20% | 22% |
| AVERAGE ADL LIMITATIONS | 3.3 CD | 4.2 ACD | 2.6 | 2.6 |
| IADL Limitations | ||||
| Under 5 IADL limitations | 8% | 7% | 7% | 20% ABC |
| 5-6 IADL limitations | 43% BC | 8% | 20% B | 41% BC |
| 7-8 IADL limitations | 49% | 85% ACD | 73% AD | 39% |
| AVERAGE IADL LIMITATIONS | 6.3 D | 7.2 AD | 6.8 AD | 5.8 |
| Mobility -- Inside Limitation | ||||
| Yes | 52% | 78% ACD | 45% | 43% |
| No | 49% B | 22% | 55% B | 57% B |
| Mobility -- Outside Limitation | ||||
| Yes | 87% D | 96% ACD | 82% | 74% |
| No | 14% B | 4% | 18% B | 26% AB |
| Cognitive Impairment | ||||
| Yes | 28% | 64% AD | 63% AD | 29% |
| No | 72% BC | 36% | 37% | 71% BC |
| Use of Assistive Technology | ||||
| Yes | 86% CD | 88% CD | 77% | 74% |
| No | 14% | 12% | 23% AB | 26% AB |
| FIGURE 5: Average Number of Functional Limitations by Service Setting: ADLs and IADLs |
 |
Functional Limitations
As expected, those receiving paid care in a nursing home are the most disabled in their ADLs, with an average of 4.2 limitations. It is important to note that participants were asked if they were able to perform an activity independently, with partial assistance or with total assistance. Those who reported that they were anything other than independent are considered to have a limitation in an ADL. Those living at home and currently receiving paid services have more ADL limitations than both those in ALFs and those not yet receiving paid care. It is also interesting to note that those living in ALFs and those living at home but not yet receiving paid care, are most likely to have fewer than two ADL limitations.
In terms of IADL limitations, those in assisted living and in nursing homes have significantly more limitations than those living at home. Moreover, of those who are living at home, the ones who are currently receiving paid care have more IADL limitations than do those who have not yet commenced service use. In terms of total limitations, the most physically disabled are those in nursing homes, followed by those receiving paid care at home, then by ALF residents. Individuals, who have not yet begun to use formal paid care, are the least disabled. Taken together, these findings suggest that individuals entering ALFs are doing so in large part to compensate for deficiencies in IADLs -- which are also related to dementia status -- whereas those receiving care at home, are more often receiving services to compensate for purely physical disabilities.
Cognitive Limitations
A high proportion of those living in nursing homes and ALFs are cognitively impaired -- close to two-thirds in each setting. While it is not surprising that this percentage is higher than it is for claimants living in the community, it is somewhat unanticipated that the proportion is so high for claimants choosing ALFs. This undoubtedly reflects the fact that most people prefer to be in a home like setting and in response, ALFs are providing more services -- including dementia care. It supports the trend in caregiving away from the more “medical” nursing home toward the more “home-like” ALF. Also, the fact that the rate of cognitive impairment is relatively low among home care claimants suggests that, in the home, both formal and family caregivers are much more adept or able to deal with physical limitations than they are with dementia-related limitations. The latter often requires more intensive and ongoing monitoring than the former, which is often confined to providing assistance with a discrete number of tasks during the course of a day.
HIPAA Triggers and Service Setting
In the Health Insurance Portability and Accountability Act (HIPAA) of 1996 legislation, LTC insurance policies are tax qualified if access to benefits is limited to: (1) individuals with at least two ADL limitations; or (2) individuals who are moderately or severely cognitive impaired. Figure 6 shows that there is variation across service settings. The highest proportion of those meeting triggers live in nursing homes, which is to be expected given that they are the most disabled. But still, 6% here do not meet HIPAA triggers. Seventeen percent of policyholders living in assisted living do not meet these triggers. It is important when viewing these percentages to keep in mind that not all of these insureds will become claimants -- something we will know in the future as we obtain data from the telephone interviews and claims data from the insurance companies. Three out of four people living at home without current paid care meet the HIPAA eligibility triggers. These individuals have the highest proportion among the service settings of those who do not meet triggers (14%) indicating that they may be planners (notifying their insurance companies early to make sure they know what to do if they become more disabled and want to file a claim) or they may be unaware of their policy benefit eligibility triggers or perhaps they are particularly frail and cannot continue to function independently in their own homes. It is also possible that the policies held by these claimants do not use the HIPAA triggers (they may have medical necessity or doctor certification as their benefit eligibility requirement). Over time, we will better understand who these people are and whether they were able to obtain benefits under their policies and if and how they continued to use paid care over time. The administrative data we obtain from the insurance companies will also tell us whether or not a person’s policy requires HIPAA triggers be met for benefit eligibility.
| FIGURE 6: Percent Meeting HIPAA Triggers by Service Setting |
 |
Use of Assistive Technology
We asked participants if they were using equipment to complete their ADLs and a majority in all settings indicated that they were. Although the percentage using such equipment is higher at home and in the nursing home, more than three-quarters of the insured’s in all of the service settings indicated that they were using some form of assistive technology.6
To sum up, those newly residing in nursing homes are the most dependent in terms of ADL and IADL limitation and cognitive impairment, while those living at home but not yet receiving paid care are the least dependent. These less disabled individuals appear to recognize their decline and are contacting their insurance company early. Alternatively, they may be more likely to have progressive health loss instead of a significant acute episode that requires immediate and urgent care.
C. Service Use
In order to better understand the decision-making process regarding service choice, we needed to obtain a picture of the amount of paid and unpaid care people were receiving, how long they had been receiving it and whether or not they were receiving any care prior to their current episode of care use.
First, we asked how long people had been receiving paid care related to a disability or a change in health status in their current setting. We structured the question so as to exclude paid care unrelated to limitations in ADLs and IADLs -- or care that may be more related to convenience instead of disability. Figure 7 shows that those receiving paid care at home have been receiving such care for the shortest amount of time -- less than one month. In contrast, individuals interviewed in residential care settings have been receiving care longer than those at home, but about the same as each other. Across all service settings the vast majority had been receiving paid care at their current location for less than three months. This timeframe is ideal when asking someone to recall why a decision was made, as well as for understanding satisfaction with service choices: it is close enough to the beginning of the process to be remembered easily, yet long enough for people to have had significant experience with the setting and provider to form an opinion about their care.
| FIGURE 7: Length of Time Receiving Paid Care in Current Location |
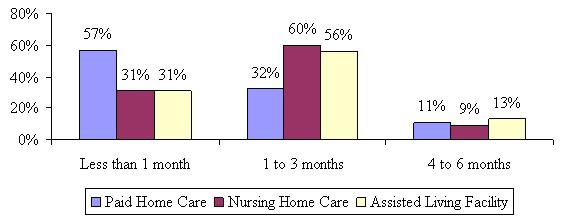 |
As noted earlier, we screened participants prior to the baseline interview to ensure that they were as close to the time that they began using paid care as possible. One of the criteria at screening was that they had to have begun using paid care within the last 120 days or four months; however, by the time the baseline interview occurred, a small percentage of the sample that may have had difficulty in scheduling the in-person interview had surpassed the four month requirement. No one had been using paid care in his or her current service setting for greater than six months.
We were interested in whether or not a person was receiving any formal LTC services or unpaid family care prior to entering their current service setting. Figure 8 shows the proportion of those currently receiving care that had received services (paid and/or unpaid) prior to entering the current service setting.
| FIGURE 8: Prior use of Formal and Family Care by Service Setting |
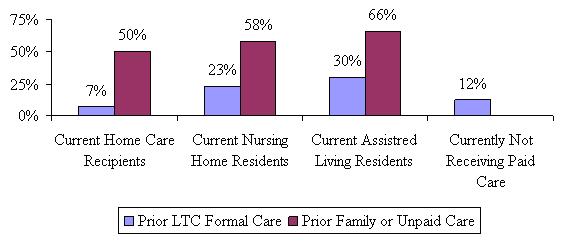 |
As shown, between 7% and 30% had accessed the formal LTC support system at some point before beginning their current paid care episode. Between one-half and two-thirds depended on unpaid family care prior to accessing paid services under the LTC insurance policies. Current nursing home residents were more likely to have received paid LTC care prior to entering the nursing home than current home care users, mostly in a hospital or at home from paid caregivers. Current ALF residents were the most likely to have received other LTC services prior to entering the ALF, most from paid caregivers in their home. This seems to suggest that those in facilities had tried to maintain their independence and remain at home with paid help, but that it may not have been enough. It is important to note, too that we did not ask when the prior care occurred. Current ALF residents were also more likely to have received unpaid care prior to entering the ALF than both current home care users and current nursing home residents. One quarter of those who are not currently receiving paid care, but expect to do so in the next two months stated that they recently received paid help (most either at home or in a rehab hospital). On the whole, current nursing home residents had been receiving their unpaid care the longest, with over half (56%) stating that they had been receiving unpaid care for more than two years prior to entering the nursing home.
In addition to prior service use, we asked participants in all service settings if they were currently receiving unpaid help specifically with ADLs and IADLs from family members or friends. Of particular interest was whether or not those residing in nursing homes were receiving more than just companionship care from their families. More specifically, it is often assumed that because someone resides in a nursing home, all of their care is provided by paid caregivers. Yet there is a great deal of anecdotal information suggesting that there are shortages of staff in nursing homes. Thus, we wished to determine if family members are providing personal care services in nursing homes.
Figure 9 shows the proportion of insured’s that are receiving unpaid help with everyday activities by service setting.
| FIGURE 9: Currently Receiving Unpaid Care by Service Setting |
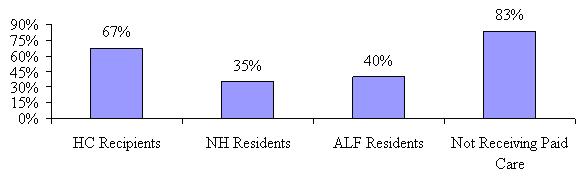 |
Although significantly less than those living at home, a little more than one-third of current nursing home residents still receives unpaid help with daily activities from their family members and/or friends. The proportion of people living at home, but not yet receiving paid care, and who receive unpaid help is significantly higher than those in all other service settings, including paid home care recipients. One can conclude that once the family support system is strained or unable to provide sufficient care, policyholders begin to receive paid care to supplement their unpaid care. This why the percentage of individuals receiving unpaid care declines somewhat once formal care is put in place. Individuals living at home who have not yet begun to use paid services are also the least disabled. This data suggests that the amount of unpaid help received is not just a function of disability status but also a function of where you receive care.
D. Decision-Making Process
One of the goals of this study is to understand why people make the decision to begin using paid care when they do, and how they choose where to receive that care. Are the decisions based on the availability of care, the disability level of the insured, or the availability of family supports? Or are there other factors involved? While researchers have examined this issue, few studies have been able to focus on decision-making at the time that services are put in place. Often disabled elders or their family members are asked to recall a process that may have occurred a year or more ago. One can imagine a situation where an elder had no desire to go in to a facility, but whose family members felt it was important for their safety. As time goes by, the institutionalized individual develops friends and a sense of belonging so that when asked if going to a facility was their first choice, or if they are happy with choosing a facility over care at home, they may answer yes. In this longitudinal study, our intent is to learn about decisions and satisfaction levels close to the outset of an episode of service use and see if and how these change over time.
This study examines three important aspects of the decision-making process. These include the decision to: (1) begin using any paid care; (2) choosing a specific type of care or location of care (i.e., home care versus nursing home or assisted living), and; choosing a particular provider of that care (i.e., the choice of ABC nursing home versus XYZ nursing home).
When interpreting answers to decision-making and satisfaction questions, it is important to understand whether or not the person providing the answers was involved in or is knowledgeable about the process. We asked each respondent if they were the primary decision-maker and in almost all cases they were was either the sole decision-maker, one of a pair or group involved, or was able to answer accurately on behalf of the decision-maker(s). It is often the case that if someone other than the insured was involved in the decision, it is a group of people (such as the children or spouse and children).
Beginning Paid Care Use
The first important issue we sought to understand was the point at which individuals feel they are disabled enough to access paid care and make claims on their LTC insurance policy. Understanding what motivates people to begin accessing paid care has important implications for planning and development of the LTC service system. We have seen previously that those who are already receiving paid care at the time that they contact their insurance company are more disabled and less likely to have family members providing care, so perhaps their motivations for engaging service providers are different as well. To examine this, we asked each participant what caused or motivated him or her to begin using paid care and file a claim. Figure 10 summarizes the most common responses.
| FIGURE 10: Most Common Motivation for Starting Paid Care by Service Setting |
 |
People in all four service settings indicated that needing more help or the inability to continue to manage on their own was the most common motivational factor behind the decision to begin using paid care. The number was significantly smaller for nursing home residents than for other service settings. The responses given by those currently residing in nursing homes were much more varied (less clustered around a small finite number of issues) than those in the other service settings. Those who are not yet receiving paid care, but intend to obtain services within the next few months seem to have similar motivational issues to those who are already receiving paid care. Interestingly though, they are more likely to indicate that the unpaid care they have is insufficient to meet their care needs. This would seem to imply that although a high proportion is currently receiving unpaid care, they may be getting worse and the support they are receiving from unpaid sources is no longer sufficient. Put another way, as the family support system experiences greater demand and strain, it is likely to require supplemental support from the formal (paid) care system.
Clearly one would expect that the decision to begin using care is related to disability status. Figure 11 illustrates the relationship between disability status and the reasons why individuals began using formal paid services.
| FIGURE 11: Most Common Motivations for Starting Paid Care by Disability Status |
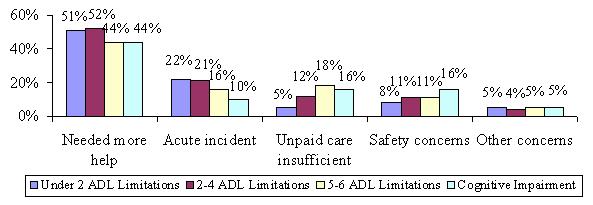 |
While needing more help is still reported as the most common motivation among all levels of disability, there are some variations in the other motivations. Those claimants who are most disabled are the least likely to say that an acute incident was the most common motivation for care; they are also least likely to say that their unpaid care was insufficient. Also, those with cognitive impairment are twice as likely as those who have less than two ADL limitations to say that safety concerns are the most common motivator.
Choosing Where to Receive Care
In conjunction with understanding the issues that motivated paid care use, we also sought to understand the issues that were important when thinking about where to receive care. Participants were offered a list of five values, each of which was theoretically related to service choices. Respondents were asked to rank them in order of their importance. The nurse assessors were instructed not to allow respondents to rank any two items the same. The five items included:
- Maintaining personal privacy;
- Feeling safe where I am;
- Having someone available to assist me when I need them;
- Having control over my own schedule/daily routines;
- Being around peers and acquaintances.
Figure 12 shows the distribution of the sample as a whole and the characteristic that was ranked as most important most often.
| FIGURE 12: Proportion Ranking Characteristics as Most Important when Thinking about Where to Receive Paid Care |
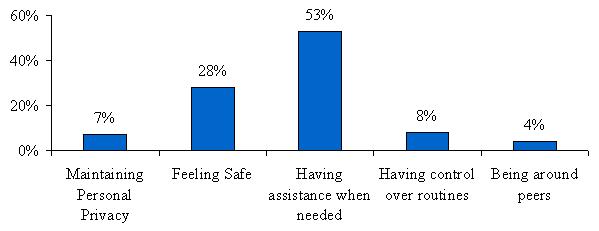 |
Of the five items offered, having someone available to assist when needed was ranked as most important thing considered when thinking about where to receive care for over half of those surveyed. This was followed by roughly two in seven saying that feeling safe was the most important when choosing service setting. Given that a large number of insured’s indicated that needing more help was the most common motivator for beginning paid care use, it is understandable that the majority would also say that the availability of helpers was the most important to their choice of service setting.
It might be hypothesized that different factors would be important to claimants who choose different service settings. For instance, it may be that safety is the most important issue for those who choose nursing homes, while maintaining personal privacy would be least important. Conversely, maintaining personal privacy could be the most important issue to those choosing paid care at home. Table 4 shows the distribution of those ranking an issue as most important by various socio-demographic characteristics as well as by service setting.
| TABLE 4: Ranking of Values by Socio-Demographic and Service Setting Variables: Proportion Ranking the Characteristic as Most Important | |||||
|---|---|---|---|---|---|
| Maintaining Personal Privacy | Feeling Safe | Having Assistance When Needed | Having Control Over Routines | Being Around Peers | |
| Setting | |||||
| Home care | 10% | 21% | 52% | 12% | 5% |
| Nursing home | 4% | 29% | 61% | 3% | 3% |
| Assisted living | 4% | 37% | 54% | 3% | 2% |
| Not yet receiving paid care | 9% | 28% | 49% | 10% | 4% |
| Disability Status | |||||
| Less than 2 ADLs | 10% | 27% | 48% | 11% | 5% |
| 2-4 ADLs | 9% | 29% | 51% | 8% | 3% |
| 5+ ADLs | 4% | 27% | 59% | 6% | 4% |
| Dementia | 5% | 34% | 52% | 5% | 4% |
| Age | |||||
| Less than 65 | 6% | 20% | 55% | 14% | 5% |
| 65-74 | 6% | 29% | 51% | 10% | 4% |
| 75-79 | 8% | 30% | 52% | 7% | 3% |
| 80-84 | 8% | 29% | 54% | 7% | 2% |
| 85+ | 8% | 26% | 53% | 8% | 5% |
| Marital Status | |||||
| Married | 9% | 23% | 56% | 8% | 4% |
| Unmarried | 7% | 30% | 51% | 8% | 4% |
| Gender | |||||
| Male | 10% | 24% | 55% | 7% | 4% |
| Female | 7% | 29% | 51% | 9% | 4% |
| Parental Status | |||||
| Have children | 8% | 28% | 53% | 8% | 3% |
| No children | 7% | 28% | 52% | 8% | 4% |
Interestingly, we found that having someone available to assist when needed was ranked most important most often among all respondents regardless of service setting, followed by the desire to feel safe. However, nursing home residents were more likely to rank having someone available as the most important issue than those in other service settings. Having control over schedules was ranked higher among those living in the community than those in facilities and feeling safe was ranked as most important by ALF residents more often than by those in other service settings.
We next asked a series of questions designed to determine whether service settings other than the current one were considered. A set of three questions was asked, each one representing a stronger interest in alternative settings. First, we asked if other care settings were considered, then if they were visited and finally if the insured is on a waiting list for any other care settings. We surmise that considering other options shows less intention than actually taking the time to visit. The strongest intention to be somewhere else is represented by being on a waiting list at an alternative care setting.
Figure 13 shows that those currently receiving paid care at home are the least likely to have considered alternative care settings. ALF residents seem the most likely to have considered all of the other options, with more than one-third stating that they considered staying at home, moving closer to or in with family and almost one-third considering moving to a nursing home. This may be reflective of the advanced age. While they may be less disabled than those in nursing homes or home care settings, they may be more frail or feeling vulnerable given their advanced age.
| FIGURE 13: Consideration of Alternative Care Settings |
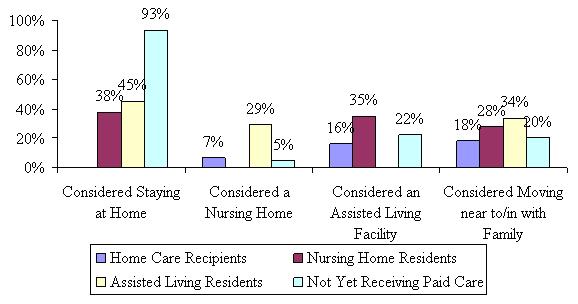 |
Figure 14 shows the distribution of those taking a more serious step toward consideration of alternative care settings. For the most part, the majority of people did not visit a nursing home or ALF; however, those currently residing at home, regardless of whether they are receiving paid care yet or not, were the least likely to have visited a nursing home or ALF. Almost half of both nursing home residents and ALF residents visited the other type of facility.
| FIGURE 14: Visited Alternative Care Settings |
 |
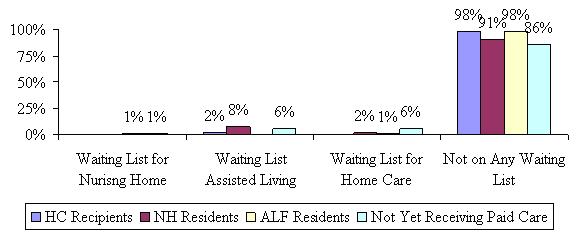
Figure 15 shows that although many participants may have considered other care settings and may even have visited a nursing home or an ALF, they are, for the most part planning to stay where they are. Only 8% of current nursing home residents said they are on a waiting list for an ALF, while 6% of those not yet receiving paid care indicated that they were on a waiting list for an ALF or to receive care at home.
| FIGURE 15: On a Waiting List for Alternative Care Setting |
 |
For those not yet receiving paid care, we asked them where they intended to receive assistance and the results are shown in Figure 16. Not surprisingly, the majority (88%) intends to receive paid care at home, with another 9% planning to move to an ALF. We also asked this group if they had made arrangements for a specific home care provider, nursing home or ALF and only 30% said that they had. Given that they have all contacted their insurance company with a claim inquiry, this suggests that they are waiting to determine whether and what their policy covers before contacting and making specific arrangements with service providers.
| FIGURE 16: Intended Care Setting for those Not Yet Receiving Paid Care |
 |
In order to understand responses regarding satisfaction with care setting and provider, we needed to know whether or not the insured was receiving care in the location of their first choice. In other words, even though it is widely believed that given the choice, people would remain at home, is this truly the case? Figure 17 shows that the overwhelming majority of home care recipients are in fact receiving care at their first choice location. While the majority of nursing home and ALF residents are receiving care at their first choice as well, the number is significantly lower than for those in the community, with only two-thirds of nursing home residents indicating they are in their first choice location.
| FIGURE 17: Current Care Setting was First Choice |
 |
For those who were not receiving care at the location of their choice, we asked why they were unable to do so. There was no clear consensus among the small number of home care recipients who were not where they would have chosen to be. Among the 35% of nursing home residents and one-quarter of assisted living residents for whom a facility was not their first choice, the most often cited reason was that they required a higher level of care than they could obtain from their first choice care location. Of the 7% of current home care recipients that were not receiving care at their preferred location, 40% would have chosen to go to an ALF and another 25% would have chosen to attend adult day care instead of having someone come in to their home to care for them. Figure 18 shows the first choice locations of those facility residents for which a facility was not their first choice.
| FIGURE 18: Location of First Choice for Those not Receiving Care at Preferred Location |
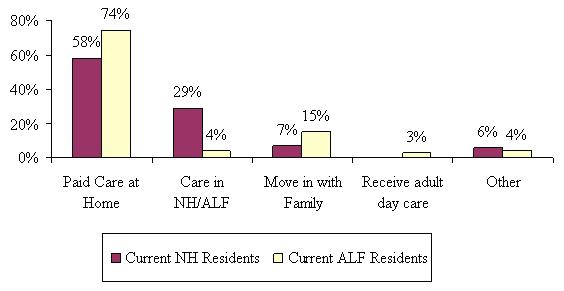 |
Not surprisingly, the majority of nursing home and assisted living residents who were not in their first choice location would prefer to be living in the community, either receiving paid care at their own homes or living with family members. Almost a third of nursing home residents would have preferred to be in an ALF instead.
To further understand what went in to the decision to use one particular care setting as opposed to another, we asked about the most important things considered when choosing where to receive care. Figure 19 highlights the general consensus that when given the choice, elders prefer to receive care in their own homes; in fact, the most important consideration for those receiving paid care at home was to remain in their own home (68%), and another roughly one in ten cited independence. But what are the important considerations for those in nursing homes and assisted living? Over two-thirds of nursing home residents (69%) said having the appropriate level of care was most important, followed by another 12% respectively stating availability of care and proximity to family as important in their decision to choose nursing home care over home care or going to an ALF. Those residing in ALFs had a wider variety of issues that were important to them. About two-thirds (36%) said that availability of care was one of the most important things when choosing assisted living over nursing home or home care, while 26% said it was having the appropriate level of care and 23% said safety concerns.
| FIGURE 19: Important Considerations when Choosing Care |
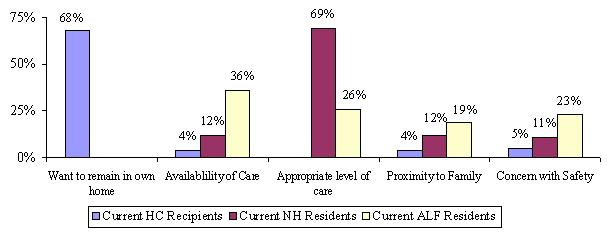 |
In addition to responses obtained from an open ended question about the most important issues considered when choosing the type of care setting, we presented participants in each service setting with a series of true/false statements regarding their choice compared to other options. The questions were tailored to particular service settings. For example, we asked paid home care recipients about nursing homes and ALFs, current nursing home residents about home care and assisted living and so on. Figure 20 shows responses among home care recipients. As expected, almost everyone said that going to a nursing home or ALF was not desirable. Of those who were aware of the quality and cost associated with local nursing homes and ALFs (about 40% of home care recipients), half agreed that the costs were too high and the local facilities did not meet their personal quality standards. The attention paid to cost is interesting in that insurance covers the vast majority of LTC costs. This does suggest that because most policies provide access to a pool of benefits, it is in the interests of policyholders to take into account cost, since in so doing, they can “stretch” their benefits. That is, shopping for lower cost alternatives enables insurance benefits to last longer.7
| FIGURE 20: Current Home Care Recipients Agreement with Statements about Alternative Care Settings |
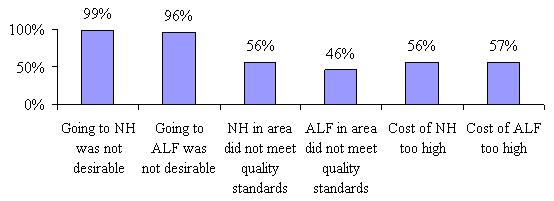 |
Figure 21 shows the responses for nursing home and ALF residents. For clarification, nursing home residents were offered the statement, “It would be most comfortable in nursing home” and assisted living residents were offered the same about assisted living. The chart shows that while 86% of ALF residents indicated that statement was true, only 63% of nursing home residents did. However, almost all of nursing home and ALF residents stated that a nursing home was the safest location for them. Most notable is the fact that almost three-quarter of the nursing home residents indicated that there were no other options in the area, while only 29% of ALF residents said the same. This suggests that there are significant gaps in the service infrastructure, especially for those who are seeking assisted living or home care in lieu of nursing home care. Given the differences between those who chose assisted living and nursing home care, it remains that those who choose a facility feel that they are safest there and that it had become too difficult for them to manage at home.
| FIGURE 21: Current NH and ALF Residents True Responses to Statements about Alternative Care Settings |
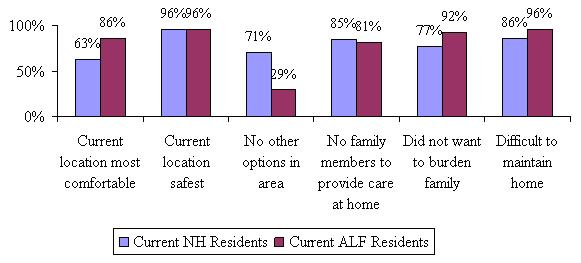 |
Choosing a Specific Care Provider
The third aspect of the decision-making process is focused on choosing a specific provider, agency or facility from which to receive care. There are a number of characteristics that can affect the choice of a specific provider such as cost, quality, availability and the like. In order to understand responses to specific issues, we first asked if paid home care recipients had interviewed multiple caregivers, nursing home residents had visited other nursing homes, ALF residents had visited other ALFs and those not yet receiving paid care had taken any of these steps.
Figure 22 shows that ALF residents were most likely to shop around before choosing their current ALF, followed by nursing home residents. Less than one-third of paid home care recipients interviewed more than one paid caregiver or agency. An even smaller number of people in the community who are not yet receiving paid care have shopped around, consistent with previous findings that they have not yet made arrangements for paid care.
| FIGURE 22: Visited/Interviewed Alternative Providers within Current Care Setting |
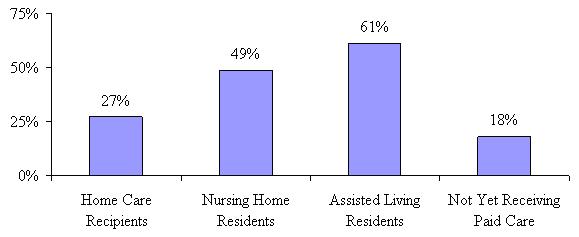 |
In the context of insurance, it may be that cost is not as important a factor as it would be if the participant did not have a LTC insurance policy. We asked if cost was an important consideration when choosing the particular home care provider, nursing home or ALF. For those not yet receiving paid care, we asked if cost was important to their decision to begin using paid care in general. Figure 23 shows that for a majority of assisted living residents cost was an important consideration in their choice of a specific facility. This may reflect the fact that there is more variation from one ALF to another -- some are very high end, providing all the amenities and others are more like nursing homes.
In contrast, only 26% of nursing home residents stated that cost was an important consideration when choosing their current nursing home. Those who have not yet decided on the type of care they are going to receive were the most likely to say cost was an important consideration, perhaps because there is still a great deal of uncertainty as to where they will receive care and they are less likely to have investigated their options. Moreover, they may not yet be certain about what their policy will cover and under what circumstances.
| FIGURE 23: Cost an Important Consideration When Choosing Current Care Provider |
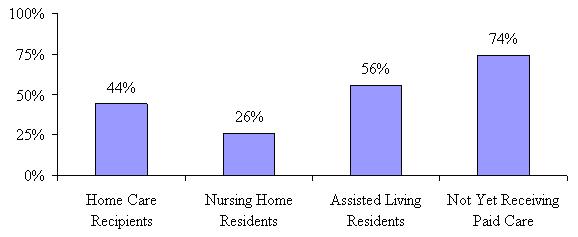 |
In fact, even though only one-quarter of nursing home residents stated that cost was an important consideration, almost twice as many actually compared costs among nursing homes (see Figure 24). Over two-thirds of ALF residents stated that they had actually compared costs among providers in their area, while only about one-third of home care recipients did the same. Consistent with the fact that those not yet receiving paid care are at the beginning of their decision-making process, only 27% have gone ahead and compared costs for different providers.
| FIGURE 24: Compared Costs Among Different Providers When Choosing Current Care Provider |
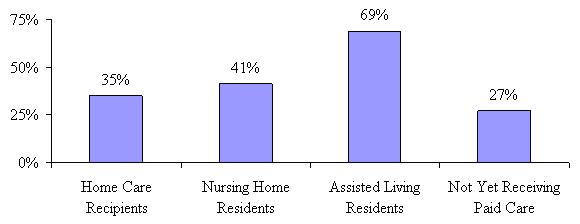 |
One of the more recent developments in the LTC industry is the increased availability of and access to quality information about providers of nursing home and home health care. To date, however, there is a lack of good information about the quality of ALFs; although there are some websites that provide ALF quality information for a fee. CMS has designed a public website devoted to providing quality information about home care providers and nursing homes (see http://www.cms.gov). As part of the decision-making process, we were interested to know if claimants were utilizing this quality information so we asked if they had made an effort to obtain online or published materials regarding the quality of providers in their local area. Figure 25 shows that relatively few -- less than one-quarter -- of paid home care recipients made any effort to obtain quality information, while about half of those residing in ALFs did.
| FIGURE 25: Obtained Quality Information When Choosing Current Care Provider |
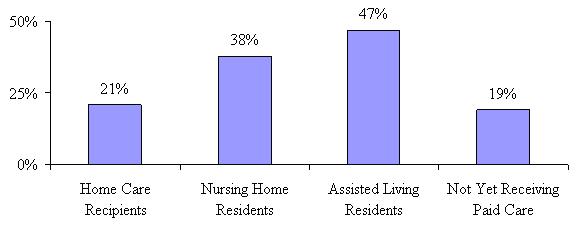 |
After an examination of cost and quality factors and their influence on choosing a particular provider, we asked insured’s what had the most influence on their decision to choose their current service provider. Figure 26 shows that reputation, location and recommendation are the most important considerations regardless of service setting.
| FIGURE 26: Characteristics that had the Most Influence on Choosing Specific Care Provider |
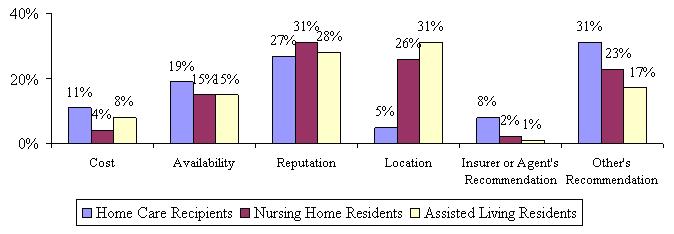 |
However, those using paid care at home seem to value reputation and other person’s recommendations the highest, which could explain why they were less inclined to shop around or obtain additional independent course information on quality. Those residing in facilities, both nursing homes and assisted living, indicate that where the facility was located had a strong influence on their choice of a specific provider.
E. Satisfaction with Service Choices
Having gone through the decision-making process, how satisfied are participants with their choice of home care provider, nursing home or ALF? Have they chosen a care provider that meets their needs? ALF residents were more likely to investigate quality information -- are they more likely to be satisfied with their choice? We first asked if the care that participants were receiving was meeting their needs. Figure 27 shows that there is a very high level of met need across all three service settings. However, those receiving paid care at home are less likely to report that their care is meeting their needs than those in a nursing home or ALF.
| FIGURE 27: Current Care is Meeting Needs |
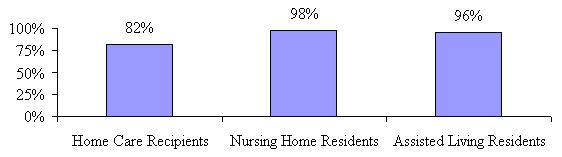 |
As stated previously, one of the most important reasons cited by those in facilities regarding their choice of care location was that they wanted to be guaranteed that if they needed a certain level of care, it would be available to them. Perhaps those receiving paid care at home are so determined to remain in their own homes, that they are willing to make a trade-off -- or perhaps satisfaction has less to do with care needs than other issues. A more detailed examination of specific satisfaction issues may shed some light on this. However, we first focus on the relationship between met needs and disability status.
| FIGURE 28: Current Care Needs Are Being Met by Disability Status |
 |
The pattern observed above persists even when looking at satisfaction levels by disability status and cognitive impairment. The majority of claimants report that their current care needs are being met, regardless of disability level; however those living at home and receiving paid care are the least likely to say that the care they are receiving is meeting their needs. Of those home care recipients who say that their care needs are not being met, almost all of them indicated that they need additional help, either with ADLs, IADLs, respite care or overnight care.
We next asked participants in each service setting a general satisfaction question related to their choice of a particular nursing home, ALF or home care provider. This was followed by a series of more detailed questions. Figure 29 shows that for the most part, people in all service settings are at least somewhat satisfied with their decision to use their current provider. However, when looking at the distinction between very satisfied and somewhat satisfied, there is a noticeable difference. Those receiving paid care at home and in ALFs are more likely to state they are very satisfied with their decision than are those residing in nursing homes. This is interesting, particularly in light of the fact that home care recipients are more likely to report unmet need.
| FIGURE 29: Overall Satisfaction with Specific Provider |
 |
To further understand satisfaction, we asked a series of questions related to specific issues people may encounter when receiving paid care. It is common to hear concerns among those receiving care at home that they feel uncomfortable with a “stranger” in their house or that they do not have enough privacy with someone around all the time. Given the current shortage of health professionals, are caregivers spending enough time with people? Questions were structured such that respondents could indicate whether an issue occurred always, sometimes or never. Figure 30 shows the proportion of those indicating an “always” response.
| FIGURE 30: Satisfaction Measures by Care Setting |
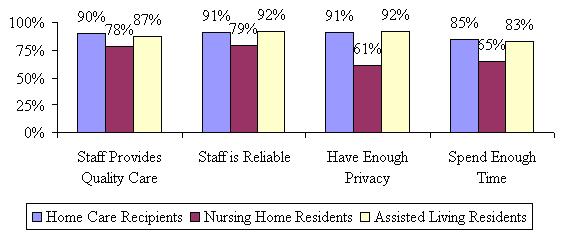 |
Again, overall there is a high level of agreement with these aspects of satisfaction across all service settings; however those in nursing homes are less likely to indicate that they have enough privacy, the staff spends enough time with them, the nursing home staff is reliable and that they provide quality care all the time. Home care recipients were the most satisfied with their caregivers across almost all measures, which would seem to indicate that satisfaction with a caregiver has little or no relationship to whether or not you feel your care needs are being met.
We completed further analyses of reports of unmet need to see if service setting actually made a difference in terms of indicating whether or not care needs are being met. We held all other variables constant (using regression analysis) so that we could find out what was having an independent effect on reported unmet need. The analysis showed that in fact, being a home care recipient is associated with unmet need, as well as reporting that the caregiver(s) do not spend enough time with the claimant, and not feeling safe with the caregiver all the time. This means that, holding all other variables that could potentially have an effect on unmet need constant, claimants were more likely to report that their care needs were not being met if they were receiving paid care at home.
It is noteworthy that across all service settings, nearly one in five respondents felt that the staff did not spend enough time with them. Given that the nature of the service provided is personal care, this finding raises concerns. A question that arises is whether individuals with more needs are more likely to feel this way compared to those with less needs. As well, we are interested to know whether there are certain characteristics associated with citing one of these quality measures as lacking. Table 5 highlights the relationship between selected socio-demographic characteristics and aspects of provider quality.
It does appear that those the more ADL limitations one has, the less likely they are to indicate that the staff/caregiver spends an adequate amount of time with them. The same holds true for the other measures -- as disability increases, a person is less likely to indicate that the staff provides high quality care or that they are reliable. Measures do go back up for those with cognitive impairment that have proxies responding on their behalf. In terms of age, older service users are the more likely to indicate that staff provide quality care and that they are reliable; but less likely to report that they always spend enough time. Married individuals and those without children are more likely to indicate that staff spend enough time with them.
Among paid home care recipients we were interested in determining whether or not their caregiver was from an agency or individually hired. We found that about a third (32%) of paid home care recipients’ caregivers were not from an agency. We also asked those who hired caregivers from an agency whether or not the agency sends the same caregiver consistently. In 77% of the cases, recipients reported the agency always sends the same caregiver and in another 21%, the agency sends the same caregiver sometimes. Only 2% of paid home care recipients who hired a caregiver from an agency reported that the agency never sends the same caregiver. From a continuity of care perspective, this finding is positive.
| TABLE 5: The Relationship between Service Quality Measures, Socio-Demographics and Disability Status | |||
|---|---|---|---|
| The Staff Provides Quality Care | The Staff is Reliable | The Staff Spends Enough Time With Me | |
| Disability Status | |||
| Less than 2 ADLs | 91% | 93% | 84% |
| 2-4 ADLs | 89% | 89% | 82% |
| 5+ ADLs | 81% | 87% | 78% |
| Dementia | 89% | 92% | 80% |
| Age | |||
| Less than 65 | 71% | 84% | 85% |
| 65-74 | 85% | 87% | 82% |
| 75-79 | 89% | 89% | 81% |
| 80-84 | 85% | 88% | 81% |
| 85+ | 92% | 93% | 80% |
| Marital Status | |||
| Married | 89% | 91% | 85% |
| Unmarried | 86% | 88% | 79% |
| Gender | |||
| Female | 86% | 89% | 80% |
| Male | 89% | 90% | 83% |
| Parental Status | |||
| Have children | 87% | 89% | 80% |
| No children | 87% | 88% | 88% |
Home care recipients were less likely to indicate their care needs were being met, but more likely to indicate they were satisfied with their current caregivers and with other aspects of their care experience. Conversely, nursing home residents are most likely to indicate that their care needs are being met and least likely to indicate that they were very satisfied overall and with specific measures of care quality. These results taken together seem to indicate that whether or not a person feels their needs are being met by their current provider may have little to do with how satisfied they are with that provider and perhaps more to do with whether or not they are satisfied with their overall choice of where to receive care.
F. Use of Care Management
One of the goals of this study is to understand how people think of and use care managers and what influence that seems to have on their decisions, satisfaction and transitions, particularly over time. When we began designing the questionnaire for this study, we interviewed key senior management personnel from each of the participating insurance companies to better understand how they define care management, who provides it and who receives it.8 We had a series of standard questions that we asked each company to determine their care management philosophy and program. The questions included:
-
Do you provide care management?
-
What is your definition of care management/what does it consist of?
-
What is the goal or corporate philosophy of care management?
-
To whom do you provide care management?
-
Do you provide incentives for the use of care management?
-
Do you have your own care managers or do you use a third party vendor?
-
Do you provide training your care managers or to the care managers you use?
-
Do your care managers or the care managers you use need to meet specific requirements before they become care managers?
-
Do you provide in person or telephonic care management?
-
Are the care managers familiar with the benefits available to the clients under their LTC insurance policies?
One of the most important things that we learned from this exercise is that each company defines care management a little differently. According to the responses we received, there was a great deal of variation surrounding the definition of care management services. According to the insurers participating in this study, care management might range anywhere from claim adjudication and assessment, to the full gamut of services including assessment of needs, care plan development and implementation, coordination of services, and reassessment.
The information we received helped to inform the development of questions related to the use of a care manager and the services they provide. Based upon what we learned from our discussions with the insurance companies, we defined a “care manager” broadly so we could be assured of capturing the different models in operation at the time of the study. We instructed the nurse assessors to read the following:
Sometimes when people need to find paid care and make arrangements for care, they work with a person called a care manager or care coordinator. This person is generally a nurse or health professional and is either someone you can hire privately or someone your LTC insurance company provides to you. He or she may visit with you in your home or talk to you over the telephone. This person is different from a doctor or a hospital discharge planner.
It appears that only a small percentage of participants (regardless of service setting) used a care manager. Figure 31 shows that the use of a care manager is higher among people in the community than in facilities, which is what would be expected; however, it is still only 19% for paid home care recipients. All the information that follows regarding specific services and satisfaction are based only on those who used a care manager.
| FIGURE 31: Use of Care Manager by Service Setting |
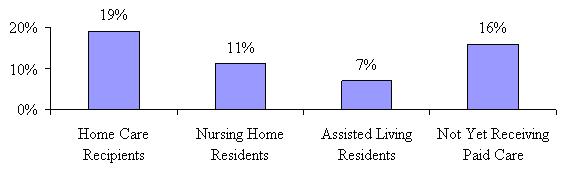 |
Even though most insurance companies provided some aspect of care management services to their insured’s (mostly upon the request of the insured), we were interested in knowing if those who were using a care manager hired them privately or used the insurance company’s care manager (see Figure 32). Surprisingly, a high proportion of those who have a care manager hired them privately, particularly those using paid care in ALFs (although these results should be viewed with caution given the small sample size for both nursing home and ALF residents).
Most of the nursing home residents that have a care manager used one provided by the insurance company, while paid home care recipients were approximately evenly divided between privately hired and insurance company provided care managers. Almost all of those not yet receiving paid care obtained their care manager from the insurance company. This is not surprising given that most of them have not made arrangements for care and are less sure of their future plans.
| FIGURE 32: For those Receiving Care Management, who Provided the Service |
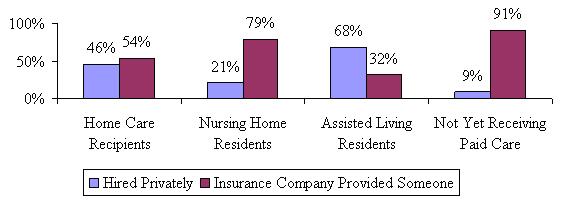 |
We also wanted to know what types of services the care managers provided and if they differed by service setting. As shown in Figure 33, care managers for those residing in nursing homes were more likely to help with the development of a care plan and where to get care, and are less likely to have helped the insured find local providers. Coupled with the fact that such a small number of nursing home residents used a care manager, it is likely that they had less choice about where to receive care and less choice of local providers.
| FIGURE 33: Duties Performed by Care Manager by Care Setting |
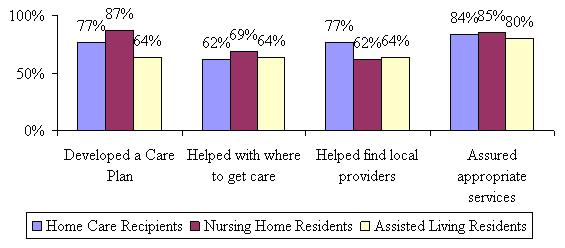 |
We also asked if the care manager’s service recommendations were followed and in almost all cases they were. All of the home care recipients and ALF residents indicated that they followed the care manager’s recommendations, while 94% of nursing home residents stated the same. For those in residential care settings, we wanted to know if the care manager specifically recommended care in their current service setting. Approximately 60% of nursing home residents stated that their care manager made a recommendation for care in a nursing home and 92% of ALF residents said the same. Satisfaction with the services provided by the care manager was very high (95% or higher) across all service settings. All of those who used a care manager felt they were helpful, that they listened to concerns that were raised, they were responsive to the claimant’s needs and they spent enough time helping the claimant and/or their family.
Although there were some variations across service setting for use and satisfaction of care management, for the most part those who used care managers were satisfied with their services.
G. Effect of Having a Long-Term Care Policy on Paid Care Use and Choice
We were interested in knowing what perceived effect having a long-term care policy had on a person’s choice of service setting. Conversely, we wanted to know what people think they would do in the absence of having their insurance policy. All questions were asked in reference to a person’s specific provider. Figure 34 details the results.
| FIGURE 34: Effect of Having an LTC Policy by Care Setting |
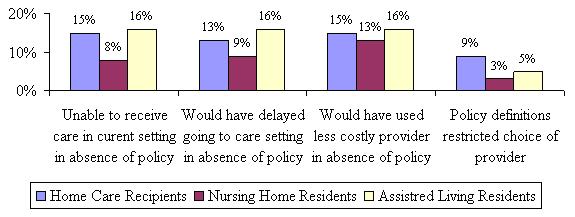 |
First, we asked if the claimant would still receive care in their current setting (i.e., would you still receive care in an ALF) if they did not have their LTC insurance policy. The majority in all three settings seemed to indicate that they would. Only 15% of home care recipients seemed to think that they would not be able to receive care at home if they did not have their policy and almost the same for ALF residents. Even fewer nursing home residents thought that they would not be able to receive nursing home care if they did not have their policy. This may be due to the fact that nursing home care is covered by public payer sources (Medicaid and perhaps some level of Medicare).
We also asked if participants would have waited longer before going to their current setting (i.e., before going to a nursing home) if they did not have their LTC insurance policy. Again, nursing home residents were least likely to indicate that they would have waited, although only a small number in all service settings thought they would have. Given the functional and cognitive profile of these policyholders, it is unlikely that they could have waited much longer.
Next, we asked if the participant would have chosen a less costly provider (i.e., a less costly nursing home for those currently in a nursing home) if they did not have a LTC insurance policy. There was really no variation by care setting and only a small proportion indicated that they would have chosen a less costly provider. The income profile of this sample supports this.
Finally, we asked if the definition of what is covered by the LTC insurance policy restricted a person’s choice of provider type. Keeping in mind that everyone in the sample has coverage for all three services settings, this question was designed to capture those who might be seeking alternative or unlicensed caregivers. For instance, some policies require a person to hire a licensed and/or certified caregiver to provide home care. It may be the case that a person may be receiving help from a close friend, neighbor or son/daughter of a friend and they want to continue to use them. The results in Figure 34 show that while only a small proportion of each sample answered in the affirmative, a statistically larger percentage of paid home care recipients did so relative to those in nursing homes and ALFs. This could be due to the reason mentioned above. Still, over 90% of respondents did not feel that the insurance restricted their use of specific service providers.
Overall these results would indicate that this group of people would have made nearly the same choices in the absence of their LTC insurance policy. It is possible that recognition of the relative effect of having a LTC insurance policy may not occur until further in to a person’s care episode. At the outset there are so many other factors that an insured is dealing with like where to get care, who to get it from and when it is going to start that they do not fully appreciate the difference having a policy has on receiving paid care. Questions about the effect of having LTC insurance are included on the subsequent telephone wave interviews; therefore, we will be able to see if these responses change over time.
V. SUMMARY AND CONCLUSION
In this report, we explored a snapshot of LTC insurance policyholders at the time that they were making a decision where to use paid care. Not surprisingly, half of paid service users chose to use their policies to pay for care at home, but about one-third is using ALFs. Even in the face of coverage for all three services modalities, 19% are still choosing to go in to a nursing home for their care.
The highest percentage of those under age 75 is living at home, while those choosing assisted living are the oldest, although not the most disabled. ALF residents are more likely to be single (not married) and female, suggesting that these individuals may be doing so to meet both social and safety needs; and may be moving at a time when they are still able to so that they can “age in place” if they begin to require more assistance or become more disabled.
A goal of this study was to interview people as close to the beginning of their use of paid care as possible. The majority had begun paid care use within the last three months, with paid home care recipients receiving their care for the shortest amount of time. This length of time is ideal as it is close enough to the decision-making process to allow accurate recall, yet long enough for individual’s to have developed opinions about their choices and caregivers.
We also asked about current unpaid care use. We were particularly interested to see if those residing in nursing homes were still receiving unpaid help with their daily activities, even though they were in a nursing home. It turns out that 35% of them report that they are currently receiving unpaid help from family and/or friends while living in a nursing home. It is common to assume that those in nursing homes receive all the care they need from the staff there; however, it appears that a significant proportion of them are getting help with their daily activities from family. This could suggest a shortage of staffing in the nursing homes, or it could just be that while family is there visiting they lend a hand and assist their loved ones.
There are a number of decisions that must be made when an individual becomes disabled. When do I decide I can no longer manage on my own and need to pay someone to assist me? Where do I want to live while I am getting paid care? How do I choose a specific provider for my care? We examined all three of these areas in this baseline report and found that needing more help and having assistance when it is needed are important motivators for people regardless of service setting choice, disability status and demographics when making these decisions.
The majority of people living at home and in assisted living decided to begin using paid care because they need more help and could no longer manage on their own. Those who are living in nursing homes were much more varied in their reasons; with the majority saying it was either that they needed more help or had an acute incident. Interestingly, those in assisted living were much more likely to say that safety concerns was a common motivator for paid care use than those in all other service settings. This is likely due to their advanced age and the fact that less are married.
Across all service settings and regardless of demographics (i.e., marital status, gender, age) and disability status, having someone available to assist when needed was ranked as the most important consideration when deciding where to receive care, with more nursing home residents saying this than those in other settings. This was followed by the desire to feel safe in a particular choice of setting.
Not surprisingly, the majority of home care residents (93%) said that staying at home was there first choice, while smaller proportions of nursing home residents (65%) and ALF residents (75%) said that their current location was their first choice. While the majority of those not living at home said they considered it, they did not actively pursue staying at home as is evidenced by the fact that few actually visited alternative care settings or put themselves on a waiting list for a different type of care.
It turns out that ALF residents are the ones who seem to have done the most “research” when choosing the specific facility. They were most likely to have visited other ALFs, compare costs among ALFs and obtain quality information. While cost did not have a great influence on an individual’s choice of specific provider, reputation, location and recommendation were all ranked high among those receiving paid care.
We also gathered information about how satisfied individuals were with their choice of provider. While there were high levels of satisfaction across all service settings across multiple characteristics, it was striking that a higher percentage of home care recipients compared to residents in nursing homes or ALFs reported that their needs were not being met or that they needed more help than they were currently getting. It would seem that whether or not a person is satisfied with their specific provider may have little to do with their belief that their needs are being met.
Only a small proportion reported using care management services at the outset of paid care use and most of those surveyed said that they would be receiving the same amount of care in the same place if they did not have their LTC insurance policy. It will be important to see if these measures change over time. It could be that the potential value of having a LTC insurance policy (or using a care manager) is not realized until a person is receiving services for a longer period of time.
While this report focuses solely on the results of the baseline interview of claimants at the beginning of their paid service use, it provides a detailed and insightful look at the decision-making process and choices made by disabled elders and their families. Understanding how these choices, satisfaction levels, use of services and transitions change over time will be explored further at the conclusion of the telephone follow-up interviews.
References
Cohen, M., Weinrobe, M. Miller, J. and Ingoldsby, A. (2005). “Becoming Disabled After Age 65: The Expected Lifetime Costs of Independent Living.” AARP Public Policy Institute Report #2005-08. June.
Cohen, M, Miller, J, and Weinrobe, M. (1999). “A Descriptive Analysis of Patterns of Informal and Formal Caregiving among Privately Insured and Non-Privately Insured Disabled Elders Living in the Community.” Report to the Office of the Assistant Secretary for Planning and Evaluation. Washington, DC: U.S. Department of Health and Human Services. April. [http://aspe.hhs.gov/daltcp/reports/ifpattrn.htm]
Cohen, M, Weinrobe, M, and Miller, J. (1999). “Multivariate Analysis of Patterns of Informal and Formal Caregiving among Privately Insured and Non-Privately Insured Disabled Elders Living in the Community.” Report to the Office of the Assistant Secretary for Planning and Evaluation. Washington, DC: U.S. Department of Health and Human Services. October. [http://aspe.hhs.gov/daltcp/reports/multanal.htm]
Cohen, M, Weinrobe, M, and Miller, J. (2000). “Informal Caregivers of Disabled Elders with Long-Term Care Insurance.” Report to the Office of the Assistant Secretary for Planning and Evaluation. Washington, DC: U.S. Department of Health and Human Services. January. [http://aspe.hhs.gov/daltcp/reports/icdeltci.htm]
Cohen, M, and Miller, J. (2000) “The Use of Nursing Home and Assisted Living Facilities Among Privately Insured and Non-Privately Insured Disabled Elders.” Report to the Office of the Assistant Secretary for Planning and Evaluation. Washington, DC: U.S. Department of Health and Human Services. April. [http://aspe.hhs.gov/daltcp/reports/nhalfuse.htm]
Hanley, RJ, Wiener, JM, and Harris, KM (1991). “Will paid home care erode informal support?” Journal of Health Politics, Policy and Law. 16(3):507-21.
Health Insurance Association of America (HIAA) (2000). “Who Buys Long-Term Care Insurance in 2000? A Decade of Study of Buyer and Nonbuyers.” October.
The Lewin Group (2002). “Projections from the 1996 Survey of Income and Program Participation, Wave 5.” Prepared for the Commission on Affordable Housing and Health Facility Needs for Seniors in the 21st Century.
LifePlans, Inc. (2005). Survey of Top Writers.
MetLife Mature Market Institute (2005). The MetLife Market Survey of Nursing Home and Home Care Costs. September.
Office of the Assistant Secretary for Planning and Evaluation (ASPE) and Administration on Aging (AoA) (1998). “Informal Caregiving: Compassion in Action.” Washington DC: U.S. Department of Health and Human Services. [http://aspe.hhs.gov/daltcp/reports/Carebro2.pdf]
Spillman, BC, Liu, K, and McGilliard, C (2002). “Trends in Residential Long-Term Care: Use of Nursing Homes and Assisted Living and Characteristics of Facilities and Residents.” Report to the Office of the Assistant Secretary for Planning and Evaluation. Washington, DC: U.S. Department of Health and Human Services. November. [http://aspe.hhs.gov/daltcp/reports/rltct.htm]
Notes
-
We know that there is a great deal of movement across service modalities. In a recent study of disabled elders receiving benefits under private insurance policies, 38% of individuals observed in nursing homes had used home care prior to their nursing home entry. Moreover, 23% of assisted living residents had been in a nursing home prior to their moving to an assisted living residence (Cohen, et al. 1999 & 2000).
-
Nurses were trained to always observe the claimant (unless the family or proxy expressly forbade it) in order to understand functional and cognitive status. However, for questions related to decision-making and insurance, many claimants either requested a family member be present with them or that the nurse talk to a family member. We also allowed claimants to have us contact familiy members via telephone regarding the decision making questions. Only a small percentage of claimants exercised this option.
-
It is important to note that the in-force measure is a “stock” whereas the newly admitted measure could represent the beginning of a “flow”. That is, it may be the case that many of the individuals who enter the system as assisted living residents go on to enter nursing homes at later periods of their disability spell.
-
It is often the case that facility policy requires medication be given to all residents, regardless of their level of dependence with medication management. Those who indicated that this was the case were removed from the sample (33% of people in nursing homes and 24% of people in ALF). Therefore, medication management is truly those who require assistance with it.
-
If it was determined that a person was cognitively impaired (by failing the SPMSQ or a diagnosis of Dementia or Alzheimer’s) the interviewer terminated the interview with the insured and continued with their designated proxy.
-
These could include devices like canes, walkers, wheelchairs, raised toilet seats, grab bars, etc. Although a number of people reported using furniture to assist with mobility and transferring, we did not classify this as equipment.
-
This is true for all policies that have durational limitations. This incentive does not exist when a policy provides lifetime protection, that is, unlimited policy benefits.
-
We were only able to conduct interviews with seven of the ten participating companies. There were companies added at later stages of the fieldwork who were not able to be interviewed and conversely, there were companies interviewed who did not end up providing sample for the study. The discussion of care management that appears here is reflective only of the seven participating companies who were available for interview. It is also important to note that what may have been the care management and/or philosophy of a particular company at the time of interview (2002) may not be the current philosophy or structure of care management for those companies today.