
U.S. Department of Health and Human Services
National Estimates of Prescription Drug Utilization and Expenditures in Long-Term Care Facilities
Linda Simoni-Wastila, PhD, Thomas Shaffer, MHS and Bruce Stuart, PhD
University of Maryland, Baltimore, Peter Lamy Center on Drug Therapy and Aging
October 25, 2006
PDF Version (23 PDF pages)
This report was prepared under contract #HHS-100-03-0025 between the U.S. Department of Health and Human Services (HHS), Office of Disability, Aging and Long-Term Care Policy (DALTCP) and the University of Maryland. For additional information about this subject, you can visit the DALTCP home page at http://aspe.hhs.gov/_/office_specific/daltcp.cfm or contact the office at HHS/ASPE/DALTCP, Room 424E, H.H. Humphrey Building, 200 Independence Avenue, S.W., Washington, D.C. 20201. The e-mail address is: webmaster.DALTCP@HHS.GOV. The Project Officer was Linda Bergofsky.
The opinions expressed herein are solely those of the authors and do not reflect the position or policy of any office of the Assistant Secretary for Planning and Evaluation at the U.S. Department of Health and Human Services or any other government authority.
TABLE OF CONTENTS
- I. INTRODUCTION
- Methods
- Drug Use Measures
- Medicare Eligibility and Payor Source
- Findings
- II. PRESCRIPTION DRUG UTILIZATION AND EXPENDITURES AMONG MEDICARE BENEFICIARIES RESIDING IN LTCFS, 2001
- Description of the 2001 LTCF Population
- Prescription Drug Utilization and Expenditures, 2001
- III. TRENDS IN ACTUAL AND PROJECTED PRESCRIPTION DRUG SPENDING, 1998-2005
- Discussion
- Conclusions
- LIST OF FIGURES
- FIGURE 1: Total LTCF Prescription Drug Spending by Top 10 Therapeutic Categories, 2001
- FIGURE 2: Trends in LTCF Population, 1998-2001
- FIGURE 3: Trends in Proportion of LTCF Medicare Beneficiaries Eligible by SSDI Eligibility, 1998-2001
- FIGURE 4: Mean Annual Growth in Prescription Drug Expenditures in LTCFs, by Facility Type
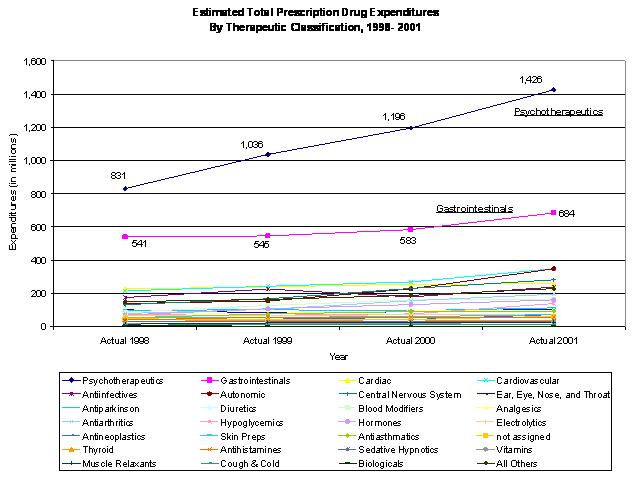
- FIGURE 5: Prescription Drug Expenditures by Therapeutic Class, 1998-2001
- FIGURE 6: Actual and Projected Prescription Drug Spending, 1998-2005
- LIST OF TABLES
- TABLE 1: Stability of Individual Residence by Facility Type, 1998-2001
- TABLE 2: Characteristics of Institutionalized Medicare Beneficiaries by Facility Type, 2001
- TABLE 3: Prescription Drug Utilization and Expenditures, Overall and by Facility Type, 2001
- TABLE 4: Top 10 Most Frequently Utilized Prescription Drug Categories, 2001
- TABLE 5: Prescription Drug Spending by Eligibility Status, 2001
- TABLE 6: Total and Per User Prescription Drug Spending by Coverage Source, 2001
- TABLE 7: Per User Expenditures and Total Expenditures Ranking by Top 5 Therapeutic Categories and by Coverage Source, 2001
- TABLE 8: Actual and Projected Prescription Drug Expenditures, 1998-2005
I. INTRODUCTION
Although several studies have provided national estimates of prescription drug use by Medicare beneficiaries residing in nursing homes (NHs) and other long-term care facilities (LTCFs),1 there are no published estimates of expenditures for prescription medications administered in LTCFs in the United States. This Policy Brief offers an updated look at prescription drug utilization by Medicare beneficiaries residing in LTCFs and reports, for the first time, national estimates of prescription drug spending by this population. For this paper, LTCFs exclude Medicare-qualified skilled nursing facility (SNF) stays unless they lead to a longer stay, as well as exclude facilities that do not provide continuous nursing care and have centralized medication management. Although findings from this analysis are important to many individuals, this particular brief is targeted to policy-makers and payors who want to better understand the magnitude of prescription medication spending and the drivers of such spending in LTCF.
We focus on two factors thought to influence drug utilization and expenditures -- Medicare eligibility status and coverage source. We expect to see differences in prescription drug use and spending patterns between individuals who are Medicare-eligible on the basis of Social Security Disability Insurance (SSDI) versus those who are eligible on the basis of age (over 65). Such differences are likely due to the heterogeneity of the two populations in terms of disease burden, severity-of-illness, and the types of prescription medications required to treat their medical conditions. Medicare beneficiaries with different insurance coverage also may exhibit different prescription drug utilization and spending patterns, with individuals possessing insurance with drug coverage (i.e., Medicaid or private) likely to use more and different prescription medications than those with no or typically less generous coverage (i.e., Medicare-only covered coverage).
Findings presented here are part of a larger Office of the Assistant Secretary for Planning and Evaluation-funded study whose primary purpose is to provide updated, detailed spending data on prescription medication use in LTCFs. These data will support further analyses of relationships and associations detected by these preliminary and descriptive findings presented in this and subsequent briefs. The first study aim of this project -- and the focus of this brief -- is to produce national estimates of prescription utilization and spending in LTCFs for the period 1998-2001.
We provide a detailed snapshot of prescription drug use and spending in 2001, the latest year for which complete data are available. For this analysis, we present summary findings of:
- Characteristics of Medicare beneficiaries residing in LTCFs, overall and by facility type.
- Total and percent of utilization of prescription drugs by Medicare beneficiaries residing in LTCFs, overall and by facility type.
- Total and per user expenditures of prescription drugs by Medicare beneficiaries, overall and by facility type.
- Comparison of prescription drug spending by Medicare beneficiaries by eligibility status (SSDI-eligible less than 65 and aged 65 and older).
- Comparison of prescription drug use and spending by Medicare beneficiaries by four payor sources -- Medicaid, private prescription with drug coverage, no drug coverage supplementation, and all other coverage with drug coverage status unknown.
A second analysis focuses on total LTCF prescription drug utilization and spending trends from 1998-2001, overall, and by therapeutic category. Using linear and non-linear projection approaches, we project spending through 2005.
Methods
Data. Data used for this analysis include the 1998-2001 Medicare Current Beneficiary Survey (MCBS) Cost and Use data. The MCBS is the only longitudinal data publicly available to examine prescription drug utilization at the individual drug level in the Medicare long-term care population. We extracted information on socio-demographics, facility type, and payor source from the public-use Cost and Use files. We obtained detailed information on prescription drug administration from the Institutional Drug Administration (IDA) file. Prescription drug information was obtained from data extracted from the Medication Administration Records on prescription drug use in LTCFs and collected by MCBS surveyors. This file, known as the IDA, is collected at the time of the general MCBS survey and then prepared as an analytic file by the University of Maryland under contract to the Centers for Medicare and Medicaid Services (CMS). This file is not part of the general MCBS survey at this time. More information on the MCBS is available online at: http://www.cms.hhs.gov/MCBS/.
A key feature of this particular study was the assignment of a price to each prescription drug record. The pricing of drug data is normally based upon the presence of a National Drug Code that uniquely identifies important characteristics of the drug (e.g., strength, form, and manufacturer) allowing it to be individually priced. The MCBS survey, however, does not collect this unique identifier for its respondents; rather, drug name, dosage form, strength, and several other drug attributes are collected. Pricing of drugs for surveyed persons in long-term care settings was done by using the same algorithm used by CMS to price drugs for people in the community. This analysis represents the first time the CMS drug pricing algorithm has been applied to long-term care drug administration data.2 The algorithm takes into account such factors as dosage form and strength (among other things) to produce a base price. Once a base price is produced, it is further adjusted to reflect the influence of payor source to account for various real-world market factors such as discounts and dispensing fees.
Drug Use Measures
The measures of prescription drug utilization include: total annual users; annual administrations; mean annual administrations per user; and mean monthly administrations per user. The measures of expenditures include: total annual expenditures; annual mean expenditures per beneficiary; and mean monthly expenditures per user. Prescription drug use and spending are examined in aggregate, as well as by therapeutic category. All use and spending measures are weighted to provide national estimates. All expenditures are presented in current dollars of the year analyzed. It is important to note estimates reported here only include prescription drugs used in LTCFs. The pricing algorithm specifically excludes the pricing of over the counter (OTC) drugs; thus, they have been excluded from these analyses. Although OTC medications represent a significant component of medication utilization, accounting for almost a third of all administrations, they are comparatively inexpensive due to their OTC status.3
Medicare Eligibility and Payor Source
We consider prescription drug utilization and expenditures in the context of two primary variables: Medicare eligibility and source of payor source. For this analysis, we considered all individuals who qualify as SSDI-eligible (i.e., less than 65 years of age) to be Medicare-eligible on the basis of disability and all individuals aged 65 and older to be Medicare-eligible on the basis of age.
Payor source reflects the health insurance source for the individual during the year as determined by the MCBS which tracks coverage on a month-by-month basis. Supplemental payor source is assigned based on a four-part hierarchy of coverage scenarios of traditional Medicaid (i.e., Medicaid programs which provide drug coverage as opposed to waiver programs without drug coverage), private coverage with prescription drug coverage, all other payor source with unknown Rx coverage, and no supplemental coverage (i.e., Medicare-only). For this analysis, any evidence of Medicaid coverage was given precedence over all other forms of coverage, followed by private insurance with evidence of prescription drug coverage, and then all other forms of supplemental coverage with no identifiable source of insurance. Individuals with no source of supplemental coverage lack any evidence of other supplemental coverage and thus are assumed to have Medicare as their sole source of health coverage. It is important to note that this paper uses data that precedes the implementation of the Part D provisions of the Medicare Prescription Drug, Improvement, and Modernization Act of 2005 (MMA).
Residential setting. LTCFs were stratified by the internal designation of the facility according to the MCBS. The facility types used were Nursing Home, Assisted Living and All Other facilities. Non-qualifying stays in SNFs after a qualifying three-day post-acute hospitalization are not considered as a long-term NH stay; instead, they are categorized in the All Other facilities. Assisted Living Facilities (ALFs) includes those facilities designated as assisted living by the survey and do not include other types of congregate care settings. Thus, NH and ALF represent single homogenous facility type designations. All Other Facilities (OFs) include rehabilitation, psychiatric, group homes, congregate care, bed and board, Mental Retardation and Developmental Disability (MRDD) residences, short-term SNF stays post-hospitalization, and others.
The MCBS offers the ability to establish residence in a specific facility type during a period of time. Because individuals can reside in more than one facility during the year, this presented a methodological challenge in allocating prescription medication utilization and expenditures to facility type. For this brief, prescription medications were assigned to the setting the respondent was determined to be in for the month of prescription. For months where the respondent moved between several long-term settings a systematic approach was used to resolve the most likely setting to assign.
In general, there is considerable stability across facility types (since residents tend to stay where they are) and across the study years. Residents in NH show the highest degree of stability (ranging from 88-91% of residents who remain in just that setting), followed by ALF (range 76-86%), with residents of OF settings showing the highest degree of mobility across settings (Table 1).
| TABLE 1. Stability of Individual Residence by Facility Type, 1998-2001 | ||||
| 1998 | 1999 | 2000 | 2001 | |
| % NH residents solely in a NH setting (N=1,832,837) | 90.9% | 88.4% | 87.4% | 87.7% |
| % ALF residents solely in an ALF setting (N=287,566) | 85.9% | 82.0% | 72.5% | 76.6% |
| % Other residents solely in OF settings (N=839,532) | 76.2% | 72.6% | 67.6% | 71.6% |
| % of residents across all settings who remain in just 1 setting | 93.1% | 91.1% | 89.3% | 90.5% |
| SOURCE: MCBS, 1998-2001. | ||||
Findings
The following results are grouped into two sections: Section II examines prescription drug utilization and expenditures in 2001, the latest year for which expenditures data are available for the LTCF population. Section III examines trends in prescription drug spending and characterizes changes in the LTCF population from 1998-2001. Based on spending from 1998-2001, we present projected prescription drug spending through 2005. These estimates are current dollars and are not constant dollars adjusted for growth in spending.
II. PRESCRIPTION DRUG UTILIZATION AND EXPENDITURES AMONG MEDICARE BENEFICIARIES RESIDING IN LTCFS, 2001
Description of the 2001 LTCF Population
In 2001, nearly 2.7 million Medicare beneficiaries resided for at least part of the year in one or more LTCFs. Of these, 68.3%, or 1.8 million Medicare beneficiaries, spent at least one month in a NH (Table 2), 287,000 spent at least one month in an ALF, and 839,000 spent at least one month in some other institutional facility. As noted above, there is considerable stability in the LTCF population in 2001 -- 90.5% of all beneficiaries spent the entire year in just one facility type, while the remaining 9.5% transitioned between facility types (Table 1). Thus, in 2001, of the entire LTCF population, 59.9% resided only in a NH, 8.2% only resided in an ALF, and 22.4% only resided in another facility type (data not shown).
| TABLE 2. Characteristics of Institutionalized Medicare Beneficiaries by Facility Type, 2001 | |||||
| Total Facility(N=2,684,426) | Nursing Home(N=1,832,837) | Assisted Living Facility(N=287,566) | Other Facilities(N=839,532) | ||
| Frequency | As % | As % | As % | As % | |
| Under 65 | 435,596 | 16.2 | 9.4 | 5.4++ | 32.4 |
| 65 - 74 years | 306,347 | 11.4 | 12.1 | 15.0 | 9.8 |
| 74 - 85 years | 809,008 | 30.1 | 34.0 | 24.7 | 23.3 |
| 85+ years | 1,133,475 | 42.2 | 44.5 | 54.9 | 34.5 |
| Male | 908,736 | 33.9 | 31.5 | 24.0 | 41.2 |
| Female | 1,775,691 | 66.1 | 68.5 | 76.0 | 58.8 |
| White | 2,373,192 | 88.4 | 86.1 | 96.8 | 91.1 |
| Non-White | 311,235 | 11.6 | 13.9 | 3.2++ | 8.9 |
| Married | 524,805 | 19.5 | 20.7 | 22.7 | 14.3 |
| Widowed | 1,357,800 | 50.6 | 54.7 | 59.9 | 40.1 |
| Single | 801,821 | 29.9 | 24.6 | 17.4 | 45.6 |
| 1,494,703 | 55.7 | 55.9 | 45.3 | 57.4 | |
| High School | 609,704 | 22.7 | 23.7 | 23.1 | 18.8 |
| Some College | 580,020 | 21.6 | 20.4 | 31.6 | 23.8 |
| East | 594,076 | 22.1 | 21.0 | 12.5++ | 27.7 |
| Midwest | 737,073 | 27.5 | 28.9 | 28.4 | 23.6 |
| South | 880,043 | 32.8 | 35.6 | 31.7 | 24.7 |
| West | 473,234 | 17.6 | 14.6 | 27.4 | 24.0 |
| Metro | 2,045,585 | 76.2 | 74.6 | 87.2 | 79.1 |
| Non-Metro | 638,841 | 23.8 | 25.4 | 12.8 | 20.9 |
| Meets FPL for 2001 | 901,295 | 33.6 | 35.3 | 14.9 | 31.8 |
| 100-200% above FPL | 1,032,625 | 38.5 | 38.3 | 42.5 | 38.0 |
| 200-300% above FPL | 356,010 | 13.3 | 13.0 | 15.7 | 15.9 |
| >3x above FPL | 394,496 | 14.7 | 13.4 | 26.9 | 14.3 |
| Traditional Medicaid | 1,670,518 | 62.2 | 68.3 | 16.5 | 57.1 |
| Private, Rx Coverage | 261,570 | 9.7 | 8.5 | 19.3 | 13.6 |
| No Supplementation | 282,414 | 10.5 | 9.1 | 21.8 | 9.5 |
| All Others, Rx Cov unknown | 469,924 | 17.5 | 14.1 | 42.5 | 19.8 |
| Excellent + Very Good | 305,653 | 13.0 | 8.3 | 22.3 | 19.2 |
| Good | 648,359 | 27.5 | 23.8 | 42.8 | 31.2 |
| Fair | 942,763 | 40.0 | 45.3 | 21.8 | 32.2 |
| Poor | 450,234 | 19.1 | 22.1 | 12.4 | 16.9 |
| Missing | 9,124 | 0.4++ | 0.5++ | 0.7++ | 0.5++ |
| No ADL dependencies | 272,361 | 11.5 | 6.2 | 20.9 | 19.5 |
| 1 - 2 ADL dependencies | 420,239 | 17.7 | 14.2 | 27.6 | 20.1 |
| 3 - 4 dependencies | 436,464 | 18.4 | 18.2 | 20.0 | 20.2 |
| 5 - 6 dependencies | 1,246,211 | 52.5 | 61.4 | 31.4 | 40.3 |
| SOURCE: MCBS, 2001. * Other Facility includes: congregate care settings, MRDD and rehabilitation settings, psychiatric institutions, and group homes. ++ Estimates considered unreliable due top RSE >30. | |||||
The preponderance of beneficiaries residing in LTCF facilities were 85 years and older (42.2%), although this varied by facility type. Although disabled beneficiaries comprised 16.2% of the entire LTCF population, nearly one-third (32.4%) of OF residents were SSDI-eligible. One-third (33.9%) of LTCF Medicare beneficiaries are male, nearly one-fifth (19.5%) are married, more than half (55.7%) did not complete high school, and three-quarters (76.2%) resided in facilities located in metropolitan areas.
One-third (33.6%) of Medicare beneficiaries residing in LTCFs have incomes at or below the Federal Poverty Level (FPL) and 38.5% are within 100-200% of the FPL. Fewer ALF beneficiaries meet FPL income criteria. Medicaid is the most common payor source of health coverage, with 62.2% of all Medicare LTCF residents having Medicaid coverage, 9.7% possessing private insurance with prescription drug benefits, and 17.5% possessing coverage, including Medicaid waiver programs, with unknown or uncertain prescription drug benefits. More than one in ten (10.5%) Medicare beneficiaries in 2001 only possessed Medicare coverage. Coverage source varies by facility type --14.9% of ALF residents, 57.1% of OF residents, and 68.3% of NH residents receive Medicaid coverage. Medicare beneficiaries with no other coverage supplementation constituted 21.8% of all ALF residents.
More than half (59.1%) of all Medicare LTCF beneficiaries or their survey proxies report their health status as poor or fair, with 67.4% of NH residents reporting the same. Across all LTCF residents, 11.5% reported no limitations in activities of daily living. This proportion was lowest in NH residents (6.2%) and highest in ALF residents (20.9%) and OF residents (19.5%).
Prescription Drug Utilization and Expenditures, 2001
In 2001, 95.6% of the Medicare LTCF beneficiary population used at least one prescription drug (Table 3). There was little variability in any prescription drug utilization across facility type, ranging from 92.2% in OF residents to 98.0% of residents in ALFs.
| TABLE 3. Prescription Drug Utilization and Expenditures, Overall and by Facility Type, 2001 | |||
| % of Facility Population Using at Least One Prescription Drug | Total Annual Expenditures (in million $) | Expenditures Per User (rounded to the nearest $) | |
| Total LTCF | 95.6% | 5,427 | 2,110 |
| Nursing Home | 97.4% | 3,482 | 1,957 |
| Assisted Living Facilities | 98.0% | 547 | 2,011 |
| All Other Facilities | 92.2% | 1,398 | 1,566 |
| SOURCE: MCBS, 2001. | |||
In 2001, total prescription drug spending for all LTCFs in the United States exceeded $5.427 billion (Table 3). The mean annual prescription drug expenditures per user of at least one prescription drug was $2,110. Prescription drug spending in NHs accounted for 64.1% of total LTCF drug spending, followed by OFs (25.8%) and ALFs (10.1%).
Prescription drug use and spending by therapeutic category. The Top 10 therapeutic categories and proportion of LTCF Medicare residents using them most frequently across all LTCFs in 2001 are listed in Table 4. The most commonly used therapeutic category was psychotherapeutics, which includes of antidepressants, antipsychotics, anxiolytics and other related pharmacologic classes. Antibiotics and other anti-infective agents comprise the second most commonly used medication category.
| TABLE 4. Top 10 Most Frequently Utilized Prescription Drug Categories, 2001 | |
| Therapeutic Classification | % all Facility Residents Using At Least One Drug |
| Psychotherapeutics | 61.4% |
| Anti-infectives | 53.8% |
| Gastrointestinal agents | 47.2% |
| Cardiac drugs | 37.5% |
| Diuretics | 36.8% |
| Cardiovascular agents | 36.3% |
| Analgesics | 29.9% |
| Autonomic agents | 27.2% |
| Electrolytes | 24.9% |
| Central nervous system agents | 22.4% |
| FIGURE 1. Total LTCF Prescription Drug Spending by Top 10 Therapeutic Categories, 2001 |
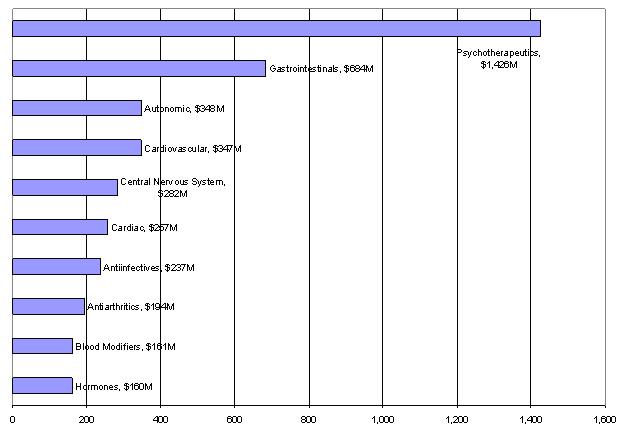 |
The Top 10 spending therapeutic categories accounted for 75.4% of total prescription drug spending in LTCFs in 2001 (Figure 1). Psychotherapeutic agents accounted for $1.426 billion, or 26.3% of total prescription drug spending, in 2001. The second most expensive therapeutic category was gastrointestinal agents, account for $684 million, or 12.6% of total prescription drug spending. Together, the psychotherapeutic and gastrointestinal drug categories accounted for nearly $4 in every $10 dollars spent on prescription drugs in LTCFs.
The use of and spending on these two broad drug categories is not surprising -- psychotherapeutics and gastrointestinal drugs are used to treat medical and health conditions commonly found among LTCF residents, including depression, anxiety, sleep disorders, schizophrenia, agitation and problems associated with dementia and delirium, ulcerative disease, constipation, and diarrhea. The remaining eight therapeutic classes, ranked in order of spending, include: autonomic, cardiovascular, central nervous system, cardiac, anti-infectives, anti-arthritics, blood modifiers, and hormones.
There was little variation in the therapeutic categories comprising the most expensive Top 10 therapeutic categories across facility type. Psychotherapeutic and gastrointestinal agents accounted for the first and second most expensive therapeutic category across all facility types. Seven therapeutic categories (autonomic, cardiovascular, central nervous system, cardiac, anti-infectives and hormones) all ranked in the Top 10 for all three facility settings. Blood modifiers constituted a tenth therapeutic category for all facility types except OFs, where hypoglycemic agents took its place. There was little uniformity of drug spending patterns across facility types for the remaining Top 10 therapeutic categories.
Prescription drug spending by eligibility status, 2001. As expected, patterns of prescription drug use and spending varied by whether or not individuals were Medicare SSDI-eligible. Although SSDI-eligible Medicare beneficiaries constituted 16.2% of the institutionalized Medicare population, their spending on prescription drugs accounted for 18.9% of total prescription drug spending. Differences in annual prescription drug spending per user are particularly notable, with the SSDI beneficiaries spending more than $800 more per year than their aged counterparts (Table 5).
There is also variation in the types of drugs used by SSDI versus aged Medicare beneficiaries. Although psychotherapeutic agents was the most frequently used therapeutic category by both SSDI and aged beneficiaries, the remaining Top 10 therapeutic categories varied by type and ranking (Table 5). Though we found that the proportions of SSDI and aged Medicare beneficiaries using at least one psychotherapeutic agent in 2001 were essentially identical (61.5% versus 61.4%, respectively), psychotherapeutic spending was disproportionate. That is, total psychotherapeutic spending by SSDI beneficiaries accounted for 41.4% of total prescription drug spending, compared to 22.8% by aged. Mean per user psychotherapeutic spending also varied, with SSDI Medicare users spending $1,680 annually compared to $710 spent by aged Medicare users.
| TABLE 5. Prescription Drug Spending by Eligibility Status, 2001 | |||||
| SSDI-Eligible (Under 65) | Aged (Over 65) | ||||
| Total Facility $ (in millions) | Mean $ Per User | Total Facility $ (in millions) | Mean $ Per User | ||
| Psychotherapeutics | 423.9 | 1,680 | Psychotherapeutics | 1,001.9 | 710 |
| Central Nervous System | 127.2 | 783 | Gastrointestinals | 571.5 | 510 |
| Gastrointestinals | 112.5 | 717 | Autonomic | 326.5 | 484 |
| Cardiovascular | 45.3 | 465 | Cardiovascular | 301.6 | 340 |
| Anti-infectives | 37.5 | 215 | Cardiac | 241.7 | 250 |
| Autonomic | 21.4 | 347 | Anti-infectives | 199.6 | 156 |
| Skin Preparations | 18.7 | 197 | Anti-arthritics | 179.4 | 345 |
| Hypoglycemics | 18.4 | 590 | Central Nervous System | 154.6 | 352 |
| Analgesics | 17.1 | 248 | Blood Modifiers | 149.4 | 301 |
| Hormones | 16.1 | 285 | Hormones | 143.6 | 270 |
| All Therapeutic Categories | 1,024.8 | 2,811 | All Therapeutic Categories | 4,402.6 | 1,983 |
| Total Top 10 Spending | 838.1 | -- | Total Top 10 Spending | 3,269.8 | -- |
| Top 10 Categories as Percent of Total | 81.8% | -- | Top 10 Categories as Percent of Total | 74.3% | -- |
| SOURCE: MCBS, 2001. | |||||
Prescription drug spending by payor source, 2001. Medicaid paid the largest share of prescription drug expenditures in 2001, accounting for 65.9%, or $3,572.4 million, of total prescription drug expenditures among Medicare beneficiaries residing in LTCFs (Table 6). Individuals with no supplemental coverage accounted for $554.2 million in drug expenditures, all of which is assumed to be paid for out-of-pocket.
| TABLE 6. Total and Per User Prescription Drug Spending by Coverage Source, 2001 | ||
| Total Spending ($ in millions) | Spending Per User (Rounded to the nearest $) | |
| Medicaid | 3,572.4 | 2,237 |
| Private Coverage with Prescription Drug Coverage | 297.7 | 1,155 |
| Other Coverage with Prescription Coverage Unknown | 1,003.0 | 2,168 |
| No Supplemental Coverage | 554.2 | 2,077 |
| SOURCE: MCBS, 2001. | ||
There was variability in annual per user prescription drug spending, with individuals possessing private coverage with prescription drug spending the least ($1,155 per year) and Medicaid-dual eligibles expending the most ($2,237). Annual expenditures per user for beneficiaries with unknown prescription coverage and those with no supplemental coverage also paying significant sums on prescription drugs were $2,168 and $2,077 per user, respectively.
Psychotherapeutic and gastrointestinal agents remained the top two most expensive therapeutic classes, regardless of coverage source (Table 7). Due to the sheer volume of LTCF beneficiaries with Medicaid as an coverage source, spending patterns by therapeutic category are almost wholly driven by this insurer. In addition to variability in ranking of therapeutic category by coverage source, there is also considerable per user differences in spending by therapeutic category. For example, annual expenditures for psychotherapeutics ranged from $976 for Medicare beneficiaries also possessing Medicaid coverage to $364 for those beneficiaries with private prescription drug coverage. Medicare beneficiaries without any supplemental coverage paid nearly as much for psychotherapeutic agents ($867) and more for gastrointestinal agents ($620) than did dual eligibles ($552).
| TABLE 7. Per User Expenditures and Total Expenditures Ranking by Top 5 Therapeutic Categories and by Coverage Source, 2001 | |||||
| All CoveragesSources | Medicaid(N=1,670,518) | Private InsuranceCoverage(N=261,570) | Other Insurance withPrescription Coverage Unknown(N=469,924) | No SupplementalCoverage(N=282,414) | |
| Per User Expenditures in dollars ($)(Rank in Terms of Total Category Spending) | |||||
| Pyschotherapeutics | 857 (1) | 976 (1) | 364 (1) | 688 (1) | 867 (1) |
| Gastrointestinals | 535 (2) | 552 (2) | 308 (2) | 548 (2) | 620 (2) |
| Autonomic | 473 (3) | 467 (5) | 287 (3) | 581 (3) | 537 (3) |
| Cardiovascular | 352 (4) | 367 (4) | 208 (6) | 393 (4) | 340 (4) |
| Central Nervous System | 469 (5) | 497 (3) | 202 (12) | 304 (11) | 706 (5) |
| Cardiac | 252 (6) | 265 (7) | 164 (5) | 271 (6) | 256 (6) |
| Anti-infectives | 163 (7) | 173 (6) | 216 (4) | 134 (10) | 103 (10) |
| Anti-arthritics | 328 (8) | 321 (9) | 304 (7) | 316 (7) | 417 (7) |
| Blood Modifiers | 300 (9) | 341 (10) | 98 (10) | 368 (8) | 237 (16) |
| Hormones | 272 (10) | 283 (11) | 171 (8) | 309 (9) | 255 (11) |
| All Therapeutic Categories ($ in millions) | 5,427.4 | 3,572.4 | 297.7 | 1,003.0 | 554.2 |
| Total Top 10 Spending ($ in millions) | 4,162.5 | 2,741.9 | 240.7 | 780.2 | 425.2 |
| Top 10 Categories as Percent of Total | 76.7% | 76.8% | 80.8% | 77.8% | 76.7% |
| SOURCE: MCBS, 2001. | |||||
III. TRENDS IN ACTUAL AND PROJECTED PRESCRIPTION DRUG SPENDING, 1998-2005
This section examines the socio-demographic changes occurring in the LTCF population from 1998-2001. Based upon estimates provided for prescription drug expenditures from 1998-2001, projected drug expending is estimated for 2002-2005, the last year before implementation of the MMA.
Trends in characteristics of Medicare beneficiaries residing in LTCFs, 1998-2001. The United States population residing in LTCFs remained relatively stable from 1998-2001, with the LTCF population growing 1.6% over the three year period (Figure 2). Growth, where it did occur, was primarily in ALF and OF residences: the number of individuals residing in ALF homes increased 33.2% in three years, and those residing in OF residences increased 10.8% over the same time period. Between 1998 and 2001, the population residing in traditional NH declined by 3.4%.
| FIGURE 2. Trends in LTCF Population, 1998-2001 |
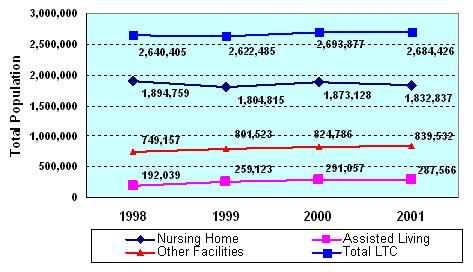 |
| SOURCE: MCBS, 1998-2001. |
For the most part, characteristics of individuals residing in LTCFs remained stable over the four year study period. Of primary consequence to this analysis was the shift in coverage source income over time. Specifically, we observed a dramatic increase in the proportion of beneficiaries in long-term care who qualify for Medicare on the basis of SSDI (Figure 3). Indeed, in the total LTCF Medicare population, the proportion of the SSDI individuals has increased nearly four percentage points from 1998 to 2001. This growth is primarily driven by the burgeoning SSDI population residing in Other Facility settings.
| FIGURE 3. Trends in Proportion of LTCF Medicare Beneficiaries Eligible by SSDI Eligibility, 1998-2001 |
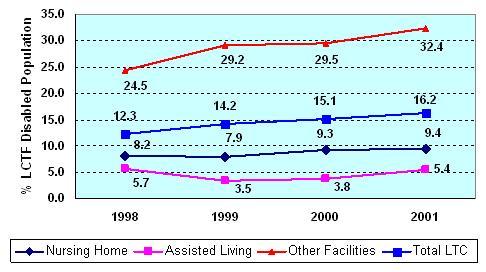 |
| SOURCE: MCBS, 1998-2001. |
Trends in prescription drug utilization and spending, 1998-2001. Total prescription spending increased steadily between 1998 and 2001 (Figure 4). Mean annual growth in prescription drug spending across all LTCFs was 11.9% over the three year period, with the greatest growth noted in ALFs.
| FIGURE 4. Mean Annual Growth in Prescription Drug Expenditures in LTCFs, by Facility Type (1998-2001) |
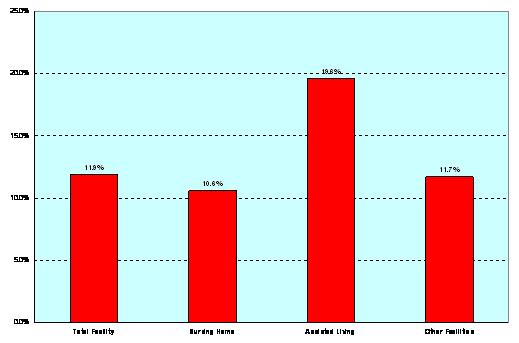 |
| SOURCE: MCBS, 1998-2001. |
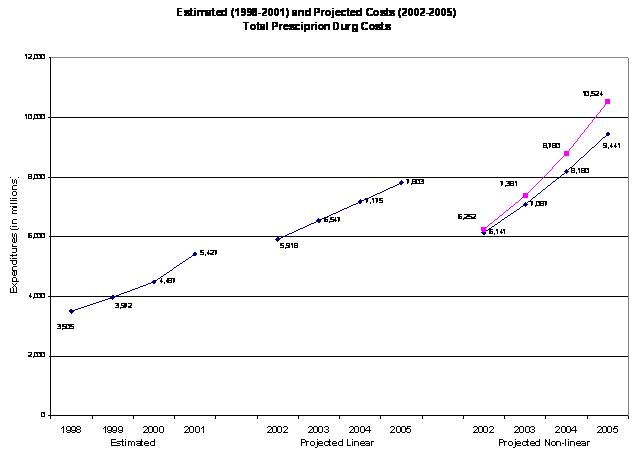
Actual and projected prescription drug expenditures, 1998-2005. Based on actual national estimates from 1998-2001, total prescription drug expenditures for all LTCFs are projected through 2005. Two types of projections are presented that illustrate the consequences of different modeling assumptions. The first type of projection uses a linear projection which assumes that total prescription drug expenditures increase at a constant rate. This is shown by the resultant straight line shown in the projected numbers.
The non-linear projections fit the actual spending estimates for 1998-2001 to an exponential growth series using two methods. The first non-linear growth trend is based solely upon total prescription drug expenditures and projects them forward as a unit regardless of the individual growth patterns of the therapeutic classifications contained with it.
The second type of non-linear trend accounts for differing individual growth rates in therapeutic categories rates and so projects them forward separately and then sums them collectively to come up with a new total expenditure. Because individual, categorical growth rates are accounted for, this results in larger total expenditures.
| FIGURE 5. Prescription Drug Expenditures by Therapeutic Class, 1998-2001 |
 |
| SOURCE: MCBS, 1998-2001. |
We found that two therapeutic categories are primarily responsible for prescription drug spending growth between 1998 and 2001: the psychotherapeutic agents and gastrointestinal agents (Figure 5). In regard to the psychotherapeutic agents, this spending growth is due to both increases in utilization as well as increases in spending. The heaviest users of psychotherapeutic agents are SSDI Medicare beneficiaries, the majority of whom also are dually eligible for Medicaid.
Based on the three different approaches, total prescription drug expenditures in LTCFs are estimated to range from $7.8-$10.5 billion (Figure 6 and Table 8). The different types of projections of prescription drug spending for 2005 illustrate the large differences the modeling assumptions can create. For example, projected 2005 expenditures using a linear projection model shows expenditures at $7.8 billion while the non-linear total expenditure projection estimate is $9.4 billion, and the non-linear projections based on the sum of individually trended therapeutic classification rises still further to $10.5 billion. The following table shows the projected estimates and percentage increases from 2001, the last year of data.
| TABLE 8. Actual and Projected Prescription Drug Expenditures, 1998-2005 | ||||||||
| Projected Expenditures by Different Projection Models ($ in millions) | % Increase from 2001 Estimates | |||||||
| 2002 | 2003 | 2004 | 2005 | 2002 | 2003 | 2004 | 2005 | |
| Linear | 5,918 | 6,547 | 7,175 | 7,803 | 9.0% | 20.6% | 32.2% | 43.8% |
| Non-linear, total $ | 6,141 | 7,087 | 8,180 | 9,441 | 13.1% | 30.6% | 50.7% | 73.9% |
| Non-linear, Sum of Therapeutic Categories | 6,252 | 7,381 | 8,780 | 10,524 | 15.2% | 36.0% | 61.8% | 93.9% |
| SOURCE: MCBS, 1998-2001. | ||||||||
| FIGURE 6. Actual and Projected Prescription Drug Spending, 1998-2005 |
 |
| SOURCE: MCBS, 1998-2001. |
Discussion
In 2001, nearly 2.7 million Medicare beneficiaries living in NHs and other LTCFs spent more than $5.42 billion on prescription drugs. In the absence of any diagnostic or functional assessment, prescription drug spending as reported through the MCBS is largely driven by coverage source, with Medicaid being the largest payor of prescription drugs. The SSDI-eligible LTCF population, designated here as those Medicare beneficiaries aged less than 65, are growing as a proportion of Medicare beneficiaries and also constitute a driving force behind the number and types of prescription medication expenditures. Indeed, in 2001 Medicare beneficiaries designated as SSDI-eligible spent, on average, $828 more on prescription drugs than their counterparts qualifying for Medicare on the basis of age.
Overall population growth in LTCFs from 1998-2001 has been nominal, spurred by growth in two sectors -- ALF and OF. This increase in the OF population is primarily due to increases in the disabled population, which is inherently the more expensive population in terms of prescription drug spending. In contrast, growth in ALFs, while notable, is driven primarily by relatively healthy Medicare-eligibles age 65 and older and still represents a relatively small proportion of total LTCF beds. The differential findings for coverage type and eligibility status suggest that these populations are very different in terms of prescription drug utilization and expenditures patterns and should be considered as such in future policy and research analyses.
In general, the Top 10 therapeutic categories accounted for approximately three-quarters of all prescription drug spending in LTCFs, regardless of facility type, coverage source, and eligibility status. Thus, any efforts to manage the use and spending of prescription drugs in LTCFs most likely would focus on these classes. Of course, as this brief illustrates, there is variability in which categories are most frequently used; these differences are most notable when examined by facility type, coverage source, and eligibility status because these groups embody different medical conditions and needs. What is not examined here and may be addressed in future analysis is how clinical variability, in terms of actual diagnoses as well as severity-of-illness, influences drug spending. Under the MMA, Medication Management Therapy services are provided to individuals with a high disease and/or drug burden, which may ultimately alter drug spending patterns in the future.
Psychotherapeutic agents were the most commonly utilized therapeutic class, as well as the most expensive class, accounting for more than one-quarter of all drug spending. Psychotherapeutic drug use was driven by disabled individuals who were dually eligible for Medicare and Medicaid. Given that estimates provided here are from 2001, it demonstrates that psychotherapeutics are likely to constitute a large proportion of LTCF drug spending under the MMA. Indeed, under the Part D provisions, many of the psychotherapeutic pharmacologic classes, including the antidepressants, the antipsychotics, and the anticonvulsants (many of which are used to treat mental health conditions) enjoy special protections including the provision that all drugs in that class be excluded from Prescription Drug Plan formularies. These protected classes, however, are still subject to prior authorization and differential copayments, which may influence utilization patterns. Thus, the psychotherapeutic agents remain a broad therapeutic category that may warrant monitoring as the MMA unfolds. The gastrointestinal agents are the second most expensive therapeutic class, and account for another one in ten prescription drug dollars. The next three most expensive therapeutic classes warrant scrutiny in the future: the autonomic agents, comprised of some antihypertensive agents (e.g., beta-blockers) and drugs used to treat Parkinsons disease, cardiovascular drugs, and the central nervous system drugs, which include the anticonvulsant agents such as lamotrigine and gabapentin.
Limitations. Findings should be considered in the context of several limitations. We estimate prescription spending growth to continue at approximately 11% annually. It is important to note, however, that projection models are inherently sensitive to assumptions, as evidenced by the wide variability of total growth estimates ranging from 44% to 94%, depending upon model and when referenced to 2001 spending. The projection of prescription spending into the future is always sensitive endeavor and subject to cumulative influences of the assumptions behind the growth model. The reader is cautioned to view these projections as rough approximations to the degree of growth, and not as absolute numbers. Our projected estimates of prescription drug expenditures growth are basic; detailed projections were beyond the scope of this study. Further work in projecting expenditures forward should consider the use of constant dollars, using the GDP or other inflation adjuster, as well as decomposition of spending to reflect true price differences from growth due to increased utilization and/or therapeutic drug mix.
For one, the findings only are generalizable to Medicare beneficiaries, as the MCBS does not contain information on LTCF residents who are not Medicare-eligible. We also exclude facilities that do not have continuous (24/7) nursing care and centralized medication management; thus, our findings of prescription use and spending in ALF and OFs are likely to be underestimated. In addition, the pricing algorithm used for this analysis has only been used to price prescription drug events among MCBS respondents residing in the community and there is no published benchmark to which we can compare for validity of our LTCF prescription drug expenditures. This will be addressed in a future sensitivity analysis using proprietary data from a large prescription drug service provider, as well as in another Policy Brief comparing prescription drug expenditures among LTCF-residing beneficiaries to their community-dwelling counterparts. Finally, the findings from this report generalize to the Medicare population residing in LTCFs and do not capture beneficiaries residing in the community. Future work will compare prescription drug spending in these two beneficiary populations.
Conclusions
This brief presents the first national estimates of prescription drug expenditures in LTCFs in the United States. These findings provide a useful benchmark for policy-makers and payors of prescription drugs for the LTCF Medicare population. Further research and analysis are required in several areas, including: estimating monthly prescription drug utilization and expenditures to the facility in which they were incurred; the use of multivariable methods which control for various covariates, including disease burden and severity-of-illness; the continuous updating of MCBS files to provide current data; the continued application of the pricing algorithm to the IDA data and generation of more recent expenditures estimates; decomposition of spending by use, price, and therapeutic mix; and the application of more sophisticated modeling techniques to better approximate projected prescription drug spending.
LIST OF REPORTS
Prescription Drug Spending by Medicare Beneficiaries in Institutional and Residential Settings, 1998-2001
HTML version: http://aspe.hhs.gov/daltcp/reports/2007/pdspend.htm
PDF version: http://aspe.hhs.gov/daltcp/reports/2007/pdspend.pdf
POLICY BRIEF #1: National Estimates of Prescription Drug Utilization and Expenditures in Long-Term Care Facilities
HTML version: http://aspe.hhs.gov/daltcp/reports/2006/pdnatest.htm
PDF version: http://aspe.hhs.gov/daltcp/reports/2006/pdnatest.pdf
POLICY BRIEF #2: A National Comparison of Prescription Drug Expenditures by Medicare Beneficiaries Living in the Community and Long-Term Care Facility Settings
HTML version: http://aspe.hhs.gov/daltcp/reports/2007/pdnatcom.htm
PDF version: http://aspe.hhs.gov/daltcp/reports/2007/pdnatcom.pdf
POLICY BRIEF #3: Drug Use and Spending for Medicare Beneficiaries During Part A Qualifying Skilled Nursing Facility Stays and Non-Qualifying Long-Term Care Facility Stays
HTML version: http://aspe.hhs.gov/daltcp/reports/2007/druguse.htm
PDF version: http://aspe.hhs.gov/daltcp/reports/2007/druguse.pdf
NOTES
-
Stuart B, Simoni-Wastila L, Shaffer T, Baysac F, Shea D. Coverage and Use of Prescription Drugs in Nursing Homes: Implications for the Medicare Modernization Act. Medical Care. March 2006, 44(3):243-249. Briesacher BA, Limcangco R, Simoni-Wastila L, Doshi JA, Levens SR, Shea DG, and Stuart B. The quality of antipsychotic prescribing in nursing homes. Archives of Internal Medicine. June 2005; 165:1280-1285. Briesacher B, Limcangco R, Simoni-Wastila L, Doshi J, Gurwitz J. Evaluation of nationally-mandated drug use reviews to improve patient safety in nursing homes: a natural experiment. Journal of the American Geriatric Society. June 2005; 53(6); 991-998. Simoni-Wastila L, Stuart B, and Shaffer T. Over-the-Counter drug use by Medicare beneficiaries in nursing homes: implications for practice and policy. Journal of the American Geriatrics Society. Accepted for publication and available online August 3, 2006 (http://www.blackwell-synergy.com/doi/abs/10.1111/j.1532-5415.2006.00870).
-
This effort was undertaken in consultation with CMS.
-
Simoni-Wastila L, Stuart B, Shaffer T. Over-the-Counter drug use by Medicare beneficiaries in nursing homes: implications for practice and policy. Journal of the American Geriatrics Society. Accepted for publication and available online August 3, 2006 (http://www.blackwell-synergy.com/doi/abs/10.1111/j.1532-5415.2006.00870).