
U.S. Department of Health and Human Services
A National Comparison of Prescription Drug Expenditures by Medicare Beneficiaries Living in the Community and Long-Term Care Facility Settings
Linda Simoni-Wastila, PhD, Thomas Shaffer, MHS and Bruce Stuart, PhD
University of Maryland, Baltimore, Peter Lamy Center on Drug Therapy and Aging
February 15, 2007
PDF Version (19 PDF pages)
This report was prepared under contract #HHS-100-03-0025 between the U.S. Department of Health and Human Services (HHS), Office of Disability, Aging and Long-Term Care Policy (DALTCP) and the University of Maryland. For additional information about this subject, you can visit the DALTCP home page at http://aspe.hhs.gov/_/office_specific/daltcp.cfm or contact the office at HHS/ASPE/DALTCP, Room 424E, H.H. Humphrey Building, 200 Independence Avenue, S.W., Washington, D.C. 20201. The e-mail address is: webmaster.DALTCP@HHS.GOV. The Project Officer was Linda Bergofsky.
The opinions expressed herein are solely those of the authors and do not reflect the position or policy of any office of the Assistant Secretary for Planning and Evaluation at the U.S. Department of Health and Human Services or any other government authority.
TABLE OF CONTENTS
- FINDINGS
- Description of the 2001 Institutionalized and Community-Dwelling Medicare Beneficiary Populations
- Prescription Drug Utilization and Expenditures Among Medicare Beneficiaries Residing in LTCFs and the Community, 2001
- Prescription Drug Use and Spending by Therapeutic Category
- Prescription Drug Spending by Eligibility Status, 2001
- Prescription Drug Spending by Prescription Coverage Source, 2001
- LIST OF FIGURES
- FIGURE 1: Comparison of Prescription Drug Utilization and Expenditures in Community and LTCF Medicare Beneficiaries, 2001
- FIGURE 2: Total Prescription Drug Spending by Medicare Beneficiaries by Prescription Coverage Source
- LIST OF TABLES
- TABLE 1: Top 10 Most Frequently Utilized Prescription Drug Categories, 2001
- TABLE 2: Top 10 Prescription Drug Categories by Total Expenditures, 2001
- TABLE 3: Prescription Drug Expenditures by Eligibility Status, 2001
- TABLE 4: Total and Per User Prescription Drug Spending by Prescription Coverage Source, 2001
- TABLE 5: Per User Expenditures and Total Expenditures by Top 10 Therapeutic Categories and by Prescription Coverage Source and Residential Setting, 2001
INTRODUCTION
Although several studies have provided national estimates of prescription drug use by Medicare beneficiaries residing in long-term care facilities (LTCFs),1 few studies have examined prescription drug spending in LTCFs,2 and none have expressly compared patterns of prescription drug spending by beneficiaries living in LTCFs to those residing in the community. Such comparative analyses are important because much of Medicare drug policy is made based on needs -- or perceived needs -- of the larger, more robust, independent living Medicare population. It is important to understand differences in the socio-demographics characteristics of the institutionalized versus community-dwelling beneficiary, as many of these differences may represent differences in disease burden and severity-of-illness which, in turn, drive patterns of pharmacologic use and spending. The extent of existing differences in drug use patterns between these two disparate beneficiary groups may in turn be important distinctions for policy-makers as they implement modifications to current Medicare drug policy.
In this paper, we examine differences in socio-demographic and drug utilization and expenditures characteristics of Medicare beneficiaries residing in LTCFs and those residing in community settings. For the purposes of this paper, we use the 2001 Medicare Current Beneficiary Survey (MCBS). We focus in particular on several factors thought to differ markedly by residential status: Medicare and Medicaid eligibility status, the prevalence and source of prescription drug coverage and differential patterns of drug use by therapeutic class. As noted in another Office of the Assistant Secretary for Planning and Evaluation (ASPE) Policy Brief (see footnote 2), we expect to see differences in prescription drug use and spending patterns between individuals who are Medicare-eligible on the basis of Social Security Disability Insurance (SSDI) versus those who are eligible on the basis of age (65 and older). These differences arise from the heterogeneity of the two populations in terms of disease burden, severity-of-illness, and types of prescription medications required to treat their medical conditions. We expect the prevalence and source of prescription drug coverage to vary by residential setting primarily because of the higher proportion of Medicaid-dual eligibles residing in institutions. Finally, we expect that differences in types and severity-of-illness between, community-dwelling and institutionalized beneficiaries will drive differences in prescription utilization and expenditure patterns in the two settings.
Findings presented here are part of a larger ASPE-sponsored study whose primary purpose is to provide updated, detailed spending data on prescription medications used in LTCFs. These data will support further analyses of relationships and associations identified in this paper and our previous ASPE brief. The aim of this particular project is to produce national estimates of prescription drug use and spending patterns by Medicare beneficiaries residing in LTCFs and the community for 2001.
We provide a snapshot of prescription drug use and spending in 2001, the latest years for which complete community and LTCF drug data are available. For this analysis, we present summary findings of:
- Characteristics of Medicare beneficiaries residing in LTCFs and the community.
- Overview of prescription drug utilization and expenditures in aggregate and by therapeutic category.
- Prescription drug expenditures by source of prescription coverage and Medicare eligibility status.
METHODS
Data. Data for this analysis were drawn from the 2001 MCBS Cost and Use and Institutional Drug Administration (IDA) files. We extracted information on socio-demographics, facility type, and source of prescription coverage source from the Cost and Use files. We obtained drug use and cost information for community-dwelling Medicare beneficiaries from the Prescription Medication Event (PME) analytic file in the Cost and Use file available to the public. We obtained detailed information on prescription drug administration in LTCFs from the IDA file. Prescription drug information in IDA is extracted by MCBS surveyors from the Medication Administration Records on prescription drug use in LTCFs. This file, known as the IDA, is collected at the time of the general MCBS survey and then prepared as an analytic file by the University of Maryland under contract to the Centers for Medicare and Medicaid Services (CMS). This file is not part of the general MCBS survey at this time.
A key feature of this particular study was the assignment of a price to each prescription drug record. The pricing of drug data is usually based on the 9-11 digit National Drug Code (NDC) which uniquely identifies important characteristics of the drug (e.g., strength, form, brand or generic status, and manufacturer) that allows it to be individually priced. The MCBS survey, however, does not collect this unique identifier; rather, only drug name, dosage form, and strength are collected. Pricing of drugs for persons surveyed in long-term care settings was accomplished by applying the same algorithm used by CMS to price drugs for people in the community.3 The algorithm takes into account name, dosage form, and strength to impute a base price. Once a base price is imputed, further adjustments are made to reflect payer type to account for real-world market factors such as discounts and dispensing fees.
Residential setting. LTCF residents are defined by the MCBS those who live in a residential facility providing 24 hour nursing services. These include skilled nursing facilities (SNFs), other nursing homes, selected high-end ALFs, and other types of residential facilities (such as long-term rehabilitation and psychiatric hospitals, Mental Retardation and Developmental Disability residences, and others). Short-term residential stays in SNFs after a qualifying three-day post-acute hospitalization are not considered as facility stays by the MCBS. Community-dwelling individuals are all those who are not in a LTCF as defined by the MCBS.
The MCBS contains a small segment (1.6%) of individuals who spend time in both the community and in a facility setting. For the purposes of this report, this special subset of individuals is considered facility dwelling. Due to the nature of how the PME file is constructed, these individuals are also likely to have annual prescription drug expenditures imputed on their behalf instead of just for the time they remained in the community (mean time in community is 162 days). This argued for dropping their community expenditures at the cost of slight underestimation of total PME expenditures.
Drug use measures. Due to fundamental differences in the way MCBS drug data are collected at the community and facility levels, comparisons of prescription drug utilization and expenditures are limited in several important ways:
-
Utilization of prescription drugs in institutional settings is recorded at the monthly level, but drug use in the community is reported at the annual level. Thus, comparisons can only be made at the annual level (rather than at the monthly level).
-
There are differences in the way dosage form and strength are recorded in the community and institutional surveys. Further, data in the IDA dosage and strength fields required considerable cleaning by University of Maryland pharmacy staff in order to permit the CMS pricing algorithm to operate optimally. The combination of different source information and different cleaning procedures may introduce an immeasurable level of error into the cost comparisons by setting.
-
Finally, because the CMS community drug pricing algorithm uses only drug names collected in the PME files, it does not recognize some drugs and dosage forms used only in institutional settings. Professional pharmaceutical experts were consulted to develop a cross-walk in an effort to accommodate these situations.
Measures of prescription drug utilization include proportion of users having at least one PME (community) or medication administration (LTCF) in the year. Expenditures are measured as total expenditures and expenditures per user per year. Prescription drug use and spending are examined in aggregate, as well as by therapeutic category. Therapeutic categories are those defined by First DataBank4 and used by the MCBS for classifying PME drug events. All use and spending measures are weighted to provide national estimates. All expenditures are presented in current 2001 dollars. For all analyses of therapeutic class, we examined the Top 10 most commonly used or most expensive categories according to use and spending in the community. Thus, spending in LTCFs is benchmarked to that of the community.
It is important to note estimates reported here include prescription-only drugs; the CMS pricing algorithm specifically excludes over the counter (OTC) drugs and consequently they are omitted from analyses. Although OTC medications represent a significant component of medication utilization in LTCFs, accounting for almost a third of all administrations, they are comparatively inexpensive due to their OTC status.5
Measures of prescription coverage. The MCBS Cost and Use files contain detailed plan-level information about prescription coverage for community-dwelling Medicare beneficiaries. However, there are no specific questions about drug coverage for institutionalized beneficiaries. In order to make comparisons between the two settings, we developed an algorithm that could be applied in both. In some cases, we could infer that LTCF residents had drug coverage based on Medicaid enrollment records. All traditional Medicaid programs offer prescription coverage to LTCF residents. In addition, beneficiaries who are Qualified Medicare Beneficiaries (QMB) or Specified Low Income Beneficiaries (SLMB) may have prescription coverage at the states discretion (these are known as QMB-plus and SLMB-plus states). Beneficiaries who enroll in a state pharmaceutical assistance program also have drug coverage. For a select sub-sample of LTCF residents we could track private health insurance and prescription benefits prior to LTCF admission. In such cases, we assumed that residents who had prior drug coverage also had it while institutionalized. Finally, we could determine whether LTCF residents had any source of Medicare supplementation. Those with no Medicare supplementation are without prescription coverage by definition; as a result of these investigations, we defined four classes of prescription coverage: Medicaid with prescription benefits, other source of prescription coverage, prescription coverage status unknown (comprising those with a Medicare supplement whose prescription coverage status could not be determined), and those with no prescription coverage.6
FINDINGS
Description of the 2001 Institutionalized and Community-Dwelling Medicare Beneficiary Populations
In 2001, nearly 2.7 million Medicare beneficiaries resided for at least part of the year in one or more LTCFs (See Policy Brief #1, Table 2). Thus, LTCF residents constitute nearly 6.6% of the entire Medicare beneficiary population of 41.2 million.
Not unexpectedly, Medicare beneficiaries residing in LTCFs are more likely to be older, female, and widowed when compared to their community-dwelling counterparts. More than 40% of LTCF residents are 85 years or older, compared to under 10% of community-residing beneficiaries. Similar proportions of the community and facility populations are under age 65 and receive SSDI. LTCF residents are less likely than community peers to have completed high school (44.3% and 68.1%, respectively) and more likely to fall under the federal Poverty Limit (33.6% and 15.7%, respectively). Institutionalized beneficiaries have different prescription coverage profiles than those living in the community; they are much more likely to have prescription drug coverage through Medicaid (49.8% versus 12.1%), whereas non-Medicaid sources of prescription coverage were the predominant aspect of prescription drug coverage in the community (10.7% versus 63.3%). There were approximately the same proportions of individuals with no prescription drug coverage in both facility and community settings (21.8% versus 23.8%).
Beneficiaries residing in LTCFs are also sicker than their community peers: only 13.1% of LTCF residents rate their overall health as very good to excellent, compared to 40.5% of community beneficiaries. Similarly, only 11.5% of LTCF residents have no limitation in activities of daily living, compared to 71.2% of those living in the community.
Prescription Drug Utilization and Expenditures Among Medicare Beneficiaries Residing in LTCFs and the Community, 2001
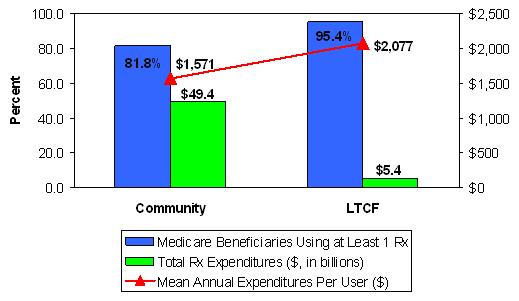
In 2001, 95.4% of the Medicare LTCF beneficiary population and 81.8% of the community-dwelling beneficiary population used at least one prescription drug (Figure 1). Total prescription drug expenditures by Medicare beneficiaries topped $54.8 billion in 2001. Drug spending by LTCF residents accounted for 9.9% ($5.4 billion) of this amount, with the remaining 90.1% ($49.4 billion) accounted for by community-dwelling beneficiaries. The mean annual prescription drug expenditure per user is markedly higher for LTCF residents than for community-dwelling beneficiaries ($2,077 versus $1,571, respectively).
| FIGURE 1. Comparison of Prescription Drug Utilization and Expenditures in Community and LTCF Medicare Beneficiaries, 2001 |
 |
| SOURCE: MCBS, 2001 |
Prescription Drug Use and Spending by Therapeutic Category
The Top 10 therapeutic categories used by the Medicare population residing in the community are defined by the proportion of users with at least one PME in the therapeutic category of interest (Table 1). Use of these Top 10 therapeutic categories in the community is compared to use by the LTCF population. Rankings of use vary markedly by residential setting. For example, psychotherapeutic drugs are the most frequently used drug class by beneficiaries residing in LTCFs, but the ninth most frequent class among community-dwelling beneficiaries. Conversely, cardiovascular medications comprise the most frequently used therapeutic class by community-residing beneficiaries, but the sixth most frequently used class by LTCF beneficiaries.
The ranking of Top 10 drug classes also varies markedly by expenditures. In the community, cardiovascular drugs are both the most commonly used class based on utilization (as shown in Table 1), and the most expensive therapeutic class (as shown in Table 2). Expenditures for gastrointestinal agents moved this therapeutic category into second most expensive class in both the community and LTCF populations. Similarly, although psychotherapeutic agents rank ninth in total utilization by community-dwelling beneficiaries, it ranks third in terms of total expenses.
| TABLE 1. Top 10 Most Frequently Utilized Prescription Drug Categories, 2001 | ||
| Top 10 Therapeutic Classesby Utilization in the Community | % of Community-Dwelling Residents using At Least One Drug (rank) | % all Facility Residents Using At Least One Drug (rank) |
| CARDIOVASCULAR | 45.2 (1) | 36.5 (6) |
| CARDIAC DRUGS | 28.7 (2) | 38.2 (4) |
| DIURETICS | 26.2 (3) | 36.7 (5) |
| GASTROINTESTINAL | 23.7 (4) | 45.2 (2) |
| ANTIARTHRITICS | 22.1 (5) | 21.4 (14) |
| AUTONOMIC DRUGS | 21.4 (6) | 27.1 (9) |
| ANTI-INFECTIVES | 21.1 (7) | 40.0 (3) |
| HORMONES | 20.9 (8) | 21.8 (12) |
| PSYCHOTHERAPEUTIC DRUGS | 20.8 (9) | 61.5 (1) |
| ANALGESICS | 18.1 (10) | 30.9 (8) |
| SOURCE: MCBS, 2001. | ||
Total prescription expenditures for the Top 10 therapeutic classes arrayed by spending accounted for $39.9 billion, or 72.8% of total prescription drug expenditures by the Medicare population in 2001. The Top 10 therapeutic categories accounted for 73.0% of total spending in the community ($36.1 billion), and 72.2% of spending in LTCFs ($3.8 billion).7
| TABLE 2. Top 10 Prescription Drug Categories by Total Expenditures, 2001 | |||
| Top 10 Therapeutic Classes by Spending in the Community | Total Community Expenditures ($ in mill) (rank) | Total LTCF Expenditures ($ in mill) (rank) | Total Expenditures ($ in mill) (rank) |
| CARDIOVASCULAR | 10,050.9 (1) | 347.5 (3) | 10,398.4 (1) |
| GASTROINTESTINAL | 4,761.0 (2) | 636.6 (2) | 5,397.7 (3) |
| PSYCHOTHERAPEUTIC DRUGS | 4,065.1 (3) | 1,427.0 (1) | 5,492.1 (2) |
| CARDIAC DRUGS | 3,704.4 (4) | 257.1 (6) | 3,961.5 (4) |
| UNCLASSIFIED DRUG PRODUCTS | 3,239.8 (5) | 221.0 (7) | 3,460.8 (5) |
| ANTIARTHRITICS | 2,787.4 (6) | 193.1 (8) | 2,980.6 (6) |
| HYPOGLYCEMICS | 2,396.1 (7) | 138.1 (12) | 2,534.2 (7) |
| AUTONOMIC DRUGS | 2,021.5 (8) | 347.0 (4) | 2,368.5 (8) |
| HORMONES | 1,585.0 (9) | 159.7 (10) | 1,744.7 (9) |
| BLOOD PRODUCTS | 1,491.3 (10) | 161.0 (9) | 1,652.3 (10) |
| TOTAL SPENDING | 36,102.5 | 3,888.1 | 39,990.8 |
Prescription Drug Spending by Eligibility Status, 2001
Patterns of prescription drug use and spending vary by whether individuals are Medicare-eligible by virtue of disability (SSDI) or age (Table 3). Although disabled Medicare beneficiaries constituted 15.1% of the institutionalized Medicare population in 2001, they accounted for 18.7% of total prescription drug spending. Similarly, the 13.7% of SSDI beneficiaries living in the community accounted for 19.4% of total community expenditures for prescription drugs.
| TABLE 3. Prescription Drug Expenditures by Eligibility Status, 2001 | ||||||||
| SSDI-Eligible (Under 65) | Aged (Over 65) | |||||||
| Facility | Community | Facility | Community | |||||
| Total $ (in mill) | Mean $ Per User | Total $ (in mill) | Mean $ Per User | Total $ (in mill) | Mean $ Per User | Total $ (in mill) | Mean $ Per User | |
| All Therapeutic Categories | $1,012 | $2,775 | $9,577 | $2,444 | $4,352 | $1,962 | $39,871 | $1,418 |
| Total Top 10 Spending | $682 | $1,986 | $5,736 | $1,585 | $2,969 | $1,362 | $26,302 | $1,009 |
| Top 10 Categories as Percent of Total | 67.4% | -- | 59.9% | -- | 68.2% | -- | 66.0% | -- |
| SOURCE: MCBS, 2001. | ||||||||
On average, SSDI beneficiaries in the community spent $2,444 per user on prescription drugs, compared to $2,775 per user by SSDI-eligibles residing in facilities, a mean difference of $331 per year. Within LTCFs, there were higher per user expenditures for SSDI beneficiaries than their aged counterparts ($2,775 versus $1,962); in the community, SSDI-eligibles also spent on average nearly $1,000 more than their aged counterparts ($2,444 versus 1,418).
Prescription Drug Spending by Prescription Coverage Source, 2001
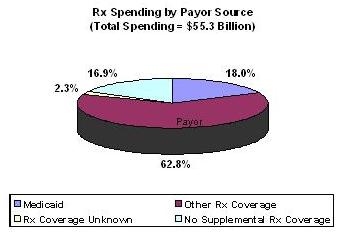
Beneficiaries categorized as having other sources of prescription coverage accounted for the highest proportion of drug spending for the entire Medicare population in 2001 (Figure 2). Medicaid spending for prescription drugs accounted for less one-fifth (18%) of total drug spending. Almost 17% of total drug spending was accounted for by Medicare beneficiaries with no drug coverage. In the community, one would expect that most of this spending was incurred out-of-pocket or by undocumented sources (e.g., state pharmaceutical assistance plans). Unaccounted payor sources in LTCFs may be due to out-of-pocket, picked by the facilities themselves as unreimbursed expenses, or other sources From the data available, we could not assign a prescription coverage source to 2.3% of drug expenditures by Medicare beneficiaries.
Table 4 shows the breakdown of prescription expenditures by beneficiaries drug coverage status. Not surprisingly, in LTCFs, beneficiaries with Medicaid drug coverage accounted for the highest share, 52.3% or $2.81 billion, of total prescription drug expenditures. By contrast, in the community, beneficiaries with Medicaid drug coverage accounted for only 14.3% of total drug spending.
| FIGURE 2. Total Prescription Drug Spending by Medicare Beneficiaries by Prescription Coverage Source |
 |
| SOURCE: MCBS, 2001 |
There was variability observed in annual per user prescription drug spending across and within residential settings. On average, per user spending by LTCF residents was notably higher than by beneficiaries in the community. Expenditures for beneficiaries covered by Medicaid were higher in the facility setting than in the community ($2,188 versus $1,844); community expenditures were higher though for those beneficiaries with other sources of prescription coverage. The most marked difference was seen with individuals without known drug benefits; for beneficiaries living in facilities, $1,400 more was spent per user per year than their community-dwelling peers ($2,536 versus $1,128).
| TABLE 4. Total and Per User Prescription Drug Spending by Prescription Coverage Source, 2001 | ||||
| Prescription Coverage | Community | LTCF | ||
| Total Spending ($ in mill) | Spending Per User ($) | Total Spending ($ in mill) | Total Spending ($ in mill) | |
| Total | 49,448 | 1,559 | 5,364 | 2,077 |
| Medicaid | 7,049 | 1,844 | 2,807 | 2,188 |
| Other | 34,043 | 1,649 | 308 | 1,132 |
| Coverage Unknown | 268 | 557 | 1,067 | 1,899 |
| No Coverage | 8,088 | 1,128 | 1,182 | 2,536 |
| SOURCE: MCBS, 2001. | ||||
Examination of drug spending by therapeutic class also reveals considerable variation by prescription coverage source and residential setting (Table 5). In general, LTCF residents with other coverage had the lowest per user spending across therapeutic categories, while community-dwelling beneficiaries with no supplemental drug benefits spent the least on medications.
| TABLE 5. Per User Expenditures and Total Expenditures by Top 10 Therapeutic Categories and by Prescription Coverage Source and Residential Setting, 2001 | ||||||||||
| All Coverage Sources(N=41,216,778) | Medicaid Rx Coverage(N=6,001,375) | Other Rx Coverage(N=24,662,701) | Rx Coverage Unknown(N=789,846) | No Rx Coverage(N=9,762,855) | ||||||
| Per User Expenditures (Rank in Terms of Total Category Spending) | ||||||||||
| LTCF | COM | LTCF | COM | LTCF | COM | LTCF | COM | LTCF | COM | |
| CARDIOVASCULAR | 352.6 | 567.1 | 373.7 | 500.2 | 207.7 | 608.5 | 406.7 | 382.4 | 331.5 | 470.4 |
| CARDIAC DRUGS | 252.4 | 329.0 | 273.2 | 314.2 | 158.9 | 347.7 | 294.5 | 184.2 | 234.4 | 283.2 |
| DIURETICS | 98.9 | 94.5 | 104.3 | 92.5 | 38.0 | 97.6 | 115.2 | 62.7++ | 108.2 | 86.9 |
| GASTROINTESTINAL | 527.2 | 513.1 | 562.2 | 555.6 | 284.5 | 545.0 | 628.3 | 358.8++ | 493.7 | 356.2 |
| ANTI-ARTHRITICS | 333.3 | 321.6 | 331.3 | 291.2 | 311.7 | 355.4 | 352.2 | 395.4 | 330.8 | 229.9 |
| AUTONOMIC DRUGS | 472.8 | 241.3 | 502.4 | 230.4 | 298.1 | 256.6 | 587.7 | 156.0++ | 422.6 | 207.4 |
| ANTI-INFECTIVES | 81.2 | 77.5 | 89.1 | 92.5 | 67.7++ | 79.1 | 71.5 | 34.9++ | 76.8 | 66.5 |
| HORMONES | 271.6 | 193.9 | 294.5 | 208.6 | 174.0 | 198.1 | 348.8 | 230.2++ | 217.4 | 170.6 |
| PSYCHOTHERAPEUTIC DRUGS | 857.8 | 499.3 | 952.5 | 754.5 | 348.6 | 469.3 | 770.4 | 382.3 | 923.7 | 362.8 |
| ANALGESICS | 119.6 | 205.4 | 126.9 | 188.9 | 63.7 | 187.2 | 118.0 | 64.2 | 139.9 | 217.2++ |
| Total Expenditures (Overall and Top 10 Total and as Percent of Total Spending) | ||||||||||
| LTCF | COM | LTCF | COM | LTCF | COM | LTCF | COM | LTCF | COM | |
| All Therapeutic Categories ($ in millions) | 5,364 | 49,448 | 2,807 | 7,049 | 308 | 34,043 | 1,067 | 268 | 1,182 | 8,088 |
| Total Top 10 Spending ($ in millions) | 3,651 | 32,038 | 1,902 | 4,491 | 219 | 21,590 | 731 | 80 | 799 | 5,395 |
| Top 10 Categories as Percent of Total | 68.1% | 64.8% | 67.8% | 63.7% | 71.1% | 64.6% | 68.5% | 63.7% | 67.6% | 66.7% |
| SOURCE: MCBS, 2001. ++ Estimates considered unreliable due to RSE >0.30. | ||||||||||
Among LTCF residents, the therapeutic category that includes psychotherapeutic agents accounted for greatest spending, regardless of prescription coverage source. Within the institutionalized psychotherapeutic using group, mean psychotherapeutic expenditures per year ranged from a low of $348 per user for those with other coverage to $952 per user for those who had prescription drug coverage through Medicaid.
Cardiovascular medications comprised the therapeutic category with the highest per user expenditure among community-dwelling beneficiaries. There is less variability in the expenditures range for cardiovascular medication by prescription coverage source than seen with psychotherapeutic agents in LTCF residents. Indeed, mean per user expenditures for cardiovascular drugs in the community ranged from $470 for those with no evidence of supplemental prescription coverage to $609 for those with other coverage.
Top 10 drug spending as a proportion of total drug spending ranged from 63.7% (Community beneficiary with Medicaid prescription coverage) to 71.1% (LTCF beneficiary spending with other prescription drug benefit).
DISCUSSION
In 2001, 41.2 million Medicare beneficiaries spent more than $55 billion on prescription drugs. Of this amount, 9.9%, or $5.4 billion, was accounted for by the 2.7 million Medicare beneficiaries living in LTCFs. Spending for prescription drugs varies markedly by therapeutic category, prescription drug coverage source, and eligibility status, both within and across residential setting types. Absent diagnostic or functional assessment information, prescription drug spending appears to be largely driven by coverage source, with Medicaid being the largest payer of prescription drugs for beneficiaries residing in facility settings, and other (primarily private coverage) paying the lions share for community beneficiaries.
Much of this variation is likely related to the health status of individuals. As mentioned previously, beneficiaries residing in LTCFs are frailer, have more comorbidities, and more severity-of-illness than their counterparts residing in the community. It also is likely that health status varies with prescription coverage source as well. The eligibility criteria for Medicaid make it likely that individuals with private coverage supplementing Medicare are generally healthier than those with dual Medicare and Medicaid coverage. Examination of health status differences was not a focus of this Policy Brief; however, future work, using multivariate analysis to control for such differences, may be warranted to further explore the relationship to spending and utilization.
Significant variation in drug spending within and across residential settings also occurs by Medicare eligibility status. Individuals who qualify for Medicare on the basis of disability have a higher prevalence of physical and psychiatric comorbidities than those who are eligible based solely on age, thereby accounting for higher total and per user drug expenditures.
In general, the Top 10 therapeutic categories accounted for approximately two-thirds of all prescription drug spending in LTCFs and in the community. There was little variation in Top 10 spending when further stratified by eligibility status and prescription coverage source. However, there is considerable variation in the drug classes that comprise the Top 10 by prevalence of use and spending by residential setting. Once again, these differences reflect the older and frailer population inhabiting LTCFs. Thus, any efforts to modify patterns of use and spending of specific classes of prescription drugs by Medicare beneficiaries should consider the effect of residential setting. As this Policy Brief illustrates, there is significant variability in which categories are most frequently used; these differences are most notable when examined by source of coverage.
Prescription drug coverage through Medicare Part D has now been available for one year. These findings can provide a useful benchmark for examining prescription drug utilization and spending patterns by residential status post 2006. Most significant, it considers the LTCF and SSDI-eligible Medicare subpopulations, both of which are of considerable interest to policy-makers. This Policy Brief suggests these two populations, of which there is substantial overlap, may warrant further attention. The LTCF population uses markedly different medications, and spends considerably more per person. As seen in a previous Policy Brief analysis conducted by the authors, the considerable variation in drug use and spending within the different types of long-term care settings is, in large part, driven by the SSDI-eligible population.
LIMITATIONS
The findings presented in this Policy Brief should be considered in the context of several limitations. For one, the findings only are generalizable to Medicare beneficiaries, as the MCBS does not contain information on individuals who are not Medicare-eligible. As well, these data only include LTCF stays which are long-term (i.e., not short-term Medicare-qualified SNF stays).We also exclude facilities that do not have continuous (24/7) nursing care and centralized medication management; thus, our findings of prescription use and spending in assisted living and other facilities are likely to be underestimated.
As described previously, the manner in which information is collected and maintained on prescription drugs in the MCBS differs markedly according to whether beneficiaries reside in the community or a facility. Some of these differences make comparisons difficult; for example, it is impossible to directly compare most utilization measures in LTCF and the community. Because the facility prescription drug use data are derived from facility Medication Administration Record abstraction, the institutional drug data are far more detailed; at the community level, only number of fills is calculable. As such, the information supplied in the data may result in differences in the way the pricing algorithm, originally developed to provide estimates for community drug data, interprets facility drug utilization.
Finally, these data reflect usage and spending prior to enactment of the MMA. These findings may differ if the same methodology was applied to more current MCBS data.
CONCLUSIONS
This Policy Brief presents the first published national estimates comparing prescription drug expenditures by Medicare beneficiaries residing in LTCFs to their peers residing in the community. This analysis provides information on the socio-demographic differences of these two disparate populations, as well as compares prescription drug use and spending in the aggregate and stratified by Medicare eligibility status and prescription coverage source.
These findings provide a useful benchmark for policy-makers but further research and analysis may be useful, specifically: the use of multivariable methods which control for various covariates, including disease burden and severity-of-illness; decomposition of spending by use, price, and therapeutic mix; and the application of more sophisticated modeling techniques to better approximate projected prescription drug spending.
LIST OF REPORTS
Prescription Drug Spending by Medicare Beneficiaries in Institutional and Residential Settings, 1998-2001
HTML version: http://aspe.hhs.gov/daltcp/reports/2007/pdspend.htm
PDF version: http://aspe.hhs.gov/daltcp/reports/2007/pdspend.pdf
POLICY BRIEF #1: National Estimates of Prescription Drug Utilization and Expenditures in Long-Term Care Facilities
HTML version: http://aspe.hhs.gov/daltcp/reports/2006/pdnatest.htm
PDF version: http://aspe.hhs.gov/daltcp/reports/2006/pdnatest.pdf
POLICY BRIEF #2: A National Comparison of Prescription Drug Expenditures by Medicare Beneficiaries Living in the Community and Long-Term Care Facility Settings
HTML version: http://aspe.hhs.gov/daltcp/reports/2007/pdnatcom.htm
PDF version: http://aspe.hhs.gov/daltcp/reports/2007/pdnatcom.pdf
POLICY BRIEF #3: Drug Use and Spending for Medicare Beneficiaries During Part A Qualifying Skilled Nursing Facility Stays and Non-Qualifying Long-Term Care Facility Stays
HTML version: http://aspe.hhs.gov/daltcp/reports/2007/druguse.htm
PDF version: http://aspe.hhs.gov/daltcp/reports/2007/druguse.pdf
NOTES
-
Stuart B, Simoni-Wastila L, Shaffer T, Baysac F, Shea D. Coverage and Use of Prescription Drugs in Nursing Homes: Implications for the Medicare Modernization Act. Medical Care. March 2006, 44(3):243-249. Briesacher BA, Limcangco R, Simoni-Wastila L, Doshi JA, Levens SR, Shea DG, and Stuart B. The quality of antipsychotic prescribing in nursing homes. Archives of Internal Medicine. June 2005; 165:1280-1285. Briesacher B, Limcangco R, Simoni-Wastila L, Doshi J, Gurwitz J. Evaluation of nationally-mandated drug use reviews to improve patient safety in nursing homes: a natural experiment. Journal of the American Geriatric Society. June 2005; 53(6); 991-998. Simoni-Wastila L, Stuart B, and Shaffer T. Over-the-Counter drug use by Medicare beneficiaries in nursing homes: implications for practice and policy. Journal of the American Geriatrics Society. 2006;54:1543-1549. Also available online August 3, 2006 (http://www.blackwell-synergy.com/doi/abs/10.1111/j.1532-5415.2006.00870).
-
Simoni-Wastila L, Shaffer T, and Stuart B. National Estimates of Prescription Drug Utilization and Expenditures in Long-Term Care Facilities. Policy Brief submitted to ASPE, Department of Health and Human Services, October 25, 2006. Available online July 2007 (http://aspe.hhs.gov/daltcp/reports/2006/pdnatest.htm).
-
This effort was done in consultation with CMS.
-
First DataBank is a proprietary software system used to crosswalk NDCs of prescription pharmaceuticals to generic and brand drug names. It also uses a therapeutic classification system, which is used by the MCBS and the researchers for these analyses.
-
Simoni-Wastila L, Stuart B, and Shaffer T. Over-the-Counter drug use by Medicare beneficiaries in nursing homes: implications for practice and policy. Journal of the American Geriatrics Society. 2006;54:1543-1549. Available online August 3, 2006 (http://www.blackwell-synergy.com/doi/abs/10.1111/j.1532-5415.2006.00870).
-
Note: Analyses use data that precede the passage of the Medicare Prescription Drug, Improvement, and Modernization Act of 2005 (MMA).
-
Note that the fifth most expensive class of drugs is denoted as unclassified. This terminology reflects the fact that drugs are classified by name and not NDC code; if there are misspellings in the reported drug name or the drug is newly marketed and not listed in the First DataBank dictionary used for classification purposes it will be listed as unclassified. Three-quarters of the unclassified drugs in the 2001 PME file were bone marrow drugs (e.g., Fosamax) and agents used to treat urinary incontinence (e.g., Detrol and Proscar).