
U.S. Department of Health and Human Services
A Comparison of Demographic and Attitudinal Characteristics Among Active and Retired Buyers, Non-Buyers and Non-Responders to the Federal Long-Term Care Insurance Program
LifePlans, Inc.
August 2004
PDF Version (27 PDF pages)
This policy brief was prepared under contract between the U.S. Department of Health and Human Services (HHS), Office of Disability, Aging and Long-Term Care Policy (DALTCP) and LifePlans, Inc. For additional information about the study, you may visit the DALTCP home page at http://aspe.hhs.gov/_/office_specific/daltcp.cfm or contact the ASPE Project Officer, Hunter McKay, at HHS/ASPE/DALTCP, Room 424E, H.H. Humphrey Building, 200 Independence Avenue, SW, Washington, DC 20201. His e-mail address is: Hunter.McKay@hhs.gov.
I. BACKGROUND
One of the more ambitious proposals for encouraging growth in the private insurance market was the passage of the Long Term Care Security Act (Public Law 106-265). This act was passed in the summer of 2000 and was signed into law on September 19th of that year. It authorized the U.S. Office of Personnel Management (OPM) to contract for a long-term care (LTC) insurance program for federal employees. Medically underwritten coverage was made available to active federal employees and annuitants (civilian retirees), as well as active and retired members of the uniformed services. It was also made available to other qualified relatives, who would include current spouses of employees and annuitants, including surviving spouses of members and retired members of the uniformed services who are receiving a survivor annuity, adult children of living employees and annuitants, and parents, parents-in-law, and stepparents of living active employees. Because this coverage is medically underwritten, certain medical conditions prevented some people from being approved for coverage. OPM expected that, like the health and life insurance programs it administers, the Federal Long-Term Care Insurance Program (FLTCIP) would become the largest employer-sponsored LTC insurance program in the nation.
Naturally it was expected that implementation of the program would spur additional interest and growth in the market. The program began in earnest in July of 2002, which constituted the beginning of the open enrollment period. The carriers underwriting the program -- John Hancock and MetLife -- formed a joint venture called Long Term Care Partners, LLC, which is devoted exclusively to administering the Program.
Long Term Care Partners conducted one of the largest LTC educational campaigns ever. More than one million people requested enrollment kits. As of August 2003, 273,000 applications had been received. About 64% of enrollees were active employees and spouses, 31% annuitants and their spouses, and another 5% surviving spouses, parents/in-laws and adult children. Thus, in relatively short order, the FLTCIP became the largest group programs in the United States. In part this was due to the significant marketing and enrollment activities including more than 2,100 educational meetings, briefings to human resources staff and outreach programs to affinity groups.
The large number of enrollments affords a unique opportunity to better understand the attitudes and perspectives of both working and retired individuals regarding LTC concerns, the importance of planning, and the role that insurance may (or may not) play in meeting the needs of disabled individuals. An examination of such attitudes can assist policymakers as well as insurers to better understand marketplace opportunities and barriers, and devise strategies to encourage growth in the market.
II. PURPOSE
The purpose of this project is to analyze survey data collected by Long Term Care Partners from members of the federal family regarding the LTC insurance offering available to them. The analysis focuses on the attitudes, opinions and motivations of both active employees and retirees who have enrolled in the program ("buyers"), those who have expressed an interest in the program but chosen not to enroll ("non-buyers"), and those who are members of the federal family but have not enrolled or expressed any interest in doing so ("non-responders"). As part of this project, we also compare the results to available data from other studies of non-federal buyers and non-buyers in both the individual and group markets. In this way we are able to determine the extent to which there are significant differences, which could influence both the marketing and future design of LTC insurance. Finally, we examine specific issues within each of he three sample groups.
This is the fourth in a series of data briefs based on the information collected for the study of buyers, non-buyers, and non-responders to the FLTCIP. The purpose of this data brief is to compare the demographic and attitudinal characteristics of these groups. The analysis focuses on demographic characteristics, as well as on issues related to retirement planning, experience with LTC, and opinions about LTC insurance. Relevant research questions answered in this brief include (but are not limited to) the following:
- How do the demographic and employment characteristics of active and retired buyers, non-buyers and non-responders differ?
- What are the attitudes and opinions about retirement planning among active and retired buyers, non-buyers and non-responders?
- What are the similarities and/or differences in knowledge of LTC and insurance among the samples?
III. METHOD AND SAMPLE
We used mail surveys to collect information from active and retired buyers and non-buyers and from retired non-responders. An Internet survey was used for active non-responders. For purposes of this research, the active sample consists of federal employees who are actively working (in either the civilian, postal or military sectors of the government) and the retired sample consists of those federal family members who have retired from a civilian, military or postal position. A "buyer" is someone who has purchased the insurance plan through the federal program and paid premiums beyond the free look period. A "non-buyer" is defined as someone who expressed interest in the FLTCIP by requesting an information kit and application, but had not purchased the plan at the time we drew the sample. A "non-responder" is defined as someone who did not request an information kit or application and who was not enrolled in the FLTCIP at the time we drew the sample.1 Data was collect between the months of January 2003 and April 2003. Final sample sizes for analysis are as follows: 1,756 buyers (642 active and 1,114 retired), 1,161 non-buyers (575 active and 586 retired) and 7,357 non-responders (6,870 active and 487 retired).
The analyses are conducted separately for active and retired responders and all of the differences among the samples described in this brief are statistically significant at the five percent level or better.
IV. FINDINGS
A. Demographic and Employment Characteristics
1. Active Sample
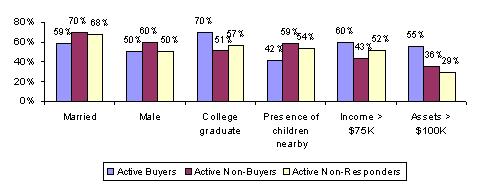
Figure 1 summarizes important demographic characteristics of the aggregate active sample. The majority of the active samples are married although a significantly smaller proportion of buyers are married. This could suggest that non-buyers and non-responders are more likely to think that their spouses will care for them or perhaps that unmarried buyers have more disposable income to spend on planning for the future. The gender distribution in the active sample closely reflects the distribution of active Federal Government employees, where half of the active buyers and non-responders are male, while 60 percent of active non-buyers are male. Active buyers are also more highly educated than non-buyers and non-responders.
| Figure 1: Demographic Characteristics of Active Buyers, Non-Buyers and Non-Responders |
 |
| Source: Analysis of data from the Federal Long-Term Care Insurance Program, 2003. |
Interestingly, buyers are significantly less likely to have children living nearby, even though they are the same age as non-buyers and older than non-responders -- the average age of active buyers and non-buyers is 53, while non-responders are on average 46 years old. Buyers are also wealthier than non-buyers and non-responders in both income and assets with an average income of $86,929 and average liquid assets of $201,176. Both buyers and non-buyers have been employed by the Federal Government for an average of 23 years. Active non-buyers in this sample have the lowest average income of $73,912, which is somewhat surprising. One would have expected that non-buyers, who have investigated the insurance but chosen not to buy, would have more income than non-responders, but such is not the case. Non-responders do, however, have the lowest asset levels -- an average of $135,359 -- and they have been federal employees for the shortest length of time, with an average of 19 years.
The general demographic profile of buyers does confirm what is already known in the literature -- buyers are traditionally older, less likely to have children living nearby, tend to be better educated and to be wealthier.
2. Retired Sample
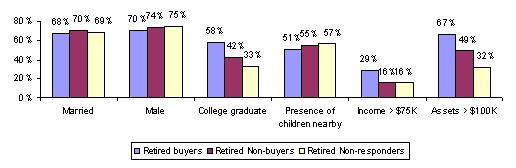
There is no statistical difference in the marital and gender profile across the sub-groups of the retired sample (see Figure 2) -- the majority of all three samples is male and married. As with the active sample, the buyers are more educated than the non-buyers and non-responders, with the majority of buyers having a college education. On the whole, retired non-buyers are also more educated than non-responders. There is no difference in the proportion of respondents who have children living nearby in this sample. There are however, dramatic differences in the income and asset profile of retired buyers -- they have higher income and asset levels (average income is $64,796 and average assets are $209,405) than non-buyers and non-responders. Here again, it seems to be the asset profile that distinguishes the non-buyers from the non-responders. This suggests that either those who would seriously consider the insurance must first have a level of assets that can generate additional income to pay for the premiums, or they must have a sufficient level of assets that they deem worth protecting through the purchase of LTC insurance.
| Figure 2: Demographic Characteristics of Retired Buyers, Non-Buyers and Non-Responders |
 |
| Source: Analysis of data from the Federal Long-Term Care Insurance Program, 2003. |
Retired buyers and non-buyers had worked for the Federal Government for about the same amount of time -- 28 and 27 years respectively, while retired non-responders were employed by the Federal Government for 25 years.
Although the retired sample may be retired from their positions with the Federal Government, it is clear from our past research that many "retired" people are still working either full- or part-time. We asked respondents in the retired sample if they were currently working, and about one out of every three retired buyers and non-responders indicated that they are working either full or part-time, while a significantly lower percentage, 23% of non-buyers are working full- or part-time.
B. Attitudes and Opinions about Retirement Planning and LTC
One thing that we know from previous briefs is that federal employees as a whole seem to be active in planning for their retirement and understand the potential LTC risks associated with later life. One would expect that buyers would at least be most likely to feel confident about their planning for both retirement and LTC and more likely to be concerned about be prepared for future LTC needs. We asked a series of questions designed to illuminate differences between buyers, non-buyers and non-responders regarding these issues.
1. Active Sample
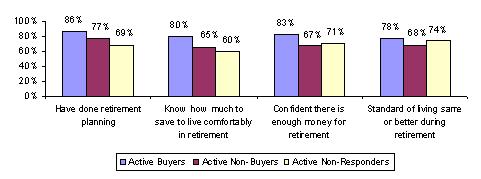
Figure 3 shows that a significantly higher percentage of active buyers (than both active non-buyers and active non-responders) have engaged in retirement planning, know how much to save to live well in retirement, are confident that there is enough money for retirement and believe that their standard of living will be the same or better during retirement.
| Figure 3: Attitudes and Opinions About Retirement Planning, Active Sample |
 |
| Source: Analysis of data from the Federal Long-Term Care Insurance Program, 2003. |
In addition, buyers have given significantly more thought to paying for LTC expenses, and are more likely to have considered LTC insurance as a very important part of their retirement planning. Further, buyers are significantly more likely than non-buyers and non-responders to strongly agree that it is important to plan now for the possibility of needing LTC services in the future. It is difficult to know with certainty whether these attitudes led to the purchase of the insurance or whether they were formed during the and after the education process and purchase decision.
In past research, one factor that has distinguished buyers from non-buyers is their knowledge of potential payment sources for LTC. The insurance industry has invested heavily in educating consumers about LTC financing and there was an extensive educational campaign for the federal program. In order to gauge the effectiveness of that education, we asked buyers, non-buyers and non-responders that they believe would pay for LTC if they ever needed it.
Figure 4 shows that a relatively small proportion of active employees believe that public programs would pay for their LTC needs. As expected, active buyers are more likely than non-buyers and non-responders to say that (in the absence of their policy) they would pay for LTC costs with their own income. A significantly higher proportion of non-buyers and non-responders believe (erroneously) that they will be able to use their FEHB or some other health plan to pay for LTC; it is surprising that almost one-third of buyers also believed that in the absence of their LTC policy, they would be able to use their health plan to pay for care. As expected, more non-buyers and non-responders do not know how they would pay for LTC if it were needed.
| Figure 4: How Active Sample Would Pay for the Costs of LTC if Needed |
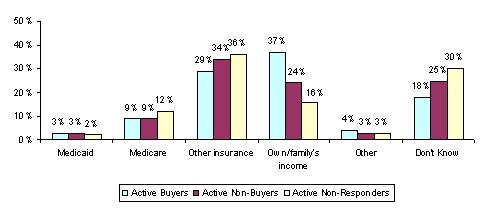 |
| Source: Analysis of data from the Federal Long-Term Care Insurance Program, 2003. Percentages do not add to 100 as some categories were omitted. |
Overall, active buyers are much more likely than active non-buyers and non-responders to have done retirement planning, to have thought about and considered LTC insurance an important part of their retirement planning and to be educated about potential payment sources for LTC needs.
2. Retired Sample
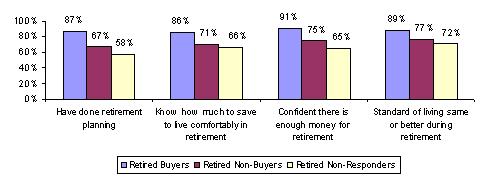
Similar to the active sample, the majority of retired federal employees prepared for retirement. Figure 5 shows that, overall, buyers have given more thought and are more confident about their retirement than non-buyers and non-responders.
Further, retired buyers are more likely to strongly agree that it is important to plan now for the possibility of needing LTC services in the future and they are also more likely to have given more thought to paying for LTC. Like actives, retired buyers seem to be more future-oriented in terms of thinking about retirement planning, about the role of LTC insurance in that planning, and about paying for LTC expenses. This forward-looking behavior could have given buyers that extra push to buy LTC insurance while non-buyers (who at least requested an application and information) did not take that final step of submitting the application and paying the premium.
| Figure 5: Attitudes and Opinions About Retirement Planning, Retired Sample |
 |
| Source: Analysis of data from the Federal Long-Term Care Insurance Program, 2003. |
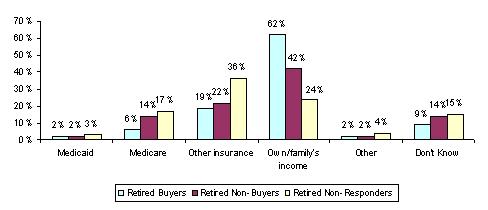
Understandably, in the aggregate, the retired sample seems to have given more thought to how they would pay for LTC if needed; only a relatively small percentage of the three samples stated they did not know how they would pay for potential care if needed (see Figure 6). Again, a significantly higher percentage of buyers believe that in the absence of their policy, they would have to use their own or their family's income to pay for care if needed. Retired non-responders, much like active non-responders, are more likely to incorrectly believe that their own health insurance and retiree health care plan will cover their LTC expenses.
| Figure 6: How Retired Sample Would Pay for the Costs of LTC if Needed |
 |
| Source: Analysis of data from the Federal Long-Term Care Insurance Program, 2003. Percentages do not add to 100 as some categories were omitted. |
C. Experience with LTC
Many times one hears LTC insurance advocates talk about their personal experiences with LTC. It is a commonly held view that one motivating factor for purchasing insurance is a person's personal experience with either providing care for an elderly parent or trying to find a way to pay for care for a loved one. We asked active and retired employees whether they had had any of several experiences regarding LTC to see if there was a significant difference among the sample groups.2
1. Active Sample
Interestingly, there were no differences regarding personal LTC experience between the buyers and the non-buyers in the active sample. Equal proportions had a parent, close friend or family member who needed care, had been a caregiver and/or knew someone who had experienced financial hardship or used most of their savings to pay for care. Most of the active sample's exposure to LTC appears to have been financial (knowing someone who had experienced financial hardship or used most of their savings to pay for care).
2. Retired Sample
The retired sample seems to have had more personal experience with LTC in that higher proportions have had a friend, spouse or parent who had needed care. A significantly higher proportion of retired buyers (61%) had a parent that needed care, but oddly, a lower proportion of buyers have been a caregiver. One explanation for this may be that buyers are significantly younger than non-buyers in this sample. Overall, it seems that experience with LTC may not be as decisive a factor in the buy-non-buy decision for these federal family members.
D. Experience with the Application Process
One way to view the non-buyer sample is that many of them are "potential future buyers" who have not made the commitment to apply for a policy. Both retired and active non-buyers requested information and an application and many of them may have had questions about the application, the insurance, etc. One thing that could distinguish the buyers from the non-buyers is their experience with the application process. Was it easy or difficult? Did non-buyers have a harder time understanding the application or getting their questions answered? We asked both buyers and non-buyers a series of questions about their experiences with the application process.
1. Active Sample
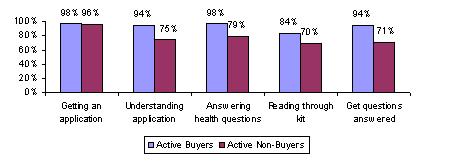
Figure 7 summarizes the proportion of active buyers and non-buyers who found the various application-related activities either very easy or easy. As shown, overall, the vast majority of the active buyers and non-buyers found the process to be easy. In fact, almost everyone who requested an application received one. However, once received, non-buyers had a more difficult time reading through and understanding the materials, as well as answering the health questions. They also were significantly less likely to get their questions answered easily. These finding would suggest that overall experience with the application process likely has an effect on the ultimate buying decision.
| Figure 7: Proportion of Active Buyers and Non-Buyers Who Found Application Process Activities Easy |
 |
| Source: Analysis of data from the Federal Long-Term Care Insurance Program, 2003. Respondents who indicated they did not do an activity were removed from the analysis. |
2. Retired Sample
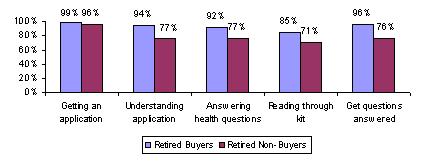
Figure 8 shows that the majority of the retired sample also seemed to find the application process an easy one, however the same significant differences are evident with respect to buyers and non-buyers, again suggesting that experience with the application process likely affects the buying decision.
| Figure 8: Proportion of Retired Buyers and Non-Buyers Who Found Application Process Activities Easy |
 |
| Source: Analysis of data from the Federal Long-Term Care Insurance Program, 2003. Respondents who indicated they did not do an activity were removed from the analysis. |
V. CONCLUSIONS
For the most part, the differences between buyers, non-buyers and non-responders of the FLTCIP are those one would expect. Active buyers are traditionally older, less likely to have children living nearby, and tend to be better educated and to be wealthier, while retired buyers are younger (than retired non-buyers and non-responders), more educated and wealthier.
In terms of retirement planning, active buyers are much more likely than active non-buyers and non-responders to have done retirement planning, to have considered LTC insurance an important part of their retirement planning and to have thought more about paying for LTC expenses. Retired buyers, like active buyers, are more future-oriented in terms of thinking about retirement planning, about the role of LTC insurance in that planning and about paying for LTC expenses.
One important finding is that both active and retired non-buyers had a more difficult time understanding the application materials and getting their questions answered. If we view non-buyers as "potential future buyers" who have just not yet made the purchase decision, then helping them understand the application and assisting them with the process may make a difference in terms of their buying behavior, enabling them to make the commitment to purchasing the federal LTC insurance.
NOTES
-
For the purposes of this brief, respondents who filled out non-buyer and non-responder surveys but indicated that they have LTC insurance (other than the FLTCIP) have been placed in the "buyer" category.
-
See Appendix at the end of this brief for complete results and proportions.
APPENDIX
Notes for Tables
Unless otherwise indicated, the analysis of the data is based on the responses of 642 active buyers, 575 active non-buyers, 6870 non-responders, 1114 retired buyers, 586 retired non-buyers and 487 retired non-responders.
All significance tests are based on 5% level or better. Notations for significance are as follows: If one category out of three contains the symbol (*), then the category starred is statistically different from each of the other two categories, but the non-starred categories are not different from each other. If two categories out of the three contain the symbol (*), then those two categories are statistically different from each other, but each of those categories is not statistically different from the third one. If all three categories contain the symbol (*), then all three are statistically different from each other.
Unless otherwise specified, only the response category that has a notation of significance was tested against all other categories. In some cases, it was determined that a combination of categories would be tested. These are indicated in the footnotes or by brackets in the table itself (Table 5 and Table 6). It also may be the case that if categories were or were not combined, it would change the results of the test of significance.
Unless otherwise indicated, only the first response category (i.e., strongly agree, very important, very likely, etc.) or the yes response was tested. Therefore, if there are no notations for significance, the test was not significant at the 5% level.
For the purpose of the analyses in Tables 5 through 11 active non-buyers and non-responders and retired non-buyers and non-responders of the FLTCIP that have LTCI with another company are considered to be buyers. The sample sizes (only for those tables mentioned above) for the adjusted six samples are: 989 active buyers, 516 active non-buyers, 6582 active non-responders, 1264 retired buyers, 479 retired non-buyers and 444 retired non-responders.
| TABLE 1: Socio-Demographic Characteristics of Active Buyers, Non-Buyers and Non-Responders1 | |||
| Socio-Demographic Characteristics | ActiveBuyers | ActiveNon-Buyers | ActiveNon-Responders |
| Average age | 53 | 53 | 46* |
| Less than 40 | 7% | 10% | 24% |
| 40 to 44 | 7 | 10 | 15 |
| 45 to 49 | 13 | 14 | 17 |
| 50 to 54 | 25 | 24 | 22 |
| 55 to 59 | 26 | 19 | 15 |
| 60 to 64 | 15 | 10 | 5 |
| 65 and over | 7 | 13 | 2 |
| Gender | |||
| Male | 50 | 60* | 50 |
| Female | 50 | 40 | 50 |
| Marital status | |||
| Never Married | 17 | 10 | 14 |
| Married | 59* | 70 | 68 |
| Divorced/separated | 18 | 16 | 14 |
| Widowed | 4 | 3 | 2 |
| Domestic Partner | 2 | 1 | 2 |
| Presence of children living within 25 miles | |||
| Yes | 42* | 59 | 54 |
| No | 58 | 41 | 46 |
| Educational level | |||
| Less than high school graduate | 0 | 1 | 0 |
| High school graduate | 6 | 13 | 9 |
| Technical/trade/business school | 4 | 5 | 5 |
| Some college | 20 | 30 | 29 |
| College graduate2 | 37* | 28 | 36 |
| Graduate degree | 33 | 23 | 21 |
| Average income3 | $86,929* | $73,912* | $79,443* |
| Less than $15,000 | 0 | 1 | 0 |
| $15,000 to $24,999 | 0 | 1 | 1 |
| $25,000 to $34,999 | 3 | 5 | 4 |
| $35,000 to $39,999 | 2 | 6 | 5 |
| $40,000 to $49,999 | 8 | 14 | 8 |
| $50,000 to $59,999 | 9 | 13 | 10 |
| $60,000 to $69,999 | 10 | 10 | 11 |
| $70,000 to $74,999 | 8 | 7 | 9 |
| $75,000 to $99,999 | 23 | 20 | 23 |
| $100,000 to $124,999 | 15 | 13 | 15 |
| $125,000 or more | 22 | 10 | 14 |
| Average liquid assets3 | $201,176* | $161,433* | $135,359* |
| Less than $10,000 | 7 | 17 | 22 |
| $10,000 to $19,999 | 3 | 8 | 10 |
| $20,000 to $29,999 | 5 | 7 | 9 |
| $30,000 to $49,999 | 10 | 12 | 14 |
| $50,000 to $74,999 | 13 | 12 | 10 |
| $75,000 to $99,999 | 7 | 8 | 6 |
| $100,000 to $124,999 | 8 | 7 | 6 |
| $125,000 to $149,999 | 6 | 5 | 3 |
| $150,000 to $199,999 | 9 | 4 | 5 |
| $200,000 to $249,999 | 10 | 4 | 4 |
| $250,000 and above | 22 | 16 | 11 |
| Home ownership | |||
| Yes | 90 | 86 | 80* |
| No | 10 | 14 | 20 |
| |||
| TABLE 2: Socio-Demographic Characteristics of Retired Buyers, Non-Buyers and Non-Responders | |||
| Socio-Demographic Characteristics | RetiredBuyers | RetiredNon-Buyers | RetiredNon-Responders |
| Average age | 66 | 71* | 67 |
| Less than 50 | 1% | 2% | 11% |
| 50 to 54 | 3 | 3 | 7 |
| 55 to 59 | 14 | 7 | 10 |
| 60 to 64 | 24 | 12 | 12 |
| 65 and over | 58 | 76 | 60 |
| Gender | |||
| Male | 70 | 74 | 75 |
| Female | 30 | 26 | 25 |
| Marital status | |||
| Never Married | 9 | 4 | 4 |
| Married | 68 | 70 | 69 |
| Divorced/separated | 10 | 8 | 9 |
| Widowed | 12 | 18 | 17 |
| Domestic Partner | 1 | 0 | 1 |
| Presence of children living within 25 miles | |||
| Yes | 51 | 55 | 57 |
| No | 49 | 45 | 43 |
| Educational level | |||
| Less than high school graduate | 1 | 3 | 5 |
| High school graduate | 14 | 17 | 24 |
| Technical/trade/business school | 5 | 8 | 9 |
| Some college | 22 | 30 | 29 |
| College graduate | 30* | 24* | 21* |
| Graduate degree | 28 | 18 | 12 |
| Average income1 | $64,796* | $50,901 | $49,227 |
| Less than $15,000 | 1 | 4 | 6 |
| $15,000 to $24,999 | 3 | 13 | 14 |
| $25,000 to $34,999 | 8 | 12 | 16 |
| $35,000 to $39,999 | 9 | 15 | 12 |
| $40,000 to $49,999 | 15 | 16 | 13 |
| $50,000 to $59,999 | 15 | 12 | 14 |
| $60,000 to $69,999 | 12 | 8 | 5 |
| $70,000 to $74,999 | 8 | 4 | 4 |
| $75,000 to $99,999 | 16 | 10 | 7 |
| $100,000 to $124,999 | 7 | 3 | 4 |
| $125,000 or more | 6 | 3 | 5 |
| Average liquid assets1 | $209,405* | $169,730* | $138,520* |
| Less than $10,000 | 4 | 11 | 23 |
| $10,000 to $19,999 | 3 | 6 | 9 |
| $20,000 to $29,999 | 3 | 7 | 8 |
| $30,000 to $49,999 | 7 | 12 | 12 |
| $50,000 to $74,999 | 9 | 9 | 9 |
| $75,000 to $99,999 | 7 | 6 | 7 |
| $100,000 to $124,999 | 8 | 6 | 7 |
| $125,000 to $149,999 | 6 | 5 | 3 |
| $150,000 to $199,999 | 9 | 8 | 5 |
| $200,000 to $249,999 | 7 | 6 | 5 |
| $250,000 and above | 37 | 24 | 12 |
| Home ownership | |||
| Yes | 92 | 90 | 83* |
| No | 8 | 10 | 17 |
| |||
| TABLE 3: Employment Characteristics of Active Buyers, Non-Buyers and Non-Reponders | |||
| Employment Characteristics | ActiveBuyers | ActiveNon-Buyers | ActiveNon-Responders |
| Average number of years working for the Federal Government | 23 | 23 | 19* |
| Currently is: | |||
| Civilian employee | 96% | 92% | 94% |
| Member of the uniformed services | 4 | 8 | 6 |
| TABLE 4: Employment Characteristics of Retired Buyers, Non-Buyers and Non-Reponders | |||
| Employment Characteristics | RetiredBuyers | RetiredNon-Buyers | RetiredNon-Responders |
| Average number of years worked for the Federal Government | 28 | 27 | 25* |
| Currently working | |||
| Yes | 29% | 23% | 32% |
| Part time | 13 | 13 | 24 |
| Full time | 16 | 10 | 8 |
| No | 71 | 77 | 68 |
| While working for the Federal Government was: | |||
| Civilian employee | 79* | 70* | 54* |
| Member of the uniformed services | 21 | 30 | 46 |
| TABLE 5: Attitudes and Opinions About Retirement Planning and LTC Among Active Buyers, Non-Buyers and Non-Responders1 | ||||||
| Attitudes and Opinions | ActiveBuyers | ActiveNon-Buyers | ActiveNon-Responders | |||
| Average age at which plan to retire | 61 | 61 | 60 | |||
| Done retirement planning | ||||||
| Yes | 86%* | 77%* | 69%* | |||
| No | 14 | 23 | 31 | |||
| Determined how much to save to live comfortably in retirement | ||||||
| Yes, a definite sense2 | 24* | 16 | 13 | |||
| Yes, a general sense | 56 | 49 | 47 | |||
| No | 19 | 33 | 38 | |||
| Do not plan to retire | 1 | 2 | 2 | |||
| Confident that there is enough money to live comfortably in retirement | ||||||
| Very confident | 21* | 13 | 13 | |||
| Somewhat confident | 62 | 54 | 58 | |||
| Not very confident | 12 | 24 | 20 | |||
| Not at all confident | 3 | 7 | 8 | |||
| Do nto plan to retire | 2 | 2 | 1 | |||
| Standard of living during retirement wil be | ||||||
| Better than during worknig years | 8 | 8 | 10 | |||
| Same as working years | 70 | 60 | 64 | |||
| Worse than during working | 20 | 30 | 24 | |||
| Do not plan to retire | 2 | 2 | 2 | |||
| Thought given to paying for LTC expenses | ||||||
| A great deal | 57* | 21* | 9* | |||
| Some | 33 | 51 | 43 | |||
| Not much thought | 8 | 23 | 36 | |||
| No thought at all | 2 | 5 | 12 | |||
| How important is LTC insurance to retirement planning | ||||||
| Very important | 57* | 25* | 13* | |||
| Somewhat important | 38 | 54 | 43 | |||
| Not very important | 4 | 15 | 27 | |||
| Not at all important | 0 | 1 | 6 | |||
| Have not starting planning | 1 | 5 | 11 | |||
| I worry how to pay for LTC3 | ||||||
| Strongly agree | 16 | 18 | 10* | |||
| Agree | 42 | 45 | 39 | |||
| Disagree | 32 | 31 | 40 | |||
| Strongly disagree | 10 | 6 | 11 | |||
| It is important to plan now for the possibility of needing LTC services in the future | ||||||
| Strongly agree | 51* | 24* | 15* | |||
| Agree | 44 | 58 | 59 | |||
| Disagree | 3 | 16 | 22 | |||
| Strongly disagree | 2 | 2 | 4 | |||
| LTC insurance programs sold today will cover the cost of LTC services needed in the future | ||||||
| Strongly agree | 9* |  78* 78* | 3 | 41* | 2 | 34* |
| Agree | 67 | 38 | 32 | |||
| Disagree | 21 | 49 | 52 | |||
| Strongly disagree | 3 | 10 | 14 | |||
| How would LTC costs be paid3 | ||||||
| Medicaid | 3 | 3 | 2 | |||
| Medicare | 9 | 9 | 12 | |||
| Medigap Supplement Policy | 1 | 1 | 1 | |||
| Own health insurance or retiree health care plan | 28* | 33 | 35* | |||
| Own income | 36* | 23* | 15* | |||
| Children will help pay | 1 | 1 | 1 | |||
| Other | 4 | 3 | 3 | |||
| LTC insurance | --- | 2 | 1 | |||
| Don't know | 18* | 25 | 30* | |||
| ||||||
| TABLE 6: Attitudes and Opinions About Retirement Planning and LTC Among Retired Buyers, Non-Buyers and Non-Responders1 | ||||||
| Attitudes and Opinions | RetiredBuyers | RetiredNon-Buyers | RetiredNon-Responders | |||
| Average number of years since retirement from the Federal Government2 | 9* | 12 | 12 | |||
| Within the last 2 years | 7% | 4% | 5% | |||
| Between 2 and 5 years ago | 20 | 12 | 14 | |||
| Between 6 and 10 years ago | 29 | 17 | 18 | |||
| Between 10 and 15 years ago | 19 | 20 | 23 | |||
| More than 15 years ago | 25 | 47 | 41 | |||
| Done retirement planning | ||||||
| Yes | 87* | 67* | 58* | |||
| No | 13 | 33 | 42 | |||
| Determined how much to save to live comfortably in retirement | ||||||
| Yes, a definite sense | 28* | 17 | 14 | |||
| Yes, a general sense | 58 | 54 | 52 | |||
| No | 14 | 29 | 34 | |||
| Confident that there is enough money to live comfortably in retirement | ||||||
| Very confident | 32* | 20 | 16 | |||
| Somewhat confident | 59 | 55 | 49 | |||
| Not very confident | 8 | 15 | 23 | |||
| Not at all confident | 1 | 10 | 12 | |||
| Standard of living during retirement wil be | ||||||
| Better than during worknig years | 18 | 17 | 14 | |||
| Same as working years | 71 | 60 | 58 | |||
| Worse than during working | 11 | 23 | 28 | |||
| Thought given to paying for LTC expenses | ||||||
| A great deal | 66* | 26* | 13* | |||
| Some | 32 | 56 | 40 | |||
| Not much thought | 2 | 15 | 31 | |||
| No thought at all | 0 | 3 | 16 | |||
| How important is LTC insurance to retirement planning | ||||||
| Very important | 59* | 97 | 20 | 65* | 15 | 54* |
| Somewhat important | 39 | 45 | 39 | |||
| Not very important | 2 | 22 | 22 | |||
| Not at all important | 0 | 5 | 9 | |||
| Have not starting planning | 0 | 8 | 15 | |||
| I worry how to pay for LTC3 | ||||||
| Strongly agree | 17 | 69* | 21 | 68 | 19 | 62* |
| Agree | 52 | 47 | 42 | |||
| Disagree | 26 | 26 | 31 | |||
| Strongly disagree | 5 | 6 | 8 | |||
| It is important to plan now for the possibility of needing LTC services in the future | ||||||
| Strongly agree | 48* | 25 | 21 | |||
| Agree | 51 | 60 | 57 | |||
| Disagree | 1 | 13 | 18 | |||
| Strongly disagree | 0 | 2 | 4 | |||
| LTC insurance programs sold today will cover the cost of LTC services needed in the future | ||||||
| Strongly agree | 10* | 79* | 3 | 36* | 1 | 24* |
| Agree | 69 | 33 | 23 | |||
| Disagree | 19 | 47 | 58 | |||
| Strongly disagree | 2 | 17 | 18 | |||
| How would LTC costs be paid3 | ||||||
| Medicaid | 2 | 2 | 3 | |||
| Medicare | 6 | 14 | 17 | |||
| Medigap Supplement Policy | 1 | 2 | 1 | |||
| Own health insurance or retiree health care plan | 18 | 22 | 36* | |||
| Own income | 62* | 42* | 24* | |||
| Children will help pay | 0 | 0 | 0 | |||
| Other | 2 | 2 | 4 | |||
| LTC insurance | --- | 2 | 0 | |||
| Don't know | 9 | 14 | 15 | |||
| ||||||
| TABLE 7: Experience with LTC Among Active Buyers, Non-Buyers and Non-Responders1 | |||
| Experiences with LTC | ActiveBuyers | ActiveNon-Buyers | ActiveNon-Responders |
| Respondent needed LTC | |||
| Yes | 1% | 1% | 1% |
| No | 99 | 99 | 99 |
| Spouse needed LTC | |||
| Yes | 2 | 1 | 1 |
| No | 98 | 99 | 99 |
| Parent needed LTC | |||
| Yes | 56* | 54 | 49* |
| No | 44 | 46 | 51 |
| Close friend needed LTC | |||
| Yes | 8 | 7 | 7 |
| No | 92 | 93 | 93 |
| The respondent has been a caregiver | |||
| Yes | 26 | 25 | 22 |
| No | 74 | 75 | 78 |
| The respondent knew someone who used most of his/her assets to pay for LTC | |||
| Yes | 54* | 48 | 42* |
| No | 46 | 52 | 58 |
| The respondent has experienced financial hardship as a result of caring for an elderly relative | |||
| Yes | 8 | 9 | 7 |
| No | 92 | 91 | 93 |
| The respondent knew someone who has experienced financial hardship as a result of caring for an elderly relative | |||
| Yes | 44 | 41 | 34* |
| No | 56 | 59 | 66 |
| |||
| TABLE 8: Experience with LTC Among Retired Buyers, Non-Buyers and Non-Responders1 | |||
| Experiences with LTC | RetiredBuyers | RetiredNon-Buyers | RetiredNon-Responders |
| Respondent needed LTC | |||
| Yes | 1%* | 2% | 3% |
| No | 99 | 98 | 97 |
| Spouse needed LTC | |||
| Yes | 3 | 6* | 3 |
| No | 97 | 94 | 97 |
| Parent needed LTC | |||
| Yes | 61* | 49 | 45 |
| No | 39 | 51 | 55 |
| Close friend needed LTC | |||
| Yes | 11 | 14 | 10 |
| No | 89 | 86 | 90 |
| The respondent has been a caregiver | |||
| Yes | 31* | 38* | 31 |
| No | 69 | 62 | 69 |
| The respondent knew someone who used most of his/her assets to pay for LTC | |||
| Yes | 56* | 50 | 46* |
| No | 44 | 50 | 54 |
| The respondent has experienced financial hardship as a result of caring for an elderly relative | |||
| Yes | 5* | 9 | 10* |
| No | 95 | 91 | 90 |
| The respondent knew someone who has experienced financial hardship as a result of caring for an elderly relative | |||
| Yes | 37 | 37 | 40 |
| No | 63 | 63 | 60 |
| |||
| TABLE 9: Self-assessed Risk of Needing LTC Among Active Buyers, Non-Buyers and Non-Responders1 | |||
| Type of LTC | ActiveBuyers | ActiveNon-Buyers | ActiveNon-Responders |
| How likely is it that: | |||
| a) the respondent thinks he/she will need help with everyday activities such as bathing and dressing | |||
| Very likely | 11% | 10% | 6%* |
| Likely | 16 | 14 | 12 |
| Somewhat likely | 40 | 35 | 33 |
| Not very likely | 26 | 30 | 34 |
| Not at all likely | 7 | 11 | 15 |
| b) the respondent thinks he/she will need home care services for more than three months | |||
| Very likely | 11* | 10 | 6* |
| Likely | 19 | 14 | 13 |
| Somewhat likely | 42 | 39 | 33 |
| Not very likely | 22 | 28 | 34 |
| Not at all likely | 6 | 9 | 14 |
| c) the respondent thinks he/she will need nursing home care for more than three months | |||
| Very likely | 11 | 10 | 6* |
| Likely | 16 | 13 | 12 |
| Somewhat likely | 39 | 34 | 31 |
| Not very likely | 25 | 31 | 35 |
| Not at all likely | 9 | 12 | 16 |
| d) the respondent thinks he/she will need care provided in assisted living facility for more than three months | |||
| Very likely | 14* | 10 | 7* |
| Likely | 20 | 16 | 14 |
| Somewhat likely | 38 | 37 | 32 |
| Not very likely | 21 | 27 | 31 |
| Not at all likely | 7 | 10 | 16 |
| |||
| TABLE 10: Self-assessed Risk of Needing LTC Among Retired Buyers, Non-Buyers and Non-Responders1 | |||
| Type of LTC | RetiredBuyers | RetiredNon-Buyers | RetiredNon-Responders |
| How likely is it that: | |||
| a) the respondent thinks he/she will need help with everyday activities such as bathing and dressing | |||
| Very likely | 8%* | 13% | 13% |
| Likely | 17 | 18 | 12 |
| Somewhat likely | 45 | 38 | 36 |
| Not very likely | 24 | 24 | 27 |
| Not at all likely | 6 | 7 | 12 |
| b) the respondent thinks he/she will need home care services for more than three months | |||
| Very likely | 7* | 12 | 12 |
| Likely | 18 | 18 | 14 |
| Somewhat likely | 47 | 39 | 33 |
| Not very likely | 22 | 23 | 29 |
| Not at all likely | 6 | 8 | 12 |
| c) the respondent thinks he/she will need nursing home care for more than three months | |||
| Very likely | 6* | 11* | 10 |
| Likely | 16 | 14 | 11 |
| Somewhat likely | 44 | 37 | 32 |
| Not very likely | 27 | 27 | 31 |
| Not at all likely | 7 | 11 | 16 |
| d) the respondent thinks he/she will need care provided in assisted living facility for more than three months | |||
| Very likely | 9 | 11 | 11 |
| Likely | 20 | 15 | 13 |
| Somewhat likely | 45 | 39 | 34 |
| Not very likely | 20 | 25 | 29 |
| Not at all likely | 6 | 10 | 13 |
| |||
| TABLE 11: Nursing Home Experience Awareness Among Retired Buyers, Non-Buyers and Non-Responders1 | |||
| Awareness Measure | RetiredBuyers | RetiredNon-Buyers | RetiredNon-Responders |
| How long no average do people spend in a nursing home | |||
| About 1 month | 1% | 0% | 1% |
| Between 2 and 6 months | 8 | 9 | 11 |
| Between 7 and 11 months | 10 | 11 | 9 |
| Between 1 and 3 years | 63* | 47 | 40 |
| Between 4 and 6 years | 9 | 12 | 10 |
| More than 7 years | 1 | 4 | 6 |
| Don't know | 8* | 17* | 23* |
| Average nursing home care cost per month2 | $3,598* | $3,373 | $3,313 |
| $1,000 or less | 0 | 1 | 2 |
| $1,001 to $2,000 | 7 | 13 | 8 |
| $2,001 to $3,000 | 20 | 20 | 27 |
| $3,001 to $4,000 | 37 | 30 | 21 |
| $4,001 to $5,000 | 18 | 15 | 10 |
| $5,001 to $6,000 | 7 | 4 | 5 |
| $6,001 or more | 5 | 4 | 4 |
| Don't know | 6* | 13* | 23* |
| |||
| TABLE 12: Experience with the Application Process Among Active Buyers and Non-Buyers | ||
| Experience with the Application Process | ActiveBuyers | ActiveNon-Buyers |
| How easy/difficult did the application look to complete | ||
| Never looked at the application | 36% | |
| Looked easy to complete | 51 | |
| Looked difficult to complete | 13 | |
| How easy/difficult was the application process | ||
| Very easy | 57% | |
| Easy | 40 | |
| Difficult | 3 | |
| Very difficult | 0 | |
| Was the following easy/difficult for you:1 | ||
| a) getting an application | ||
| Did not get an application | 0 | 21 |
| Did get an application | 100 | 79 |
| Easy to get an application | 98 | 96 |
| Difficult to get an application | 2 | 4 |
| b) understanding the application | ||
| Did not attempt to understand the application | 0 | 32 |
| Did attempt to understand the application | 100 | 68 |
| Easy to understand the application | 94* | 75 |
| Difficult to understand the application | 6 | 25 |
| c) answering health questions | ||
| Did not answer health questions | 0 | 41 |
| Did answer health questiosn | 100 | 59 |
| Easy to answer health questions | 98* | 79 |
| Difficult to answer health questions | 2 | 21 |
| d) reading the application materials | ||
| Did not read the application materials | 0 | 69 |
| Did read the application materials | 100 | 31 |
| Easy to read the application materials | 84* | 70 |
| Difficult to read the application materials | 16 | 30 |
| Easy/difficult to obtain answers to questions about the federal program | ||
| Very easy | 32* | 20 |
| Easy | 62 | 51 |
| Difficult | 5 | 24 |
| Very difficult | 1 | 5 |
| ||
| TABLE 13: Experience with the Application Process Among Retired Buyers and Non-Buyers | ||
| Experience with the Application Process | RetiredBuyers | RetiredNon-Buyers |
| How easy/difficult did the application look to complete | ||
| Never looked at the application | 43% | |
| Looked easy to complete | 45 | |
| Looked difficult to complete | 13 | |
| How easy/difficult was the application process | ||
| Very easy | 37% | |
| Easy | 59 | |
| Difficult | 4 | |
| Very difficult | 0 | |
| Was the following easy/difficult for you:1 | ||
| a) getting an application | ||
| Did not get an application | 0 | 29 |
| Did get an application | 100 | 71 |
| Easy to get an application | 99 | 96 |
| Difficult to get an application | 1 | 4 |
| b) understanding the application | ||
| Did not attempt to understand the application | 0 | 34 |
| Did attempt to understand the application | 100 | 66 |
| Easy to understand the application | 94* | 77 |
| Difficult to understand the application | 6 | 23 |
| c) answering health questions | ||
| Did not answer health questions | 0 | 43 |
| Did answer health questiosn | 100 | 57 |
| Easy to answer health questions | 92* | 77 |
| Difficult to answer health questions | 8 | 23 |
| d) reading the application materials | ||
| Did not read the application materials | 0 | 38 |
| Did read the application materials | 100 | 62 |
| Easy to read the application materials | 85* | 71 |
| Difficult to read the application materials | 15 | 29 |
| Easy/difficult to obtain answers to questions about the federal program | ||
| Very easy | 34* | 16 |
| Easy | 62 | 60 |
| Difficult | 3 | 21 |
| Very difficult | 1 | 3 |
| ||
A total of nine Policy Briefs are available from the Office of Disability, Aging and Long-Term Care on this subject:
- A Comparison of Demographic and Attitudinal Characteristics Among Active and Retired Buyers, Non-Buyers and Non-Responders to the Federal Long-Term Care Insurance Program [http://aspe.hhs.gov/daltcp/reports/charcom.htm] Posted June 2005
- A Comparative Analysis of the Socio-Demographic and Attitudinal Characteristics of Active Buyers and Non-Buyers of Long-Term Care Insurance in the Federal, Private and Public Sectors [http://aspe.hhs.gov/daltcp/reports/LTCIchar.htm] Posted February 2006
- A Demographic and Attitudinal Profile of Buyers of the Federal Long-Term Care Insurance Program [http://aspe.hhs.gov/daltcp/reports/buyprof.htm] Posted June 2005
- A Demographic and Attitudinal Profile of Non-Buyers of the Federal Long-Term Care Insurance Program [http://aspe.hhs.gov/daltcp/reports/nonbuyprof.htm] Posted September 2005
- A Demographic and Attitudinal Profile of Non-Responders of the Federal Long-Term Care Insurance Program [http://aspe.hhs.gov/daltcp/reports/nonresprof.htm] Posted September 2005
- Does Geographic Location Make a Difference? A Comparative Analysis of the Socio-Demographic and Attitudinal Characteristics of Active Buyers and Non-Buyers of the Federal Long-Term Care Insurance Program [http://aspe.hhs.gov/daltcp/reports/FLTCIloc.htm] Posted February 2006
- Marketing Activities: A Comparative Analysis of Engagement and Participation Among Buyers, Non-Buyers and Non-Responders of the Federal Long-Term Care Insurance Program [http://aspe.hhs.gov/daltcp/reports/markact.htm] Posted July 2005
- Multivariate Analysis of Buyers and Non-Buyers of the Federal Long-Term Care Insurance Program [http://aspe.hhs.gov/daltcp/reports/FLTCIanal.htm] Posted September 2005
- What We Know About Buyers and Non-Buyers of Private Long-Term Care Insurance: A Review of Studies [http://aspe.hhs.gov/daltcp/reports/LTCIlr.htm] Posted September 2005