U.S. Department of Health and Human Services
A Comparative Analysis of the Socio-Demographic and Attitudinal Characteristics of Active Buyers and Non-Buyers of Long-Term Care Insurance in the Federal, Private and Public Sectors
LifePlans, Inc.
August 25, 2004
PDF Version: http://aspe.hhs.gov/daltcp/reports/2004/LTCIchar.pdf (34 PDF pages)
This data brief was prepared under contract between the U.S. Department of Health and Human Services (HHS), Office of Disability, Aging and Long-Term Care Policy (DALTCP) and Abt Associates. The brief was written by LifePlans, Inc. For additional information about the study, you may visit the DALTCP home page at http://aspe.hhs.gov/_/office_specific/daltcp.cfm or contact the ASPE Project Officer, Hunter McKay, at HHS/ASPE/DALTCP, Room 424E, H.H. Humphrey Building, 200 Independence Avenue, SW, Washington, DC 20201. His e-mail address is: Hunter.McKay@hhs.gov.
This data brief is one of eight commissioned by the Department of Health and Human Services, Office of the Assistant Secretary for Planning and Evaluation to analyze survey data collected by Long Term Care Partners from members of the federal family regarding the long-term care insurance offering available to them. This brief analyzes how geography is associated with long-term care insurance. The remaining briefs address: a Profile of Buyers; a Profile of Non-Buyers; a Profile of Non-Responders; a Comparison of Active and Retired Buyers, Non-Buyers and Non-Responders; a Comparison of Engagement and Participation among Buyers, Non-Buyers and Non-Responders; a Multivariate Analysis of Buyers and Non-Buyers; and a Comparative Analysis of Socio-Demographic and Attitudinal Characteristics. A Literature Review is also available.
I. BACKGROUND
One of the more ambitious proposals for encouraging growth in the private insurance market was passage of the Long Term Care Security Act (Public Law 106-265). This Act was passed in the summer of 2000 and was signed into law on September 19th of that year. It authorized the U.S. Office of Personnel Management (OPM) to contract for a long-term care (LTC) insurance program for federal employees. Coverage would be available to active federal employees and annuitants (civilian retirees), as well as active and retired members of the uniformed services. "Qualified relatives" of active workers and military personnel including spouses, adult children, parents, and parents-in-law would also be covered by the program. OPM expected that, like the health and life insurance programs it administers, the Federal Long-Term Care Insurance Program (FLTCIP) would become the largest employer-sponsored LTC insurance program in the nation.
The development of the program was in part meant to send a message to other employers around the country that a "progressive" employer is one that offers LTC insurance to its employees. Naturally it was expected that implementation of the program would spur additional interest and growth in the market. The program began in earnest in July 2002, which constituted the beginning of the open enrollment period. The carriers underwriting the program -- John Hancock and MetLife -- formed a joint venture called Long Term Care Partners, LLC, which is devoted exclusively to administering the program.
Long Term Care Partners conducted one of the largest LTC educational campaigns ever. More than one million people requested enrollment kits. As of August 2004, more than 300,000 applications had been received and more than 210,000 policies issued. About 64% of enrollees were active employees and spouses, 31% annuitants and their spouses, and another 5% surviving spouses, parents/in-laws and adult children. Thus, in relatively short order, the FLTCIP became one of the largest group programs in the United States. In part this was due to the significant marketing and enrollment activities including more than 2,100 educational meetings, briefings to human resources staff and outreach programs to affinity groups.
The large number of enrollments affords a unique opportunity to better understand the attitudes and perspectives of both working and retired individuals regarding LTC concerns, the importance of planning, and the role that insurance may (or may not) play in meeting the needs of disabled individuals. An examination of such attitudes can assist policymakers as well as insurers to better understand marketplace opportunities and barriers, and devise strategies to encourage growth in the market.
II. PURPOSE
This is the seventh in a series of data briefs based on the information collected from active buyers and non-buyers of the federal program, other public LTC insurance programs, and private employer group insurance plans. The purpose of this data brief is to analyze survey data collected from members of the federal family and compare their attitudes and opinions to those of individuals offered coverage in other public programs as well as those offered coverage in private sector employer-group settings. The analysis focuses on the attitudes, opinions and motivations of individuals who purchased and did not purchase policies, and on their experience with LTC, and opinions about LTC insurance. Relevant research questions answered in this brief include (but are not limited to) the following:
- How do the demographic and characteristics of active buyers and non-buyers differ across these market segments?
- What are the attitudes and opinions about retirement planning among active buyers and non-buyers across these market segments?
- What are the similarities and/or differences in knowledge of LTC and insurance among the samples?
III. METHOD AND SAMPLE
Long Term Care Partners used mail surveys to collect information from active buyers and non-buyers. For purposes of this research, the active sample consists of employees who are actively working. A "buyer" is someone who has purchased the insurance plan and paid premiums beyond the free look period. A "non-buyer" is defined as someone who expressed interest in a program but had not purchased the plan at the time that the survey was completed.
Three market segments are analyzed: (1) The Federal Long-Term Care Insurance Program "(FLTCIP)"; (2) The Employer Group market "(Private Programs)"; and (3) Other Public LTC Insurance Programs "(Public Programs)". Table 1 shows the number of active buyer and non-buyer respondents in each market segment. As shown, roughly 3,700 individuals participated in the various surveys of actives, all of which have been conducted within the last five years.1 The number of employers represented in the "Private Programs" sample is nine and there are four large state programs represented in the "Public Market" category. It should be noted that not all of these interviewees have responded to all of the questions that are presented here and in a number of cases, comparability issues preclude direct comparisons of responses across surveys.
| TABLE 1: Buyer and Non-Buyer Respondents by Market Segment |
| | Federal Program "FLTCIP" | Nine Employer Groups "Private Programs" | Four State Sponsored Programs "Public Programs" |
| Active Buyers | 642 | 501 | 1,061 |
| Active Non-Buyers | 575 | 164 | 762 |
| Total | 1,217 | 665 | 1,823 |
| NOTE: The state programs include the North Carolina State Teachers, Minnesota Public Employees, the California Public Employees Retirement System (CALPERS) and Michigan Public Employees. |
The analyses are conducted separately for active buyers and non-buyers and unless otherwise noted, all of the differences among the samples described in this brief are statistically significant at the 5% level or better. Also note that the reference group to which most comparisons are made is the FLTCIP.
IV. FINDINGS
A. Socio-Demographic Characteristics
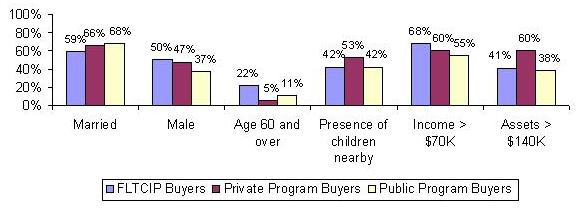
Figure 1 summarizes important demographic characteristics of the active sample by market segment. As shown, compared to other market segments, buyers of the FLTCIP tend to be somewhat older, are less likely to be married, and more likely to be male than buyers in the other market segments. The average age of buyers of the FLTCIP is 53 years whereas for other public programs it is 50 years; the private programs examined have the youngest average age -- 47 years. FLTCIP buyers also tend to have higher income levels, which may reflect the fact that they are also older, hence have more years of experience in the labor force. On the other hand, compared to buyers in the private market they are less likely to have accumulated high levels of liquid assets and they are also less likely to have children living nearby. This suggests that many of the FLTCIP and Public Program buyers may view having LTC insurance as enabling them to purchase services that would otherwise have been provided by family members. In contrast, private program buyers, who are more likely to be married and have children living nearby, may view the role of the insurance as protecting higher levels of accumulated assets or as meeting other objectives.
| FIGURE 1: Demographic Characteristics of Active Buyers by Market Segment |
 |
| SOURCE: Analysis of data from the FLTCIP, 2003; America's Health Insurance Plans, 2000; MetLife, 2001; MedAmerica, 2000. |
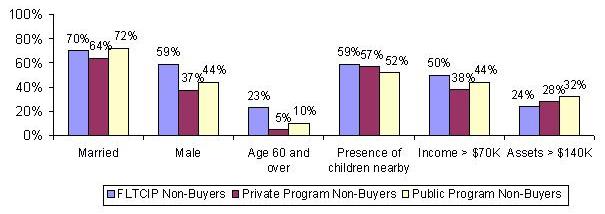
Figure 2 compares the demographic characteristics of individuals who chose not to purchase a policy by market segment. As shown, non-buyers of the FLTCIP tend to be older than those in other market segments -- 53 years compared to 49 years in public programs and 45 years in private programs. They also tend to be more male and have higher levels of income yet lower levels of assets. In contrast to active buyers there are no significant differences in the proportion that are married and have children living nearby across the market segments.
| FIGURE 2: Demographic Characteristics of Active Non-Buyers by Market Segment |
 |
| SOURCE: Analysis of data from the FLTCIP, 2003; America's Health Insurance Plans, 2000; MetLife, 2001; MedAmerica, 2000. |
When we examine and compare buyers to non-buyers across market segments, we find that the greatest variable of difference that is consistent across markets is wealth: non-buyers tend to have lower levels of assets and lower incomes than buyers.
B. Attitudes and Opinions about Retirement Planning and Long-Term Care
One thing that we know from previous briefs is that federal employees as a whole seem to be active in planning for their retirement and understand the potential LTC risks associated with later life. One would expect that buyers would at least be most likely to feel confident about their planning for both retirement and LTC, and more likely to be concerned about being prepared for future LTC needs. We asked a series of questions designed to illuminate differences across markets and between buyers and non-buyers regarding these issues.
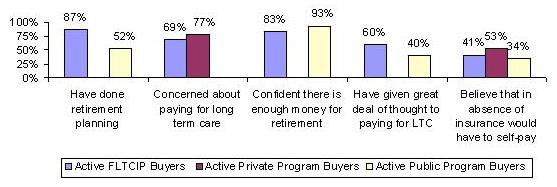
Figure 3 shows how buyers across market segments feel about retirement and LTC planning. Many of the questions were not asked of Private Program buyers so comparisons to this group are somewhat more limited. What is striking is the very high percentage of FLTCIP buyers who have done retirement planning and who have given a great deal of thought to paying for LTC when compared with buyers of other public programs. This may reflect the very targeted and focused marketing and education campaign to which the FLTCIP buyers were exposed.
| FIGURE 3: Attitudes about Retirement Planning among Buyers by Market Segment |
 |
| SOURCE: Analysis of data from the FLTCIP, 2003; America's Health Insurance Plans, 2000; MetLife, 2001; MedAmerica, 2000. |
Somewhat surprisingly, private program buyers are more likely to express concern about how they will pay for LTC expenses than are FLTCIP buyers. This may reflect an underlying uncertainty about the continued value of the product or about the stability of the company offering the product. Given the very strong affinity among federal employees, the fact that they are somewhat less concerned about paying for LTC may reflect their belief that the government will continue to protect their interests well into the future. Alternatively, that relatively high percentages of buyers in each market segment continue to worry about paying for LTC suggests that there may remain uncertainty about the product or about the level of coverage chosen.
The insurance industry has invested heavily in educating consumers about LTC financing. Buyers were asked who would pay for LTC expenses in the absence of insurance. Somewhat surprisingly, private market buyers were most likely to understand that the liability would fall on their shoulders. A smaller percentage of FLTCIP and other public program buyers believed that they would have to pay for LTC in the absence of their policy; they were more likely to believe that other insurance or other government programs would pay for the care. As well, many were unsure about how such costs would be paid (in the absence of their insurance).
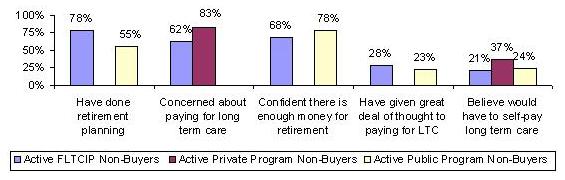
Figure 4 displays similar results for non-buyers across each of the market segments. As shown, FLTCIP non-buyers are much more likely to have engaged in retirement planning than other public program non-buyers. They are, however, less concerned about paying for LTC. This may be explained in part by the fact that they are also more likely to believe that other insurance or government programs will pay for LTC if it is needed. Also, private program non-buyers are much more likely to be concerned about paying for LTC; they have a better understanding that the liability would be theirs and would not be covered by other programs or insurance.
| FIGURE 4: Attitudes about Retirement Planning among Non-Buyers by Market Segment |
 |
| SOURCE: Analysis of data from the FLTCIP, 2003; America's Health Insurance Plans, 2000; MetLife, 2001; MedAmerica, 2000. |
When comparing buyers and non-buyers across the market segments, a fairly consistent pattern emerges. Buyers are more likely to have done retirement planning, are more confident that they will have adequate resources to enjoy their retirement, have given more thought to paying for LTC, and are more likely to understand that without private insurance, the LTC liability will fall on their shoulders.
C. The Purchase Process
Prior research has shown that most individuals who purchase LTC insurance consult with others before doing so. This is also true of buyers across these three market segments. Buyers of the FLTCIP were, however, more likely to have consulted with a financial planner, work colleague, and children than were buyers in either of the other two market segments.
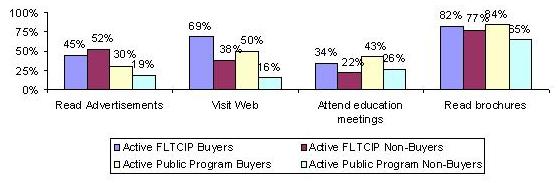
Non-buyers in the FLTCIP and public program samples were asked how likely they thought it was that they would buy insurance when they requested information about their respective programs. A significant proportion in both groups -- 70% of FLTCIP non-buyers and 80% of public program non-buyers -- thought that they would buy a policy. Obviously, something along the way changed their mind or their initial purchase commitment was weak. When asked about the application process itself, similar proportions of both market segments -- roughly 25% -- indicated that they found the application difficult to understand. This may explain in part, why they did not proceed to buy a policy. Also, as shown below in Figure 5, for the most part, non-buyers in each of the two market segments were less likely to have actively engaged in activities designed to educate and reinforce the need for insurance protection against the cost of LTC.
| FIGURE 5: Exposure to Promotional Activities by Market Segment and Purchase Status |
 |
| SOURCE: Analysis of data from the FLTCIP, 2003; America's Health Insurance Plans, 2000; MetLife, 2001; MedAmerica, 2000. |
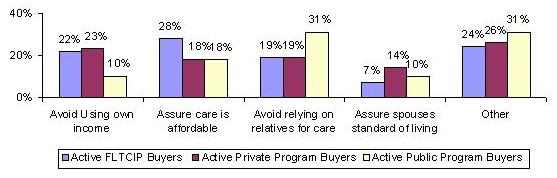
D. Motivations Behind the Purchase and Non-Purchase Decision by Market Segment
We have already demonstrated that there are a number of socio-demographic and attitudinal differences among buyers across each of the market segments and among non-buyers in the different segments. Figure 6 below highlights the single most important reason why buyers in each of the market segments chose to purchase a policy. As shown there are significant differences across market segments. Among FLTCIP buyers, assuring that care is affordable when needed is the most important purchase motivation. Among buyers of public programs, being able to avoid having to rely on relatives for care is the most important reason for having a policy. Finally, the most important purchase reason for private market buyers is to avoid having to use family resources to pay for care.
| FIGURE 6: Single Most Important Reason for Buying a Policy by Market Segment |
 |
| SOURCE: Analysis of data from the FLTCIP, 2003; America's Health Insurance Plans, 2000; MetLife, 2001; MedAmerica, 2000. |
An important point worth noting is that there is less variation in purchase reasons for FLTCIP and public program buyers compared to buyers in the private market. This suggests that the targeted marketing and education campaigns that accompany public program rollouts do focus the attention of buyers on a number of key points regarding the value of the insurance.
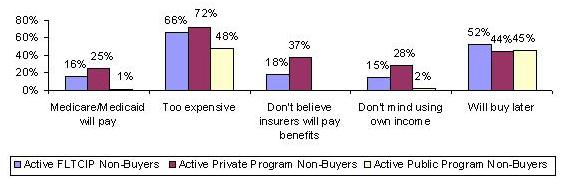
| FIGURE 7: Reasons for Not Buying a Policy by Market Segment |
 |
| SOURCE: Analysis of data from the FLTCIP, 2003; America's Health Insurance Plans, 2000; MetLife, 2001; MedAmerica, 2000. |
Figure 7 below shows the reasons cited by non-buyers as relevant to their decision not to buy a policy. As shown, across each market segment, cost remains the largest barrier to purchase. Between 48% and 72% of respondents cited this as a reason for non-purchase. Roughly one-in-six FLTCIP non-buyers and one-in-four public program non-buyers believe that they do not need the insurance because Medicare or Medicaid will pay. In contrast, the overwhelming majority of non-buyers from public programs do not have this belief: almost none of them believe that the presence of Medicaid or Medicare is a sufficient reason not to buy the insurance.
An interesting finding is that roughly equal proportions of non-buyers across each of these market segments indicate that they are planning to buy the insurance at a later time. Clearly, these "first-time" non-buyers represent a future marketing opportunity. A marketing campaign designed to stress the value of a policy relative to its cost as well as the advantages of purchasing at younger ages, may be particularly effective at "turning" these reluctant potential buyers into actual purchasers.
V. CONCLUSIONS
For the most part, the differences between buyers and non-buyers across each of the market segments are those one would expect. On the other hand, not all "buyers" are the same and neither are all "non-buyers". There are differences in attitudes, socio-demographic characteristics and decision-making that are a function of market segment. Such differences underscore the importance of a highly targeted marketing campaign with a discrete number of messages about LTC, insurance and retirement planning.
NOTES
-
The Appendix also summarizes information about the retiree sample, of which there are an additional 5,000 respondents.
Notes for Tables
Unless otherwise indicated, the analysis of the data is based on the responses of 642 active buyers, 575 active non-buyers, 1114 retired buyers, and 586 retired non-buyers from the FLTCIP; 501 active buyers, 164 active non-buyers, 1841 retired buyers, and 360 retired non-buyers from employer group plans; 232 active buyers from North Carolina State Teachers; 198 active buyers, 102 active non-buyers, 162 retired buyers, and 138 retired non-buyers from the California Public Employees Retirement System (CALPERS); 504 active buyers and 326 active non-buyers from the State of Minnesota public employees, and 127 active buyers, 334 active non-buyers, 63 retired buyers, and 279 retired non-buyers from the State of Michigan public employees. It should be noted that not all of these interviewees have responded to all of the questions that we have presented here.
All significance tests are based on 5% level or better. Notations for significance are as follows: If one category out of three contains the symbol (*), then the category starred is statistically different from each of the other two categories, but the non-starred categories are not different from each other. If two categories out of the three contain the symbol (*), then those two categories are statistically different from each other, but each of those categories is not statistically different from the third one. If all three categories contain the symbol (*), then all three are statistically different from each other.
Unless otherwise specified, only the response category that has a notation of significance was tested against all other categories. In some cases, it was determined that a combination of categories would be tested. These are indicated in the footnotes. It also may be the case that if categories were or were not combined, it could change the results of the test of significance.
Unless otherwise indicated, the first response category (i.e., strongly agree, very important, very likely, etc.) or the yes response was tested. Therefore, if there are no notations for significance, the test was not significant at the 5% level.
| TABLE A-1: Socio-Demographic Characteristics of Active Buyers1 |
| Socio-Demographic Characteristics | FLTCIP | Private Programs | Public Programs |
| Average age | 53* | 47* | 50* |
| Less than 50 | 27% | 57% | 43% |
| 50 to 54 | 25 | 25 | 25 |
| 55 to 59 | 26 | 13 | 20 |
| 60 to 64 | 15 | 4 | 9 |
| 65 and over | 7 | 1 | 3 |
| Gender |
| Male | 50* | 47 | 37* |
| Female | 50 | 43 | 63 |
| Marital status |
| Never Married | 17 | 18 | 14 |
| Married | 59* | 66 | 68* |
| Divorced/separated | 18 | 14 | 12 |
| Widowed | 4 | 2 | 3 |
| Domestic Partner | 2 | 0 | 3 |
| Presence of children living within 25 miles2 |
| Yes | 42 | 43 | 42 |
| No | 58 | 47* | 58 |
| Education level2 |
| Less than high school graduate | 0 | 0 | 0 |
| High school graduate | 6 | 9 | 5 |
| Technical/trade/business school | 4 | 5 | 6 |
| Some college | 20 | 21 | 17 |
| College graduate3 | 37 | 44 | 37 |
| Graduate degree | 33 | 21 | 35 |
| Income |
| Less than $30,000 | 3 | 8* | 3 |
| $30,000 to $69,999 | 29 | 32 | 42 |
| $70,000 or more | 68* | 60 | 55 |
| Assets2 |
| Less than $60,000 | 25 | 25 | 38* |
| $60,000 to $139,999 | 34 | 15 | 24 |
| $140,000 and above | 41 | 60* | 38 |
| Home ownership4 |
| Yes | 90 | | 87 |
| No | 10 | | 13 |
- It should be noted that not all of these interviewees have responded to all of the questions that we have presented here.
- For this category, Public Programs include only the CALPERS and the Minnesota databases.
- Here, having a college degree or better is tested for significance against not having a college degree.
- For this category, Public Programs include only the CALPERS database.
|
| TABLE A-2: Socio-Demographic Characteristics of Active Non-Buyers |
| Socio-Demographic Characteristics | FLTCIP | Private Programs | Public Programs |
| Average age | 53* | 45* | 49* |
| Less than 50 | 34% | 53% | 52% |
| 50 to 54 | 24 | 29 | 22 |
| 55 to 59 | 19 | 13 | 17 |
| 60 to 64 | 10 | 4 | 5 |
| 65 and over | 13 | 1 | 4 |
| Gender |
| Male | 59* | 37 | 44 |
| Female | 41 | 63 | 56 |
| Marital status |
| Never Married | 10 | 17 | 12 |
| Married | 70 | 65 | 72 |
| Divorced/separated | 16 | 16 | 12 |
| Widowed | 3 | 2 | 2 |
| Domestic Partner | 1 | 0 | 2 |
| Presence of children living within 25 miles1 |
| Yes | 59 | 57 | 52 |
| No | 41 | 43 | 48 |
| Education level1 |
| Less than high school graduate | 1 | 1 | 0 |
| High school graduate | 13 | 12 | 9 |
| Technical/trade/business school | 5 | 9 | 9 |
| Some college | 30 | 18 | 16 |
| College graduate2 | 28* | 37 | 31* |
| Graduate degree | 23 | 23 | 35 |
| Income |
| Less than $30,000 | 7 | 14* | 6 |
| $30,000 to $69,999 | 43 | 48 | 50 |
| $70,000 or more | 50* | 38* | 44 |
| Assets1 |
| Less than $60,000 | 44 | 50 | 44 |
| $60,000 to $139,999 | 32 | 22 | 25 |
| $140,000 and above | 24* | 28 | 31* |
| Home ownership3 |
| Yes | 86 | | 80 |
| No | 14 | | 20 |
- For this category, Public Programs include only the CALPERS and the Minnesota databases.
- Here, having a college degree or better is tested for significance against not having a college degree.
- For this category, Public Programs include only the CALPERS database.
|
| TABLE A-3: Socio-Demographic Characteristics of Retired Buyers |
| Socio-Demographic Characteristics | FLTCIP | Private Programs | Public Programs |
| Average age | 66* | 67* | 63* |
| Less than 50 | 1% | 1% | 0% |
| 50 to 54 | 3 | 4 | 13 |
| 55 to 59 | 14 | 10 | 17 |
| 60 to 64 | 24 | 22 | 31 |
| 65 and over | 58 | 63 | 39 |
| Gender |
| Male | 70* | 43 | 42 |
| Female | 30 | 57 | 58 |
| Marital status |
| Never Married | 9 | 4 | 7 |
| Married | 68 | 72* | 61* |
| Divorced/separated | 10 | 5 | 18 |
| Widowed | 12 | 19 | 13 |
| Domestic Partner | 1 | 0 | 1 |
| Presence of children living within 25 miles1 |
| Yes | 51* | 62* | 58 |
| No | 49 | 38 | 42 |
| Education level1 |
| Less than high school graduate | 1 | 5 | 0 |
| High school graduate | 14 | 22 | 5 |
| Technical/trade/business school | 5 | 7 | 1 |
| Some college | 22 | 19 | 29 |
| College graduate2 | 30 | 24* | 21 |
| Graduate degree | 28 | 23 | 44 |
| Income |
| Less than $30,000 | 12 | 34* | 11 |
| $30,000 to $69,999 | 51 | 41 | 54 |
| $70,000 or more | 37 | 25* | 35 |
| Assets1 |
| Less than $60,000 | 17 | 18 | 23 |
| $60,000 to $139,999 | 30 | 22 | 33 |
| $140,000 and above | 53* | 60* | 44 |
| Home ownership3 |
| Yes | 92* | | 98 |
| No | 8 | | 2 |
- For this category, Public Programs include only the CALPERS and the Minnesota databases.
- Here, having a college degree or better is tested for significance against not having a college degree.
- For this category, Public Programs include only the CALPERS database.
|
| TABLE A-4: Socio-Demographic Characteristics of Retired Non-Buyers |
| Socio-Demographic Characteristics | FLTCIP | Private Programs | Public Programs |
| Average age | 71* | 70 | 69* |
| Less than 50 | 2% | 1% | 2% |
| 50 to 54 | 3 | 3 | 4 |
| 55 to 59 | 7 | 4 | 11 |
| 60 to 64 | 12 | 17 | 20 |
| 65 and over | 76 | 75 | 63 |
| Gender |
| Male | 74* | 41 | 34 |
| Female | 26 | 59 | 66 |
| Marital status |
| Never Married | 4 | 3 | 6 |
| Married | 70* | 66 | 59* |
| Divorced/separated | 8 | 9 | 14 |
| Widowed | 18 | 22 | 21 |
| Domestic Partner | 0 | 0 | 0 |
| Presence of children living within 25 miles1 |
| Yes | 55 | 62 | 53 |
| No | 45 | 38 | 47 |
| Education level1 |
| Less than high school graduate | 4 | 7 | 0 |
| High school graduate | 17 | 29 | 3 |
| Technical/trade/business school | 8 | 9 | 2 |
| Some college | 29 | 20 | 23 |
| College graduate2 | 24* | 21* | 21* |
| Graduate degree | 18 | 14 | 51 |
| Income |
| Less than $30,000 | 29 | 60* | 22 |
| $30,000 to $69,999 | 50 | 30 | 54 |
| $70,000 or more | 21 | 10* | 24 |
| Assets1 |
| Less than $60,000 | 36 | 41 | 33 |
| $60,000 to $139,999 | 26 | 24 | 25 |
| $140,000 and above | 38 | 35 | 42 |
| Home ownership3 |
| Yes | 90 | | 88 |
| No | 10 | | 12 |
- For this category, Public Programs include only the CALPERS and the Minnesota databases.
- Here, having a college degree or better is tested for significance against not having a college degree.
- For this category, Public Programs include only the CALPERS database.
|
| TABLE A-5: Attitudes and Opinions About Retirement Planning and LTC Among Active Buyers |
| Attitudes and Opinions | FLTCIP | Private Programs | Public Programs |
| Done retirement planning1 |
| Yes | 87%* | | 52% |
| No | 13 | | 48 |
| Confident that there is enough money to live comfortably in retirement1 |
| Very confident | 17* | | 36 |
| Somewhat confident | 66 | | 57 |
| Not very confident | 13 | | 4 |
| Not at all confident | 4 | | 3 |
| Thought given to paying for LTC expenses1 |
| A great deal | 60* | | 40 |
| Some | 36 | | 45 |
| Not much thought | 4 | | 13 |
| No thought at all | 0 | | 2 |
| I worry how to pay for LTC |
| Strongly agree | 19* | 24 | |
| Agree | 50 | 53 | |
| Disagree | 26 | 22 | |
| Strongly disagree | 5 | 1 | |
| It is important to plan now for the possibility of needing LTC services in the future1 |
| Strongly agree | 54 | 53 | 52 |
| Agree | 45 | 44 | 46 |
| Disagree | 1 | 2 | 1 |
| Strongly disagree | 0 | 1 | 1 |
| LTC insurance programs sold today will cover the cost of LTC services needed in the future1 |
| Strongly agree | 10 | | 11 |
| Agree | 73 | | 74 |
| Disagree | 15 | | 14 |
| Strongly disagree | 2 | | 1 |
| How would LTC costs be paid2,3 |
| My own income or my children will help pay | 41* | 53* | 34* |
| Other sources will pay | 59 | 47 | 66 |
- For this category, Public Programs include only the CALPERS database.
- The different surveys had different response categories for "If you needed LTC and had no LTC insurance how would the cost of LTC services be paid?" Here we report the percentage of those who said that they will pay with own income or that they children will help them pay and group all other responses in one category.
- For this category, Public Programs include only the CALPERS and the Minnesota databases.
|
| TABLE A-6: Attitudes and Opinions About Retirement Planning and LTC Among Active Non-Buyers |
| Attitudes and Opinions | FLTCIP | Private Programs | Public Programs |
| Done retirement planning1 |
| Yes | 78%* | | 55% |
| No | 22 | | 45 |
| Confident that there is enough money to live comfortably in retirement1 |
| Very confident | 14* | | 24 |
| Somewhat confident | 55 | | 54 |
| Not very confident | 24 | | 16 |
| Not at all confident | 7 | | 6 |
| Thought given to paying for LTC expenses1 |
| A great deal | 28 | | 23 |
| Some | 47 | | 48 |
| Not much thought | 21 | | 23 |
| No thought at all | 4 | | 6 |
| I worry how to pay for LTC |
| Strongly agree | 18* | 36 | |
| Agree | 44 | 47 | |
| Disagree | 32 | 17 | |
| Strongly disagree | 6 | 0 | |
| It is important to plan now for the possibility of needing LTC services in the future1 |
| Strongly agree | 27 | 31 | 35 |
| Agree | 57 | 59 | 57 |
| Disagree | 14 | 10 | 8 |
| Strongly disagree | 2 | 0 | 0 |
| LTC insurance programs sold today will cover the cost of LTC services needed in the future1 |
| Strongly agree | 3* | | 8 |
| Agree | 41 | | 51 |
| Disagree | 47 | | 31 |
| Strongly disagree | 9 | | 10 |
| How would LTC costs be paid2,3 |
| My own income or my children will help pay | 21 | 37* | 24 |
| Other sources will pay | 79 | 63 | 76 |
- For this category, Public Programs include only the CALPERS database.
- The different surveys had different response categories for "If you needed LTC and had no LTC insurance how would the cost of LTC services be paid?" Here we report the percentage of those who said that they will pay with own income or that they children will help them pay and group all other responses in one category.
- For this category, Public Programs include only the CALPERS and the Minnesota databases.
|
| TABLE A-7: Attitudes and Opinions About Retirement Planning and LTC Among Retired Buyers |
| Attitudes and Opinions | FLTCIP | Private Programs | Public Programs |
| Done retirement planning1 |
| Yes | 87%* | | 52% |
| No | 13 | | 48 |
| Confident that there is enough money to live comfortably in retirement1 |
| Very confident | 33* | | 54 |
| Somewhat confident | 59 | | 43 |
| Not very confident | 7 | | 2 |
| Not at all confident | 1 | | 1 |
| Thought given to paying for LTC expenses1 |
| A great deal | 63 | | 58 |
| Some | 35 | | 35 |
| Not much thought | 2 | | 4 |
| No thought at all | 0 | | 3 |
| I worry how to pay for LTC |
| Strongly agree | 18* | 22 | |
| Agree | 55 | 48 | |
| Disagree | 23 | 24 | |
| Strongly disagree | 4 | 6 | |
| It is important to plan now for the possibility of needing LTC services in the future1 |
| Strongly agree | 47 | 64* | 45 |
| Agree | 53 | 34 | 51 |
| Disagree | 0 | 1 | 4 |
| Strongly disagree | 0 | 1 | 0 |
| LTC insurance programs sold today will cover the cost of LTC services needed in the future1 |
| Strongly agree | 10 | | 14 |
| Agree | 71 | | 74 |
| Disagree | 17 | | 11 |
| Strongly disagree | 2 | | 1 |
| How would LTC costs be paid1,2 |
| My own income or my children will help pay | 63 | 59 | 14*3 |
| Other sources will pay | 37 | 41 | 86 |
- For this category, Public Programs include only the CALPERS database.
- The different surveys had different response categories for "If you needed LTC and had no LTC insurance how would the cost of LTC services be paid?" Here we report the percentage of those who said that they will pay with own income or that they children will help them pay and group all other responses in one category
- Thirty-three percent of the responders said that "Medigap" will pay for LTC, 21% said that "Other" will pay and 15% said "Don't know."
|
| TABLE A-8: Attitudes and Opinions About Retirement Planning and LTC Among Retired Non-Buyers |
| Attitudes and Opinions | FLTCIP | Private Programs | Public Programs |
| Done retirement planning1 |
| Yes | 72%* | | 38% |
| No | 28 | | 62 |
| Confident that there is enough money to live comfortably in retirement1 |
| Very confident | 22* | | 41 |
| Somewhat confident | 56 | | 48 |
| Not very confident | 14 | | 6 |
| Not at all confident | 8 | | 5 |
| Thought given to paying for LTC expenses1 |
| A great deal | 36 | | 36 |
| Some | 48 | | 41 |
| Not much thought | 13 | | 16 |
| No thought at all | 3 | | 7 |
| I worry how to pay for LTC |
| Strongly agree | 19* | 33 | |
| Agree | 44 | 47 | |
| Disagree | 30 | 17 | |
| Strongly disagree | 7 | 3 | |
| It is important to plan now for the possibility of needing LTC services in the future1 |
| Strongly agree | 30* | 33 | 41* |
| Agree | 56 | 58 | 54 |
| Disagree | 12 | 8 | 5 |
| Strongly disagree | 2 | 1 | 0 |
| LTC insurance programs sold today will cover the cost of LTC services needed in the future1 |
| Strongly agree | 3* | | 11 |
| Agree | 37 | | 43 |
| Disagree | 45 | | 35 |
| Strongly disagree | 15 | | 11 |
| How would LTC costs be paid1,2 |
| My own income or my children will help pay | 35 | 42 | 41 |
| Other sources will pay | 65 | 58 | 59 |
- For this category, Public Programs include only the CALPERS database.
- The different surveys had different response categories for "If you needed LTC and had no LTC insurance how would the cost of LTC services be paid?" Here we report the percentage of those who said that they will pay with own income or that they children will help them pay and group all other responses in one category.
|
| TABLE A-9: Experience with LTC Among Active Buyers |
| Experiences with LTC | FLTCIP | Private Programs | Public Programs |
| Respondent/spouse or parent needed LTC |
| Yes | 62% | 65% | 50%* |
| No | 38 | 35 | 50 |
| TABLE A-10: Experience with LTC Among Active Non-Buyers |
| Experiences with LTC | FLTCIP | Private Programs | Public Programs |
| Respondent/spouse or parent needed LTC |
| Yes | 62% | 64% | 39%* |
| No | 38 | 36 | 61 |
| TABLE A-11: Experience with LTC Among Retired Buyers |
| Experiences with LTC | FLTCIP | Private Programs | Public Programs |
| Respondent/spouse or parent needed LTC |
| Yes | 69%* | 76%* | 28%* |
| No | 31 | 24 | 72 |
- For this category, Public Programs include only the CALPERS and the Michigan databases.
|
| TABLE A-12: Experience with LTC Among Retired Non-Buyers |
| Experiences with LTC | FLTCIP | Private Programs | Public Programs |
| Respondent/spouse or parent needed LTC |
| Yes | 66% | 73% | 31%* |
| No | 34 | 27 | 69 |
- For this category, Public Programs include only the CALPERS and the Michigan databases.
|
| TABLE A-13: Self-Assessed Risk of Needing LTC Among Active Buyers |
| Type of LTC | FLTCIP | Private Programs |
| How likely is it that: |
| a) the respondent thinks he/she will need home care services for more than three months |
| Very likely | 12%* | 20% |
| Likely | 64 | 47 |
| Somewhat likely | 20 | 28 |
| Not at all likely | 4 | 5 |
| b) the respondent thinks he/she will need nursing home care for more than three months |
| Very likely | 12* | 21 |
| Likely | 58 | 45 |
| Somewhat likely | 24 | 28 |
| Not at all likely | 6 | 6 |
| c) the respondent thinks he/she will need care provided in assisted living facility for more than three months |
| Very likely | 15* | 20 |
| Likely | 62 | 50 |
| Somewhat likely | 19 | 25 |
| Not at all likely | 4 | 5 |
| TABLE A-14: Self-Assessed Risk of Needing LTC Among Active Non-Buyers |
| Type of LTC | FLTCIP | Private Programs |
| How likely is it that: |
| a) the respondent thinks he/she will need home care services for more than three months |
| Very likely | 11% | 14% |
| Likely | 54 | 43 |
| Somewhat likely | 27 | 38 |
| Not at all likely | 8 | 5 |
| b) the respondent thinks he/she will need nursing home care for more than three months |
| Very likely | 11 | 14 |
| Likely | 49 | 37 |
| Somewhat likely | 29 | 40 |
| Not at all likely | 11 | 9 |
| c) the respondent thinks he/she will need care provided in assisted living facility for more than three months |
| Very likely | 12 | 13 |
| Likely | 53 | 44 |
| Somewhat likely | 26 | 35 |
| Not at all likely | 9 | 8 |
| TABLE A-15: Self-Assessed Risk of Needing LTC Among Retired Buyers |
| Type of LTC | FLTCIP | Private Programs |
| How likely is it that: |
| a) the respondent thinks he/she will need home care services for more than three months |
| Very likely | 6%* | 18% |
| Likely | 65 | 51 |
| Somewhat likely | 23 | 28 |
| Not at all likely | 6 | 3 |
| b) the respondent thinks he/she will need nursing home care for more than three months |
| Very likely | 5* | 17 |
| Likely | 60 | 48 |
| Somewhat likely | 28 | 30 |
| Not at all likely | 7 | 5 |
| c) the respondent thinks he/she will need care provided in assisted living facility for more than three months |
| Very likely | 7* | 12 |
| Likely | 66 | 50 |
| Somewhat likely | 21 | 33 |
| Not at all likely | 6 | 5 |
| TABLE A-16: Self-Assessed Risk of Needing LTC Among Retired Non-Buyers |
| Type of LTC | FLTCIP | Private Programs |
| How likely is it that: |
| a) the respondent thinks he/she will need home care services for more than three months |
| Very likely | 12% | 12% |
| Likely | 58 | 44 |
| Somewhat likely | 23 | 37 |
| Not at all likely | 7 | 7 |
| b) the respondent thinks he/she will need nursing home care for more than three months |
| Very likely | 11 | 12 |
| Likely | 54 | 42 |
| Somewhat likely | 25 | 39 |
| Not at all likely | 10 | 7 |
| c) the respondent thinks he/she will need care provided in assisted living facility for more than three months |
| Very likely | 11 | 9 |
| Likely | 56 | 41 |
| Somewhat likely | 24 | 42 |
| Not at all likely | 9 | 8 |
| TABLE A-17: Beliefs About LTC Among Active Non-Buyers |
| Experiences with LTC | FLTCIP | Private Programs | Public Programs |
| It is important to avoid using own income and savings to pay for LTC |
| Strongly agree | 33% | | 29% |
| Agree | 45 | | 49 |
| Disagree | 19 | | 19 |
| Strongly disagree | 3 | | 3 |
| There are public programs that will pay the cost of LTC1 |
| Strongly agree | 3 | 5* | 1* |
| Agree | 23 | 11 | 13 |
| Disagree | 59 | 48 | 49 |
| Strongly disagree | 15 | 36 | 37 |
- For this category, Public Programs include only the CALPERS database.
|
| TABLE A-18: Beliefs About LTC Among Retired Non-Buyers |
| Experiences with LTC | FLTCIP | Private Programs | Public Programs |
| It is important to avoid using own income and savings to pay for LTC |
| Strongly agree | 32%* | | 22% |
| Agree | 45 | | 51 |
| Disagree | 19 | | 22 |
| Strongly disagree | 4 | | 5 |
| There are public programs that will pay the cost of LTC1 |
| Strongly agree | 4 | 15* | 3 |
| Agree | 19 | 17 | 5 |
| Disagree | 57 | 35 | 62 |
| Strongly disagree | 20 | 33 | 30 |
- For this category, Public Programs include only the CALPERS database.
|
| TABLE A-19: Opinions about LTC Insurance Among Active Non-Buyers |
| Opinions about LTC Insurance | FLTCIP | Private Programs | Public Programs |
| Do you currently have LTC insurance1 |
| Yes | 11% | | 11% |
| No | 89 | | 89 |
| Did you buy your LTC insurance after you heard about the current program2,3 |
| Yes | 47 | | 59 |
| No | 36 | | 41 |
| Insurance companies sell adequate coverage for LTC services |
| Strongly agree | 5 | 4 | |
| Agree | 42 | 51 | |
| Disagree | 41 | 36 | |
| Strongly disagree | 12 | 9 | |
- For this category, Public Programs include only the CALPERS and the Michigan databases.
- Responders to the FLTCIP surveys had the option to say "I did not know about the FLTCIP" and as a result the reported percentages do not add up to 100.
- For this category, Public Programs included only the CALPERS database.
|
| TABLE A-20: Opinions about LTC Insurance Among Retired Non-Buyers |
| Opinions about LTC Insurance | FLTCIP | Private Programs | Public Programs |
| Do you currently have LTC insurance1 |
| Yes | 20% | | 18% |
| No | 80 | | 82 |
| Did you buy your LTC insurance after you heard about the current program2,3 |
| Yes | 13 | | 40 |
| No | 60 | | 60 |
| Insurance companies sell adequate coverage for LTC services |
| Strongly agree | 5 | 4 | |
| Agree | 43 | 46 | |
| Disagree | 39 | 36 | |
| Strongly disagree | 13 | 14 | |
- For this category, Public Programs include only the CALPERS and the Michigan databases.
- Responders to the FLTCIP surveys had the option to say "I did not know about the FLTCIP" and as a result the reported percentages do not add up to 100.
- For this category, Public Programs included only the CALPERS database.
|
| TABLE A-21: Decision Making Process of Active Buyers |
| Decision Making Process | FLTCIP | Private Programs | Public Programs |
| I would have bought LTC insurance if the current agency had not offered it1 |
| Yes | 33% | 55% | |
| No | 17 | 45 | |
| I discussed LTC insurance purchase with: |
| a) spouse2 |
| Yes | 63 | 65 | 68 |
| No | 37 | 35 | 32 |
| b) children2 |
| Yes | 27* | 12 | 11 |
| No | 73 | 88 | 89 |
| c) HR officer3 |
| Yes | 13* | 19 | 22 |
| No | 87 | 81 | 78 |
| d) colleagues/other relatives/friends2 |
| Yes | 83* | 46* | 67* |
| No | 17 | 54 | 33 |
| e) financial planner3 |
| Yes | 22* | 17* | 8* |
| No | 78 | 83 | 92 |
| f) insurance agent2 |
| Yes | 15 | 10 | 12 |
| No | 85 | 90 | 88 |
- Responders to the FLTCIP surveys had the option to say "Not sure" and as a result the reported percentages do not add up to 100.
- For this category, Public Programs include only the CALPERS and the Minnesota databases.
- For this category, Public Programs include only the Minnesota database.
|
| TABLE A-22: Decision Making Process of Retired Buyers |
| Decision Making Process | FLTCIP | Private Programs | Public Programs |
| I discussed LTC insurance purchase with: |
| a) spouse1 |
| Yes | 71%* | 84%* | 61%* |
| No | 29 | 16 | 39 |
| b) children1 |
| Yes | 40 | 50* | 32 |
| No | 60 | 50 | 68 |
| c) colleagues/other relatives/friends1 |
| Yes | 57* | 48* | 54 |
| No | 43 | 52 | 46 |
| d) financial planner |
| Yes | 22* | 42* | |
| No | 78 | 58 | |
| e) insurance agent1 |
| Yes | 13 | 82* | 19 |
| No | 87 | 18 | 81 |
- For this category, Public Programs include only the CALPERS database.
|
| TABLE A-23: People Who Had the Most Influence on Decision to Purchase of Insurance Among Active Buyers |
| Decision Making Process | FLTCIP | Private Programs |
| Person who had most influence over insurance decision1 |
| Spouse | 52 | 60 |
| Colleagues/other relatives/friends | 31 | 19 |
| Financial planner | 6 | 8 |
- There are different answer categories to this question in the different surveys and that is why the reported percentages do not add up to 100.
|
| TABLE A-24: People Who Had the Most Influence on Decision to Purchase of Insurance Among Retired Buyers |
| Decision Making Process | FLTCIP | Private Programs |
| Person who had most influence over insurance decision |
| Spouse | 69 | 43 |
| Colleagues/other relatives/friends | 13 | --- |
| Children | 8 | --- |
| Insurance agent | --- | 28 |
| Financial planner | --- | 12 |
| TABLE A-25: Decision Making Process of Active Non-Buyers |
| Decision Making Process | FLTCIP | Public Programs |
| How likely did you think it was that you would buy the FLTCIP when you requested the application |
| Very likely | 18% | 23% |
| Likely | 52 | 57 |
| Not very likely | 28 | 17 |
| Not at all likely | 2 | 3 |
| TABLE A-26: Decision Making Process of Retired Non-Buyers |
| Decision Making Process | FLTCIP | Public Programs |
| How likely did you think it was that you would buy the FLTCIP when you requested the application |
| Very likely | 11% | 15% |
| Likely | 43 | 52 |
| Not very likely | 40 | 24 |
| Not at all likely | 6 | 9 |
| TABLE A-27: Experience with the Application Process Among Active Non-Buyers |
| Experience with the Application Process | FLTCIP | Public Programs |
| Was understanding the application easy/difficult for you1 |
| Easy to understand the application | 75% | 78% |
| Difficult to understand the application | 25 | 22 |
- Percentages for the FLTCIP are based only on those who read the application.
|
| TABLE A-28: Experience with the Application Process Among Retired Non-Buyers |
| Experience with the Application Process | FLTCIP | Public Programs |
| Was understanding the application easy/difficult for you1 |
| Easy to understand the application | 77% | 79% |
| Difficult to understand the application | 23 | 21 |
- Percentages for the FLTCIP are based only on those who read the application.
|
| TABLE A-29: Exposure to Promotional Activities Among Active Buyers |
| Promotional Activities | FLTCIP | Public Programs |
| Did you find any of the following helpful1 |
| a) read advertisements |
| Found them to be helpful | 45%* | 30% |
| Did not find them to be helpful | 55 | 70 |
| b) visit websites describing the federal program |
| Found them to be helpful | 69* | 50 |
| Did not find them to be helpful | 31 | 50 |
| c) read general brochures |
| Found them to be helpful | 82 | 84 |
| Did not find them to be helpful | 18 | 16 |
| d) call toll-free number |
| Found it to be helpful | 33* | 18 |
| Did not find it to be helpful | 67 | 82 |
| e) attend educational meetings at work |
| Found them to be helpful | 34* | 43 |
| Did not find them to be helpful | 66 | 57 |
| f) view satellite broadcasts |
| Found them to be helpful | 17* | 3 |
| Did not find them to be helpful | 83 | 97 |
- The "Not helpful" category encompasses "No, did not do this", "Did it, but did not find it helpful" and "Did not know about this."
|
| TABLE A-30: Exposure to Promotional Activities Among Active Non-Buyers |
| Promotional Activities | FLTCIP | Public Programs |
| Did you find any of the following helpful |
| a) read advertisements |
| Did not read advertisements | 38%* | 17% |
| Yes, helpful | 38 | 12 |
| Yes not helpful | 13 | 7 |
| Did not know about the advertisements | 11 | 64 |
| b) visit websites describing the federal program |
| Did not visit websites | 51* | 12 |
| Yes, helpful | 32 | 9 |
| Yes not helpful | 7 | 7 |
| Did not know abuot the websites | 10 | 72 |
| c) read general brochures |
| Did not read general brochures | 18* | 26 |
| Yes, helpful | 63 | 50 |
| Yes not helpful | 14 | 15 |
| Did not know about the general brochures | 5 | 10 |
| d) attend educational meetings at work |
| Did not attend educational meetings | 66* | 27 |
| Yes, helpful | 18 | 20 |
| Yes not helpful | 4 | 6 |
| Did not know about the educational meetings | 12 | 48 |
| e) view satellite broadcasts |
| Did not view satellite broadcasts | 76* | 12 |
| Yes, helpful | 5 | 2 |
| Yes not helpful | 3 | 2 |
| Did not know about the satellite broadcasts | 16 | 84 |
| TABLE A-31: Exposure to Promotional Activities Among Retired Buyers |
| Promotional Activities | FLTCIP | Public Programs |
| Did you find any of the following helpful1 |
| a) read advertisements |
| Found them to be helpful | 57%* | 13% |
| Did not find them to be helpful | 43 | 87 |
| b) visit websites describing the federal program |
| Found them to be helpful | 40* | 17 |
| Did not find them to be helpful | 60 | 83 |
| c) read general brochures |
| Found them to be helpful | 85* | 60 |
| Did not find them to be helpful | 15 | 40 |
| d) call toll-free number |
| Found it to be helpful | 42* | 21 |
| Did not find it to be helpful | 58 | 79 |
- The "Not helpful" category encompasses "No, did not do this", "Did it, but did not find it helpful" and "Did not know about this."
|
| TABLE A-32: Reasons for Buying LTC Insurance: Active Buyers |
| Reasons for Buying | FLTCIP | Private Programs | Public Programs |
| Single most important reason for buying LTC insurance1 |
| Avoid using own income | 22% | 23% | 10%* |
| Assure that care is affordable | 28* | 18 | 18 |
| Assure greater freedom in choosing service providers | 5 | 3 | 10 |
| Avoid having to rely on relatives for care | 19 | 19 | 31* |
| Assure that spouse's standard of living will not decline if individual needs care | 7 | 14 | 10 |
| Avoid relying on Medicaid | 2 | 2 | 3 |
- Responders in all groups had indicated other reasons, in addition to the ones presented here, for which they bought LTC insurance. Presented here are only the common reasons and that is why the reported percentages do not add up to 100.
|
| TABLE A-33: Reasons for Buying LTC Insurance: Retired Buyers |
| Reasons for Buying | FLTCIP | Private Programs | Public Programs |
| Single most important reason for buying LTC insurance1 |
| Avoid using own income | 25%* | 21% | 12% |
| Assure that care is affordable | 23* | 15 | 9 |
| Assure greater freedom in choosing service providers | 3 | 5 | 14 |
| Avoid having to rely on relatives for care | 17 | 19 | 33* |
| Assure that spouse's standard of living will not decline if individual needs care | 10 | 12 | 11 |
| Avoid relying on Medicaid | 2 | 2 | 3 |
- Responders in all groups had indicated other reasons, in addition to the ones presented here, for which they bought LTC insurance. Presented here are only the common reasons and that is why the reported percentages do not add up to 100.
|
| TABLE A-34: Comparison of Current LTC Insurance Program to Other Programs Among Active Buyers |
| Reasons for Buying | FLTCIP | Private Programs | Public Programs |
| Was the current FLTCIP compared to other programs1 |
| Yes | 54% | | 33% |
| No | 46 | | 66 |
| Why was the current FLTCIP purchased instead of a different program2 |
| a) lower rates |
| Yes | 31 | | 39 |
| No | 69 | | 61 |
| b) better benefits |
| Yes | 25 | | 34 |
| No | 75 | | 66 |
| c) recommended by others |
| Yes | 9 | | 9 |
| No | 91 | | 91 |
| d) easier to qualify |
| Yes | 40* | | 3 |
| No | 60 | | 97 |
| e) easier to get benefits |
| Yes | 15* | | 4 |
| No | 85 | | 96 |
| f) easier to understand coverage |
| Yes | 22* | | 5 |
| No | 78 | | 95 |
| g) Federal Government sponsorship |
| Yes | 74* | | 13 |
| No | 26 | | 87 |
- Responders from CALPERS had the option of saying "Don't know" to this question and that is why the reported percentages in the Public Programs group do not add up to 100.
- For this category, Public Programs include only the CALPERS database.
|
| TABLE A-35: Comparison of Current LTC Insurance Program to Other Programs Among Retired Buyers |
| Reasons for Buying | FLTCIP | Private Programs | Public Programs |
| Was the current FLTCIP compared to other programs1 |
| Yes | 67% | 68% | 67% |
| No | 33 | 32 | 31 |
| Why was the current FLTCIP purchased instead of a different program2 |
| a) lower rates |
| Yes | 44 | | 54 |
| No | 56 | | 46 |
| b) better benefits |
| Yes | 33* | | 45 |
| No | 67 | | 55 |
| c) recommended by others |
| Yes | 7 | | 6 |
| No | 93 | | 94 |
| d) easier to qualify |
| Yes | 18* | | 3 |
| No | 82 | | 97 |
| e) easier to get benefits |
| Yes | 7* | | 0 |
| No | 93 | | 100 |
| f) easier to understand coverage |
| Yes | 21* | | 9 |
| No | 79 | | 91 |
| g) Federal Government sponsorship |
| Yes | 84* | | 17 |
| No | 16 | | 83 |
- Responders from CALPERS had the option of saying "Don't know" to this question and that is why the reported percentages in the Public Programs group do not add up to 100.
- For this category, Public Programs include only the CALPERS database.
|
| TABLE A-36: Reasons for Not Buying the Current LTC Insurance Program: Active Non-Buyers |
| Reasons for Not Buying | FLTCIP | Private Programs | Public Programs |
| Were the following reasons not to buy the current FLTCIP: |
| a) do not think LTC services wil ever be needed1 |
| Yes, a reason | 8% | 25%* | 14% |
| No, not a reason | 92 | 75 | 86 |
| b) Medicare/Medicaid will pay for LTC services2 |
| Yes, a reason | 16* | 25* | 1* |
| No, not a reason | 84 | 75 | 99 |
| c) family/relatives will take care of individual3 |
| Yes, a reason | 7 | 19* | 12 |
| No, not a reason | 93 | 81 | 88 |
| d) FLTCIP is too expensive1 |
| Yes, a reason | 66 | 72 | 48* |
| No, not a reason | 34 | 28 | 52 |
| e) do not mind using own income to pay for LTC2 |
| Yes, a reason | 15* | 28* | 2* |
| No, not a reason | 85 | 72 | 98 |
| f) have other insurance like FEHB3 |
| Yes, a reason | 13 | 24* | 9 |
| No, not a reason | 87 | 76 | 91 |
| g) do not believe insurance companies will pay benefits |
| Yes, a reason | 18* | 37 | |
| No, not a reason | 82 | 63 | |
| h) will buy the LTC insurance later1,4 |
| Yes, a reason | 52 | 44 | 45 |
| No, not a reason | 48 | 56 | 55 |
| i) information about the FLTCIP too confusing |
| Yes, a reason | 22* | | 0 |
| No, not a reason | 78 | | 100 |
| j) not happy with the features |
| Yes | 17* | | 1 |
| No | 83 | | 99 |
- For this category, Public Programs include only the CALPERS database.
- For this category, Public Programs include only the Michigan database.
- For this category, Public Programs include only the CALPERS and the Michigan databases.
- The "No, not a reason" category combines "Don't know" and "No, not a reason."
|
| TABLE A-37: Reasons for Not Buying the Current LTC Insurance Program: Retired Non-Buyers |
| Reasons for Not Buying | FLTCIP | Private Programs | Public Programs |
| Were the following reasons not to buy the current FLTCIP:1 |
| a) do not think LTC services wil ever be needed |
| Yes, a reason | 11% | 34%* | 18% |
| No, not a reason | 89 | 66 | 82 |
| b) Medicare/Medicaid will pay for LTC services2 |
| Yes, a reason | 14* | 32* | 3* |
| No, not a reason | 86 | 68 | 97 |
| c) family/relatives will take care of individual3 |
| Yes, a reason | 11* | 21 | 23 |
| No, not a reason | 89 | 79 | 77 |
| d) FLTCIP is too expensive1 |
| Yes, a reason | 62 | 84* | 60 |
| No, not a reason | 38 | 16 | 40 |
| e) do not mind using own income to pay for LTC2 |
| Yes, a reason | 25* | 43* | 6* |
| No, not a reason | 75 | 57 | 94 |
| f) have other insurance like FEHB3 |
| Yes, a reason | 19 | | 13 |
| No, not a reason | 81 | | 87 |
| g) do not believe insurance companies will pay benefits |
| Yes, a reason | 13* | 44 | |
| No, not a reason | 87 | 56 | |
| h) will buy the LTC insurance later1 |
| Yes, a reason | 22* | | 36 |
| No, not a reason | 78 | | 64 |
| i) information about the FLTCIP too confusing |
| Yes, a reason | 19* | | 0 |
| No, not a reason | 81 | | 100 |
| j) not happy with the features2 |
| Yes | 16* | | 1 |
| No | 84 | | 99 |
- For this category, Public Programs include only the CALPERS database.
- For this category, Public Programs include only the Michigan database.
- For this category, Public Programs include only the CALPERS and the MetLife databases.
|
| TABLE A-38: Three Most Important Common Reasons for Not Buying the Current Program Among Active Non-Buyers |
| Reasons for Not Buying | FLTCIP | Private Programs | Public Programs |
| Three most important reasons not to buy the current program1,2 |
| Cannot afford the current program | 30% | 44% | 37% |
| Current program is too expensive | 24 | --- | --- |
| Will buy the current program later | 13 | 8 | 5 |
| I don't think I will ever need LTC insurance | --- | 4 | --- |
| My family will take care for me | --- | --- | 2 |
- For this category, Public Programs include only the CALPERS and the MetLife databases.
- In addition to the common among all files categories, 14% of ANB from Michigan responded that it is too early to plan and 16% of RNB from CALPERS responded that they want to use their money for other purposes.
|
| TABLE A-39: Three Most Important Common Reasons for Not Buying the Current Program Among Retired Non-Buyers |
| Reasons for Not Buying | FLTCIP | Private Programs | Public Programs |
| Three most important reasons not to buy the current program1,2 |
| Cannot afford the current program | 33% | --- | --- |
| Current program is too expensive | 15 | 45 | 38 |
| Will buy the current program later | 7 | --- | --- |
| I don't mind using own income/assets | --- | 7 | 4 |
| I don't think I will ever need LTC insurance | --- | 4 | --- |
| I have other insurance | --- | --- | 4 |
- For this category, Public Programs include only the CALPERS and the MetLife databases.
- In addition to the common among all files categories, 17% of RNB from Michigan responded that there is no reason for not buying and 14% of RNB from CALPERS responded that it is too confusing to know which is the right policy for them.
|
| TABLE A-40: Factors that Would Make Active Non-Buyers More Interested in Buying the Current Program |
| Factors | FLTCIP | Private Programs | Public Programs |
| More interested in buying the current program if: |
| a) there was a guarantee that premiums will not increase in the future |
| Agree | 83% | 91% | |
| Disagree | 17 | 9 | |
| b) premiums were tax deductible1 |
| Agree | 87* | 93 | 97* |
| Disagree | 13 | 7 | 3 |
- For this category, Public Programs include only the CALPERS database.
|
| TABLE A-41: Factors that Would Make Retired Non-Buyers More Interested in Buying the Current Program |
| Factors | FLTCIP | Private Programs | Public Programs |
| More interested in buying the current program if: |
| a) there was a guarantee that premiums will not increase in the future |
| Agree | 76% | 79% | |
| Disagree | 24 | 21 | |
| b) premiums were tax deductible1 |
| Agree | 77 | 80 | 81 |
| Disagree | 23 | 20 | 19 |
- For this category, Public Programs include only the CALPERS database.
|
This data brief was prepared under contract between the U.S. Department of Health and Human Services, Office of the Assistant Secretary for Planning and Evaluation, Office of Disability, Aging and Long-Term Care Policy (DALTCP) and Abt Associates. The brief was written by LifePlans, Inc. For additional information on this subject, or to view the other briefs in this series, you can visit the ASPE home page at http://aspe.hhs.gov, the DALTCP home page at http://aspe.hhs.gov/_/office_specific/daltcp.cfm or contact the ASPE Project Officer, Hunter McKay, at HHS/ASPE/DALTCP, Room 424E, H.H. Humphrey Building, 200 Independence Avenue, S.W., Washington, D.C. 20201, Hunter.McKay@hhs.gov.
LONG-TERM CARE INSURANCE FOR THE FEDERAL FAMILY: A STUDY OF BUYERS, NON-BUYERS AND NON-RESPONDENTS REPORTS AVAILABLE
- A Comparison of Demographic and Attitudinal Characteristics Among Active and Retired Buyers, Non-Buyers and Non-Responders to the Federal Long-Term Care Insurance Program
- HTML http://aspe.hhs.gov/daltcp/reports/charcom.htm
- PDF http://aspe.hhs.gov/daltcp/reports/charcom.pdf
- A Demographic and Attitudinal Profile of Buyers of the Federal Long-Term Care Insurance Program
- HTML http://aspe.hhs.gov/daltcp/reports/buyprof.htm
- PDF http://aspe.hhs.gov/daltcp/reports/buyprof.pdf
- A Demographic and Attitudinal Profile of Non-Buyers of the Federal Long-Term Care Insurance Program
- HTML http://aspe.hhs.gov/daltcp/reports/nonbuyprof.htm
- PDF http://aspe.hhs.gov/daltcp/reports/nonbuyprof.pdf
- A Demographic and Attitudinal Profile of Non-Responders of the Federal Long-Term Care Insurance Program
- HTML http://aspe.hhs.gov/daltcp/reports/nonresprof.htm
- PDF http://aspe.hhs.gov/daltcp/reports/nonresprof.pdf
- Marketing Activities: A Comparative Analysis of Engagement and Participation Among Buyers, Non-Buyers and Non-Responders of the Federal Long-Term Care Insurance Program
- HTML http://aspe.hhs.gov/daltcp/reports/markact.htm
- PDF http://aspe.hhs.gov/daltcp/reports/markact.pdf
- Multivariate Analysis of Buyers and Non-Buyers of the Federal Long-Term Care Insurance Program
- HTML http://aspe.hhs.gov/daltcp/reports/2004/FLTCIanal.htm
- PDF http://aspe.hhs.gov/daltcp/reports/2004/FLTCIanal.pdf
- What We Know About Buyers and Non-Buyers of Private Long-Term Care Insurance: A Review of Studies
- HTML http://aspe.hhs.gov/daltcp/reports/LTCIlr.htm
- PDF http://aspe.hhs.gov/daltcp/reports/LTCIlr.pdf
LONG-TERM CARE INSURANCE FOR THE FEDERAL FAMILY: ANALYSIS OF FOLLOW-UP SURVEY DATA REPORTS AVAILABLE
- A Comparative Analysis of the Socio-Demographic and Attitudinal Characteristics of Active Buyers and Non-Buyers of Long-Term Care Insurance in the Federal, Private and Public Sectors
- HTML http://aspe.hhs.gov/daltcp/reports/2004/LTCIchar.htm
- PDF http://aspe.hhs.gov/daltcp/reports/2004/LTCIchar.pdf
- Does Geographic Location Make a Difference? A Comparative Analysis of the Socio-Demographic and Attitudinal Characteristics of Active Buyers and Non-Buyers of the Federal Long-Term Care Insurance Program
- HTML http://aspe.hhs.gov/daltcp/reports/FLTCIloc.htm
- PDF http://aspe.hhs.gov/daltcp/reports/FLTCIloc.pdf
To obtain a printed copy of this report, send the full report title and your mailing information to:
U.S. Department of Health and Human ServicesOffice of Disability, Aging and Long-Term Care PolicyRoom 424E, H.H. Humphrey Building200 Independence Avenue, S.W.Washington, D.C. 20201FAX: 202-401-7733Email: webmaster.DALTCP@hhs.gov
RETURN TO:
Office of Disability, Aging and Long-Term Care Policy (DALTCP) Home [http://aspe.hhs.gov/_/office_specific/daltcp.cfm]Assistant Secretary for Planning and Evaluation (ASPE) Home [http://aspe.hhs.gov]U.S. Department of Health and Human Services Home [http://www.hhs.gov]
