
by:
Irma Perez-Johnson, Debra Strong, and Michelle Van Noy
With Contributions by:
Charles Nagatoshi
Submitted to:
Department of Health and Human Services
Office of the Assistant Secretary for Planning and Evaluation
Project Officer: Alana Landey
Submitted by:
Mathematica Policy Research, Inc.
Project Director: Alan Hershey
Acknowledgments
This report is part of a congressionally mandated evaluation of the Welfare-to-Work (WtW) Grants program, being conducted by Mathematica Policy Research, Inc. (MPR), and its subcontractors, the Urban Institute and Support Services International. Completing it would not have been possible without the diligent work of a large cast of individuals at MPR and other organizations. The authors wish to acknowledge their contributions.
We could not have completed the report without help from dozens of busy WtW grantee program administrators and staff members across our evaluation sites who gave generously of their time and helped us analyze the costs of their WtW programs. These individuals helped us compile the necessary financial, participation, and outcomes information, and then worked closely with us to interpret this rich and complex information.
At MPR, Alan Hershey, the director of the overall evaluation, oversaw the conduct of the cost analysis and provided insightful guidance throughout. Patricia Ciaccio provided careful editing. William Garrett and others on MPRs secretarial staff did a superb word processing and production job, as usual. We are especially grateful to Walter Corson, at MPR, and Demetra Smith Nightingale, at the Urban Institute, for their thoughtful and constructive comments as reviewers of the draft document. We also received valuable support from the U.S. Department of Health and Human Services and the U.S. Department of Labor. In particular, Alana Landey, the project officer in the USDHHS office of the Assistant Secretary for Planning and Evaluation has consistently provided useful advice and guidance. We are thankful for careful reading and useful comments on the draft report.
We appreciate these contributions, as well of those of any other individuals we may have omitted unintentionally. Any errors or omissions are strictly the responsibility of the authors.
I. Introduction
The Welfare-to-Work (WtW) grants program is one of several major federally funded initiatives whose purpose is to help welfare recipients and other low-income parents move into employment. In 1997, the Balanced Budget Act (BBA) authorized the U.S. Department of Labor (DOL) to award $3 billion in WtW grants to states and local organizations. These grants were intended to support efforts to help the hardest-to-employ recipients of Temporary Assistance for Needy Families (TANF), as well as noncustodial parents, prepare for employment, find jobs, stay employed, and advance in the job market. The WtW grants program built on the earlier enactment, in 1996, of the Personal Responsibility and Work Opportunity Reconciliation Act (PRWORA), which created the work-focused, time-limited TANF program. PRWORA was designed to move people off the welfare rolls and into employment more quickly. WtW grants provided resources targeted to state and local efforts to help particularly disadvantaged individuals who were likely to have great difficulty making that transition.
This report examines the costs of WtW programs in nine sites that operated with federal grant support. The WtW cost analysis is part of a comprehensive, congressionally mandated evaluation, which is being conducted by Mathematica Policy Research, Inc. (MPR), the Urban Institute, and Support Services International, Inc. under a contract from the U.S. Department of Health and Human Services.
The main objectives of the WtW cost analysis were to understand the cost structure of selected programs and factors that influence program costs. Program evaluators and planners should find this information useful in assessing the outcomes of WtW programs and in making decisions about future programs with similar objectives. Table I.1 summarizes the main findings from the cost study.
|
The Welfare-to-Work Grants Program
The BBA defined WtW programs as a complement to the "work first" programs established under TANF. The WtW initiative was developed to give states and localities additional resources to help the hardest-to-employ segments of the TANF population, including the noncustodial parents of children on TANF, find work. To ensure that grantees used WtW resources as intended, the legislation established detailed spending rules. For example, it required that at least 70 percent of grant funds be spent on individuals who met specific eligibility criteria.(1)
DOL distributed the $3 billion in funding that Congress provided for the WtW program to states and to competitive grantees in stages during 1998 and 1999. Seventy-five percent of the federal WtW funds were allocated to states based on a formula that considered states' share of the national poverty population and TANF caseload. State formula grants were awarded in 1998 and 1999. States had to pass 85 percent of the funding they received to local workforce investment boards (WIBs). WIBs and other groups could also receive separate competitive grants directly from DOL. Competitive grants were awarded in three rounds, announced in May 1998, November 1998, and October 1999.
The organizations that actually served WtW program participants were nevertheless diverse. The BBA and its implementing regulations (20 CFR 645.220) required that services relating to job readiness and job placement, as well as postemployment services, be provided through contracts or vouchers. At the local level, therefore, WtW grantees often solicited competitive bids and awarded subcontracts to several community-based and other provider organizations for WtW service delivery.
WtW programs were thus designed and operated primarily at the local level. Partly because of the grantees' reliance on subcontracting, a diverse mix of programs emphasizing different services and targeting different groups of WtW-eligible individuals was often implemented. This rich variety of WtW approaches was evident both across and within grantee initiatives.
Congress did not intend to provide ongoing support for these interventions. WtW grantees were originally given three years from the date they received their WtW awards (both formula and competitive) to spend their grants. WIBs and other WtW grantees, in turn, passed these same requirements to the providers with whom they subcontracted for WtW services. Ultimately, Congress extended the period over which WtW funds may be used to a total of five years.(2) However, no additional appropriations for WtW have occurred or are planned.
The National Evaluation and Cost Analysis
The WtW cost analysis is part of a comprehensive, congressionally mandated evaluation of this federal grants program. The National Evaluation of the Welfare-to-Work Grants Program includes three major components:
1. Descriptive Assessment of All WtW Grantees. Mail surveys of all grantees, conducted in 1998 and 1999, provided an overview of program designs and activities, target populations, characteristics of participants, and, when available, information on early placement outcomes. Visits to several dozen grantees before the first survey helped develop a fuller understanding of program variations and provided a basis for selection of in-depth study sites. Previously released reports document the findings from both national surveys and the early visits to selected grantees. (3)
2. Process and Implementation Study. In 1999-2000 and 2000-2001, two rounds of site visits were conducted to 11 grantee evaluation sites. Some sites were selected because of their innovative approaches, settings, or target groups, others because they were typical of the most common WtW interventions. The process visits included discussions with staff of WtW programs and related agencies, focus groups with participants, and program observations. The aim of the process and implementation study has been to identify implementation issues and challenges, as well as lessons for program implementation.(4)
3. Outcomes Analysis. In 10 of the 11 process study sites, a sample of WtW participants was enrolled. Follow-up data on these participants are being collected through surveys and administrative data. These data are being used to analyze participants' activities in the programs and their employment and social outcomes. The 10 grantee sites where such analyses are being conducted are called the "in-depth study" sites.
In addition, a special process and implementation study focuses on documenting welfare and employment systems operated by American Indian and Alaska Native grantees, the supportive services they provide, and how these tribal grantees integrate funds from various sources to help their members move from welfare to work.(5)
The original design for the national WtW evaluation called for impact and cost-effectiveness analyses based on a random-assignment experimental design. Such analyses were to be conducted in the in-depth study sites. Estimating the full costs of delivering WtW program services was an essential foundation for the proposed cost-effectiveness analysis. The impact and cost-effectiveness components of the WtW evaluation proved infeasible, however. The main barrier to conducting the impact study was difficulty finding grantees that were identifying more eligible candidates than they could serve (grantees with excess demand) a necessary precondition for random assignment. Without impact estimates, it was impossible to assess the cost-effectiveness of WtW programs.
A detailed analysis of the costs of WtW programs is still useful, however. The new time-limited nature of welfare assistance raises the stakes of participation in programs such as WtW for individual participants. It also makes it important to examine how fiscal and other resources are distributed to support the transition to employment and self-sufficiency. The goals of the WtW cost analysis were therefore redefined to focus on (1) understanding more fully how specific WtW interventions operated, and (2) exploring the cost implications of the alternative strategies or approaches used by WtW program operators. More specifically, the WtW cost analysis was restructured to address three descriptive and analytic objectives:
1. Describe the cost experiences of selected WtW programs
2. Compare program costs across grantees, sites, or program components
3. Identify factors that help account for cost variations within and across WtW programs and explore why and how these factors affect costs
Programs Included in the Cost Analysis
The process and implementation analysis explored the implementation of the full range of WtW grant-funded initiatives in the grantee study sites. These grantee initiatives often included multiple programs distinct interventions offering different mixes of services, targeting specific groups of WtW-eligible clients, or operated by different contractors. The cost analysis focuses on a subset of the programs that received operational support through WtW grant funds in the evaluation's in-depth study sites. Eighteen WtW programs out of a possible 36 from 9 of the 10 in-depth study sites are included.(6) (Table C.1 in Appendix C identifies the programs excluded from this analysis.)
The programs included in the WtW cost analysis were purposefully selected. Whenever possible, we sought to develop cost estimates for all programs that were enrolling a sample of participants for the evaluation's outcomes study. Because these programs were more intensively involved in the evaluation, it was more feasible to collaborate with local staff to collect this type of information.
This was not possible in all in-depth study sites, however. In two in-depth evaluation sites Boston and Fort Worth the grantees enrolled WtW study participants and then referred them to as many as 13 different programs.(7) In these two sites, it would have been impractical to collect and analyze cost information for all these programs, so we selected a subset of the programs that could potentially serve WtW sample members. The cost analysis includes those programs that served the largest number of WtW participants and that reflected (to the extent possible) the variety of WtW service delivery approaches that was evident at the grantee site.
The WtW programs differed along three important dimensions (Table I.2):(8)
1.Service Locations. Most (16) of the programs operated out of one or two locations. However, the West Virginia program, which covered 29 rural counties, had six offices, and the Nashville program, which contracted with several service providers, had seven offices.
2. Target Population. All of the cost analysis programs were open to all WtW-eligible participants. However, many developed interventions that were more specifically tailored to the needs of a particular segment of this population. Of the 18 programs
| WtW Program Services | |||||||||||
|---|---|---|---|---|---|---|---|---|---|---|---|
| In-Depth Study Site: WtW Program Operator | Service Delivery Locations | Target Population | Outreach and Recruitment | Job Readiness | Case Management | Paid Work Experience | Job Development and Placement | Subsidized Employment | Post- employment Followup | Retention/ Advancement Incentives | Support Services |
| Boston: | |||||||||||
| Marriott | 1 | Relatively job-ready | X | X | X | X | X | ||||
| Partners | 1 | Relatively job-ready | X | X | X | X | X | ||||
| Chicago: | |||||||||||
| Catholic Charities | 2 | Hard-to-serve | X | X | X | X | X | X | |||
| Employment and Employer Services (E&ES) | 1 | General WtW-eligible | X | X | X | X | X | X | |||
| Easter Seals | 1 | Hard-to-serve | X | X | X | X | X | X | X | ||
| Maximus | 2 | General WtW-eligible | X | X | X | X | X | ||||
| Pyramid | 1 | Relatively job-ready | X | X | X | X | X | X | |||
| Fort Worth: | |||||||||||
| Arlington Night Shelter (ANS) | 1 | Homeless | X | X | X | X | X | X | |||
| Women's Center (WC) | 1 | General WtW-eligible | X | X | X | X | X | ||||
| Johns Hopkins University: | |||||||||||
| Florida | 1 | Employed | X | X | X | X | X | X | |||
| Maryland | 1 | Employed | X | X | X | X | X | ||||
| Nashville: | |||||||||||
| Pathways | 7 | General WtW-eligible | X | X | X | X | X | X | X | ||
| Philadelphia: | |||||||||||
| Transitional Work Corporation (TWC) | 1 | Hard-to-serve | X | X | X | X | X | X | X | X | |
| Phoenix: | |||||||||||
| Employment And Respect Now (EARN) | 1 | EC residents | X | X | X | X | X | X | |||
| West Virginia: | |||||||||||
| Human Resources Development (HRD) | 6 | Rural residents | X | X | X | X | X | X | X | X | X |
| Yakima: | |||||||||||
| People for People (PFP) | 2 | WtW-eligible/ NCPs | X | X | X | X | X | X | |||
| Farm Workers Clinic (FWC) | 1 | Migrant workers | X | X | X | X | X | X | |||
| Opportunities Industrialization Center (OIC) | 1 | General WtW-eligible | X | X | X | X | X | X | |||
| Note: EC = enterprise community; NCPs = noncustodial parents. | |||||||||||
included in the cost analysis, 8 targeted hard-to-serve individuals.(9) Five programs targeted WtW-eligible individuals more generally, and two targeted WtW-eligible recipients who had already found employment.
3. Complementary Services. The content, intensity, and method of delivering WtW services varied across the programs. All of the WtW cost analysis programs, however, provided some form of job readiness, case management, job placement and postemployment follow-up services (Table I.2). The programs varied more in the extent to which they offered other services. Fourteen programs provided some assistance with support services such as child care and transportation (always to supplement those provided by TANF), but four relied only on TANF-funded support services. Similarly, eight programs engaged in some outreach and recruitment activities, while the other 10 relied primarily on referrals from the local TANF offices to identify and enroll WtW-eligible participants. Nine of the 18 programs offered paid work experience to their WtW participants; three offered subsidized employment with private employers. Four of the cost analysis programs used incentives to reward participants for good performance or achievement of notable employment milestones, although this was not a major emphasis of any intervention.
As we discuss in the following chapters, the costs of these programs varied in ways that were consistent with these differences. This variation is a rich source of information and yields important insights into WtW program operations. Chapter II describes the methods we used to estimate the full costs of operating these programs and presents our cost estimates. Chapter III explores the variation in measures of total and unit costs for WtW programs. Chapter IV places our cost findings in the larger context of evaluations of programs that have worked to link welfare recipients to employment.
1. The BBA required that at least 70 percent of all WtW grant funds (both formula and competitive) be spent on individuals with a specific combination of employment barriers. They could be TANF recipients who themselves (1) had been receiving TANF or AFDC for 30 or more months or were within 12 months of reaching a time limit; and (2) faced two of three specific barriers to employment lack of a high-school diploma or GED certificate and low reading or math skills; substance abuse problems; or a poor work history. Alternatively, they could be noncustodial parents who faced two of these same three barriers and had children in a long-term TANF case. As the WtW programs were implemented, it quickly became clear that the congressionally defined eligibility criteria were slowing enrollment and limiting participation. Therefore, the WtW eligibility rules were amended in November 1999. These amendments left intact the requirement that 70 percent of WtW funds be spent on a defined category of participants, but broadened this category to make it easier for both TANF recipients and noncustodial parents to qualify for WtW services. (For more details, see Perez-Johnson et al. 1999.)
2. This extension was granted in response to the difficulties that most grantees encountered enrolling WtW-eligible individuals, which lasted for most of the grants' original implementation period. The restrictiveness of legislatively defined eligibility criteria was a major contributing factor to these difficulties. These implementation issues are discussed in more detail in Fender et al. 2000 and other reports from the national evaluation.
3. For results of the two surveys, see Perez-Johnson and Hershey 1999, and Perez-Johnson et al. 2000. Findings from the exploratory site visits are discussed in Nightingale et al. 2000.
4. Findings from the first round of process visits are discussed in Nightingale 2001. Topical briefs on recruitment challenges and strategies (Fender et al. 2000) and on the approaches used by programs serving noncustodial parents (Martinson et al. 2000) are also available.
5. Results for the first year of the tribal program evaluation are reported in Hillabrant and Rhoades 2000.
6. We were unable to collect cost information for the Milwaukee study site, the NOW program, operated by the Wisconsin Department of Corrections.
7. In Boston, individuals determined eligible for WtW could be referred to one of 11 "employer partnerships" or two "enhanced community service" programs.
8. Appendix A contains detailed profiles of these programs.
9. These include the Philadelphia-TWC, Chicago-Catholic Charities, and Chicago-Easter Seals programs, which targeted individuals generally considered hard-to-employ because of limited work experience, substance abuse problems, or physical disabilities. They also include programs that targeted residents in Phoenix's enterprise community, homeless individuals (Fort Worth-ANS), residents from the extremely isolated rural areas in West Virginia, and migrant farmworkers (Yakima-FWC) or noncustodial parents (Yakima-PFP). While the BBA did not categorize noncustodial parents as "hard-to-employ," the experience of WtW programs aiming to work with this group suggests that they can have many obstacles to program participation and employment (see Martinson et al. 2000).
II. Measuring Program Costs
The goal of our cost analysis was to develop cost measures that were consistent across all programs and that captured all of the costs of WtW interventions. Consistent information is useful for assessing the outcomes of WtW grants programs and for budgeting new programs similar to them. Measuring the cost of WtW program operations consistently involved formulating definitions, assumptions, and procedures for data collection and analysis, which influenced the estimates developed. Therefore, an understanding of these definitions, procedures, and assumptions is essential to interpreting the cost estimates correctly.
In this chapter, we describe the procedures and conventions used to conduct the WtW cost analysis. We also present the three types of cost estimates developed: (1) total costs for one year of program operations, (2) allocations of total costs across major program components, and (3) total unit costs per participant and per job placement. Chapter III explores the cross-program variation in these cost estimates.
Total WtW Program Costs
Our objective in estimating total costs was to measure the market value of all resources used to serve WtW participants. To do this, we (1) defined the interventions at each WtW program, (2) determined a specific time period for which costs would be analyzed, (3) identified the resources used to provide the interventions, and (4) used market prices or equivalent unit-cost estimates to determine the value of those resources. We then took, as our estimate of total WtW program costs, the sum of the values for all resources used.
How Total WtW Program Costs Were Estimated
Here we describe in more detail the four key steps used to estimate the total costs of WtW programs:
- Defining WtW Interventions. We defined WtW interventions as all activities conducted and services delivered to participants directly by WtW program staff. We also included services that other agencies provided to WtW participants (as in-kind contributions, through referrals, or on a fee-for-service basis) when such services were an integral feature of the programs.
- Establishing Cost Analysis Periods. We measured costs for a single year of program operations instead of for the duration of the WtW programs. The cost analysis year varied by program; in most cases, it ran from January 2000 to December 2000 or from July 2000 to June 2001.(1) These were relatively stable periods in program operations, when the programs most closely resembled ongoing ones.(2) Aiming for as much overlap as possible in the cost analysis years for individual programs enhanced their overall comparability because they were subject to similar grant regulations and national economic conditions.
- Identifying WtW Resources. Before collecting and analyzing cost information, we reviewed site visit summaries and other evaluation documents to learn more about the WtW programs. We refined our understanding of these programs through telephone conversations with program staff. In addition, members of the cost analysis team participated in process analysis visits to a few programs. This information helped us define the interventions and identify the types of resources used to support the programs.(3) We then worked with program staff to obtain budget, staff utilization, and expenditure data for the cost analysis period.
- Determining Market Value. In general, the costs recorded in the accounting systems of the WtW program operators reflected true costs. When the timing of expenditures and the utilization of resources differed, or when resources were not obtained in the open marketplace (for example, when services were donated), we made adjustments to include all resources used in actual program operations for the analysis period.
Estimates of Total Costs for WtW Programs
Table II.1 summarizes the total cost estimates and the estimation process. For each WtW program, the table presents the costs the program operator recorded in its accounting system and our estimates of costs incurred off-budget (outside the program's accounts). As the table shows, adjustments were limited and generally accounted for a small portion of total WtW program costs.(4)
Our estimates of total costs are subject to some uncertainty, as we describe below. Nevertheless, we feel that all important costs have been captured and that missing or misestimated costs are unlikely to affect the basic results of our analysis. Resources excluded from our cost estimates are generally small, affected only a small proportion of WtW participants, or both. Therefore, their absence should not substantially affect the cost estimates or analysis.
Despite the adjustments made, not all costs are captured or captured equally accurately in these estimates. Because the objectives of the accounting systems that WtW grantees or program operators maintained differed from the objectives of the cost analysis, we could not obtain data for the analysis solely from program expenditure records. In addition, the structure and definitions of accounting systems differed.
Another source of uncertainty is the inclusion of special demonstration costs. Throughout the evaluation, the WtW programs included in the cost analysis incurred extra expenses to accommodate research requirements and requests. Because we believe these costs were
| Costs Reported in WtW Accounts | Off-Budget Adjustments | ||||||||
|---|---|---|---|---|---|---|---|---|---|
| WtW Programs | Cost Analysis Year | Total Costs | WtW Program Expenditures | Percent of Total Costs | Supportive or Other Services | Volunteered Time | Administration and Other Indirect Costs | Total Off-Budget Adjustments | Percent of Total Costs |
| Boston-Marriott | Nov. 99 - Oct. 00 | $216,233 | $204,450 | 95 | $11,783 | $11,783 | 5 | ||
| Boston-Partners | Oct. 99 - Sep. 00 | $436,673 | $385,754 | 88 | $29,625 | $21,294 | $50,919 | 12 | |
| Chicago-Maximus | Jul. 00 - Jun. 01 | $1,377,100 | $1,348,600 | 98 | $28,500 | $28,500 | 2 | ||
| Chicago-E&ES | Jun. 00 - May 01 | $1,867,690 | $1,530,190 | 82 | $337,500 | $337,500 | 18 | ||
| Chicago-Pyramid | Jul. 00 - Jun. 01 | $711,242 | $671,492 | 94 | $39,750 | $39,750 | 6 | ||
| Chicago-Catholic Charities | Jan. 00 - Dec. 00 | $1,722,558 | $1,591,233 | 92 | $131,325 | $131,325 | 8 | ||
| Chicago-Easter Seals | Jul. 00 - Jun. 01 | $439,691 | $406,691 | 92 | $33,000 | $33,000 | 8 | ||
| Fort Worth-ANS | Jan. 00 - Dec. 00 | $231,760 | $231,760 | 100 | $0 | 0 | |||
| Fort Worth-WC | Jan. 00 - Dec. 00 | $440,222 | $440,222 | 100 | $0 | 0 | |||
| JHU-Florida | Jul. 00 - Jun. 01 | $315,908 | $271,644 | 86 | $44,264 | $44,264 | 14 | ||
| JHU-Maryland | Jul. 00 - Jun. 01 | $394,982 | $284,198 | 72 | $110,784 | $110,784 | 28 | ||
| Nashville-Pathways | Jul. 00 - Jun. 01 | $1,326,515 | $1,306,115 | 98 | $20,400 | $20,400 | 2 | ||
| Philadelphia-TWC | Jan. 00 - Dec. 00 | $7,757,912 | $7,639,236 | 98 | $118,676 | $118,676 | 2 | ||
| Phoenix-EARN | Jul. 00 - Jun. 01 | $1,920,564 | $1,878,564 | 98 | $42,000 | $42,000 | 2 | ||
| West Virginia-HRD | Jan. 00 - Dec. 00 | $1,605,214 | $1,605,214 | 100 | $0 | 0 | |||
| Yakima-PFP | Jul. 00 - Jun. 01 | $688,187 | $558,303 | 81 | $129,884 | $129,884 | 19 | ||
| Yakima-OIC | Jul. 00 - Jun. 01 | $546,629 | $421,232 | 77 | $125,397 | $125,397 | 23 | ||
| Yakima-FWC | Jul. 00 - Jun. 01 | $639,036 | $513,399 | 80 | $125,637 | $125,637 | 20 | ||
relatively small, we did not separate them out from total program costs.(5) Thus, our cost estimates are likely to slightly overstate the costs that future nondemonstration program operators would incur to provide similar services.
This slight overstatement of administrative costs is somewhat offset by programs' inability to recognize overhead costs fully within WtW accounts. The WtW regulations limited the amount of grant funds that could be devoted to administrative expenses to 15 percent, and many WIBs and other entities administering the grants at the local level passed on these same restrictions to their WtW contractors. Thus, indirect and overhead costs--agency administration and other costs that were not program-specific--were not always charged fully to the WtW programs. When this undercharge was evident, we adjusted our total cost estimates.(6) However, such adjustments were not possible for all programs.
Finally, for analytical and practical reasons, our analysis focused on WtW-funded supportive services and excluded TANF-funded supportive services. WtW resources were expected to emphasize direct services to participants, rather than supportive ones. The BBA and WtW program regulations restricted the use of WtW grant funds to provide supportive services for participants engaged in job readiness or employment activities to situations when such services were not otherwise available. From an analytical perspective, it made sense therefore for the cost analysis to focus on the use of WtW grant (or other) funds to provide supportive services as a complementary strategy. From a practical perspective, many WtW participants received TANF-funded assistance with child care, transportation, and other supportive service needs, but such assistance was generally provided by the welfare agencies directly.(7) Thus, the staff and administrators of WtW programs had limited knowledge of the assistance their customers had actually received and could not describe such services, much less estimate their value, with confidence.
Allocating Costs to Program Components
The WtW grants program was not a single intervention, but rather a funding stream that supported many programs. These programs used different approaches to promote employment, job retention, and career advancement, but many had common elements, which we call program components. To help us understand the similarities and differences across the programs included in the cost analysis, we disaggregated total WtW costs into program components.
How Total Costs Were Allocated
We broke down total WtW costs into program administration and six other basic program components, although individual WtW programs did not necessarily include all of these components. The other components were:
- Outreach and Recruitment. All activities specifically aimed at publicizing WtW program services and generating referrals or enrollments for the programs.
- Job Readiness and Case Management. Intake, assessment, service planning, and general case management activities occurring until placement in unsubsidized employment. This component also included structured job readiness workshops and other services aimed at enhancing the overall employability and job search preparedness of WtW participants.(8)
- Work Experience and Other Paid Temporary Employment. All activities related to the development of temporary work assignments (such as community service, work experience, or on-the-job training), as well as the placement and supervision of WtW participants in such positions. The purpose of these activities was to enhance participants' overall employability, help them develop job-specific skills, or both. These activities often involved the payment of wages, subsidies, and taxes to or on behalf of WtW participants, either by the WtW program operator or a different organization.
- Job Development and Placement. All activities to identify unsubsidized job openings (in the private or public sector) for WtW participants and help them secure such employment.
- Postemployment Followup. All WtW activities occurring after placement in unsubsidized employment (such as retention followup and bonuses, advancement-focused counseling, and occupational skills training).
- Support Services. All support services funded by WtW or other entities that were provided as a complement to TANF-funded assistance, either before or after placement in unsubsidized employment (mainly transportation, along with some child care and other services).
Whenever possible, we collected accounting information broken down by these program components, which made these allocations straightforward.(9) When such detail was unavailable, we worked with program staff and administrators to break down expenditures and allocate costs to key program components. Such allocations generally followed the allocation of staff members' time (that is, the percentages of their time spent on specific WtW activities). Program costs other than staff labor that were associated with a specific component (for example, supplies used specifically for outreach, or participant wages and taxes paid as part of work experience) were allocated to that component. While allocating costs across WtW program components in this way was an inexact process, our analysis disaggregates resource use by focusing on the most distinctive elements of the WtW programs and does not partition staff activities or functions to unnecessarily fine levels of detail. Thus, we believe that it presents a useful and reasonably accurate description of the costs of important program components.
Allocation of WtW Costs to Program Components
Table II.2 summarizes the allocation of total WtW costs across program components. For each WtW program, the table shows how total costs for one year of WtW operations were distributed across the components described earlier.
| Outreach/ Recruitment | Job Readiness/ Case Management | Paid Work Experience | Job Development/ Placement | Postemployment Followup | Support Services | Administration | |||||||||
|---|---|---|---|---|---|---|---|---|---|---|---|---|---|---|---|
| Site/Program | Total Costs | Cost | Percent of Total | Cost | Percent of Total | Cost | Percent of Total | Cost | Percent of Total | Cost | Percent of Total | Cost | Percent of Total | Cost | Percent of Total |
| Boston-Marriott | $216,233 | $37,001 | 17 | $99,219 | 46 | $0 | 0 | $17,629 | 8 | $38,260 | 18 | $0 | 0 | $24,124 | 11 |
| Boston-Partners | $436,673 | $50,541 | 12 | $205,796 | 47 | $0 | 0 | $65,650 | 15 | $61,066 | 14 | $0 | 0 | $53,620 | 12 |
| Chicago-Maximus | $1,377,100 | $0 | 0 | $652,745 | 47 | $0 | 0 | $274,503 | 20 | $170,203 | 12 | $199,885 | 15 | $79,764 | 6 |
| Chicago-E&ES | $1,867,690 | $0 | 0 | $918,267 | 49 | $0 | 0 | $288,495 | 15 | $211,908 | 11 | $337,500 | 18 | $111,521 | 6 |
| Chicago-Pyramid | $711,242 | $0 | 0 | $221,759 | 31 | $273,942 | 39 | $68,234 | 10 | $51,175 | 7 | $64,170 | 9 | $31,961 | 4 |
| Chicago-Catholic Charities | $1,722,558 | $0 | 0 | $618,331 | 36 | $564,038 | 33 | $192,093 | 11 | $137,210 | 8 | $131,325 | 8 | $79,561 | 5 |
| Chicago-Easter Seals | $439,691 | $0 | 0 | $102,463 | 23 | $180,396 | 41 | $50,456 | 11 | $34,900 | 8 | $33,000 | 8 | $38,476 | 9 |
| Fort Worth-ANS | $231,760 | $0 | 0 | $134,728 | 58 | $0 | 0 | $7,843 | 3 | $23,570 | 10 | $32,427 | 14 | $33,191 | 14 |
| Fort Worth-WC | $440,222 | $0 | 0 | $217,941 | 50 | $0 | 0 | $70,358 | 16 | $77,496 | 18 | $29,475 | 7 | $44,954 | 10 |
| JHU-Florida | $315,908 | $59,451 | 19 | $0 | 0 | $0 | 0 | $47,386 | 15 | $174,594 | 55 | $0 | 0 | $34,477 | 11 |
| JHU-Maryland | $394,982 | $63,829 | 16 | $0 | 0 | $0 | 0 | $39,498 | 10 | $236,160 | 60 | $0 | 0 | $55,495 | 14 |
| Nashville-Pathways | $1,326,515 | $64,687 | 5 | $469,370 | 35 | $164,292 | 12 | $67,375 | 5 | $233,172 | 18 | $86,432 | 7 | $241,187 | 18 |
| Philadelphia-TWC | $7,757,912 | $155,129 | 2 | $1,423,558 | 18 | $3,622,211 | 47 | $569,288 | 7 | $552,857 | 7 | $118,676 | 2 | $1,316,194 | 17 |
| Phoenix-EARN | $1,920,564 | $274,812 | 14 | $395,619 | 21 | $0 | 0 | $234,062 | 12 | $706,274 | 37 | $120,806 | 6 | $188,990 | 10 |
| West Virginia-HRD | $1,605,214 | $27,426 | 2 | $344,674 | 21 | $608,811 | 38 | $820 | 0 | $370,414 | 23 | $79,107 | 5 | $173,962 | 11 |
| Yakima-PFP | $688,187 | $0 | 0 | $276,889 | 40 | $172,124 | 25 | $77,520 | 11 | $58,140 | 8 | $52,519 | 8 | $50,996 | 7 |
| Yakima-OIC | $546,629 | $0 | 0 | $224,705 | 41 | $115,485 | 21 | $85,638 | 16 | $62,132 | 11 | $22,179 | 4 | $36,490 | 7 |
| Yakima-FWC | $639,036 | $0 | 0 | $234,998 | 37 | $237,358 | 37 | $64,288 | 10 | $48,216 | 8 | $27,748 | 4 | $26,430 | 4 |
| Averages | $1,257,673 | $40,715 | 5 | $363,392 | 33 | $329,925 | 16 | $123,396 | 11 | $180,430 | 19 | $74,181 | 6 | $145,633 | 10 |
Estimating Average Costs
The decision to enroll an individual in WtW represented an offer of job readiness, employment placement, case management, supportive services, retention and advancement followup, and other assistance. Because not all participants needed or used all these services, the WtW programs did not require the capacity to provide all participants with all services. The average cost per participant describes the average value of the package of WtW services that individuals who enrolled actually received. While any individual participant's actual resource use is likely to differ from this average, this estimate provides a sound basis for comparing programs, as well as for planning interventions with goals and target populations similar to those of WtW programs.
The ultimate aim of WtW programs was to place participants in unsubsidized jobs that could make them economically self-sufficient. However, not all individuals who enrolled in WtW programs entered unsubsidized employment. Therefore, when assessing and comparing WtW programs, it is important to take into account their overall rate of success in helping participants
achieve this objective. For each WtW program, we collected information on the number of participants ever placed in unsubsidized employment during the cost analysis period and on the program's overall rate of participant placement in unsubsidized employment. We used this information to estimate average costs per participant placed in unsubsidized employment.(10)
How Average Costs per Participant Were Estimated
The average cost per participant is a broad measure that describes the financial commitment implicit in the decision to enroll an individual into a WtW program. To develop this measure, we had to estimate participation in the WtW programs. Participation figures also helped us describe the overall scale of program operations.
Whenever possible, participation measures were derived from the programs' management information systems (MIS), which usually collected information on each participant's enrollment and activities.(11) For each WtW program where MIS data were available, we used these data to determine (1) the number of participants enrolled or otherwise active during the cost analysis period, (2) the number of months each participant was active in the program, (3) the average duration of participation in the program, and (4) the total months of participation for all individuals served at any time during the cost analysis period. When MIS information was unavailable to conduct such analysis, we relied on paper-based administrative records, reports to DOL, and other documents to impute participation figures.
In our estimates, we used program longitudinal records to measure the length of enrollment from the time participants officially entered in the WtW program to the time they were terminated or deemed inactive. Some WtW programs had an open-door policy for participants who had been placed in unsubsidized jobs, which allowed them to return for assistance (for example, for reemployment assistance upon job loss or for skills upgrading or career advancement) for as long as the program operated. In such cases, termination dates usually were unavailable and had to be imputed based on program's stated expectations for how long the staff would follow participants' status after job placement.
For programs for which we had full information, we used two steps to compute average costs per participant. First, we estimated the unit cost for a month of participation in the WtW program by dividing total costs for the analysis period by the total months of participation for that year.(12) To estimate average cost per participant, we then multiplied this cost per month by the average number of months that participants received WtW services.(13)
When information on total participant-months of service was unavailable from programs' MIS data, we first divided total costs for the cost analysis period by the number of total participants ever active during that year.(14) Then, we adjusted this crude estimate of average cost per participant, to account for the fact that some of the costs of providing services to participants active during the cost analysis year would have occurred outside of this period.(15) Table II.3 summarizes this process and presents the estimates of average cost per participant.
How Average Costs per Placement Were Estimated
The average cost per participant placed in unsubsidized employment describes the average level of resources a WtW program had to invest to achieve a job placement. To develop this measure of average costs, we first had to estimate placements for each WtW program included in the cost analysis.
Placement measures were also constructed using information from the programs' MIS, whenever possible. Since these systems typically recorded more than one placement for a given participant, special attention had to be paid to counting only placements in unsubsidized employment (as opposed to work experience, on-the-job training, or other temporary work assignments) and to counting individual participants who were placed in unsubsidized employment (as opposed to the number of placements). When MIS information was unavailable to conduct such analysis, we also relied on paper-based administrative records, reports to DOL, and other documents to impute these statistics.(16)
| Total Participants | ||||||||
|---|---|---|---|---|---|---|---|---|
| Site/Program Operator | Total Costs | Carry-overs | Enrolled | Ever Active | Total Participant-Months of Service | Average Duration of Participation (in months) | Cost per Participant(a) | Imputed Cost per Participant(b) |
| Boston-Marriott | $216,233 | 51 | 36 | 87 | NA | 12.0 | NA | $2,308 |
| Boston-Partners | $436,673 | 39 | 51 | 90 | NA | 10.0 | NA | $5,407 |
| Chicago-Maximus | $1,377,100 | 55 | 891 | 946 | NA | 4.5 | NA | $3,605 |
| Chicago-E&ES | $1,867,690 | 123 | 1,057 | 1,180 | NA | 5.2 | NA | $3,392 |
| Chicago-Pyramid | $711,242 | 93 | 130 | 223 | NA | 6.1 | NA | $5,827 |
| Chicago-Catholic Charities | $1,722,558 | 413 | 350 | 763 | NA | 7.6 | NA | $3,310 |
| Chicago-Easter Seals | $439,691 | 8 | 286 | 294 | NA | 5.4 | NA | $3,086 |
| Fort Worth-ANS | $231,760 | 29 | 62 | 91 | NA | 12.0 | NA | $2,365 |
| Fort Worth-WC | $440,222 | 52 | 148 | 200 | NA | 13.0 | NA | $1,887 |
| JHU-Florida | $315,908 | 69 | 79 | 148 | 1,166 | 8.0 | $2,167 | n.a. |
| JHU-Maryland | $394,982 | 109 | 104 | 213 | 1,787 | 9.9 | $2,189 | n.a. |
| Nashville-Pathways | $1,306,515 | 277 | 592 | 869 | 5,720 | 8.6 | $1,964 | n.a. |
| Philadelphia-TWC | $7,757,912 | 487 | 1,691 | 2,178 | 7,593 | 6.5 | $6,641 | n.a. |
| Phoenix-EARN | $1,920,564 | 318 | 211 | 529 | 5,111 | 11.0 | $4,133 | n.a. |
| West Virginia-HRD | $1,605,214 | 394 | 85 | 479 | 3,448 | 8.1 | $3,771 | n.a. |
| Yakima-PFP | $688,187 | 215 | 36 | 251 | 1,852 | 9.5 | $3,530 | n.a. |
| Yakima-OIC | $546,629 | 140 | 14 | 154 | 1,196 | 9.7 | $4,433 | n.a. |
| Yakima-FWC | $639,036 | 105 | 56 | 161 | 1,275 | 9.8 | $4,912 | n.a. |
| Note: NA = not available; n.a. = not applicable. a. Cost per participant = (total costs/total participant months) X average duration. b. Cost per participant = (total costs/total participants active participants) X (11.1441/average duration). | ||||||||
We computed average costs per participant placed in unsubsidized employment in two ways. First, we divided total costs for the analysis period by the number of individuals ever placed in unsubsidized employment during that year. As an alternative measure, we divided the estimates of average cost per participant by each program's rate of participant placement in unsubsidized employment.(17) In most cases, both calculations produced similar estimates of the cost per placement. Table II.4 summarizes this process and presents the estimates of average cost per placement developed.
While used widely, we must note that measures of cost per placement provide only a partial picture of the success or efficiency that WtW programs achieved in helping participants secure and retain unsubsidized employment. For example, our measures do not take into account the hourly wages that WtW participants received, the total number of hours they were able to work, the amount of time they remained in such jobs, or other dimensions of the quality of such placements. Nor do they fully account for how difficult it was for the WtW program to achieve a placement because of characteristics of its target population, prevailing labor market conditions, or other reasons. Thus, these estimates must be used and interpreted with caution.
| Site/Program Operator | Total Costs | Total Placements | Cost per Placement(a) | Placement Rate (percent) | Cost per Participant | Imputed Cost per Placement(b) |
|---|---|---|---|---|---|---|
| Boston-Marriott | $216,233 | NA | NA | 71.0 | $2,308 | $3,251 |
| Boston-Partners | $436,673 | NA | NA | 66.0 | $5,407 | $8,192 |
| Chicago-Maximus | $1,377,100 | 328 | $4,198 | 78.0 | $3,605 | $4,622 |
| Chicago-E&ES | $1,867,690 | 427 | $4,374 | 62.2 | $3,392 | $5,453 |
| Chicago-Pyramid | $711,242 | 79 | $9,003 | 72.5 | $5,827 | $8,037 |
| Chicago-Catholic Charities | $1,722,558 | 179 | $9,623 | 39.7 | $3,310 | $8,339 |
| hicago-Easter Seals | $439,691 | 86 | $5,113 | 53.6 | $3,086 | $5,758 |
| Forth Worth-ANS | $231,760 | 30 | $7,725 | 33.0 | $2,365 | $7,167 |
| Fort Worth-WC | $440,222 | 84 | $5,241 | 42.0 | $1,887 | $4,493 |
| JHU-Florida | $315,908 | n.a. | n.a. | n.a. | n.a. | n.a. |
| JHU-Maryland | $394,982 | n.a. | n.a. | n.a. | n.a. | n.a. |
| Nashville-Pathways | $1,306,515 | 289 | $4,521 | 53.3 | $1,964 | $3,685 |
| Philadelphia-TWC | $7,757,912 | 585 | $13,261 | 48.2 | $6,641 | $13,778 |
| Phoenix-EARN | $1,920,564 | 298 | $6,445 | 65.6 | $4,133 | $6,301 |
| West Virginia-HRD | $1,605,214 | 228 | $7,040 | 61.0 | $3,771 | $6,182 |
| Yakima-PFP | $688,187 | 124 | $5,550 | 73.1 | $3,530 | $4,829 |
| Yakima-OIC | $546,629 | 46 | $11,883 | 50.6 | $4,433 | $8,762 |
| Yakima-FWC | $639,036 | 53 | $12,057 | 60.9 | $4,912 | $8,065 |
| Note: Estimates presented in bold are those used for the cross-program analysis in Chapter III. n.a. = not applicable; NA = not available. a Cost per placement = Total costs/placements during cost analysis period. b Cost per placement = Cost per participant/placement rate. | ||||||
1. Table II.1 reports the analysis periods used. As the table shows, 3 of the 18 WtW programs had cost analysis periods other than January to December 2000 or July 2000 to June 2001. In these cases, the specified time frames corresponded to WtW program operators' contract (and reporting) periods. Using these time frames made data collection easier and should not have affected the basic results of the cost analysis since there is, at most, a two-month difference from the periods specified for other programs.
2. WtW programs went through several phases as they planned, implemented, refined, and phased out their operations. During the cost analysis period, the WtW programs were well established and operations were, for the most part, routine. Cost analysis periods also ended before programs began to close down or alter their structure to move toward more permanent long-term operational arrangements.
3. We sought information on all sources of support for the programs, not just the WtW grant funds. For some programs, this included WtW grant funds, grants from foundations, state matching funds, and funds from other sources.
4. Off-budget costs varied across programs due to differences in program structure and funding strategies. For example, some grantees provided in-kind contributions of office space and facilities, and in some programs participants received transportation passes or other supports from external agencies.
5. The WtW programs participating in the national evaluation were all compensated to offset the burden of introducing customers to the national evaluation, administering baseline information forms, and other activities associated with enrolling WtW participants in a research sample. The compensation these programs received during their cost analysis periods represented, at most, one percent of total estimated costs for these same periods.
6. In such cases, we determined the full overhead costs incurred by the programs on the basis of the contractor's audited overhead rates and accounting procedures. Then, we added in any of these costs not already included in the accounting records.
7. Furthermore, TANF recipients did not have to participate in WtW to receive TANF-funded supportive services.
8. Case management services were provided to WtW participants throughout their enrollment. However, the pre-employment phase of most programs involved primarily case management activities that were closely integrated with overall job readiness preparation. For this reason, we refer to this program component as "job readiness and case management." Case management services provided after job placement are included in "postemployment followup."
9. Cost information was available with such breakdowns from 11 of the 18 WtW programs included in this analysis.
10. From here on, we refer to "average costs per participant placed in unsubsidized employment" as "average costs per placement." The terms should be viewed as equivalent.
11. MIS data were unavailable for WtW programs in Boston. For the WtW programs in Chicago (except Catholic Charities), the available MIS data did not cover the programs' cost analysis periods fully, and there appeared to be significant lags in data entry of participant information for some programs.
12. The estimate of average cost per participant-month masks month-to-month variation in the actual costs of WtW programs. For example, these estimates do not indicate that WtW per-month costs could be much higher while a participant was engaged in temporary work activities that involved wage payments by the program, or that costs were generally lower during the follow-up period after placement in unsubsidized employment.
13. Average duration is not calculated as total participant-months divided by total participants ever active during the cost analysis period. Since the spells of some participants are truncated, but none are overstated, such calculation underestimates average duration. Instead, using MIS data, we estimated the overall duration of participation for individuals active in WtW at any time during the cost analysis period; average duration is the mean value of this variable.
14. As Table II.3 shows, we were unable to estimate total participant-months for nine programs. Also, for the WtW programs in Boston and for Maximus and Easter Seals in Chicago, average duration of participation was estimated based on discussions with program staff. For E&ES and Pyramid (also in Chicago), average duration was estimated using all available MIS participant records (not just those for participants active during the cost analysis year).
15. Using the information for the nine programs for which we had full information, we estimated the average relationship between the total number of individuals ever active in the cost year and the total number of participant-months. We then applied this "adjustment" factor to the crude estimates of average cost per participant for the programs where we were missing information. In algebraic terms, we set (Total Costs/Total Participant Months) * Average Duration = (Total Costs/Total Participants Ever Active) * X, where X is the adjustment factor. Furthermore, we assumed that X was inversely related to average program duration (that is X = Y/Average Duration), which was available for all the programs, so that Average Cost per Participant = Total Costs * Y/(Total Participants Ever Active * Average Duration). Thus, we estimated the average value of Y across those programs with full information (Y = 11.1), and used this adjustment to impute average costs for those programs missing total participant months of service. Alternative models were tested, but the one we used achieved the best fit for the data from programs with full information.
16. Placement rates were imputed for the WtW programs in Boston and Fort Worth, and for the WtW programs operated by Maximus and Easter Seals in Chicago.
17. Importantly, placement rates were computed over each program's full period of operations (not just the cost analysis period), except for Philadelphia-TWC, West Virginia-CEP, and the WtW programs in Fort Worth. For the West Virginia and Fort Worth programs, we could only obtain information on placements occurring during the cost analysis period. For Philadelphia-TWC, we computed an overall placement rate for those participants ever active during the cost analysis period.
III. Analyzing WtW Program Costs
Although the WtW programs included in the cost analysis were all part of the same federal initiative, the flexible nature of WtW as a funding stream resulted in programs with unique characteristics. Some programs operated in large cities, while others served rural areas. Some were independent, self-standing programs; others were part of larger-scale WtW initiatives. The programs offered and emphasized different combinations of services to their target populations. These diverse characteristics all influenced the programs' costs.
In this chapter, we explore the rich variation in characteristics of WtW programs to glean insights into their cost implications. Section A describes the variation in total costs of WtW programs. Section B discusses important similarities and differences in the allocation of total costs across WtW program components or services. Sections C and D explore variation in average costs per participant and average costs per placement, respectively.
Variation in Total Costs
Estimates of total costs help convey the overall scale and scope of a program's operations. In comparisons of different programs, exploring scale is important because it can reveal important differences in their aims or operations.
Our cost estimates reflect the significant amount of resources that was invested in the WtW initiative. On an aggregate basis, operating for one year the 18 WtW programs included in the analysis cost an estimated $22.6 million. Nevertheless, total costs per program for one year of WtW operations varied widely, ranging from just over $200,000 to more than $7 million (for Philadelphia-TWC, not shown in Figure III.1). The WtW programs also varied in their total
Figure III.1
Total Wtw Program Costs, by Total Participation
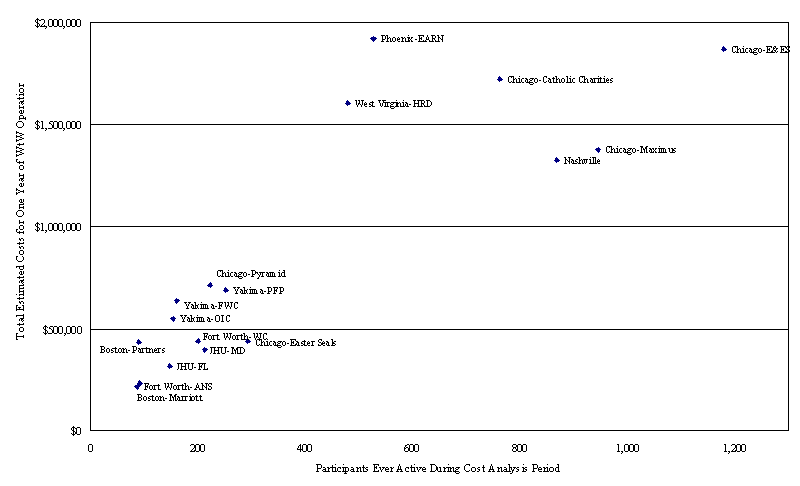
participation, ranging from just under 100 to more than 2,000 (for Philadelphia-TWC, not shown in Figure III.1) individuals ever active during the programs' cost analysis years.
Much of this variation was by design and reflected the diverse organizational context of the WtW programs. For example, the WtW programs operated by Maximus, E&ES, and Catholic Charities in Chicago, Philadelphia-TWC, and Phoenix-EARN all served large metropolitan areas and were developed specifically to help large numbers of WtW-eligible individuals move into employment. In contrast, the smaller WtW programs--for example, those in Boston and Fort Worth--tended to be part of larger-scale WtW initiatives that involved multiple providers, each offering tailored services to a relatively small number of WtW-eligible participants.
Variation in WtW Resource Allocation
The WtW programs allocated resources to specific services and activities. On an aggregate level, examining this cross-component allocation can reveal important characteristics of the WtW initiative as a whole. Across individual programs, examining the variation in allocation of costs across services or components helps us understand important differences in their emphasis or operations.
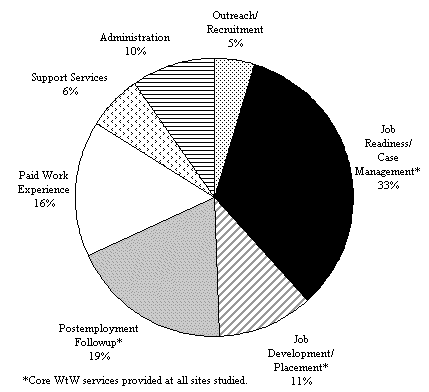
Outreach and Recruitment Were Important WtW Investments for Some Programs
Outreach and recruitment costs represented only five percent of the costs for the average WtW program (Figure III.2), as only eight programs incurred costs for such activities. Although devoting resources to outreach and recruitment was not always planned, these eight programs spent from $27,426 to more than $274,000 to try to identify and recruit eligible WtW participants (TableIII.1). Their outreach and recruitment costs translated into $92 (Philadelphia-TWC) to $1,302 (Phoenix-EARN) per enrollee during the cost analysis year.
Figure III.2
Average Allocation of Total Costs Across WtW Components
| Outreach and Recruitment Costs During Cost Analysis Year | New Enrollees During Cost AnalysisYear | Implied Cost of Outreach and Recruitment per | ||
|---|---|---|---|---|
| WtW Program | Costs | Percent of Total | ||
| West Virginia-HRD | $27,426 | 2 | 85 | $323 |
| Boston-Marriott | $37,001 | 17 | 51 | $726 |
| Boston-Partners | $46,760 | 10 | 51 | $917 |
| JHU-Florida | $59,451 | 19 | 79 | $754 |
| JHU-Maryland | $63,829 | 16 | 104 | $614 |
| Nashville-Pathways | $64,687 | 5 | 592 | $109 |
| Philadelphia-TWC | $155,129 | 2 | 1,691 | $92 |
| Phoenix-EARN | $274,812 | 14 | 211 | $1,302 |
Most of the outreach and recruitment costs these programs incurred represented the time some WtW staff had to devote explicitly to participant recruitment. Phoenix-EARN and Philadelphia-TWC, the programs with the largest outreach and recruitment costs, had dedicated outreach staff whose principal responsibility was to help identify and recruit prospective WtW participants. In the other programs, directors, case managers, and other WtW staff members reported spending a fair amount of their time visiting welfare offices and other potential referral sources to try to increase referrals by "talking up" their programs.
The remaining 10 programs could, in general, rely on well-established relationships with the local TANF agencies to get enough WtW referrals. While the outreach and recruitment costs for these programs are reported as zero, staff members from many of these programs reported investing small but indeterminate amounts of time in general outreach activities. For example, program directors, case managers, or other WtW staff in Chicago or Fort Worth periodically visited welfare offices and other potential referral sources to maintain these important relationships. Thus, even programs with minimal outreach and recruitment costs considered these efforts important.
Unanticipated recruitment difficulties arose from the restrictiveness of the initial WtW criteria, falling TANF caseloads, and the availability of alternative WtW or other programs in some areas.(1) In spite of their outreach efforts, some of the WtW programs included in our analysis may have had the capacity to serve additional individuals at a relatively low marginal cost, which could have reduced their average costs somewhat.
Job Readiness, Placement, and Case Management Are the Core of WtW Services
Core WtW services included such activities as job readiness classes; intake, assessment, and general preemployment case management; job development and placement services; and postplacement followup. This subset of services was present in all of the WtW programs examined and accounted for between 34 percent (Philadelphia-TWC) and 84 percent (Fort Worth-Women's Center) of the total costs for the programs (Figure III.3).(2) In the average WtW program, almost two-thirds of total costs were associated with activities aimed at engaging eligible participants, helping them prepare for and secure unsubsidized employment, and supporting them after such placements (Figure III.2).
Emphasis on Work Experience Differentiated Some WtW Programs
Both the availability and extent of use of paid work experience were characteristics that differentiated WtW programs. While paid work experience accounted for 16 percent of total
Figure III.3
Percent of Total Costs Spent on Core Versus Other Wtw Services
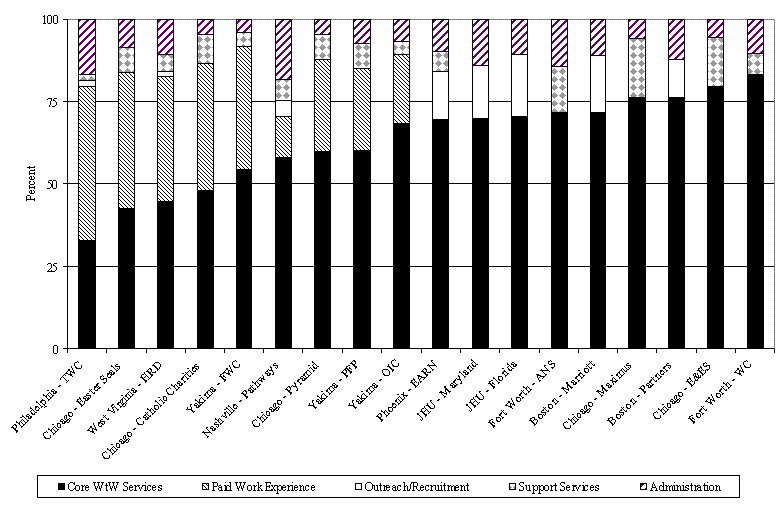
costs in the average WtW program (Figure III.2), only half of the programs in the cost analysis offered their participants paid work experience. Moreover, the programs that offered paid work experience emphasized such placements to varying extents. For five programs (Chicago-Easter Seals, Chicago-Pyramid, Philadelphia-TWC, West Virginia-HRD, and Yakima-FWC) costs related to paid work experience represented the largest proportion of WtW costs, ranging from 37 to 41 percent (Table II.2). Other programs devoted fewer resources to work experience or did not offer such placements.
WtW Transportation Assistance Helped Fill a Gap in Transitional Support
Consistent with the authorizing legislation, WtW resources were used for support services primarily as a complementary strategy. In the average program, support services accounted for only six percent of total WtW costs (Figure III.2). However, 14 of the 18 programs examined incurred some WtW support service costs. Among these programs, the support service most commonly provided was transportation assistance for the period following placement in unsubsidized employment.
The main reason for WtW's limited emphasis on support services was that most participants had access to TANF-funded support services to help ease their transition from public assistance to employment.(3) These transitional benefits usually included assistance with child care, health care, and transportation. However, many programs were limited in their ability to use WtW funds to provide support services to participants, because they had ceilings on support service expenditures or restrictions on allowable expenditures.(4) Therefore, the fact that, on average, only six percent of total WtW costs were associated with support services does not mean that WtW participants only needed such assistance to this extent.
The programs that provided WtW-funded transportation assistance reported that TANF's transportation benefits typically ended while participants were still engaged in WtW activities or shortly after job placement. Transportation difficulties could jeopardize participants' employment, so WtW-funded transportation assistance helped fill an important gap in transitional support.
Variation in Costs per Participant
As we just saw, the WtW programs in the cost analysis offered different mixes of services. Since specific services require different combinations of resources (for example, more or less staff time, space, materials, or equipment), differences in the programs' service mix could contribute to differences in their costs. Even when examining WtW programs that offered a similar mix of services to their clients, expenditure patterns can reveal important differences in where programs truly concentrated their efforts or in how services were delivered.
Unit measures of cost allow us to explore these differences most clearly, because they factor out the influences of program scale. In particular, estimates of cost per participant describe the amount of resources that programs spent, on average, to serve a single participant. These estimates make it possible to compare the magnitude of WtW expenditures on individual participants, overall or for particular services, across programs.
The average WtW program spent $3,607 to serve each participant. As with other estimates, however, there was substantial variation in costs per participant across the programs. The least costly program spent $1,887 per participant (Fort Worth-Women's Center) while the most costly (Philadelphia-TWC) spent $6,641.
Sources of Cost Variation Go Beyond Program Model, Scale, and Duration of Participation
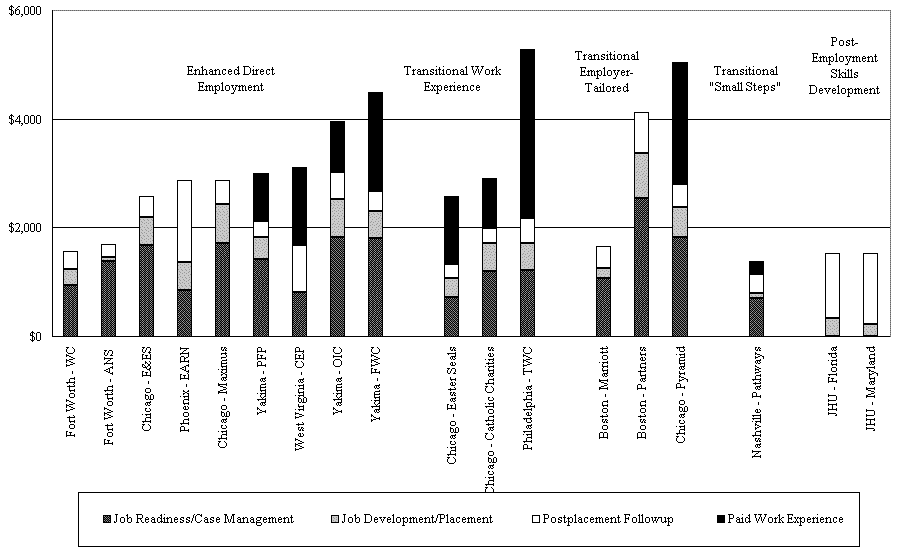
The WtW process evaluation identified three basic program models, representing distinct employment philosophies and approaches to providing WtW services.(5) As a starting point for our analyses, we classified the WtW programs into these same model categories (Table III.2):
· Enhanced Direct Employment (EDE). These WtW programs focused on moving WtW participants into unsubsidized employment as soon as possible. They were "enhanced" because, unlike traditional "rapid attachment" interventions, they complemented placement services with pre-employment job readiness activities, individualized counseling and support, and extended followup after employment. Among the programs included in the cost analysis, another distinguishing characteristic of enhanced direct-employment programs was that they helped their WtW participants gain access to a wide range of locally available employment opportunities.
· Transitional Employment (TE). These programs tried to gradually and systematically improve their participants' employability. Their objective was for participants to ultimately--not immediately--obtain unsubsidized employment. The WtW programs in the cost analysis used three distinct approaches to this systematic building of employability skills:
- Paid Work Experience. In some transitional programs, WtW clients were generally expected to participate in work experience as an intermediate step before unsubsidized employment.
- Employer-Tailored Programs. Some transitional programs were tailored to the needs or expectations of particular employers. These programs aimed to help participants develop the skills necessary for jobs with a given employer or a group of employers with similar characteristics.
- Small Steps. Only one of the WtW programs in the cost analysis used this approach, which was distinct from other transitional programs. The Nashville-Pathways program did not have participants follow a particular sequence of activities, nor did it offer an explicit menu of WtW services. Instead, case managers and participants together identified a highly individualized set of employment-related objectives and activities for the participant to pursue. Importantly, "small steps," such as time spent arranging child care or resolving housing issues, were counted as WtW activities and helped participants meet their TANF work activity requirements.
| WtW Site/Program | Average Cost per Participant | Average Duration of Participation (in Months) | Participants Ever Active During Cost Analysis Period |
|---|---|---|---|
| Enhanced Direct-Employment Programs | |||
| Fort Worth-Women's Center | $1,887 | 13.0 | 200 |
| Fort Worth-ANS | $2,365 | 12.0 | 91 |
| Chicago-E&ES | $3,392 | 5.2 | 1,180 |
| Yakima-PFP* | $3,530 | 9.5 | 251 |
| Chicago-Maximus | $3,605 | 4.5 | 946 |
| West Virginia-HRD* | $3,771 | 8.1 | 479 |
| Phoenix-EARN | $4,133 | 11.0 | 529 |
| Yakima-OIC* | $4,433 | 9.7 | 154 |
| Yakima-FWC* | $4,912 | 9.8 | 161 |
Model Mean | $3,559 | 9.2 | 443 |
| Transitional Work Experience Programs | |||
| Chicago-Easter Seals* | $3,087 | 5.4 | 291 |
| Chicago-Catholic Charities* | $3,310 | 7.6 | 763 |
| Philadelphia-TWC* | $6,641 | 6.5 | 2,178 |
Model Mean | $4,346 | 6.5 | 1,077 |
| Transitional Employer-Tailored Programs | |||
| Boston-Marriott | $2,308 | 12.0 | 87 |
| Boston-Partners | $5,407 | 10.0 | 90 |
| Chicago-Pyramid* | $5,826 | 6.1 | 223 |
Model Mean | $4,513 | 9.4 | 133 |
| Transitional "Small Steps" Programs | |||
| Nashville-Pathways* | $1,964 | 8.6 | 869 |
| Model Mean | $1,964 | 8.6 | 869 |
| Postemployment Skills Development Programs | |||
| JHU-Florida | $2,167 | 8.0 | 148 |
| JHU-Maryland | $2,189 | 9.9 | 213 |
| Model Mean | $2,178 | 9.0 | 181 |
| Note: * = WtW programs that offered paid work experience. | |||
. Postemployment Skills Development (PSD). The two JHU programs in the cost analysis emphasized supporting WtW participants after they had secured an unsubsidized job. They focused on providing services and assistance to help participants retain unsubsidized employment and advance to better jobs, in the hope of improving their prospects for long-term self-sufficiency.
On average, differences in the cost per participant of WtW programs were in the direction their model classifications would suggest. PSD programs aimed to serve primarily people who had already found jobs, and thus focused exclusively on postemployment services. They cost less per participant, on average, than EDE and TE programs, which provided both pre- and postemployment services (Table III.2). Similarly, EDE programs, which emphasized a quick entry into unsubsidized employment, were less costly, on average, than TE programs, which emphasized more gradual, systematic acquisition of employability skills.
Costs varied considerably, however, among programs in any given model. As a result, some EDE programs could cost less, as much, or more than some TE programs (Table III.2). Similarly, PSD programs were not cheaper than all EDE or TE programs. For programs belonging to the same WtW model, average costs per participant were not necessarily lower if they operated on a larger scale or had lower average durations. This suggested that factors other than program model, scale of operations, or overall duration of participation contributed to the cost differences across WtW programs.
Costs Differences Reflected Programs' Emphasis on Work Experience and Postemployment Support
The programs in each WtW model shared similar priorities and, in general, offered a similar mix of services, but they emphasized different individual services or program components. This variation in emphasis led to notable differences in average costs per participant, even for WtW programs in the same model category. In particular, differences in the costs per participant of WtW programs reflected their relative emphasis on, and the structure of, work experience and postemployment components.
a. Costs Were Higher, but Still Varied, in Programs That Offered Paid Work Experience
Programs that included paid work experience generally had higher costs per participant than those that did not (Figure III.4). However, the costs per participant of WtW programs with such a component still varied widely, reflecting specific features of these components. In particular, costs varied based on (1) the prevalence of participation in paid work experience among WtW participants, (2) wage payments and other costs (for example, payroll taxes) incurred on behalf of work experience participants, and (3) the overall intensity of work experience activities, as defined by participation duration and the extent of job readiness services offered with work experience (Table III.3).
Figure III.4
Allocations of Costs per Participant to Main Wtw Program Components
| Programs with a Work Experience Component (Average Cost per Participant of Work Experience)(a) | Prevalence of Participation | Wage Payments and Other Costs Incurred on Behalf of Participants | Intensity of Work Experience Activities | |
|---|---|---|---|---|
| Duration of Participation | Integration of Job Readiness Services | |||
| Philadelphia-TWC ($3,101) | Most. Participants completing 2-week orientation/job readiness component | High. $5.15 per hour, for up to 25 hours weekly; $50 monthly payment to mentors | Long. Until assessed work ready, up to 6 months | High. Career development training for 10 hours weekly while in transitional work; weekly worksite visits to assess performance and work readiness |
| Chicago-Pyramid ($2,244) | Most. Participants completing 4-week job readiness workshop | High. OJT positions paid between $6.25 and $8.25 per hour; 30 hours per week | Short. 4 to 6 weeks | Limited. No structured job readiness concurrent with work experience |
| Yakima-FWC ($1,824) | As needed. Only participants failing to secure employment after 12 weeks of structured job search | High. $6.72 per hour (minimum wage in Washington), up to 20 hours weekly | Long. Until participant secured unsubsidized employment, up to 9 months | High. Individualized work readiness and job search support during work experience |
| West Virginia-HRD ($1,430) | All. Participants completing 4-week job readiness workshop | Modest. - Mostly OE: $1.60 per hour stipend for 25 to 35 hours/week (as determined by TANF benefits/minimum wage) - Some OJTs: WtW paid up to half of entry-level wages (no range available) | Modest. Duration varied according to participants' work readiness: - Less work ready: OEs at nonprofits for up to 6 months - More work ready: OEs at for-profits for up to 1 month or OJTs for up to 6 months | Limited. No structured job readiness concurrent with work experience |
| Chicago-Easter Seals ($1,266) | As needed. Only participants completing 4-week job readiness/search workshop without employment | High. Industrial workshop participants paid on piecemeal basis, $6 per hour average, 15 hours weekly | Short. Until placed in subsidized or unsubsidized employment, up to 4 weeks | High. Job readiness training for 15 hours per week while in industrial workshop |
| Chicago-Catholic Charities ($1,084) | As needed. Only participants completing 2-week job readiness class plus 3 weeks of structured job search without unsubsidized job | High. $5.15 per hour, up to 30 hours weekly | Long. Until participant secured unsubsidized job, up to 6 months | Limited. No structured job readiness concurrent with work experience |
| Yakima-OIC ($937) | As needed. Only participants failing to secure employment after 12 weeks of structured job search | High. $6.72 per hour (minimum wage in Washington), up to 20 hours weekly | Long. Until participant secured unsubsidized employment, up to 9 months | High. Individualized work readiness and job search support during work experience |
| Yakima-PFP ($883) | As needed. Only participants failing to secure employment after 12 weeks of structured job search | High. $6.72 per hour (minimum wage in Washington), up to 20 hours weekly | Long. Until participant secured unsubsidized employment, up to 9 months | High. Individualized work readiness and job search support during work experience |
| Nashville-Pathways ($243) | Few. Only participants needing work experience to fulfill 40-hour/week TANF work requirement | High. $5.25 per hour, up to 20 hours weekly | Modest. Up to 3 months | Limited. No structured job readiness concurrent with work experience |
| a. Average per participant costs of work experience were computed by applying the program's work experience allocation of total costs for the cost analysis year to the estimate of average cost per participant. Thus, these estimates should not be interpreted as the average cost of work experience per participant involved in such activities. OE = occupational exploration; OJT = on-the-job training; TANF = Temporary Assistance for Needy Families. | ||||
Among the study site programs, Philadelphia-TWC had the highest cost per participant ($6,641), for all the reasons mentioned above. Most TWC clients participated in the program's work experience component, which was relatively long. Because the program explicitly targeted individuals with limited or no work experience, all TWC clients who completed the program's initial job readiness activities were placed in transitional work activities.(6) TWC participants were expected to spend 25 hours each week in transitional work and were paid $5.15 per hour. They remained in the positions until they were considered ready for work, up to a maximum of six months. Another distinctive feature of the TWC program was that further job readiness and skills upgrading were integrated into the program's work experience component. While in transitional work, TWC participants were required to attend 10 hours of career development training each week.
High participation rates in work experience and high wage costs also appeared to contribute to the high per-participant costs of the Chicago-Pyramid program ($5,826). In contrast to the employer-tailored programs in Boston, which integrated unpaid job shadowing into participants' job readiness activities, Pyramid featured a four- to six-week paid work experience placement for all its participants. Moreover, while most WtW work experience placements in other programs paid minimum wage, Pyramid placed its WtW participants in on-the-job training positions, which generally paid higher wages.
Conversely, the cost per participant for the West Virginia-HRD program was lower ($3,771), mainly due to modest wage costs. Although all participants were expected to receive some work experience, they did not always receive direct wages from the WtW program. Most participants "worked off their TANF grants" and received only a small stipend ($1.60 per hour) to supplement their cash assistance.
Among WtW programs that offered work experience, costs were lower where such placements were based on need. For example, the Yakima programs (with average costs ranging from $3,530 to $4,912) used paid work experience only for participants who had completed 12 weeks of structured job search without securing unsubsidized employment.(7) The initial sequence of job readiness and job search activities at Chicago-Catholic Charities and Chicago-Easter Seals helped WtW staff identify relatively "work ready" WtW participants, contributing to lower per-participant costs ($3,310 and $3,087, respectively).(8)
Paid work experience was a minor component of average costs in the Nashville-Pathways program ($1,964). While Pathways offered paid work experience for up to 12 weeks, few participants were placed in such positions. Only 69 of the 870 individuals ever active in Pathways during the cost analysis year (about eight percent) participated in work experience during that year.
b. Differences in Preemployment Costs Reflected the Structure of Job Readiness and the Use of Work Experience
The costs of WtW job readiness and preemployment case management varied widely, largely because of differences in the nature of job readiness activities and the duration of case management. Average costs ranged from $695 (Nashville-Pathways) to $2,548 (Boston-Partners) per participant (Table III.4).
| WtW Program (Average Cost per Participant of Job Readiness and Preemployment Case Management)(a) | Duration of Structured Job Readiness Activities | Intensity and Duration of Preemployment Case Management |
|---|---|---|
| Boston-Partners ($2,548) | 7-week work preparation class | Case managers led work preparation classes; individualized support until job entry; mental health counseling also offered |
| Yakima-OIC ($1,822) | No structured job readiness | Individualized work readiness/job search support during work experience (up to 9 months), until job entry |
| Chicago-Pyramid ($1,817) | 4-week work preparation class | Periodic followup during work preparation and OJT (up to 6 weeks); individualized support until job entry |
| Yakima-FWC ($1,806) | No structured job readiness | Individualized work readiness/job search support during work experience (up to 9 months), until job entry |
| Chicago-Maximus ($1,709) | 6-day job readiness class | Case managers led job readiness classes; individualized job search support until job entry |
| Chicago-E&ES ($1,668) | 2-week job readiness workshop plus work-related soft-skills classes concurrent with job search | Individualized work readiness/job search support until job entry |
| Yakima-PFP ($1,420) | No structured job readiness | Individualized work readiness/job search support during work experience (up to 9 months), until job entry |
| Fort Worth-ANS ($1,375) | 4-week job readiness workshop | Individualized work readiness/job search assistance until job entry |
| Philadelphia-TWC ($1,219) | 2-week orientation/job readiness workshop | Weekly followup (minimum) during work experience (up to 6 months); individualized support until job entry |
| Chicago-Catholic Charities ($1,118) | 2-week job readiness class | Periodic followup during job readiness and work experience (up to 6 months); individualized support until job entry |
| Boston-Marriott ($1,059) | 2-week work preparation class (plus 4 weeks job shadowing) | Case managers led job readiness class; individualized support until job entry |
| Fort Worth-ANS ($1,375) | 4-week job readiness workshop | Individualized work readiness/job search support until job entry |
| Fort Worth-WC ($934) | 5-day job readiness workshop | Individualized work readiness/job search support until job entry |
| West Virginia-HRD ($810) | 4-week orientation/job readiness workshop | Individualized support during job readiness, work experience (up to 6 months), and job search, until job entry |
| Phoenix-EARN ($851) | 3-week job readiness class | Periodic followup during job readiness class; individualized job search assistance to (a few) participants exiting class without employment |
| Chicago-Easter Seals ($719) | 4-week work readiness/job search workshop | Periodic followup during work readiness/job search and industrial workshop (8 weeks total); individualized support until job entry |
| Nashville-Pathways ($695) | No structured job readiness | Individualized work readiness/job search counseling until job entry; monthly meeting |
| Note: Table excludes the JHU programs, which focused on postemployment services. a. Average costs per participant of job readiness and preemployment case management were computed by applying each program's allocation of total costs during the cost analysis year to job readiness and preemployment case management to the estimate of average cost per participant. Thus, these estimates should not be interpreted as the average cost of job readiness and preemployment case management per participant involved in such activities. | ||
Reflecting an overall commitment to building "human capital," the most costly WtW programs placed participants in structured job readiness components (lasting up to seven weeks) and lengthy work experience with associated case management (that could last up to nine months). Boston-Partners, with the highest costs for job readiness and preemployment case management, put participants in seven weeks of classroom-based work preparation activities, and Partners case managers tracked participants closely until they were placed in unsubsidized jobs. Similarly, the Yakima WtW programs had relatively high average costs for job readiness and preemployment case management ($1,822 to $1,420). Although these programs did not include a lengthy routine job readiness component, many participants were placed in work experience for up to nine months and received individualized work readiness and job search support during that period.
Costs were lowest where participants pursued more independent job readiness activities and individualized objectives, since WtW staff did not always have to be intensely involved in such activities. In Nashville, for example, the main activity for all Pathways participants was a monthly meeting, in which they shared their accomplishments and challenges with their case managers and each other. Job readiness costs averaged $695 per participant.
c. Variation in Postemployment Support Costs Reflects the Labor Intensity of Services and Participant Payments
Helping WtW participants not just secure employment but also retain and, if possible, move on to better jobs was an important goal for all of the programs we examined. In most WtW programs, postplacement support consisted of brief staff contacts with participants (and sometimes their employers), and costs were therefore modest. In 11 programs, these contacts typically lasted through the first six months of employment, with decreasing frequency and intensity, at a cost ranging from $241 (Fort Worth-ANS) to $419 (Chicago-Pyramid). The remaining seven programs provided more intensive postemployment services, wage supplements, or retention incentives to participants, and their costs for postplacement services ranged from $473 (Philadelphia-TWC) to $1,520 (Phoenix-EARN) per participant.
Postemployment costs were relatively high in the two JHU programs--in Florida and Maryland--which provided their participants with intensive postemployment support. These Career Transcript System programs worked mostly with newly employed individuals (and their supervisors), and their objective was to help participants retain their jobs, identify advancement opportunities, and move up a career ladder. By design, then, WtW spending focused on postemployment case management. At costs of $1,309 per participant in JHU-Maryland and $1,198 in JHU-Florida, postemployment services represented 60 and 55 percent, respectively, of overall average costs for these programs.
Postemployment services were most costly, however, in Phoenix-EARN, which complemented follow-up case management with structured mentoring. All EARN participants placed in unsubsidized jobs received regular follow-up visits by professional counselors for six months after placement. These visits were in addition to brief follow-up contacts by EARN case managers (similar to those made by most other WtW programs). This additional attention brought postemployment costs to $1,520. The Yakima-OIC program also featured postplacement mentoring services, which contributed to higher-than-average costs for postemployment services ($504 per participant).
Wage supplements and other direct payments to WtW participants could also raise postemployment costs. WtW participants in West Virginia-HRD who worked 30 or more hours per week and earned less than $7.75 per hour received such supplements for their first 24 weeks of employment.(9) Philadelphia-TWC participants were eligible for up to $800 in retention bonuses: $400 after completing their first month of unsubsidized employment, $200 after three months of continuous employment, and another $200 after six months of continuous employment.(10) In these programs, postemployment costs per participant were $870 (West Virginia-HRD) and $473 (Philadelphia-TWC).
Variation in Costs per Placement
The goal of WtW programs was to place participants in unsubsidized employment and, thus, help them make strides toward self-sufficiency. The cost of achieving this objective can be summarized as the cost per placement--the resources programs had to invest, on average, to have one participant reach unsubsidized job placement. Our estimates of cost per placement for WtW programs cover a wide range--from $3,501 for Boston-Marriott to $13,778 for Philadelphia-TWC.
These estimates should not be interpreted as measures of programs' efficiency or effectiveness, for several reasons. Differences in cost per placement partly reflect differences in the mix and intensity of services that WtW programs offered. For programs that offered similar services, differences in cost per placement may reflect important differences in the populations served and, therefore, the relative ease or difficulty with which programs could achieve placements. Differences in cost per placement also do not take into account potentially important differences in the quality or long-term success of programs' placements. Thus, differences in costs per placement probably bear no relation to differences in outcomes or impacts across programs.
For any individual WtW program, cost per placement is principally a function of its cost per participant and its placement rate. Different factors can influence a program's cost per participant, placement rate, or both--and, through them, its cost per placement. In this section, we examine how program characteristics, contextual factors, and participant characteristics relate to the variation in costs per placement observed across WtW programs.(11) In general, we found that job-matching strategies and participant characteristics were the most important factors in understanding differences in WtW costs per placement.
Cost per Placement Clearly Reflects Job-Matching Strategy
While all the WtW programs provided placement support to their participants (Nightingale 2002), they still varied in how their staff worked with participants searching for employment. Program staff could be more or less active in identifying job opportunities appropriate for their clients and in letting them know about these opportunities. Similarly, staff could work more or less actively with participants to help them identify and pursue job opportunities that may be appropriate for, or appealing to, them as individuals.
Program efforts to help WtW participants secure unsubsidized employment seemed to follow three general approaches:
- Self-Directed Matching. Under this approach, participants generally identified their own matches to available job listings, with some guidance and support from WtW program staff. While participants may have attended job clubs or even received some job leads from WtW staff, they were principally responsible for identifying appropriate opportunities and pursuing them. Nashville-Pathways, West Virginia-HRD, and Chicago-Catholic Charities used self-directed matching.
- Staff-Assisted Matching. Programs that used this approach had dedicated staff who worked actively to identify job openings suitable for their WtW clientele and to match participants individually to them. In several programs with staff-assisted placement--Chicago-Maximus, Chicago-E&ES, Philadelphia-TWC, Phoenix-EARN, and the Yakima programs-WtW staff also had well-established placement relationships with some local employers. Since the programs continuously made placements with this set of employers, ensuring good matches was considered important to keep these employer clients satisfied.
- Employer-Focused Matching. Under this approach, program staff worked exclusively with selected employers and industries that had job opportunities available and helped WtW participants gain the skills and qualifications needed for such positions. Examples of this approach are the three employer-tailored WtW programs: Boston-Marriott, Boston-Partners, and Chicago-Partners. In these programs, job placement was guaranteed to participants who completed the employer- or industry-specific training.
Overall job-matching strategy helps explain differences in placement rates and costs per placement (Table III.5). On average, programs that used employer-focused or staff-assisted matching approaches achieved higher placement rates. This outcome is to be expected, as these programs took a more active role in facilitating placement and ensuring good job matches for the generally hard-to-place WtW population.
These programs also had, on average, higher overall costs per participant. While their more active approach to placement required additional resources for job development and placement activities, differences in the costs of these activities did not fully account for their higher overall per-participant costs. Thus, the higher average costs for these programs suggest that they worked more intensively with WtW participants in other areas besides placement.
| WtW Programs, by Job-Matching Strategy | Cost per Placement (in Dollars) | Placement Rate (Percent) | Cost per Participant (in Dollars) | Per Participant Cost of Job Development and Placement (in Dollars) | Average Starting Hourly Wage (in Dollars) |
|---|---|---|---|---|---|
| Self-Directed Matching | |||||
| Fort Worth-ANS | 7,725 | 33 | 2,365 | 80 | NA |
| Chicago-Catholic Charities* | 8,339 | 40 | 3,310 | 369 | 7.00 |
| Fort Worth-WC | 5,241 | 42 | 1,887 | 302 | NA |
| West Virginia-HRD* | 6,182 | 61 | 3,771 | NA | 5.84 |
| Nashville-Pathways* | 3,685 | 53 | 1,964 | 100 | 7.19 |
| Averages | 6,234 | 46 | 2,660 | 213 | 6.68 |
| Staff-Assisted Matching | |||||
| Philadelphia-TWC* | 13,778 | 48 | 6,641 | 487 | 7.26 |
| Yakima-OIC* | 8,762 | 51 | 4,433 | 695 | 7.40 |
| Chicago-Easter Seals* | 5,758 | 54 | 3,086 | 354 | 6.64 |
| Yakima-FWC* | 8,065 | 61 | 4,912 | 494 | 7.07 |
| Chicago-E&ES | 5,453 | 62 | 3,392 | 524 | 7.05 |
| Phoenix-EARN | 6,301 | 66 | 4,133 | 504 | 7.46 |
| Yakima-PFP* | 4,829 | 73 | 3,530 | 398 | 7.75 |
| Chicago-Maximus | 4,622 | 78 | 3,605 | 719 | 6.98 |
| Averages | 7,196 | 62 | 4,217 | 522 | 7.20 |
| Employer-Focused Matching | |||||
| Boston-Partners | 8,192 | 66 | 5,407 | 813 | 8.98 |
| Boston-Marriott | 3,251 | 71 | 2,308 | 188 | 9.67 |
| Chicago-Pyramid* | 8,037 | 73 | 5,827 | 559 | 7.43 |
| Averages | 6,493 | 70 | 4,514 | 520 | 8.69 |
| Note: NA = not available; * = WtW programs that offer paid work experience. | |||||
Other characteristics that one may associate with WtW programs that worked more intensively with participants were not as important in understanding cross-program differences in placement rates and, therefore, costs per placement. For example, TE programs, which worked with WtW participants to gradually and systematically upgrade their employability skills, achieved the same placement rates, on average, as EDE programs, which tried to place WtW participants in unsubsidized employment as soon as possible (Table III.6). On average, the costs per placement for TE programs were higher, due mainly to the programs' higher average costs per participant.
The TE programs and others that offered paid work experience also had high average costs per placement (Table III.7). However, presence of a paid work experience component was not synonymous with marked differences in WtW placement rates. Rather, programs with a work experience component had higher overall costs per participant (as discussed previously), and this was the principal factor contributing to their higher costs per placement.
| Model | Average Cost per Placement | Average Placement Rate | Average Cost per Participant |
|---|---|---|---|
| Enhanced Direct Employment (EDE) | $6,449 | 57% | $3,559 |
| Transitional Employment (TE) | $7,291 | 58% | $4,077 |
| Paid Work Experience | Average Cost per Placement | Average PlacementRate | Average Cost per Participant |
|---|---|---|---|
| Offered | $7,493 | 57% | $4,164 |
| Not Offered | $5,098 | 52% | $2,887 |
Differences in placement rates and, therefore, the costs per placement of WtW programs could also reflect differences in how selective WtW programs were in the types of jobs into which they placed participants. For example, some programs may have only placed participants in jobs offering a minimum wage rate or number of hours, benefits, or strong advancement opportunities. However, the starting wages appeared to be similar for the jobs that WtW programs helped their participants secure. In general, WtW programs placed participants in jobs with starting wages that ranged from about $6 to $7 per hour. The only notable exception was employer-focused programs, whose participants, on average, secured jobs with higher starting hourly wages (Table III.5). As we discuss below, these programs may have targeted WtW-eligible people who were relatively more job ready, which could have contributed to the higher wage rates for their initial unsubsidized placements.
Urbanicity and Prevailing Unemployment Rates Had No Obvious Effect on Costs per Placement
The local economy can influence many aspects of a program, such as the choice of service strategies, operating expenses, and its ability to place participants in employment. However, differences in urbanicity and unemployment rates for the areas the WtW programs served were not strongly associated with differences in costs per placement, placement rates, or costs per participant across WtW programs (Table III.8).
The cost analysis periods examined were generally periods of relative prosperity, strong economic growth, and strong labor markets. Most of the WtW programs in the cost analysis operated in urban areas that, in 2000, had low unemployment, averaging 3.4 percent.(12) As expected, higher average unemployment rates for the WtW programs operating in rural areas suggested that these programs faced somewhat less prosperous economic conditions. However, these did not appear to lead to higher costs per placement for these programs. Despite serving a rural area with relatively high unemployment (10.6 percent), the Yakima programs achieved relatively high placement rates (50 to 73 percent) and thus, in general, more modest costs per placement ($4,829 to $8,762).
| WtW Programs, by Urbanicity of Service Delivery Area | Cost per Placement (in Dollars) | Placement Rate (Percent) | Cost per Participant (in Dollars) | Unemployment Rate (Percent) (a) | Average Starting Hourly Wage (in Dollars) |
|---|---|---|---|---|---|
| Rural | |||||
| West Virginia-HRD | 6,182 | 61 | 3,771 | 8.0 (b) | 5.84 |
| Yakima-OIC | 8,762 | 51 | 4,433 | 10.6 | 7.40 |
| Yakima-FWC | 8,065 | 61 | 4,912 | 10.6 | 7.07 |
| Yakima-PFP | 4,829 | 73 | 3,530 | 10.6 | 7.75 |
| Averages | 6,960 | 62 | 4,162 | 9.9 | 7.02 |
| Urban | |||||
| Fort Worth-ANS | 7,725 | 33 | 2,365 | 3.2 | NA |
| Chicago-Catholic Charities | 8,339 | 40 | 3,310 | 4.2 | 7.00 |
| Philadelphia-TWC | 13,778 | 48 | 6,641 | 4.0 | 7.26 |
| Chicago-Easter Seals | 5,758 | 54 | 3,086 | 4.2 | 6.64 |
| Boston-Partners | 8,192 | 66 | 5,407 | 2.2 | 8.98 |
| Boston-Marriott | 3,251 | 71 | 2,308 | 2.2 | 9.67 |
| Chicago-Pyramid | 8,037 | 73 | 5,827 | 4.2 | 7.43 |
| Fort Worth-WC | 5,241 | 42 | 1,887 | 3.2 | NA |
| Nashville-Pathways | 3,685 | 53 | 1,964 | 2.8 | 7.19 |
| Chicago-E&ES | 5,453 | 62 | 3,392 | 4.2 | 7.05 |
| Phoenix-EARN | 6,301 | 66 | 4,133 | 2.7 | 7.46 |
| Chicago-Maximus | 4,622 | 78 | 3,605 | 4.2 | 6.98 |
| Averages | 6,699 | 57 | 3,661 | 3.4 | 7.57 |
| Note:NA = not available. a. Average unemployment rate in 2000, by Metropolitan Statistical Area. b. Average across 29 service counties, weighted by proportion of WtW participants from each county. | |||||
Participant Characteristics May Have Influenced WtW Costs per Placement
To the extent that WtW programs worked with relatively more or less hard-to-serve individuals, their costs per placement may vary.(13) WtW programs that targeted WtW-eligible participants with the most severe barriers to employment, on average, had lower placement rates than programs that targeted the general WtW-eligible population or WtW-eligible participants who met at least a minimum threshold for employability (Table III.9).
| WtW Programs, by Target Population | Cost per Placement (in Dollars) | Placement Rate (Percent) | Cost per Participant (in Dollars) | Average Starting Hourly Wage (in Dollars) |
|---|---|---|---|---|
| Hardest-to-Serve Among WtW Eligible | ||||
| Fort Worth-ANS | 7,725 | 33 | 2,365 | NA |
| Chicago-Catholic Charities | 8,339 | 40 | 3,310 | 7.00 |
| Philadelphia-TWC | 13,778 | 48 | 6,641 | 7.26 |
| Chicago-Easter Seals | 5,758 | 54 | 3,086 | 6.64 |
| Averages | 8,900 | 44 | 3,851 | 6.97 |
| Relatively Job-Ready Among WtW Eligible | ||||
| Boston-Partners | 8,192 | 66 | 5,407 | 8.98 |
| Boston-Marriott | 3,251 | 71 | 2,308 | 9.67 |
| Chicago-Pyramid | 8,037 | 73 | 5,827 | 7.43 |
| Averages | 6,493 | 70 | 4,514 | 8.69 |
| General WtW Eligible | ||||
| Fort Worth-WC | 5,241 | 42 | 1,887 | NA |
| West Virginia-HRD | 6,182 | 61 | 3,771 | 5.84 |
| Nashville-Pathways | 3,685 | 53 | 1,964 | 7.19 |
| Yakima-OIC | 8,762 | 51 | 4,433 | 7.40 |
| Yakima-FWC | 8,065 | 61 | 4,912 | 7.07 |
| Chicago-E&ES | 5,453 | 62 | 3,392 | 7.05 |
| Phoenix-EARN | 6,301 | 66 | 4,133 | 7.46 |
| Yakima-PFP | 4,829 | 73 | 3,530 | 7.75 |
| Chicago-Maximus | 4,622 | 78 | 3,605 | 6.98 |
| Averages | 5,904 | 61 | 3,514 | 7.09 |
| Note: NA = not available. | ||||
Some WtW programs--most notably Philadelphia-TWC and Fort Worth-ANS--explicitly targeted WtW-eligible clients with little or no work experience, low literacy or numeric skills, and other substantial barriers to employment (such as homelessness). These programs aimed to serve some of the most disadvantaged WtW-eligible people, and differences in their placement rates are consistent with such targeting strategies.
Conversely, those WtW programs that targeted the relatively job-ready among WtW-eligible people achieved higher placement rates. For example, the Boston employer partnership programs screened applicants for interest and skill. Participants had to apply for the programs and meet minimum literacy requirements. Thus, because of the nature of these programs, their participants may have been somewhat less disadvantaged and more motivated than other WtW-eligible people.
Differences in placement rates or costs per placement should not be equated with program success or effectiveness, however.Previous research has shown that achieving one placement of a harder-to-serve participant may create greater impacts than one placement of a relatively job-ready participant.(14) Thus, despite the lower average placement rates for programs targeting the hardest-to serve WtW-eligible participants, the greatest benefits of WtW may lie in achieving success with this population.
1. Factors that affected enrollment are discussed in detail in other evaluation reports: Fender et al. 2001; Nightingale et al. 2002; Nightingale 2001; Perez-Johnson et al. 2000; and Perez-Johnson and Hershey 1999. Congress modified the WtW legislation in 1999 as part of the Fiscal Year 2000 Appropriations legislation for the Departments of Labor, Health and Human Services, Education, and related agencies, to expand WtW eligibility.
2. In Table II.2, both JHU programs appear not to offer job readiness and pre-employment case management services, as their allocation of total costs to these activities is shown as zero. Most JHU program services were similar to those that other WtW programs offered. The main distinction of the JHU programs was that the staff generally (but not always) began working with WtW participants after they secured unsubsidized employment. Thus, most program costs were allocated to postemployment followup.
3. An important exception was WtW participants who are noncustodial parents of children on TANF. Since these individuals usually are not TANF recipients themselves, they do not qualify for TANF-funded transitional benefits. The potential cost implications of serving more noncustodial parents can be seen somewhat in the differences in WtW support service costs across the Yakima WtW programs (Table II.2). Support services accounted for eight percent of total costs for Yakima-PFP, which targeted noncustodial parents. In contrast, support services accounted for half that amount in the two other Yakima programs, which did not serve, or served far fewer, noncustodial parents.
4. For example, Nashville-Pathways could provide bus passes or gas reimbursement for 3 months out of a 12-month period for those in job readiness or work experience, among various other supportive services or payments.
5. See Nightingale et al. 2002.
6. Seventy-six percent of those individuals ever active during TWC's cost analysis year participated in transitional work during this same period.
7. Other participants received retention services only, but they still figure in the calculation of average costs for the programs.
8. The per-participant costs for these two WtW programs also could have been lower for other reasons. As in Philadelphia-TWC, the Chicago-Easter Seals work experience component integrated job readiness and case management activities. It was much shorter, however (four weeks maximum instead of six months maximum). Reportedly, the Chicago-Catholic Charities staff did not interact as often with WtW participants in work experience, who were only required to attend a weekly job club while in paid work experience activities.
9. During the cost analysis year, the West Virginia-HRD program placed 228 participants in unsubsidized jobs and spent about $110,000 on wage supplements, for an average wage supplement cost of $480 per participant placed in unsubsidized employment. Supplements were reduced over three eight-week intervals--bringing the wage up to $7.75 per hour for the first eight weeks, $6.80 for the second eight weeks, and $5.80 for the third eight weeks.
10. During its cost analysis year, TWC paid $258,200 in retention bonuses to 498 participants. Program records indicated that 69 percent of the TWC participants who had been placed in unsubsidized jobs by the end of the cost analysis year had received a first bonus, 48 percent had received a second bonus, and 32 percent had received a third bonus.
11. The JHU programs (Florida and Maryland) are excluded from this discussion because of their postemployment focus. JHU staff helped WtW participants secure unsubsidized jobs if they lost their original positions or were ready to advance to better positions. Initial placement in unsubsidized employment was not a primary program objective, however.
12. Based on the Bureau of Labor Statistics' average yearly rates for 2000 in each program's Metropolitan Statistical Area (www.bls.gov/lau/laumatch.htm).
13. Participants across the WtW evaluation sites were similar in prevalence of recognized barriers to employment, such as low levels of education and physical or mental disabilities (Nightingale 2002). In any given evaluation site, however, individual WtW programs could have reached out to relatively more or less disadvantaged participants.
14. See, for example, Scrivener et al. 1998; Maxfield 1990; and O'Neill 1990.
IV. Welfare-to-Work Costs in Context
Over the past 40 years, welfare policies have increasingly emphasized work. Several generations of programs to help welfare recipients prepare for and enter employment have been implemented, reformed, rethought, and replaced. Programs funded under the WtW grants program are another step in this evolution. Comparison of program costs for WtW and earlier programs can suggest useful implications about the costs of future programs as they might emerge. In this final chapter, we address two questions:
1. How do WtW costs compare to those for similar interventions, and what are the reasons for differences?
2. What are possible implications of our findings for future programs?
WtW Costs Compared to Earlier Programs
The costs of WtW programs can be best understood against the backdrop of costs in programs of the past three decades. We compared estimated cost for the WtW programs, presented in earlier chapters, to cost estimates for 10 previously evaluated efforts to promote employment among welfare recipients and populations at risk of becoming welfare recipients. These earlier programs were part of distinct welfare policy regimes or important demonstration efforts: (1) four Work Incentives (WIN) models, (2) four Job Opportunities and Basic Skills (JOBS) models, (3) the Supported Work demonstration, and (4) the Minority Female Single Parent (MFSP) demonstration.(1)
The costs of WtW programs appear to fall in the middle of the range of these programs' costs. As with WtW programs, these earlier models represented a variety of program strategies and a range of costs per participant (Table IV.1). Compared to these efforts, WtW programs were neither the least costly nor the most expensive (Figure IV.1).
Three characteristics of WtW programs help explain where they fall in the historical range of program costs. First, WtW programs targeted hard-to-employ individuals--earlier interventions did not always focus on, or even serve, such individuals. Second, WtW programs favored work over education but still emphasized human capital development in a different form. Third, WtW programs needed more intensive case management and related services to maintain this simultaneous focus on employment and human capital development with a hard-to-employ population.
WtW Costs Reflect Targeting of Hard-to-Employ Individuals
WtW programs as a whole represent a targeted effort to meet the needs of hard-to-employ individuals. After passage of PRWORA, Congress expected that some individuals would need intensive assistance to secure employment and make strides toward self-sufficiency. Hence, WtW funds were made available to supplement the work-first efforts of welfare agencies.
Some earlier employment programs intentionally omitted, or at least did not focus on, the hard to employ, and this difference accounts in part for their lower costs. For example, WIN programs--which, on average, cost $2,147 per participant, compared to $3,607 for WtW--targeted the most employable AFDC recipients (Figure IV.1). Even when program registration mandates applied more broadly, many individuals were deferred from participation due to transportation, health, or other problems (Levitan et al. 1971, Pacific Consultants 1976; and O'Neill 1990). Moreover, when program openings were scarce, priority was often given to the most employable.
Figure IV.1
Range of Average Costs per Participant for Wtw and Comparable Programs
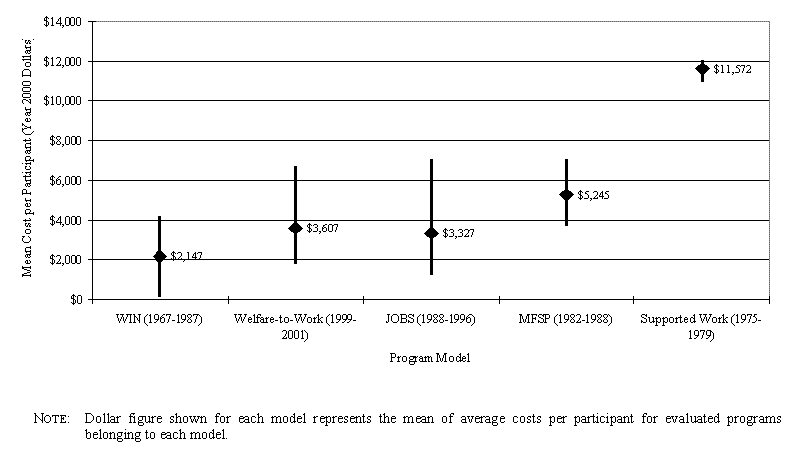
| Year Implemented | Program Model: Summary of Service Strategy (Number of Sites Included in Evaluation) | Average Cost per Participant | |
|---|---|---|---|
| Range (in dollars) | Mean (in dollars) | ||
| WIN Programs | |||
| 1967 | WIN I: basic education, vocational training, unpaid work experience, some OJT, monthly stipends (4 sites) | 2,868-4,106 | 3,384 |
| 1971 | WIN II: mostly job placement; some OJT, unpaid public service employment, and vocational training (national mean) | 2,014-2,926 | 2,470 |
| 1981 | WIN: mostly job search and unpaid work experience (7 sites) | 221-902 | 502 |
| 1985 | WIN Balanced: employment services, basic education, vocational training, counseling (4 sites) | 1,350-3,171 | 2,230 |
| Overall mean | 2,147 | ||
JOBS Programs | |||
| 1988 | JOBS Two Tracks: employment or education (3 sites) | 1,930-4,098 | 2,669 |
| 1989 | GAIN: emphasized education (6 sites) | 3,278-6,971 | 4,573 |
| 1993 | JOBS labor force attachment: mostly placement assistance (3 sites) | 1,302-3203 | 2,131 |
| 1993 | JOBS human capital: mostly basic education and vocational training (3 sites) | 3,196-4,914 | 3,934 |
| Overall mean | 3,327 | ||
Demonstrations | |||
| 1971 | Supported Work: highly structured paid work experience, job search training, and placement assistance (13 sites) | Not available | 11,572 |
| 1983 | MFSP: mostly basic education and vocational training, plus supportive services (4 sites) | 3,774-6,796 | 5,245 |
Welfare-to-Work | |||
| 1998 | WtW Enhanced Direct Employment with Work Experience (West Virginia-CEP and Yakima-FWC, PFP, and OIC) | 3,530-4,912 | 4,162 |
| 1988 | WtW Enhanced Direct Employment (Chicago-ES&S and Maximus; Fort Worth-ANS and Women's Center) | 1,187-4,133 | 2,182 |
| 1998 | WtW Transitional Employer-Tailored (Boston-Marriott and Partners, Chicago-Pyramid) | 2,308-5,827 | 4,154 |
| 1998 | WtW Transitional Work Experience (Chicago-Easter Seals and Catholic Charities, Philadelphia-TWC) | 3,086-6,641 | 4,346 |
| 1998 | WtW Transitional "Small Steps" (Nashville-Pathways) | Not applicable | 1,964 |
| 1998 | WtW Postemployment Skills Development (JHU-Florida and JHU-Maryland) | 2,167-2,189 | 2,178 |
| Overall mean (18 individual programs) | 3,607 | ||
| Sources: Levitan et al. 1971; Pacific Consultants 1976; Hollister et al. 1984; Handwerger and Thornton 1988; O'Neill 1990; Maxfield 1990; Scrivener et al. 1991 and 1998; Riccio et al. 1994; Hamilton et al. 1997; Storto et al. 2000; and Farrell et al. 2000. Notes: All costs are reported in year 2000 dollars. Calculations of mean costs are based on available program evaluations. Estimates for WIN job search, WIN balanced, and demonstration programs include child care costs, which were minor (likely under 10 percent per participant for WIN). Child care costs have been excluded from the remaining comparative programs, since our WtW estimates do not include child care assistance available to WtW participants through TANF or other sources. Costs for other supportive services (mainly transportation) have been included for all programs. OJT = on-the-job training. | |||
Expansion of target populations has been reflected in increased costs. Over time, programs to increase employment among welfare recipients have broadened the populations they serve. Instead of focusing on the immediately employable only, groups were included that had less work experience or more potential barriers to employment (such as limited education and longer welfare spells). For example, JOBS programs were specifically required to focus on long-term AFDC recipients, not just on the most employable recipients. Costs were higher than for the earlier WIN programs, averaging $3,327, even when, in practice, many hard-to-employ individuals were still exempted from participation.(2)
Differences in target population, however, do not fully explain program cost differences. WtW programs explicitly targeted the most disadvantaged TANF recipients, including many who might have been exempted from JOBS participation requirements, yet average WtW costs were similar to the average costs of JOBS programs (Figure IV.1). Moreover, WtW costs were substantially lower than those for programs operated as part of the National Supported Work Demonstration ($11,572), which also targeted hard-to-employ individuals. The reason for these apparent discrepancies is that the differences between WtW and both JOBS and Supported Work also reflect important differences in the services offered or emphasized.
WtW Favors Work but Still Emphasizes Skill Building
Programs that emphasize quick entry into employment and provide mostly job search assistance and placement services consistently have had relatively low costs, regardless of their target population. With mean costs of $502 and $2,131 per participant, respectively, the WIN and JOBS "labor force attachment" programs were the least costly among related efforts (Table IV.1).Similarly, the "enhanced direct employment" WtW programs ($3,559) were less costly, on average, than the $4,077 average across all "transitional employment" WtW programs (Table III.6).
Programs serving harder-to-employ participants have generally provided more than basic employment services. Programs have offered education and training, work experience, and other intensive service components aimed at increasing skills and overall human capital to individuals for whom job search and placement assistance alone did not, or were not expected to, result in rapid or adequate employment. Not surprisingly, programs have had higher costs when they offered expanded services such as adult basic education (ABE), English as a Second Language (ESL) instruction, and occupational training. For example, WIN I ($3,384) and JOBS human capital ($3,934) programs emphasized such education alternatives for their less work-ready participants, and cost more, on average, than WIN ($502) and JOBS labor force attachment programs ($2,131), their rapid-attachment counterparts (Table IV.1).
WtW programs have not emphasized traditional education and training activities, yet their costs are similar to programs that did. Instead of emphasizing education and training, WtW programs sought to build participants' foundation for employment through direct work experience and other activities more directly related to employment. WtW programs emphasized structured job readiness classes, work experience, and skills upgrade activities wrapped around work hours, as a way to enhance participant human capital. Thus, the costs of WtW programs overall ($3,607) were roughly similar to those for education-based programs (see above) because both emphasized skill building for their hard-to-employ participants.
However, WtW programs that offered work experience (at an average cost of $5,098 per participant--Table III.2) were, on average, more costly than all WIN and JOBS programs, even though WIN and JOBS also typically offered work experience as a preemployment option (Table IV.1). This was because WtW programs generally paid or subsidized participant wages and often provided work experience to a substantial portion of their participants, while WIN and JOBS programs did not pay participant wages and enrolled few participants in work experience.(3) Furthermore, work experience in WtW lasted longer--six months or more in seven of the nine WtW programs that offered work experience, compared to a three-month limit under both WIN and JOBS.
None of the WtW work experience programs, however, were as costly as the National Supported Work Demonstration programs, which provided highly structured and closely supervised work experience to their hard-to-employ participants. Supported Work was particularly costly because program operators had to set up and maintain business enterprises that could provide appropriate work experience opportunities to groups of participants at any given time (Hollister et al. 1984). In contrast, the WtW programs that offered work experience relied primarily on placements in the public or nonprofit sectors. Hence, even the most structured WtW work experience program, Philadelphia-TWC, had an average cost of $6,641 per participant, a full 42 percent less than the average Supported Work program ($11,572).(4)
Focus on Employment for the WtW Population Has Required More Intensive Services
Because they are dealing with the WtW target population and still focusing on employment, most WtW programs needed more intensive case management and more specialized staff than earlier programs. Both of these shifts have contributed to higher costs. Under WIN, welfare agencies primarily relied on eligibility workers to assess, then refer, AFDC recipients for placement services, which were provided mostly through local employment service offices (Levitan et al. 1972; and Mitchell et al. 1979). Under JOBS, welfare offices expanded case management to include more assessment, closer case supervision, and employment counseling, sometimes provided by specialized workers (Riccio et al. 1994).
Compared to these earlier programs, the core services offered by WtW represent a further intensification of individualized case management and other specialized services, for several reasons. First, all the WtW programs we examined offered postplacement services to help participants retain their jobs and potentially advance to better positions. Earlier programs usually did not provide such follow-up services. Second, some WtW programs had job developers and other placement staff who managed comprehensive or systematic placement components, and some programs even formed partnerships with local businesses or industries to fill positions for specific employers. Finally, some WtW programs were explicitly designed to be consistent with TANF work activity requirements. Hence, job readiness, case management, and employment activities were usually more structured and closely managed by staff, so that programs could insure that participants spent as many as 35 hours weekly in allowable work activities.
Implications for Future Programs
There are no current plans to reauthorize the WtW grants program, and whether states will continue to provide similar supplemental services to hard-to-employ TANF recipients is unknown. However, recent developments suggest that states may have strong incentives to continue to focus on hard-to-employ individuals or even to intensify past efforts. Earlier steep declines in TANF caseloads, which enabled many states to meet aggregate work requirements, have leveled off, and some states have experienced slight increases--possibly as a result of the economic slowdown of late 2001. Furthermore, the President's welfare reform proposals made in early 2002 urge Congress to require substantially more welfare recipients to get jobs and work longer hours.(5)
States' future ability to meet existing or expanded work mandates may depend on their ability to engage not only the most work-ready, but also a substantial proportion of hard-to-employ individuals on their caseloads, in approved work activities. Depending on the strength of the economy and other factors, states may find that a high proportion of the individuals on their caseloads need assistance meeting expanded work requirements. As our review has shown, doing "what it takes" to help these individuals is likely to have cost implications.
While it is impossible to predict the direction of future efforts, we see at least two adjustments that the operators of programs that target the hard-to-employ may decide to pursue. First, program operators may further intensify structured services and case management to help hard-to-employ individuals prepare for, secure, and succeed in employment, while simultaneously meeting work activity requirements. Future programs that target the hard-to-employ and use this approach may cost as much as, or more than, WtW programs. Second, state calls for increased flexibility in program design may allow programs to place more emphasis on education and training, while still retaining a work-first focus. The cost implications of this second potential shift are more uncertain.
Costs of education and training are more uncertain in part because WtW programs did not emphasize them. Long-term education and training were excluded as approved work activities under TANF, and short-term education and training were limited, at least initially, by the WtW regulations. Even after these restrictions were relaxed, and some programs made education and training services available, WtW participants did not use them extensively.(6) This was especially true when education and training activities had to be pursued concurrent with employment, instead of as part of the structured services offered by WtW programs.
Thus, the WtW process and cost analyses leave considerable uncertainty about how more emphasis on basic or occupational training would affect costs. Integrating education and training into structured services could increase participation in such activities and, therefore, the costs of programs that target hard-to-employ individuals.(7) However, to the extent that new policies require participants to pursue education and training activities concurrent with employment, participation may continue to be limited (as it has been in WtW programs) and cost increases therefore less pronounced.
1. Appendix B provides details on the services offered by these programs and their costs.
2. JOBS participation was mandatory for those without children under age 3, but individuals could be deferred for illness, remoteness from the program, lack of child care, or other acceptable reasons. This was similar to WIN deferral policies, except that the age of the youngest child under WIN was age 6, rather than age 3 (U.S. General Accounting Office 1999).
3. WtW payments of wages or stipends were partly offset by decreases in TANF cash assistance, but usually not on a dollar-for-dollar basis. Thus, compared to earlier unpaid work experience programs, WtW programs offering paid work experience would still be more costly from a societal perspective. WtW regulations required WtW programs to compensate participants for the hours spent in work experience. To be compensated, participants could work up to the number of hours calculated by dividing their TANF grant by the minimum wage (the same strategy as many of the WIN and JOBS programs that we have characterized as unpaid), but the payment of wages was explicitly preferred. Yet, the greater use of subsidized work experience under WtW may also reflect a shift toward providing more work experience and other opportunities for transitional employment (such as OJT) in the private rather than the public or nonprofit sectors. For example, WtW programs like Chicago-Pyramid or West Virginia-HRD had to pay or, at least, partially subsidize participants' wages to secure such placements.
4. As demonstration programs, both Supported Work and MFSP programs may also have incurred some additional costs compared to WIN, JOBS and WtW, for several reasons. First, because they were not explicitly linked to welfare, the programs had to build their own referral linkages to and from other community resources. Second, both demonstrations also included many participants who were not receiving AFDC, so programs had to make a wide range of services available to them.
5. Key components of the President's welfare reform agenda are (1) increasing minimum work requirements so that, by 2007, 70 percent of welfare families are required to participate in work and other activities designed to help them achieve self-sufficiency; and (2) requiring welfare recipients to work 40 hours per week, either at a job or in programs designed to help them achieve independence (www.whitehouse.gov/news/releases/2002/02/20020226.html).
6. Nightingale, et al. 2002.
7. The cost estimates for GAIN programs, which emphasized education and training, can be used to estimate the magnitude of this potential increase in costs. The mean cost per participant for GAIN program services other than education and training (namely, orientation, assessment, appraisal, and job search) was $1,610. Program costs increase to $2,996 when the average costs of basic education (ABE and ESL) are added and to $4,190 when the costs of postsecondary and vocational education are also added (Riccio et al. 1994). Thus, adding education and training activities, if pursued by a high proportion of participants, could add $3,000 or more to the per-participant costs of programs.
References
Bliss, Steven. San Francisco Works: Toward an Employer-Led Approach to Welfare Reform and Workforce Development. New York: Manpower Demonstration Research Corporation, 2000.
Burke, Vee. "Statement of Vee Burke, Specialist in Income Maintenance, Congressional Research Service, Library of Congress Testimony Before the Subcommittee on Human Resources of the House Committee on Ways and Means Hearing on Welfare Reform and Work." April 3, 2001. Available at [www.house.gov/ways_means/humres/107cong/4-3-01/4-3burk.htm].
Farrell, Mary. "National Evaluation of Welfare-to-Work Strategies: Implementation, Participation Patterns, Costs, and Two-Year Impacts of the Detroit Welfare-to-Work Program." Washington, DC: U.S. Department of Health and Human Services, Administration for Children and Families, and U.S. Department of Education, Office of the Under Secretary and Office of Vocational and Adult Education, August 2000.
Fender, Lynne, Alan Hershey, and Demetra Smith Nightingale. "Welfare-to-Work Grant Programs Tackle Recruitment Challenges. The National Evaluation of the Welfare-to-Work Grants Programs." Occasional brief, series no. 0001. Washington, DC: Urban Institute, November 2000.
Friedlander, Daniel, Stephanie Freedman, Gayle Hamilton, and Janet Quint. "Illinois: The Demonstration of State Work/Welfare Initiatives, Final Report on Job Search and Work Experience in Cook County." New York: Manpower Demonstration Research Corporation, November 1987.
Friedlander, Daniel, Gregory Hoerz, Janet Quint, and James Riccio. "Arkansas: The Demonstration of State Work/Welfare Initiatives, Final Report on the WORK Program in Two Counties." New York: Manpower Demonstration Research Corporation, September 1985.
Goldman, Barbara. "Impacts of the Immediate Job Search Assistance Experiment." New York: Manpower Demonstration Research Corporation, June 1981.
Hamilton, Gayle, Thomas Brock, Mary Farrell, Daniel Friedlander, and Kristin Harknet. "National Evaluation of Welfare-to-Work Strategies: Two-Year Findings on the Labor Force Attachment and Human Capital Development Programs in Three Sites." Washington, DC: U.S. Department of Health and Human Services, Administration for Children and Families, and U.S. Department of Education, Office of the Under Secretary and Office of Vocational and Adult Education, December 1997.
Handwerger, Sharon, and Craig Thornton. "The Minority Female Single Parent Demonstration: Program Costs." New York: Rockefeller Foundation, 1988.
Hillabrant, Walter, Mack Rhoades, Nancy Pindus, and John Trutko. "The Evaluation of the Tribal Welfare-to-Work Grants Program: Initial Implementation Findings." Silver Spring, MD: Support Services International, Inc., November 2001.
Hillabrant, Walter, and Mack Rhoades. "Learning from Tribal Experience: The Evaluation of the Tribal Welfare-to-Work Grants Program." Silver Spring, MD: Support Services International, Inc., December 2000.
Hollister, Robinson G., Peter Kemper, and Rebecca A. Maynard. The National Supported Work Demonstration. Madison, WI: University of Wisconsin Press, 1984.
Levitan, Sar A., Martin Rein, and David Marwick. Work and Welfare Go Together. Baltimore, MD: Johns Hopkins University Press, 1972.
Martinson, Karin, John Trutko, and Debra Strong. "Serving Noncustodial Parents: A Descriptive Study of Welfare-to-Work Programs." Washington, DC: Urban Institute, December 2000.
Maxfield, Miles Jr. Planning Employment Services for the Disadvantaged. New York: Rockefeller Foundation, 1990.
Mitchell, John J., Mark L. Chadwin, and Demetra Smith Nightingale. "Implementing Welfare-Employment Programs: An Institutional Analysis of the Work Incentive (WIN) Program." Washington, DC: Urban Institute, October 1979.
Nightingale, Demetra Smith. "Program Structure and Service Delivery in Eleven Welfare-to-Work Grant Programs." Washington, DC: Urban Institute, January 2001.
Nightingale, Demetra Smith, Nancy Pindus, and John Trutko (with contributions by Michael Egner). "Slow but Steady: The Implementation of the Welfare-to-Work Grant Programs." Draft report. Princeton, NJ: Mathematica Policy Research, Inc., February 2002.
Nightingale, Demetra Smith, Terri Thompson, Nancy Pindus, Pamela Holcomb, Edgar Lee, and Jesse Valente. "Early Implementation of the Welfare-to-Work Grants Program: Report to Congress, Part II." Princeton, NJ: Mathematica Policy Research, Inc., 2000.
O'Neill, June. Work and Welfare in Massachusetts: An Evaluation of the ET Program. Boston, MA: Pioneer Institute for Public Policy Research, 1990.
Pacific Consultants. "The Impact of WIN II." Washington DC: U.S. Department of Labor, Employment and Training Administration, Office of Policy, Evaluation, and Research, September 1976.
Perez-Johnson, Irma, Alan M. Hershey, and Jeanne Bellotti. "Further Progress, Persistent Constraints: Findings from a Second Survey of the Welfare-to-Work Grants Program." Princeton, NJ: Mathematica Policy Research, Inc., May 2000.
Perez-Johnson, Irma, and Alan M. Hershey. "Early Implementation of the Welfare-to-Work Grants Program: Report to Congress." Princeton, NJ: Mathematica Policy Research, Inc., March 1999.
Plimpton, Lisa, and Demetra Smith Nightingale. "Welfare Employment Programs: Impacts and Cost-Effectiveness of Employment and Training Programs." In Improving the Odds, edited by Burt S. Barnow and Christopher E. King. Washington, DC: Urban Institute Press, 2000.
Quint, Janet, Joseph Ball, Barbara S. Goldman, Judith Gueron, and Gayle Hamilton. "Maryland: The Demonstration of State Work/Welfare Initiatives, Interim Findings from the Maryland Employment and Initiatives Programs." New York: Manpower Demonstration Research Corporation, February 1984.
Riccio, James, Daniel Friedlander, and Stephen Freedman. "GAIN: Benefits, Costs, and Three-Year Impacts of a Welfare-to-Work Program." New York: Manpower Demonstration Research Corporation, September 1994.
Scrivener, Susan, Gayle Hamilton, Mary Farrell, Stephen Freedman, Daniel Friedlander, Marisa Mitchell, Jodi Nudelman, and Christine Schwartz. "National Evaluation of Welfare-to-Work Strategies, Implementation, Participation Patterns, Costs and Two-Year Impacts of the Portland (Oregon) Welfare-to-Work Program." Washington, DC: U.S. Department of Health and Human Services, Administration for Children and Families, and U.S. Department of Education, Office of the Under Secretary and Office of Vocational and Adult Education, May 1998.
Storto, Laura, Gayle Hamilton, Christine Schwartz, and Susan Scrivener. "National Evaluation of Welfare-to-Work Strategies: Oklahoma City's ET & E Program: Two-Year Implementation, Participation, Cost and Impact Findings." Washington, DC: U.S. Department of Health and Human Services, Administration for Children and Families, and U.S. Department of Education, Office of the Under Secretary and Office of Vocational and Adult Education, August 2000.
U.S. General Accounting Office. "Welfare Reform: Assessing the Effectiveness of Various Welfare-to-Work Approaches." Publication no. GAO/HEHS-99-179. Washington, DC: GAO, September 1999.
U.S. General Accounting Office. "Welfare-to-Work: States Begin JOBS, but Fiscal and Other Problems May Impede Their Progress." Publication no. GAO/HRD-91-106. Washington, DC: GAO, September 1991.
Appendix A: Profiles of WtW Programs Included in the Cost Analysis
Program Profile: Boston-Marriott
WtW Operator/Program: Marriott Pathways to Independence Employer Partnership
Grant Administrator: Office of Jobs and Community Services (JCS) in the Boston Economic Development and Industrial Corporation
Provider Background:Marriott Corporation and Crittenton Hastings House, a local nonprofit community organization, formed this employer partnership to provide employer-focused, job readiness training, and case management services through yearly contracts with JCS.
Target Population:WtW-eligible people who are relatively job ready
Statistics for the WtW Program Overall Vs. The Cost Analysis
| WtW Program Overall | Cost Analysis Period | |
|---|---|---|
| Period of Operations | 11/1/99 to 10/31/00 | 11/1/99 to 10/31/00 |
| Funding/Costs | $212,163 (second contract year) | $216,233 (total estimated costs for one year) |
| Enrollments | Goal: 30 | Actual: 36 |
| Unsubsidized Job Placements | Goal: 25 | Actual: 26 |
Welfare-to-Work Program Services
Outreach and Recruitment:The Marriott shared responsibility for outreach with JCS and the career centers. JCS hired an outreach coordinator, conducted direct mailings, and ran advertising campaigns on the radio and on public transit. The Marriott employment manager promoted the program to community groups. The career center staff visited the Department of Transitional Assistance (DTA) offices to distribute flyers and meet with prospective participants. The prospective participants were assessed and screened for their appropriateness for the Marriott program, first by center staff, later by staff from the Marriott.
Job Readiness and CaseManagement:Participants received a two-week classroom training covering basic employment and life skills. The training was conducted at one of Marriotts hotels by staff from Marriott and Crittenton, the agency contracted by Marriott to provide case management services. The case manager performed assessments, arranged for support services, and provided counseling services to participants, regardless of their program status in the Marriott program.
After completing the classroom training, participants spent four weeks job shadowing in departments that matched their occupational interests. The Marriott employment manager gave participants a weekly performance review, with input from the participants supervisors.
Paid Temporary Employment:Not available
Job Development and Placement:The Marriott employment manager worked with Marriott human resources department staff to place participants in permanent jobs at one of Marriotts four Boston locations. The staff placed participants in jobs in participants area of interest, where they would fit best, and where they were most needed.
Postplacement Followup: The Crittenton case manager followed up with employed participants by telephone and in person.
Support Services: DTA was the primary provider of supportive services, but the Marriott provided uniforms and supportive services on an as-needed basis.
Other: None
Program Profile: Boston-Partners
WtW Operator/Program: Partners Health Care (PHC) Employer Partnership
Grant Administrator: Office of Jobs and Community Services (JCS) in the Boston Economic Development and Industrial Corporation
Provider Background: In 1994, Massachusetts General and Brigham and Womens hospitals founded PHC as a nonprofit organization to develop an integrated health care delivery system in the region. In addition to the two founding academic medical centers, the PHC system includes physicians, community hospitals, specialty facilities, community health centers, and other health-related entities. PHC partnered with two local community organizations (WorkSource Staffing and the Jewish Vocational Service) to provide employer-focused, job readiness training and case management services through yearly contracts with JCS.
Target Population: WtW-eligible people who are relatively job ready (that is, have at least 6th-grade literacy skills and strong English-language skills) and have an interest in a career in the health care industry
Statistics for the WtW Program Overall Vs. The Cost Analysis
WtW Program Overall | Cost Analysis Period | |
|---|---|---|
| Period of Operations | 10/1/99 to 9/30/00 | 10/1/99 to 9/30/00 |
| Funding/Costs | $444,871 (second contract year) | $457,959 |
| Enrollments | Goal: 60 | Actual: 51 |
| Unsubsidized Job Placements | Goal: 45 | Actual: 34 |
Welfare-to-Work Program Services
Outreach and Recruitment:PHC shared the responsibility for outreach with JCS and the career centers. JCS hired an outreach coordinator, conducted direct mailings, and ran advertising campaigns on the radio and on public transit. The PHC coordinator and the case manager from WorkSource, PHCs partner organization responsible for case management services, made presentations and distributed information in the community. The career center staff visited the Department of Transitional Assistance (DTA) offices to distribute flyers and meet with prospective participants. The prospective participants were assessed and screened for their appropriateness for the PHC, first by center staff, later by PHC staff.
Job Readiness and CaseManagement:Jewish Vocational Service was responsible for the training. It used a customized curriculum, which it developed in conjunction with PHC and WorkSource. The curriculum covered both employment-related soft skills and hard skills, such as medical terminology, basic literacy and math skills, and basic computer skills. The curriculum consisted of a seven-week classroom component and a two-week job-shadowing component that ran concurrently with the last two weeks of the classroom component. The participants had two job-shadowing experiences the first could be in any department, the second was matched to the participants area of interest. After they completed training, and while they waited to be placed in a permanent job, participants attended a job club. The PHC coordinator led this club, with the support of a mental health counselor who addressed participants personal and emotional issues.
Paid Temporary Employment:Not available
Job Development and Placement:The PHC coordinator worked with PHC staff to identify job openings in the PHC system. The coordinator worked with PHCs human resources department staff to place participants in permanent jobs in their area of interest and where they would fit best and were needed. Most participants were placed in full-time, entry-level positions at Massachusetts General Hospital or Brigham and Womens Hospital.
Postplacement Followup: Case managers from WorkSource follow up with participants for up to 12 months after enrollment in the program. They help participants access support services and address issues that arise. The case managers are located at the partners training site.
Support Services: Not available. DTA was responsible for providing support services with Temporary Assistance for Needy Families funds.
Other: None
WtW Program Profile: Chicago-Catholic Charities
WtW Operator/Program:Catholic Charities, Welfare-to-Work Program
Grant Administrator:Mayors Office of Workforce Development, Chicago
Provider Background:Founded in 1917, Catholic Charities is the social services arm of the Catholic Church. This nonprofit organization provides a range of services for low-income, disadvantaged households in metropolitan Chicago.
Target Population:WtW-eligible people
Statistics for the WtW Program Overall Vs. The Cost Analysis
| WtW Program Overall | Cost Analysis Period | |
|---|---|---|
| Period of Operations | 7/1/98 to 6/30/01 | 1/1/00 to 12/31/01 |
| Funding/Costs | $3,807,177 (WtW grant/contract amount) | $1,722,558 (total estimated costs for one year) |
| Enrollments | Goal: 1,000 | New: 350 Cumulative by end of period: 1,149 |
| Unsubsidized Job Placements | Goal: 775 | New: 179 Cumulative by end of period: 314 |
Welfare-to-Work Program Services
Outreach and Recruitment:Most WtW referrals came directly through local Illinois Department of Human Services (IDHS) offices. Catholic Charities staff visited the local offices about once a month to distribute brochures and discuss Catholic Charities services and the progress of active WtW participants with IDHS staff. Occasionally, Catholic Charities staff made presentations at IDHS workshops and orientation sessions. Catholic Charities received a few referrals from its other programs.
Job Readiness and CaseManagement:Participants went through a one-hour orientation and several hours of assessment. The assessment included a one-on-one interview, the Test of Adult Basic Education, and a drug test. Those who failed the drug test were referred to Catholic Charities drug treatment program. Those who passed the drug test were immediately enrolled in a two-week job readiness class and the Pathways peer support group. In the job readiness class, participants learned planning, job search, job retention, and other essential skills. Pathways met monthly to help participants stay focused on their goals. It gave them the opportunity to work on soft skills, and to discuss problems they were encountering. While in job readiness activities, participants also attended a weekly job club meeting, where they could obtain job leads and general help structuring their job search.
Paid Temporary Employment:Participants without a job after three weeks of job search were placed in a subsidized job, for up to 30 hours per week, for up to six months. Participants received $5.15 per hour worked.
Job Development and Placement:A job developer was assigned to each participant after the participant completed the job readiness workshop or after enrollment, if the participant was job ready then. The job developers helped participants structure their job search and monitored their progress. Although the job developers gave participants some job leads, participants were responsible for developing their own job leads and structuring their job search. Participants continued attending the weekly job club while they searched for employment.
Postplacement Followup: Job developers tracked the progress of employed participants for the first 30 days. After the 30th day, the job developer turned the case over to retention specialists, who tracked the participants for another 150 days. Tracking was done through a combination of telephone and on-site meetings with the participant and the employer. Catholic Charities also operated a retention group that met on two Saturdays each month. It featured discussions and presentations on topics of interest to recently employed people (for example, taxes, individual development accounts, and training opportunities).
Support Services: Catholic Charities helped WtW participants with transportation, clothing, and tools.
Other:In 2001, Catholic Charities started to refer a small number of participants to short-term occupational training programs. Participants could access other programs operated by Catholic Charities, including domestic violence, housing assistance, emergency assistance, and child care services.
WtW Program Profile: Chicago-E&ES
WtW Operator/Program: Employment and Employer Services, Inc. (E&ES), Welfare-to-Work Program
Grant Administrator:Mayors Office of Workforce Development, Chicago
Provider Background:E&ES was founded in 1983 largely to provide Job Training Partnership Act (JTPA) services. Originally a nonprofit organization, E&ES converted into a for-profit entity in 1990 because of JTPA prohibitions on carrying unexpended contract funds into the next year. E&ES has about 160 staff members across six locations.
Target Population:WtW-eligible people
Statistics for the WtW Program Overall Vs. The Cost Analysis
| WtW Program Overall | Cost Analysis Period | |
|---|---|---|
| Period of Operations | 4/1/00 to 6/30/02 | 7/1/00 to 6/30/01 |
| Funding/Costs | $4,800,000 (WtW grant/contract amount) | $1,867,690 (total estimated costs for one year) |
| Enrollments | Goal: 1,300 | New: 1,057 Cumulative by end of period: 1,147 |
| Unsubsidized Job Placements | Goal: 675 | New: 427 Cumulative by end of period: 454 |
Welfare-to-Work Program Services
Outreach and Recruitment:E&ES received most of its referrals from the Illinois Department of Human Services (IDHS). Because of falling referrals from IDHS, E&ES tried to recruit noncustodial parents and the working poor, with mixed results. Referral procedures were established, but few WtW eligible noncustodial parents or working poor individuals actually enrolled.
Job Readiness and Case Management:Participants entering E&ES went through a two-hour orientation, usually led by E&ES graduates. They also took the Test of Adult Basic Education at this time. After orientation, participants entered a two-week job readiness class that addressed job search skills, as well as personal issues and life skills. In the job readiness class, participants also received a drug test. Those testing positive were referred to the clinical counselor at E&ES. After completing the job readiness class and concurrent with their job search, participants received life skills and work-related soft skills instruction from case managers.
Paid Temporary Employment:Not available
Job Development and Placement:After completing the job search class, participants were expected to come in daily to work with E&ES staff in pursuing job leads. E&ES staff referred participants to employers in its extensive employer network, developed over its years as a JTPA contractor. Wage subsidies were used occasionally.
Postplacement Followup: During the first month of employment, E&ES staff contacted the participant and the employer weekly. E&ES required participants to sign a release form that authorized employers to share information with E&ES if problems arose. E&ES also established a call center to contact participants in the evenings after the first month to check on their progress. Typically, after participants had been employed for about six months, E&ES staff encouraged them to participate in E&ES classes that provided advanced occupational skills. E&ES also held recognition ceremonies for people employed for 180 days.
Support Services: Transportation only
Other:None
WtW Program Profile: Chicago-Easter Seals
WtW Operator/Program: Easter Seals, Project ABLE
Grant Administrator:Mayors Office of Workforce Development, Chicago
Provider Background:The mission of Easter Seals is to help people with disabilities achieve maximum independence by providing them with comprehensive services. The agency, which has seven offices in metropolitan Chicago, offered WtW services out of its office in west Chicago.
Target Population: Recipients of Temporary Assistance for Needy Families (TANF) who have disabilities
Statistics for the WtW Program Overall Vs. The Cost Analysis
| WtW Program Overall | Cost Analysis Period | |
|---|---|---|
| Period of Operations | 4/1/00 to 6/30/02 | 7/01/00 to 6/30/01 |
| Funding/Costs | $1,099,130 (WtW grant/contract amount) | $406,711 (total estimated costs for one year) |
| Enrollments | Goal: 300 | New: 142 Cumulative by end of period: 296 |
| Unsubsidized Job Placements | Goal: 160 | New: 86 Cumulative by end of period: 86 |
Welfare-to-Work Program Services
Outreach and Recruitment:Easter Seals received its WtW participants from the Illinois Department of Human Services (IDHS), most of them from two offices in west Chicago. Easter Seals staff visited local IDHS offices to promote its services to the staff and to TANF recipients. Easter Seals staff promoted Project ABLE as a program providing specialized services for people with disabilities but was also open to those without disabilities. Most participants referred to Project ABLE did not have disabilities. Easter Seals also recruited outside of IDHS offices (for example, at foster homes).
Job Readiness and CaseManagement:Participants who enrolled in Project ABLE went through a standard intake and assessment process. After receiving an orientation on Easter Seals and the WtW program, participants returned the following day to start the two-day intake and assessment process. Participants were tested on their level of motivation, occupational interests, job readiness, and level of academic performance. They were also tested for substance abuse. Those who failed the substance abuse test were referred for further assessment and, if necessary, referred to treatment. Those who passed the substance abuse test proceeded to an orientation on the program and a tour of the facility. Case managers worked with participants to develop an individual employment plan that identified employment barriers and service plans. The case managers continued to work with participants throughout their enrollment in Project ABLE, monitoring their progress, assisting with job leads, coordinating support services, and updating IDHS. The day after participants met their case manager, they enrolled in a job readiness training workshop that met three hours a day for four weeks to provide participants with life and employability skills instruction. In the last two weeks of the workshop, the participants engaged in job search.
Paid Temporary Employment:During the same period that participants attended the job readiness training workshop, they also were placed in Easter Seals industrial workshop, which provided sheltered work and training. Participants worked three hours a day and were paid on a piecemeal basis that averaged about $6 an hour. Participants could stay in the workshop as long as they needed to typically, about a month.
Job Development and Placement:The Easter Seals job developers helped participants find employment opportunities. When the participants level of disabilities and skill required, the job developers located subsidized and on-the-job training placements.
Postplacement Followup: Easter Seals assigned a job coach to each employed person to work with them on job retention and advancement. The job coaches contacted participants twice a month during the first three months and monthly during the following three months. Participants and employers were asked to contact the job coach if problems arose. Participants were also expected to attend Easter Seals monthly Job Club meeting.
Support Services: Easter Seals provided participants with bus passes and made referrals to other providers to address other needs.
Other:None
WtW Program Profile: Chicago-Maximus
WtW Operator/Program:MAXIMUS, WtW Program
Grant Administrator:Mayors Office of Workforce Development, Chicago
Provider Background:Established in 1975, MAXIMUS is a large, for-profit, health and human services management firm that administers workforce development, welfare-to-work, child support enforcement, managed care programs, and one-stop career centers across the United States.
Target Population:WtW-eligible people
Statistics for the WtW Program Overall Vs. The Cost Analysis
| WtW Program Overall | Cost Analysis Period | |
|---|---|---|
| Period of Operations | 4/1/00 to 6/30/02 | 7/1/00 to 6/30/01 |
| Funding/Costs | $2,652,166 (WtW grant/contract amount) | $1,377,100 (total estimated costs for one year) |
| Enrollments | Goal: 850 | New: 891 Cumulative by end of period: 968 |
| Unsubsidized Job Placements | Goal: 400 | New: 328 Cumulative by end of period: 354 |
Welfare-to-Work Program Services
Outreach and Recruitment:Most of the MAXIMUS referrals came from local offices of the Illinois Department of Human Services (IDHS). MAXIMUS staff visited IDHS offices regularly to remind IDHS staff of MAXIMUS services. MAXIMUS also received some referrals from other agencies and through contacts at job fairs. It also had some walk-ins.
Job Readiness and CaseManagement:All participants enrolling at MAXIMUS attended a half-day group orientation led by a case manager. At the orientation, participants received an overview of program services, a basic skills test, and a one-on-one interview. In addition, they completed an individual service strategy plan. The week after orientation, participants began a six-day, six-hour per day job readiness class that provided job search, life skills, and job retention instruction, as well as exercises to build self-esteem. Participants with major employment barriers were not placed in the job readiness class immediately after orientation; instead, they were referred to other providers to address the barriers. In addition, MAXIMUS allowed those participants who did not appear job-ready after completing the job readiness class to repeat the class or to receive individualized instruction from their case manager.
Paid Temporary Employment:Not available
Job Development and Placement:Immediately after completing the job readiness class, participants were placed in the job club, where they received the support of a MAXIMUS job developer and their case manager. The participants reported daily to a resource room equipped with telephones, computers for on-line job search and for preparing resumes and cover letters, and facsimile machines. Participants were also required to contact three to five employers per day. MAXIMUS invited employers to recruit at the job club and received job orders from employers. At the end of each month, the case managers reviewed participants progress.
Postplacement Followup: MAXIMUS staff contacted participants regularly for the first 180 days of employment weekly for the first 30 days, biweekly for the next 60 days, and monthly for the remaining 90 days.
Support Services: MAXIMUS helped participants with transportation, child care, rent, and work-related expenses, such as shoes and uniforms.
Other:Participants had access to the learning lab at MAXIMUS, which had computers equipped with basic skills and literacy-upgrading software.
WtW Program Profile: Chicago-Pyramid Partnership
WtW Operator/Program:Pyramid Partnership/Projects Hyatt and Workwise
Grant Administrator:Mayors Office of Workforce Development, Chicago
Provider Background:Pyramid Partnership, Inc., was established in 1985 as a consulting firm specializing in staff training and development for service-driven industries. In the mid-1990s, Pyramid received state certification to operate a postsecondary vocational training school. Pyramid specializes in training disadvantaged workers for entry-level jobs using an employer-driven curriculum.
Target Population:Job ready people
Statistics for the WtW Program Overall Vs. The Cost Analysis
| WtW Program Overall | Cost Analysis Period | |
|---|---|---|
| Period of Operations | 7/1/98 to 6/30/02 | 7/1/00 to 6/30/01 |
| Funding/Costs | $3,815,1500 (WtW grant/contract amount) | $711,242 (total estimated costs for one year) |
| Enrollments | Goal: 455 | New: 130 Cumulative by end of period: 322 |
| Unsubsidized Job Placements | Goal: 223 | New: 79 Cumulative by end of period: 263 |
Welfare-to-Work Program Services
Outreach and Recruitment:Pyramid received most of its WtW referrals from local offices of the Illinois Department of Human Services (IDHS). Pyramid staff periodically visited the IDHS offices to conduct outreach to staff and to prospective WtW participants. Pyramid received some referrals from other social service agencies.
Job Readiness and CaseManagement:After completing an orientation, participants were assessed for potential barriers to employment and to help match them to employers. The assessment involved the Test of Adult Basic Education, substance abuse screening, a criminal background check, and a one-on-one interview with a case manager that included behavior-screening questions for work readiness. People with an active drug problem were referred to a facility for treatment. Those with felony backgrounds were either referred back to IDHS or put in placement services for unsubsidized employment. The remaining participants were placed in a four-week, 120-hour job readiness workshop that focused on soft skills, self-esteem building, conflict management, and basic employability skills.
Paid Temporary Employment:Participants who completed the job readiness workshop were placed in four- to six-week paid on-the-job training (OJT) positions with one of Pyramids employer partners. Under the Round 1 grant, all participants were placed with Hyatt Hotels, with Pyramid paying 100 percent of the participants wages ($7.50 per hour) for the first two weeks and 50 percent of the wages for the final four weeks. Under the Round 2 grant, other employers were included, with Pyramid paying 100 percent of the participants wages ($6.50 to $8.25 per hour, depending on the employer) for the duration of the OJT.
Job Development and Placement:Participants who successfully completed their OJT were hired by their OJT employer.
Postplacement Followup: Pyramid staff tracked participants in their jobs for six months. In addition to providing postplacement assistance, Pyramid case managers encouraged former participants to take advantage of basic skills and other training available at Pyramid.
Support Services: Pyramid provided participants with transportation (bus passes) for up to six months and funds to cover other employment-related expenses, including initial union dues.
Other:None
WtW Program Profile: Fort Worth-ANS
WtW Operator/Program:Arlington Night Shelter (ANS), Project Link
Grant Administrator:Tarrant County (Texas) Workforce Development Board (TCWDB)
Provider Background:ANS is a nonprofit organization established in 1986 to prevent homelessness and to serve the homeless in Arlington. ANS operates an 87-bed shelter for the homeless and provides meals, case management, employment preparation and search, and recreational services for the homeless.
Target Population:Homeless and transient population in Arlington, Texas
Statistics for the WtW Program Overall Vs. The Cost Analysis
| WtW Program Overall | Cost Analysis Period | |
|---|---|---|
| Period of Operations | 10/1/98 to 9/30/01 | 1/1/00 to 12/31/00 |
| Funding/Costs | $384,000 (WtW contract amount for 2 years) | $231,760 (total estimated costs for 1 year) |
| Enrollments | Goal: Not available | Actual: 62 |
| Unsubsidized Job Placements | Goal: 68 percent | Actual: 30 |
Welfare-to-Work Program Services
Outreach and Recruitment:ANS received its participants from TCWDB (some of whom ANS recruited and sent to TCWDB for WtW eligibility determination). ANS recruited participants through brochures distributed in places frequented by the homeless and among people seeking housing assistance. In addition, during the cost analysis period, ANS conducted an outreach effort to reengage participants who had dropped out of the program, paying a $25 bonus to each participant who reentered the program.
Job Readiness and CaseManagement:ANS staff assessed participants for job readiness and employment barriers. Participants received job readiness instruction at a four- week job readiness workshop and a weekly job search class. The job readiness workshop, offered twice during the cost analysis period, sought to build self-confidence and worth and to provide general employability and life skills needed to find and keep a job. The job search class was a combination support group and work preparation workshop. During this preemployment stage, ANS case managers arranged for support services, taught problem-solving skills, and provided support and encouragement.
Paid Temporary Employment:Not offered
Job Development and Placement:An ANS job developer attended job forums, cold-called employers for job openings, and reviewed the employment section in the local newspaper for job leads. ANS staff took participants to job fairs, helped them with their job applications, and, if requested, accompanied them to job interviews. Each participant placed in a job received a $20 bonus.
Postplacement Followup: ANS staff maintained regular contact with the employer and the participant after job placement to monitor the participants progress and to resolve any problems. ANS paid $40 to each participant still employed after 180 days.
Support Services: ANS provided support services needed to address employment barriers that were not covered by other providers. ANS contracted with a local faith-based organization to provide transportation services and provided funds for vehicle repairs and other needs that affected job readiness.
Other:None
WtW Program Profile: Fort Worth-WC
WtW Operator/Program:Womens Center, WtW Program
Grant Administrator:Tarrant County (Texas) Workforce Development Board (TCWDB)
Provider Background:The Womens Center (WC) is a community-based, nonprofit organization established in 1979 to advocate on behalf of women and to provide services to women and their families in Tarrant County. Its 65 staff members provide counseling, employment, and life skills services to women and their families.
Target Population:WtW-eligible people
Statistics for the WtW Program Overall Vs. The Cost Analysis
| WtW Program Overall | Cost Analysis Period | |
|---|---|---|
| Period of Operations | 10/1/98 to 9/30/01 | 1/1/00 to 12/31/00 |
| Funding/Costs | $ 1.5 million (WtW grant/contract amount) | $440,222 (total estimated costs for 1 year) |
| Enrollments | Goal: Not available | Actual: 148 |
| Unsubsidized Job Placements | Goal: 68 percent | Actual: 84 |
Welfare-to-Work Program Services
Outreach and Recruitment:WC received many of its referrals from TCWDB. WC did general outreach using informational brochures and holding family celebrations in public housing complexes and low-income neighborhoods. As a result, WC also received many self-referrals. Prospective participants were screened for WtW eligibility.
Job Readiness and CaseManagement:Participants deemed not to be job ready at enrollment were placed in a five-day, 30-hour job readiness workshop that covered life skills and soft skills individuals need to manage their lives and retain employment. WC gave each participant who completed the workshop a $50 gift certificate. After completing the workshop, participants entered a weeklong employment search workshop where they learn job-seeking skills. Case management services were largely provided by staff members, who helped participants with their job search and provided postemployment followup.
Paid Temporary Employment:Not offered
Job Development and Placement:Participants spent 10 hours of the weeklong employment search looking for work. Participants who did not have a job after the workshop were assigned to a family advocate with whom they met weekly for one to two hours to review job search strategies and to receive job leads.
Postplacement Followup: WC assigned a job retention specialist to monitor participants progress during the first six months of employment. The job retention specialist was responsible for providing participants with the support they needed to retain their job and for helping the participant and the employer resolve work-related issues.
Support Services: WC provided services to remove barriers to employment. It provided funds to purchase work-related clothing and transportation assistance, including a weeks worth of cab vouchers for traveling to and from work.
Other:As WC clients, the WtW participants could access other WC programs and services. These included WCs job bank, with its approximate 3,500 job listings, and a one-hour, biweekly workshop that brought employers in to interview WC participants. They also included WCs partnership with used-car dealers that provided cars to low-income women.
WtWProgram Profile: JHU-Florida
WtW Operator/Program:Indian River Community College (IRCC), Career Transcripts System (CTS) Program
Grant Administrator: The Johns Hopkins University (multisite grantee)
Provider Background:IRCC is a comprehensive community college in Ft. Pierce, Florida (on the Atlantic coast, 70 miles north of Palm Beach). This region on Floridas Treasure Coast includes isolated rural areas and has few large employers. The CTS program is supervised by the Dean of Workforce Development. IRCC has a long history of involvement in workforce development programs and, until recently, operated the one-stop center adjacent to its main campus. The CTS program operates out of an IRCC one-stop in a neighboring community. IRCC is one of 10 community colleges that participated in the JHU WtW grant-funded program.
Target Population: Recently employed WtW-eligible people
Statistics for the WtW Program Overall Vs. The Cost Analysis
| WtW Program Overall | Cost Analysis Period | |
|---|---|---|
| Period of Operations | 3/1/99 to 12/31/01 | 7/1/00 to 6/30/01 |
| Funding/Costs | $592,865 (WtW grant/contract amount) | $315,908 (total estimated costs for one year) |
| Enrollments | Goal: 300 | New: 79 Cumulative by end of period: 150 |
| Unsubsidized Job Placements | Goal: Not available | New: Not available |
Welfare-to-Work Program Services
Outreach and Recruitment:CTS staff members met with Temporary Assistance for Needy Families (TANF) caseworkers who were located with them at the one-stops. They gave the caseworkers information on CTS services and recruited employed TANF recipients from them. The CTS staff eventually expanded its outreach to TANF eligibility workers, also located at the one-stops, and to local employers. The program also accepted self-referrals.
Job Readiness and Case Management: The case managers assessed participants general work skills, helped them access services, and counseled them on personal andfamily issues. Since most participants were already employed, case managers primarily provided job retention services.
Paid Temporary Employment:Not applicable
Job Development and Placement:The CTS program was designed for already employed people. In practice, however, case managers also provided some job placement assistance to a small proportion of participants who were not employed at enrollment and to those who lost jobs or needed to change jobs once they were enrolled. They tried to place clients with an employer who already had one or more employees participating in CTS, and they provided referrals for job openings they noticed in the community or learned about from other clients.
Postplacement Followup: Postplacement services were the primary component of the CTS program. Participants received two types of assessments. One consisted of questions on the best responses for individuals portrayed in 10 workplace scenarios shown to the participants on videotape. Based on their responses, the participants were assessed in different skill areas. The second assessment was an evaluation by the participants direct supervisor on 37 general workplace skills. This assessment used an instrument created specifically for the participant based on his or her results from the videotape assessment and the key job skills identified by the supervisor. The supervisors evaluation was used to identify areas needing improvement, develop service strategies for improving them, and help identify employment goals and strategies for achieving them. Supervisors were asked to evaluate participants every three to six months.
The case managers counseled and coached participants. They also contacted the supervisors regularly and intervened when problems were reported. In addition, they helped to link CTS participants with needed social services and provided general advice and counseling. The program also awarded incentive gifts to encourage job retention.
Support Services: Not applicable
Other:None
WtW Program Profile: JHU-Maryland
WtW Operator/Program: Community College of Baltimore County (CCBC), Career Transcripts System (CTS) Program
Grant Administrator: The Johns Hopkins University (JHU) (multisite grant)
Provider Background:CCBC is a multicampus college in suburban Baltimore County, which surrounds the city of Baltimore, Maryland. It is the largest community college in the state, and its Division of Continuing Education and Economic Development, which operated the CTS program at its Catonsville campus, provides customized employee development training for local business and industry. As a subcontractor to the countys Department of Social Services, CCBC also provides job readiness services to recipients of Temporary Assistance for Needy Families (TANF). CCBC is one of 10 community colleges that participated in the JHU WtW-funded grant program.
Target Population: Recently employed WtW-eligible people
Statistics for the WtW Program Overall Vs. The Cost Analysis
| WtW Program Overall | Cost Analysis Period | |
|---|---|---|
| Period of Operations | 3/1/99 to 12/31/01 | 7/1/00 to 6/30/01 |
| Funding/Costs | $463,273 (WtW grant/contract amount) | $394,982 (total estimated costs for one year) |
| Enrollments | Goal: 300 | New: 104 Cumulative by end of period: 215 |
| Unsubsidized Job Placements | Goal: Not available | New: Not available |
Welfare-to-Work Program Services
Outreach and Recruitment:CCBC did not have linkages to one-stop centers, and the number of referrals from the local TANF agency and its employment services and WtW vendors were less than hoped. Therefore, CCBC marketed the CTS program directly to employers. CTS staff worked with the employer and eligible employees to enroll participants.
Job Readiness and Case Prior to the cost analysis period, CTS staff worked closely with Management: participants to access services they needed to address their employment barriers. The case managers provided job retention services.
Paid Temporary Employment:Not applicable
Job Development and Placement:The CTS program was designed for already employed individuals. In practice, however, case managers also provided some job placement assistance to a small proportion of participants who were not employed at enrollment and to those who lost jobs or needed to change jobs once they were enrolled. They tried to place clients with an employer who already had one or more employees participating in CTS, and they provided referrals for job openings they noticed in the community or learned about from other clients.
Postplacement Followup: Postplacement services were the primary component of JHUs CTS program. Participants received two types of assessments. One consisted of questions on the best responses for individuals portrayed in 10 workplace scenarios shown to the participants on videotape. Based on their responses, the participants were assessed in different skill areas. The second assessment was an evaluation by the participants direct supervisor on 37 general workplace skills. This assessment used an instrument created specifically for the participant based on his or her results from the videotape assessment and the key job skills identified by the supervisor. The supervisors evaluation was used to identify areas needing improvement, develop service strategies for improving them, and help identify employment goals and strategies for achieving them. Supervisors were asked to evaluate participants every three to six months.
The case managers counseled and coached participants. They also contacted the supervisors regularly and intervened when problems were reported. In addition, they helped to link CTS participants with needed social services and provided advice and counseling.
The case managers developed seminars to enhance retention, improve skills, and resolve problems. For example, participants employed as child care workers in licensed facilities were asked to participate in continuing education activities. The case managers worked the CCBC to hold seminars for several child care providers with employees in the CTS program.
Support Services: Not applicable
Other:None
WtW Program Profile: Nashville-Pathways
WtW Operator/Program: Nashville Career Advancement Center (NCAC), Pathways
Grant Administrator: NCAC
Provider Background:NCAC is the Workforce Investment Act administrative entity and the operator of one-stop centers in Nashville and three neighboring counties. NCAC was responsible for administering all of the Nashville/Davidson County WtW funds. NCACs Pathways program, provided by NCAC and three employment service providers, was one option that WtW-eligible Temporary Assistance for Needy Families (TANF) clients could choose. NCAC staff developed and piloted the program, which was based on the Project Match model (Chicago). NCAC then turned the program over to subcontractors. NCAC continued to provide technical assistance and oversight.
Target Population: WtW-eligible people
Statistics for the WtW Program Overall Vs. The Cost Analysis
| WtW Program Overall | Cost Analysis Period | |
|---|---|---|
| Period of Operations | 7/1/98 to 12/31/01 | 7/1/00 to 6/30/01 |
| Funding/Costs | $4.2 million (WtW grant/contract amount) | $1,326,515 (total estimated costs for one year) |
| Enrollments | Goal: 1,875 | New: 592 Cumulative at end of period: 1,007 |
| Unsubsidized Job Placements | Goal: Not available | New: 289 |
Welfare-to-Work Program Services
Outreach and Recruitment:Early in the program (prior to the cost analysis year), NCAC played a major role in recruitment. By January 2001, the Pathways contractors were recruiting from their own Families First caseloads. NCAC did conduct an advertising campaign, however.
Job Readiness and Case Management: Monthly half-day meetings for all participants was the heart of Pathways, a small steps program that counted toward meeting Tennessees 40 hours per week work requirement. Each WtW contractor held two such meetings each month. At these meetings, which were also attended by NCAC staff, participants received job and training leads, reviewed their activities and progress toward their goals, and gave each other mutual support. Over time, the program placed greater emphasis on case manager and participant interaction outside these meetings to address more personal issues.
Paid Temporary Employment:Work experience became more common during the cost year, when about 103 individuals participated. They worked 20 hours per week for up to three months, at $5.25 per hour. NCAC assigned a staff person to develop paid work experience slots with both public and private nonprofit employers.
Job Development and Placement:Participants received some job leads at the monthly meetings, but otherwise job placements were not the focus of the program.
Postplacement Followup: Postplacement followup varied across the three Pathways contractors. In general, postplacement did not become a focus of the program until some time during the cost year.
Support Services: Pathways offered supportive services to fill in the gaps in TANF services. Pathways could provide funds to address transportation and child care barriers. It could also provide funds for work-related equipment.
Other:None
WtW Program Profile: Philadelphia-TWC
WtW Operator/Program: Transitional Work Corporation (TWC), Phil@Work Program
Grant Administrator: Philadelphia Workforce Development Corporation (PWDC)
Provider Background:TWC was created in September 1998 to manage the Phil@Work program.
Target Population: Long-term welfare recipients with limited work experience and other severe barriers to employment
Statistics for the WtW Program Overall Vs. The Cost Analysis
| WtW Program Overall | Cost Analysis Period | |
|---|---|---|
| Period of Operations | 12/1/98 to 11/31/01 | 1/1/00 to 12/31/00 |
| Funding/Costs | $30 million | $7,639,236 (total estimated costs for 1 year) |
| Enrollments | Goal: approximately 4,500 | New: 1,691 Cumulative by end of period: 3,193 |
| Unsubsidized Job Placements | Goal: Not available | New: 585 Cumulative by end of period: 1,017 |
Welfare-to-Work Program Services
Outreach and Recruitment:TWC received referrals from Greater Philadelphia Works, a PWDC program. In addition, TWC staff visited the County Assistance Offices (the Temporary Assistance for Needy Families offices) to recruit participants.
Job Readiness and Case Management: Participants received a two-week orientation and basic job readiness skills and interviewed for subsidized work experience positions. While participating in work experience, participants also attended TWCs career development training for 10 hours per week. Career development training covered job-related and general life skills, basic computer skills, and education refreshers. During orientation, case managers assessed and developed an individualized service plan for each participant. TWC career advisers provided participants with intensive case management services throughout their involvement in the program.
Paid Temporary Employment:Participants worked in a transitional work experience position for up to six months or until they were deemed job-ready. Participants worked at their transitional job positions for 25 hours each week under the supervision of a mentor. TWC provided small gifts to encourage retention and to reward good performance.
Job Development and Placement:TWC job developers identified transitional and unsubsidized job opportunities for participants. The job developers identified job opportunities by examining published job listings on the Internet and in newspapers and by cold-calling employers.
Postplacement Followup: TWC career advisers typically followed up with participants for six months after placement in unsubsidized employment. TWC paid participants retention bonuses of up to $800 $400 after one month of employment, $200 after three months of continuous employment, and $200 after six months of continuous employment.
Support Services: TWC participants received transportation assistance for their first six months of unsubsidized employment.
Other: None
WtW Program Profile: Phoenix-EARN
WtW Operator/Program: Employment and Respect Now (EARN) Alliance
Grant Administrator: City of Phoenix Human Services Department, Employment and Training Division
Provider Background:EARN was established in 1998 in response to the WtW competitive grant program.
Target Population: Residents in Phoenixs Enterprise Community
Statistics for the WtW Program Overall Vs. The Cost Analysis
| WtW Program Overall | Cost Analysis Period | |
|---|---|---|
| Period of Operations | 10/1/98 to 9/30/01 | 7/1/00 to 6/30/00 |
| Funding/Costs | $5,000,000 (WtW grant/contract amount) | $1,920,564 (total estimated costs for one year) |
| Enrollments | Goal: 1,600 | New: 211 Cumulative by end of period: 719 |
| Unsubsidized Job Placements | Goal: 1,100 | New: 124 |
Welfare-to-Work Program Services
Outreach and Recruitment:EARN hired current and former EARN participants to do outreach and recruitment. They went door-to-door, distributed flyers and brochures, made phone calls, and made presentations to groups to promote the program. In addition, prior to the cost analysis period, EARN distributed promotional gifts (for example, colored pads and pencils and magnets) and conducted targeted mass-media advertising campaigns.
Job Readiness and Case Management: Case managers assessed participants employability and job readiness. Participants took a three-week course. EARN staff taught the course, with support from other contractors. The first two weeks of the course focused on life skills and job readiness. The third week combined computer-assisted occupational training and interviews with potential employers. The case managers also provided job placement and retention services. They referred participants who had not found a job after two weeks of job search to the Department of Economic Security for 20 hours a week of work experience.
Paid Temporary Employment:Not available
Job Development and Placement:Most of the job placements were with large, local companies EARN recruited at the start of the program.
Postplacement Followup: The case managers contacted participants every 30 days to verify employment and pay rate, and, at six months, to review job advancement opportunities. They also contacted the employers regularly. Professional counselors also provided participants with follow-up services for six months.
Support Services: Transportation was the largest support service that EARN provided. EARN contracted with a van service to transport participants to the program and to their jobs.
Other: None
WtW Program Profile: West Virginia-HRD
WtW Operator/Program: Human Resources Development Foundation, Inc. (HRDF), Comprehensive Employment Program (CEP)
Grant Administrator: HRDF
Provider Background:HRDF is a private, nonprofit employment and training agency. Established in 1967, HRDF has been a long-standing Workforce Investment Act/Job Training Partnership Act contractor. Affiliated with, but not funded by, organized labor, HRDF is well connected to pre-apprenticeship and apprenticeship programs and has well-developed linkages with employers. HRDF provided WtW services for 26 of West Virginias 55 counties from six of its district offices.
Target Population: WtW-eligible residents in isolated rural areas
Statistics for the WtW Program Overall Vs. The Cost Analysis
| WtW Program Overall | Cost Analysis Period | |
|---|---|---|
| Period of Operations | 1/4/99 to 6/30/01 | 1/1/00 to 12/31/00 |
| Funding/Costs | $4,934,876 (WtW grant/contract amount) | $1,605,214 (total estimated costs for one year) |
| Enrollments | Goal: 510 | New: 85 Cumulative by end of period: 479 |
| Unsubsidized Job Placements | Goal: 332 | New: 228 |
Welfare-to-Work Program Services
Outreach and Recruitment:The local Department of Health and Human Resources (DHHR) offices referred participants to HRDF for WtW services. The local HRDF district offices gave their intake schedule to their local DHHR offices. Before the scheduled intake date, the DHHR offices gave the HRDF district office a list of participants. The HRDF district office staff scheduled a group orientation at the local DHHR offices to explain the CEP program and to address issues that might interfere with participation. In addition, HRDF staff followed up with inactive participants and tried to reengage them.
Job Readiness and Case Management: All participants attended a four-week, 100-hour orientation and job readiness workshop, where they received job readiness instruction and occupational interest and aptitude assessments. Participants received a stipend of $1.60 an hour for their time in the workshop and traveling to and from the workshop, and they received a $25 gift certificate for completing the workshop.
Paid Temporary Employment:Participants not considered ready for unsubsidized jobs were placed in one of two work experience activities, where they usually worked 25 to 35 hours a week. One activity was with public or nonprofit organizations for up to six months. The number of hours the participants were expected to work was determined by their Temporary Assistance for Needy Families and food stamp benefits and a $1.60 per hour stipend from HRDF. The other activity was with private employers, who were expected, but not required, to hire the participant at the end of a 160-hour placement. HRDF subsidized half of the wages paid to these participants. HRDF staff could also arrange for on-the-job training (OJT) positions to help participants gain entry to jobs. The OJT positions were for up to six months, and the employers were expected to hire the participant at the completion of the training. The program paid up to 50 percent of the participants wages.
Job Development and Placement:Work-ready participants conducted their own job search, with HRDF job developers providing them with some job leads and ongoing counseling.
Postplacement Followup: HRDF provided participants with job retention support and incentives. HRDF staff visited participants at the workplace at least twice a month for the first 180 days and called them monthly for the remaining 12 months. In addition, HRDF maintained a toll-free telephone number to make it easier for participants to call. HRDF supplemented the wages of participants who worked at least 30 hours a week in unsubsidized jobs and earned less than $7.75 an hour. The supplement scale brought the participants wages up to $7.75 the first eight weeks, $6.80 the second eight weeks, and $5.50 the third eight weeks. In addition, at the end of 90 and 180 days, participants in unsubsidized employment received $200 and $300, respectively, in the form of gift certificates or utility payments.
Support Services: HRDF provided support services not covered by DHHR, paying particular attention to transportation needs. In addition, HRDF support services covered the costs for child care/day care, work clothing, adult day care, drivers licenses (including drivers education), relocation, tools/equipment, grooming, and other job-related needs.
Other:HRDF offered assistance to help CEP participants address basic skills deficits, obtain GEDs, and undertake job education/training to enhance prospects for job retention and movement to higher-paying jobs.
WtW Program Profile: Yakima-FWC
WtW Operator/Program: Northwest Community Action Center (NCAC), Yakima Valley Farm Workers Clinic (FWC), Welfare-to-Work Program
Grant Administrator: Tri-County Workforce Development Council
Provider Background:The NCAC is an affiliate of FWC and is located next to the boundary of the Confederated Tribes and Bands of the Yakama Indian Nation. FWC operates workforce development programs.
Target Population: Migrant farmworkers and other WtW-eligible people
Statistics for the WtW Program Overall Vs. The Cost Analysis
| WtW Program Overall | Cost Analysis Period | |
|---|---|---|
| Period of Operations | 8/1/98 to 12/31/01 | 7/1/00 to 6/30/01 |
| Funding/Costs | $991,393 (WtW grant/contract amount) | $639,036 (total estimated costs for one year) |
| Enrollments | Goal: 150 | New: 56 Cumulative by end of period: 161 |
| Unsubsidized Job Placements | Goal: Not available | New: 53 Cumulative by end of period: 81 |
Welfare-to-Work Program Services
Outreach and Recruitment:The primary source of referrals was the Washington State Department of Social and Health Services (DSHS).
Job Readiness and Case Management: FWC provided employability assessment and ongoing case management services. The case managers monitored the progress of their clients, helping them with problems as they arose, ensuring supportive service needs were met, and keeping DSHS case managers informed of client progress. FWC assigned cases with special needs such as substance abuse, domestic violence, and child abuse to a special case manager who gave them the support they needed to continue their efforts to become economically self-sufficient.
Paid Temporary Employment:WtW clients could be placed in two types of paid work experience positions. Clients could be placed in paid work experience positions at nonprofit or community-based organizations to obtain work experience and work maturity skills. In addition, DSHS case managers could place clients in community jobs where they earned minimum wage and worked 20 hours a week. Clients were placed in the community jobs positions for up to nine months and received paid sick leave and vacation benefits.
Job Development and Placement:FWC case managers provided individualized job search assistance and also connected clients with Workforce Investment Act services for referrals.
Postplacement Followup: Like the other WtW providers in the Yakima Valley, FWC provided postemployment services that focused on retention.
Support Services: FWC provided support services after the participant had exhausted the services available through Temporary Assistance for Needy Families. The support services FWC provided included transportation, child care, and work-related supplies and clothing.
Other:Clients could access state-supported preemployment training, which lasted up to 22 weeks.
WtWProgram Profile: Yakima-OIC
WtW Operator/Program: Yakima Valley Opportunities Industrialization Center (OIC), Welfare-to-Work Program
Grant Administrator: Tri-County Workforce Development Council, Washington State
Provider Background:OIC is a community-based, nonprofit community action agency that is part of a national network of employment and training programs serving disadvantaged people and their communities.
Target Population: WtW-eligible people
Statistics for the WtW Program Overall Vs. The Cost Analysis
| WtW Program Overall | Cost Analysis Period | |
|---|---|---|
| Period of Operations | 8/1/98 to 12/31/01 | 7/1/00 to 6/30/01 |
| Funding/Costs | $991,393 (WtW grant/contract amount) | $546,629 (total estimated costs for one year) |
| Enrollments | Goal: 150 | New: 14 Cumulative by end of period: 154 |
| Unsubsidized Job Placements | Goal: Not available | New: 46 Cumulative by end of period: 70 |
Welfare-to-Work Program Services
Outreach and Recruitment:The primary source of referrals was the Washington State Department of Social and Health Services (DSHS).
Job Readiness and Case Management: OIC provided employability assessment and ongoing case management services. The case managers monitored the progress of their clients, helping them with problems as they arose, ensuring supportive service needs were met, and keeping DSHS case managers informed of client progress.
Paid Temporary Employment:WtW clients could be placed in two types of paid work experience positions. Clients could be placed in paid work experience positions at nonprofit or community-based organizations to obtain work experience and work maturity skills. In addition, DSHS case managers could place clients in community jobs where they earned minimum wage and worked 20 hours a week. Clients were placed in the community jobs positions for up to nine months and received paid sick leave and vacation benefits.
Job Development and Placement:OIC case managers provided individualized job search assistance and connected clients with Workforce Investment Act services for job referrals.
Postplacement Followup: Like the other WtW providers in the Yakima Valley, OIC provided postemployment services that focused on retention. OIC operated a mentoring program to help clients with issues they encountered in their transition from welfare to work. The mentors, who were volunteers, worked with OIC case managers to coordinate client services.
Support Services: OIC provided support services after the participant had exhausted the services available through Temporary Assistance for Needy Families. The support services OIC provided included transportation, child care, and work-related supplies and clothing.
Other:Clients could access the state-supported preemployment training, which lasted up to 22 weeks.
WtW Program Profile: Yakima-PFP
WtW Operator/Program: People for People (PFP), Welfare-to-Work and SHARE Programs
Grant Administrator: Tri-County Workforce Development Council
Provider Background: PFP is a community action agency that has provided job training and employment services in Yakima Valley for more than 33 years. It is the oldest locally originated community service agency in Yakima Valley and the largest Workforce Development Council contractor.
Target Population: WtW-eligible people and noncustodial parents
Statistics for the WtW Program Overall Vs. The Cost Analysis
| WtW Program Overall | Cost Analysis Period | |
|---|---|---|
| Period of Operations | 8/1/98 to 12/31/01 | 7/1/00 to 6/30/01 |
| Funding/Costs | $2,689,229 (WtW grant/contract amount) | $688,187 (total estimated costs for one year) |
| Enrollments | Goal: 180 | New: 36 Cumulative by end of period: 264 |
| Unsubsidized Job Placements | Goal: Not available | New: 53 Cumulative by end of period: 186 |
Welfare-to-Work Program Services
Outreach and Recruitment: The primary source of referrals was the Washington State Department of Social and Health Services (DSHS). PFP also received referrals of noncustodial parents from the Division of Child Support Enforcement within DSHS.
Job Readiness and Case Management: PFP provided employability assessment and ongoing case management services. The case managers monitored the progress of their clients, helping them with problems as they arose, ensuring supportive service needs were met, and keeping DSHS case managers informed of client progress.
Paid Temporary Employment: WtW clients could be placed in two types of paid work experience positions. Clients could be placed in paid work experience positions at nonprofit or community-based organizations to obtain work experience and work maturity skills. In addition, DSHS case managers could place clients in community jobs where they earned minimum wage and worked 20 hours a week. Clients were placed in the community jobs positions for up to nine months and received paid sick leave and vacation benefits.
Job Development and Placement: PFP case managers provided individualized job search assistance and also connected clients with Workforce Investment Act services for job referrals.
Postplacement Followup: Like the other WtW providers in the Yakima Valley, PFP provided postemployment follow-up services that focused on retention.
Support Services: PFP provided support services after the participant had exhausted the services available through Temporary Assistance for Needy Families. The support services PFP provided included transportation, child care, and work-related supplies and clothing.
Other: Clients could access state-supported preemployment training, which lasted up to 22 weeks.
Appendix B: Background Information on Programs Comparable to WtW
WIN
In 1967, Congress adopted the Work Incentives (WIN) program, "the first truly national effort to promote the self-support of welfare recipients (Pacific Consultants 1976, p. 12).(1) WIN was a joint program of the U.S. Department of Labor (DOL) and of the Department of Health, Education and Welfare that required welfare offices to refer certain AFDC recipients for employment and training, including women without children under age 6.
In the first-generation WIN program, DOL-funded state employment services offices provided employment, subsidized on-the-job training (OJT), vocational training, and monthly participation stipends to employable (and, in the case of females, mostly voluntary) AFDC recipients referred to them by welfare agencies. Including supportive services (but not child care), costs ranged from $2,868 to $4,106 in four specific sites. The average OJT subsidy was $2,400, and the mean cost for vocational training programs was nearly $12,000 (Levitan 1972, p. 102).
In 1971, WIN was substantially altered because of Congress's dissatisfaction with program results and continued concerns about growing AFDC caseloads. WIN II mandated registration among all recipients over age 16 for employment services, fewer preemployment support services, and quicker job placement. Average program costs dropped to $2,014 for male participants, although costs were higher for men in OJT ($2,399), training ($6,374) or public jobs ($16,976) and around $1,000 higher for women because of child care costs. In general, WIN II participants had fewer, shorter welfare spells than nonparticipants and were more likely to be male and high school graduates (Pacific Consultants 1976).
WIN programs were reformed yet again in 1981, through the Omnibus Budget Reconciliation Act (OBRA). Under OBRA, states could limit programs to job search and/or unpaid work experience, or they could incorporate a more "balanced" approach that also included supportive services, counseling, and training for participants. WIN job search and unpaid work experience programs were substantially less costly than earlier programs, ranging from $221 to $902 in seven evaluated sites (Maxfield 1990). Programs were short, focused on the most employable participants, and provided fewer supportive services and little or no access to education and training activities (Pacific Consultants 1976). Balanced programs, which offered more services, including education, job training, and child care, were more costly. Program costs in four sites ranged from $1,350 to $3,171, still lower than costs for the first-generation WIN programs (O'Neill 1990; and Maxfield 1990).
Supported Work
The National Supported Work Demonstration was conducted during the WIN era, from 1975 to 1979, in 13 sites. The program provided a highly structured paid work experience component, along with job search training, placement assistance, and support services, to long-term AFDC recipients and other disadvantaged groups. The program led to statistically significant improvements in employment and income for AFDC recipients while they were in the program and during the postprogram period. Costs of the program were high: $11,572 in year 2000 dollars (Hollister et al. 1984). The requirement that the program operate businesses that provided appropriate work experience positions was a primary cause of the high costs.
Jobs
In 1988, the Family Support Act replaced WIN with the Job Opportunities and Basic Skills Training (JOBS) program. Local welfare agencies were fully responsible for administering the program. Participation was mandatory for those without children under age 3, and it not deferred for illness, remoteness from the program, lack of child care, or other reasons. JOBS also required states to target individuals who were long-term AFDC recipients or whose characteristics put them at risk for long or repeat welfare spells. With JOBS, states shifted to an emphasis on longer-term education and training (U.S. General Accounting Office 1999). They also expanded case management to include closer case supervision and employment counseling, sometimes provided by specialized workers.
JOBS programs usually offered two program tracks. One began with job search but gave participants who did not get jobs access to additional assessment, then to education. The second track, for those considered less job-ready, emphasized basic education and job readiness activities, followed by job search (Scrivener et al. 1998; and Hamilton et al. 1997). Costs ranged from $1,930 to $4,098 in three evaluation sites (Scrivener et al. 1998; Storto et al. 2000; and Farrell et al. 2000) and from $3,278 to $6,971 in Greater Avenues to Independence (GAIN) programs operated in six California counties, five of which strongly emphasized the education track (Riccio et al. 1994).(2)
A side-by-side comparison of JOBS programs that emphasized either rapid employment (called the labor force attachment approach) or skill-building activities (called the human capital approach) in three sites showed that costs ranged from $1,302 to $3,203 for labor force attachment programs. The costs of human capital programs in the three sites were higher, ranging from $3,196 to $4,914 (Table B.1).
MFSP
Costs for JOBS human capital programs were slightly lower than costs for the Minority Female Single Parent (MFSP) Demonstration program, implemented in the mid-1980s. MFSP provided funding to community-based organizations to operate employment and training programs for low-income, minority single mothers, at costs (including child care costs) ranging from $3,774 to $6,796 at four sites (Handwerger et al. 1988).(3) Many program participants were enrolled in vocational training programs.
| Program | Program Components | Cost (in Year 2000 Dollars) | Source of Cost Data (Lead Author: Page Number) |
|---|---|---|---|
WIN I: Education, Training, and Work Experience | |||
| WIN Georgia | Education, institutional training, unpaid work experience (WEX), OJT, followup for men and women, supportive services | 2,868 | Levitan: 102 |
| WIN California | Education, institutional training, unpaid WEX, OJT, followup for men and women, supportive services | 3,038 | Levitan: 102 |
| WIN New York | Education, institutional training, unpaid WEX, OJT, followup for men and women, supportive services | 3,522 | Levitan: 102 |
| WIN Wisconsin | Education, institutional training, unpaid WEX, OJT, followup for men and women, supportive services | 4,106 | Levitan: 102 |
WIN II: Placement and Subsidized Work | |||
| WIN (National)--Males | Job placement, limited support services, some OJT and public service employment | 2,014 | Pacific Consultants: 164 Table 8.1 |
| WIN (National)--Females | Job placement, limited support services, some OJT and public service employment | 2,926 | Pacific Consultants: 164 Table 8.1 |
WIN: Job search, Work Experience | |||
| WIN Cook County, Illinois | Job club, independent job search assistance, unpaid WEX sequence | 221 | Maxfield: 44 Table 4 |
| WIN Arkansas | Job club, independent job search assistance, unpaid WEX sequence | 223 | Maxfield: 44 Table 4 |
| WIN West Virginia | Unlimited length workfare (unpaid WEX) targeted toward men in two-parent AFDC families | 240 | Maxfield: 44 Table 4 |
| WIN Louisville | Job search assistance | 530 | Maxfield: 44 Table 4 |
| WIN Virginia | Job Club, independent job search assistance, unpaid WEX sequence, job training, OJT, and basic education | 606 | Maxfield: 44 Table 4 |
| WIN San Diego | Job club | 793 | Maxfield: 44 Table 4 |
| WIN San Diego | Job club and WEX | 902 | Maxfield: 44 Table 4 |
WIN Balanced | |||
| Baltimore Options | Job search, education, training, OJT and unpaid WEX options | 1,350 | Maxfield: 44 Table 4 |
| SWIM San Diego | Job search, unpaid WEX, education, training sequence | 2,177 | Maxfield: 44 Table 4 |
| ET Choices (Massachusetts) | (Mean cost 1984-1989) | 2,223 | O'Neil; 88 Table 6.1 |
| Training Opportunities in the Private Sector, Maine | Work-readiness training, WEX, emphasized OJT | 3,171 | Maxfield: 44 Table 4 |
JOBS Two-Track | |||
| JOBS Oklahoma | Basic education, vocational training, college, job search | 1,930 | Storto: 41 Table 3.2 |
| JOBS Portland | Job search, life skills training, basic education, vocational training, college, WEX | 1,980 | Scrivener: 72 Table 4.2 |
| JOBS Detroit | Education (basic and postsecondary), training, self-directed job search, OJT or WEX for a few | 4,098 | Farrell |
| GAIN Two-Track | |||
| GAIN Riverside | Two-track job search assistance or basic education, vocational training, OJT or unpaid WEX if no job found | $3,278 | Riccio: 76 Table 3.2 |
| GAIN San Diego | Two-track job search assistance or basic education, vocational training, OJT or unpaid WEX if no job found | $3,390 | Riccio: 76 Table 3.2 |
| GAIN Tulare | Two-track job search assistance or basic education, vocational training, OJT or unpaid WEX if no job found | $4,038 | Riccio: 76 Table 3.2 |
| GAIN Butte | Two-track job search assistance or basic education, vocational training, OJT or unpaid WEX if no job found | $4,290 | Riccio: 76 Table 3.2 |
| GAIN Los Angeles | Two-track job search assistance or basic education, vocational training, OJT or unpaid WEX if no job found | $6,550 | Riccio: 76 Table 3.2 |
| GAIN Alameda | Two-track job search assistance or basic education, vocational training, OJT or unpaid WEX if no job found | $6,971 | Riccio: 76 Table 3.2 |
JOBS Labor Force Attachment | |||
| JOBS Riverside | Job club or supervised job search followed by basic education or WEX if no job obtained | $1,302 | Hamilton: 170 Table 7.2 |
| JOBS Atlanta | Job club or supervised job search followed by basic education or WEX if no job obtained | $1,888 | Hamilton: 170 Table 7.2 |
| JOBS Grand Rapids | Job club or supervised job search followed by basic education or WEX if no job obtained | $3,203 | Hamilton: 170 Table 7.2 |
JOBS Human Capital | |||
| JOBS Riverside | Basic education, vocational training or college, followed by job club or supervised job search if no job obtained | $3,196 | Hamilton: 191 Table 8.2 |
| JOBS Atlanta | Basic education, vocational training or college, followed by job club or supervised job search if no job obtained | $3,692 | Hamilton: 191 Table 8.2 |
| JOBS Grand Rapids | Basic education, vocational training or college, followed by job club or supervised job search if no job obtained | $4,914 | Hamilton: 191 Table 8.2 |
MFSP | |||
| MFSP D.C. | Basic education and vocational training for low-income, minority, single-female parents | $3,774 | Handwerger: 25, Table 3.3 |
| MFSP San Jose | Basic education and vocational training for low-income, minority, single-female parents | $5,034 | Handwerger: 25, Table 3.3 |
| MFSP Atlanta | Basic education and vocational training for low-income, minority, single-female parents | $5,376 | Handwerger: 25, Table 3.3 |
| MFSP Providence | Basic education and vocational training for low-income, minority, single-female parents | $6,796 | Handwerger: 25, Table 3.3 |
Supported Work | |||
| National Supported Work Demonstration (13 sites) | Paid work experience with close supervision at program-operated ventures for long-term AFDC recipients and other disadvantaged groups | 11,572 | Hollister et al. |
1. Most local community work experience programs before WIN focused on fathers, who in 1961 had become AFDC-eligible under some circumstances and, unlike mothers, were not presumed to be out of the labor market. The program provided little training--instead, participants usually worked off their AFDC benefits in public jobs (O'Neill 1990).
2. GAIN was California's JOBS program.
3. Overall, in the MSFP programs, child care and other support services used more resources than the education and training component. We have excluded child care costs from the cost estimates for all JOBS programs discussed here, and from costs for WIN I programs. This is because WtW programs incurred negligible child care costs, and child costs for remaining WIN-era programs were also quite low, given both low take-up rates and low child care expenses among those who did use paid child care.
Appendix C: WtW In-depth Evaluation Sites And/or Programs Not Included in Cost Analysis
| Site (and Grantee) | Program Type | Operator(s) | Description |
|---|---|---|---|
| Boston, MA (Office of Jobs and Community Services in the Boston Economic Development and Industrial Corporation) | Transitional Employer-Tailored | 9 partnerships between employers and non-profit partners focusing on industries such as child care, retail, health care, and banking. | Job readiness/job skills classroom training for two to eight weeks, on-the-job training/job shadowing, guaranteed job placement with the employer upon completion of training program, pre and post placement case management support. |
| Enhanced Community Service Programs | 2 non-profit organizations in child care and health care. | Job readiness/job skills classroom training for two to eight weeks, on-the-job training/job shadowing, possible job placement at non-profit upon completion of training program, pre and post placement case management support. | |
| Fort Worth, TX (Tarrant County Workforce Development Board) | Enhanced Direct Employment Programs | Goodwill Industries of Fort Worth, Inc | Skill assessment, supported job search, job readiness classes, life skills workshops, paid work experience, short-term clerical training, and post-employment followup. |
| Tarrant County Mental Health Mental Retardation | Needs assessment, intensive life skills and job readiness training, job placement, job coaching and post-employment followup, and mental health counseling and treatment services. | ||
| Milwaukee, WI (Private Industry Council of Milwaukee & Wisconsin Department of Corrections) | Enhanced Direct Employment Programs for Non-Custodial Parents | Goodwill Industries, Inc., United Migrant Opportunity Services, Opportunities Industrialization Center, YW Works, and Maximus | Job search, skill development, short-term training, subsidized work experience, retention and post-employment followup, fatherhood and parenting classes and support services. |
| Note: Programs were excluded due to lack of available information, or to minimize duplication in sites with multiple programs. | |||