
Under The Affordable Care Act, 105 Million Americans No Longer Face Lifetime Limits on Health Benefits
March 2012
By: Thomas D. Musco and Benjamin D. Sommers, ASPE
This Issue Brief is available on the Internet at:http://aspe.hhs.gov/health/reports/2012/LifetimeLimits/ib.shtml
Printer Friendly (PDF) Version (6 pages) [Free PDF reader  ]
]
The Affordable Care Act prohibits health plans from imposing a lifetime dollar limit on most benefits received by Americans in any health plan renewing on or after September 23, 2010. While some plans already provided coverage with no limits on lifetime benefits, millions of Americans were previously in health plans that did not. According to the Kaiser Family Foundations Employer Health Benefits Survey, 59 percent of all workers covered by their employers health plan in 2009 had some lifetime limit placed on their benefits.[1] In addition, 89 percent of people with individually purchased coverage had a lifetime limit on their benefits.[2]
The Department of Health and Human Services (HHS) estimated the number of Americans receiving these new protections, combining results from the 2009 Kaiser employer survey and 2009 Americas Health Insurance Plans (AHIP) report with data from the 2009 to 2011 versions of the Current Population Survey (covering calendar years 2008-2010).[3]
Overall, we estimated that 70 million persons in large employer plans, 25 million persons in small employer plans, and 10 million persons with individually purchased health insurance had lifetime limits on their health benefits prior to the passage of the Affordable Care Act (Figure 1).[4] These 105 million Americans now enjoy improved coverage without lifetime limits.
Among the 105 million Americans for whom lifetime limits have been eliminated as a result of the Affordable Care Act, 75.3 million are non-Latino White, 11.8 million are Latino, 10.4 million are African-American, 5.5 million are Asian, and approximately 500,000 are American Indian or Alaska Native (Figure 2).[5] Approximately 28 million of those benefiting are children, with the remainder of the 105 million split almost equally between adult men and adult women (Figure 3). Approximately 15.9 million individuals lived in rural areas, with the remainder in urban areas.[6]
Table 1 presents totals by state.
Figure 1: Distribution (in millions) by Market of 105 Million Americans (Ages 0-64) Benefiting from the Affordable Care Acts Prohibition on Lifetime Limits
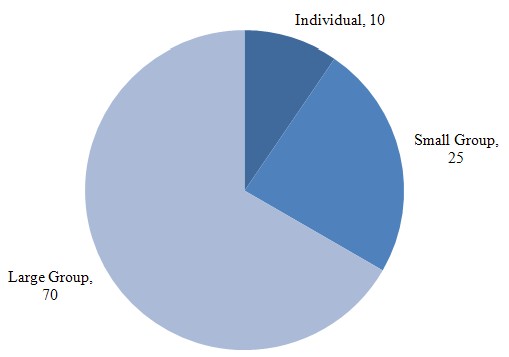
Source: ASPE analysis using data from the Employer Health Benefits: 2009 Annual Survey, Washington, DC: Henry J Kaiser Family Foundation and Health Research & Educational Trust, September 2009;Individual Health Insurance, 2009: A Comprehensive Survey of Premiums, Availability, and Benefits, AHIP Center for Policy Research; and 2009-2011 Current Population Survey Annual and Social Economic Supplements
Figure 2: Distribution (in millions) by Race/Ethnicity[5] of 105 Million Americans (Ages 0-64) Benefiting from the Affordable Care Acts Prohibition on Lifetime Limits
![Figure 2: Distribution by Race/Ethnicity[5] of 105 Million Americans (Ages 0-64) Benefiting from the ACA's Prohibition on Lifetime Limits on Health Benefits, in millions, White non-Latino = 75.3, Latino = 11.8, Black = 10.4, Asian = 5.5, Native = 0.5, American Indian/Alaska Native = 0.5, and Other = 1.9.](/sites/default/files/private/images-reports-basic/70641/fig2.jpg)
Source: ASPE analysis using data from the Employer Health Benefits: 2009 Annual Survey, Washington, DC: Henry J Kaiser Family Foundation and Health Research & Educational Trust, September 2009;Individual Health Insurance, 2009: A Comprehensive Survey of Premiums, Availability, and Benefits, AHIP Center for Policy Research; and 2009-2011 Current Population Survey Annual and Social Economic Supplements
Figure 3: Distribution (in millions) by Age/Gender of 105 Million Americans (Ages 0-64) Benefiting from the Affordable Care Acts Prohibition on Lifetime Limits
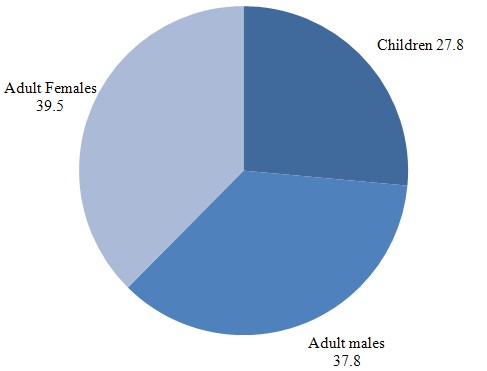
Source: ASPE analysis using data from the Employer Health Benefits: 2009 Annual Survey, Washington, DC: Henry J Kaiser Family Foundation and Health Research & Educational Trust, September 2009;Individual Health Insurance, 2009: A Comprehensive Survey of Premiums, Availability, and Benefits, AHIP Center for Policy Research; and 2009-2011 Current Population Survey Annual and Social Economic Supplements
| State | Children | Adult Males | Adult Females | Total |
| Alabama | 396,000 | 561,000 | 609,000 | 1,566,000 |
| Alaska | 64,000 | 87,000 | 86,000 | 237,000 |
| Arizona | 570,000 | 752,000 | 769,000 | 2,091,000 |
| Arkansas | 219,000 | 313,000 | 333,000 | 865,000 |
| California | 3,255,000 | 4,389,000 | 4,448,000 | 12,092,000 |
| Colorado | 521,000 | 685,000 | 696,000 | 1,902,000 |
| Connecticut | 367,000 | 494,000 | 525,000 | 1,386,000 |
| Delaware | 86,000 | 113,000 | 121,000 | 320,000 |
| District of Columbia | 34,000 | 83,000 | 91,000 | 208,000 |
| Florida | 1,411,000 | 2,006,000 | 2,170,000 | 5,587,000 |
| Georgia | 916,000 | 1,145,000 | 1,256,000 | 3,317,000 |
| Hawaii | 115,000 | 174,000 | 173,000 | 462,000 |
| Idaho | 173,000 | 195,000 | 198,000 | 566,000 |
| Illinois | 1,192,000 | 1,735,000 | 1,743,000 | 4,670,000 |
| Indiana | 615,000 | 822,000 | 822,000 | 2,259,000 |
| Iowa | 311,000 | 443,000 | 433,000 | 1,187,000 |
| Kansas | 279,000 | 368,000 | 374,000 | 1,021,000 |
| Kentucky | 362,000 | 524,000 | 528,000 | 1,414,000 |
| Louisiana | 385,000 | 488,000 | 538,000 | 1,411,000 |
| Maine | 103,000 | 156,000 | 172,000 | 431,000 |
| Maryland | 585,000 | 794,000 | 872,000 | 2,251,000 |
| Massachusetts* | 633,000 | 912,000 | 975,000 | 2,520,000 |
| Michigan | 977,000 | 1,255,000 | 1,315,000 | 3,547,000 |
| Minnesota | 553,000 | 736,000 | 754,000 | 2,043,000 |
| Mississippi | 223,000 | 294,000 | 327,000 | 844,000 |
| Missouri | 581,000 | 775,000 | 792,000 | 2,148,000 |
| Montana | 81,000 | 122,000 | 116,000 | 319,000 |
| Nebraska | 192,000 | 252,000 | 257,000 | 701,000 |
| Nevada | 269,000 | 339,000 | 329,000 | 937,000 |
| New Hampshire | 140,000 | 197,000 | 208,000 | 545,000 |
| New Jersey | 877,000 | 1,183,000 | 1,214,000 | 3,274,000 |
| New Mexico | 148,000 | 194,000 | 213,000 | 555,000 |
| New York | 1,609,000 | 2,294,000 | 2,529,000 | 6,432,000 |
| North Carolina | 804,000 | 1,101,000 | 1,186,000 | 3,091,000 |
| North Dakota | 66,000 | 94,000 | 93,000 | 253,000 |
| Ohio | 1,100,000 | 1,512,000 | 1,542,000 | 4,154,000 |
| Oklahoma | 317,000 | 430,000 | 450,000 | 1,197,000 |
| Oregon | 342,000 | 485,000 | 529,000 | 1,356,000 |
| Pennsylvania | 1,136,000 | 1,677,000 | 1,769,000 | 4,582,000 |
| Rhode Island | 89,000 | 138,000 | 147,000 | 374,000 |
| South Carolina | 397,000 | 495,000 | 566,000 | 1,458,000 |
| South Dakota | 82,000 | 104,000 | 109,000 | 295,000 |
| Tennessee | 523,000 | 744,000 | 775,000 | 2,042,000 |
| Texas | 2,094,000 | 2,671,000 | 2,771,000 | 7,536,000 |
| Utah | 411,000 | 385,000 | 387,000 | 1,183,000 |
| Vermont | 46,000 | 82,000 | 87,000 | 215,000 |
| Virginia | 817,000 | 1,036,000 | 1,121,000 | 2,974,000 |
| Washington | 580,000 | 910,000 | 937,000 | 2,427,000 |
| West Virginia | 147,000 | 215,000 | 219,000 | 581,000 |
| Wisconsin | 580,000 | 771,000 | 791,000 | 2,142,000 |
| Wyoming | 54,000 | 73,000 | 69,000 | 196,000 |
| Total | 27,827,000 | 37,803,000 | 39,534,000 | 105,164,000 |
| * Massachusetts previously permitted lifetime limits only on non-core benefits.Source: ASPE analysis using data from the Employer Health Benefits: 2009 Annual Survey, Washington, DC: Henry J Kaiser Family Foundation and Health Research & Educational Trust, September 2009; Individual Health Insurance, 2009: A Comprehensive Survey of Premiums, Availability, and Benefits, AHIP Center for Policy Research; and 2009-2011 Current Population Survey Annual and Social Economic Supplements | ||||
Endnotes
[1] Employer Health Benefits: 2009 Annual Survey, Washington, DC: Henry J Kaiser Family Foundation and Health Research & Educational Trust, September 2009.
[2] Individual Health Insurance, 2009: A Comprehensive Survey of Premiums, Availability, and Benefits, AHIP Center for Policy Research.
[3] We used estimates of the percentages of individuals covered by small group and large group plans subject to lifetime limits (from the Kaiser employer survey cited in note 1), and an estimate for the non-group market from the AHIP survey cited in note 2, and multiplied these percentages by the number of individuals in each type of plan, as estimated from the Current Population Survey (CPS) Annual Social and Economic Supplement, 2009-2011 datasets. We then made the same calculations based on the number of individuals covered in each type of plan at the state level. Similarly, we used CPS data to estimate the distribution of small, large, and non-group coverage by race/ethnicity, and then used the Kaiser and AHIP results to estimate the number of people by race and ethnicity that benefited from the prohibition on lifetime limits.
[4] Patient Protection and Affordable Care Act: Preexisting Condition Exclusions, Lifetime and Annual Limit, Rescissions, and Patient Protections, Interim Final Rule, Federal Register Vol. 75, No. 123, June 28, 2010
[5] Race/ethnicity based on self-report from the Current Population Survey. White non-Latino, Black, Asian, and American Indian/Alaska Native groups exclude Latinos, who comprise their own category. 'Other' contains any individuals not included in the first five categories (including biracial and multiracial individuals).
[6] The method for this calculation was analogous to that described for race/ethnicity in Note 4. We used the Census definition in the CPS of living in a 'metropolitan area' as urban, and all others as rural.