
U.S. Department of Health and Human Services
The Size of the Long-Term Care Population in Residential Care: A Review of Estimates and Methodology
Brenda C. Spillman and Kirsten J. Black
The Urban Institute , Health Policy Center
February 28, 2005
PDF Version: http://aspe.hhs.gov/daltcp/reports/2005/ltcpopsz.pdf (57 PDF pages)
This report was prepared under contract #HHS-100-97-0010 between the U.S. Department of Health and Human Services (HHS), Office of Disability, Aging and Long-Term Care Policy (DALTCP) and the Urban Institute. For additional information about this subject, you can visit the DALTCP home page at http://aspe.hhs.gov/_/office_specific/daltcp.cfm or contact the ASPE Project Officer, John Drabek, at HHS/ASPE/DALTCP, Room 424E, H.H. Humphrey Building, 200 Independence Avenue, S.W., Washington, D.C. 20201. His e-mail address is: John.Drabek@hhs.gov.
The opinions and views expressed in this report are those of the authors. They do not necessarily reflect the views of the Department of Health and Human Services, the contractor or any other funding organization.
TABLE OF CONTENTS
- BACKGROUND
- What Are Alternative Residential Setting?
- Sampling and Survey Coverage
- Identification of Residential Care
- DATA SOURCES FOR EXISTING ESTIMATES
- Private Provider-Based Data
- Provider-Based Data from Public Sources
- Census and Individual or Household Survey Data
- COMPARISON OF EXISTING ESTIMATES
- Nursing Homes and Residents
- Alternative Residential Care
- SUMMARY AND ANALYTIC FRAMEWORK
- Magnitude of Differences in Estimates
- Key Issues and Data Sources for Analysis
- INDEX OF FIGURES
- FIGURE 1. Relationship of Census Definitions to Residential Care Settings
- FIGURE 2a. Estimates of Nursing Home Facilities
- FIGURE 2b. Estimates of Nursing Home Residents: Provider-Based Data
- FIGURE 2c. Estimates of Nursing Home Residents: Population-Based Data
- FIGURE 3a. Estimates of Alternative Residential Care Settings
- FIGURE 3b. Estimates of Alternative Residential Care Residents
- INDEX OF TABLES
- TABLE 1. Typology of Residential Long-Term Care Places
- TABLE 2. Sources and Characteristics of Published Estimates
- TABLE 3. Comparison of Surveys
EXECUTIVE SUMMARY
In recent years, a number of trends in care for those with a disability, particularly the elderly, point to a shift from nursing homes to other care settings. States, which determine Medicaid eligibility and benefits, have devoted resources to community-based care to contain nursing home spending and to address the preference of beneficiaries for noninstitutional alternatives. Since the 1990s, there also has been independent growth of residential care alternatives serving primarily an older private pay clientele, as a supportive environment for those no longer able or willing to perform activities needed for independent living at home.
A result of this movement toward alternatives to care at home and to traditional institutional settings has been a blurring of the demarcation between private households and residential care places and between noninstitutional and institutional settings. This blurring has made it less likely that survey data with samples based on historical concepts of housing units and group quarters deriving from definitions used in the Decennial Census fully represent the populations of interest for studies of persons with disability. The result is increased uncertainty about where the disabled are receiving care, the size of the population in various accommodative settings, and the characteristics of those receiving care in these settings. This type of information is critical to the ability to quantify this vulnerable population and to monitor care arrangements and quality both for public policy purposes and for consumer information.
This report is part of a project that will attempt to better understand the source of differences in estimates of the older population in residential care by analyzing key national surveys. It presents results of a review of existing estimates of the number of alternative residential care settings and nursing homes and the number of persons residing in them. It has three aims:
-
To describe the data that have been used in recent years to generate estimates and summarize the range of existing estimates.
-
To identify methodological issues that contribute to differences among estimates, focusing on those that can be investigated using available national surveys.
-
To identify surveys that appear to offer the best opportunity for analysis to provide a better understanding of the size and characteristics of the residential care population and insights into how collection of data on residential care settings can be improved.
Background
Alternative residential care settings encompass a variety of places and care arrangements that provide both housing and services outside of a nursing facility for those who are unable or unwilling to live independently. Beyond that very broad description, there appears to be no consensus on criteria for identifying or distinguishing between these settings. They include such places as small foster care homes, board and care or personal care homes, congregate housing, and assisted living facilities. In the past decade, state licensing practices have changed to keep pace with an evolving residential care industry, but these changes have done little to bring consistency to terminology or criteria for alternative residential care settings. Changes in state licensing may also have affected nursing home estimates, although certification under Medicare provides a more clear cut foundation for identifying nursing homes.
Lack of consistent definitions and differences in methodology used by the Decennial Census and other national surveys to classify and identify settings affect whether alternative residential settings are captured well or at all in surveys that target either the noninstitutional or institutional population, but not both, and reduce the comparability of estimates across surveys that represent both populations. For example, methodology used in the 2000 Census classifies assisted living and congregate care in the broad category of housing units, so that no Census estimate of such settings can be made.
Sources of estimates we examined fall into three general categories:
- private provider-based data from industry, association, or other sources;
- provider-based estimates from public sources; and
- individual- or household-level survey data, including data from the Decennial Census.
Range of Existing Estimates
For nursing homes, despite differences in methodology, there was greater consistency in estimates of both the number of facilities (15,000 to 18,000 in all years) and the number of older residents (1.2 million to 1.56 million) than in estimates for residential care alternatives. The estimates appear to show a mild upward trend in the number of nursing homes prior to 1997 and a mild downward trend thereafter. The trend for residents appears to have been slightly downward in the late 1990s but lack of consistent published estimates makes the trend since then unclear.
For residential care alternatives, estimates suggest a stronger upward trend throughout our period of observation, but the range of estimates for both the number of places and the number of residents is greater than for nursing homes and residents. Differences between estimates of the number of alternative residential care settings ranged from 14,000 to nearly 40,000, depending on the year. Estimates of the number of residents also differed to a greater degree than for nursing homes, but the most recent estimates, which allow identification of both community and institutional or facility settings, suggest a population in these alternative settings on the order of 800,000.
Key Methodological Issues
In our review we identified five key methodological issues contributing to differences across estimates that are most amenable to empirical investigation using existing surveys:
- age of the population examined (i.e., all persons versus persons age 65 or older);
- method used to assigning individuals to the facility or institutional population (and conversely, the community or noninstitutional population);
- method used to identifying nursing homes (e.g., self-identification, certification);
- method used to identifying type of alternative residential care (e.g. named type or services offered); and
- sample representation and weighting (e.g. cross-section or annual users).
Data Sources for Analysis
The key features of data best suited for analysis of these five issues are the following:
- population representation, so that all elements of the population of interest--older persons with disabilities--are represented;
- the ability to determine how settings in which individuals reside are identified;
- the ability to apply different criteria more similar to those used in comparison surveys; and
- extensive documentation of survey methods.
Four national surveys are recent and meet all or most of these criteria: The 1999 National Long Term Care Survey (NLTCS), the 2002 Medicare Current Beneficiary Survey (MCBS) Access to Care file, the 2002 MCBS Cost and Use file, and the 2002 Health and Retirement Survey (HRS)/Assets and Health of the Oldest Old (AHEAD).
The first three surveys, the NLTCS and the two MCBS files, meet all criteria. They are population-based surveys that either are or can be limited to the Medicare population age 65 or older, and data elements are available that allow some potential for investigating more consistent alternate definitions of residential care. All identify residential care by named type of setting and identify services provided for some or all of those identified as living in residential care. In addition, comparisons across the three surveys offer information about the importance of sample representation because they represent, respectively, a cross-section of the Medicare elderly, those always enrolled during the survey year, and those ever enrolled during the survey year.
The HRS/AHEAD, which is a community survey, meets all criteria except full population coverage. A strength of the HRS/AHEAD is that, unlike the other three surveys, it does not rely on named types of settings, but rather screens all persons not in traditional freestanding households for services available and received. Comparison of estimates from the HRS/AHEAD with those from the surveys representing the full population also has may shed light on the implications of Census-based rules for identifying the excluded institutional population for residential care estimates.
All four surveys contain detailed information about the characteristics and particularly the disability of respondents. This detailed information provides the opportunity to understand what subpopulations are being served by different types of residential care, as well as confirming whether different methods of identifying residential settings are capturing similar populations.
INTRODUCTION
In recent years, a number of trends in care for those with a disability, particularly the elderly, point to a shift from nursing homes to other care settings. With the introduction of Medicaid funding in 1965, nursing homes and related facilities became the most common institutional settings for persons with disabilities, primarily because of eligibility rules and benefit packages skewed toward institutional care. More recently, however, states, which determine Medicaid eligibility and benefits, have devoted resources to community-based care for several reasons. Perhaps the most compelling is a desire to contain nursing home spending. States, however, also are attempting to address the preference of beneficiaries for noninstitutional alternatives. In 1999, the Olmstead Decision, which mandates that reasonable alternative accommodations be available to prevent institutionalization of those who prefer other settings, added impetus to state efforts (Fox-Grage, Folkemer, and Lewis 2003; Rosenbaum 2000). Since the 1990s, there also has been independent growth of residential care alternatives serving primarily an older private pay clientele, as a supportive environment for those no longer able or willing to perform activities needed for independent living at home.
A result of this movement toward alternatives to care at home and to traditional institutional settings has been a blurring of the demarcation between private households and residential care places and between noninstitutional and institutional settings. For instance, some settings, notably assisted living and other senior housing where residents may occupy a private apartment even though they receive or have access to supportive services, may be difficult to distinguish from any other private residence.
This blurring has made it less likely that surveys with samples based on historical concepts of housing units and group quarters deriving from definitions used in the Decennial Census fully represent the populations of interest for studies of those with disability. In addition, even within surveys that represent the full population, representation of formerly unconventional settings may be small, and differences in how the different types of residential settings are identified may lead to different conclusions about the size of the population in residential care as well as its characteristics. The result is increased uncertainty about where the disabled are receiving care, the size of the population in various accommodative settings, and the characteristics of those receiving care in these settings. This type of information is critical to the ability to quantify this vulnerable population and to monitor care arrangements and quality both for public policy purposes and for consumer information.
This report is part of a project that will attempt to better understand the source of differences in estimates of the older population in residential care by analyzing key national surveys. In it we present results of a review of existing estimates of the number of residential care settings, generally divided into nursing homes and alternative residential care settings, and the number of persons residing in them. The review has three purposes. First, we describe the data that have been used to generate estimates and summarize the range of estimates. Second, we identify methodological issues that contribute to differences among estimates, focusing on those that can be investigated using available national surveys. Finally, we identify four surveys that appear to offer the best opportunity to conduct such an investigation and to provide a better understanding of the size and characteristics of the residential care population and insights into how collection of data on residential care settings can be improved.
BACKGROUND
Before the 1990s, the line between the community and institutional populations and between housing units and long term care settings was relatively simple to define in the Census and in other surveys. Gray areas of supportive residential settings that might be inadequately covered by either household and person-based surveys or nursing facility surveys could reasonably be assumed to be small enough to ignore and, in fact, too small to measure well or analyze. Only in the last 5 years or so have national data collection efforts made more purposeful attempts to adjust to growth in the number and variety of long term care settings and the potential gap between the traditionally defined community and institutional settings.
This adjustment has been primarily the addition of data elements in an attempt to define residential settings more carefully in surveys of the older population, for whom these settings are most common. These efforts are complicated, however, by a lack of consensus on quantifiable characteristics of such settings that would allow them to be identified operationally and by difficulty in assuring adequate coverage and representation in survey samples. For example, oversampling to improve the precision of estimates requires the ability to set criteria for identifying the population to be oversampled. To date no frame of such places exists, although a project is underway, sponsored jointly by the National Center for Health Statistics (NCHS), the Agency for Healthcare Research and Quality (AHRQ), and the Department of Health and Human Services' Office of the Assistant Secretary for Planning and Evaluation (ASPE), to develop a provider Inventory of Long-Term Care Residential Places that would complement the provider frame used for the National Nursing Home Surveys (NNHS).
What Are Alternative Residential Settings?
Alternative residential care settings encompass a variety of places and care arrangements that provide both housing and services outside of a nursing facility for those who are unable or unwilling to live independently. Hallmark services generally include assistance with independent living activities such as meals and housekeeping (instrumental activities of daily living or IADLs) and personal care activities, such as bathing and dressing (activities of daily living or ADLs). Beyond that very broad description, there appears to be no consensus on criteria for identifying or distinguishing between these settings. They include such places as small foster care homes, board and care or personal care homes, congregate housing, and assisted living facilities. Which settings are included in an estimate and what labels are placed upon them often depends on the purpose of the estimate. For example, the intent may be to identify all places where a vulnerable population receives care, to define settings for state licensure, or to develop a marketing approach for senior housing, each of which may result in a different set of inclusion criteria.
Both "board and care" and "assisted living," have been used both popularly and in state licensure to refer to a range of settings from small supervised homes serving a largely Medicaid clientele in private or shared rooms to large luxury facilities serving a well-to-do private pay clientele in private apartments. Assisted living appears to have become the more popular terminology, supplanting board and care as a blanket term for alternative residential care.
Nevertheless, some, including the assisted living industry and its trade associations, believe that the term should be reserved for settings adhering to a specific model with a consumer-centered philosophy that emphasizes independence, dignity, privacy, decision-making, and autonomy (Mollica 2002). In 2001, the U.S. Senate Special Committee on Aging formed the Assisted Living Workgroup (ALW), to consider specific criteria for facilities representing the assisted living model. The ALW defined assisted living as facilities that provide 24-hour supervision, provision and oversight of personal and supportive services, health related services, social services, recreational activities, meals, housekeeping and laundry, and transportation services (Han, Sirrocco, and Remsburg 2003).
In the past decade, state licensing practices have changed to keep pace with an evolving industry, but these changes have done little to bring consistency to terminology or criteria for alternative residential care settings. The number of states with a licensing category or statute using the term "assisted living" has grown in the past few years, from 19 states in 1994 (Mollica 1995) to 32 states and the District of Columbia in 2002 (Mollica 2002), but the facilities so designated vary from state to state. Some states have chosen to adopt "assisted living" as a distinct category of residential setting, while others have chosen to consolidate disparate categories under a general set of "assisted living" rules that include a range of settings such as board and care, elderly residential housing, congregate housing, adult foster care, in addition to assisted living facilities (Mollica 2002). For example, the District of Columbia added "assisted living" as a new category in addition to the existing category of "community residence facility" (Mollica 2002), and Arkansas established a separate licensing and regulation process for assisted living, allowing facilities previously licensed as residential care facilities to either retain their residential care licenses or become licensed as assisted living (Devore and Tanner 2003). Colorado and Texas adopted assisted living as a broad licensing category that includes personal care homes (Mollica 2002).
As mentioned, the most comprehensive effort to date to identify criteria that would allow construction of a comprehensive provider frame for long term care settings is the Inventory of Long-Term Care Residential Places project (Han, Sirrocco, and Remsburg 2003). The project collected current state regulations on licensed long-term care residential places, which were used to develop a typology of licensed residential settings that house older adults and provide assisted living services as defined by ALW. The typology consists of five categories (Table 1) ranging from small group homes to continuing care retirement communities (CCRCs), based on the type and number of residents served, the types of settings/living arrangements (e.g., shared rooms, private apartments), the types of services and care provided (e.g., personal care or limited nursing), meal preparation and arrangement (e.g., kitchenette in quarters or congregate meals), resident ratio per bath and toilet, free or restricted ability to leave the facility, and whether a facility was freestanding. The typology excludes nursing homes, hospitals, facilities for the mentally ill, mentally retarded or developmentally disabled (MR/DD), military housing, federally subsidized housing, senior citizen cooperatives, naturally occurring retirement communities (NORCs), commercial retirement communities, and other independent living places (Han, Sirrocco, and Remsburg 2003).
| TABLE 1. Typology of Residential Long-Term Care Places | |
| CATEGORY 1 Includes places typically labeled as licensed adult foster homes/adult residential care homes/small group homes |
|
| CATEGORY 2 Includes places typically labeled as licensed board and care facilities or large group homes |
|
| CATEGORY 3 Includes places typically labeled as licensed assisted living facilities with apartment units |
|
| CATEGORY 4 Includes places typically labeled as licensed assisted living facilities with private or semi-private rooms |
|
| CATEGORY 5 Includes places typically labeled as licensed continuing care retirement communities |
|
| SOURCE: Adapted from Figure 1 and typology descriptions in Han, Sirrocco, and Remsberg 2003. | |
A comparison of facility types identified from regulations in the 50 states and the District of Columbia and matching categories in the typology shows a wide variation in naming conventions for similar facilities (Han, Sirrocco, and Remsburg 2003). For example, Category 3 in the typology is typically labeled as assisted living facilities with apartment units, and includes freestanding facilities with private apartments including baths and kitchenettes, direct access from the outside or through a common hall and serving a primarily frail older population. A sampling of the state designations of these settings indicates a variety of different terms for this category of facility, including residential care facilities, personal care homes, housing with services establishments, and congregate housing services programs. In 22 states, small boarding homes (the typology's Category 1) would be included in the same designation as Category 3 assisted living facilities, and although 42 states licensed the type of facilities in Category 3, only about half of those used the term "assisted living." All 51 jurisdictions licensed some type of facilities, but only 34 of the 51 licensed Category 1 small boarding homes, and only 29 licensed Category 2, described as board and care facilities or large group homes, characterized by dorm or ward-style rooms, and shared bathroom facilities. Thus, although it may represent the best single source for building a complete and consistent frame of long-term care places, even state licensure does not provide comprehensive identification of relevant settings.
Changes over time in state licensure also may affect the comparability of estimates even within established provider sample frames. Rhoades (2000) notes that as states expanded licensing of community residential alternatives in the 1990s, some state licensed nursing and related care homes that were not Medicare or Medicaid certified nursing facilities moved to the new licensing categories. Rhoades argues that this was responsible in part for a reduced rate of nursing home use found in the 1995 NNHS. Because the NNHS relies on a provider frame built in part from state licensing lists, its estimates are sensitive to licensing changes that simply reclassified residents and beds in these facilities to community residential care categories. Although each of the five categories of residential care settings described in the typology project is defined as providing non-medical supportive services, facilities in each category also may provide some skilled nursing, although not 24-hour nursing care.
Sampling and Survey Coverage
Lack of a consistent definition and difficulties in discriminating between settings affect whether alternative residential settings are captured well or at all in surveys that target either the noninstitutional or institutional population, but not both. Very similar residential care settings may be found in either population. Some residential care facilities, particularly facilities with private apartments as in Category 3 of the typology, may be difficult to distinguish from private housing units. In fact, such settings are likely to meet the criteria used in the Decennial Census for a housing unit as opposed to some form of group quarters. Methodology reports from the Census, which provides the definition of the noninstitutional population used to identify the universe for sampling in major national surveys, document difficulties in the 2000 Census in delineating between different types of group settings and housing units and duplication of persons counted in both settings (Abramson 2003).
Surveys of the noninstitutional population, such as the National Health Interview Survey (NHIS) and the Medical Expenditure Panel Survey Household Component (MEPS-HC), include noninstitutional group settings, but their relative rarity and factors such as differences in how surveys determine whether a setting is in scope or out of scope may result in incomparability across nominally similar survey samples. Such differences may have inconsequential impacts on the general representativeness of the samples but large impacts on representation of alternative residential settings.
Surveys based on a frame of providers, such as the National Nursing Home Surveys (NNHS) and the MEPS Nursing Home Component (MEPS-NHC), include both settings certified as nursing facilities by the Medicaid or Medicare programs and those licensed by states as nursing homes. However, while certification is a relatively stable definition, as discussed, there is wide variation across states in licensing practices and definitions, and these definitions have changed over time as states have added licensing categories covering alternative residential care settings. Such factors and changes in or correction of survey frames may not only lead to different conclusions about the trend in the number of nursing homes and residents in the NNHS and the MEPS-NHC (Rhoades 2000), but also may contribute to apparent growth in alternative residential care.
Identification of Residential Care
The size and comparability of estimates also are affected by how well and how consistently the Decennial Census and surveys that cover the full population in all noninstitutional and institutional settings--and thus nominally have no gaps in coverage --identify alternative residential settings. Differences in definitions used to identify facility or institutional settings and differences in information collected to identify residential settings both may contribute to conflicting estimates of the population in supportive settings. For example, the Decennial Census includes both congregate care and assisted living facilities as housing units but does not identify them, so no estimate of these settings can be made from the Census. Nearly 2 million persons age 65 or older are in settings identified by the Census as group quarters, which are settings not considered housing units, 1.56 million in nursing homes, as defined by the Census, and another 420,000 in "other institutions" or "noninstitutional group quarters" (U.S. Census Bureau 2000).
Examining differences in data collection methods and their implementation in different surveys as well as approaches to identifying and categorizing living arrangements and long-term care service use also may help explain why estimates of the number of persons in certain residential settings vary widely even in population-based data. For example, based on the 1998 Medicare Current Beneficiary Survey (MCBS), which identified alternative residential care only in places meeting that survey's criterion of a facility, about 417,000 persons age 65 or older lived in these settings (Spillman, Liu, and McGilliard 2002). The 1999 National Long Term Care Survey (NLTCS) attempted to identify such settings in both the community and institutional populations and found about 811,000 persons (Manton and Gu 2001). In addition, because there are no uniform naming conventions for alternative settings in the community, question structure and wording may affect estimates. For example, more general questions about the type of residence and services available may be more effective in locating all long term care settings than questions that identify settings by name, such as "assisted living," but also may lack information to distinguish between types of settings.
DATA SOURCES FOR EXISTING ESTIMATES
We conducted a search for published estimates of the number of providers and residents in both alternative residential care settings and nursing homes to identify both the range of existing estimates and prospective data sources. We included estimates from various sources and estimates that include nonelderly as well as elderly residents, although data analysis in the next phase of this project will be limited to national surveys and to persons age 65 or older. Sources of data we examined fall into three general categories: private provider-based data from industry, association, or other sources; provider-based estimates from public sources; and individual- or household-level survey data, including data from the Decennial Census. Details about all sources of data and estimates we examined are summarized in Table 2. We did not include estimates for which we were unable to obtain sufficient technical documentation.
Private Provider-Based Data
Data in this category for the most part are produced for those in the industries involved, investors, marketers, or consumers. For example, the National Center for Assisted Living (NCAL) is part of the American Health Care Association (AHCA), a trade organization of for-profit and nonprofit long-term and related care providers. The National Investment Center for the Seniors Housing and Care Industry (NIC) serves developers and investors in senior housing. Firstmark, Inc., Billians Health Data Group, and InfoUSA collect contact information on a variety of entities, including health and long-term care providers, primarily for sale to marketers. CareScout is a private company that provides consumer information about "eldercare" and operates a network that offers discounts covering a variety of providers, including nursing homes, assisted living facilities, home care providers, and independent living "accommodations." Both the Firstmark and CareScout estimates used in this study were compiled from a report on existing sources of data on residential long-term care providers produced by Social and Scientific Systems (SSS) under contract to ASPE. Also included in this group is the congressionally mandated Commission on Affordable Housing and Health Facility Needs for Seniors in the 21st Century, which relied on interpolations from private data for its estimates.
| TABLE 2. Sources and Characteristics of Published Estimates | ||||||
| Data Source/Study | Year(s) of Estimate | Target Type(s) of Facility Included in Estimate | How Defined | Frame/ Universe | Population Represented (if applicable) | Methodological Notes |
| Private provider based data | ||||||
| National Center for Assisted Living (NCAL) (1998, 2001) | 1995-1999 -- facilities1997, 1998, 2000 -- residents | Assisted living facilities | Congregate residential settings that provide personal care services, 24-hour supervision, assistance, activities, and health related services | Sample frame of randomly selected NCAL members and nonmembers | Facility residents (no explicit age limit) | |
| First Mark (Social and Scientific Systems (SSS) 2002) | 2002 | Free-standing nursing homes and other residential care facilities | Nursing homes: certified as Medicare or Medicaid nursing facilities or licensed by the state, with a nurse and/or physician on staff 24 hours and providing healthcare and services to the elderly.Other residential care: retirement homes, Alzheimer's, subacute care, assisted living, and free-standing assisted living. | List sample of facilities | n.a. | Facilities in database may be flagged as more than one type (e.g. assisted living and retirement home). |
| CareScout (SSS 2002) | 2000 | Assisted living facilities | Facilities that combine "housing, supportive services, personalized assistance and healthcare designed to meet the individual's needs on a daily basis" | List sample of facilities | n.a. | |
| National Investment Center (NIC), (ProMatura 2000) | 1999 | Senior housing properties | Properties with primarily senior residents, including licensed nursing homes, freestanding assisted living, CCRC and properties combining congregate care/assisted living and assisted living/SNF | List samples of facilities in selected counties | Residents of properties primarily serving the elderly | Definition of nursing homes includes "any licensed nursing home (residential or hospital-based) including intermediate care, subacute care, etc."; modeling used to make national estimate from county sample |
| Commission on Affordable Housing (2002) | 1999 | Supportive seniors housing units | Congregate care and independent living CCRCs; assisted living, which includes board and care facilities; and skilled nursing facilities, which includes hospital-based, private-pay; and facilities managed by Dept. of Veterans Affairs | Conventional housing unit data from the American Housing Survey, U.S. Census Bureau, Supportive Seniors Housing unit data is modified from original tabulations found in Promatura Group, LLC. 2000 produced for the NIC. | Residents of properties primarily serving the elderly | Household estimates relied on assumptions about occupancy rates for CCRCs and ALFs from unpublished NIC data and assumptions about the occupancy rate and the proportion of residents in nursing homes who were age 65 or older from NNHS 1997 data. Household estimates were then reduced by certain factors to count only senior occupants. Estimates for senior residents were derived from the number of nonsenior households occupied by seniors, and the number of nonsenior households occupied by seniors, and the number of senior persons per household. Resident estimates relied on assumptions about the number of seniors per unit in senior supportive housing. |
| Billian's Health Data Group (Westat date unknown) | 2001 | Hospital-based and free-standing nursing homes and long term care facilities | Nursing homes: provides continuous nursing and other services to patients who are not acutely ill but need nursing care Long term care facilities: provide services to persons at any age with chronic impairments | List sample of facilities | n.a. | Facilities are identified as either active or inactive. Active facilities are surveyed annually. Inactive facilities are kept in the database, but the record includes a termination code. |
| InfoUSA (Westat date unknown) | 2001 | Hospital-based and free standing nursing home | Licensed nursing homes | List sample of facilities | n.a. | |
| Provider-based data from public sources | ||||||
| State licensing agency lists | ||||||
| Mollica (2002) | 1998, 2000, 2002 | State licensed long term care places | Residential care facilities serving persons in need of supportive services, excluding MR/DD facilities | State licensing agency lists | n.a. | |
| Harrington, Swan, and Wellin (1999) | 1998 | State licensed long term care places; nursing facilities | Residential care facilities serving adults and aged persons; state licensed or certified nursing facilities | State licensing agency lists | n.a. | |
| SSS (2002) | 2000 | State licensed long term care places, including nursing facilities | Long term care places | State licensing agency lists of "long term care places" | n.a. | |
| OSCAR/Provider of service | Skilled nursing facilities and nursing facilities | Nursing facilities certified to care for Medicare or Medicaid beneficiaries | CMS administrative data | Facility-reported patient census (e.g. Harrington) or facility residents with MDS assessments (e.g. CMS) (no explicit age limit) | Facility estimates are sensitive to method of selecting facilities. Facilities may be selected from master provider list or from actual survey records. | |
| Westat, Inc. (date unknown) | 2001 | |||||
| SSS (2002) | 2001 | |||||
| Centers for Medicare and Medicaid Services (CMS) (2001) | 1996-2001 -- facilities | |||||
| CMS | 1999-2001 -- residents | |||||
| Cowles (2002) | 1998-2002 -- facilities | |||||
| Cowles (2001, Nawrocki and Gregory 2000) | 1998, 1999, 2001 -- residents | |||||
| American Health Care Association (AHCA) (2003) | 2001-2003 | |||||
| Harrington et al. (2001, 2002, 2003) | 1994-2002 | |||||
| Ombudsman (Administration on Aging (AoA) 2004) | 1996-2001 | Nursing homes; Board and care homes and other similar adult care facilities | Nursing facilities licensed and operating. Board and care, assisted living, residential care facilities, and other adult care homes similar to a nursing or board and care facility for which the Ombudsman program provides services | State Long Term Care Ombudsman Reports | Facility residents (no explicit age limit) | |
| Provider-based surveys | ||||||
| National Nursing Home Survey | Nursing homes | Nursing homes and units with three or more beds that are certified as SNFs or NFs or licensed as nursing homes by states | 1995: the 1991 National Health Provider Index (NHPI) updated with an additional list of facilities from the Agency Report System (ARS) as of September 1993 and updates from the 1994 ARS 1997: 1991 NHPI updated with files from CMS and "other national organizations" 1999: 1997 frame updated with files from CMS and "other national organizations" | Facility residents (age group may be identified using resident data) | ||
| Gabrel and Jones (2000a, 2000b); Jones (2002) | 1995, 1997, 1999 | |||||
| Medical Expenditure Panel Survey Nursing Home Component | Nursing homes | Nursing homes and units with three or more beds that are certified as SNFs or NFs or licensed as nursing homes by states | Sampling frame derived from the updated 1991 National Health Provider Inventory | Facility residents (age group may be identified using resident data) | ||
| Rhoades, Potter, and Krauss (1998) -- facilities | 1996 | |||||
| Krauss and Altman (1998) -- residents | ||||||
| Hawes, Rose, and Phillips (1999) | 1998 | Assisted living facilities | Residential care facilities primarily serving an elderly population and either calling themselves assisted living or a offering a basic level of services including: 24-hour staff oversight, housekeeping, at least 2 meals a day, and help with at least two of medication assistance, bathing, or dressing | List sample of facilities meeting definition | Facility residents | Sample of facilities with more than 10 beds was drawn from frame developed for the project from various sources. |
| Census and household- or individual-level surveys | ||||||
| Decennial Census | Nursing homes | Skilled-nursing facilities; intermediate-care facilities; long-term care rooms in wards or buildings on the grounds of hospitals; long-term care rooms/nursing wings in congregate housing facilities; nursing, convalescent, and rest homes, such as soldiers', sailors', veterans', and fraternal or religious homes for the aged, with nursing care | Census of Group Quarters population | Resident population in such settings (age group may be identified using individual characteristics) | ||
| Jonas (2003) -- facilities | 2000 | |||||
| Hetzel and Smith (2001) -- residents | ||||||
| HRS/AHEAD | Household survey with housing type/services data | Civilian noninstitutional population reporting specified services available | Area probability sample supplemented by Medicare sample | Community residents age 70 or older | ||
| Spector et al. (2000) | 1993 | |||||
| MCBS Cost and Use | Long term care facilities | 3 or more beds and
| Probability sample of Medicare beneficiaries ever enrolled during the year | Medicare beneficiaries ever in these settings during the year (Spillman estimates residents age 65 or older) | Spillman et al. estimates annual users and point-in-time use. | |
| CMS (2002) | 1996-1999 | |||||
| Potter, Bernstein, and Drabek (2002) | 1999 | |||||
| Spillman, Liu, and McGilliard (2002) | 1993-1998 | |||||
| MCBS Access to Care | Long term care facilities and community residential care settings | Facilities: same as in Cost and Use fileCommunity settings: senior citizen housing, retirement communities, retirement apartments, assisted living facilities, staged living communities, continuing care communities, and "other" | Probability sample of Medicare beneficiaries continuously enrolled during year | Continuously enrolled Medicare beneficiaries in these settings on January 1 | ||
| Chulis and McCormick (2002) | 2001 | |||||
| NLTCS | Long term care institutions, including nursing homes, and community residential care settings | Institutional sample defined as residential quarters with three or more unrelated residents and institutional quarters, provided there is a health professional on duty every day; community residential care settings defined as assisted living or other noninstitutional group settings without nursing care, or settings identified by respondent as other community group or supported housing setting | Probability sample of Medicare beneficiaries age 65 or older | Beneficiaries age 65 or older in these settings | Additional detail on type of facility and certification status is provided for those assigned an institional interview on the basis of nursing supervision. | |
| Manton and Gu (2001) | 1999 | |||||
| Spillman (2004) | ||||||
For the most part, because of the purpose and type of data collected these sources provide estimates of facilities and sometimes numbers of "beds" or "units." Given the lack of consensus on the definition of "assisted living" and "supportive housing," it is difficult if not impossible to determine the exact definition of settings included in such estimates. Because the focus of those producing such estimates is generally on the most current information, it is often difficult to determine changes in methodology that may have occurred over time when entities have produced estimates for more than one year. Where estimates of residents are included, they are typically computed from occupancy rates collected or obtained from external sources or by using assumptions about the number of persons or beds per unit, so that they rely fundamentally on the number of facilities identified. In one case (NCAL) occupancy rates collected from an internally conducted survey were applied to a publicly funded estimate of the number of facilities.
Some estimates rely on interpolations using assumed growth rates and/or intervening estimates from other sources or statistical models to generate estimates over time. In the case of NIC, data produced by ProMatura, a private research firm, was based on a purposeful sample of 102 counties. Regression techniques and mathematical modeling were used to produce a national estimate of facilities. The Commission on Affordable Housing used this projection, plus "indicators" of occupancy rates from the NIC study, and assumptions about occupancy rates, persons per unit, and the proportion of residents who were age 65 or older, so that it appears to contain no independent estimates.
The data included in this category generally are intended to capture places serving an older population. However, because they are provider-based and use different ages to define "older," the population coverage is not well-defined.
Provider-Based Data from Public Sources
These data include studies that were either publicly funded or conducted data collections from the provider perspective or funded by private nonprofit organizations not related to the industries involved. They include surveys of state licensing agency lists, data collected and maintained by the Centers for Medicare and Medicaid Services (CMS) for administrative purposes, and survey data that draw from provider frames.
Mollica (2002) and Harrington (Harrington, Swan, and Wellin 1999) collected data from state licensing agencies for their estimates of residential care settings. As discussed, variation in state terminology and licensing categories, as well as the number of agencies with licensing responsibility contribute uncertainty about the population served and types of facilities included in the estimates. Mollica produced an initial 1998 estimate for ASPE and two subsequent updates funded by the National Academy of State Health Policy. The intent was to capture all residential care facilities serving an elderly or disabled population in need of supportive services, regardless of the age of the clientele. Facilities serving primarily a MR/DD population were not included. Harrington's work was funded by CMS and the U.S. Department of Housing and Urban Development. Separate estimates were made for facilities licensed as nursing homes and those licensed as residential care facilities for the aged and/or adults and nursing facilities. Whether MR/DD facilities are in a given state's estimate depends on what the state chose to include them in that category (Harrington, personal communication). A third estimate of alternative residential care settings based on state provider lists was produced by SSS as part of the inter-agency project to develop a comprehensive frame of "long-term care residential places."
The Online Survey, Certification and Reporting System (OSCAR) is an administrative database maintained by CMS that includes data from all nursing facilities or units certified as skilled nursing facilities (SNF) or nursing facilities (NF) by Medicare or Medicaid. Thus, by definition these data provide a narrower range of facilities than surveys such as the NNHS, conducted by NCHS, and the MEPS-NHC, conducted by AHRQ, which sample from a frame that also includes nursing facilities licensed by states. Both the NNHS and the MEPS-NHC use a two-stage sampling design, first selecting a sample of facilities and then sampling residents within each facility. Included facilities are places or units certified as a SNF or NF and places or units with three or more beds that are licensed as nursing homes by states. In these surveys, facilities serve residents of all ages, but because data is collected on resident characteristics, including age, estimates for the elderly can be produced.
The only survey focusing solely on alternative residential care places was conducted by Hawes and colleagues for ASPE (Hawes, Rose, and Phillips 1999). For the study, a frame was constructed drawing on various sources, and then a sample meeting inclusion criteria was drawn. Criteria were that facilities either identified themselves as assisted living facilities or offered 24-hour oversight, housekeeping, at least two meals per day, and help with at least two activities among medications, bathing, or dressing. The sample was limited to facilities with more than 10 beds primarily serving an elderly clientele, so that estimates from the survey would be expected to be lower than estimates including smaller facilities or facilities serving a broader population.
Census and Individual or Household Survey Data
The data sources in this group are the Decennial Census and three national surveys from which estimates of residential care have been made. The surveys are the Asset and Health Dynamics Study of the Oldest Old (AHEAD), which represents the older community, or noninstitutional, population, and the MCBS and NLTCS, which draw their samples from the universe of Medicare beneficiaries regardless of residential situation. Because about 95 percent of the population age 65 or older is enrolled in Medicare, the NLTCS sample, which is limited to beneficiaries age 65 or older, is roughly representative of the entire elderly population. We also examined but do not discuss further the Panel Study of Income Dynamics (PSID), which is a survey of the noninstitutional population of all ages that includes a limited set of questions about senior housing and services used by residents. We could find no published estimates of residential care using the PSID, and the sample of older respondents (about 1,500) was small relative to the three surveys reviewed here.
Decennial Census
The Decennial Census is important not only as a source of estimates, but also as the source of definitions that determine the universe for survey sampling from the noninstitutional population, such as the AHEAD. It also provides the foundation for intercensal population estimates used as control totals in sample weights for most national person-based surveys, including both the AHEAD and the NLTCS. Two overlapping designations, "institution" and "group quarters," are important for understanding the population representation of noninstitutional surveys and the implications for their coverage of alternative residential settings. They are shown graphically in Figure 1. The primary identifying characteristic of an institution as defined by the Census is that "patients or inmates" are supervised and have limited ability to leave. The definition includes correctional institutions, although the correctional population is not included in the universe covered by the surveys included here. Nursing or other medical supervision is not a Census criterion for institutions, although nursing homes, defined broadly by the Census to include settings such as "rest homes" and "homes for the aged," are the largest category of institutions, particularly among the elderly. All institutions are group quarters, as distinct from housing units, which are defined as quarters (including a single room) in which occupants live and eat separately from others and have direct access to the outside of the building or access through a common hall. However, group quarters as defined by the Census also include noninstitutional settings, which are places that are neither housing units nor institutional quarters. Noninstitutional group quarters include places such as group homes that provide care and supportive services.
Several issues relating to measurement of residential settings are evident in Figure 1. First, alternative residential settings may be housing units, noninstitutional group quarters, or institutions, and differentiating among them may be difficult (Abramson 2003). Second, the delineation between institutional and noninstitutional settings is not concrete, which may affect the comparability of community samples drawn to represent the noninstitutional population. Third, while most community, or noninstitutional, surveys include those in noninstitutional group settings in the universe from which their samples are drawn, they necessarily omit some "institutional" settings that are not substantively different from included settings. Thus, they cannot provide a complete picture of alternative residential care. Finally, even within population-based surveys that include persons in all settings, identification of types of places that have no clear-cut identifier such as Medicare or Medicaid certification is not straightforward.
| FIGURE 1. Relationship of Census Definitions to Residential Care Settings |
 |
| SOURCE: Potter, Bernstein, and Drabek 2002; U.S. Census Bureau 2003. |
Health and Retirement Survey (HRS) and AHEAD
The AHEAD survey began in 1993 with a sample of community-residing persons age 70 or older in households. The survey design used a dual frame consisting of an area probability sample and a supplementary probability sample of persons age 80 or older drawn from Medicare enrollment files. The AHEAD is a companion survey to the HRS, which began as a panel study of community residents ages 51 to 61 years old in 1992. In 1998 the two surveys merged and expanded to represent the noninstitutional population ages 51 and older in that year. Persons originally sampled in the community are followed if they are institutionalized, but have a zero cross-sectional weight for any wave in which they are in an institution.
Because it is a community survey, the HRS/AHEAD includes both housing units and noninstitutional group quarters, but excludes similar places that are designated as institutional. Thus, it necessarily provides a limited representation of alternative residential settings. In the initial 1993 AHEAD survey, respondents who reported that their residence was part of a building or community for persons over age 60 were asked whether the place offered a list of services and whether it charged extra for the services. Included services are group meals, help with bathing, dressing, or eating, nursing care, and a special residential facility for those needing nursing care.
Since the survey was merged with the HRS, all respondents who report that their residence is in a retirement community, senior housing, or other housing providing services, are then asked about services available, whether they are included in housing costs, whether the respondent actually uses the services, and whether the respondent could continue to live there if they needed "substantial care." Included services are group meals, housekeeping, transportation, help with ADLs (bathing, dressing, or eating), emergency call button, nursing or a special resident facility for those who need nursing care. The type of living situation is identified only by the type of services available, rather than by name (e.g., assisted living).
MCBS
The MCBS is a probability sample drawn from all Medicare beneficiaries that began in 1992 and is conducted annually. Participants are interviewed over a four-year period. The annual sample includes an over-sample of persons age 85 or older (Adler 1994; Laschober and Olin 1996; Liu and Sharma 2002). A supplemental sample is drawn and interviewed in each fall round (September through December) to replace respondents being retired from the sample, replenish cells depleted by refusals and death, and correct for coverage errors in the initial frame (Liu and Sharma 2002). Since 1994, the supplemental sample has been representative of persons alive and eligible on January 1 of the survey year.
Two files are released each year, the Access to Care file, which includes Medicare claims data but no survey reported use or expenditure data, and the Cost and Use file, which additionally includes Medicare use and cost data reconciled with survey reports. The first available is the Access to Care file, which contains survey information on about 18,000 persons representing those who are continuously enrolled during the year. Thus persons who die and those who enter the program during the year are not represented. The second file released is the Cost and Use file, which includes about 13,000 persons and represents all persons ever enrolled during the year, including decedents and new entrants, as well as reconciled survey and Medicare program data on use and cost of health services. The Cost and Use file is designed to provide estimates of annual Medicare spending by all beneficiaries eligible any part of the year, rather than to represent a true cross-section of the Medicare population.
A strength of the MCBS is that all settings are included. Respondents are interviewed wherever they are on the interview date, using either a community or a facility questionnaire, depending on whether the respondent is in a facility as identified by MCBS criteria, and are followed as they make residential changes. The Cost and Use file includes a complete residential timeline identifying where respondents reside throughout the survey year.
Through 2000, the MCBS collected information on residential care only in long-term care facilities, which the MCBS defines as places with three or more beds and either Medicare or Medicaid certified or state licensed, or providing 24-hour caregiver supervision, or providing supervision of medications or help with ADLs or IADLs. Facility type, including nursing home, assisted living, and various other types of residential care, is determined from the facility's self-designation in a facility screening questionnaire.
In 2001 for the first time, the Access to Care file includes data from a new housing supplement that also collected information about residential setting from all persons in the community. Respondents were asked whether their residence was in a retirement community, senior citizens housing, an assisted living facility, a continuing care community, a staged living community or retirement apartments and could specify another type. Those reporting any such special setting were asked whether services were available, whether services cost extra, and whether they would have to move out or to another part of the community if they needed "substantial care." Specific services are more limited than in the HRS/AHEAD and include no ADL or personal care items. Services included are assistance with meals, housekeeping, transportation, medication, and recreational activities.
NLTCS
The NLTCS, which is conducted by the Census under the direction of the Center for Demographic studies at Duke University, is a national sample of Medicare beneficiaries aged 65 or older weighted to represent the complete elderly population. It is designed to identify those who are chronically disabled, as defined by ADLs or IADLs, in a screening interview, and to collect detailed data on their disability, service use, family support, health and demographic characteristics and a wide range of other characteristics of their living situation. When the survey began in 1982, only community residents were eligible to receive a detailed interview. The survey was repeated in 1984 and 1989 with detailed interviews for disabled persons in the community and residents of "institutions" as defined by the NLTCS. In 1994 and 1999, samples of nondisabled community residents also received the detailed interview, so that complete information is available in those two years for the full Medicare population age 65 or older.
The samples are drawn from Medicare enrollment files and are refreshed in each wave with a new sample of persons who turned 65 since the previous survey, so that both longitudinal and cross-sectional estimates can be made. In 1994 and 1999, a supplemental sample of those aged 95 or older was added to increase precision of estimates for the very old. About 21,000 respondents were screened in 1984, 16,000 in 1989, and 17,000 in 1994 and 1999, resulting in samples of about 7,600 detailed respondents in 1984, and about 6,000 in the remaining years.
Information on residential setting is elicited on an instrument called the Control Card, which is administered just prior to the detailed interview to collect information about the individual's living situation and family and to determine whether an individual receives a community or institutional interview. An institutional setting is defined in the NLTCS as either a facility or a residential setting with three or more unrelated persons, provided that there is a health professional on duty every day. Thus, in addition to nursing homes, such places as facilities for the mentally ill or mentally disabled and some alternative residential care settings are included. The institutional questionnaire then identifies places by self-identified type, and, in all years except 1994, by whether the facility reports having beds that are certified by Medicare or Medicaid.1
Persons receiving the community questionnaire are also asked late in the detailed interview whether their residence is in a retirement community or is another type of residential care setting, including retirement home, boarding home, group home or community residential facility. In 1994 for the first time, assisted living was offered as an explicitly named choice, and in 1999, assisted living was also added as a separate category on the residential screen on the Control Card. Persons whose residence was identified as assisted living on the Control Card were asked whether they received meal preparation, housekeeping, help with eating or moving around, or "substantial nursing care of any kind" from the assisted living community. The latter question was used to determine whether assisted living residents received the community or institutional interview, rather than the more general question about health professionals on duty daily used for residents in other settings. Additional persons who identify their residence as a retirement community or other residential care setting only later in the community questionnaire are not asked about services available through their residence.
Common Issues among Surveys
Some issues are common to all three surveys reviewed. Population-based surveys in theory are better suited to identifying the universe of residential care settings than provider-based samples. Because group quarters are relatively rare, however, population or household-based surveys generate small samples of persons in these settings in the absence of oversampling, and it is not clear how well area probability sampling plans can achieve representation. Surveys like the HRS/AHEAD that include only noninstitutional settings also may be affected by the increasing difficulty in delineating the relevant universe from which to sample the target "community" population, as illustrated in Figure 1. Provider-based surveys have larger samples and thus more precision in estimates of characteristics of the population in the specific types of settings they target, but are dependent on the ability to construct a complete frame.
Weighting strategy and representation of the sample in population-based surveys also are important issues for comparability of estimates. Weights for all three surveys reviewed here are post-stratified to control totals. In the case of the MCBS, the Access and Use file is weighted to represent full-year Medicare enrollees, while the Cost and Use file represents all persons ever enrolled during the year, including both those who die and new enrollees. Thus, unlike the HRS/AHEAD and the NLTCS, neither survey provides true cross-section estimates when survey weights are used. Although the NLTCS sample is drawn from Medicare enrollment, which represents about 95 percent of the population age 65 or older,2 post-stratification is to Census projections of the complete noninstitutional and institutional populations age 65 or older. The soundness of this post-stratification depends on correct identification of segments of the sample that correspond to Census definitions of institutional and noninstitutional. Three different decisions have been made in survey-provided weights since the NLTCS began (Spillman 2004). Finally, the HRS/AHEAD, which uses area probability sampling to draw the majority of its sample, is designed to represent the noninstitutional population and weighted to population control totals for the relevant age group from the Current Population Survey, which represents the noninstitutional population as defined by the Decennial Census.
COMPARISON OF EXISTING ESTIMATES
We limited our review of estimates of the number of nursing homes and alternative residential care places and residents to the period 1994 to the present for nursing homes, and 1993 to the present for alternative residential care settings. Figure 2a, Figure 2b, and Figure 2c for nursing homes and residents and Figure 3a and Figure 3b for alternative settings show the results graphically. In cases where there are multiple estimates from a particular data source, estimates are identified by data source and first author, for example, OSCAR/Harrington. Where estimates from the same data source appeared to be duplicative, so that estimates essentially lay on top of each other, we included only one source in Figures 2 and 3, and we excluded estimates that appeared to be entirely derivative of other included estimates.3 We begin with nursing homes and residents before turning to the more complex issue of alternative residential settings.
Nursing Homes and Residents
There is a reasonable consistency among existing estimates of nursing homes and residents, reflecting the relatively greater consensus about what constitutes a nursing home. Differences, particularly in the number of nursing homes, generally are consistent with differences in the definition of nursing home used, but also may reflect changes in frames that are not easily quantified. For estimates of residents, comparisons are complicated by whether estimates are available for the elderly or only for all residents, by methodological issues, and differences in representation and measurement.
Number of Nursing Homes
Focusing first on Figure 2a, estimates are in the range of 15,000 to 18,000 nursing homes in each year. Differences in estimates generally are consistent with differences in facility definition--Medicare or Medicaid certified facilities only, or more inclusive facility definitions. Methodological differences appear to be responsible for the notable exception to this observation--the two sets of estimates (Harrington et al. 2001, 2002, 2003 and CMS 2001) that provide long trends from OSCAR data. These data include only certified nursing facilities and thus would be expected to be somewhat below more inclusive estimates. Harrington's estimates are roughly within the range of 15,000 to 15,700 facilities over the entire period, whereas the CMS estimates indicate about 1,500 to 1,900 additional facilities in each year. Both series indicate a mild increase through 1997 and a similarly mild decrease thereafter. Additional OSCAR estimates for 2002 and 2003 (AHCA 2003) appear consistent with the higher of the two trends. A review of the methods used to produce these estimates suggests that the CMS estimate is based on an OSCAR file of nursing homes created in March of each year, whereas Harrington uses the most recent survey within the calendar year (Harrington et al. 2003, CMS 2001). In addition, Harrington's estimate excludes ICF/MR facilities, while there is no mention in documentation of whether intermediate care facilities for the mentally retarded (ICF/MRs) are excluded from CMS estimates (Harrington et al. 2003, CMS 2001). Duplication of facilities also may contribute, although only between 30 and 167 facilities per year were removed because of duplication within the sample used in Harrington et al. (2003).
Examination of the remaining estimates from other sources suggests that the CMS estimates may overstate, and the Harrington estimates understate certified facilities. For example, the 1996 MEPS-NHC estimate (Rhoades and Krauss 1999) and the 1995 and 1997 NNHS estimates (Gabrel and Jones 2000a, 2000b) both are based on the same broader sample frame including licensed as well as certified facilities, yet both lie slightly below the CMS estimates, which reflect a more restricted definition. NNHS estimates restricted to certified facilities lie about halfway between the OSCAR estimates from CMS and Harrington prior to 1999. Harrington's 1998 estimate from state data (Harrington, Swan, and Wellin 1999), which, like the MEPS and NNHS estimates, includes licensed as well as certified facilities, is nearly identical to the CMS estimate for that year.
On the other hand, the NNHS sample frame also may play a role in the discrepancy between the NNHS estimates and the CMS OSCAR estimates of certified facilities. After frame updates that began in 1997, the 1999 NNHS estimates of both licensed or certified facilities (18,000) and certified facilities only (17,500) (Jones 2002), are higher than the CMS OSCAR estimate. Although we cannot investigate further using published data, this may reflect NNHS sample frame updates in 1997 and 1999 that relied on CMS data, presumably from OSCAR, and data from unspecified "other national organizations" (Jones 2002).
Interestingly, estimates from the Administration on Aging's Ombudsman program, also ostensibly representing licensed or certified facilities (AoA 2004) identify about 1,000 more facilities than the MEPS-NHC and the NNHS in 1996 and 1997, respectively, but nearly match the NNHS estimate for 1999 and remain essentially constant thereafter. It is possible that the different methodology behind the Ombudsman program estimate (Ombudsmen reports of facilities for which they provide services) contributes to the differences.
The remaining estimates for 1999 and later are all above the higher of the two OSCAR estimates, reflecting a broader facility definition not conditioned on either licensing or certification. This is especially true for the estimate from the 2000 Census of 21,051 nursing homes (Jonas 2003). The Census definition, as discussed, is quite broad, including, for example, "homes for the aged," some of which might be considered alternative residential care rather than nursing homes in state licensing data and some of which might not be licensed at all. We were not able to determine criteria used to define these settings from publicly available documentation. Documents that are available indicate that prior to the 2000 Census, homes for the aged "with or without nursing care" were included as nursing homes (U.S. Census Bureau 1992), whereas in 2000, some available documentation specifies homes for the aged "with nursing care" (U.S. Census Bureau 2003). The apparent change is not mentioned in a detailed section on comparability with the 1990 Census, although other relevant items, such as removing the designation of 10 or more unrelated persons living together as living in group quarters, are listed.
Number of Nursing Home Residents
In Figure 2b and Figure 2c, we have limited estimates to residents age 65 or older in all cases where we had estimates for that age group. To simplify the discussion and the figures, we present estimates first from provider-based surveys in Figure 2b and then present estimates from population-based data in Figure 2c.
Provider-Based Estimates
The relatively large differences in the number of facilities seen in Figure 2a do not appear to result in large differences in estimates of residents across surveys (Figure 2b), with estimates generally in the range of 1.3 to 1.5 million residents. This is likely because the additional uncertified facilities included in the NNHS and MEPS-NHC estimates tend to be relatively small (Rhoades 2000). The very small difference between the NNHS trends for residents of certified facilities only and residents of all facilities supports this conjecture. Although Harrington's OSCAR estimates include the nonelderly, they lie slightly below the NNHS estimates for certified facilities, which are restricted to residents 65 or older. Again, this may suggest that the Harrington estimate is an underestimate of residents in certified facilities, potentially owing to the facility selection method. The presence or absence of the age restriction is not in itself very important because at least 90 percent of the nursing home population is elderly.
The OSCAR data show a slight downward trend in the number of residents since the mid 1990s, while the NNHS shows a slight upward trend since 1995, consistent with the NNHS trend in the number of facilities seen in Figure 2a. The outlier CMS estimate of more than 2.5 million residents age 65 or older is constructed from Minimum Data Set assessments and apparently is an annual user estimate rather than a cross-section of residents comparable to the other estimates.
Population-Based Estimates
Population-based estimates of nursing home residents are available from the 2000 Census and from two surveys, the NLTCS, and the MCBS, which have in common full population coverage of the Medicare elderly (Figure 2c). They differ, however, in sample definition, with the NLTCS designed as a cross-section and the MCBS designed to represent either those ever enrolled during the survey year (Cost and Use) or continuously enrolled during the survey year (Access to Care). All MCBS estimates are constructed from the Cost and Use file, except the 2001 estimate (Chulis and McCormick 2002), which is from the Access to Care file. Considering first the two estimates from the NLTCS cross-section for 1999, these estimates illustrate the importance of weighting decisions for estimates. The higher of the two estimates (1.42 million) uses a weight post-stratified to Census control totals, according to specifications used in prior survey years (Spillman 2004). The lower estimate of 1.2 million elderly nursing home residents reported in Manton and Gu (2001) uses a weight in which the NLTCS institutional sample was not post-stratified to an external control but rather allowed to generate an independent estimate.4 Both estimates are well below the estimate of 1.56 million from the 2000 Census. As noted, the Census definition of nursing home appears to be broader and may or may not be conditioned on nursing care. Both estimates are also below the NNHS estimate of 1.47 million from Figure 2b, by about 40,000 and nearly 300,000, respectively.
The MCBS illustrates a number of methodological challenges for comparison with estimates from other data. The first is sample definition. Because the Cost and Use file, which is used in the MCBS estimates for 1994 through 1999, is designed to study annual spending and utilization patterns rather than to represent an accurate cross-section of the beneficiary population, the sample is selected and weights are constructed to be representative of all persons ever enrolled during the year, including both new enrollees and enrollees who die during the year. A residential timeline is provided covering the survey year for each sample member. The most common type of nursing home estimate produced using the data is an annual user estimate of all persons with at least one stay during the survey year, reflected in the two series of estimates labeled "annual users." These annual user estimates would be expected to be and are far higher than cross-sectional estimates from either the NLTCS or the provider-based estimates.
However, there is an additional issue of a change in the survey treatment of SNF stays between the 1996 and 1997 surveys that has substantial effects on the use estimates, illustrated by the discontinuity in the series of estimates labeled "Spillman -- annual users." Prior to 1997, only some SNF stays were counted because SNF stays were not identified separately on the residential time line. Thus, SNF stays were captured only if they occurred at the time of interview, and even then, they were not distinguished from other nursing home stays, so that they can neither be completely included nor excluded without claims analysis. Beginning in 1997, SNF stays were added as a category on the timeline. The Spillman estimates include these stays in 1997 and 1998 while the Potter estimate for 1999 excludes them, resulting in a discrepancy of roughly 1 million persons between the estimates. Tabulations from published MCBS estimates posted on the CMS web site confirm that this is roughly the annual number of persons age 65 or older whose only facility use was a SNF stay between 1997 and 1999.5 For illustrative purposes, estimates constructed by subtracting SNF stays from the 1997 and 1998 estimates and adding SNF stays to the 1999 estimate are shown as open circles in Figure 2c.
The final data series from the Cost and Use file, labeled Spillman--point in time, is a point in time estimate of nursing home use by persons surviving to the fall interview, from a study of the characteristics of nursing home and assisted living residents (Spillman, Liu, and McGilliard 2002). The fall interview was selected in order to use disability and other information collected in that interview. Because they are constructed at a point-in-time, these estimates are much less sensitive to the treatment of SNF stays. However, they also may be an underestimate of true cross-sections of elderly nursing home residents at a point in time. Medicare elderly population estimates corresponding to these point-in-time estimates understate Medicare enrollment by 1 to 2 percent depending on the year.
In fact, the point in time nursing home resident estimates appear to be low relative to other cross-sectional estimates only for 1997 and 1998, when estimates are 1.39 and 1.35 million, respectively, compared with estimates of 1.47 million from the 1997 and 1999 NNHS (Figure 2b). The point in time estimates for 1995 and 1996 of 1.42 million and 1.46 million, respectively are much closer to cross-sectional estimates from the provider-based survey estimates, matching the NNHS estimate for 1995 and slightly higher than the 1996 MEPS-NHC estimate of 1.43 million (Figure 2b). It is possible that the lower point-in-time estimates from the 1997 and 1998 MCBS reflect changes in the identity of marginal settings as the result of changes in state licensure options, as described by Rhoades (2000). In fact, between 1992 and 1998, the percent of the elderly population in alternative residential care rose according to MCBS estimates, so that the combined percent of the elderly population in either nursing homes or alternative residential care remained literally unchanged at 5.3 percent (Spillman, Liu, and McGilliard 2002).
The final estimate, from the 2001 Access to Care file, is 1.26 million residents6 and is well below all estimates except that of Manton for 1999. Two methodological issues, one of which would cause an overestimate and the other an underestimate of elderly residents, complicate comparisons with other estimates. First, the Access to Care estimate includes the nonelderly, which should produce a somewhat higher estimate than if limited to the elderly. Second, and presumably more important, because the Access to Care estimate represents the always-enrolled population it understates a true cross-section of the population. The total Access to Care Medicare population was 37.5 million in 2001 (Chulis and McCormick 2002). This is about 2.5 million, or 6 percent, below Medicare enrollment in July of 2001. Finally, as discussed, changes in state licensing over time also may contribute to the lower estimate.
| FIGURE 2a. Estimates of Nursing Home Facilities |
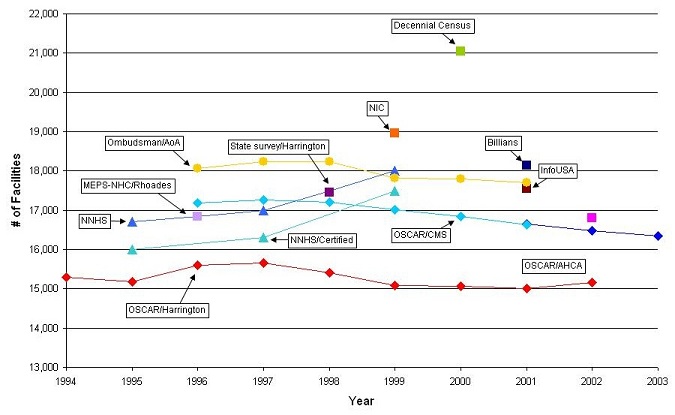 |
| FIGURE 2b. Estimates of Nursing Home Residents: Provider-Based Data |
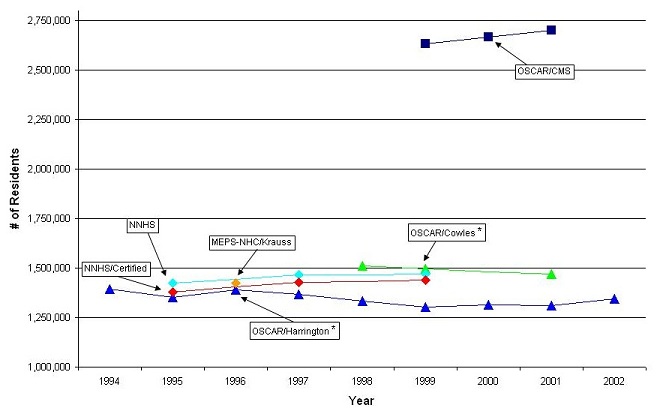 |
| * = Estimate includes nonelderly. |
| FIGURE 2c. Estimates of Nursing Home Residents: Population-Based Data |
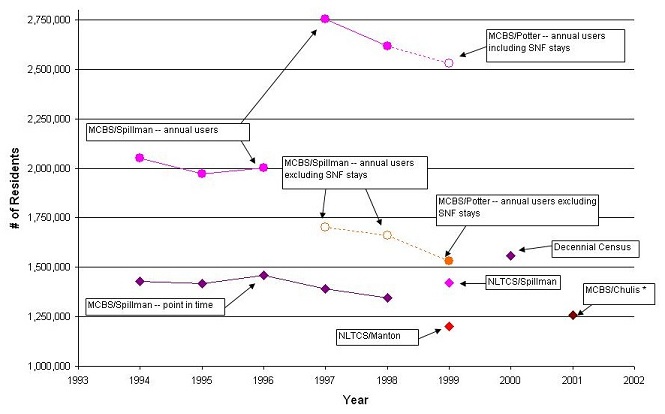 |
| * = Always enrolled in Medicare during the year (includes nonelderly). |
Alternative Residential Care
Estimates of alternative residential care settings and their residents generally support the widespread belief that this type of care arrangement is growing. Facility estimates appear to illustrate most clearly the uncertainty produced by the lack of a consistent definition of what constitutes alternative residential care. As with nursing home estimates, estimates of the number of residents in alternative care settings appear to indicate several areas where imposing more consistent methodology may be able to narrow differences.
Number of Alternative Residential Care Settings
While the general trend appears to be upward, the range of estimates of alternative residential care settings is much larger than seen for nursing facilities--from roughly 14,000 to nearly 40,000, depending on the year (Figure 3a). Within the sets of estimates providing a series, the range is narrower, although still substantial, at 10,000 to nearly 20,000 facilities depending on the year.
The estimates labeled NCAL and Mollica can be taken as roughly a single series because the NCAL estimates rely heavily on Mollica's survey of state licensing data, using internal information on opening dates to extrapolate backward and assumptions about growth rates to interpolate intermediate points. Taken as a single series, the estimates suggest that the number of facilities slightly more than doubled in the seven years between 1995 and 2002, from about 16,000 to about 36,000. As seen for nursing homes, the AoA Ombudsman data from reports of facilities for which ombudsmen provide services identify substantially more facilities, even though both series ostensibly represent licensed facilities. Estimates for 1999 from the NIC, which appears to be more narrowly defined and for 2000 from Care Scout, which includes places Care Scout identified specifically as "assisted living" but may also include some other settings (SSS 2003) lie roughly along or between the higher and lower trends, roughly consistent with their apparent inclusiveness or exclusiveness.
Remaining estimates are outliers in one direction or the other. The Hawes estimate of about 11,500 entities is the result of a purposeful attempt to exclude all facilities not meeting the assisted living model and is limited to facilities with more than 10 beds that either call themselves assisted living or offer a minimum set of services. Because of these exclusions, it is predictably below the Mollica estimate of nearly 25,000 facilities. Hawes (1999) notes, however, that only 27 percent of facilities in the frame constructed for the survey met the definition, so that an unrestricted estimate presumably would be about 42,000 facilities, almost identical to the 1998 Ombudsman estimate. Both the outliers on the high side--Harrington for 1998 and SSS, Inc., for 2000--were constructed, like the Mollica estimates, from state licensing data. The final two estimates, both for 2002 from Firstmark, which is a marketing database, differ only in construction, with the higher of the two double counting entities that identified themselves as having more than one relevant type of residential care setting, while the lower estimate counts such places only once. Because a campus may include more than one type of care setting, these estimates in theory bracket a count of unique settings.
Number of Persons in Alternative Residential Care Settings
There also appears to be a clear upward trend in the number of persons living in alternative residential care settings, at least through 1999 (Figure 3b). Methodological differences make it impossible to discern what has happened since that year. As with the nursing facility estimates, the small facilities that probably account for the discrepancies in the number of facilities appear to account for a relatively small number of residents. Notably, the Hawes estimate of 521,000 residents in 1998 is based on a far smaller number of facilities but is very much in line with the other survey estimates of residents in that year. The MCBS Cost and Use file, which over the period covered by our review was limited to residential care settings identified as facilities, according to the survey's protocol, provides the only series of estimates. As with the nursing facility estimates, two different types of Cost and Use estimates are shown, with the higher estimates representing annual users and the lower representing residents at a point in time near the fall interview (Spillman, Liu, and McGilliard 2002).
Both estimates labeled Spillman include a small proportion of persons who were living in the community with at least two unrelated persons and were disabled in ADLs as an attempt to capture community residential care not identified in the MCBS prior to the 2001 Access to Care file. The group so identified was very small, less than 0.2 percent of the population in all years, and became smaller over time, accounting for less than 0.05 percent of the population by 1998. Over the same period, both the number of persons in alternative residential care facilities and the list of facility types identified on the survey grew, suggesting the possibility that respondents may have been increasingly more likely to be designated facility residents as the identification of facility settings in the survey evolved with experience.
The difference between the annual user and point estimates is much narrower than seen for the nursing facility estimates but seems to widen slightly over time with annual users increasing from about 350,000 in 1993 to about 570,000 in 1998, and users at a point in time growing from about 260,000 to 420,000 in the two Spillman series. Both series show an average annual growth rate of about 10 percent. The additional Cost and Use file estimates for 1996 through 1999, labeled MCBS/CMS, are annual user estimates like the higher of the two Spillman trends. They are puzzling for two reasons. First, the 1996 estimate is nearly identical to the Spillman 1996 point-in-time estimate, but in 1997 and 1998 the CMS estimates are virtually the same as the Spillman annual user estimates for those years. The implied growth rate between 1996 and 1997 for the CMS series is 60 percent, which is implausibly high compared with an average annual growth rate of about 14 percent between 1997 and 1999. Second, the CMS data series includes the nonelderly, while the Spillman estimates do not. A third Cost and Use file annual user estimate, the 1999 estimate labeled MCBS/Potter estimate, attempts to exclude the nonelderly from the CMS estimate by assuming that the elderly make up a proportion of the alternative residential care estimate similar to their representation among all full year and part-year institutional residents (about 13 percent) (DEB Potter, personal communication). The result is an estimate of 532,000 elderly residents during 1999, slightly below the Spillman annual user estimate for the same age group in 1998.
Two estimates, both point in time estimates, are shown from the 2001 MCBS Access to Care file estimates: residents of combined community and facility residential care (labeled MCBS/Chulis--all), and residents of facilities only (labeled MCBS/Chulis--facilities only).7 As with the Access to Care nursing facility residents estimates, comparisons are difficult because the Chulis estimates include the nonelderly but also represent only the continuously enrolled population, which should understate a cross-section of Medicare enrollees. As noted earlier, the total Access to Care Medicare population estimate is about 6 percent below Medicare enrollment in July of 2001. This may partially explain why the 2001 Access to Care file estimate of 761,000 persons of all ages in community and facility alternative residential care settings is slightly below a 1999 estimate of 810,000 elderly residents from the NLTCS, which is the only other national population-based survey from which it is possible to estimate the residential care population in both community and facility settings. The Access to Care estimate is also similar, however, to NCAL's 2000 estimate of 789,000 residents of all ages, although the latter is not a direct estimate. It was constructed using Mollica's 2000 estimate of licensed facilities and assuming an average 24 residents per facility based on a 2000 NCAL survey (NCAL 2001). The much higher NCAL estimates of residents in 1997 and 1998 were based on an estimate of 40 residents per facility from an earlier NCAL survey (NCAL 1998).
The 2001 Access to Care estimate of 532,000 persons in residential facility settings, about 70 percent of the estimated 761,000 residential care population, is virtually identical to Potter's 1999 Cost and Use annual user estimate for the elderly, even though it would be expected to be lower. Manton and Gu (2001) report that only about 200,000, or 25 percent, of the 810,000 total assisted living residents in the 1999 NLTCS estimate were in facilities as defined by that survey. This points to the potential importance of focusing on survey definitions of "facility" and "community" in assessing the comparability of estimates.
The final estimate and the only estimate from a community survey is the 1993 AHEAD survey estimate of about 543,000 persons age 70 or older in community residential care settings (Spector et al. 2000), only slightly fewer than the roughly 600,000 found in the 1999 NLTCS. Because a very small proportion of persons between age 65 and 70 are in such settings, the age difference should not be consequential in comparisons with other estimates for the population age 65 or older. As discussed, the AHEAD survey does not identify facility types by name, but rather queries for services among all who report any type of housing other than a traditional private residence. This is presumably a broader net that would capture more persons in residential care settings, but also might capture without distinguishing some persons in settings such as naturally occurring retirement communities, where services may evolve because of a critical mass of older residents. Interestingly, 64 percent of alternative residential care residents in the AHEAD reported no IADL or ADL disabilities (Spector et al. 2000). Manton and Gu report a similar finding that about two-thirds of 600,000 community residents in assisted living settings on the 1999 NLTCS were not disabled.
| FIGURE 3a. Estimates of Alternative Residential Care Settings |
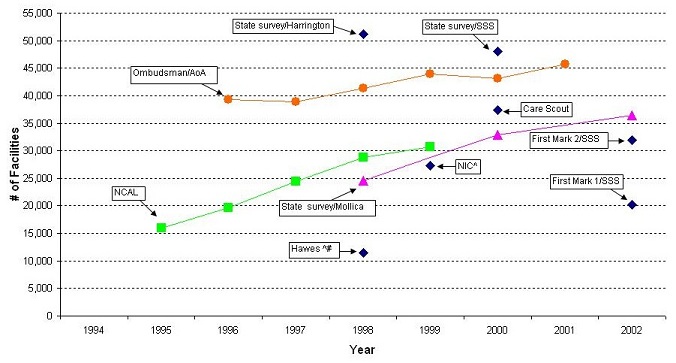 |
| ^ = Estimate excludes nonelderly. # = Excludes facilities with less than 11 beds. |
| FIGURE 3b. Estimates of Alternative Residential Care Residents |
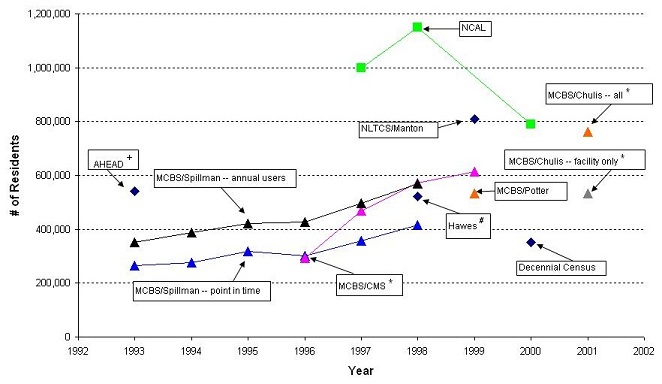 |
| * = Estimate includes nonelderly. + = Community residents 70 years or older. # = Excludes facilities with less than 11 beds. |
SUMMARY AND ANALYTIC FRAMEWORK
Our review of existing estimates confirms that there are substantial differences in estimates of both the number of residential care facilities and the number of residents. In many cases differences are consistent with known differences in underlying methodology. These methodological differences also complicate attempts to discern trends. Uncertainty about the number and characteristics of persons receiving care in various settings reduces the ability to target resources well and develop effective public policy to address the needs of the long term care population. Better understanding of these settings and the population they serve is important both to inform public policy and to assist consumers in their choices.
Many of the methodological differences we identified can be analyzed empirically to develop better estimates of the distribution of the older long term care population across settings, to begin to quantify the importance of various methodological issues for observed discrepancies, and to inform recommendations for improvements in how data are collected. In this final section, we summarize our conclusions with respect to the magnitude of discrepancies, the key methodological issues that may be addressed by analysis of existing data, and the most promising data for the purpose.
Magnitude of Differences in Estimates
For nursing homes, despite differences in methodology, there was greater consistency in estimates of both the number of facilities (15,000 to 18,000 in all years) and the number of older residents (1.2 million to 1.56 million) than in estimates for residential care alternatives. The estimates appear to show a mild upward trend in the number of nursing homes prior to 1997 and a mild downward trend thereafter. The trend for residents appears to have been slightly downward in the late 1990s but lack of consistent published estimates makes the trend since then unclear.
For residential care alternatives, estimates suggest a stronger upward trend throughout our period of observation, but the range of estimates for both the number of places and the number of residents is greater than for nursing homes and residents. Differences in estimates of the number of alternative residential care settings ranged from 14,000 to nearly 40,000, depending on the year. Estimates of the number of residents also differed to a greater degree than for nursing homes, but the most recent estimates, which allow identification of both community and institutional or facility settings, suggest a population in these alternative settings on the order of 800,000.
Key Issues and Data Sources for Analysis
The five key methodological issues identified in our review that are most amenable to empirical investigation using existing data sources are the following:
- age of the population examined;
- methods for assigning individuals to the "facility" or "institutional" population (and conversely, the "community" or "noninstitutional" population);
- methods of identifying nursing homes;
- methods of identifying alternative residential care settings; and
- sample representation and weighting.
The key features of data best suited for analysis of these five issues are population representation, so that all elements of the population of interest--older persons with disabilities--are represented, the ability to determine how settings in which individuals reside are identified, the ability to apply different criteria more similar to those used in comparison surveys, and extensive documentation of survey methods. Our review of potential data sources indicates four national surveys that are recent and meet all or most of these criteria: The 1999 NLTCS, the 2002 MCBS Access to Care file, the 2002 MCBS Cost and Use file, and the 2002 HRS/AHEAD. Relevant characteristics of the four surveys are summarized in Table 3.
The first three surveys, the NLTCS and the two MCBS files meet all criteria. They are population-based surveys that either are or can be limited to the Medicare population age 65 or older, and data elements are available that allow some potential for investigating more consistent alternate definitions of residential care. Both identify residential care by named type of setting and each identifies services provided for some or all of those identified as living in residential care. In addition, comparisons across the three surveys offer information about the importance of sample representation because they represent, respectively, a cross-section of the Medicare elderly, those always enrolled during the survey year, and those ever enrolled during the survey year.
Although it represents only the noninstitutional population, the HRS/AHEAD meets all other criteria. The strength of the HRS/AHEAD is that it has the potential to provide additional insights into the importance of how residential care settings are identified because it does not rely on named types of settings, but rather screens all persons not in traditional freestanding households for services available and received. Comparison of estimates from the HRS/AHEAD with those from the surveys representing the full population also has the potential to shed light on the implications of Census-based rules for identifying the excluded institutional population for residential care estimates.
All four surveys contain detailed information about the characteristics and particularly the disability of respondents. This detailed information provides the opportunity to understand what subpopulations are being served by different types of residential care, as well as confirming whether different methods of identifying residential settings are capturing similar populations.
| TABLE 3. Comparison of Surveys | ||||
| NLTCS | MCBS Access to Care | MCBS Cost and Use | HRS/AHEAD | |
| Year | 1999 | 2002 | 2002 | 2002 |
| Selection to age 65 or older possible | Yes | Yes | Yes | Yes |
| Universe of sample | Full population | Full population | Full population | Community residents only |
| Universe of residential care settings | Community and Facility | Community and Facility | Community and Facility | Community only |
| Screen for facility residence | Residents unit in nursing, convalescent or rest home or home for the aged, patient's unit in mental/long-stay hospital, nonstaff unit in other institution or any other setting with 3 or more unrelated persons and health professional on duty every day; or assisted living community and provides substantial nursing care of any kind | 3 or more beds and either Medicare or Medicaid certification; state license; or 24-hour supervision; or supervision of medications or help with bathing, dressing, shopping, walking, eating, or communication | 3 or more beds and either Medicare or Medicaid certification; state license; or 24-hour supervision; or supervision of medications or help with bathing, dressing, shopping, walking, eating, or communication | n.a. (noninstitutional group quarters only included in universe) |
| Facility types identified | Assisted living with substantial nursing careHospital, other than SNF or ICF unitSkilled nursing facility (SNF)Intermediate care facility (ICF)Other (non-certified) nursing homeDomiciliary or personal care facilityInstitution/facility for the mentally retarded/developmentally disabledMental health center/facilityOther | Continuing Care Retirement CommunityNursing homeRetirement communityHospitalAssisted livingBoard & care homeDomiciliary care facilityPersonal care facilityRest home/retirement homeMental health center psychiatric settingMentally ret/developmentally disabledRehabilitation facilityAdult/group homeOther Adult/group homeOther (specify:___) | Continuing Care Retirement CommunityNursing homeRetirement communityHospitalAssisted livingBoard & care homeDomiciliary care facilityPersonal care facilityRest home/retirement homeMental health center psychiatric settingMentally ret/developmentally disabledRehabilitation facilityAdult/group homeOther (specify:___) | n.a. (noninstitutional group quarters only included in universe) |
| Facility certification status identified | Yes | Yes | Yes | n.a. |
| Facility licensure status identified | No | Yes | Yes | n.a. |
| Facility license other than nursing facility identified (e.g. assisetd living, personal care) | No | Yes | Yes | n.a. |
| Community residential care types identified | Control card:Assisted living communityCommunity questionnaire:Retirement homeBoarding homeBoarding home, rooming house, or rented roomGroup home or community residential facilityAssisted living with services | Retirement communitySenior citizens housingAssisted living facilityContinuing care communityStates living communityRetirement apartments | Retirement communitySenior citizens housingAssisted living facilityContinuing care communityStates living communityRetirement apartments | No explicit types: "Retirement community, senior citizens' housing, or some other type of housing that provides services." |
| Ability to implement other criteria | ||||
| Number of unrelated individuals | Yes | Yes | Yes | Yes |
| Nursing or other health services available | Yes, if identified as assisted living or other group setting on control card | Yes, facility only | Yes, facility only | Yes, for those identifying housing with services |
| Other services available | Yes, if identified as assisted living on control card | Yes, facility or in other identified community settings | Yes, facility or in other identified community setting | Yes, for those identifying housing with services |
| Questionnaire language used | Does the Assisted-Living Community provide any of the following services to [sample person]? | Community:Does the sampled person's residence offer...Does the sampled person have access to...Facility:Does the facility provide... | Community:Does the sampled person's residence offer...Does the sampled person have access to...Facility:Does the facility provide... | "Even if you don't use them now, does the place you live offer... |
| IADL services | MealsHousekeeping | Community:MealsHousekeepingLaundryMedication assistanceTransportationFacility:Medication supervisionShopping | Community:MealsHousekeepingLaundryMedication assistanceTransportationFacility:Medication supervisionShopping | Group mealsTransportationHousekeeping |
| ADL services | MobilityEating | Community:Personal careFacility:BathingDressingEating | Community:Personal careFacility:BathingDressingEating | Bathing, dressing, or eating |
| Other services | No | Community:RecreationFacility:CommunicationWalking | Community:RecreationFacility:CommunicationWalking | Emergency call button |
| Population representation after age selection | Cross-section of Medicare enrollees age 65 or older | Population age 65 or older continuously enrolled in Medicare during year | Population age 65 or older continuously enrolled in Medicare during year | Cross-section of noninstitutional population age 65 or older |
REFERENCES
Abramson FH. 2003. Special Place/Group Quarters Enumeration. U.S. Census Bureau. http://www.census.gov/pred/www/rpts/SPGQ.pdf>. Accessed February 2004.
Adler GS. 1994. A Profile of the Medicare Current Beneficiary Survey. Health Care Financing Review 15 (4): 153-163.
Administration on Aging. 2004. Long Term Care Ombudsman Report FY 2001: with comparisons of national data for FY 1998-2001. http://www.aoa.gov/prof/aoaprog/elder_rights/LTCombudsman/National_and_S.... Access March 2004.
American Health Care Association. 2003. Trend in Certified Nursing Facilities, Beds, Patients. Data obtained from AHCA website http://www.ahca.org/research/oscar_oper.htm>. Accessed March 2004.
Centers for Medicare and Medicaid Services. 2002. Program Information on Medicare, Medicaid, SCHIP, and other programs of the Centers for Medicare and Medicaid Services: Section III.B.4: Beneficiaries Living in Long Term Care Facilities. http://www.cms.hhs.gov/charts/series/sec3-b4.ppt>. Accessed February 2005.
Centers for Medicare and Medicaid Services. 2001. Nursing Home Data Compendium 2001. Centers for Medicare and Medicaid Services.
Chulis G, McCormick C. 2002. Characteristics of the Medicare Population in Different Residential Settings: Data from the Medicare Current Beneficiary Survey Presentation at the 2002 Gerontological Society of America annual meeting.
Commission on Affordable Housing and Health Facility Needs for Seniors in the 21st Century. 2002. A Quiet Crisis in America, Final Report to Congress. Commission on Affordable Housing and Health Facility Needs for Seniors in the 21st Century.
Cowles CM. 2002. Nursing Homes: A Growth Industry? In 2002 Nursing Home Statistical Yearbook, edited by Cowles Research Group. Cowles Research Group. http://www.longtermcareinfo.com/crg/nursing_home_yearbook.html>. Accessed February 2005.
Cowles CM. 2001. Executive Summary. In 2001 Nursing Home Statistical Yearbook, edited by Cowles Research Group. http://www.longtermcareinfo.com/crg/NHSY-Executive-Summary.pdf>. Accessed February 2005.
Devore E, Tanner R. 2003. Health Policy Tracking Service: Assisted Living Issue Brief. Health Policy Tracking Service. http://www.hpts.org> Accessed September 2003.
Fox-Grage W, Folkemer D, and Lewis J. 2003. The States Response to the Olmstead Decision: How Are States Complying? National Conference of State Legislatures, Forum for State Health Policy Leadership. Washington, D.C.
Gabrel C, Jones A. 2000a. The National Nursing Home Survey: 1995 Summary for the United States. National Center for Health Statistics. In Vital and Health Statistics Series 13, vol. 146. Washington, DC: U.S. Government Printing Office.
Gabrel C, Jones A. 2000b. The National Nursing Home Survey: 1997 Summary for the United States. National Center for Health Statistics. In Vital and Health Statistics Series 13, vol. 147. Washington, DC: U.S. Government Printing Office.
Han B, Sirrocco A, and Remsburg R. 2003. Developing Typology of Long-Term Care Residential Places: The First Step. National Center for Health Statistics, Center for Disease Control and Prevention.
Harrington C. October, 2003. Personal Communication. Department of Social and Behavioral Sciences, University of California, San Francisco.
Harrington C, Carrillo H, Wellin V, and Burdin A. 2003. Nursing Facilities, Staffing, Residents, and Facility Deficiencies, 1996 through 2002. Department of Social and Behavioral Sciences, University of California. San Francisco, CA.
Harrington C, Carrillo H, and Wellin V, and Shemirani B. 2002. Nursing Facilities, Staffing, Residents, and Facility Deficiencies, 1995 through 2001. Department of Social and Behavioral Sciences, University of California. San Francisco, CA.
Harrington C, Carrillo H, and Wellin V. 2001. Nursing Facilities, Staffing, Residents, and Facility Deficiencies, 1994 Through 2000. Department of Social and Behavioral Sciences, University of California. San Francisco, CA.
Harrington C, Swan JH, and Wellin V. 1999. 1998 State Data Book on Long Term Care Program and Market Characteristics. Department of Social and Behavioral Sciences, University of California. San Francisco, CA.
Hawes C, Rose M, and Phillips CD. 1999. A National Study of Assisted Living for the Frail Elderly: Results of a National Survey of Facilities. U.S. Department of Health and Human Services Contract no. 100-94-0024, 10098-0013 and Research Triangle Institute. http://aspe.hhs.gov/daltcp/reports/facres.htm>. Accessed February 2005.
Hetzel L, Smith A. 2001. The 65 Years and Over Population: 2000. http://www.census.gov/prod/2001pubs/c2kbr01-10.pdf>. Accessed March 2004.
Jonas K. 2003. Group Quarters Enumeration, Final Report. U.S. Census Bureau. http://www.census.gov/pred/www/rpts/E.5%20R.pdf>. Accessed February 2004.
Jones A. 2002. The National Nursing Home Survey: 1999 Summary for the United States. National Center for Health Statistics. In Vital and Health Statistics Series 13, vol. 152. Washington, DC: U.S. Government Printing Office.
Krauss N, Altman B. 1998. Characteristics of nursing home residents -- 1996. Agency for Health Care Policy and Research no. 1998 MEPS Research Findings No. 5. AHCPR Pub. No. 99-0006. Rockville, MD.
Laschober MA, Olin GL. 1996. Health and Health Care of the Medicare Population: Data from the 1992 Medicare Current Beneficiary Survey. Rockville, MD: Westat, Inc.
Liu H, Sharma R. 2002. Health and Health Care of the Medicare Population: Data from the 1999 Medicare Beneficiary Survey. Prepared by WESTAT under contract to the Centers for Medicare and Medicaid Services, U.S. Department of Health and Human Services. Rockville, MD.
Manton K, Gu X. 2001. Changes in the prevalence of chronic disability in the United States black and nonblack population above age 65 from 1982 to 1999. Center for Demographic Studies, Duke University. Durham, NC.
Mollica R. 2002. State Assisted Living Policy: 2002. National Academy of State Health Policy. Portland, Maine.
Mollica R. 1995. Assisted Living Policy and Regulation: State Survey. U.S. Department of Health and Human Services, Office of Disability and Long-Term Care Policy no. #HHS-100-94-0024 and #HHS-100-98-0013. Washington, DC. http://aspe.hhs.gov/daltcp/reports/stasvyes.htm>
National Center for Assisted Living. 2001. Facts and Trends: The Assisted Living Sourcebook 2001. Washington, DC.
National Center for Assisted Living. 1998. Facts and Trends: The Assisted Living Sourcebook 1998. Washington, DC.
Nawrocki H, Gregory SR. 2000. Across the States 2000: Profiles of Long-Term Care Systems. Independent Living/Long-Term Care, Public Policy Institute, AARP. Fourth Edition. Washington, DC.
Potter DEB. March, 2004. Personal Communication. Agency for Healthcare Research and Quality.
Potter DEB, Bernstein AB, and Drabek J. 2002. Where Do the Elderly Live? Differences in Survey Estimates. Presentation at 2002 GSA meeting.
Priboth B. July, 2002. Personal Communication. Center for Demographic Studies, Duke University.
ProMatura Group, LLC. 2000. NIC National Supply Estimate of Seniors Housing and Care Properties. National Investment Center.
Rhoades J. 2000. Where Are The Missing Nursing Homes? In Health Affairs 19, no. 5: 249-50.
Rhoades J, Krauss N. 1999. Chartbook #3: Nursing Home Trends, 1987 and 1996. Agency for Health Care Policy and Research no. AHCPR Pub. No. 99-0032. Rockville, MD.
Rhoades J, Potter DEB, and Krauss N. 1998. Nursing Homes-Structure and Selected Characteristics, 1996. Agency for Health Care Policy and Research no. 1998 MEPS Research Findings No. 4 AHCPR Pub. No. 98-0006. Rockville, MD.
Rosenbaum S. 2000. The Olmstead Decision: Implications for Medicaid. Kaiser Commission on Medicaid and the Uninsured. http://www.kff.org/medicaid/2185-index.cfm>. Accessed April 2004.
Social and Scientific Systems, Inc. 2003. Task 9: Assess Results and Produce Summary Report. Inventory of Long Term Care Residential Places. Agency for Health Care Research and Quality no. HHS-100-97-0018.
Social and Scientific Systems, Inc. 2002. Task 2: Review of Previous Estimates Report Final. Inventory of Long Term Care Residential Places. Agency for Health Care Research and Quality no. HHS-100-97-0018.
Spector W, Fleishman J, and Pezzin L, and Spillman B. 2000. The Characteristics of Long-Term Care Users. Agency for Health Care Research and Quality no. AHRQ 00-0049.
Spillman, BC. 2004. "Changes in Elderly Disability Rates and the Implications for Health Care Utilization and Cost." The Milbank Quarterly 82(1): 157-194.
Spillman B, Liu K, and McGilliard C. 2002. Trends in Residential Long Term Care: Use of Nursing Homes and Assisted Living and Characteristics of Facilities and Residents. Office of Disability, Aging, and Long-Term Care Policy, Assistant Secretary for Planning and Evaluation, Department of Health and Human Services no. HHS-100-97-0010. Washington, DC. http://aspe.hhs.gov/daltcp/reports/2002/rltct.htm>
U.S. Census Bureau. 2003. Technical Documentation: Census 2000 Summary File Technical Documentation. Prepared by the U.S. Census Bureau, 2001. http://www.census.gov/prod/cen2000/doc/sf1.pdf>. Accessed May 2004.
U.S. Census Bureau. 2000. P38. Group Quarters Population by Sex by Age by Group Quarters Type [57]. Data obtained from Census website http://www.factfinder.census.gov>. Accessed March 2004.
U.S. Census Bureau. 1992. 1990 Census of Population and Housing Guide, Part B. Glossary. Prepared by the U.S. Census Bureau. http://www.census.gov/prod/cen1990/cph-r/cph-r-1b.pdf>. Accessed March 2004.
Westat. Date unknown. Evaluation of a Compendium of Inventories of U.S. Health Care Providers: Final Report. Westat. Rockville, MD.
NOTES
-
In 1994, an attempt was made to collect provider numbers so that certified facilities could be linked to CMS data (Barbara Priboth, Center for Demographic Studies, personal communication).
-
Based on an estimate of the resident population age 65 or older in 2001 (35,353,266) found at http://eire.census.gov/popest/data/national/tables/asro/NA-EST2002-ASRO-..., and CMS Medicare enrollment age 65 and older in July 2001 (33,743,452) found at http://www.cms.hhs.gov/statistics/enrollment/st01aged.asp.
-
Facility estimates from Cowles (2002), Westat (date unknown), and SSS, Inc. (2002), and residential care estimates from Commission on Affordable Housing (2002) are omitted.
-
Nursing homes can be identified in the NLTCS in several ways. The Spillman (2004) estimate identifies nursing home residents as persons receiving the institutional questionnaire and (1) identified on the institutional questionnaire as being in a SNF, intermediate care facility, or noncertified nursing home or (2) identified on the control card as living in "Resident's unit in nursing, convalescent or rest home, or home for the aged," and not identified on the institutional questionnaire as being in a hospital, an MR/DD facility, a mental facility, or "other" facility. Manton and Gu (2001) do not specify the construction of their estimate.
-
The 1999 NNHS also estimates that the number of discharges of elderly persons with Medicare as their expected payment source was roughly 1 million between October 1998 and September 1999.
-
The estimate represents residents of facilities specifically identified as a "nursing home" (Chulis and McCormick 2002).
-
The "facilities only" estimate includes residents in settings identified as assisted living, continuing care/retirement community, adult/group home, personal care facility, board and care, retirement community, domiciliary care facility, and rest home/retirement home. In addition to these facility types, the "All" estimate includes community residents in settings identified as assisted living facility, staged living community, and continuing care community (Chulis and McCormick 2002).
REPORTS AVAILABLE
- The Size and Characteristics of the Residential Care Population: Evidence from Three National Surveys
- Executive Summary: http://aspe.hhs.gov/daltcp/reports/2006/3natlsures.htm
- Full HTML Version: http://aspe.hhs.gov/daltcp/reports/2006/3natlsur.htm
- Full PDF Version: http://aspe.hhs.gov/daltcp/reports/2006/3natlsur.pdf
- The Size of the Long-Term Care Population in Residential Care: A Review of Estimates and Methodology (February 2005)
- Executive Summary: http://aspe.hhs.gov/daltcp/reports/2005/ltcpopszes.htm
- Full HTML Version: http://aspe.hhs.gov/daltcp/reports/2005/ltcpopsz.htm
- Full PDF Version: http://aspe.hhs.gov/daltcp/reports/2005/ltcpopsz.pdf
To obtain a printed copy of this report, send the full report title and your mailing information to:
U.S. Department of Health and Human ServicesOffice of Disability, Aging and Long-Term Care PolicyRoom 424E, H.H. Humphrey Building200 Independence Avenue, S.W.Washington, D.C. 20201FAX: 202-401-7733Email: webmaster.DALTCP@hhs.gov
RETURN TO:
Office of Disability, Aging and Long-Term Care Policy (DALTCP) Home [http://aspe.hhs.gov/_/office_specific/daltcp.cfm]Assistant Secretary for Planning and Evaluation (ASPE) Home [http://aspe.hhs.gov]U.S. Department of Health and Human Services Home [http://www.hhs.gov]