
Picture of Housing and Health: Medicare and Medicaid Use Among Older Adults in HUD-Assisted Housing
The Lewin Group
March 2014
This report was prepared under contract between the U.S. Department of Health and Human Services (HHS), Office of Disability, Aging and Long-Term Care Policy (DALTCP) and the Lewin Group. Additional funding was provided through Interagency Agreements with the HHS Administration on Aging and the U.S. Department of Housing and Urban Development. For additional information about this subject, you can visit the DALTCP home page at http://aspe.hhs.gov/office_specific/daltcp.cfm or contact the ASPE Project Officer, Emily Rosenoff, at HHS/ASPE/DALTCP, Room 424E, H.H. Humphrey Building, 200 Independence Avenue, S.W., Washington, D.C. 20201. Her e-mail address is: Emily.Rosenoff@hhs.gov.
The opinions and views expressed in this report are those of the authors. They do not necessarily reflect the views of the Department of Health and Human Services, the Department of Housing and Urban Development, the contractor or any other funding organization.
TABLE OF CONTENTS
- I. INTRODUCTION
- A. Study Overview and Task Objectives
- B. Background
- III. DATA
- IV. RESULTS
- A. Understand Demographic Characteristics of HUD-Assisted Individuals in the 12 Study Jurisdictions
- B. Calculate HUD and Medicare and/or Medicaid Match Rate in the 12 Study Jurisdictions, 2008
- C. Estimate HUD-Assisted Medicare Beneficiaries with Enrollment in Part D Subsidy Assistance Programs or Medical Savings Program
- D. Compare Medicare and Medicaid Payment and Utilization for HUD-Assisted Beneficiaries and Unassisted Beneficiaries in the Community in the 12 Study Jurisdictions
- V. DISCUSSION
- A. Summary of Results
- B. Limitations
- C. Future Analysis
- APPENDICES
- APPENDIX A: Data Sources and Variable Definitions
- APPENDIX B: Study Samples and Analytic Approach
- APPENDIX C: 2008 Detailed Results
- APPENDIX D: Supplemental Results, All Years
- LIST OF FIGURES
- FIGURE 1: Demographic Characteristics of HUD-Assisted Individuals in 12 Study Jurisdictions, 2008
- FIGURE 2: Distribution of HUD-Assisted Individuals by Property Type in 12 Study Jurisdictions, 2008, All Ages
- FIGURE 3: Distribution of HUD-Assisted Individuals by Property Type in 12 Study Jurisdictions, 2008, Age 62+ Years
- FIGURE 4: Proportion of HUD-Assisted Properties in 12 Study Jurisdictions Defined as "Elderly", 2008
- FIGURE 5: Medicare and Medicaid SSN Match Rates for HUD-Assisted Individuals, by Age Group, 2008
- FIGURE 6: Medicare and Medicaid Restrictive Match Rates for HUD-Assisted Individuals, by Age Group, 2008
- FIGURE 7: Comparison of HUD-Assisted Individuals Who Linked to Medicare or Medicaid and Who Did Not Link, Age 65 or Older, 2008
- FIGURE 8: HUD-Assisted Medicare Beneficiaries Part D LIS Status and Medicaid Participation
- FIGURE 9: Inclusion Criteria for HUD-Assisted and Unassisted Medicare Beneficiaries for Payment and Utilization Comparison in 12 Jurisdictions, All Ages, 2008
- FIGURE 10: Medicare and Medicaid Enrollees with Chronic Conditions, 2008, 12 Study Jurisdictions
- FIGURE 11: Comparison of Fee-for-Service HUD-Assisted MME and Unassisted MME Medicare Health Care Utilization
- FIGURE 12: Comparison of Fee-for-Service HUD-Assisted MMEs and Unassisted MMEs Medicaid Health Care Utilization
- FIGURE 13: HUD-Assisted Medicare/No Medicaid Beneficiaries and Unassisted Medicare/No Medicaid Beneficiaries, 2008, by Gender
- FIGURE 14: HUD-Assisted Medicare/No Medicaid Beneficiaries and Unassisted Medicare/No Medicaid Beneficiaries, 2008, by Race/Ethnicity
- FIGURE 15: Fee-for-Service HUD-Assisted Medicare/No Medicaid Beneficiaries and Unassisted Medicare/No Medicaid Beneficiaries, 2008, by Part D LIS Status
- FIGURE 16: HUD-Assisted Medicare/No Medicaid Beneficiaries and Unassisted Beneficiaries, Age 65+, 2008, by Chronic Condition Category Count and Prevalence
- FIGURE 17: Comparison of Fee-for-Service HUD-Assisted Medicare/No Medicaid Beneficiaries and Unassisted Medicare/No Medicaid Beneficiaries' Medicare Health Care Utilization
- FIGURE B1: Inclusion Criteria for HUD-Assisted and Unassisted Medicare Beneficiaries for Payment and Utilization Comparison, All Ages
- FIGURE C1: Inclusion Criteria for HUD-Assisted and Unassisted Medicare Beneficiaries for Payment and Utilization Comparison
- LIST OF TABLES
- TABLE A1: Property Type Variable Definition
- TABLE A2: Assignment of Chronic Conditions into 9 Chronic Condition Groups
- TABLE A3: Medicare Health Care Utilization Variable Definitions
- TABLE A4: Medicare Health Care Spending Variable Definitions
- TABLE B1: HUD-Assisted Individuals 2008 Unique Observations
- TABLE C1: Demographic Characteristics of HUD-Assisted Individuals, 2008, 12 Study Jurisdictions
- TABLE C2: Living Arrangement, All Ages and Age 62+ Years
- TABLE C3: Living Arrangement, Household Level, All Ages
- TABLE C4: Full and Partial HUD Housing Assistance, 2008, by Age Group
- TABLE C5: Proportion of HUD-Assisted Properties in 12 Study Jurisdictions Defined as "Elderly"
- TABLE C6: Medicare and Medicaid SSN and Restrictive Match Rates for HUD-Assisted Individuals, 2008, by Age Group
- TABLE C7: Medicare and Medicaid SSN and Restrictive Match Rates for HUD-Assisted Household Heads Receiving SSI, 2008, by Age Group
- TABLE C8: Comparison of HUD-Assisted Individuals Who Linked to Medicare or Medicaid, 2008, by Age Group
- TABLE C9: HUD-Assisted Medicare Beneficiary Enrollment in Part D LIS, 2008
- TABLE C10: HUD-Assisted Medicare Beneficiary Enrollment in Medicaid and Medicaid Coverage Characteristics, 2008
- TABLE C11: Five Sub-groups for Comparison of Health and Health Care Utilization Among HUD-Assisted Beneficiaries and Unassisted Beneficiaries in the Community
- TABLE C12: HUD-Assisted and Unassisted MME Demographic Characteristics
- TABLE C13: HUD-Assisted and Unassisted MME Medicare and Medicaid Enrollment Characteristics
- TABLE C14: MMEs with Chronic Condition Count and Prevalence, Age 65+, 2008, 12 Study Jurisdictions
- TABLE C15: Comparison of HUD-Assisted MME and Unassisted MME Medicare Health Care Utilization
- TABLE C16: Comparison of HUD-Assisted MME and Unassisted MME Medicaid Health Care Utilization per 1000 Member Months
- TABLE C17: Comparison of HUD-Assisted MME and Unassisted MEE Medicaid Health Care Utilization, Proportion of MMEs with Any Use
- TABLE C18: HUD-Assisted Medicare/No Medicaid Beneficiaries and Unassisted Beneficiaries, Age 65+, 2008, by Demographic and Coverage Characteristics
- TABLE C19: HUD-Assisted Medicare/No Medicaid and Unassisted Beneficiaries with Chronic Condition Count and Prevalence, Age 65+, 2008, 12 Study Jurisdictions
- TABLE C20: Comparison of HUD-Assisted Medicare/No Medicaid Beneficiaries and Unassisted Medicare/No Medicaid Beneficiaries' Medicare Health Care Utilization
- TABLE D-A1: HUD-Assisted Individuals Full vs. Partial Year, by Year (All Ages)
- TABLE D-A2: HUD-Assisted Individuals Full vs. Partial Year, by Year (Age 62+)
- TABLE D-A3: HUD-Assisted Individuals Full vs. Partial Year, by Year (Age 65+)
- TABLE D-A4: HUD-Assisted Individuals Across Consecutive Years Full vs. Partial
- TABLE D-A5: Living Arrangement, HUD-Assisted Individuals, All Ages and Age 62+ Years
- TABLE D-A6: Living Arrangement, HUD-Assisted Households, All Ages
- TABLE D-A7a: HUD-Assisted Individual Demographics, 2008
- TABLE D-A7b: HUD-Assisted Individuals Demographics, 2007-2009
- TABLE D-A8: HUD-Assisted Individual Demographics by Geographic Area
- TABLE D-A9: Demographics by Age Group
- TABLE D-A10: Demographics by Property Type
- TABLE D-A11: Demographics by Subside Type
- TABLE D-A12: Number and Proportion of TRACS Properties by Proportion of Households with at Least One Individual Age 62+
- TABLE D-A13: Number and Proportion of TRACS Properties by Proportion of Households with at Least One Individual Age 62+ by Geographic Location
- TABLE D-A14: Number and Proportion of PIC Properties by Proportion of Households with at Least One Individual Age 62+
- TABLE D-A15: Number and Proportion of PIC Properties by Proportion of Households with at Least One Individual Age 62+ or Designated Elderly by Geographic Location
- TABLE D-B1: Medicare and Medicaid SSN and Restrictive Match Rates for HUD-Assisted Individuals, 2008, by Age Group
- TABLE D-B2: Medicare and Medicaid SSN and Restrictive Match Rates for HUD-Assisted Household Heads Receiving SSI, 2008
- TABLE D-B3: Restrictive Match Rates: All Ages
- TABLE D-B4: Restrictive Match Rates: 62 Years of Age
- TABLE D-B5: Restrictive Match Rates: Age 62 to 64
- TABLE D-B6: Restrictive Match Rates: Age 65+
- TABLE D-B7: Restrictive Match Rates: Heads of Household, All Ages
- TABLE D-B8: Restrictive Match Rates: Heads of Household, 62 Years of Age
- TABLE D-B9: Restrictive Match Rates: Heads of Household, Age 62 to 64
- TABLE D-B10: Restrictive Match Rates: Heads of Household, Age 65+
- TABLE D-B11: Restrictive Match Rates: Heads of Household, Receiving SSI
- TABLE D-B12: Comparison of HUD-Assisted Individuals Who Linked to Medicare or Medicaid by Age Group, 2008
- TABLE D-C1: Health Insurance Characteristics of Those that Link by Year by Age
- TABLE D-C2: Health Insurance Characteristics of HUD Heads of Households Receiving SSI that Link in 2008 by Age
- TABLE D-D1: Final 2008 Samples for Utilization and Cost Analysis
- TABLE D-D2: Final 2008 Samples Limited to Individual with Medicaid Fee for Service -- Managed Care
- TABLE D-D.A1: Demographic and Medicare Health Insurance Characteristics of HUD-Assisted Beneficiaries vs. Unassisted Beneficiaries, 2008
- TABLE D-D.A2: Prevalence of CCW Conditions Among HUD-Assisted Beneficiaries vs. Unassisted Beneficiaries
- TABLE D-D.A3: Medicare Health Care Utilization per 1000 Member Months
- TABLE D-D.A4: Medicare and Beneficiary Health Care Costs
- TABLE D-D.A1.1: Demographic and Medicare Health Insurance Characteristics of HUD-Assisted Beneficiaries vs. Unassisted Beneficiaries 2008
- TABLE D-D.A1.2: Prevalence of CCW Conditions Among HUD-Assisted Beneficiaries vs. Unassisted Beneficiaries
- TABLE D-D.A1.3: Medicare Health Care Utilization per 1000 Member Months
- TABLE D-D.A1.4: Medicare and Beneficiary Health Care Costs
- TABLE D-D.B1: Demographic and Medicare Health Insurance Characteristics of HUD-Assisted Beneficiaries vs. Unassisted Beneficiaries 2008
- TABLE D-D.B2: Prevalence of CCW Conditions Among HUD-Assisted Beneficiaries vs. Unassisted Beneficiaries
- TABLE D-D.B3: Medicare Health Care Utilization per 1000 Member Months
- TABLE D-D.B4: Medicare and Beneficiary Health Care Costs
- TABLE D-D.C1: Demographic and Medicare Health Insurance Characteristics of HUD-Assisted Beneficiaries vs. Unassisted Beneficiaries 2008
- TABLE D-D.C2: Prevalence of CCW Conditions Among HUD-Assisted Beneficiaries vs. Unassisted Beneficiaries
- TABLE D-D.C3: Medicare Health Care Utilization per 1000 Member Months
- TABLE D-D.C4: Medicare and Beneficiary Health Care Costs
- TABLE D-D.C1.1: Demographic and Medicare Health Insurance Characteristics of HUD-Assisted Beneficiaries vs. Unassisted Beneficiaries 2008
- TABLE D-D.C1.2: Prevalence of CCW Conditions Among HUD-Assisted Beneficiaries vs. Unassisted Beneficiaries
- TABLE D-D.C1.3: Medicare Health Care Utilization per 1000 Member Months
- TABLE D-D.C1.4: Medicare and Beneficiary Health Care Costs
- TABLE D1: Proportion of Beneficiaries with Part D Coverage, Enrolled in LIS
ACRONYMS
The following acronyms are mentioned in this report and/or appendices.
| Acronyms | |
| ADL | Activity of Daily Living |
| AIDS | Acquired Immune Deficiency Syndrome |
| AMI | Area Median Income |
| ASC | Ambulatory Surgery Center |
| BMIR | Below-Market Interest Rate |
| CBPP | Center on Budget and Policy Priorities |
| CBSA | Core Based Statistical Area |
| CCW | Chronic Condition Warehouse |
| CMS | Centers for Medicare and Medicaid Services |
| DIB | Disability Insurance Benefits |
| DME | Durable Medical Equipment |
| E&M | Evaluation and Management |
| ED | Emergency Department |
| ER | Emergency Room |
| ESRD | End Stage Renal Disease |
| FFS | Fee-For-Service |
| FIPS | Federal Information Processing Standards |
| FPL | Federal Poverty Level |
| GDIT | General Dynamics Information Technology |
| HCBS | Home and Community-Based Services |
| HH | Home Health |
| HHS | U.S. Department of Health and Human Services |
| HIV | Human Immunodeficiency Virus |
| HMO | Health Maintenance Organization |
| HUD | U.S. Department of Housing and Urban Development |
| IADL | Instrument Activity of Daily Living |
| IMG | Imaging Services |
| LIS | Low Income Subsidy |
| MAX | Medicaid Analytic eXtract |
| MDS | Minimum Data Set |
| MME | Medicare and Medicaid Enrollee |
| MR/DD | Mental Retardation and Other Developmental Disabilities |
| MSP | Medicare Savings Program |
| NF | Nursing Facility |
| PAC | Project Assistance Contract |
| PHA | Public Housing Authority |
| PHYS | Physician Office Services |
| PIC | Public and Indian Housing Information Center |
| PIH | Public and Indian Housing |
| PMPM | Per Member Per Month |
| PRAC | Project Rental Assistance Contract |
| QDWI | Qualified Disabled and Working Individual |
| QMB | Qualified Medicare Beneficiary |
| RAP | Rental Assistance Payment |
| RTI | Research Triangle Institute |
| SCHIP | State Children's Health Insurance Program |
| SNF | Skilled Nursing Facility |
| SSA | Social Security Administration |
| SSI | Supplemental Security Income |
| SSN | Social Security Number |
| TRACS | Tenant Rental Assistance Certification System |
EXECUTIVE SUMMARY
Overview
For the U.S. Departments of Health and Human Services (HHS) and Housing and Urban Development (HUD), the Lewin Group and its sub-contractors, Leading Age and the Moran Company, explored the potential for publicly-subsidized senior housing to serve as a platform for efficiently managing the population health of low-income older adults with various levels of physical and mental health risk. We developed a demonstration design and piloted creating a new dataset linking HUD tenant and Medicare/Medicaid claims data in 12 jurisdictions across the country.
Study Objective
This study task explored the feasibility of matching HUD administrative data to the HHS Centers for Medicare and Medicaid Services (CMS) administrative data in order to determine the extent to which this resource could track health and housing outcomes, and whether this approach could reliably support future research and policy analysis.
Data
We focused on 2008 individual-level administrative data provided for the 12 geographic areas from both HUD and CMS. The HUD multifamily and public housing data came from the Tenant Rental Assistance Certification System and the Public and Indian Housing Information Center. Medicare administrative data came from the Medicare Beneficiary Summary File and includes Medicare Parts A, B, and D enrollment, payments, and utilization, as well as information about chronic conditions. The Medicaid Analytic eXtract Person Summary file, based on state submission of Medicaid administrative data, provided enrollment, payment and utilization for Medicaid-covered services.
Study Objectives and Results
We provide a detailed description of the study results in the Summary Report and in Appendix C. The chart below provides a brief overview of the study objectives and corresponding results.
| Objectives | Results |
| Match Rate between HUD and CMS data | Among HUD-assisted individuals age 65 or older in 2008, 93% matched to Medicare based on Social Security number (SSN) only; 85% matched to Medicare when requiring a match on SSN, gender, and date of birth. |
| Estimate HUD-assisted Medicare beneficiaries enrollment in Part D subsidy assistance programs or Medicaid | Health insurance assistance programs for Medicare beneficiaries reduce out-of-pocket health care expenses, which result in savings for HUD. Among HUD-assisted Medicare beneficiaries age 65 years or older:
While we would not expect the proportion to be 100%, as not all HUD-assisted Medicare beneficiaries meet the eligibility requirements for these programs because the income criteria for HUD-assisted housing can be higher than that for health insurance assistance, there may be room for improvement in the enrollment rates. |
| Compare Medicare and Medicaid payment and utilization among Medicare and Medicaid enrollees (MMEs) | Most of our analyses to compare HUD-assisted individuals to unassisted individuals focused on Medicare beneficiaries dually enrolled in Medicaid (MMEs), age 65+ with fee-for-service (FFS) coverage compared to unassisted MME beneficiaries in the community in order to examine comparable groups in terms of economic status because this factor drives social determinants of health, use of services, and resulting payment.Health conditions:
Medicare payments and utilization:
Medicaid payments and utilization:
|
Discussion
This study demonstrates the feasibility and utility of linking HUD tenant data to CMS administrative data. The descriptive results summarized above highlight key areas for future analysis to better understand the health and health care utilization of HUD-assisted elderly individuals enrolled in Medicare. This includes supplementing current data sources with additional CMS data, refining matching algorithms and study samples to better determine HUD-assisted elderly individuals' eligibility and enrollment in Medicare programs, providing distributional analyses, and conducting multivariate regressions to determine if the differences observed in descriptive comparisons remain after adjusting for confounders.
I. INTRODUCTION
A. Study Overview and Task Objectives
The U.S. Department of Health and Human Services (HHS) Office of the Assistant Secretary for Planning and Evaluation's Office of Disability, Aging and Long-Term Care Policy, in partnership with U.S. Department of Housing and Urban Development (HUD) and the HHS Administration for Community Living, engaged the Lewin Group and its sub-contractors, Leading Age Center for Applied Research and the Moran Company to develop design options for a demonstration of targeted, coordinated housing, health and long-term care services and supports for low-income older adults. This project sought to: (1) identify and examine affordable housing with services models that enable low-income older adults to live in affordable, safe, and accessible housing with access to health and supportive services needed to "age in place"; and (2) propose a demonstration design to track and measure outcomes and costs associated with promising housing with services models. This report presents the results of Task 6: Data Analysis. It explores the feasibility of matching HUD administrative data to national health administrative data in order to determine whether health and housing outcomes can be tracked through existing administrative data sources and whether this approach can reliably support future research and policy analysis.
We specifically focused on the feasibility of linking data from the HHS Centers for Medicare and Medicaid Services (CMS) to the HUD individual tenant-level administrative data. CMS data included the Medicare Beneficiary Annual Summary File and the Medicaid Analytic eXtract (MAX) for the 12 geographic areas of interest in this study (see Section III). Given the study objective, we chose geographic areas that have unique public housing with services models. For example, Burlington, Vermont has the "Supports and Services at Home" program that incorporates an interdisciplinary team of community service providers to coordinate participating residents' health and long-term care needs.
This report lays the groundwork for federal efforts to use existing administrative data maintained separately by health and housing agencies to more effectively serve individuals (including elderly and non-elderly persons with disabilities) and communities thatcould benefit from a coordinated housing with services program. In addition, we conducted initial descriptive analyses of the linked datasets to describe the individuals present in both the HUD and CMS data sources and compared them to individuals covered by Medicare and/or Medicaid, but not receiving housing assistance. Understanding the characteristics of individuals and their use of health care services in different housing arrangements will ideally inform policy to promote rational and optimal care.
B. Background
A large and rapidly expanding pool of low-income and modest-income older adults face the dual challenges of finding affordable and safe housing that can also accommodate changing needs as they grow older. Millions of older adults who rent or own their own homes face excessive housing costs and/or live in housing with serious physical problems. In 2011, an estimated 3.9 million older renter households without children had very low incomes (50% or less of area median income (AMI)). Of these households, 37% faced severe housing cost burdens exceeding half their incomes without public housing assistance, and a similar proportion, 36%, did receive assistance.1
A report from the Summit on Aging in Place in Public Housing (2011) stated that 1.3 million older adult renters live in publicly-subsidized housing. These older renters may have increased difficulty as they age, since they may experience a decline in their physical, cognitive, and/or mental health conditions.2 While the majority of these older renters are relatively healthy, Assets and Health Dynamics Among the Oldest Old survey data (Wave 2) show that subsidized older residents report poorer health than unsubsidized renters, more chronic conditions, significantly higher numbers of limitations in their ability to carry out basic activities of daily living (ADLs) and instrumental activities of daily living (IADLs), and less likelihood to live in properties that offer services.3
The current system of multiple payers -- primarily Medicare and Medicaid -- provides few incentives for primary, acute and chronic care providers to collaborate with each other, let alone cooperate with low-income housing or aging and long-term services and supports providers.4 As a result, when many older adults most need integrated services, they experience a highly fragmented and poorly coordinated services system. The ability of older adults with chronic conditions and/or significant disability to continue living independently may be cut short, their health and safety compromised, and public and private health and long-term care costs may skyrocket as a result of premature transfers to more expensive nursing homes and residential care facilities, repeated trips by emergency medical technicians to an individual's home, repeated trips to hospital emergency departments, and frequent hospitalizations.
To address some of these issues, hundreds of publicly assisted largely not-for-profit housing providers and several states and private sector organizations have developed programs to bring enhanced services to residents. Innovative housing providers across the country, working with federal, state, and community partners have, largely at their own initiative, developed many prototypes of publicly assisted housing with enhanced services for older adults. Typically, these properties employ a service coordinator (available through HUD grants and, in some cases, incorporated into the properties operating budget), complemented by a wide array of community partnerships.
The following table provides a guide to HUD and CMS key concepts and terms used throughout this report.
| Guide to Housing Assistance and Medicare and Medicaid Services |
NOTE:
|
| U.S. Department of Housing and Urban Development (HUD) Programs |
HUD provides housing assistance to about 4.6 million low-income households,1 including families with children, older adults, and people with disabilities. Tenant income eligibility is determined on the basis of AMI (generally calculated for metropolitan areas and non-metropolitan counties), adjusted for family size. Low-income families are defined as families whose incomes do not exceed 80% of the AMI and very low-income families are defined as families whose incomes do not exceed 50% of the AMI. Over three-fourths of assisted households in 2009 had extremely low incomes not exceeding 30% of AMI. HUD programs important for this report include:
|
| Centers for Medicare and Medicaid Services (CMS) Programs |
Medicare7,8,9 is a federal program that provides health insurance for older adults and people with disabilities. This program was designed for people age 65 and older. This program is typically an entitlement for older adults who:
The spouse of someone who meets these guidelines is also eligible for Medicare. Those under 65 can qualify for a couple of reasons. One of the major reasons is being entitled to Social Security disability benefits for at least 2 years.There are multiple parts to Medicare, including:
Medicaid10,11 is a public health insurance program for low-income children and adults.12 States administer this program following federal rules, and it is jointly financed by both federal and state governments. The federal minimum standards for eligibility are:
Beyond these federal minimums, states can set their own standards for eligibility within the allowed federal range and can opt to cover additional services. For example, all states provide HCBS to older adults through waivers and many states use the upper income limits of 300% of SSI for these services.Medicaid also covers the Medicare premiums and copayments for low-income Medicare beneficiaries through the MSP. Those with income 100% or less of the FPL receive premium and copayment coverage while those with income 101%-125% of the FPL receive premium coverage only. In addition, some individuals receive full Medicaid benefits for services not included in Medicare, such as assistance with personal care and long stay nursing facility care. Participants who are a part of both programs, MMEs, are often referred to as Dual Eligibles or Duals. |
II. STUDY OBJECTIVES AND RESEARCH QUESTIONS
The specific objectives of Task 6: Data Analysis and the corresponding research questions are outlined below. Although our project focuses on older adults and housing with services, we assessed the feasibility and quality of the match to the Medicare and Medicaid administrative data under Objectives A and B based on all HUD-assisted individuals. For Objectives C and D, related to Medicare enrollment and health care spending and utilization, we restricted our sample to individuals age 65 and older. This resulted in the most representative comparison because the vast majority of individuals age 65 and older have Medicare coverage and the small subset of those age 60-64 with Medicare or Medicaid coverage likely have it due to a disability.
A. Understand Demographic Characteristics of HUD-Assisted Individuals in the 12 Study Jurisdictions
The first component of the study was to understand the characteristics of HUD-assisted individuals--both elderly and non-elderly. We conducted basic descriptive statistics on the HUD individual tenant-level administrative data to answer the following research questions:
- What are the demographic characteristics of HUD-assisted individuals, including age, gender, subsidy type, property type, race, disability status, and living arrangement?
- How do the characteristics vary across year? Across the 12 geographic locations? Across housing subsidy type? Across housing program type?
- What proportion of public and assisted housing properties are "elderly properties"?
- How does this designation vary across the 12 geographic locations?
B. Calculate HUD and Medicare and/or Medicaid Match Rate in the 12 Study Jurisdictions
The second study component used both the HUD and CMS data sources. We linked individuals within the HUD data to the CMS data to answer the following research questions:
- What proportion of HUD-assisted individuals link to Medicare or Medicaid enrollment data ("match rate")?
- How does the match rate vary across age groups? By geography? By housing program type?
- How do older individuals receiving HUD housing assistance and who link to Medicare or Medicaid enrollment data compare demographically to HUD-assisted elderly individuals who do not link to the Medicare or Medicaid data?
C. Estimate the Proportion of HUD-Assisted Medicare Beneficiaries with Enrollment in Part D Subsidy Assistance Programs or Medical Savings Program (i.e., Medicaid)
HUD is interested in understanding what proportion of HUD-assisted Medicare beneficiaries are enrolled in programs that could reduce their out-of-pocket health care expenses and, therefore, reduce HUD's costs.
- What proportion of HUD-assisted Medicare beneficiaries are enrolled in Part D subsidy assistance programs or Medical Savings Program (i.e., Medicaid)?
D. Compare Medicare and Medicaid Payment and Utilization for HUD-Assisted Beneficiaries and Unassisted Beneficiaries in the Community in the 12 Study Jurisdictions
How do HUD-assisted Medicare beneficiaries compare to unassisted beneficiaries in the community? What are the differences in demographic characteristics, Medicare/Medicaid coverage characteristics, health and health care utilization and payments?This summary includes results for this research question for two sub-groups:
- MMEs, age 65+.
- Medicare/No Medicaid, age 65+.
III. DATA
We based the analysis on tenant-level administrative data from HUD and individual-level administrative data from CMS in the table below and described in detail in Appendix A. Note, that while we received HUD and CMS Medicare data for 2007-2009, the majority of our results are based on 2008 as 2009 data was not available for CMS Medicaid data.
| HUD Tenant-Level Administrative Data | CMS Individual-Level Administrative Data | |
| Years | 2007, 2008, & 2009 |
|
| Data Sources | TRACS | Medicare Administrative Data from the Medicare Beneficiary Summary File for 2007-2009
|
| PIH/PIC | Medicaid Administrative Data from the MAX Person Summary file for 2007 & 2008 |
The data were limited to individuals in our 12 geographic areas of interest for this study. As mentioned in the Introduction, given the study objective, we chose geographic areas that have unique public housing with services models:
- New Haven-Milford, Connecticut
- Bridgeport-Stamford-Norwalk, Connecticut
- Milwaukee-Waukesha-West Allis, Wisconsin
- San Francisco-Oakland-Freemont, California
- Boston-Cambridge-Quincy, Massachusetts
- Durham-Chapel Hill, North Carolina
- Richmond, Virginia
- New York-Northern New Jersey-Long Island
- Columbus, Ohio
- Akron, Ohio
- Cleveland, Ohio
- The entire State of Vermont
IV. RESULTS
The results presented below are organized by study objective and based on 2008 -- the most recent year for which we had data on HUD, CMS Medicare, and CMS Medicaid enrollment. Additional results for 2008 are presented in Appendix C. We also produced results for Objectives A and B, and C by year (2007, 2008, and 2009), which are included in Appendix D, all years.
A. Understand Demographic Characteristics of HUD-Assisted Individuals in the 12 Study Jurisdictions
Our sample of HUD-assisted individuals consisted of all individuals that appear in the Tenant Rental Assistance Certification System (TRACS) or Public and Indian Housing (PIH) Information Center (PIC) data at any point in time during 2008 in the 12 study jurisdictions. This included 2,057,893 unique individuals and 967,557 unique household heads that received housing assistance at some point during 2008. The Objective A results are stratified by housing assistance program in Appendix D, all years.
A1. Demographic Characteristics of HUD-Assisted Individuals
Figure 1 presents the demographic characteristics for the HUD-assisted individuals in the 12 study jurisdictions. Some highlights include:
Approximately 19% of the sample was older than 62 years of age with 37% younger than age 18.
The largest proportion of the sample, 38%, was Black non-Hispanic. Approximately 24% were Hispanic, 16% were White non-Hispanic, and 19% were unknown or declined to report.
Over half of the sample (59%) was located in the New York-Northern New Jersey-Long Island area. Nine geographies represent 5% or less of the sample. This distribution is due to our selection of certain geographies. Given the New York City area is the majority of our sample, the individuals living in this area heavily influence the results across all objectives.
| Unique Individuals(N=2,057,893) | ||
| Mean | SD | |
| Age | ||
| All Persons | 34.9 | 25.3 |
| Household Heads | 54.2 | 18.8 |
| N | % | |
| Age group | ||
| 18 | 764,543 | 37.2% |
| 18-44 | 566,059 | 27.5% |
| 45-61 | 327,067 | 15.9% |
| 62-64 | 46,700 | 2.3% |
| 65+ | 352,091 | 17.1% |
| Unknown/declined to report | 1,433 | 0.1% |
| Geographic area | ||
| Vermont | 22,635 | 1.1% |
| New Haven- Milford | 50,201 | 2.4% |
| Bridgeport- Stamford- Norwalk | 35,326 | 1.7% |
| Milwaukee- Waukesha- West Allis | 51,555 | 2.5% |
| San Francisco- Oakland- Fremont | 167,795 | 8.2% |
| Boston- Cambridge- Quincy | 243,601 | 11.8% |
| Durham- Chapel Hill | 17,945 | 0.9% |
| Richmond | 43,196 | 2.1% |
| New York- Northern New Jersey- Long Island | 1,213,201 | 59.0% |
| Columbus | 72,332 | 3.5% |
| Akron | 35,409 | 1.7% |
| Cleveland | 104,697 | 5.1% |
| Race/ethnicity | ||
| White non-Hispanic | 331,944 | 16.1% |
| Hispanic | 489,337 | 23.8% |
| Black non-Hispanic | 773,550 | 37.6% |
| Asian | 56,934 | 2.8% |
| American Indian/Alaskan | 3,699 | 0.2% |
| Hawaiian/Pacific Islander | 2,762 | 0.1% |
| Other non-Hispanic | 259 | 0.0% |
| Mixed non-Hispanic | 275 | 0.0% |
| Unknown/declined to report | 399,133 | 19.4% |
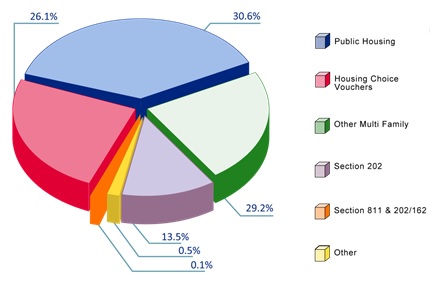
Figure 2 presents the proportion of HUD-assisted individuals by property type for all ages. Figure 3 presents the proportion of HUD-assisted individuals by property type for individuals age 62 years or older.5
FIGURE 2. Distribution of HUD-Assisted Individuals by Property Type in 12 Study Jurisdictions, 2008, All Ages
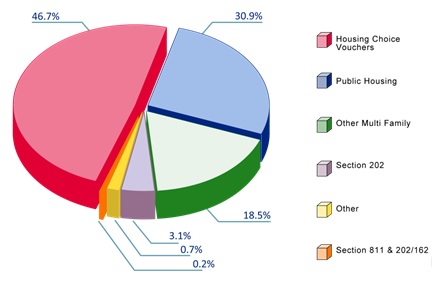
The largest proportion of individuals received Housing Choice Vouchers (47%).
Approximately 31% resided in public housing, while 19% lived in other multifamily properties.
Among individuals age 62 years or older, public housing, other multifamily, and Housing Choice vouchers were the most common (31%, 29%, and 26%), with an additional 14% residing in Section 202 properties.
FIGURE 3. Distribution of HUD-Assisted Individuals by Property Type in 12 Study Jurisdictions, 2008, Age 62+ Years
A2. HUD Elderly Properties
Figure 4 presents the proportion of properties that were defined as elderly6 among all public housing properties (from PIC) and private assisted multifamily properties (from TRACS) within the 12 study jurisdictions. Half of all multifamily properties had an individual age 62 years or older in over 50% of their units. Approximately 42% of all public housing properties were either designated as elderly by public housing authorities (PHAs) or had an individual age 62 years or older in over 50% of their units. Both of these proportions varied greatly by the 12 study jurisdictions, from 30% of multifamily properties in Durham-Chapel Hill, North Carolina to 68% of multifamily properties in Bridgeport-Stamford-Norwalk, Connecticut and only 19% of public housing properties in Cleveland compared to 90% of public housing properties in Vermont (data not shown, see Appendix D).
| Property Types | Number of Properties | Percent of Properties |
| Multifamily elderly properties (reported in TRACS) | 1,811 | 50.0% |
| Public Housing elderly properties (reported in PIC) | 335 | 42.0% |
B. Calculate HUD and Medicare and/or Medicaid Match Rate in the 12 Study Jurisdictions, 2008
B1. Match Rate: HUD-Assisted Individuals to Medicare or Medicaid Enrollment Data
The main objective of this study task was to determine the ability to link HUD-assisted individuals to Medicare and Medicaid administrative data (i.e., enrolled in Medicare or Medicaid health care programs) in the 12 study jurisdictions. We accomplished this objective by calculating two measures that represent the ability to link the HUD and CMS data sources:
Social Security Number (SSN) Match Rate. The proportion of HUD-assisted individuals enrolled in Medicare and/or Medicaid programs determined solely on a matched SSN between the datasets.
Restrictive Match Rate. A fairly conservative method on which we established whether the individuals receiving housing assistance were definitively included in the Medicare and/or Medicaid data by requiring a direct match on SSN, gender, and date of birth.7
Figure 5 presents six separate SSN match rates. We calculated the match rate to Medicaid-only, Medicaid and Medicare, and Medicare only separately for HUD-assisted individuals less than age 65, and individuals age 65 or older. A match is defined as being present in both datasets at any point during 2008.
Approximately 73% of HUD-assisted individuals less than age 65 and 96% of recipients age 65 or older matched to Medicaid, Medicare, or both.
Among HUD-assisted individuals less than age 65, 66% linked to Medicaid-only, 6% link to both Medicare and Medicaid, and 1% link to Medicare only.
Among HUD-assisted individuals age 65 or older, 63% linked to both Medicare and Medicaid and 30% linked to Medicare only. Less than 3% linked to Medicaid-only. It is most likely that the 3% who linked to Medicaid-only are not eligible for Medicare because they or their spouse did not make payroll tax contributions for ten or more years.
FIGURE 5. Medicare and Medicaid SSN Match Rates for HUD-Assisted Individuals, by Age Group, 2008
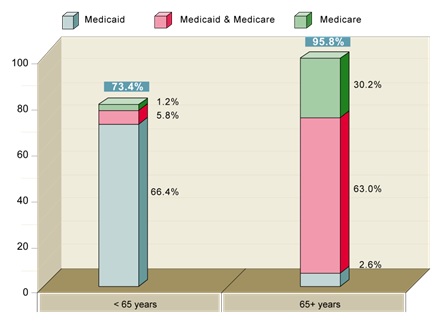
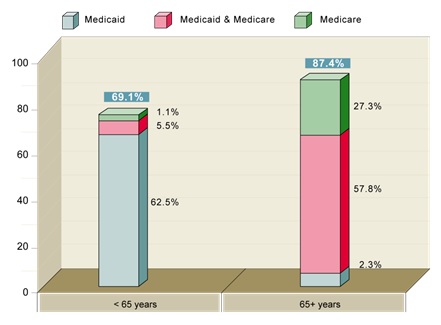
Figure 6 presents the same six match rates as Figure 5 using the restrictive match rate criterion. As expected, the match rate lowered given the more stringent criteria. The match rate for HUD-assisted individuals under age 65 decreased by four percentage points and by nine percentage points for recipients age 65 or older.
Approximately 69% of HUD-assisted individuals less than age 65 and 87% of recipients age 65 or older matched to Medicaid, Medicare, or both.
Among HUD-assisted individuals less than age 65, 63% linked to Medicaid only, 5% link to both Medicare and Medicaid, and 1% link to Medicare only.
Among HUD-assisted individuals age 65 or older, 58% linked to both Medicare and Medicaid and 27% linked to Medicare only. Approximately 2% linked to Medicaid only. It is most likely that the 2% who linked to Medicaid only are not eligible for Medicare because they or their spouse did not pay payroll tax contributions for ten or more years.
FIGURE 6. Medicare and Medicaid Restrictive Match Rate for HUD-Assisted Individuals, by Age Group, 2008
 ]
]
We also calculated the restrictive match rate for over age 65 by property type and geographic area (data not shown, see Appendix D).
While the range of restrictive match rate did not vary widely across property types, the match rate was highest for Section 202 (elderly) properties at 90%. Individuals residing in public housing had the lowest match rate at 84%.
These percentages are also high across geographic areas (86.2% in New York-Northern New Jersey-Long Island to 94.2% in Vermont) with the exception of Richmond, where only 31.2% linked.
The analyses in the remainder of the report rely on the sample that met the restricted match rate criteria. The more conservative restrictive match rate creates a sample for which we can be very confident the HUD-assisted individual was in fact enrolled in Medicare and/or Medicaid.
B2. HUD-Assisted Individuals Matched to CMS Administrative Data Compared to Recipients Who Did Not Match
Next we wanted to better understand the characteristics of HUD-assisted individuals that matched to the CMS administrative data relative to the recipients that did not match using the restrictive approach.
| Linked to 2008 Medicare or Medicaid Enrollment Files(N=305,153) | Did Not Link to 2008 Medicare or Medicaid Enrollment Files(N=44,505) | |||
| N | % | N | % | |
| ||||
| Gender | ||||
| Male | 91,241 | 29.9% | 13,416 | 30.1% |
| Female | 213,912 | 70.1% | 30,965 | 69.6% |
| Unknown/declined to report | 0 | 0.0% | 124 | 0.3% |
| Race/ethnicity | ||||
| White non-Hispanic | 65,942 | 21.6% | 6,462 | 14.5% |
| Hispanic | 46,760 | 15.3% | 8,528 | 19.2% |
| Black non-Hispanic | 48,785 | 16.0% | 10,729 | 24.1% |
| Asian | 11,373 | 3.7% | 1,250 | 2.8% |
| Other | 885 | 0.3% | 103 | 0.2% |
| Unknown/declined to report | 131,408 | 43.1% | 17,433 | 39.2% |
| Property type | ||||
| Public housing | 89,013 | 29.2% | 16,709 | 37.5% |
| Housing Choice Vouchers | 74,796 | 24.5% | 9,005 | 20.2% |
| Other multifamily | 91,469 | 30.0% | 12,836 | 28.8% |
| Section 202 | 48,424 | 15.9% | 5,750 | 12.9% |
| Other multifamily | 298 | 0.1% | 37 | 0.1% |
| Other | 1,153 | 0.4% | 168 | 0.4% |
| Elderly designated property1 | ||||
| Yes | 160,398 | 52.6% | 20,102 | 45.2% |
| No | 69,377 | 22.7% | 15,328 | 34.4% |
| Unknown | 75,378 | 24.7% | 9,075 | 20.4% |
| SSI | ||||
| Receives SSI | 134,484 | 44.1% | 16,944 | 38.1% |
Figure 7 presents a comparison of HUD-assisted individuals age 65 or older8 who were linked to Medicaid or Medicare enrollment files to those that were not linked based on the restrictive match rate. In other words, we compared the 87% of HUD-assisted individuals age 65 or older who linked to the 13% who did not link to any CMS data source. Individuals who linked to Medicare or Medicaid were more likely to be White (22% vs. 15% of individuals who did not link);9 less likely to live in public housing (29% vs. 38%); and more likely to receive Supplemental Security Income (SSI) (44% vs. 38%).
C. Estimate HUD-Assisted Medicare Beneficiaries with Enrollment in Part D Subsidy Assistance Programs or Medical Savings Program (i.e., Medicaid)
As detailed in an October 2012 Center on Budget and Policy Priorities (CBPP) memo,10 HUD-assisted individuals may have unreimbursed medical expenses deducted from their income for the purpose of determining the level of assistance provided by HUD. According to the CBPP, approximately 700,000 assisted households claim such expenses, which increase HUD rental subsidy costs by $400-$500 million per year. Therefore, HUD is interested in understanding what proportion of HUD-assisted Medicare beneficiaries (defined as HUD-assisted individuals who linked to Medicare based on the restrictive match criteria) are enrolled in programs that could reduce their out-of-pocket health care expenses and therefore reduce HUD's costs. These programs include:
Medicare Part D (drug coverage) Low Income Subsidy (LIS). Medicare Part D provides coverage for prescription medications and the LIS program assists beneficiaries with paying the premium and out-of-pocket expenses for their medication.
Medicare Savings Program (MSP). This is more commonly referred to as being a Medicare and Medicaid enrollee (MME) or dually eligible. Medicare beneficiaries may be eligible for Medicaid to assist with out-of-pocket Medicare expenses (premiums and copayments) and to receive Medicaid-covered services that are not covered by Medicare, including and importantly long-term services and supports.
Figure 8 presents the proportion of HUD-assisted Medicare beneficiariesage 65 years or older enrolled in Part D LIS and Medicaid.
Approximately 90% of the Medicare beneficiaries had Part D coverage (data not shown, see Appendix D). Among those with Part D coverage, 80% received premium and out-of-pocket assistance through the LIS Program.
Approximately 68% of Medicare beneficiaries were dually enrolled in Medicare and Medicaid. Almost 89% of those dually enrolled in Medicare and Medicaid were receiving Medicaid assistance with Medicare expenses and fully eligible for Medicaid-covered services.
FIGURE 8. HUD-Assisted Medicare Beneficiaries (Age 65+): Part D LIS Status and Medicaid Participation

It is important to note that the results presented in Figure 8 above are the proportion of all HUD-assisted Medicare beneficiaries age 65+ who match based on the restrictive match criteria. It is not the proportion of HUD-assisted Medicare beneficiaries who are eligible for these programs based on national criteria for Part D LIS and criteria established by each state for Medicaid benefits. In other words, we would not expect the proportion to be 100% as not all HUD-assisted Medicare beneficiaries are eligible for these programs because the income criteria for HUD-assisted housing can be higher than that for health insurance assistance. In fact, among HUD-assisted individuals, an examination of the proportion of Medicare beneficiaries dually enrolled in Medicaid, where enrollment should be automatic for the Medicare Part D prescription drug LIS, found 99% received LIS, while only about one-third of those with Medicare and no Medicaid coverage had this coverage.
D. Compare Medicare and Medicaid Payment and Utilization for HUD-Assisted Beneficiaries and Unassisted Beneficiaries in the Community in the 12 Study Jurisdictions
After we identified the HUD-assisted individuals who were Medicare and/or Medicaid beneficiaries in 2008, the next objective was to compare HUD-assisted Medicare beneficiaries to unassisted beneficiaries in the community with regards to enrollment, chronic conditions, health care payment and utilization. Although our overall study focused on individuals age 62 and older receiving housing assistance, we narrowed this analysis to individuals age 65 and older because the vast majority of individuals age 65 and older have Medicare coverage. Before comparing groups of beneficiaries, we first refined our study sample of Medicare beneficiaries (both HUD-assisted and unassisted beneficiaries in the 12 study jurisdictions).
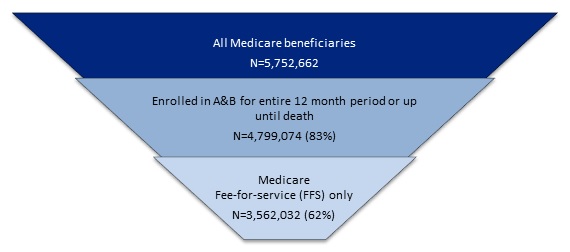
Figure 9 presents a graphical depiction of the inclusion criteria, regardless of age. Medicare beneficiaries had to be enrolled in Part A Hospital and Part B Physician Services for all 12 months of 2008 or up until death and have no Medicare managed care (i.e., Medicare Part C or Medicare Advantage)11 enrollment in 2008. This reduced the sample of Medicare beneficiaries by 38%, down to 3.6 million. Approximately 7% of the Medicare beneficiaries were HUD-assisted individuals and 93% were unassisted in the community.
FIGURE 9. Inclusion Criteria for HUD-Assisted and Unassisted Medicare Beneficiaries for Payment and Utilization Comparison in 12 Jurisdictions, All Ages, 2008
We expected HUD-assisted beneficiaries to differ dramatically from unassisted beneficiaries in the community with regards to health status, utilization, and payment given the differences in demographic factors (e.g., race, income) and Medicare and Medicaid program eligibility due to low income (e.g., Part D LIS and Medicaid participation defined above). This was supported by preliminary comparisons of HUD-assisted Medicare beneficiaries age 65+ and unassisted Medicare beneficiaries age 65+ in the community. We found:
After limiting our sample to HUD-assisted Medicare beneficiaries with continuous enrollment in Medicare Parts A and B with no Medicare managed care during 2008, approximately 70% of HUD-assisted Medicare fee-for-service (FFS) beneficiaries age 65+ were dually enrolled in Medicaid compared to only 13% of unassisted Medicare FFS beneficiaries in the community.
The average total medical and prescription drug per member per month (PMPM) Medicare payment was $1,479 for HUD-assisted Medicare FFS beneficiaries age 65+ compared to only $937 for unassisted Medicare FFS beneficiaries age 65+ in the community.
The higher expenditures for HUD-assisted Medicare beneficiaries likely reflects the much higher proportion of MMEs in the HUD-assisted sample. According to a recent study by the Kaiser Family Foundation, spending for MMEs was 1.8 times higher than for Medicare/No Medicaid counterparts.12 Based on this knowledge, we stratified the Medicare beneficiaries into five sub-groups in an attempt to group similar beneficiaries into distinct samples to reduce variability between the HUD-assisted beneficiaries and the unassisted beneficiaries when comparing their Medicare enrollment characteristics, payments, and utilization. See Appendix C for detail on stratification and definitions for all five sub-groups. In this summary report, we present the results for the following two sub-groups:
Sub-group A1 (MMEs): MMEs, Age 65+, with no Medicare skilled nursing facility (SNF) or Medicaid nursing facility13 use in 2008.
Sub-group C1 (Medicare only): Medicare beneficiaries with no Medicaid enrollment, age 65+, no SNF use in 2008.
D1. Comparison of HUD-Assisted MMEs and Unassisted MMEs in the Community, Age 65+ in 12 Study Jurisdictions, 2008 (Sub-group A1)
In 2008 in the 12 study jurisdictions, there were 112,045 HUD-assisted MMEs and 249,490 unassisted FFS MMEs in the community age 65+. Figure 10, Figure 11, and Figure 12 present the key findings when comparing HUD-assisted MMEs and unassisted MMEs in the community.
Figure 10 compares the count of chronic condition groupings among MMEs. HUD-assisted MMEs, on average, experience greater chronic illness than unassisted MMEs in the community.
HUD-assisted MMEs are more likely to have multiple chronic diseases; 55% have five or more compared to 43% of unassisted MMEs in the community.
The prevalence of eight of the nine chronic condition categories is also higher among HUD-assisted Medicare beneficiaries (data not shown, see Appendix D). The chronic condition groupings are: Cardiovascular; Cancer; Endocrine and Renal; Alzheimer's-related; Depression; Musculoskeletal; Pulmonary; Opthalmic; and, Other (Anemia, Hyperlipidemia, Hyperplasia, Hypertension).
FIGURE 10. Medicare and Medicaid Enrollees (MMEs) with Chronic Conditions (Age 65+), 2008, 12 Study Jurisdictions
[highchart different_values="0" chart_id="93676"]Figure 11 provides a comparison of health care service utilization between HUD-assisted FFS MMEs and FFS unassisted MMEs in the community. HUD-assisted MMEs were higher utilizers of health care services. With the exception of dialysis, the difference in utilization was statistically significant for all health care services.
The higher utilization for HUD-assisted MMEs was most notable for home health visits (31% higher), ambulatory surgery center (ASC) visits (45% higher), other procedures (78% higher), durable medical equipment (DME) (22% higher), and Part B and D drugs (22% and 24% higher, respectively).
HUD-assisted MME beneficiaries also had a 26% higher rate of physician office visits and 13% higher rate of emergency department visits than unassisted MME beneficiaries.
As expected, this higher utilization resulted in 16% higher average medical and pharmacy PMPM Medicare payments for HUD-assisted MME beneficiaries than unassisted MME beneficiaries ($1,222 vs. $1,054) (data not shown, see Appendix C).
| Medicare Services Annual Utilization per 1000 Member Months1 | HUD-Assisted MME(N=112,045) | Non-HUD-Assisted MME(N=249,490) | Ratio of HUD-Assistedvs. Unassisted MMEs |
| Mean | Mean | ||
NOTES:
** p0.01; * p0.05 | |||
| Total admissions | 32.8 | 30.9 | 1.06** |
| Acute stay admissions | 31.4 | 29.4 | 1.07** |
| Other inpatient admissions2 | 1.4 | 1.6 | 0.90** |
| Hospital readmissions | 5.2 | 4.9 | 1.06* |
| Medicare HH visits | 581.5 | 445.5 | 1.30* |
| Medicare hospice days | 36.9 | 208.1 | 0.18* |
| Hospital outpatient visits3 | 686.5 | 590.5 | 1.16** |
| Total ED visits | 58.4 | 51.6 | 1.13** |
| ED visits without an admission | 36.6 | 30.6 | 1.19** |
| ED visits resulting in an admission | 21.9 | 21.0 | 1.04** |
| Physician office visits | 1,652.3 | 1,307.9 | 1.26** |
| ASC visits | 14.5 | 10.0 | 1.45** |
| Dialysis events | 17.0 | 17.3 | 0.98 |
| Anesthesia events | 27.8 | 23.7 | 1.17** |
| Imaging events | 510.5 | 420.1 | 1.21** |
| Test events | 1,762.2 | 1,428.5 | 1.23** |
| Other procedures | 1,464.6 | 821.6 | 1.78** |
| DME | 369.2 | 301.4 | 1.22** |
| Part B drugs | 296.1 | 241.8 | 1.22** |
| Part D4 drugs | 5,080.1 | 4,094.3 | 1.24** |
Figure 12 compares the utilization of Medicaid-covered services14 by FFS HUD-assisted MMEs and unassisted MMEs in the community. HUD-assisted MMEs use a much greater amount of Medicaid-covered services than unassisted MMEs in the community. It should be noted that one driver of the higher utilization may be that a higher proportion of HUD-assisted MMEs were eligible for full Medicaid benefits than unassisted MMEs in the community (91% vs. 85%, respectively):
HUD-assisted MMEs used over 100% more Personal Care services,15 80% more "other HCBS", and over 67% more DME services covered by Medicaid than unassisted MMEs in the community. This suggests that the poorer health status of HUD-assisted MMEs increases their likelihood of needing HCBS and/or relationships between the property management and community supports make these services more available to HUD-assisted individuals.
On the other hand, unassisted MMEs in the community used 60% more Residential Care settings than HUD-assisted MMEs. Residential care settings, including assisted living facilities, have traditionally provided assistance and oversight to persons with physical and mental impairments who cannot or choose not to live at home alone.16
Due to the higher utilization of services, HUD-assisted MMEs Medicaid PMPM of $1,180 was 32% higher than unassisted MMEs PMPM of $895 (data not shown, see Appendix D).
| Medicare Service Utilization per 1000 Member Months | HUD-Assisted MMEswith Medicaid FFS(N=106,764) | Unassisted MMEs withMedicaid FFS(N=227,186) | Ratio of HUD-Assistedvs. Unassisted MMEs |
| Mean | Mean | ||
NOTES:
** p0.01 | |||
| Personal Care services | 4,512.4 | 2,149.1 | 2.09** |
| Residential care | 38.9 | 63.7 | 0.61** |
| DME | 380.0 | 227.7 | 1.67** |
| Other HCBS2 | 3,309.8 | 1,840.6 | 1.79** |
D2. Comparison of HUD-Assisted Medicare/No Medicaid17 Beneficiaries and Unassisted Medicare/No Medicaid Beneficiaries in the Community, Age 65+ in 12 Study Jurisdictions, 2008 (Sub-group C1)
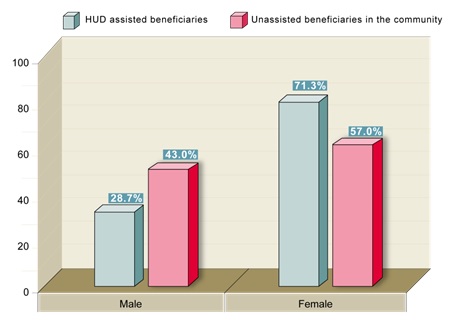
FIGURE 13. HUD-Assisted Medicare/No Medicaid Beneficiaries and Unassisted Medicare/No Medicaid Beneficiaries, 2008, by Gender
During 2008 in the 12 study jurisdictions, there were 46,806 FFS HUD-assisted Medicare/No Medicaid beneficiaries and 2,318,394 unassisted beneficiaries in the community age 65+. Figure 13, Figure 14 and Figure 15 present the key findings when comparing HUD-assisted Medicare beneficiaries and unassisted beneficiaries in the community. Unlike the previous comparison of MMEs, these estimates do not control for income. We would expect that the HUD-assisted Medicare/No Medicaid beneficiaries would generally have lower income and experience greater social and economic constraints to good health than their community counterparts.
FIGURE 14. HUD-Assisted Medicare/No Medicaid Beneficiaries and Unassisted Medicare/No Beneficiaries, 2008, by Race/Ethnicity
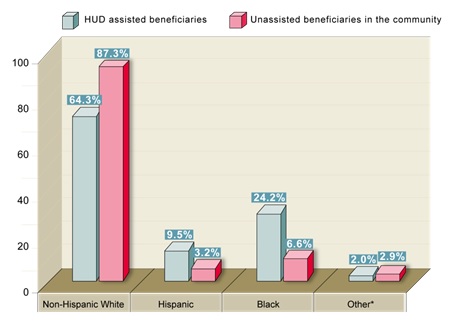
* Other category includes categories of Asian/Pacific Islander, American Indian/Alaska Native, Other, Unknown. Race/ethnicity is based on CMS enrollment data.
Figure 13, Figure 14, and Figure 15 summarize the distribution of HUD-assisted Medicare beneficiaries and unassisted Medicare beneficiaries in the community by various demographic characteristics. As expected, the profile of the HUD-assisted beneficiaries does differ from the unassisted beneficiaries:
Medicare/No Medicaid HUD-assisted beneficiaries are much more likely to be female (71% vs. 57%), Black (24% vs. 7%), and over age 85 years (23% vs. 16%) than unassisted beneficiaries (age data not shown, see Appendix D).
Over 87% of unassisted beneficiaries in the community were non-Hispanic White compared to only 64% of HUD-assisted beneficiaries.
HUD-assisted Medicare/No Medicaid beneficiaries are also more likely to have received Part D LIS (32% vs. 6%) than unassisted beneficiaries in the community.
FIGURE 15. Fee-for-Service HUD-Assisted Medicare/No Medicaid Beneficiaries and Unassisted Medicare/No Medicaid Beneficiaries, 2008, by Part D LIS Status
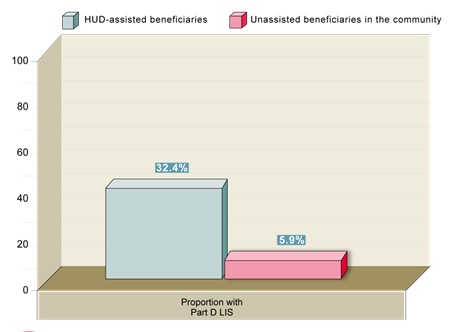
Figure 16 shows the proportion of HUD-assisted and unassisted Medicare beneficiaries with chronic conditions. Unlike the HUD-assisted MMEs age 65 or older (Sub-group A1 above), the HUD-assisted Medicare/No Medicaid beneficiaries of the same age group are more similar to the unassisted Medicare/No Medicaid beneficiaries with regards to health status.
Approximately 14% of HUD-assisted Medicare/No Medicaid beneficiaries had zero chronic conditions compared to 13% of unassisted Medicare/No Medicaid beneficiaries. However, 38% of HUD-assisted Medicare/No Medicaid beneficiaries had five or more conditions compared to only 33% of unassisted Medicare/No Medicaid beneficiaries in the community.
The prevalence of chronic conditions was not consistently higher for the HUD-assisted Medicare/No Medicaid beneficiaries. In fact, the unassisted Medicare/No Medicaid beneficiaries had a higher proportion of cancer (10% vs. 9%) and ophthalmic conditions (37% vs. 32%).
| CCW Condition | HUD-Assisted Medicare Beneficiaries | Unassisted Medicare Beneficiaries | ||
| N | % | N | % | |
| Prevalence of Chronic Conditions | 46,806 | 100.0% | 2,318,394 | 100.0% |
| 0 Conditions | 6,624 | 14.2% | 299,936 | 12.9% |
| 1 Condition | 3,972 | 8.5% | 249,962 | 10.8% |
| 2 Conditions | 5,245 | 11.2% | 312,462 | 13.5% |
| 3 Conditions | 6,472 | 13.8% | 358,219 | 15.5% |
| 4 Conditions | 6,669 | 14.2% | 339,586 | 14.6% |
| 5 or More Conditions | 17,824 | 38.1% | 758,229 | 32.7% |
| Prevalence of Chronic Conditions by Category | ||||
| Cardiovascular | 20,638 | 44.1% | 952,061 | 41.1% |
| Cancer | 4,105 | 8.8% | 238,416 | 10.3% |
| Endocrine and Renal | 19,313 | 41.3% | 800,924 | 34.5% |
| Alzheimer's-related | 3,543 | 7.6% | 179,304 | 7.7% |
| Depression | 3,930 | 8.4% | 167,119 | 7.2% |
| Musculoskeletal | 15,494 | 33.1% | 719,065 | 31.0% |
| Pulmonary | 6,777 | 14.5% | 246,619 | 10.6% |
| Ophthalmic | 15,098 | 32.3% | 847,512 | 36.6% |
| Other (Anemia, Hyperlipidemia, Hyperplasia, Hypertension) | 35,030 | 74.8% | 1,696,319 | 73.2% |
Figure 17 provides a comparison of Medicare health care utilization between the Medicare/No Medicaid HUD-assisted beneficiaries and unassisted beneficiaries in the community. The utilization by HUD-assisted beneficiaries was higher for some services and lower for others when compared to unassisted Medicare/No Medicaid beneficiaries. In particular:
HUD-assisted Medicare/No Medicaid beneficiaries used 42% more emergency room visits per 1000 member months than unassisted beneficiaries.
The admission rate was 19% higher and the readmission rate was 17% higher for HUD-assisted Medicare/No Medicaid beneficiaries.
On the other hand, HUD-assisted Medicare/No Medicaid beneficiaries were more likely to not have any office visits. Approximately 13% of HUD-assisted beneficiaries did not have any office visits during 2008 compared to 9% of unassisted Medicare/No Medicaid beneficiaries (data not shown, see Appendix D).
Overall, the Medicare PMPM was 8% higher for HUD-assisted Medicare/No Medicaid beneficiaries than unassisted Medicare/No Medicaid beneficiaries ($617 vs. $574).
| Medicare Services Annual Utilization per 1000 Member Months | HUD-Assisted Medicare Beneficiaries(N=46,806) | Unassisted Medicare Beneficiaries(N=2,318,394) | Ratio of HUD-Assisteds. Unassisted |
| Mean | Mean | ||
** p0.01; * p0.05 | |||
| Total Admissions | 23.0 | 19.3 | 1.19** |
| Acute stay admissions | 21.7 | 18.2 | 1.19** |
| Other inpatient admissions1 | 1.3 | 1.1 | 1.20** |
| Hospital Readmissions | 2.7 | 2.3 | 1.17** |
| Medicare HH visits | 220.5 | 136.0 | 1.62** |
| Medicare hospice days | 36.5 | 77.6 | 0.47** |
| Total outpatient visits | 444.8 | 409.5 | 1.09** |
| Total ED visits | 43.0 | 30.4 | 1.42** |
| ED visits without an admission | 27.2 | 18.8 | 1.45** |
| ED visits resulting in an admission | 15.8 | 11.6 | 1.37** |
| Physician office visits | 1,145.2 | 1,129.1 | 1.01* |
| ASC visits | 12.7 | 16.0 | 0.79** |
| Dialysis events | 6.5 | 4.8 | 1.36** |
| Anesthesia events | 25.9 | 29.2 | 0.89** |
| Imaging events | 378.2 | 382.2 | 0.99* |
| Test events | 1,347.0 | 1,416.9 | 0.95** |
| Other procedures | 527.2 | 635.4 | 0.83** |
| DME | 180.7 | 139.0 | 1.30** |
| Part B Drugs | 205.7 | 242.2 | 0.85** |
| Part D Drugs | 2983.9 | 2496.0 | 1.20** |
V. DISCUSSION
To our knowledge, this study was the first attempt to link the HUD individual tenant-level and CMS beneficiary level administrative data (enrollment and payment and utilization claims data). This study demonstrates the feasibility of linking these rich data sources to conduct numerous informative analyses that can shed light on the advisability of investing in programs that might improve the health and well-being of individuals with HUD-assisted housing. This study also provides descriptive comparisons of HUD-assisted Medicare beneficiaries to unassisted Medicare beneficiaries, highlighting areas of potential future analyses.
A. Summary of Results
Match Rate
We found that among HUD-assisted individuals age 65 or older in 2008, 93% matched to Medicare based on SSN only; 85% matched to Medicare when requiring a match on SSN, gender, and date of birth.
HUD-Assisted Medicare Beneficiaries Enrollment in Part D Subsidy Assistance Programs or Medicaid
Some HUD-assisted Medicare beneficiaries age 65 and older not enrolled in programs that could reduce their out-of-pocket health care expenses, such as the Medicare Part D (drug coverage) LIS and MSP (being an MME, may be costing HUD). Approximately 68% of HUD-assisted Medicare beneficiaries were dually enrolled in Medicare and Medicaid. Among HUD-assisted Medicare beneficiaries with Part D coverage, 80% received premium and out-of-pocket assistance. We would not expect the proportion to be 100% as not all HUD-assisted Medicare beneficiaries are eligible for these programs because the income criteria for HUD-assisted housing can be higher than that for health insurance assistance. We plan to examine the issue of participation among eligible individuals in future analyses.
Compare Medicare and Medicaid Payment and Utilization
The average total FFS medical and prescription drug PMPM Medicare paid amount was $1,479 for HUD-assisted Medicare beneficiaries age 65 and older compared to only $937 for unassisted Medicare beneficiaries in the community. The higher expenditures for HUD-assisted Medicare beneficiaries likely reflects the much higher proportion of MMEs in the HUD-assisted sample than in the unassisted beneficiaries in the community (70% vs. 13%), as spending for MMEs is almost two times higher than for Medicare/No Medicaid counterparts.
Given the difference in demographic characteristics, health conditions, and MME enrollment among HUD-assisted beneficiaries and unassisted beneficiaries in the community, we created similar sub-groups for comparison, including MMEs age 65+ with no SNF or nursing facility use and Medicare/No Medicaid age 65+ with no SNF use.
Fee-for-Service MME, Age 65+, No SNF/Nursing Facility Use
HUD-assisted MMEs age 65+ had more chronic conditions which translated into higher health care utilization and payments than unassisted MMEs in the community. HUD-assisted MME beneficiaries' average Medicare FFS PMPM was $1,222 compared to $1,054 PMPM for unassisted beneficiaries. This was driven by higher utilization for all services, with the exception of hospice. Most notably, HUD-assisted MMEs had more home health visits (31% higher), ASC visits (45% higher), physician office visits (26%), and emergency department visits (13%). These results are strictly descriptive. In other words, they are not adjusted for demographic characteristics or health care conditions beyond MME status that are known to be associated with health care utilization.
We found similar results when comparing Medicaid-covered FFS health care service utilization and payment by MMEs. HUD-assisted MMEs Medicaid FFS average PMPM was 32% higher than unassisted MMEs ($1,180 vs. $895). HUD-assisted MMEs used over 200% more Personal Care services, 80% more "other HCBS", and over 67% more DME services covered by Medicaid than unassisted MMEs in the community. This suggests that the poorer health status of HUD-assisted MMEs increases their likelihood of needing HCBS and/or relationships between the property management and community supports make these services more available to HUD-assisted individuals. On the other hand, unassisted MMEs in the community used 60% more Residential Care services, which includes assisted living, than HUD-assisted MMEs.
Fee-for-Service Medicare/No Medicaid Beneficiaries, Age 65+
While the comparison among MMEs found that HUD-assisted beneficiaries had more chronic conditions and higher health care utilization and Medicare payment almost across all health care services, the results of the Medicare/No Medicaid beneficiary comparison was mixed. Ultimately, HUD-assisted Medicare/No Medicaid beneficiaries had 8% higher Medicare PMPM than unassisted beneficiaries. The HUD-assisted FFS Medicare/No Medicaid beneficiaries had substantially higher utilization of costly services. HUD-assisted beneficiaries used 42% more emergency room visits, 19% more admissions, and had a 17% higher readmission rate. On the other hand, 87% of HUD-assisted beneficiaries had a physician office visit compared to 91% of unassisted beneficiaries. Unlike the previous comparison of MMEs, these estimates do not control for income. We would expect that the HUD-assisted Medicare/No Medicaid beneficiaries would generally have lower income and experience greater social and economic constraints to good health than their community counterparts. Similar to above, these results are descriptive only and, therefore, additional analyses would need to be conducted to determine if the results remain when controlling for differences among the two samples.
B. Limitations
While this study provides insight into the feasibility of linking HUD and CMS administrative data and a preliminary analysis of health and health care utilization among elderly HUD-assisted individuals who are Medicare beneficiaries, this study is not without limitations. First, because New York represents over half the individuals studied, the differences in New York's assisted population could account for a number of the observed differences. Thus, the findings of this report are only suggestive of future paths for research. Second, the Medicare plan paid amounts are not standardized for geographic differences in payment rates. Therefore, care must be used when comparing average payment for a particular service across the geographies. However, the distribution by the 12 geographies of the HUD-assisted beneficiaries and the unassisted beneficiaries was similar in our datasets reducing concerns about payments being driven by differences in geography. Third, we were unable to identify all nursing facility stays, regardless of payer, with our current data sources. Therefore, we had to eliminate any Medicare beneficiaries with any Medicaid nursing facility or Medicare SNF stay as a proxy for nursing facility use. While this only reduced our Medicare/No Medicaid sample by 5%, it reduced our sample of MMEs by 19%.
Finally, our analyses are descriptive and no policy recommendations should be derived based on these results alone. The results are, however, a starting point. This research demonstrates that it is feasible to match health and housing agency administrative data and suggests that while we have much to learn about the relationship between housing and health, the methods demonstrated here can be used to build that knowledge cost-effectively and in ways that may ultimately improve both housing and health program effectiveness. See future analysis for recommendations related to addressing these limitations.
C. Future Analysis
This study demonstrates that it is feasible to link HUD tenant data to CMS administrative data. The descriptive results summarized above highlight key areas for future analysis to better understand the health and health care utilization of elderly HUD-assisted individuals enrolled in Medicare. This includes supplementing current data sources with additional CMS data, refining matching algorithms and study samples to better determine HUD-assisted individuals' eligibility and enrollment in Medicare programs, and conducting multivariate regressions to determine if the differences observed in descriptive comparisons remain after adjusting for confounders.
Refine match algorithm. Currently, we matched the datasets based on SSN and then SSN, gender, and date of birth without any discrepancies. We can refine the algorithms to require more than just a match on SSN, but not be as conservative as the "restrictive match." For instance, we may want to allow some differences in date of birth (i.e., consider it a match if mm/yy aligns).
Look more closely at the eligibility/enrollment issue to estimate missed opportunities for HUD-assisted elderly individuals to enroll in CMS programs. As highlighted above, we calculated the proportion of all HUD-assisted Medicare beneficiaries, age 65 or older, receiving Part D LIS and dually enrolled in Medicaid. Future analyses could limit the denominator to HUD-assisted beneficiaries eligible for the Part D LIS program and Medicaid program separately to determine what proportion of those eligible were enrolled (i.e., look at income in HUD data vs. enrollment in Medical Savings Program, for example). This analysis could assist HUD in identifying if under-enrollment among those eligible is a missed opportunity for HUD-assisted individuals and better estimate the potential cost savings to HUD of increasing enrollment into these programs.
Conduct multivariate regressions to determine if the differences observed in descriptive analyses above remain after adjusting for potential confounders available in the HUD and CMS data sources (e.g., race/ethnicity, age, geography, presence of chronic conditions, market characteristics).
Update analysis with more recent data. The current analysis is based on 2008 data. While we had 2009 and 2010 Medicare data, 2008 was the most recent year of Medicaid data. We could update the analysis, with the exception of Medicaid-covered service comparison, on 2010 data.
Add to existing data. We recommend appending the Minimum Data Set (MDS) detailing the utilization of Nursing Facility services, regardless of payer (Medicare, Medicaid, private payer) and the Timeline file. MDS would allow us to determine which HUD-assisted Medicare beneficiaries used nursing facility services compared to unassisted Medicare beneficiaries. The Timeline file creates a flag for each day of the year for each Medicare beneficiary. Each day is assigned as: community, community with home health care, nursing facility, SNF, inpatient, and death. This data would allow us to look at key events and paths following the event (e.g., hospital stay) and the associated payments. Finally, we suggest expanding this analysis to the entire nation. As mentioned previously, one limitation of this analysis is it is heavily influenced by the New York City metropolitan area and it is unknown if any findings are representative of HUD-assisted elderly housing recipients nationally.
Appendices
TABLE OF CONTENTS
- APPENDIX A: DATA SOURCES AND VARIABLE DEFINITIONS
- Introduction
- A. Data Sources
- B. Variable Definitions
- APPENDIX B: STUDY SAMPLES AND ANALYTIC APPROACH
- A. Study Samples
- B. Analytic Approach
- APPENDIX C: 2008 DETAILED RESULTS
- Introduction
- A. Understand Demographic Characteristics of HUD-Assisted Individuals in the 12 Study Jurisdictions
- B. Calculate HUD and Medicare and/or Medicaid Match Rate in the 12 Study Jurisdictions, 2008
- C. Estimate Proportion of HUD-Assisted Medicare Beneficiaries with Enrollment in Part D Subsidy Assistance Programs or Medical Savings Program
- D. Compare Medicare and Medicaid Payment and Utilization for HUD-Assisted Beneficiaries and Unassisted Beneficiaries in the Community in the 12 Study Jurisdictions
- APPENDIX D: SUPPLEMENTAL RESULTS, ALL YEARS
- Objective A: Understand Demographic Characteristics of HUD-Assisted Individuals/Households in the 12 Study Jurisdictions
- Objective B: Calculate Number of HUD-Assisted Individual Medicare and/or Medicaid Match Rate in the 12 Study Jurisdictions, 2008
- Objective C: Estimate HUD-Assisted Medicare Beneficiaries with Enrollment in Part D Subsidy Assistance Programs of Medical Savings Program
- Objective D: Compare Medicare and Medicaid Cost and Utilization for HUD-Assisted Medicare Beneficiaries and Unassisted Beneficiaries in the Community in the 12 Study Jurisdictions
- Part D LIS Enrollment
- LIST OF FIGURES
- FIGURE B1: Inclusion Criteria for HUD-Assisted and Unassisted Medicare Beneficiaries for Payment and Utilization Comparison, All Ages
- FIGURE C1: Inclusion Criteria for HUD-Assisted and Unassisted Medicare Beneficiaries for Payment and Utilization Comparison
- LIST OF TABLES
- TABLE A1: Property Type Variable Definition
- TABLE A2: Assignment of Chronic Conditions into 9 Chronic Condition Groups
- TABLE A3: Medicare Health Care Utilization Variable Definitions
- TABLE A4: Medicare Health Care Spending Variable Definitions
- TABLE B1: HUD-Assisted Individuals 2008 Unique Observations
- TABLE C1: Demographic Characteristics of HUD-Assisted Individuals, 2008, 12 Study Jurisdictions
- TABLE C2: Living Arrangement, All Ages and Age 62+ Years
- TABLE C3: Living Arrangement, Household Level, All Ages
- TABLE C4: Full and Partial HUD Housing Assistance, 2008, by Age Group
- TABLE C5: Proportion of HUD-Assisted Properties in 12 Study Jurisdictions Defined as "Elderly"
- TABLE C6: Medicare and Medicaid SSN and Restrictive Match Rates for HUD-Assisted Individuals, 2008, by Age Group
- TABLE C7: Medicare and Medicaid SSN and Restrictive Match Rates for HUD-Assisted Household Heads Receiving SSI, 2008, by Age Group
- TABLE C8: Comparison of HUD-Assisted Individuals Who Linked to Medicare or Medicaid, 2008, by Age Group
- TABLE C9: HUD-Assisted Medicare Beneficiary Enrollment in Part D LIS, 2008
- TABLE C10: HUD-Assisted Medicare Beneficiary Enrollment in Medicaid and Medicaid Coverage Characteristics, 2008
- TABLE C11: Five Sub-groups for Comparison of Health and Health Care Utilization Among HUD-Assisted Beneficiaries and Unassisted Beneficiaries in the Community
- TABLE C12: HUD-Assisted and Unassisted MME Demographic Characteristics
- TABLE C13: HUD-Assisted and Unassisted MME Medicare and Medicaid Enrollment Characteristics
- TABLE C14: MMEs with Chronic Condition Count and Prevalence, Age 65+, 2008, 12 Study Jurisdictions
- TABLE C15: Comparison of HUD-Assisted MME and Unassisted MME Medicare Health Care Utilization
- TABLE C16: Comparison of HUD-Assisted MME and Unassisted MME Medicaid Health Care Utilization per 1000 Member Months
- TABLE C17: Comparison of HUD-Assisted MME and Unassisted MEE Medicaid Health Care Utilization, Proportion of MMEs with Any Use
- TABLE C18: HUD-Assisted Medicare/No Medicaid Beneficiaries and Unassisted Beneficiaries, Age 65+, 2008, by Demographic and Coverage Characteristics
- TABLE C19: HUD-Assisted Medicare/No Medicaid and Unassisted Beneficiaries with Chronic Condition Count and Prevalence, Age 65+, 2008, 12 Study Jurisdictions
- TABLE C20: Comparison of HUD-Assisted Medicare/No Medicaid Beneficiaries and Unassisted Medicare/No Medicaid Beneficiaries' Medicare Health Care Utilization
- TABLE D-A1: HUD-Assisted Individuals Full vs. Partial Year, by Year (All Ages)
- TABLE D-A2: HUD-Assisted Individuals Full vs. Partial Year, by Year (Age 62+)
- TABLE D-A3: HUD-Assisted Individuals Full vs. Partial Year, by Year (Age 65+)
- TABLE D-A4: HUD-Assisted Individuals Across Consecutive Years Full vs. Partial
- TABLE D-A5: Living Arrangement, HUD-Assisted Individuals, All Ages and Age 62+ Years
- TABLE D-A6: Living Arrangement, HUD-Assisted Households, All Ages
- TABLE D-A7a: HUD-Assisted Individual Demographics, 2008
- TABLE D-A7b: HUD-Assisted Individuals Demographics, 2007-2009
- TABLE D-A8: HUD-Assisted Individual Demographics by Geographic Area
- TABLE D-A9: Demographics by Age Group
- TABLE D-A10: Demographics by Property Type
- TABLE D-A11: Demographics by Subside Type
- TABLE D-A12: Number and Proportion of TRACS Properties by Proportion of Households with at Least One Individual Age 62+
- TABLE D-A13: Number and Proportion of TRACS Properties by Proportion of Households with at Least One Individual Age 62+ by Geographic Location
- TABLE D-A14: Number and Proportion of PIC Properties by Proportion of Households with at Least One Individual Age 62+
- TABLE D-A15: Number and Proportion of PIC Properties by Proportion of Households with at Least One Individual Age 62+ or Designated Elderly by Geographic Location
- TABLE D-B1: Medicare and Medicaid SSN and Restrictive Match Rates for HUD-Assisted Individuals, 2008, by Age Group
- TABLE D-B2: Medicare and Medicaid SSN and Restrictive Match Rates for HUD-Assisted Household Heads Receiving SSI, 2008
- TABLE D-B3: Restrictive Match Rates: All Ages
- TABLE D-B4: Restrictive Match Rates: 62 Years of Age
- TABLE D-B5: Restrictive Match Rates: Age 62 to 64
- TABLE D-B6: Restrictive Match Rates: Age 65+
- TABLE D-B7: Restrictive Match Rates: Heads of Household, All Ages
- TABLE D-B8: Restrictive Match Rates: Heads of Household, 62 Years of Age
- TABLE D-B9: Restrictive Match Rates: Heads of Household, Age 62 to 64
- TABLE D-B10: Restrictive Match Rates: Heads of Household, Age 65+
- TABLE D-B11: Restrictive Match Rates: Heads of Household, Receiving SSI
- TABLE D-B12: Comparison of HUD-Assisted Individuals Who Linked to Medicare or Medicaid by Age Group, 2008
- TABLE D-C1: Health Insurance Characteristics of Those that Link by Year by Age
- TABLE D-C2: Health Insurance Characteristics of HUD Heads of Households Receiving SSI that Link in 2008 by Age
- TABLE D-D1: Final 2008 Samples for Utilization and Cost Analysis
- TABLE D-D2: Final 2008 Samples Limited to Individual with Medicaid Fee for Service -- Managed Care
- TABLE D-D.A1: Demographic and Medicare Health Insurance Characteristics of HUD-Assisted Beneficiaries vs. Unassisted Beneficiaries, 2008
- TABLE D-D.A2: Prevalence of CCW Conditions Among HUD-Assisted Beneficiaries vs. Unassisted Beneficiaries
- TABLE D-D.A3: Medicare Health Care Utilization per 1000 Member Months
- TABLE D-D.A4: Medicare and Beneficiary Health Care Costs
- TABLE D-D.A1.1: Demographic and Medicare Health Insurance Characteristics of HUD-Assisted Beneficiaries vs. Unassisted Beneficiaries 2008
- TABLE D-D.A1.2: Prevalence of CCW Conditions Among HUD-Assisted Beneficiaries vs. Unassisted Beneficiaries
- TABLE D-D.A1.3: Medicare Health Care Utilization per 1000 Member Months
- TABLE D-D.A1.4: Medicare and Beneficiary Health Care Costs
- TABLE D-D.B1: Demographic and Medicare Health Insurance Characteristics of HUD-Assisted Beneficiaries vs. Unassisted Beneficiaries 2008
- TABLE D-D.B2: Prevalence of CCW Conditions Among HUD-Assisted Beneficiaries vs. Unassisted Beneficiaries
- TABLE D-D.B3: Medicare Health Care Utilization per 1000 Member Months
- TABLE D-D.B4: Medicare and Beneficiary Health Care Costs
- TABLE D-D.C1: Demographic and Medicare Health Insurance Characteristics of HUD-Assisted Beneficiaries vs. Unassisted Beneficiaries 2008
- TABLE D-D.C2: Prevalence of CCW Conditions Among HUD-Assisted Beneficiaries vs. Unassisted Beneficiaries
- TABLE D-D.C3: Medicare Health Care Utilization per 1000 Member Months
- TABLE D-D.C4: Medicare and Beneficiary Health Care Costs
- TABLE D-D.C1.1: Demographic and Medicare Health Insurance Characteristics of HUD-Assisted Beneficiaries vs. Unassisted Beneficiaries 2008
- TABLE D-D.C1.2: Prevalence of CCW Conditions Among HUD-Assisted Beneficiaries vs. Unassisted Beneficiaries
- TABLE D-D.C1.3: Medicare Health Care Utilization per 1000 Member Months
- TABLE D-D.C1.4: Medicare and Beneficiary Health Care Costs
- TABLE D1: Proportion of Beneficiaries with Part D Coverage, Enrolled in LIS
APPENDIX A. DATA SOURCES AND VARIABLE DEFINITIONS
Introduction
The following table provides a guide to HUD and CMS key concepts and terms.
| Guide to Housing Assistance and Medicare and Medicaid Services | |||
NOTES:
| |||
| U.S. Department of Housing and Urban Development (HUD) Programs | |||
HUD provides housing assistance to about 4.6 million low-income households,1 including families with children, older adults, and people with disabilities. Tenant income eligibility is determined on the basis of AMI (generally calculated for metropolitan areas and non-metropolitan counties), adjusted for family size. Low-income families are defined as families whose incomes do not exceed 80% of the AMI and very low-income families are defined as families whose incomes do not exceed 50% of the AMI. Over three-fourths of assisted households in 2009 had extremely low incomes not exceeding 30% of AMI. HUD programs important for this report include:
| |||
| Centers for Medicare and Medicaid Services (CMS) Programs | |||
Medicare7,8,9 is a federal program that provides health insurance for older adults and people with disabilities. This program was designed for people age 65 and older. This program is typically an entitlement for older adults who:
The spouse of someone who meets these guidelines is also eligible for Medicare. Those under 65 can qualify for a couple of reasons. One of the major reasons is being entitled to Social Security disability benefits for at least two years.There are multiple parts to Medicare, including:
Medicaid10,11 is a public health insurance program for low-income children and adults.12 States administer this program following federal rules, and it is jointly financed by both federal and state governments. The federal minimum standards for eligibility are:
Beyond these federal minimums, states can set their own standards for eligibility within the allowed federal range and can opt to cover additional services. For example, all states provide HCBS to older adults through waivers and many states use the upper income limits of 300% of SSI for these services.Medicaid also covers the Medicare premiums and copayments for low-income Medicare beneficiaries through the MSP. Those with income 100% or less of the FPL receive premium and copayment coverage while those with income 101-125% of the FPL receive premium coverage only.Participants who are a part of both programs, MMEs, are often referred to as Dual Eligibles or Duals. In addition, some individuals receive full Medicaid benefits for services not included in Medicare, such as assistance with personal care and long stay nursing facility care. | |||
A. Data Sources
We based the analysis on individual-level administrative data from both HUD and CMS described in detail below.
1. HUD Individual-Level Administrative Data
We received individual-level administrative data from HUD for 2007, 2008, and 2009. The data originated from two HUD data systems. Given the study objective, we chose geographic areas that have unique public housing with services models.
The data were limited to individuals in our 12 geographic areas of interest:
- New Haven-Milford, Connecticut
- Bridgeport-Stamford-Norwalk, Connecticut
- Milwaukee-Waukesha-West Allis, Wisconsin
- San Francisco-Oakland-Fremont, California
- Boston-Cambridge-Quincy, Massachusetts
- Durham-Chapel Hill, North Carolina
- Richmond, Virginia
- New York-Northern New Jersey-Long Island
- Columbus, Ohio
- Akron, Ohio
- Cleveland, Ohio
- The entire State of Vermont
Tenant Rental Assistance Certification System (TRACS)
The TRACS system collects certified tenant data from owners and management agents of privately owned multifamily housing projects, as well as from local PHAs, and state housing agencies acting as subsidy contract administrators for HUD. The programs covered in TRACS include: Section 8, Rent supplement, Rental Assistance Payment (RAP), Section 236 (Interest Reduction and RAPs), Section 211 Below-Market Interest Rate (BMIR) mortgage insurance, Section 202 Project Rental Assistance Contract (PRAC), Section 811 PRAC, and Section 202/162 Project Assistance Contract (PAC). Note that there are two Section 202 categories. A small number of 202 properties contain units for non-elderly disabled that were funded with rental assistance created by Section 162 of the Housing and Community Development Act of 1987. Section 162 has been superseded by the Section 811 program, which supports housing for disabled individuals. Data contain information on both an individual level (for each individual who resides in the household) and a household level.
Public and Indian Housing (PIH) Information System (PIC)
PHAs regularly collect and electronically submit information to HUD about the households they assist, and the housing assistance that is provided. This study limited its review of housing assistance to the following programs administered by HUD: Section 8 Certificates, Mod Rehab, Public Housing, and Section 8 Vouchers, Multifamily. Data were available for the head of household and each individual that resides in the household.
As described in Appendix B, we combined the TRACS and PIC data into one dataset for our sample. For individuals that appear in both datasets (across all three years this was 38,326 individuals, or 1.54%), we created only one observation per individual based on the PIC data. Individuals were excluded if an individual's move out date in a given year occurred prior to the current data year (N=194,674).
2. CMS Individual-Level Administrative Data
We received individual-level administrative data from CMS for both Medicare and Medicaid. This included information on enrollment, eligibility, presence of chronic conditions, health care payments, and health care use for individuals covered by Medicare and/or Medicaid who resided in any of our 12 geographic areas of interest. We received the most recent data available for the data sources: 2007-2009 for Medicare data and 2007 and 2008 for Medicaid data. Note, that while we received HUD and CMS Medicare data for 2007-2009, given 2009 data was not available for CMS Medicaid data, the majority of our results are based on 2008.
a. Medicare administrative data
We received three segments of the Medicare Beneficiary Summary File for each year of 2007-2009. Data contain information on the individual level for any Medicare beneficiary that had coverage at any point in time during the four year period. The three segments included:
Parts A, B, and D. This file contains information on the beneficiary's demographic, enrollment and eligibility for Medicare coverage. For example, variables include gender, race, first date of Medicare coverage, date of death if applicable, length of Medicare enrollment, indicatorfor any Medicare managed care coverage, indicator for Part D coverage, and number of months eligible for both Medicare and Medicaid.
Chronic Conditions. This file contains flags for 28 chronic conditions based on validated criteria, as defined and identified by CMS. Example conditions include acute myocardial infarction, hypertension, cancers, and Alzheimer's. For each of the 28 conditions, the file includes a year-end flag, mid-year flag, and the first date of occurrence for the condition.
Cost and Use. This file includes the total utilization, Medicare payments, and beneficiary payments for the given year by type of health care service for each beneficiary. Examples of health care services include utilization of outpatient emergency room, acute inpatient hospital, SNF days covered by Medicare, imaging, and DME.
b. Medicaid Administrative Data
We received the MAX Person Summary file for 2007 and 2008. The Person Summary file contains demographic characteristics, Medicaid enrollment, payment, and utilization variables for each beneficiary that had Medicaid coverage at any point in time during the calendar year.
B. Variable Definitions
The variables are organized by study objective and data source. We created the variables for each year of data.
1. Demographic Characteristics of HUD-Assisted Housing Residents
The variables below were based on information in the HUD TRACs and PIC datasets. Each variable was created by year for all HUD-assisted housing residents in the 12 geographic areas of interest. The level of observation was beneficiary year. Variables were created for each year of HUD data -- 2007, 2008, and 2009.
Race/Ethnicity. Created using the fields from TRACS (RACE_WHITE, RACE_AMRIND_ALKNTV, RACE_ASIAN, RACE_BLCK_AFR_AMR, RACE_HAWAIIAN_PI, RACE_OTHER, and RACE_DECLND_TO_RPT) and PIC (MBR_ETHNICITY, WHITE_IND, BLACK_IND, A_INDIAN_ALASKAN_IND, ASIAN_IND, and HAWAIIAN_PACIFIC_IND). Categories are: White/non-Hispanic, Black, Asian, Hispanic, North American Native, Other and Unknown/did not report.
Living Arrangement (individual level). Original values in the data included: Head of Household, spouse, child, other adult, foster child, adult co-head, live-in caretaker, other person >18 years old or full-time student, full-time student 18+, other youth under 18, did not report. We combined values to create sub-groups of interest. The categories were assigned as follows: If there was one person in a household, then they were marked as living alone. If there were two people in a household and one of them was a spouse, then each person in the household was marked as living with a spouse only. If there was a live-in aide in the household then everyone in the household was marked as living with a live-in aide. If there was more than one person in the household and one of the persons was a youth, foster youth, or student, and there was no live-in aide, then everyone in the household was marked as living with children. If there was more than one person in the household and there were no youths and no live-in aides and the people in the household were adults, co-heads, or foster adults, then everyone in the household was marked as living with other adults. If the people in the household had responses missing or other responses to their relationship status question (e.g., not spouse, child, student, live-in aide, etc.) then everyone in the household was marked as other living arrangement.
Living Arrangement (household level). Households are determined to be households according to the SSN of the head of household. Each person in a household is grouped together by the SSN of the household head. After grouping all of the households, the living arrangement by household was determined. Living arrangement at the household level was assigned the same way as the individual level living arrangement variable (see above). If a household appeared in both the TRACS and PIC data in the same year and they had differing living arrangements, then the household's living arrangement was marked as unknown.
Household Heads. Heads of household are noted in both the TRACS and PIC data in relationship fields. If a person selected head of household ("H"), then they were considered a household head.
Disability or Handicapped Status. Disability was set to Y/N/Not reported. The PIC field of "disability_ind" was a direct map to this variable. The TRACS data was mapped using the "special status" field. If a person's SPECIAL_STATUS_CD contained an "H" (handicapped) response, they were considered disabled, regardless of other SPECIAL_STATUS_CD responses. For example, a person could have a special status of "ESH", meaning they were an elderly (E) student (S) who was handicapped (H). Whenever handicapped (H) was one of the responses, they were considered disabled.
Gender. We utilized the gender variable in TRACS/PIC dataset. Values include: male, female, unknown/did not report.
Age. Age was calculated for each year. The age was calculated as the year of data (i.e., 2007, 2008) minus the birth year. Age in 2009 was used as the default when looking at individuals in all three years. If a person's age was not available in the 2009 data, their age in 2008 or 2007 was used and the appropriate amount of years were added to determine what their age would be in 2009. Two age group variables were created based on this variable: 0-18, 18-44, 45-61, 62-64,18 65+, unknown/not reported; and 62, 62-64, 65+, unknown/not reported.
Age 62+ with Children in the Home. This variable took all persons age 62 or older from the individual living arrangement variable and noted whether that person lived with children in the household or had a different living arrangement.
Elderly Properties. Each property in the TRACS data is identified using a Property ID. Similarly, each property in PIC is identified using a Development Code. For TRACs properties, a property was defined as elderly if at least 50% of the households within a Property ID had an individual age 62 or older. PHAs can explicitly designate properties as elderly. Therefore, a property in the PIC data was defined as elderly if it had an elderly designation or at least 50% of the households within a Development Code had an individual age 62 or older.
Subsidy Type.19 The PIC variable used for subsidy type was "program type" and for TRACS the variable used was "subsidy type". The variable categories created were: Public housing, Housing Choice Vouchers, Project-Based Section 8, Section 202, Section 202/162, Section 811, and Other. For PIC, program type was mapped as follows: public housing to "Public housing"; Section 8 certificates and Section 8 vouchers to "Housing Choice Vouchers"; and Mod Rehab converted to "Other". For TRACS, subsidy type was mapped as follows: Section 8 to "Project-Based Section 8", Section 202 PRAC to "Section 202", Section 202/162 PAC to "Section 202/162", Section 811 PRAC to "Section 811", and Rent supplement, RAP, Section 236, and BMIR to "Other".
Property Type. We mapped the property type variable from the HUD property level data files to our individual-level files based on Development Code for PIC individuals and Property ID for TRACS individual. The PIC variable used for property type was ‘program type name.' And for TRACS the variable used was "subsidy_type". The variable categories created were: "public housing", "housing choice vouchers", "other multifamily", "Section 202", "Section 811 and 202/162" and "other". "Housing choice vouchers' include all types of buildings in which housing choice voucher holders live, from a single-family home to a large apartment complex. The assignment of PIC and TRACS property types to these categories is displayed in Table A1. For the small proportion of TRACS individuals whom do not have a property type assigned to their property, we assigned their property type value based on their subsidy type. The purpose of the property type variable was to assign individuals to the actual type of property in which they live whereas the subsidy type variable assigned individuals to a category based on their subsidy type regardless of the type of property in which they live. While there is much overlap between the two variables, the main difference is for individuals receiving a project-based Section 8 subsidy. The property type variable distributes individuals receiving a project-based Section 8 subsidy to the actual property in which they live -- Other multifamily, Section 202, Section 811 and 202/162, or Other. The majority of individuals with project-based Section 8 subsidies were mapped to "Other multifamily". However, a larger portion of individuals age 65+ with a project-based Section 8 subsidy were mapped to "Section 202" property.20
| Public Housing | Housing Choice Vouchers | Other Multifamily | Section 202 | Section 811 & 202/162 | Other | |
| PIC property types (based on development code' variable) | Public housing | Section 8 vouchers | Other | |||
| TRACS property types (based on "property_id" variable) |
|
|
|
Geographic Area. Individuals were assigned to one of the 12 geographic areas of interest of our study based on Core Based Statistical Area (CBSA) or State Code: Vermont, New Haven-Milford, Bridgeport-Stamford-Norwalk, Milwaukee-Waukesha-West Allis, San Francisco-Oakland-Fremont, Boston-Cambridge-Quincy, Durham-Chapel Hill, Richmond, New York-Northern New Jersey-Long Island, Columbus, Akron, and Cleveland.
| Metropolitan Statistical Area(CBSA Code) | County | County Census Code | SSA State Code | SSA County Code |
| State of Vermont | 50000 | 47 | 000 | |
| New Haven- Milford (35300) | Connecticut--New Haven County--state Federal Information Processing Standards (FIPS) code: 09 | 09009 | 07 | 040 |
| Bridgeport- Stamford- Norwalk (14860) | Connecticut--Fairfield County--state FIPS code: 09 | 09001 | 07 | 000 |
| Milwaukee- Waukesha- West Allis (33340) | Wisconsin--state FIPS code: 55 | 52 | ||
| Milwaukee County | 55079 | 52 | 390 | |
| Ozaukee County | 55089 | 52 | 440 | |
| Washington County | 55131 | 52 | 650 | |
| Waukesha County | 55133 | 52 | 660 | |
| San Francisco- Oakland- Fremont (41860) | California--state FIPS code: 06 | 05 | ||
| Alameda County | 06001 | 05 | 000 | |
| Contra Costa County | 06013 | 05 | 060 | |
| Marin County | 06041 | 05 | 310 | |
| San Francisco County | 06075 | 05 | 480 | |
| San Mateo County | 06081 | 05 | 510 | |
| Boston- Cambridge- Quincy (14460) | Massachusetts--state FIPS code: 25 | |||
| Norfolk County | 25021 | 22 | 130 | |
| Plymouth County | 25023 | 22 | 150 | |
| Suffolk County | 25025 | 22 | 160 | |
| Middlesex County | 25017 | 22 | 090 | |
| Essex County | 25009 | 22 | 040 | |
| New Hampshire--state FIPS code: 33 | ||||
| Rockingham County | 33015 | 30 | 070 | |
| Strafford County | 33017 | 30 | 080 | |
| Durham- Chapel Hill (20500) | North Carolina--state FIPS code: 37 | |||
| Chatham County | 37037 | 34 | 180 | |
| Durham County | 37063 | 34 | 310 | |
| Orange County | 37135 | 34 | 670 | |
| Person County | 37145 | 34 | 720 | |
| Richmond (40060) | Virginia--state FIPS code: 51 | |||
| Amelia County | 51007 | 49 | 030 | |
| Caroline County | 51033 | 49 | 160 | |
| Charles City County | 51036 | 49 | 180 | |
| Chesterfield County | 51041 | 49 | 200 | |
| Cumberland County | 51049 | 49 | 240 | |
| Dinwiddie County | 51053 | 49 | 260 | |
| Goochland County | 51075 | 49 | 370 | |
| Hanover County | 51085 | 49 | 420 | |
| Henrico County | 51087 | 49 | 430 | |
| King and Queen County | 51097 | 49 | 480 | |
| King William County | 51101 | 49 | 500 | |
| Louisa County | 51109 | 49 | 540 | |
| New Kent County | 51127 | 49 | 621 | |
| Powhatan County | 51145 | 49 | 720 | |
| Prince George County | 51149 | 49 | 740 | |
| Sussex County | 51183 | 49 | 910 | |
| New York- Northern New Jersey- Long Island (35620) | New Jersey--state FIPS code: 34 | |||
| Middlesex County | 34023 | 31 | 270 | |
| Monmouth County | 34025 | 31 | 290 | |
| Ocean County | 34029 | 31 | 310 | |
| Somerset County | 34035 | 31 | 350 | |
| Hunterdon County | 34019 | 31 | 250 | |
| Morris County | 34027 | 31 | 300 | |
| Sussex County | 34037 | 31 | 360 | |
| Union County | 34039 | 31 | 370 | |
| Bergen County | 34003 | 31 | 100 | |
| Hudson County | 34017 | 31 | 230 | |
| Passaic County | 34031 | 31 | 320 | |
| Essex County | 34013 | 31 | 200 | |
| New York--state FIPS code: 36 | ||||
| Nassau County | 36059 | 33 | 400 | |
| Suffolk County | 36103 | 33 | 700 | |
| Bronx County | 36005 | 33 | 020 | |
| Kings County | 36047 | 33 | 331 | |
| New York County | 36061 | 33 | 420 | |
| Putnam County | 36079 | 33 | 580 | |
| Queens County | 36081 | 33 | 590 | |
| Richmond County | 36085 | 33 | 610 | |
| Rockland County | 36087 | 33 | 620 | |
| Westchester County | 36119 | 33 | 800 | |
| Pennsylvania--Pike County | 42103 | 39 | 630 | |
| Columbus (18140) | Ohio | |||
| Delaware County | 39041 | 36 | 210 | |
| Fairfield County | 39045 | 36 | 230 | |
| Franklin County | 39049 | 36 | 250 | |
| Licking County | 39089 | 36 | 460 | |
| Madison County | 39097 | 36 | 500 | |
| Morrow County | 39117 | 36 | 600 | |
| Pickaway County | 39129 | 36 | 660 | |
| Union County | 39159 | 36 | 810 | |
| Akron (10420) | Portage County | 39133 | 36 | 680 |
| Summit County | 39153 | 36 | 780 | |
| Cleveland (17460) | Cuyahoga County | 39035 | 36 | 170 |
| Geauga County | 39055 | 36 | 280 | |
| Lake County | 39085 | 36 | 440 | |
| Lorain County | 39093 | 36 | 480 | |
| Medina County | 39103 | 36 | 530 |
Fullyear2007. This field indicates if an individual received housing assistance for the entire year or only a portion of the year. The variable was created differently for individuals in TRACS and PIC data. For TRACS, the following three variables were used to determine full year assistance: move in date, certification type, and effective date. If an individual's "move in date" is before the first of the year, and he/she did not have a "certification type" of Termination or Move Out with an "effective date" during the year or prior to the year, fullyear2007=1. If the individual's "move in date" is after the first of the year or if the individual had a "certification type" of Termination or Move Out with an "effective date" during the year, fullyear2007=0. For PIC, the three variables used were: admission date, type of action, and effective date. If the individual's "admission date" is before the first of the year and he/she did not have a "type of action" of Termination with an "effective date" during the year or prior to the year, fullyear=1. If the individual's "admission date" is after the first of the year or the individual had a "type of action" of Termination with an "effective date" during the year, fullyear2007=0. For both TRACS and PIC, some individuals had a move out or termination dated back to a previous year (2006 or earlier). In this instance, the individual was deleted from the 2007 dataset.
Fullyear2008. Created similarly to fullyear2007. Some individuals have a move out or termination dated back to a previous year (2007 or earlier). For example, an individual may show up as present in the 2007 and 2008 data. In the 2008 data, it shows that they moved out in 2007. This individual's fullyear2007 variable was then set to 0 ("partial-year") and they were deleted from the 2008 dataset.
Fullyear2009. Created similarly to fullyear2007. Some individuals have a move out or termination dated back to a previous year (2008 or earlier). For example, an individual may show up as present in the 2008 and 2009 data. In the 2009 data, it shows that they moved out in 2008. This individual's fullyear2008 variable was then set to 0 ("partial-year") and they were deleted from the 2009 dataset.
Fullyear0708. Using fullyear2007 and fullyear2008 variables, this variable categorizes individuals as receiving housing assistance for all of 2007 and 2008 or for only a partial portion of those two years. The variable was defined as followings: fullyear0708=1 if fullyear07=1 and fullyear08=1. Fullyear0708=0 if either fullyear07 or fullyear08 were equal to zero. Similar variable was created for fullyear0809.
Fullyearallyears. Using fullyear2007, fullyear2008, and fullyear2009 variables, this variable categorizes individuals as receiving housing assistance for all three years or for only a partial portion of the three years. The variable was defined as followings: fullyearallyears=1 if fullyear07=1, fullyear08=1, and fullyear09=1. Fullyearallyears=0 if either fullyear07 or fullyear08 or fullyear09 were equal to zero.
Reason for Partial-Year. For individuals where fullyear=0 (partial-year), this variable specifies why they were not receiving housing assistance for the entire year. The values include: moved in after the first of the year, moved out during the year, terminated21 during the year.
2. Feasibility of linking HUD and CMS data sources
The main objective of this study task was to determine the ability to link HUD-assisted housing recipients to Medicare and Medicaid administrative data (i.e., enrolled in Medicare or Medicaid health care programs) in the 12 study jurisdictions. We accomplished this objective by calculating two measures that represent the ability to link the HUD and CMS data sources:
SSN Match Rate. The proportion of HUD-assisted housing recipients enrolled in Medicare and/or Medicaid programs (determined solely on a matched SSN between the datasets).
Restrictive Match Rate. A fairly conservative method on which we established whether the individuals receiving housing assistance were definitively included in the Medicare and/or Medicaid data by requiring a direct match on SSN, gender, and date of birth.22
The restrictive match rate was calculated by year and across years for both Medicare and Medicaid programs using various combinations of the below indicators.
Linked to Medicare Eligibility File by Year (2007, 2008, 2009). For each individual in the TRACS/PIC datasets, we created a series of binary variables (Y/N) indicating whether the individual could be linked to the Medicare eligibility by year. If the individual was linked based on SSN, date of birth, and gender, this individual was assigned a Y for the given year. If the individual was not located on the Medicare eligibility file, this individual was assigned a N.
Linked to Medicaid eligibility file by year (2007 and 2008). For each individual in the TRACS/PIC datasets, we created two binary variables (Y/N) indicating whether the person could be linked to the Medicaid eligibility file by year. If the individual was linked based on SSN, date of birth, and gender, this individual was assigned a Y for the given year. If the individual was not located on the Medicaid eligibility file, this individual was assigned a N.
3. Medicare Beneficiary Demographic and Coverage Characteristics
The variables below were based on information in the Medicare Beneficiary Summary File. Each variable was created by year for all Medicare beneficiaries in the 12 geographic areas of interest. The level of observation was beneficiary year.
Age. Age at end of year. Age groups were also created as followed: under age 65 (62, 62-64); 65+ (65-74, 75-84, 85+).
Gender. Values included unknown, female, and male.
Race. Research Triangle Institute (RTI) Race Code which is based on enhanced race/ethnicity designation based on first and last name algorithms. Categories include: unknown, non-Hispanic White, Black, other, Asian/Pacific Islander, Hispanic, American Indian/Alaska Native.
Died. Each beneficiary was assigned a Y/N flag based on the beneficiary date of death variable. If date of death=mmddyyyy, then Died=Y(1). If date of death is missing, then Died=N(0).
Part A Coverage Indicator. Part A coverage was assigned as a Y/N variable using the Beneficiary HI Coverage Months variable. If the beneficiary had a minimum of one month of Part A coverage, Part A Coverage indicator=Y(1), else=N(0). Medicare Part A includes inpatient services coverage, such as hospital care, SNF care, nursing home care (with exceptions), hospice, and home health services. The costs covered for these services depend on a number of factors.
Part B Coverage Indicator. Part B coverage was assigned as a Y/N variable using the Beneficiary Severe Mental Illness Coverage Months variable. If the beneficiary had a minimum of one month of Part B coverage, Part B Coverage indicator=Y(1), else=N(0). Medicare Part B covers outpatient services, such as doctor's visits. The services covered by Part B are medically necessary services (i.e., those needed to diagnosis or treat a medical condition) or preventive services (e.g., a flu shot).23
Month Count with Part A Coverage. The count of months when the beneficiary had Medicare Part A coverage. Values ranged from 0 to 12.
Month Count with Part B Coverage. The count of months when the beneficiary had Medicare Part B coverage. Values ranged from 0 to 12.
Annual Part A and B Enrollment. Beneficiaries were identified as being enrolled in both Part and B for the entire year if the month count with Part A coverage=12 and month count with Part B coverage=12.
Medicare Health Maintenance Organization (HMO)/Managed Care Indicator. The Medicare HMO/Managed Care indicator was assigned as a Y/N variable using the HMO coverage total months variable. If the beneficiary had a minimum of one month of HMO coverage, HMO/Managed Care Coverage indicator=Y(1), else=N(0). Medicare HMOs, or Managed Care, are plans that incorporate Medicare Parts A and B; these are called Medicare Part C, or Medicare Advantage plans. In these plans, a private Medicare-approved company provides oversight of a beneficiary's health care utilization.
Month Count with HMO/Managed Care Coverage. The count of months when the beneficiary had Medicare HMO/Managed Care coverage. Values ranged from 0 to 12.
Original Reason for Medicare Entitlement. Reason why the beneficiary was initially entitled to Medicare coverage. Values include: 0=Old age and survivors insurance; 1=Disability insurance benefits (DIB); 2=End Stage Renal Disease (ESRD); and 3=Both DIB and ESRD.
Current Reason for Medicare Entitlement. Reason why the beneficiary was currently entitled to Medicare coverage during reference year. Values include: 0=Old age and survivors insurance; 1=DIB; 2=ESRD; and 3=Both DIB and ESRD.
Medicare Coverage Status. Medicare coverage status was assigned based on the monthly buy-in indicators which specify if the beneficiary had Part A and/or Part B coverage by month. Medicare coverage status values were based on the following mapping:
- If no buy-in monthly flags=(1,2,3,A,B,C) then beneficiary was assigned to 1=Not Entitled.
- If all buy-in monthly flags=(1 or A) then beneficiary was assigned to 2=Part A coverage only category.
- If all buy-in monthly flags=(2 or B) then beneficiary was assigned to 3=Part B coverage only category.
- If all buy-in monthly flags=(3 or AB) then beneficiary was assigned to 4=Part A and B coverage only category.
- If enrollee has any other combination of buy-in monthly flags they were assigned to the 5=Combination coverage category.
Part D Coverage Indicator. Part D coverage was assigned as a Y/N variable using the Plan D coverage monthsvariable. If the beneficiary had a minimum of one month of Part D coverage, Part D Coverage indicator=Y(1), else=N(0). Medicare Part D is prescription drug coverage. This is optional coverage that Medicare beneficiaries can purchase through private plans.24 Having Part D coverage adds more drug coverage to Medicare Part A and B plans, in addition to some other Medicare plans.
Month Count with Part D Coverage. The count of months when the beneficiary had Medicare Part D coverage. Values ranged from 0 to 12.
Part D Coverage by Cost Share Group Code. The Part D benefit includes cost sharing provisions. State Medicaid and other government-sponsored subsidized premiums and/or copayments/coinsurance for low-income individuals are allowed. Additionally, unlike Medicare A and B, the Part D benefit allows for means-testing. The LIS provides assistance to certain low-income individuals to supplement the premium and cost sharing (including deductibles and cost sharing during the coverage gap) associated with the Part D benefit. Subsidies may also be provided to employers to cover eligible beneficiaries. All of these cost sharing provisions are indicated within this variable. Each beneficiary was assigned to one cost share group code based on the 12 monthly cost share indicators.25 Months with a value of 10, 11, 12, 13, 00, or XX (not enrolled in Part D or missing) were not considered when counting the most often that occurs. If all months were equal to 09 ("No premium-subsidy nor cost sharing"), then PartD_costshrgrp=9. Else, partD_costshrgrp is set equal to the value that occurs most often across the 12 monthly indicators (01=Bene is deemed with 100% premium-subsidy and no copayment; 02=Bene is deemed with 100% premium-subsidy and low copayment; 03=Bene is deemed with 100% premium-subsidy and high copayment; 04=Bene with LIS, 100% premium-subsidy and high copayment; 05=Bene with LIS, 100% premium-subsidy and 15% copayment; 06=Bene with LIS, 75% premium-subsidy and 15% copayment; 07=Bene with LIS, 50% premium-subsidy and 15% copayment; 08=Bene with LIS, 25% premium-subsidy and 15% copayment).
MME Status. MME Status was assigned to one of the following categories based on the variable "EL_MDCR_DUAL_ANN". Categories included: 00 (or NA), 99 (or unknown), 01 (qualified Medicare beneficiary (QMB) only), 02 (QMB Plus), 03 (specified low-income Medicare beneficiary (SLMB) only), 04 (SLMB plus), or 05 (Other MME status). These categories include the array of categories for MMEs, meaning that someone eligible for both Medicare and Medicaid may fall under some of these categories.26
Qualified Medicare Beneficiary (QMB). For an individual to be a QMB,they must be entitled to Medicare Part A, have an income at or below 100% of the Federal Poverty Level (FPL) and resources that do not exceed twice the SSI eligibility limit. These individuals also cannot be otherwise eligible for full Medicaid. This program pays for Part A and B premiums, as well as deductibles, coinsurance, and copayments.
- For QMBs, Medicaid pays for their Medicare Part A and B premiums, if any, and Medicare deductibles and coinsurance for Medicare services provided by Medicare providers (as is consistent with the Medicaid State Plan).
A QMB Plus is someone who meets all of the eligibility criteria of a QMB; however, they are eligible for full Medicaid benefits.
- For QMB Plus individuals, Medicaid also pays for these benefits and provides full Medicaid benefits.
SLMB. These individuals are entitled to Medicare Part A, have an income above 100% FPL, but below 120% FPL and resources that do not exceed twice the SSI eligibility limit. These individuals are not otherwise eligible for Medicaid.
- For SLMB only individuals, Medicaid pays for their Medicare Part B premiums only.
The SLMB Plus population meets all of the SLMB requirements; however, they are eligible for full Medicaid benefits.
- For SLMB plus individuals, Medicaid pays for their Medicare Part B premiums and provides full Medicaid benefits.
Other MME Status. This category captures those individuals who are eligible for Medicare and Medicaid, but are not QMB and SLMB. These can include qualified disabled and working individuals (QDWI) and Medicaid-only Dual Eligibles.
Any MME Status. A binary Y/N variable based on DUAL_MO count. If DUAL_MO count not equal to zero, MME Status=Y; else N.
Number of months with dual (Medicare and Medicaid) coverage. Equal to the number of months within the DUAL_MO variable.
4. Medicaid Coverage Characteristics
The variables below were based on information in the Medicaid person summary file. Each variable was created by year for all Medicaid beneficiaries in the 12 geographic areas of interest. The level of observation was beneficiary year.
Month Count of Medicaid Coverage. The count of months when the beneficiary has Medicaid coverage (managed care or FFS). Values ranged from 0 to 12.
Annual Medicaid Enrollment. Beneficiaries were identified as being enrolled in Medicaid for the entire year if the month count ("EL_ELGBLTY_MO_CNT")=12.
Medicaid HMO/Managed Care Indicator. The Medicaid HMO/Managed Care indicator was assigned as a Y/N variable using the private insurance month count variable. If the beneficiary had a minimum of one month of private insurance, Medicaid HMO/Managed Care Coverage indicator=Y(1), else=N(0).
Month Count with Medicaid HMO/Managed Care Coverage. The count of months when the beneficiary had Medicaid HMO/Managed Care coverage. Values ranged from 0 to 12.
Medicaid Basis for Eligibility. Reason why the beneficiary was initially eligible for Medicaid coverage. Values include: 00=00 (not eligible); 99=99 (unknown); 11, 21, 31, 41, or 51=01 (aged); 12, 22, 32, 42, or 52=02 (blind/disabled); 14, 24, 34, 44, or 54=03 (child); 15, 25, 35, 45, or 55=04 (adult); 16=05 (child of unemployed adult); 17=06 (unemployed adult); 48=07 (foster care child); or 3A=08 (covered under breast and cervical cancer prevention act).
Medicaid Maintenance of Assistance. The maintenance of assistance for the Medicaid beneficiary. Values include: 0=not eligible; 1=Cash or Section 1931 of the Act; 2=MN; 3=Poverty or State Children's Health Insurance Program (SCHIP); 4=Other; 5=foster care child; 6=Section 1115 Demo Expansion. Medicaid maintenance of assistance refers to how someone qualifies for Medicaid:27, 28
- Value 0 means someone is not eligible for Medicaid.
- Value 1 refers to Section 1931 of the Social Security Act, establishes rules for Medicaid coverage for qualified low-income families.29
- Value 2 refers to those that are Medically Needy.
- Value 3 means someone qualifies for Medicaid under poverty-related eligibility criteria.
- Value 4 captures, but does not specify, other ways someone is eligible for Medicaid.
- Value 5 means someone qualifies for Medicaid because they are a foster care or adoptive child.
- Value 6 means someone is eligible under a Section 1115 demonstration.
Type of 1915c Waiver Status Code. 1915c waivers are HCBS waivers. Individuals can qualify for a 1915c waiver based on the codes listed above. For example, someone can qualify for a state Medicaid 1915c waiver specifically for people who are aged and disabled. Most recent type of 1915c waiver, if applicable. Values include Blank=unknown, missing eligibility; G=aged and disabled; H=aged; I=disabled; J=brain injured; K=HIV/AIDS; L=MR/DD; M=mentally ill/severely emotionally disturbed; N=technology-dependent/medically fragile; O=Other or unknown; P=Autism/Autism spectrum disorder; 0=never enrolled in a 1915c waiver during the year.
Any 1915c Waiver Status Code. Indicates if individual had any 1915c waiver status code during 2008. If MAX_1915C_WAIVER_TYPE_LTST is not equal to "blank" or 0, then indicator=1, else indicator=0.
5. Chronic Conditions
The Chronic Condition Warehouse (CCW) flags, as defined by CMS, were used to identify individuals with Medicare coverage who had any of the 27 chronic conditions. A binary variable (Y/N) was created for each of the 28 CCW conditions for each year of Medicare data available (2007, 2008, 2009, 2010) using the "end-of-year" flags. Individuals with an "end-of-year" value=1 ("claims met") or 3 ("claims and coverage met") for a condition were assigned a "Y" for the given CCW condition. A summary variable was created for each of the four years which summed up the flags across 26 of the 27 conditions (excluding Alzheimer's chronic condition to not double count with Alzheimer's and related conditions flag) for a given individual (e.g., an individual with three CCW condition "end-of-year" flags would be assigned a three for the given calendar year).
We grouped the 27 chronic conditions into nine categories, shown in Table A2.
| Chronic Condition Group | Chronic Condition |
| Cardiovascular Chronic Conditions | Acute Myocardial InfarctionAtrial FibrillationChronic Heart FailureIschemic Heart DiseaseStroke |
| Cancer | Breast CancerColorectal CancerLung CancerEndometrial CancerProstate Cancer |
| Endocrine & Renal | Chronic Kidney DiseaseDiabetesHypothyroidism |
| Alzheimer's Disease | Alzheimer's DiseaseAlzheimer's and Alzheimer's-Related Disorders or Senile Dementia |
| Depression | Depression |
| Musculoskeletal | Hip FractureOsteoporosisRheumatoid Arthritis |
| Pulmonary | Chronic Obstructive Pulmonary DiseaseAsthma |
| Ophthalmic | CataractGlaucoma |
| Other | AnemiaHyperlipidemiaHypertensionBenign Prostatic Hyperplasia |
6. Health Care Utilization
Health care utilization metrics were generally defined as available in the Medicare Beneficiary Summary File. In a few instances, we combined existing metrics to create a summation of related services. Table A3 includes the utilization metrics created in our dataset and the corresponding Medicare variable or Medicare data-based logic. Variables were created for each year available in the Medicare (2007, 2008, 2009 and 2010) data.
| Utilization Metric | Variable as Named inMedicare Data or AlgorithmUsing Medicare Data Variables | Variable Definitions1 | |
NOTES:
| |||
| Total Admissions | ACUTE_STAYS + OIP_STAYS | ||
| Acute stay admissions | ACUTE_STAYS | Count of hospital stays (unique admissions, which may span more than one facility) in the acute inpatient setting for a given year. An acute stay is defined as a set of one or more consecutive acute claims where the beneficiary is only discharged on the most recent claim in the set.Acute care settings include a hospital, ER, and short-stay facilities for shorter-term treatment. | |
| Other inpatient admissions | OIP_STAYS | Count of hospital stays (unique admissions, which may span more than 1 facility) in the non-acute inpatient setting for a given year. A non-acute inpatient stay is defined as a set of 1 or more consecutive non-acute inpatient claims where the beneficiary is only discharged on the most recent claim in the set.Non-acute inpatient settings are SNFs. | |
| Hospital Readmissions | READMISSIONS | Count of hospital readmissions in the acute inpatient setting for a given year. | |
| Medicare SNF days | SNF_STAYS | Count of SNF setting stays (unique admissions, which may span more than 1 facility) for a given year. A SNF stay is defined as a set of 1 or more consecutive SNF claims where the beneficiary is only discharged on the most recent claim in the set. | |
| Medicare HH visits | HH_VISITS | Count of HH visits for a given year. | |
| Medicare hospice days | HOS_COV_DAYS | Count of covered days in the hospice setting for a given year. | |
| Hospital Outpatient visits | HOP_VISITS | Count of unique revenue center dates (as a proxy for visits) in the hospital outpatient setting for a given year. | |
| Total ER visits (total) | HOP_ER_VISITS + IP_ER_VISITS | ||
| ER visits without an admission | HOP_ER_VISITS | Count of unique ED revenue center dates (as a proxy for an ED visit) in the hospital outpatient data file for a given year. | |
| ER visits resulting in an admission | IP_ER_VISITS | Count of ED claims in the inpatient setting for a given year. | |
| Physician office visits | EM_EVENTS + PHYS_EVENTS | The EM_EVENTS variable is the count of events for the Part B E&M services for a given year. E&M claims are a subset of the claims in the Part B Carrier and DME data files, and a subset of physician claims.The PHYS_EVENTS variable is the count of events in the Part B PHYS for a given year. Physician office claims are a subset of the claims in the Part B Carrier and DME data files, and a subset of physician E&M claims. | |
| ASC visits | ASC_EVENTS | Count of events in the Part B ASC setting for a given year. | |
| Dialysis events | DIALYS_EVENTS | Count of events for Part B dialysis services (primarily the professional component since treatments are covered in hospital outpatient) for a given year. | |
| Anesthesia events | ANES_EVENTS | Count of events for Part B ANES for a given year. | |
| Imaging events | IMG_EVENTS | Count of events for IMG for a given year. | |
| Test events | TEST_EVENTS | Count of events in for Part B tests for a given year. | |
| Other procedures | OPROC_EVENTS | Count of events for Part B other procedures for a given year. | |
| DME | DME_EVENTS | Count of events in the Part B DME for a given year. | |
| Part B | PTB_DRUG_EVENTS | Count of events in the Part B drug setting for a given year. | |
| Part D2 | PTD_EVENTS where PLNCOVMO not equal to 0 | Count of events for Part D drugs for a given year (i.e., a unique count of the PDE_IDs). An event is a dispensed (filled) drug prescription covered by the Part D benefit.PLNCOVMO is Part D Plan Coverage Months. | |
For MMEs, the following three variables were defined using the Medicaid Person Summary data for 2007 and 2008.
Medicaid HCBS. These services help Medicaid beneficiaries stay in their communities and are implemented by states. As stated above, they can cover a range of services including DME and transportation. Sum of claims (FFS_CLM_CNT) when type of service represents one of the following: personal care services, residential care, DME, private duty nursing, adult day care, home health, rehab, targeted case management, transportation, and hospice. (TOS=13, 30, 31, 33, 35, 26, 38, 51, 52, 54).
Medicaid Nursing Facility Days. Given this is a Medicaid-covered service, it is only included in the Medicaid person summary file and not the Medicare claims data. This value is equal to the variable named "TOT_LTC_CVR_DAY_CNT_NF", which represents total covered nursing facility days, including long-term stays.
Other Long-Term Days (excluding Nursing Facility). This is the count of covered days for any of the following types of service: mental hospital, inpatient psych (age 21), and intermediate care facility for persons with mental retardation covered days.
7. Health Care Spending
Medicare plan paid variables were created for various types of services (e.g., total admissions PMPM). Payments are not standardized due to geographic differences in payment rates. Therefore, care must be used when comparing average spending for a particular service across the geographies.30
Table A4 includes the health care spending metrics created in our dataset and the corresponding Medicare variable or Medicare data-based logic. Variables were created for each year available in the Medicare (2007, 2008, 2009 and 2010) data. Definitions for the services included in each variable are included in Table A3.
| Health Care Spending Metric | Medicare Plan Paid Definition |
NOTE:
| |
| Total medical and pharmacy payments | TOT_MED_MDCR + PTD_MDCR_PMT |
| Total medical payments | Sum of all individual values below excluding long-term care and Part D drugs (not double counting categories that have subcategories (e.g., total admissions)) |
| Total admissions | ACUTE_MDCR_PMT + OIP_MDCR_PMT |
| Acute stay admissions | ACUTE_MDCR_PMT |
| Other inpatient admissions | OIP_MDCR_PMT |
| Medicare SNF days | SNF_MDCR_PMT |
| Medicare HH visits | HH_MDCR_PMT |
| Medicare hospice days | HOS_MDCR_PMT |
| Hospital outpatient visits | HOP_MDCR_PMT |
| Physician office visits | EM_MDCR_PMT + PHYS_MDCR_PMT |
| ASC visits | ASC_MDCR_PMT |
| Dialysis events | DIALYS_MDCR_PMT |
| Anesthesia events | ANES_MDCR_PMT |
| Imaging events | IMG_MDCR_PMT |
| Test events | TEST_MDCR_PMT |
| Other procedures | OPROC_MDCR_PMT |
| DME | DME_MDCR_PMT |
| Part B | PTB_DRUG_MDCR_PMT |
| Part D1 | PTD_MDCR_PMT |
APPENDIX B. STUDY SAMPLES AND ANALYTIC APPROACH
A. Study Samples
1. Objective A, B, and C study samples
Our sample of HUD-assisted individuals consisted of all individuals that appear in the TRACS or PIC data at any point in time during 2008. This sample was the basis for Objective A (Understanding demographic characteristics of HUD-assisted individuals). The "TRACS/PIC base" sample was created by combining the TRACS and PIC data into one dataset. For individuals that appear in both datasets (across all three years this was 38,326 individuals, or 1.54%), we created only one observation per individual based on the PIC data. Individuals were excluded if an individual's move out date in a given year occurred prior to the current data year31 (N=194,674). The resulting total sample size was 2,057,893 unique individuals and 967,557 unique heads of households.
The sample of HUD-assisted individuals for Objective B (Calculate match rate between HUD and Medicare and/or Medicaid data) and Objective C (Estimate HUD-assisted Medicare beneficiaries with enrollment in Part D subsidy assistance programs or Medical Savings Program) was a subset of this sample. The Medicare and Medicaid data can have duplicate observations for a given SSN due to a variety of reasons (e.g., Medicaid beneficiary who moved to a different state mid-year, data error, etc.). We excluded any individual who had more than one observation in the Medicare or Medicaid data from Objective B in order to calculate an accurate Participation and Match Rate without duplicate beneficiaries. HUD-assisted individuals who appeared multiple times in the Medicare or Medicaid data files were therefore excluded.
Table B1 presents the HUD-assisted individuals 2008 sample size for Objective A and the reduced sample for Objectives B and C.
| Objective Sample | Individuals |
| Objective A sample: HUD-assisted individuals 2008 unique observations | 2,057,893 |
| Objectives B & C sample: HUD-assisted individuals 2008 unique observations, removing Medicare/Medicaid duplicates | 2,025,126 |
2. Objective D Study Samples
As discussed in the Summary Report and Appendix C, the sample was refined in order to compare HUD-assisted Medicare beneficiaries to unassisted beneficiaries in the community with regards to enrollment, chronic conditions, health care payment and utilization. Although our overall study focused on individuals age 62 and older receiving housing assistance, we narrowed this analysis to individuals age 65 and older to result in the most representative comparison because the vast majority of individuals age 65 and older have Medicare coverage.
Before comparing groups of beneficiaries, we first refined our study sample of Medicare beneficiaries (both HUD-assisted and unassisted beneficiaries in the 12 study jurisdictions). Figure B1 depicts the inclusion criteria. Medicare beneficiaries had to be enrolled in Part A Hospital and Part B Physician Services for all 12 months of 2008 or up until death and not have any Medicare managed care (i.e., Medicare Part C or Medicare Advantage)32 enrollment in 2008. This reduced the sample of Medicare beneficiaries 38%, down to 3.6 million. Approximately 7% of the Medicare beneficiaries were HUD-assisted individuals and 93% were unassisted in the community.
FIGURE B1. Inclusion Criteria for HUD-Assisted and Unassisted Medicare Beneficiaries for Payment and Utilization Comparison, All Ages
B. Analytic Approach
This section outlines our analytic approach by research question.
1. Understand Demographic Characteristics of HUD-Assisted Individuals in the 12 Study Jurisdictions
We calculated the number and percentage of HUD-assisted individuals by characteristic (e.g., race, living arrangement). Objective A results were stratified by year (2007, 2008, 2009), age group (62, 62-64, 65+ years of age), the 12 geographic areas, subsidy type, and property type. For certain characteristics, such as living arrangement, we calculated the metric on both an individual and household level. In addition to individual characteristics, we also looked at the number and proportion of properties defined as an elderly property (see Appendix A for variable definitions).
2. Calculate HUD and Medicare and/or Medicaid Match Rate in 12 Study Jurisdictions
The main objective of this study task was to determine the ability to link HUD-assisted individuals to Medicare and Medicaid administrative data (i.e., enrolled in Medicare or Medicaid health care programs) in the 12 study jurisdictions. We focus the results on 2008 -- the most recent year for which we had data on HUD, CMS Medicare, and CMS Medicaid enrollment. We accomplished this objective by calculating two measures that represent the ability to link the HUD and CMS data sources:
SSN Match Rate. The proportion of HUD-assisted individuals enrolled in Medicare and/or Medicaid programs (determined solely on a matched SSN between the datasets).
Restrictive Match Rate. A fairly conservative method on which we established whether the individuals receiving housing assistance were definitively included in the Medicare and/or Medicaid data by requiring a direct match on SSN, gender, and date of birth.
The SSN Match Rate gives a fairly good estimate on the proportion of HUD-assisted individuals that had any Medicare and/or Medicaid enrollment during the observation period. The more conservative Restrictive Match Rate creates a sample for which we can be very confident the HUD-assisted individual was in fact enrolled in Medicare and/or Medicaid. This method is important for identifying a sample of beneficiaries with HUD housing assistance for which we would then compare to other Medicare and/or Medicaid beneficiaries' payment and utilization.
The following outlines the steps we completed to calculate the Match Rates:
Lewin sent Buccaneer/General Dynamics Information Technology (GDIT) HUD data that included the individuals with a valid SSN receiving housing assistance at any point in time during 2007, 2008, and 2009.
Buccaneer/GDIT linked these files to Medicare and Medicaid data (not limited to any particular years) based on SSN. Buccaneer/GDIT sent Lewin a "crosswalk" file that contained the list of all valid SSNs that linked to Medicare or Medicaid data and the corresponding Medicare/Medicaid beneficiary identification number (Bene_ID).
- This crosswalk contained HUD individuals with valid SSNs who had a Medicare or Medicaid Bene_ID at any point in time.
Of the individuals in the crosswalk file, Lewin limited it those who had a Bene_ID present in our years of study: 2007, 2008, 2009, or 2010.
Calculate Participation rate: same SSN only.
Calculate Match rate: Same SSN, date of birth, and gender.
To compare the HUD-assisted individuals who linked to those that did not link to the Medicare or Medicaid data (based on the Match Rate definition), we calculated the number and percentages of individuals with certain characteristics. We calculated the chi-square statistic for categorical variables (e.g., gender) and the t-test for continuous variables (e.g., age) to test if the two samples were statistically different. We also created summary statistics to examine the Medicare enrollment characteristics among those that linked, including the participation rates in Medicare Part D LIS and Medicaid programs.
3. Estimate the Proportion of HUD-Assisted Medicare Beneficiaries with Enrollment in Part D Subsidy Assistance Programs or Medical Savings Program (i.e., Medicaid)
We calculated the number and percentage of HUD-assisted Medicare beneficiaries by Part D subsidy assistance program types and the Medicaid coverage status categories.
4. Compare Medicare and Medicaid Payment and Utilization for HUD-Assisted Beneficiaries and Unassisted Beneficiaries in the Community in the 12 Study Jurisdictions
Similar to the above, to compare demographic and coverage characteristics, we calculated the number and percentages of individuals with certain characteristics along with the chi-square statistic to compare the distribution of categorical variables (e.g., reason for entitlement) and means and standard deviations along with the t-test to compare continuous variables (e.g., months of Medicare coverage) across three strata: (1) HUD-assisted beneficiaries partial-year; (2) HUD-assisted beneficiaries full year; and (3) unassisted beneficiaries in the community. The results of this comparison then informed whether or not to combine HUD partial-year and HUD full year into one group for the comparison of chronic conditions, payment and utilization.
To compare prevalence of chronic conditions, we calculated the number and percentage of individuals with nine different categories of conditions (See Appendix A for variable definitions) and the chi-square statistic to test if the groups were statistically different. To examine health care utilization and payments, we used descriptive techniques that account for length of enrollment time: utilization metrics were calculated per 1000 member months, and we used PMPM for health care payments. Means, medians, and standard deviations were calculated for these variables and t-tests were calculated for significance testing.
Note that with large sample sizes (such as those of our study samples) tests of association tend to be statistically significant.
APPENDIX C. 2008 DETAILED RESULTS
Introduction
The results presented below are organized by study objective and based on 2008--the most recent year for which we had data on HUD, CMS Medicare, and CMS Medicaid enrollment. We also produced results for Objectives A, B, and C by year (2007, 2008, and 2009), which are included in Appendix D.
A. Understand Demographic Characteristics of HUD-Assisted Individuals in the 12 Study Jurisdictions
The HUD individual tenant-level data for 2008 included 2,057,893 unique individuals and 967,557 unique household heads that received housing assistance at some point during 2008. The tables below summarize characteristics of these individuals based on the data available in the HUD data sources.
1. Demographic Characteristics of HUD-Assisted Individuals
Table C1 presents the demographic characteristics for HUD-assisted individuals in the 12 study jurisdictions.
| Unique Individuals(N=2,057,893) | ||
| Mean | SD | |
NOTES:
| ||
| Age | ||
| All Persons | 34.9 | 25.3 |
| Household Heads | 54.2 | 18.8 |
| N | % | |
| Gender | ||
| Male | 765,169 | 37.2% |
| Female | 1,291,140 | 62.7% |
| Unknown/declined to report | 1,584 | 0.1% |
| Age Group | ||
| 18 | 764,543 | 37.2% |
| 18-44 | 566,059 | 27.5% |
| 45-61 | 327,067 | 15.9% |
| 62-64 | 46,700 | 2.3% |
| 65+ | 352,091 | 17.1% |
| Unknown/declined to report | 1,433 | 0.1% |
| Race/Ethnicity | ||
| White non-Hispanic | 331,944 | 16.1% |
| Hispanic | 489,337 | 23.8% |
| Black non-Hispanic | 773,550 | 37.6% |
| Asian | 56,934 | 2.8% |
| American Indian/Alaskan | 3,699 | 0.2% |
| Hawaiian/Pacific Islander | 2,762 | 0.1% |
| Other non-Hispanic | 259 | 0.0% |
| Mixed non-Hispanic | 275 | 0.0% |
| Unknown/declined to report | 399,133 | 19.4% |
| Property Type1 | ||
| Public housing | 635,906 | 30.9% |
| Housing Choice Vouchers2 | 960,387 | 46.7% |
| Other multifamily | 381,078 | 18.5% |
| Section 202 | 63,033 | 3.1% |
| Section 811 & 202/162 | 3,993 | 0.2% |
| Other | 13,496 | 0.7% |
| Subsidy Type | ||
| Public housing | 638,584 | 31.0% |
| Housing Choice Vouchers | 969,140 | 47.1% |
| Project-Based Section 8 | 376,552 | 18.3% |
| Section 202 | 21,386 | 1.0% |
| Section 202/162 | 100 | 0.0% |
| Section 811 | 3,839 | 0.2% |
| Other | 48,292 | 2.3% |
| Disability or Handicapped Status | ||
| Yes | 376,339 | 18.3% |
| No | 1,472,679 | 71.6% |
| Unknown/declined to report | 208,875 | 10.1% |
| Geographic Area | ||
| Vermont | 22,635 | 1.1% |
| New Haven- Milford | 50,201 | 2.4% |
| Bridgeport- Stamford- Norwalk | 35,326 | 1.7% |
| Milwaukee- Waukesha- West Allis | 51,555 | 2.5% |
| San Francisco- Oakland- Fremont | 167,795 | 8.2% |
| Boston- Cambridge- Quincy | 243,601 | 11.8% |
| Durham- Chapel Hill | 17,945 | 0.9% |
| Richmond | 43,196 | 2.1% |
| New York- Northern New Jersey- Long Island | 1,213,201 | 59.0% |
| Columbus | 72,332 | 3.5% |
| Akron | 35,409 | 1.7% |
| Cleveland | 104,697 | 5.1% |
Over half of the sample (59%) was located in the New York-Northern New Jersey-Long Island area. The remaining ten geographies each represent 5% or less of the sample. Given the New York City area is the majority of our sample, the individuals living in this area heavily influence the other characteristics presented in the result tables.
The majority of individuals were female (63%) with an average age of 34.9 years. Approximately 19% of the sample was older than 62 years of age ("elderly") with 37% younger than age 18. As expected, among household heads, the average age was much higher (54.2 years). While 19% of the sample declined to report race/ethnicity, among the individuals where the information was available, 38% were non-Hispanic Black, 24% were Hispanic, 16% were White non-Hispanic, 3% were Asian, and less than 1% were American Indian/Alaskan, Hawaiian/Pacific Islander, Other non-Hispanic or Mixed non-Hispanic. Only 18% of individuals were designated as living in a household identified as a disability status or handicapped household (11% declined to report so 20% among those reporting).
The largest proportion of subsidy type received was Housing Choice Vouchers (47%). Approximately 31% resided in public housing and another 18% lived in multifamily project-based Section 8 housing. Among individuals age 62 years or older, public housing, other multifamily, and Housing Choice Vouchers were the most common (31%, 29%, and 25%) with an additional 14% residing in Section 202 properties (data not shown, see Appendix D).
| All Ages(N=2,057,893) | Age 62+ Years(N=398,791) | |||
| N | % | N | % | |
| Living arrangement | ||||
| Lives Alone | 450,410 | 21.9% | 267,751 | 67.1% |
| Lives with Spouse | 89,066 | 4.3% | 68,694 | 17.2% |
| Other Adults | 144,705 | 7.0% | 30,603 | 7.7% |
| Minor(s) in Household | 1,345,190 | 65.4% | 24,130 | 6.1% |
| Live-in Aide | 7,039 | 0.3% | 1,877 | 0.5% |
| Other | 283 | 0.0% | 38 | 0.0% |
| Unknown/declined to report | 21,200 | 1.0% | 5,698 | 1.4% |
| Living with minor(s) in household | ||||
| Age 62+ with minor(s) in household | 24,130 | 6.1% | ||
Table C2 presents living arrangement on an individual level by age (all ages and 62+ years only) and Table C3 presents living arrangement on a household level. Approximately 65% of individuals of all ages were in households with children and 22% lived alone. In contrast, among individuals age 62 years or older, over 67% live alone and 6% had minors in the home. On a household level, 41% of households had children while 47% of households consisted of a single individual. Among households with more than one person, there was an average of 3.1 people (data not shown).
| Households(N=967,557) | ||
| N | % | |
| Living arrangement | ||
| Lives Alone | 448,556 | 46.4% |
| Lives with Spouse | 45,985 | 4.8% |
| Other Adults | 68,751 | 7.1% |
| Minor(s) in Household | 394,260 | 40.7% |
| Live-in Aide | 3,131 | 0.3% |
| Other | 78 | 0.0% |
| Unknown/declined to report | 6,796 | 0.7% |
Table C4 presents the number and proportion of HUD-assisted individuals who received housing assistance for the entire year of 2008 or for only a portion of the year by age (all ages, 62+ years; 65+ years). For those individuals that only received housing assistance for a portion of the year, the reason is also included. Approximately 87% of all individuals received housing assistance for all of 2008. Among the 13% who only received housing assistance for a portion of the year, the large majority (60%) had moved into the property after January 1stof the calendar year. Approximately 40% of partial-year participants terminated the program or moved out of the property. Among individuals age 65 years or older, 79% received housing assistance for the full year. Similarly, the reason for partial-year assistance was also different among this older sample -- 54% had terminated the program or moved out of the property compared with 40% of partial-year recipients across all ages. This difference was expected because older individuals would be more likely to move to another facility (such as a nursing home) or die.
| All Ages(N=2,057,893) | Age 62+(N=398,791) | Age 65+(N=352,091) | ||||
| N | % | N | % | N | % | |
| Full year participants | 1,783,202 | 86.7% | 353,789 | 88.7% | 313,035 | 88.9% |
| Partial-year participants | 274,691 | 13.3% | 45,002 | 11.3% | 39,056 | 11.1% |
| Reason for partial-year | ||||||
| Moved Out/Terminated | 110,370 | 40.2% | 22,815 | 50.7% | 20,876 | 53.5% |
| Moved in after Jan 1 | 164,321 | 59.8% | 22,187 | 49.3% | 18,180 | 46.5% |
2. HUD Elderly Properties
Table C5 presents the proportion of properties that were defined as elderly33 among all public housing properties (from PIC) and private assisted multifamily properties (from TRACS) within the 12 study jurisdictions. Half of all multifamily properties had an individual age 62 years or older in over 50% of their units. Approximately 42% of all public housing properties were either designated as elderly by PHAs or had an individual age 62 years or older in over 50% of their units. Both of these proportions varied greatly by the 12 study jurisdictions, from 30% of multifamily properties in Durham-Chapel Hill, North Carolina to 68% of multifamily properties in Bridgeport-Stamford-Norwalk, Connecticut and only 19% of public housing properties in Cleveland compared to 90% of public housing properties in Vermont (data not shown, see Appendix D).
| Property Types | Number of Properties | Percent of Properties |
| Multifamily elderly properties (reported in TRACS) | 1,811 | 50.0% |
| Public Housing elderly properties (reported in PIC) | 335 | 42.0% |
B. Calculate HUD and Medicare and/or Medicaid Match Rate in the 12 Study Jurisdictions, 2008
1. Match Rate: HUD-Assisted Individuals to Medicare or Medicaid Enrollment Data
The main objective of this study task was to assess the feasibility and potential for successful (i.e., accurate and complete) matching to Medicare and Medicaid administrative data (i.e., enrolled in Medicare or Medicaid health care programs) in the 12 study jurisdictions to support research and policy analysis. We accomplished this objective by calculating two measures that represent the ability to link the HUD and CMS data sources:
"SSN Match Rate". The proportion of HUD-assisted individuals enrolled in Medicare and/or Medicaid programs (determined solely on a matched SSN between the datasets).
"Restrictive Match Rate". A fairly conservative method on which we established whether the individuals receiving housing assistance were truly included in the Medicare and/or Medicaid data by requiring a direct match on SSN, gender, and date of birth.34
Table C6 presents the Medicare and Medicaid SSN match rate and restrictive match rate for the 2008 sample of HUD-assisted individuals, excluding duplicates. SSN match rate and restrictive match rate are presented separately for individuals less than age 65 years and those age 65 years or older to align with Medicare eligibility at age 65. Before calculating SSN and restrictive match rates, we excluded individuals from the HUD sample that do not have valid SSNs. This results in a less than 1% reduction in sample size for both age groups.
Among HUD-assisted individuals age 65 years or older with a valid SSN, the Medicare SSN Match Rate was 93%. This decreased by 8 percentage points to 85% when requiring a match on gender and date of birth in addition to SSN. Among HUD-assisted individuals less than age 65 with a valid SSN, the Medicaid SSN match rate was 73%. This decreased to 69% when requiring a match on gender and date of birth in addition to SSN. Approximately 63% of HUD-assisted individuals age 65 years or older with a valid SSN linked to Medicare and Medicaid in 2008 based on SSN alone. The restrictive match rate for Medicare and Medicaid among this sample was 58%.
| Age 65 Years(N=1,663,348) | Age 65+ Years(N=349,208) | |||
| N | % | N | % | |
NOTE:
| ||||
| Medicare | ||||
| SSN Match Rate (SSN only) | 116,803 | 7.0% | 325,589 | 93.2% |
| Restrictive Match Rate (SSN, gender, date of birth) | 110,395 | 6.7% | 297,227 | 85.1% |
| Medicaid | ||||
| SSN Match Rate (SSN only) | 1,200,981 | 72.2% | 229,093 | 65.6% |
| Restrictive Match Rate (SSN, gender, date of birth) | 1,131,137 | 68.5% | 209,679 | 60.0% |
| Medicare and Medicaid | ||||
| SSN Match Rate (SSN only) | 96,509 | 5.8% | 220,139 | 63.0% |
| Restrictive Match Rate (SSN, gender, date of birth) | 91,564 | 5.5% | 201,753 | 57.8% |
We also calculated the restrictive match rate for individuals age 65 and older by property type and geography and found little variation (data not shown, see Appendix D). The percentages that linked to Medicare or Medicaid are consistently high across property types, ranging from 84.2% (public housing) to 89.4% (Section 202). These percentages are also high across geographic area (86.2% in New York-Northern New Jersey-Long Island to 94.2% in Vermont) with the exception of Richmond, where only 31.2% linked.
| Age 65 Years(N=158,323) | Age 65+ Years(N=131,335) | |||
| N | % | N | % | |
NOTE:
| ||||
| Medicare | ||||
| SSN Match Rate (SSN only) | 49,367 | 31.2% | 123,759 | 94.2% |
| Restrictive Match Rate (SSN, gender, date of birth) | 46,875 | 29.6% | 112,783 | 85.9% |
| Medicaid | ||||
| SSN Match Rate (SSN only) | 143,443 | 90.6% | 124,730 | 95.0% |
| Restrictive Match Rate (SSN, gender, date of birth) | 134,320 | 84.8% | 113,711 | 86.6% |
| Medicare and Medicaid | ||||
| SSN Match Rate (SSN only) | 46,717 | 29.5% | 120,811 | 92.0% |
| Restrictive Match Rate (SSN, gender, date of birth) | 44,389 | 28.0% | 110,254 | 83.9% |
Table C7 presents the Medicare and Medicaid SSN match rate and restrictive match rate among the 2008 sample of HUD-assisted household heads who were receiving SSI in 2008. The purpose of calculating the SSN match rate and restrictive match rate for this subsample is that individuals eligible for SSI are automatically eligible for Medicaid. Therefore, we would expect to see close to 100% SSN match rate, understanding a perfect Match Rate is not expected given limitations in the dataset. Among head of households receiving SSI under age 65 with a valid SSN in the HUD data, 91% were linked to Medicaid enrollment files on SSN alone. Among head of households receiving SSI age 65 and older, the Medicare SSN Match Rate was 94% and the SSN match rate for Medicaid and Medicare was 92%. While the proportions are not 100%, over 90% of individuals receiving SSI were enrolled in SSI in 2008. Additional analysis would need to be conducted in order to better estimate program enrollment among individuals that are eligible.
From this point forward, all HUD-assisted individuals identified as Medicare beneficiaries are based on the restrictive match rate -- individuals that linked based on gender, date of birth, and SSN. The more conservative Restrictive Match Rate creates a sample for which we can be very confident the HUD-assisted housing recipient was in fact enrolled in Medicare and/or Medicaid.
2. HUD-Assisted Individuals Matched to Medicare Administrative Data Compared to HUD-Assisted Individuals Who Did Not Match
Next we wanted to better understand the characteristics of HUD-assisted individuals that matched to the CMS administrative data relative to the individuals that did not match.
Table C8 presents a comparison of HUD-assisted individuals who were linked to Medicaid or Medicare enrollment files to those that were not linked (using the restrictive match based on gender, date of birth, and SSN). Among individuals less than 65 years of age, we compared those who linked to Medicaid compared to those who did not. Individuals who linked to Medicaid files were more likely to be White (17% vs. 11%); much more likely to have received Housing Choice Vouchers (56% vs. 42%); disabled (19% vs. 10%); and received SSI (18% vs. 6%).
Similar results were found when comparing individuals age 65 years or older who linked to either Medicare or Medicaid enrollment files. Individuals who linked to Medicare or Medicaid were more likely to be White (22% vs. 15% of individuals who did not link); more likely to receive Housing Choice Vouchers (24.5% vs. 20.2%) or live in Section 202 (elderly supportive housing) property (15.9% vs. 12.9%); and more likely to receive SSI (44% vs. 38%).
| HUD-Assisted Individuals(65 Years) | HUD-Assisted Individuals(65+ Years) | |||||||
| Linked to 2008Medicaid Enrollment Files(N=1,131,137) | Did No Link to2008 Medicaid Enrollment Files(N=542,905) | Linked to 2008Medicaid Enrollment Files(N=305,153) | Did No Link to2008 Medicaid Enrollment Files(N=44,505) | |||||
| Mean | SD | Mean | SD | Mean | SD | Mean | SD | |
NOTES:
* Cell sizes less than 11 are not displayed. | ||||||||
| Age--All Persons | 24.6 | 17.9 | 30.4 | 18.4 | 76.3 | 7.7 | 76.9 | 8.3 |
| Age--Household Heads | 42.6 | 11.8 | 45.5 | 11.5 | 76.5 | 7.8 | 77.2 | 8.3 |
| N | % | N | % | N | % | N | % | |
| Gender | ||||||||
| Male | 429,972 | 38.0% | 216,918 | 40.0% | 91,241 | 29.9% | 12,416 | 30.15% |
| Female | 701,165 | 62.0% | 325,903 | 60.0% | 213,912 | 70.1% | 30,965 | 69.6% |
| Unknown/declined to report | 0 | 0.0% | 84 | 0.0% | 0 | 0.0% | 124 | 0.3% |
| Age Group | ||||||||
| 18 | 531,042 | 46.9% | 168,356 | 31.0% | ||||
| 18-44 | 383,522 | 33.9% | 220,231 | 40.6% | ||||
| 45-61 | 194,296 | 17.2% | 130,220 | 24.0% | ||||
| 62-64 | 22,277 | 2.0% | 24,098 | 4.5% | ||||
| 65+ | 305,153 | 100.0% | 44,505 | 100.0% | ||||
| Unknown/declined to report | 0 | 0.0% | 0 | 0.0% | 0 | 0.0% | 0 | 0.0% |
| Race/Ethnicity | ||||||||
| White non-Hispanic | 196,344 | 17.4% | 59,773 | 11.0% | 65,942 | 21.6% | 6,462 | 14.5% |
| Hispanic | 293,367 | 25.9% | 131,007 | 24.1% | 46,760 | 15.3% | 8,528 | 19.2% |
| Black non-Hispanic | 456,226 | 40.3% | 241,907 | 44.6% | 48,785 | 16.0% | 10,729 | 24.1% |
| Asian | 29,199 | 2.6% | 14,199 | 2.6% | 11,373 | 3.7% | 1,250 | 2.8% |
| American Indian/Alaskan | 2,222 | 0.2% | 938 | 0.2% | 428 | 0.1% | 49 | 0.1% |
| Hawaiian/Pacific Islander | 1,492 | 0.1% | 790 | 0.1% | 351 | 0.1% | 39 | 0.1% |
| Other non-Hispanic | 146 | 0.0% | 66 | 0.0% | 33 | 0.0% | * | 0.0% |
| Mixed non-Hispanic | 132 | 0.0% | 56 | 0.0% | 73 | 0.0% | * | 0.0% |
| Unknown/declined to report | 152,009 | 13.4% | 94,169 | 17.3% | 131,408 | 43.1% | 17,433 | 39.2% |
| Property Type | ||||||||
| Public housing | 314,201 | 27.8% | 206,232 | 38.0% | 89,013 | 29.2% | 16,709 | 37.5% |
| Housing Choice vouchers | 630,610 | 55.8% | 226,884 | 41.8% | 74,796 | 24.5% | 9,005 | 20.2% |
| Other multifamily | 170,340 | 15.1% | 102,264 | 18.8% | 91,469 | 30.0% | 12,836 | 28.8% |
| Section 202 | 6,330 | 0.5% | 2,817 | 0.5% | 48,424 | 15.9% | 5,750 | 12.9% |
| Section 811 & 202/162 | 2,736 | 0.2% | 893 | 0.2% | 298 | 0.1% | 37 | 0.1% |
| Other | 7,920 | 0.7% | 3,815 | 0.7% | 1,153 | 0.4% | 168 | 0.4% |
| Subsidy Type | ||||||||
| Public housing | 315,985 | 27.9% | 206,874 | 38.1% | 89,290 | 29.3% | 16,753 | 37.6% |
| Housing Choice vouchers | 636,520 | 56.3% | 228,800 | 42.1% | 75,351 | 24.7% | 9,094 | 20.4% |
| Project-based Section 8 | 155,410 | 13.7% | 88,143 | 16.2% | 113,582 | 37.2% | 15,259 | 34.3% |
| Section 202 | 467 | 0.0% | 485 | 0.1% | 18,258 | 6.0% | 1,996 | 4.5% |
| Section 202/162 | 31 | 0.0% | 11 | 0.0% | 51 | 0.0% | * | 0.0% |
| Section 811 | 2,627 | 0.2% | 855 | 0.2% | 294 | 0.1% | 37 | 0.1% |
| Other | 20,097 | 1.8% | 17,737 | 3.3% | 8,327 | 2.7% | 1,359 | 3.1% |
| Elderly Designated Property1 | ||||||||
| Yes | 59,788 | 5.3% | 40,523 | 7.5% | 160,398 | 52.6% | 20,102 | 45.2% |
| No | 438,541 | 38.8% | 274,457 | 50.6% | 69,377 | 22.7% | 15,328 | 34.4% |
| Unknown | 632,808 | 55.9% | 227,925 | 42.0% | 75,378 | 24.7% | 9,075 | 20.4% |
| Disability or Handicapped Status | ||||||||
| Yes | 213,843 | 18.9% | 53,557 | 9.9% | 90,974 | 29.8% | 13,511 | 30.4% |
| No | 793,739 | 70.2% | 407,938 | 75.1% | 213,603 | 70.0% | 30,833 | 69.3% |
| Unknown/declined to report | 123,555 | 10.9% | 81,410 | 15.0% | 576 | 0.2% | 161 | 0.4% |
| Living Arrangement | ||||||||
| Lives alone | 123,759 | 10.9% | 82,829 | 15.3% | 209,450 | 68.6% | 29,612 | 66.5% |
| Lives with spouse | 12,890 | 1.1% | 13,267 | 2.4% | 55,419 | 18.2% | 6,626 | 14.9% |
| Other adults | 58,816 | 5.2% | 59,545 | 11.0% | 20,713 | 6.8% | 4,277 | 9.6% |
| Children in household | 925,455 | 81.8% | 375,234 | 69.1% | 14,537 | 4.8% | 3,082 | 6.9% |
| Live-in aide | 2,655 | 0.2% | 2,779 | 0.5% | 1,316 | 0.4% | 224 | 0.5% |
| Other | 105 | 0.0% | 148 | 0.0% | 19 | 0.0% | * | 0.0% |
| Unknown/declined to report | 7,457 | 0.7% | 9,103 | 1.7% | 3,699 | 1.2% | 677 | 1.5% |
| SSI | ||||||||
| Receives SSI | 198,457 | 17.5% | 34,140 | 6.3% | 134,484 | 44.1% | 16,944 | 38.1% |
| Geographic Area | ||||||||
| Vermont | 14,956 | 1.3% | 2,910 | 0.5% | 4,350 | 1.4% | 270 | 0.6% |
| New Haven- Milford | 31,451 | 2.8% | 10,396 | 1.9% | 7,016 | 2.3% | 767 | 1.7% |
| Bridgeport- Stamford- Norwalk | 19,831 | 1.8% | 8,651 | 1.6% | 5,538 | 1.8% | 716 | 1.6% |
| Milwaukee- Waukesha- West Allis | 34,094 | 3.0% | 7,787 | 1.4% | 8,373 | 2.7% | 706 | 1.6% |
| San Francisco- Oakland- Fremont | 82,586 | 7.3% | 48,047 | 8.8% | 29,542 | 9.7% | 3,173 | 7.1% |
| Boston- Cambridge- Quincy | 147,750 | 13.1% | 46,386 | 8.5% | 43,124 | 14.1% | 4,799 | 10.8% |
| Durham- Chapel Hill | 11,877 | 1.1% | 4,271 | 0.8% | 1,380 | 0.5% | 206 | 0.5% |
| Richmond | 11,005 | 1.0% | 28,114 | 5.2% | 1,185 | 0.4% | 2,614 | 5.9% |
| New York- Northern New Jersey- Long Island | 628,304 | 55.5% | 349,780 | 64.4% | 182,507 | 59.8% | 29,141 | 65.5% |
| Columbus | 51,159 | 4.5% | 12,417 | 2.3% | 7,107 | 2.3% | 739 | 1.7% |
| Akron | 25,598 | 2.3% | 5,536 | 1.0% | 3,467 | 1.1% | 260 | 0.6% |
| Cleveland | 72,526 | 6.4% | 18,610 | 3.4% | 11,564 | 3.8% | 1,114 | 2.5% |
C. Estimate Proportion of HUD-Assisted Medicare Beneficiaries with Enrollment in Part D Subsidy Assistance Programs or Medical Savings Program (i.e., Medicaid)
As detailed in an October 2012 CBPP memo,35 HUD-assisted individuals may have unreimbursed medical expenses deducted from their income for the purpose of determining the level of assistance provided by HUD. According to the CBPP, approximately 700,000 assisted households claim such expenses, which increase HUD rental subsidy costs by $400 to $500 million per year. Therefore, HUD is interested in understanding what proportion of HUD-assisted Medicare beneficiaries are enrolled in programs that could reduce their out-of-pocket health care expenses and therefore reduce HUD's costs. These programs include:
Medicare Part D (drug coverage) LIS. Medicare Part D provides coverage for prescription medications and the LIS program assists beneficiaries with paying the premium and out-of-pocket expenses for their medication.
Medicare Savings Program. This is more commonly referred to as being a MME. Medicare beneficiaries may be eligible for Medicaid to assist with out-of-pocket expenses and to receive Medicaid-covered services that are not covered by Medicare (e.g., transportation).
Table C9 and Table C10 present the proportion of assisted Medicare beneficiaries, age 65 years or older enrolled in Part D LIS and Medicaid. Approximately 90% of the Medicare beneficiaries had Part D coverage. Among those with Part D coverage, 82% received premium and out-of-pocket assistance. This proportion increased to 90% among those under age 65. Approximately 72% of Medicare beneficiaries were dually enrolled in Medicare and Medicaid (83% of beneficiaries under age 65; 68% of beneficiaries age 65 and over). The majority (68%) of MMEs were QMB plus (receiving Medicaid assistance with Medicare expenses and fully eligible for Medicaid-covered services). Almost all of the remaining beneficiaries were "Other dual" (QDWIs not eligible for SLMB or QMB). These proportions were similar in both individuals under age 65 and age 65 or older. As expected, the Medicaid basis for eligibility was largely blind/disabled (95%) for beneficiaries under age 65 while for beneficiaries age 65 years or older it was aged (77%) followed by blind/disabled (23%). Among the 8% of all Medicare and Medicaid beneficiaries who had 1915c waiver, 78% was for aged or aged/disabled. Among beneficiaries less than 65 years of age with a 1915c waiver, almost 60% received the mental retardation and other developmental disabilities (MR/DD) waiver.
| Medicare Beneficiaries | Total | Under Age 65 | Age 65+ |
| Total | 407,622 | 110,395 | 297,227 |
| Part D Beneficiaries | 365,812 | 102,927 | 262,885 |
| Percent of Medicare Beneficiaries | 89.7% | 93.2% | 88.5% |
| Part D LIS Participants | 301,537 | 92,142 | 209,395 |
| Percent of Part D with LIS | 82.4% | 89.5% | 79.7% |
| Percent of Medicare with Part D LIS | 74.0% | 83.5% | 70.4% |
| Percent of Medicare without Part D LIS | 26.0% | 16.5% | 29.6% |
It is important to note that the results presented in Table C9 and Table C10 are the proportion of all HUD-assisted Medicare beneficiaries who match based on the restrictive match criteria. It is not the proportion of HUD-assisted Medicare beneficiaries who are eligible for these programs based on national criteria for Part D LIS and criteria established by each state for Medicaid benefits. In other words, we would not expect the proportion to be 100% as not all HUD-assisted Medicare beneficiaries are eligible for these programs because the income criteria for HUD-assisted housing can be higher than that for health insurance assistance.
| Medicare Beneficiaries | Total | Under Age 65 | Age 65+ |
| Total Medicare beneficiaries | 407,622 | 110,395 | 297,227 |
| Medicare beneficiaries dually enrolled with Medicaid (MMEs) | 293,317 | 91,564 | 201,753 |
| Percent of Medicare with Medicaid | 72.0% | 82.9% | 67.9% |
| Percent of Medicare without Medicaid | 28.0% | 17.1% | 32.1% |
| Medicare and Medicaid eligibility status | 293,317 | 91,564 | 201,753 |
| QMB only | 3.7% | 4.9% | 3.1% |
| QMB plus | 66.9% | 64.8% | 67.8% |
| SLMB only | 3.7% | 3.4% | 3.8% |
| SLMB Plus | 1.6% | 1.8% | 1.5% |
| Other dual | 23.3% | 23.6% | 23.2% |
| NA | 0.8% | 1.4% | 0.5% |
| Medicaid basis for eligibility | 293,317 | 91,564 | 201,753 |
| Aged | 53.2% | 0.1% | 77.3% |
| Blind/disabled | 45.3% | 95.3% | 22.6% |
| Child | 0.0% | 0.0% | 0.0% |
| Adult | 1.4% | 4.5% | 0.1% |
| Other child of unemployed adult | 0.0% | 0.1% | 0.0% |
| Medicaid maintenance of assistance | 293,317 | 91,564 | 201,753 |
| Receiving cash or eligible under Section 1931 of the Act | 58.2% | 48.4% | 62.7% |
| Medically needy | 13.7% | 14.9% | 13.2% |
| Poverty-related (includes children eligible under SCHIP expansion) | 18.3% | 23.9% | 15.8% |
| Other | 7.6% | 9.5% | 6.8% |
| Foster care child | 0.0% | 0.0% | 0.0% |
| 1115 demonstration expansion eligible | 2.1% | 3.2% | 1.6% |
| Unknown | 0.0% | 0.0% | 0.0% |
| Missing | 0.0% | 0.1% | 0.0% |
| Beneficiaries with 1915c waiver status code | 23,356 | 6,399 | 16,957 |
| Percent of Medicare/Medicaid beneficiaries with 1915c waiver status code | 8.0% | 7.0% | 8.4% |
| Type of 1915c waiver status code (among beneficiaries with a waiver) | |||
| Aged and disabled | 54.3% | 25.0% | 65.4% |
| Aged | 23.6% | 1.5% | 31.9% |
| Disabled | 3.0% | 10.4% | 0.1% |
| Brain injured | 0.3% | 1.1% | 0.01% |
| HIV-AIDS | 0.7% | 2.2% | 0.1% |
| MR/DD | 18.1% | 59.7% | 2.4% |
| Mentally ill/severely emotionally disturbed | 0.0% | 0.0% | 0.0% |
| Technology-dependent/medically fragile | 0.0% | 0.02% | 0.0% |
D. Compare Medicare and Medicaid Payment and Utilization for HUD-Assisted Beneficiaries and Unassisted Beneficiaries in the Community in the 12 Study Jurisdictions
After we identified the HUD-assisted individuals who were Medicare and/or Medicaid beneficiaries in 2008, the next objective was to compare HUD-assisted Medicare beneficiaries to unassisted beneficiaries in the community with regards to enrollment, chronic conditions, health care payment and utilization. Before comparing groups of beneficiaries, we first refined our study sample of Medicare beneficiaries (both HUD-assisted and unassisted beneficiaries in the 12 study jurisdictions). Figure C1 presents a graphical depiction of the inclusion criteria. Medicare beneficiaries had to be enrolled in Part AHospital and Part B Physician Services for all 12 months of 2008 or up until death and not have any Medicare managed care (i.e., Medicare Part C or Medicare Advantage)36 enrollment in 2008. This reduced the sample of Medicare beneficiaries 38%, down to 3.6 million. Approximately 7% of the Medicare beneficiaries were HUD-assisted individuals and 93% were unassisted in the community (data not shown).
FIGURE C1. Inclusion Criteria for HUD-Assisted and Unassisted Medicare Beneficiaries for Payment and Utilization Comparison
We expected HUD-assisted beneficiaries to differ dramatically from unassisted beneficiaries in the community with regards to health status, utilization, and payment given the differences in demographic factors (e.g., race, income) and Medicare and Medicaid program eligibility due to low income (e.g., Part D LIS and Medicaid participation defined above in Section C). This was supported by preliminary comparisons of HUD-assisted Medicare beneficiaries age 65+ and unassisted Medicare beneficiaries age 65+ in the community. We found:
After limiting our sample to HUD-assisted Medicare beneficiaries with continuous enrollment in Medicare Parts A and B with no Medicare managed care during 2008, approximately 70% of HUD-assisted Medicare FFS beneficiaries age 65+ were dually enrolled in Medicaid compared to only 13% of unassisted Medicare FFS beneficiaries in the community.
The average total medical and prescription drug PMPM Medicare paid was $1,479 for HUD-assisted Medicare FFS beneficiaries age 65+ compared to only $937 for unassisted Medicare FFS beneficiaries age 65+ in the community.
The higher expenditures for HUD-assisted Medicare beneficiaries likely reflects the much higher proportion of MMEs in the HUD-assisted sample. According to a recent study by the Kaiser Family Foundation, spending for MMEs was 1.8 times higher than for Medicare/No Medicaid counterparts.37 Based on this knowledge, we stratified the Medicare beneficiaries into five sub-groups in an attempt to group similar beneficiaries into distinct samples to reduce variability between the HUD-assisted beneficiaries to the unassisted beneficiaries when comparing their Medicare enrollment characteristics and health care utilization and payment. We stratified the sample into five sub-groups:
Sub-groupA (MMEs, all ages): MMEs, with no SNF or nursing facility38 use in 2008.
Sub-group A1 (MMEs, age 65+): MMEs, Age 65+, with no SNF or nursing facility use in 2008.
Sub-group B (MMEs, all ages, SNF or nursing facility use): MMEs, with >0 and 365 days of SNF or nursing facility use in 2008 (results presented in Appendix D only).
Sub-group C (Medicare/No Medicaid): Medicare beneficiaries with no Medicaid enrollment, no SNF use in 2008.
Sub-group C1 (Medicare/No Medicaid, age 65+): Medicare beneficiaries with no Medicaid enrollment, age 65+, no SNF use in 2008.
Table C11 presents the sample sizes for each of these five sub-groups on which we conducted comparisons of HUD-assisted Medicare beneficiaries to unassisted beneficiaries. We further stratified the HUD-assisted individuals by length of time receiving assistance during 2008 -- full year or part of the year.
| HUDFull | HUDPartial | Total HUD-Assisted Beneficiaries | Unassisted Beneficiariesin the Community | Total | |
| Exclusion Criteria | |||||
| All Medicare Beneficiaries | 362,162 | 45,460 | 407,622 | 5,345,040 | 5,752,662 |
| Medicare benes enrolled in A&B for entire 12 month period or up until death | 326,707 | 36,450 | 363,157 | 4,435,917 | 4,799,074 |
| No managed care/HMO (Medicare FFS only) | 232,630 | 26,807 | 259,437 | 3,302,595 | 3,562,032 |
| Sub-group sample sizes | |||||
| Sub-group A: Medicare/ Medicaid benes, no SNF or NF days | 162,010 | 15,046 | 177,056 | 446,751 | 623,807 |
| Sub-group A1: Age 65+ | 104,416 | 7,629 | 112,045 | 249,490 | 361,535 |
| Sub-group B: Medicare/ Medicaid benes with >0 and 365 SNF/NF days | 12,684 | 3,875 | 16,559 | 86,626 | 103,185 |
| Sub-group C: Medicare/No Medicaid, 65+ | 45,566 | 5,406 | 50,972 | 2,453,763 | 2,504,735 |
| Sub-group C1: Medicare/ No Medicaid, 65+, No SNF days | 42,286 | 4,520 | 46,806 | 2,318,394 | 2,365,200 |
1. Comparison of HUD-assisted fee-for-service MMEs and unassisted fee-for-service MMEs in the community, age 65+ in 12 study jurisdictions, 2008 (sub-group A1)
In 2008 in the 12 study jurisdictions, there were 112,045 HUD-assisted MMEs and 249,490 unassisted MMEs in the community age 65+. Tables C12-C17 present the findings when comparing HUD-assisted MMEs and unassisted MMEs in the community. Sub-group A1 consists of Medicare beneficiaries who were also enrolled in Medicaid, age 65 years or older without any utilization of SNF or nursing facility.
Table C12 compares the demographic characteristics between the HUD-assisted MMEs and unassisted MMEs. The two samples were statistically significantly different across all characteristics. However, the statistical difference is expected given the large sample size and it does not always equate to a meaningful difference. HUD-assisted MMEs had a higher proportion of Blacks (18% vs. 14%) and a lower proportion of Asian/Pacific Islander (13% vs. 18%). The distribution of beneficiaries differs slightly by geography. A higher proportion of HUD-assisted MMEs reside in Boston than unassisted beneficiaries (14% vs. 10%) and a lower proportion in Vermont (2% vs. 4%) and Milwaukee (3% vs. 5%). A higher proportion of unassisted MMEs died in 2008 than HUD-assisted MMEs (3% vs. 2%).
| Demographic Characteristics | HUD-Assisted MMEs(N=112,045) | Unassisted MMEs(N=249,490) | ||
| N | % | N | % | |
| * Cell sizes less than 11 are not displayed. | ||||
| Race (based on RTI variable) | ||||
| Non-Hispanic White | 49,781 | 44.4% | 109,981 | 44.1% |
| Hispanic | 23,948 | 21.4% | 50,563 | 20.3% |
| Black | 20,116 | 18.0% | 35,837 | 14.4% |
| Asian/Pacific Islander | 14,949 | 13.3% | 45,773 | 18.3% |
| American Indian/Alaska Native | 107 | 0.1% | 418 | 0.2% |
| Other | 2,796 | 2.5% | 6,289 | 2.5% |
| Unknown | 348 | 0.3% | 629 | 0.3% |
| Age Group | ||||
| 65 to 74 | 51,253 | 45.7% | 110,126 | 44.1% |
| 75 to 79 | 24,728 | 22.1% | 50,505 | 20.2% |
| 80 to 84 | 19,715 | 17.6% | 42,357 | 17.0% |
| 85+ | 16,349 | 14.6% | 46,502 | 18.6% |
| Geographic Area | ||||
| Vermont | 2,621 | 2.3% | 10,881 | 4.4% |
| New Haven- Milford | 2,348 | 2.1% | 4,408 | 1.8% |
| Bridgeport- Stamford- Norwalk | 2,023 | 1.8% | 3,541 | 1.4% |
| Milwaukee- Waukesha- West Allis | 3,565 | 3.2% | 12,130 | 4.9% |
| San Francisco- Oakland- Fremont | 14,144 | 12.6% | 32,726 | 13.1% |
| Boston- Cambridge- Quincy | 15,702 | 14.0% | 25,419 | 10.2% |
| Durham- Chapel Hill | 467 | 0.4% | 2,134 | 0.9% |
| Richmond | 290 | 0.3% | 2,933 | 1.2% |
| New York- Northern New Jersey- Long Island | 64,345 | 57.4% | 137,642 | 55.2% |
| Columbus | 1,930 | 1.7% | 4,572 | 1.8% |
| Akron | 979 | 0.9% | 1,930 | 0.8% |
| Cleveland | 3,631 | 3.2% | 7,558 | 3.0% |
| Missing | * | 0.0% | 3,616 | 1.4% |
| Died during the year | 1,719 | 1.5% | 6,456 | 2.6% |
Table C13 presents the comparison of Medicare and Medicaid coverage and enrollment characteristics. Although our sample is limited to those dually eligible for Medicare and Medicaid, the basis for Medicaid eligibility differs for those receiving HUD assistance compared to those not receiving HUD assistance. Approximately 24% of HUD-assisted MMEs' basis for Medicaid eligibility was blind/disabled compared to only 15% of unassisted MMEs. Similarly, a higher proportion of HUD-assisted MMEs' Medicaid maintenance of assistance was due to receiving cash or eligibility under Section 1931 (68% vs. 55%) and a lower proportion was due to being medically needy39 (10% vs. 15%) or poverty-related (15% vs. 19%). Finally, HUD-assisted Medicare and Medicaid beneficiaries are more likely to be QMB plus (78% vs. 65%) than unassisted beneficiaries.
| Topic Area | HUD-Assisted MMEs(N=112,045) | Unassisted MMEs in the Community(N=249,490) | ||
| N | % | N | % | |
| * Cell sizes less than 11 are not displayed. | ||||
| Medicaid Basis for Eligibility | ||||
| Aged | 85,635 | 76.4% | 212,431 | 85.1% |
| Blind/disabled | 26,349 | 23.5% | 36,636 | 14.7% |
| Child | * | 0.0% | * | 0.0% |
| Adult | 49 | 0.0% | 234 | 0.1% |
| Other/missing/unknown | * | 0.0% | 187 | 0.1% |
| Medicaid Maintenance of Assistance | ||||
| Receiving cash or eligible under Section 1931 of the Act | 76,083 | 67.9% | 136,914 | 54.9% |
| Medically needy | 11,346 | 10.1% | 36,414 | 14.6% |
| Poverty-related (includes children eligible under SCHIP expansion) | 16,497 | 14.7% | 46,345 | 18.6% |
| Other | 5,940 | 5.3% | 16,739 | 6.7% |
| Foster care child | * | 0.0% | * | 0.0% |
| 1115 demonstration expansion eligible | 2,169 | 1.9% | 12,896 | 5.2% |
| Unknown/missing | * | 0.0% | 182 | 0.1% |
| Medicare and Medicaid Eligibility Status | ||||
| QMB only | 3,138 | 2.8% | 8,829 | 3.5% |
| QMB plus | 87,111 | 77.7% | 163,146 | 65.4% |
| SLMB only | 3,567 | 3.2% | 11,540 | 4.6% |
| SLMB Plus | 1,317 | 1.2% | 3,020 | 1.2% |
| Other dual | 16,817 | 15.0% | 62,374 | 25.0% |
| Unknown | * | 0.0% | 174 | 0.1% |
| NA | 85 | 0.1% | 407 | 0.2% |
Note: We initially separated HUD-assisted MMEs into those receiving HUD assistance all year vs. a portion of the year. There were no meaningful differences between the two samples so we combined them. See Appendix D for results separated by partial vs. all year receiving HUD assistance.
Table C14 compares the presence and count of chronic conditions among the Sub-group A1 HUD-assisted MMEs and unassisted MMEs in the community. HUD-assisted MMEs are, on average, more chronically ill than the unassisted MMEs. First, HUD-assisted MMEs are more likely to have multiple chronic diseases; 55% have five or more compared to 43% of unassisted MMEs. The prevalence of eight of the nine chronic condition categories is also higher among HUD-assisted MMEs. The one exception is Alzheimer's which is 1 percentage point higher (16% vs. 15%) among unassisted MMEs which is most likely due to the fact that individuals with Alzheimer's and related diseases tend to require more care than can be provided in a public housing or related property.
| CCW Condition | HUD-Assisted MMEs(N=112,045) | Unassisted MMEs in the Community(N=249,490) | ||
| N | % | N | % | |
| Prevalence of Chronic Conditions | ||||
| 0 conditions | 6,031 | 5.4% | 24,404 | 9.8% |
| 1 condition | 6,571 | 5.9% | 20,686 | 8.3% |
| 2 conditions | 9,765 | 8.7% | 27,678 | 11.1% |
| 3 conditions | 13,398 | 12.0% | 34,387 | 13.8% |
| 4 conditions | 15,210 | 13.6% | 34,878 | 14.0% |
| 5 or more conditions | 61,070 | 54.5% | 107,457 | 43.1% |
| Prevalence of Chronic Conditions by Category | ||||
| Cardiovascular | 62,012 | 55.3% | 120,344 | 48.3% |
| Cancer | 9,162 | 8.2% | 17,269 | 6.9% |
| Endocrine and Renal | 60,076 | 53.6% | 118,124 | 47.4% |
| Alzheimer's-related | 16,427 | 14.7% | 39,691 | 15.9% |
| Depression | 18,603 | 16.6% | 28,774 | 11.5% |
| Musculoskeletal | 55,129 | 49.2% | 94,354 | 37.9% |
| Pulmonary | 21,352 | 19.0% | 39,209 | 15.7% |
| Opthalmic | 42,910 | 38.3% | 76,172 | 30.6% |
| Other (Anemia, Hyperlipidemia, Hyperplasia, Hypertension) | 96,642 | 86.2% | 196,465 | 78.8% |
Table C15 provides a comparison of health care service utilization between HUD-assisted MMEs and unassisted MMEs in Sub-group A1 (dually eligible for Medicaid, age 65 years or older, with no SNF/nursing facility use in 2008). With the exception of dialysis, the difference in utilization (as defined as per 1,000 member months) was statistically significant for all health care services. HUD-assisted MMEs were higher utilizers of health care services. The higher utilization was most notable for home health visits (31% higher), ASC visits (45% higher), other procedures (78% higher), DME (22% higher), and Part B and D drugs (22% and 24% higher, respectively). HUD-assisted MMEs also had a 26% higher rate of physician office visits and 13% higher rate of total emergency room visits. In addition, the proportion of HUD-assisted MMEs with any use was statistically significantly higher across all services but dialysis (data not shown, see Appendix D). As expected, this higher utilization resulted in higher average medical and pharmacy PMPM payments for HUD-assisted MMEs than unassisted MMEs ($1,222 vs. $1,054) (data not shown, see Appendix D).
| Medicare Services Annual Utilization per 1000 Member Months1 | HUD-Assisted MMEs(N=112,045) | Unassisted MMEs(N=249,490) | Ratio of HUD-Assistedvs. Unassisted |
| Mean | Mean | ||
NOTES:
** p0.01; * p0.05 | |||
| Total Admissions | 32.8 | 30.9 | 1.06** |
| Acute stay admissions | 31.4 | 29.4 | 1.07** |
| Other inpatient admissions2 | 1.4 | 1.6 | 0.90** |
| Hospital Readmissions | 5.2 | 4.9 | 1.06* |
| Medicare HH visits | 581.5 | 445.5 | 1.30* |
| Medicare hospice days | 36.9 | 208.1 | 0.18* |
| Hospital Outpatient visits3 | 686.5 | 590.5 | 1.16** |
| Total ER visits | 58.4 | 51.6 | 1.13** |
| ER visits without an admission | 36.6 | 30.6 | 1.19** |
| ER visits resulting in an admission | 21.9 | 21.0 | 1.04** |
| Physician office visits | 1,652.3 | 1,307.9 | 1.26** |
| ASC visits | 14.5 | 10.0 | 1.45** |
| Dialysis events | 17.0 | 17.3 | 0.98 |
| Anesthesia events | 27.8 | 23.7 | 1.17** |
| Imaging events | 510.5 | 420.1 | 1.21** |
| Test events | 1,762.2 | 1,428.5 | 1.23** |
| Other procedures | 1,464.6 | 821.6 | 1.78** |
| DME | 369.2 | 301.4 | 1.22** |
| Part B Drugs | 296.1 | 241.8 | 1.22** |
| Part D Drugs4 | 5,080.1 | 4,094.3 | 1.24** |
The higher utilization of health care services among MMEs receiving HUD assistance than beneficiaries without HUD assistance is even more apparent when comparing utilization and payments of Medicaid-covered services40 (Table C16 and Table C17). HUD-assisted MMEs used over 100% more Personal Care services,41 80% more other HCBS, and 67% more DME services covered by Medicaid than unassisted MMEs. This suggests that the poorer health status of HUD-assisted MMEs increases their likelihood of needing HCBS and/or relationships between the property management and community supports make these services more available to HUD-assisted individuals.
| Topic Area | HUD-Assisted MMEs | Unassisted MMEs | Ratio of HUD-Assisted vs. Unassisted | ||
| N | % | N | % | ||
NOTE:
** p0.01; * p0.05 | |||||
| Limited to individuals with Medicaid FFS | 106,764 | 95% | 227,186 | 91% | |
| Mean | SD | Mean | SD | ||
| Personal care services | 4,512.4 | 10,047.1 | 2,149.1 | 7,128.2 | 2.09** |
| Residential care | 38.9 | 683.0 | 63.7 | 1,164.3 | 0.61** |
| DME | 380.0 | 946.2 | 227.7 | 746.9 | 1.67** |
| Other HCBS (private duty nursing, adult day care, HH, rehab, targeted case management, transportation, and hospice) | 3,309.8 | 8,321.7 | 1,840.6 | 6,675.4 | 1.79** |
On the other hand, unassisted MMEs used 60% more Residential Care services than unassisted MMEs. Residential care settings, including assisted living facilities, have traditionally provided assistance and oversight to persons with physical and mental impairments who cannot live at home alone, but do not require a nursing home level of care. As such, residential care lies on the long-term care continuum between home care and nursing facility care. Since residential care settings generally require licensure by the state, HUD properties generally do not provide Medicaid reimbursed residential care. This higher utilization drove the 32% higher average Medicaid PMPM for HUD-assisted MMEs compared to unassisted MMEs ($1,180 vs. $895). (Data not shown,see Appendix D.)
| HUD-Assisted MMEs | Unassisted MMEs | Ratio of HUD-Assistedvs. Unassisted | |||
| N | % | N | % | ||
NOTE:
** p0.01; * p0.05 | |||||
| Personal Care services | 30,186 | 28% | 32,885 | 14% | 0.92** |
| Residential care | 1,931 | 2% | 2,696 | 1% | 0.72** |
| DME | 53,927 | 51% | 79,598 | 35% | 0.67** |
| Other HCBS | 43,929 | 41% | 57,815 | 25% | 0.76** |
Sub-group A: Medicare/Medicaid Beneficiaries, No SNF or Nursing Facility Days
We also compared demographic, enrollment, and health care payment and utilization for all Medicare/Medicaid beneficiaries with no SNF or nursing facility days, regardless of age (Sub-group A1 in Table C11 above). This almost doubled the sample size from 361,535 when limited to individuals age 65 years or older to 623,807. The tables providing this comparison are included in Appendix D. In summary, the findings are similar to those highlighted for Sub-group A1 (when limited to individuals 65 years or older) with a couple of exceptions. Most notably, although the HUD-assisted Medicare/Medicaid beneficiaries have much higher Medicare and Medicaid health care service utilization, the Medicaid spending PMPM was actually 6% lower for the unassisted Medicare/Medicaid beneficiaries. This is largely driven by the lower payment for residential services ($47 for HUD-assisted beneficiaries vs. $165 for unassisted beneficiaries).
2. Comparison of HUD-Assisted FFS Medicare/No Medicaid42 Beneficiaries and Unassisted FFS Medicare/No Medicaid Beneficiaries in the Community, Age 65+ in 12 Study Jurisdictions, 2008 (Sub-group C1)
In 2008 in the 12 study jurisdictions, there were 46,806 FFS HUD-assisted Medicare/No Medicaid beneficiaries and 2,318,394 unassisted beneficiaries in the community age 65+. Tables C18-C20 compare HUD-assisted to unassisted Medicare/No Medicaid beneficiaries. Similar to the results for Sub-group A1 above, in this section the tables provide comparisons of demographic characteristics, Medicare enrollment characteristics, chronic conditions, and Medicare health care utilization and payments. Unlike the previous comparison of MMEs, estimates below do not control for income and, therefore, we would expect that the HUD-assisted Medicare/No Medicaid beneficiaries would generally have lower income and greater social determinants of health than their community counterparts.
Table C18 provides a comparison of the demographic and Medicare enrollment characteristics for HUD-assisted Medicare/No Medicaid beneficiaries relative to unassisted beneficiaries. HUD-assisted beneficiaries are much more likely to be female (71% vs. 57%), Black (24% vs. 7%), and 85 years and over (23% vs. 16%) than unassisted beneficiaries. HUD-assisted beneficiaries are also more likely to have received Medicare originally due to disability (15% vs. 6%) and receive Part D LIS (32% vs. 6%) than unassisted beneficiaries.
| HUD-Assisted Medicare/No Medicaid Beneficiaries(N=46,806) | Unassisted Medicare/No Medicaid Beneficiaries(N=2,318,394) | |||
| N | % | N | % | |
| Demographic Characteristics | ||||
| Gender | ||||
| Male | 13,428 | 28.7% | 997,877 | 43.0% |
| Female | 33,378 | 71.3% | 1,320,517 | 57.0% |
| Missing | 0 | 0.0% | 0 | 0.0% |
| Race (based on RTI variable) | ||||
| Non-Hispanic White | 30,115 | 64.3% | 2,023,130 | 87.3% |
| Hispanic | 4,460 | 9.5% | 75,090 | 3.2% |
| Black | 11,338 | 24.2% | 153,339 | 6.6% |
| Asian/Pacific Islander | 570 | 1.2% | 45,354 | 2.0% |
| American Indian/Alaska Native | 28 | 0.1% | 679 | 0.0% |
| Other | 258 | 0.6% | 18,994 | 0.8% |
| Unknown | 37 | 0.1% | 1,808 | 0.1% |
| Age Group | ||||
| 65 to 69 | 8,207 | 17.5% | 531,472 | 22.9% |
| 70 to 74 | 9,347 | 20.0% | 546,599 | 23.6% |
| 75 to 79 | 9,192 | 19.6% | 468,478 | 20.2% |
| 80 to 84 | 9,415 | 20.1% | 398,836 | 17.2% |
| 85+ | 10,645 | 22.7% | 373,009 | 16.1% |
| Medicare Coverage Characteristics | ||||
| Original reason for entitlement | ||||
| Old age and survivor's insurance | 39,829 | 85.1% | 2,181,228 | 94.1% |
| DIB | 6,921 | 14.8% | 134,856 | 5.8% |
| ESRD | 28 | 0.1% | 1,316 | 0.1% |
| Disability Insurance and ESRD | 28 | 0.1% | 994 | 0.0% |
| Medicare Part D coverage at any point during the year | 25,782 | 55.1% | 866,629 | 37.4% |
| Average months of Part D coverage (among those with Part D coverage) | 11.75 | 11.77 | ||
| Proportion with Part D LIS | ||||
| No Part D LIS (premium-subsidy nor cost sharing) | 16,279 | 63.1% | 774,363 | 89.4% |
| Part D LIS (Any premium-subsidy or cost sharing | 8,363 | 32.4% | 51,301 | 5.9% |
| Missing | 1,140 | 4.4% | 40,965 | 4.7% |
Table C19 shows the proportion of HUD-assisted and unassisted Medicare/No Medicaid beneficiaries with chronic conditions -- by count and type. Unlike the HUD-assisted MMEs age 65 or older (Sub-group A1 above), the HUD-assisted Medicare/No Medicaid beneficiaries of the same age group are more similar to the unassisted Medicare/No Medicaid beneficiaries with regards to health status. Approximately 14% of HUD-assisted Medicare/No Medicaid beneficiaries had zero chronic conditions compared to 13% of unassisted Medicare/No Medicaid beneficiaries. As highlighted in Table C14 above, only 5% of HUD-assisted had zero chronic conditions compared to 10% of unassisted Medicare/Medicaid beneficiaries. Not only were the proportions of the HUD-assisted and unassisted Medicare/No Medicaid beneficiaries with chronic conditions more similar than for the HUD and unassisted Medicare/Medicaid beneficiaries, the prevalence of chronic conditions was not consistently higher for the HUD-assisted Medicare/No Medicaid beneficiaries. In fact, the unassisted Medicare/No Medicaid beneficiaries had a higher proportion of cancer (10% vs. 9%) and ophthalmic (37% vs. 32%).
| CCW Condition | HUD-Assisted Medicare/No Medicaid Beneficiaries(N=46,806) | Unassisted Medicare/No Medicaid Beneficiaries(N=2,318,394) | ||
| N | % | N | % | |
| Prevalence of Chronic Conditions | ||||
| 0 conditions | 6,624 | 14.2% | 299,936 | 12.9% |
| 1 condition | 3,972 | 8.5% | 249,962 | 10.8% |
| 2 conditions | 5,245 | 11.2% | 312,462 | 13.5% |
| 3 conditions | 6,472 | 13.8% | 358,219 | 15.5% |
| 4 conditions | 6,669 | 14.2% | 339,586 | 14.6% |
| 5 or more conditions | 17,824 | 38.1% | 758,229 | 32.7% |
| Prevalence of Chronic Conditions by Category | ||||
| Cardiovascular | 20,638 | 44.1% | 952,061 | 41.1% |
| Cancer | 4,105 | 8.8% | 238,416 | 10.3% |
| Endocrine and renal | 19,313 | 41.3% | 800,924 | 34.5% |
| Alzheimer's-related | 3,543 | 7.6% | 179,304 | 7.7% |
| Depression | 3,930 | 8.4% | 167,119 | 7.2% |
| Musculoskeletal | 15,494 | 33.1% | 719,065 | 31.0% |
| Pulmonary | 6,777 | 14.5% | 246,619 | 10.6% |
| Opthalmic | 15,098 | 32.3% | 847,512 | 36.6% |
| Other (anemia, hyperlipidemia, hyperplasia, hypertension) | 35,030 | 74.8% | 1,696,319 | 73.2% |
Table C20 provides a comparison of Medicare health care utilization between the HUD-assisted Medicare/No Medicaid and unassisted Medicare/No Medicaid beneficiaries age 65 or older. Similarly to the variability between the higher prevalence of chronic conditions between the two groups, the utilization by HUD-assisted beneficiaries was higher for some services and lower for others when compared to unassisted beneficiaries. In particular, the HUD-assisted beneficiaries used 42% more emergency room visits per 1000 member months than unassisted beneficiaries. The admission rate was 19% higher and the readmission rate was 17% higher for HUD-assisted Medicare/No Medicaid beneficiaries. In addition, 29% of HUD-assisted Medicare/No Medicaid beneficiaries visited the emergency room at least one during 2008 compared to only 23% of unassisted Medicare/No Medicaid beneficiaries. Interestingly, the utilization of office visits was 1% lower for the HUD-assisted beneficiaries and 13% of HUD-assisted beneficiaries did not have any office visits during 2008 compared to 9% of unassisted beneficiaries (data not shown, see Appendix D). The HUD-assisted beneficiaries also had lower utilization of hospice services, ambulatory care surgery, tests, other services, and Part B pharmacy. Overall, the Medicare PMPM was 8% higher for HUD-assisted Medicare/No Medicaid beneficiaries than unassisted Medicare/No Medicaid beneficiaries ($617 vs. $574) (data not shown, see Appendix D).
| Medicare Services Annual Utilization per 1000 Member Months | HUD-AssistedMedicare Beneficiaries(N=46,806) | UnassistedMedicare Beneficiaries(N=2,318,394) | Ratio of HUD-Assistedvs. Unassisted |
| Mean | Mean | ||
NOTE:
** p0.01; * p0.05 | |||
| Total Admissions | 23.0 | 19.3 | 1.19** |
| Acute stay admissions | 21.7 | 18.2 | 1.19** |
| Other inpatient admissions1 | 1.3 | 1.1 | 1.20** |
| Hospital Readmissions | 2.7 | 2.3 | 1.17** |
| Medicare HH visits | 220.5 | 136.0 | 1.62** |
| Medicare hospice days | 36.5 | 77.6 | 0.47** |
| Total outpatient visits | 444.8 | 409.5 | 1.09** |
| Total ED visits | 43.0 | 30.4 | 1.42** |
| ED visits without an admission | 27.2 | 18.8 | 1.45** |
| ED visits resulting in an admission | 15.8 | 11.6 | 1.37** |
| Physician office visits | 1,145.2 | 1,129.1 | 1.01* |
| ASC visits | 12.7 | 16.0 | 0.79** |
| Dialysis events | 6.5 | 4.8 | 1.36** |
| Anesthesia events | 25.9 | 29.2 | 0.89** |
| Imaging events | 378.2 | 382.2 | 0.99* |
| Test events | 1,347.0 | 1,416.9 | 0.95** |
| Other procedures | 527.2 | 635.4 | 0.83** |
| DME | 180.7 | 139.0 | 1.30** |
| Part B Drugs | 205.7 | 242.2 | 0.85** |
| Part D Drugs | 2983.9 | 2496.0 | 1.20** |
Sub-group C: Medicare Only Beneficiaries, Age 65+ Years
We also compared demographic, enrollment, and health care payment and utilization for all Medicare/No Medicaid beneficiaries age 65+ years, regardless of SNF use during 2008. Approximately 8% of HUD-assisted Medicare/No Medicaid beneficiaries utilized SNF services in 2008 compared to 6% of unassisted Medicare/No Medicaid beneficiaries (see Table C11). Despite the slightly different proportion of SNF users in the two groups, we also conducted the comparison between HUD-assisted and unassisted Medicare/No Medicaid beneficiaries including individuals with SNF utilization in 2008. As expected, given the higher proportion of individuals with SNF utilization among the HUD-assisted group, the differences in utilization and payments widened. HUD-assisted Medicare/No Medicaid beneficiariesadmission rate was 29% higher than unassisted beneficiaries and the readmission utilization was 37% higher. Not surprisingly, HUD-assisted Medicare/No Medicaid beneficiaries had 18% higher payments than unassisted Medicare/No Medicaid beneficiaries (difference was only 8% when individuals with SNF utilization were excluded). See Appendix D for result tables.
APPENDIX D. SUPPLEMENTAL RESULTS, ALL YEARS
Objective A: Understand Demographic Characteristics of HUD-Assisted Individuals/Households in the 12 Study Jurisdictions
| All Ages | 2007(N=1,976,053) | 2008(N=2,057,893) | 2009(N=2,075,168) | |||
| N | % | N | % | N | % | |
| Full year participants | 1,703,863 | 86.2% | 1,783,202 | 86.7% | 1,812,869 | 87.4% |
| Partial year participants | 272,190 | 13.8% | 274,691 | 13.3% | 262,299 | 12.6% |
| Reason for Partial Year | ||||||
| Moved Out/Terminated | 110,767 | 40.7% | 110,370 | 40.2% | 114,352 | 43.6% |
| Moved in after Jan 1 | 161,423 | 59.3% | 164,321 | 59.8% | 147,947 | 56.4% |
| Total | 272,190 | 274,691 | 262,299 | |||
| Property Type | ||||||
| Public housing | 579,609 | 29.3% | 635,906 | 30.9% | 628,247 | 30.3% |
| Housing choice vouchers | 933,950 | 47.3% | 960,387 | 46.7% | 978,717 | 47.2% |
| Other multifamily | 381,442 | 19.3% | 381,078 | 18.5% | 388,287 | 18.7% |
| Section 202 | 63,860 | 3.2% | 63,033 | 3.1% | 61,282 | 3.0% |
| Section 811 & 202/162 | 3,970 | 0.2% | 3,993 | 0.2% | 4,125 | 0.2% |
| Other | 13,222 | 0.7% | 13,496 | 0.7% | 14,510 | 0.7% |
| Subsidy Type | ||||||
| Public housing | 581,145 | 29.4% | 638,584 | 31.0% | 631,419 | 30.4% |
| Housing choice vouchers | 939,231 | 47.5% | 969,140 | 47.1% | 987,160 | 47.6% |
| Project-Based Section 8 | 382,634 | 19.4% | 376,552 | 18.3% | 378,662 | 18.2% |
| Section 202 | 21,499 | 1.1% | 21,386 | 1.0% | 21,941 | 1.1% |
| Section 202/162 | 102 | 0.0% | 100 | 0.0% | 100 | 0.0% |
| Section 811 | 3,892 | 0.2% | 3,839 | 0.2% | 3,953 | 0.2% |
| Other | 47,550 | 2.4% | 48,292 | 2.3% | 51,933 | 2.5% |
| All Ages | 2007(N=383,576) | 2008(N=398,791) | 2009(N=407,428) | |||
| N | % | N | % | N | % | |
| Full year participants | 335,478 | 87.5% | 353,789 | 88.7% | 359,702 | 88.3% |
| Partial year participants | 48,098 | 12.5% | 45,002 | 11.3% | 47,726 | 11.7% |
| Reason for Partial Year | ||||||
| Moved Out/Terminated | 23,230 | 48.3% | 22,815 | 50.7% | 26,846 | 56.3% |
| Moved in after Jan 1 | 24,868 | 51.7% | 22,187 | 49.3% | 20,880 | 43.7% |
| Total | 48,098 | 45,002 | 47,726 | |||
| Property Type | ||||||
| Public housing | 113,601 | 29.6% | 123,557 | 31.0% | 124,536 | 30.6% |
| Housing choice vouchers | 94,704 | 24.7% | 100,504 | 25.2% | 106,168 | 26.1% |
| Other multifamily | 115,892 | 30.2% | 115,733 | 29.0% | 118,769 | 29.2% |
| Section 202 | 57,168 | 14.9% | 56,604 | 14.2% | 55,182 | 13.5% |
| Section 811 & 202/162 | 451 | 0.1% | 517 | 0.1% | 582 | 0.1% |
| Other | 1,760 | 0.5% | 1,876 | 0.5% | 2,191 | 0.5% |
| Subsidy Type | ||||||
| Public housing | 113,778 | 29.7% | 123,930 | 31.1% | 124,961 | 30.7% |
| Housing choice vouchers | 95,198 | 24.8% | 101,292 | 25.4% | 106,871 | 26.2% |
| Project-Based Section 8 | 141,873 | 37.0% | 140,804 | 35.3% | 141,077 | 34.6% |
| Section 202 | 21,056 | 5.5% | 20,969 | 5.3% | 21,532 | 5.3% |
| Section 202/162 | 63 | 0.0% | 66 | 0.0% | 62 | 0.0% |
| Section 811 | 451 | 0.1% | 507 | 0.1% | 567 | 0.1% |
| Other | 11,157 | 2.9% | 11,223 | 2.8% | 12,358 | 3.0% |
| All Ages | 2007(N=340,297) | 2008(N=352,091) | 2009(N=357,207) | |||
| N | % | N | % | N | % | |
| Full year participants | 298,227 | 87.6% | 313,035 | 88.9% | 316,008 | 88.5% |
| Partial year participants | 42,070 | 12.4% | 39,056 | 11.1% | 41,199 | 11.5% |
| Reason for Partial Year | ||||||
| Moved Out/Terminated | 21,306 | 50.6% | 20,876 | 53.5% | 24,361 | 59.1% |
| Moved in after Jan 1 | 20,764 | 49.4% | 18,180 | 46.5% | 16,838 | 40.9% |
| Total | 42,070 | 39,056 | 41,199 | |||
| Property Type | ||||||
| Public housing | 98,198 | 28.9% | 106,306 | 30.2% | 106,502 | 29.8% |
| Housing choice vouchers | 80,376 | 23.6% | 84,635 | 24.0% | 88,421 | 24.8% |
| Other multifamily | 105,213 | 30.9% | 104,914 | 29.8% | 107,208 | 30.0% |
| Section 202 | 54,885 | 16.1% | 54,560 | 15.5% | 53,159 | 14.9% |
| Section 811 & 202/162 | 331 | 0.1% | 336 | 0.1% | 364 | 0.1% |
| Other | 1,294 | 0.4% | 1,340 | 0.4% | 1,553 | 0.4% |
| Subsidy Type | ||||||
| Public housing | 98,352 | 28.9% | 106,634 | 30.3% | 106,880 | 29.9% |
| Housing choice vouchers | 80,792 | 23.7% | 85,296 | 24.2% | 89,015 | 24.9% |
| Project-Based Section 8 | 130,651 | 38.4% | 129,608 | 36.8% | 129,308 | 36.2% |
| Section 202 | 20,319 | 6.0% | 20,399 | 5.8% | 20,932 | 5.9% |
| Section 202/162 | 56 | 0.0% | 58 | 0.0% | 56 | 0.0% |
| Section 811 | 322 | 0.1% | 333 | 0.1% | 362 | 0.1% |
| Other | 9,805 | 2.9% | 9,763 | 2.8% | 10,654 | 3.0% |
| Number of Household Heads | 303,695 | 311,657 | 314,014 | |||
| 2007-2008 | 2008-2009 | 2007-2009 | ||||
| N | % | N | % | N | % | |
| All ages | 2,277,570 | 100.0% | 2,292,744 | 100.0% | 2,490,435 | 100.0% |
| Full year participants | 1,478,133 | 64.9% | 1,556,238 | 67.9% | 1,299,352 | 52.2% |
| Partial year participants | 799,437 | 35.1% | 736,506 | 32.1% | 1,191,083 | 47.8% |
| 62+ | 454,076 | 100.0% | 445,035 | 100.0% | 481,175 | 100.0% |
| Full year participants | 324,974 | 71.6% | 328,151 | 73.7% | 289,885 | 60.2% |
| Partial year participants | 129,102 | 28.4% | 116,884 | 26.3% | 191,290 | 39.8% |
| 65+ | 402,714 | 100.0% | 391,434 | 100.0% | 424,729 | 100.0% |
| Full year participants | 288,879 | 71.7% | 289,667 | 74.0% | 256,851 | 60.5% |
| Partial year participants | 113,835 | 28.3% | 101,767 | 26.0% | 167,878 | 39.5% |
| 2007 | 2008 | 2009 | ||||
| N | % | N | % | N | % | |
| Individuals, All Ages | 1,976,053 | 100.0% | 100.0% | 2,075,168 | 100.0% | |
| Living Arrangement | ||||||
| Lives Alone | 437,101 | 22.1% | 450,410 | 21.9% | 456,085 | 22.0% |
| Lives with Spouse | 85,453 | 4.3% | 89,066 | 4.3% | 90,291 | 4.4% |
| Other Adults | 129,066 | 6.5% | 144,705 | 7.0% | 154,862 | 7.5% |
| Minor(s) in Household | 1,299,636 | 65.8% | 1,345,190 | 65.4% | 1,341,700 | 64.7% |
| Live-in Aide | 5,870 | 0.3% | 7,039 | 0.3% | 7,884 | 0.4% |
| Other | 327 | 0.0% | 283 | 0.0% | 282 | 0.0% |
| Unknown/declined to report | 18,600 | 0.9% | 21,200 | 1.0% | 24,064 | 1.2% |
| Individuals, Age 62+ | 383,576 | 100.0% | 398,791 | 100.0% | 407,428 | 100.0% |
| Living Arrangement | ||||||
| Lives Alone | 260,849 | 68.0% | 267,751 | 67.1% | 271,561 | 66.7% |
| Lives with Spouse | 65,851 | 17.2% | 68,694 | 17.2% | 70,178 | 17.2% |
| Other Adults | 27,398 | 7.1% | 30,603 | 7.7% | 32,351 | 7.9% |
| Minor(s) in Household | 22,883 | 6.0% | 24,130 | 6.1% | 24,282 | 6.0% |
| Live-in Aide | 1,553 | 0.4% | 1,877 | 0.5% | 2,143 | 0.5% |
| Other | 36 | 0.0% | 38 | 0.0% | 36 | 0.0% |
| Unknown/declined to report | 5,006 | 1.3% | 5,698 | 1.4% | 6,877 | 1.7% |
| Living with Minor(s) in the Household | ||||||
| Age 62+ with minor(s) in the home | 22,883 | 6.0% | 24,130 | 6.1% | 24,282 | 6.0% |
| Age 62+ without minor(s) in the home | 360,693 | 94.0% | 374,661 | 93.9% | 383,146 | 94.0% |
| 2007 | 2008 | 2009 | ||||
| N | % | N | % | N | % | |
| Household Heads, All Ages | 939,775 | 100.0% | 967,557 | 100.0% | 971,094 | 100.0% |
| Living arrangement--By Household | ||||||
| Lives Alone | 435,146 | 46.3% | 448,556 | 46.4% | 454,313 | 46.8% |
| Lives with Spouse | 45,794 | 4.9% | 45,985 | 4.8% | 45,131 | 4.6% |
| Other Adults | 63,408 | 6.7% | 68,751 | 7.1% | 71,227 | 7.3% |
| Children in Household | 386,513 | 41.1% | 394,260 | 40.7% | 388,653 | 40.0% |
| Live-in Aide | 2,690 | 0.3% | 3,131 | 0.3% | 3,477 | 0.4% |
| Other | 94 | 0.0% | 78 | 0.0% | 74 | 0.0% |
| Unknown/declined to report | 6,130 | 0.7% | 6,796 | 0.7% | 8,219 | 0.8% |
| Unique Individuals Receiving PublicHousing Subsidy During 2008(N=2,057,893) | ||
| Mean | SD | |
| Age | ||
| Age--All Persons | 34.89 | 25.32 |
| Age--Household Heads | 54.22 | 18.77 |
| N | % | |
| Gender | ||
| Male | 765,169 | 37.2% |
| Female | 1,291,140 | 62.7% |
| Unknown/declined to report | 1,584 | 0.1% |
| Age Group | ||
| 18 | 764,543 | 37.2% |
| 18-44 | 566,059 | 27.5% |
| 45-61 | 327,067 | 15.9% |
| 62-64 | 46,700 | 2.3% |
| 65+ | 352,091 | 17.1% |
| Unknown/declined to report | 1,433 | 0.1% |
| Race/Ethnicity | ||
| White non-Hispanic | 331,944 | 16.1% |
| Hispanic | 489,337 | 23.8% |
| Black non-Hispanic | 773,550 | 37.6% |
| Asian | 56,934 | 2.8% |
| American Indian/Alaskan | 3,699 | 0.2% |
| Hawaiian/Pacific Islander | 2,762 | 0.1% |
| Other non-Hispanic | 259 | 0.0% |
| Mixed non-Hispanic | 275 | 0.0% |
| Unknown/declined to report | 399,133 | 19.4% |
| Property Type | ||
| Public housing | 635,906 | 30.9% |
| Housing choice vouchers | 960,387 | 46.7% |
| Other multifamily | 381,078 | 18.5% |
| Section 202 | 63,033 | 3.1% |
| Section 811 & 202/162 | 3,993 | 0.2% |
| Other | 13,496 | 0.7% |
| Subsidy Type | ||
| Public housing | 638,584 | 31.0% |
| Housing choice vouchers | 969,140 | 47.1% |
| Project-Based Section 8 | 376,552 | 18.3% |
| Section 202 | 21,386 | 1.0% |
| Section 202/162 | 100 | 0.0% |
| Section 811 | 3,839 | 0.2% |
| Other | 48,292 | 2.3% |
| Disability or Handicapped Status | ||
| Yes | 376,339 | 18.3% |
| No | 1,472,679 | 71.6% |
| Unknown/declined to report | 208,875 | 10.1% |
| Geographic Area | ||
| Vermont | 22,635 | 1.1% |
| New Haven- Milford | 50,201 | 2.4% |
| Bridgeport- Stamford- Norwalk | 35,326 | 1.7% |
| Milwaukee- Waukesha- West Allis | 51,555 | 2.5% |
| San Francisco- Oakland- Fremont | 167,795 | 8.2% |
| Boston- Cambridge- Quincy | 243,601 | 11.8% |
| Durham- Chapel Hill | 17,945 | 0.9% |
| Richmond | 43,196 | 2.1% |
| New York- Northern New Jersey- Long Island | 1,213,201 | 59.0% |
| Columbus | 72,332 | 3.5% |
| Akron | 35,409 | 1.7% |
| Cleveland | 104,697 | 5.1% |
| Unique Individuals Receiving Public HousingSubsidy During 2007, 2008, or 2009*(N=2,490,435) | ||
| Mean | SD | |
| * Each individual only included once, regardless of appearing in more than one year of data. For those individuals that appeared in multiple years, we defined the demographic variables based on their most recent year variable value. Earlier analyses showed very strong consistency across years (over 99% of individuals had consistent values for a given variable across multiple years). For the small percentage of individuals who were present in all three years, if an individual had a demographic variable the same for two years, but different in a third year, the third year was changed to match the other two. | ||
| Age | ||
| Age--All Persons | 34.96 | 25.34 |
| Age--Household Heads | 54.80 | 19.06 |
| N | % | |
| Gender | ||
| Male | 944,759 | 48.31% |
| Female | 1,544,019 | 78.95% |
| Unknown/declined to report | 1,657 | 0.07% |
| Age group | ||
| 18 | 888,052 | 192.81% |
| 18-44 | 735,274 | 159.64% |
| 45-61 | 384,500 | 83.48% |
| 62-64 | 56,446 | 12.26% |
| 65+ | 424,729 | 92.22% |
| Unknown/declined to report | 1,434 | 0.31% |
| Race/Ethnicity | ||
| White non-Hispanic | 411,743 | 15.92% |
| Hispanic | 590,807 | 22.84% |
| Black non-Hispanic | 953,141 | 36.85% |
| Asian | 69,622 | 2.69% |
| American Indian/Alaskan | 4,545 | 0.18% |
| Hawaiian/Pacific Islander | 3,657 | 0.14% |
| Other non-Hispanic | 949 | 0.04% |
| Mixed non-Hispanic | 741 | 0.03% |
| Unknown/declined to report | 455,230 | 17.60% |
| Subsidy Type | ||
| Public housing | 734,284 | 33.69% |
| Housing choice vouchers | 1,190,533 | 54.63% |
| Project-based Section 8 | 468,145 | 21.48% |
| Section 202 | 25,944 | 1.19% |
| Section 202/162 | 117 | 0.01% |
| Section 811 | 5,009 | 0.23% |
| Other | 66,403 | 3.05% |
| Disability or Handicapped Status | ||
| Yes | 434,013 | 17.43% |
| No | 1,787,476 | 71.77% |
| Unknown/declined to report | 268,946 | 10.80% |
| Geographic Area | ||
| Vermont | 29,401 | 23.08% |
| New Haven- Milford | 60,687 | 47.64% |
| Bridgeport- Stamford- Norwalk | 42,472 | 33.34% |
| Milwaukee- Waukesha- West Allis | 65,882 | 51.71% |
| San Francisco- Oakland- Fremont | 205,888 | 161.61% |
| Boston- Cambridge- Quincy | 291,571 | 228.87% |
| Durham- Chapel Hill | 23,779 | 18.67% |
| Richmond | 57,406 | 45.06% |
| New York- Northern New Jersey- Long Island | 1,437,415 | 1128.29% |
| Columbus | 97,511 | 76.54% |
| Akron | 46,957 | 36.86% |
| Cleveland | 131,466 | 103.19% |
| Vermont(N=29,401) | New Haven-Milford(N=60,687) | Bridgeport- Stamford-Norwalk(N=42,472) | Milwaukee- Waukesha-West Allis(N=65,882) | San Francisco-Oakland- Fremont(N=205,888) | Boston- Cambridge-Quincy(N=291,571) | |||||||
| Mean | SD | Mean | SD | Mean | SD | Mean | SD | Mean | SD | Mean | SD | |
| Age | 37.21 | 26.39 | 33.13 | 25.28 | 34.84 | 25.68 | 33.71 | 25.68 | 37.402 | 25.67 | 37.72 | 26.08 |
| N | % | N | % | N | % | N | % | N | % | N | % | |
| Gender | ||||||||||||
| Male | 11,592 | 39.4% | 22,279 | 36.7% | 15,536 | 36.6% | 23,492 | 35.7% | 80,607 | 39.2% | 110,775 | 38.0% |
| Female | 17,803 | 60.6% | 38,376 | 63.2% | 26,917 | 63.4% | 42,368 | 64.3% | 125,171 | 60.8% | 180,582 | 61.9% |
| Did not report | * | * | 32 | 0.1% | 19 | 0.0% | 22 | 0.0% | 110 | 0.1% | 214 | 0.1% |
| Age Group | ||||||||||||
| 18 | 9,569 | 32.5% | 23,948 | 39.5% | 15,581 | 36.7% | 26,030 | 39.5% | 66,555 | 32.3% | 94,214 | 32.3% |
| 18-44 | 8,501 | 28.9% | 17,893 | 29.5% | 12,503 | 29.4% | 18,054 | 27.4% | 58,969 | 28.6% | 81,864 | 28.1% |
| 45-61 | 4,759 | 16.2% | 8,096 | 13.3% | 5,780 | 13.6% | 8,787 | 13.3% | 35,324 | 17.2% | 49,720 | 17.1% |
| 62-64 | 747 | 2.5% | 1,235 | 2.0% | 911 | 2.1% | 1,606 | 2.4% | 4,851 | 2.4% | 7,268 | 2.5% |
| 65+ | 5,818 | 19.8% | 9,483 | 15.6% | 7,679 | 18.1% | 11,384 | 17.3% | 40,032 | 19.4% | 58,291 | 20.0% |
| Unknown/ declined to report | * | * | 32 | 0.1% | 18 | 0.0% | 21 | 0.0% | 157 | 0.1% | 214 | 0.1% |
| Race/Ethnicity | ||||||||||||
| White non-Hispanic | 20,250 | 68.9% | 8,876 | 14.6% | 4,700 | 11.1% | 8,646 | 13.1% | 29,014 | 14.1% | 83,750 | 28.7% |
| Hispanic | 330 | 1.1% | 18,293 | 30.1% | 14,609 | 34.4% | 2,928 | 4.4% | 19,964 | 9.7% | 60,605 | 20.8% |
| Black non-Hispanic | 1,369 | 4.7% | 20,332 | 33.5% | 16,242 | 38.2% | 34,553 | 52.4% | 86,705 | 42.1% | 57,788 | 19.8% |
| Asian | 284 | 1.0% | 94 | 0.2% | 275 | 0.6% | 192 | 0.3% | 33,136 | 16.1% | 9,873 | 3.4% |
| American Indian/Alaskan | 89 | 0.3% | 76 | 0.1% | 58 | 0.1% | 148 | 0.2% | 802 | 0.4% | 800 | 0.3% |
| Hawaiian/Pacific Islander | * | * | 16 | 0.0% | 40 | 0.1% | 17 | 0.0% | 1,737 | 0.8% | 839 | 0.3% |
| Other non-Hispanic | * | * | 20 | 0.0% | * | * | * | * | 118 | 0.1% | 188 | 0.1% |
| Mixed non-Hispanic | 18 | 0.1% | 19 | 0.0% | * | * | 53 | 0.1% | 85 | 0.0% | 117 | 0.0% |
| Declined to report | 7,052 | 24.0% | 12,961 | 21.4% | 6,543 | 15.4% | 19,341 | 29.4% | 34,327 | 16.7% | 77,611 | 26.6% |
| Property Type | ||||||||||||
| Public housing | 4,255 | 14.5% | 10,521 | 17.3% | 13,457 | 31.7% | 10,486 | 15.9% | 30,817 | 15.0% | 54,149 | 18.6% |
| Housing choice vouchers | 16,903 | 57.5% | 33,388 | 55.0% | 20,547 | 48.4% | 30,781 | 46.7% | 130,994 | 63.6% | 140,714 | 48.3% |
| Other multifamily | 6,937 | 23.6% | 14,777 | 24.3% | 6,310 | 14.9% | 21,468 | 32.6% | 31,277 | 15.2% | 82,915 | 28.4% |
| Section 202 | 911 | 3.1% | 1,288 | 2.1% | 1,509 | 3.6% | 2,636 | 4.0% | 9,097 | 4.4% | 10,292 | 3.5% |
| Section 811 & 202/162 | 94 | 0.3% | 129 | 0.2% | 43 | 0.1% | 214 | 0.3% | 658 | 0.3% | 856 | 0.3% |
| Other | 301 | 1.0% | 584 | 1.0% | 606 | 1.4% | 297 | 0.5% | 3,045 | 1.5% | 2,645 | 0.9% |
| Subsidy Type | ||||||||||||
| Public housing | 4,294 | 14.6% | 10,605 | 17.5% | 13,512 | 31.8% | 10,581 | 16.1% | 30,929 | 15.0% | 54,503 | 18.7% |
| Housing choice vouchers | 17,080 | 58.1% | 33,828 | 55.7% | 20,663 | 48.7% | 31,205 | 47.4% | 131,676 | 64.0% | 142,075 | 48.7% |
| Project-based Section 8 | 7,358 | 25.0% | 14,879 | 24.5% | 7,111 | 16.7% | 22,644 | 34.4% | 35,467 | 17.2% | 82,960 | 28.5% |
| Section 202 | 269 | 0.9% | 636 | 1.0% | 321 | 0.8% | 923 | 1.4% | 3,511 | 1.7% | 3,397 | 1.2% |
| Section 202/162 | * | * | * | * | * | * | * | * | 14 | 0.0% | * | * |
| Section 811 | 92 | 0.3% | 106 | 0.2% | 43 | 0.1% | 211 | 0.3% | 648 | 0.3% | 868 | 0.3% |
| Other | 308 | 1.0% | 633 | 1.0% | 822 | 1.9% | 318 | 0.5% | 3,643 | 1.8% | 7,768 | 2.7% |
| Disability or Handicapped Status | ||||||||||||
| Yes | 7,553 | 25.7% | 10,254 | 16.9% | 6,248 | 14.7% | 12,637 | 19.2% | 39,806 | 19.3% | 61,259 | 21.0% |
| No | 18,702 | 63.6% | 42,991 | 70.8% | 34,468 | 81.2% | 42,714 | 64.8% | 151,150 | 73.4% | 187,275 | 64.2% |
| Did not report | 3,146 | 10.7% | 7,442 | 12.3% | 1,756 | 4.1% | 10,531 | 16.0% | 14,932 | 7.3% | 43,037 | 14.8% |
| Durham-Chapel Hill(N=23,779) | Richmond(N=57,406) | New York- NorthernNew Jersey- Long Island(N=1,437,415) | Columbus(N=97,511) | Akron(N=46,957) | Cleveland(N=131,466) | |||||||
| Mean | SD | Mean | SD | Mean | SD | Mean | SD | Mean | SD | Mean | SD | |
| * Cell sizes of less than 11 are not displayed. | ||||||||||||
| Age | 27.46 | 22.47 | 26 | 22.17 | 35.74 | 25.26 | 27.648 | 23.41 | 28.488 | 23.42 | 30.52 | 24.1 |
| N | % | N | % | N | % | N | % | N | % | N | % | |
| Gender | ||||||||||||
| Male | 8,543 | 35.9% | 20,261 | 35.3% | 546,897 | 38.0% | 37,783 | 38.7% | 17,003 | 36.2% | 49,991 | 38.0% |
| Female | 15,228 | 64.0% | 37,125 | 64.7% | 889,443 | 61.9% | 59,667 | 61.2% | 29,938 | 63.8% | 81,401 | 61.9% |
| Did not report | * | * | 20 | 0.0% | 1,075 | 0.1% | 61 | 0.1% | 16 | 0.0% | 74 | 0.1% |
| Age Group | ||||||||||||
| 18 | 11,121 | 46.8% | 28,106 | 49.0% | 490,854 | 34.1% | 45,482 | 46.6% | 20,491 | 43.6% | 56,101 | 42.7% |
| 18-44 | 7,136 | 30.0% | 17,555 | 30.6% | 430,788 | 30.0% | 29,226 | 30.0% | 14,711 | 31.3% | 38,074 | 29.0% |
| 45-61 | 3,016 | 12.7% | 6,100 | 10.6% | 226,682 | 15.8% | 11,040 | 11.3% | 6,157 | 13.1% | 19,039 | 14.5% |
| 62-64 | 438 | 1.8% | 826 | 1.4% | 33,677 | 2.3% | 1,562 | 1.6% | 879 | 1.9% | 2,446 | 1.9% |
| 65+ | 2,060 | 8.7% | 4,799 | 8.4% | 254,570 | 17.7% | 10,143 | 10.4% | 4,709 | 10.0% | 15,761 | 12.0% |
| Unknown/ declined to report | * | * | 20 | 0.0% | 844 | 0.1% | 58 | 0.1% | * | * | 45 | 0.0% |
| Race/Ethnicity | ||||||||||||
| White non-Hispanic | 1,902 | 8.0% | 2,619 | 4.6% | 198,082 | 13.8% | 20,861 | 21.4% | 16,144 | 34.4% | 16,899 | 12.9% |
| Hispanic | 427 | 1.8% | 592 | 1.0% | 463,157 | 32.2% | 819 | 0.8% | 470 | 1.0% | 8,613 | 6.6% |
| Black non-Hispanic | 18,497 | 77.8% | 39,650 | 69.1% | 527,087 | 36.7% | 50,942 | 52.2% | 19,964 | 42.5% | 80,012 | 60.9% |
| Asian | 50 | 0.2% | 134 | 0.2% | 25,049 | 1.7% | 174 | 0.2% | 191 | 0.4% | 170 | 0.1% |
| American Indian/Alaskan | 36 | 0.2% | 75 | 0.1% | 2,120 | 0.1% | 103 | 0.1% | 41 | 0.1% | 197 | 0.1% |
| Hawaiian/Pacific Islander | * | * | 12 | 0.0% | 868 | 0.1% | 71 | 0.1% | 15 | 0.0% | 33 | 0.0% |
| Other non-Hispanic | * | * | 51 | 0.1% | 301 | 0.0% | 193 | 0.2% | 24 | 0.1% | 33 | 0.0% |
| Mixed non-Hispanic | 12 | 0.1% | 15 | 0.0% | 201 | 0.0% | 93 | 0.1% | 40 | 0.1% | 87 | 0.1% |
| Declined to report | 2,842 | 12.0% | 14,258 | 24.8% | 220,550 | 15.3% | 24,255 | 24.9% | 10,068 | 21.4% | 25,422 | 19.3% |
| Property Type | ||||||||||||
| Public housing | 7,913 | 33.3% | 15,913 | 27.7% | 528,717 | 36.8% | 11,800 | 12.1% | 12,598 | 26.8% | 30,311 | 23.1% |
| Housing choice vouchers | 12,017 | 50.5% | 21,472 | 37.4% | 636,807 | 44.3% | 50,886 | 52.2% | 19,681 | 41.9% | 65,826 | 50.1% |
| Other multifamily | 3,327 | 14.0% | 18,156 | 31.6% | 223,274 | 15.5% | 28,718 | 29.5% | 12,534 | 26.7% | 29,630 | 22.5% |
| Section 202 | 406 | 1.7% | 1,498 | 2.6% | 37,607 | 2.6% | 4,813 | 4.9% | 1,067 | 2.3% | 4,564 | 3.5% |
| Section 811 & 202/162 | 116 | 0.5% | 149 | 0.3% | 1,920 | 0.1% | 509 | 0.5% | 172 | 0.4% | 336 | 0.3% |
| Other | * | * | 218 | 0.4% | 9,090 | 0.6% | 785 | 0.8% | 905 | 1.9% | 799 | 0.6% |
| Subsidy Type | ||||||||||||
| Public housing | 7,992 | 33.6% | 16,281 | 28.4% | 529,788 | 36.9% | 12,107 | 12.4% | 12,779 | 27.2% | 30,913 | 23.5% |
| Housing choice vouchers | 12,126 | 51.0% | 22,083 | 38.5% | 640,846 | 44.6% | 52,137 | 53.5% | 20,073 | 42.7% | 66,741 | 50.8% |
| Project-Based Section 8 | 3,398 | 14.3% | 17,038 | 29.7% | 204,177 | 14.2% | 29,589 | 30.3% | 12,803 | 27.3% | 30,721 | 23.4% |
| Section 202 | 160 | 0.7% | 347 | 0.6% | 12,829 | 0.9% | 1,937 | 2.0% | 206 | 0.4% | 1,408 | 1.1% |
| Section 202/162 | 23 | 0.1% | * | * | * | * | 77 | 0.1% | * | * | * | * |
| Section 811 | 80 | 0.3% | 146 | 0.3% | 1,858 | 0.1% | 474 | 0.5% | 162 | 0.3% | 321 | 0.2% |
| Other | * | * | 1,511 | 2.6% | 47,914 | 3.3% | 1,190 | 1.2% | 934 | 2.0% | 1,362 | 1.0% |
| Disability or Handicapped Status | ||||||||||||
| Yes | 4,068 | 17.1% | 8,189 | 14.3% | 237,718 | 16.5% | 14,755 | 15.1% | 8,031 | 17.1% | 23,495 | 17.9% |
| No | 17,528 | 73.7% | 36,820 | 64.1% | 1,070,416 | 74.5% | 62,017 | 63.6% | 30,993 | 66.0% | 92,402 | 70.3% |
| Did not report | 2,183 | 9.2% | 12,397 | 21.6% | 129,281 | 9.0% | 20,739 | 21.3% | 7,933 | 16.9% | 15,569 | 11.8% |
| 62(N=2,007,826) | 62 to 64(N=56,446) | 65+(N=424,729) | ||||
| N | % | N | % | N | % | |
| * Cell sizes of less than 11 are not displayed. | ||||||
| Gender | ||||||
| Male | 797,183 | 39.7% | 17,920 | 31.7% | 129,638 | 30.5% |
| Female | 1,210,538 | 60.3% | 38,518 | 68.2% | 294,923 | 69.4% |
| Declined to report | 105 | 0.0% | * | * | 168 | 0.0% |
| Race/Ethnicity | ||||||
| White non-Hispanic | 306,965 | 15.3% | 12,414 | 22.0% | 92,360 | 21.7% |
| Hispanic | 508,701 | 25.3% | 13,969 | 24.7% | 68,135 | 16.0% |
| Black non-Hispanic | 863,137 | 43.0% | 15,522 | 27.5% | 74,458 | 17.5% |
| Asian | 50,268 | 2.5% | 2,372 | 4.2% | 16,955 | 4.0% |
| American Indian/Alaskan | 3,801 | 0.2% | 118 | 0.2% | 625 | 0.1% |
| Hawaiian/Pacific Islander | 3,031 | 0.2% | 87 | 0.2% | 539 | 0.1% |
| Other non-Hispanic | 785 | 0.0% | 30 | 0.1% | 134 | 0.0% |
| Mixed non-Hispanic | 539 | 0.0% | 13 | 0.0% | 189 | 0.0% |
| Declined to report | 270,599 | 13.5% | 11,921 | 21.1% | 171,334 | 40.3% |
| Property Type | ||||||
| Public housing | 586,559 | 29.2% | 19,823 | 35.1% | 124,501 | 29.3% |
| Housing choice vouchers | 1,055,771 | 52.6% | 20,122 | 35.6% | 104,122 | 24.5% |
| Other multifamily | 337,120 | 16.8% | 13,105 | 23.2% | 127,990 | 30.1% |
| Section 202 | 7,390 | 0.4% | 2,340 | 4.1% | 65,691 | 15.5% |
| Section 811 & 202/162 | 4,473 | 0.2% | 262 | 0.5% | 458 | 0.1% |
| Other | 16,513 | 0.8% | 794 | 1.4% | 1,967 | 0.5% |
| Subsidy Type | ||||||
| Public housing | 589,454 | 29.4% | 19,873 | 35.2% | 124,903 | 29.4% |
| Housing choice vouchers | 1,065,294 | 53.1% | 20,283 | 35.9% | 104,955 | 24.7% |
| Project-Based Section 8 | 296,952 | 14.8% | 13,381 | 23.7% | 156,507 | 36.8% |
| Section 202 | 451 | 0.0% | 646 | 1.1% | 24,818 | 5.8% |
| Section 202/162 | 45 | 0.0% | * | * | 65 | 0.0% |
| Section 811 | 4,310 | 0.2% | 246 | 0.4% | 452 | 0.1% |
| Other | 51,320 | 2.6% | 2,010 | 3.6% | 13,029 | 3.1% |
| Disability or Handicapped Status | ||||||
| Yes | 275,558 | 13.7% | 30,789 | 54.5% | 127,650 | 30.1% |
| No | 1,468,802 | 73.2% | 22,769 | 40.3% | 295,864 | 69.7% |
| Unknown/Declined to report | 263,466 | 13.1% | 2,888 | 5.1% | 1,215 | 0.3% |
| Public Housing(N=730,937) | Housing ChoiceVouchers(N=1,180,016) | Other Multifamily(N=479,323) | Section 202(N=75,688) | Section 811 &Section 202/162(N=5,196) | Other(N=19,275) | |||||||
| N | % | N | % | N | % | N | % | N | % | N | % | |
| * Cell sizes of less than 11 are not displayed. | ||||||||||||
| Gender | ||||||||||||
| Male | 282,289 | 38.6% | 452,071 | 38.3% | 173,587 | 36.2% | 23,871 | 31.5% | 5,196 | 68.4% | 10,149 | 52.7% |
| Female | 448,647 | 61.4% | 727,944 | 61.7% | 304,475 | 63.5% | 51,431 | 68.0% | 2,398 | 31.6% | 9,124 | 47.3% |
| Declined to report | * | * | * | * | 1,261 | 0.3% | 386 | 0.5% | * | * | * | * |
| Race/Ethnicity | ||||||||||||
| White non-Hispanic | 80,796 | 11.1% | 300,961 | 25.5% | 20,250 | 4.2% | 4,994 | 6.6% | 685 | 13.2% | 4,057 | 21.0% |
| Hispanic | 251,646 | 34.4% | 309,340 | 26.2% | 22,919 | 4.8% | 1,758 | 2.3% | 81 | 1.6% | 5,063 | 26.3% |
| Black non-Hispanic | 366,456 | 50.1% | 525,948 | 44.6% | 49,474 | 10.3% | 2,447 | 3.2% | 366 | 7.0% | 8,450 | 43.8% |
| Asian | 28,478 | 3.9% | 35,736 | 3.0% | 3,609 | 0.8% | 1,433 | 1.9% | 27 | 0.5% | 339 | 1.8% |
| American Indian/Alaskan | 1,454 | 0.2% | 2,531 | 0.2% | 450 | 0.1% | 47 | 0.1% | * | * | 57 | 0.3% |
| Hawaiian/Pacific Islander | 1,109 | 0.2% | 2,297 | 0.2% | 160 | 0.0% | 26 | 0.0% | * | * | 65 | 0.3% |
| Other non-Hispanic | * | * | * | * | 857 | 0.2% | 64 | 0.1% | * | * | 22 | 0.1% |
| Mixed non-Hispanic | * | * | * | * | 640 | 0.1% | 86 | 0.1% | 11 | 0.2% | * | * |
| Declined to report | 998 | 0.1% | 3,203 | 0.3% | 380,964 | 79.5% | 64,833 | 85.7% | 4,014 | 77.3% | 1,218 | 6.3% |
| Age Group | ||||||||||||
| 18 | 237,841 | 32.5% | 501,217 | 42.5% | 144,399 | 30.1% | 188 | 0.2% | 251 | 4.8% | 4,156 | 21.6% |
| 18-44 | 223,889 | 30.6% | 375,696 | 31.8% | 126,248 | 26.3% | 1,980 | 2.6% | 1,805 | 34.7% | 5,656 | 29.3% |
| 45-61 | 124,829 | 17.1% | 178,858 | 15.2% | 66,473 | 13.9% | 5,222 | 6.9% | 2,417 | 46.5% | 6,701 | 34.8% |
| 62-64 | 19,823 | 2.7% | 20,122 | 1.7% | 13,105 | 2.7% | 2,340 | 3.1% | 262 | 5.0% | 794 | 4.1% |
| 65+ | 124,501 | 17.0% | 104,122 | 8.8% | 127,990 | 26.7% | 65,691 | 86.8% | 458 | 8.8% | 1,967 | 10.2% |
| Unknown/declined to report | 54 | 0.0% | * | * | 1,108 | 0.2% | 267 | 0.4% | * | * | * | * |
| Disability or Handicapped Status | ||||||||||||
| Yes | 147,074 | 20.1% | 199,861 | 16.9% | 64,603 | 13.5% | 10,849 | 14.3% | 4,657 | 89.6% | 6,969 | 36.2% |
| No | 583,863 | 79.9% | 980,155 | 83.1% | 149,627 | 31.2% | 62,964 | 83.2% | 193 | 3.7% | 10,674 | 55.4% |
| Unknown/declined to report | * | * | * | * | 265,093 | 55.3% | 1,875 | 2.5% | 346 | 6.7% | 1,632 | 8.5% |
| Public Housing(N=734,284) | Housing ChoiceVouchers(N=1,190,533) | Other Multifamily(N=468,144) | Section 202(N=25,945) | Section 811 &Section 202/162(N=5,126) | Other(N=66,403) | |||||||
| N | % | N | % | N | % | N | % | N | % | N | % | |
| * Cell sizes of less than 11 are not displayed. | ||||||||||||
| Gender | ||||||||||||
| Male | 283,455 | 38.6% | 455,776 | 38.3% | 166,846 | 35.6% | 7,949 | 30.6% | 2,742 | 53.5% | 27,991 | 42.2% |
| Female | 450,828 | 61.4% | 734,756 | 61.7% | 299,746 | 64.0% | 17,956 | 69.2% | 2,380 | 46.4% | 38,353 | 57.8% |
| Declined to report | * | * | * | * | 1,553 | 0.3% | 39 | 0.2% | * | * | 59 | 0.1% |
| Race/Ethnicity | ||||||||||||
| White non-Hispanic | 81,194 | 11.1% | 302,621 | 25.4% | 19,605 | 4.2% | 1,737 | 6.7% | 609 | 11.9% | 5,977 | 9.0% |
| Hispanic | 252,354 | 34.4% | 311,721 | 26.2% | 18,310 | 3.9% | 704 | 2.7% | 84 | 1.6% | 7,634 | 11.5% |
| Black non-Hispanic | 368,619 | 50.2% | 532,262 | 44.7% | 36,497 | 7.8% | 909 | 3.5% | 336 | 6.6% | 14,518 | 21.9% |
| Asian | 28,546 | 3.9% | 35,831 | 3.0% | 3,893 | 0.8% | 624 | 2.4% | 21 | 0.4% | 707 | 1.1% |
| American Indian/Alaskan | 1,459 | 0.2% | 2,548 | 0.2% | 397 | 0.1% | 34 | 0.1% | * | * | 103 | 0.2% |
| Hawaiian/Pacific Islander | 1,110 | 0.2% | 2,317 | 0.2% | 144 | 0.0% | 11 | 0.0% | * | * | 75 | 0.1% |
| Other non-Hispanic | * | * | * | * | 801 | 0.2% | 33 | 0.1% | * | * | 109 | 0.2% |
| Mixed non-Hispanic | * | * | * | * | 648 | 0.1% | 29 | 0.1% | 11 | 0.2% | 53 | 0.1% |
| Declined to report | 1,002 | 0.1% | 3,233 | 0.3% | 387,850 | 82.8% | 21,863 | 84.3% | 4,055 | 79.1% | 37,227 | 56.1% |
| Age Group | ||||||||||||
| 18 | 239,358 | 32.6% | 506,212 | 42.5% | 124,460 | 26.6% | * | * | 251 | 4.9% | 17,763 | 26.8% |
| 18-44 | 224,973 | 30.6% | 379,167 | 31.8% | 109,573 | 23.4% | 54 | 0.2% | 1,756 | 34.3% | 19,751 | 29.7% |
| 45-61 | 125,123 | 17.0% | 179,915 | 15.1% | 62,919 | 13.4% | 389 | 1.5% | 2,348 | 45.8% | 13,806 | 20.8% |
| 62-64 | 19,873 | 2.7% | 20,283 | 1.7% | 13,381 | 2.9% | 646 | 2.5% | 253 | 4.9% | 2,010 | 3.0% |
| 65+ | 124,903 | 17.0% | 104,955 | 8.8% | 156,507 | 33.4% | 24,818 | 95.7% | 517 | 10.1% | 13,029 | 19.6% |
| Unknown/declined to report | 54 | 0.0% | * | * | 1,305 | 0.3% | 29 | 0.1% | * | * | 44 | 0.1% |
| Disability or Handicapped Status | ||||||||||||
| Yes | 147,616 | 20.1% | 201,397 | 16.9% | 68,938 | 14.7% | 1,214 | 4.7% | 4,541 | 88.6% | 10,307 | 15.5% |
| No | 586,668 | 79.9% | 989,136 | 83.1% | 162,366 | 34.7% | 24,260 | 93.5% | 228 | 4.4% | 24,818 | 37.4% |
| Unknown/declined to report | * | * | * | * | 236,841 | 50.6% | 470 | 1.8% | 357 | 7.0% | 31,278 | 47.1% |
| Proportion of Households with at Least One Individual Age 62+ | Number of Properties 2007 | Percent of Properties 2007 | Number of Properties 2008 | Percent of Properties 2008 | Number of Properties 2009 | Percent of Properties 2009 | Number of Properties 2007-2009 | Percent of Properties 2007-2009 |
| 0-9% | 763 | 625.4% | 706 | 727.8% | 663 | 861.0% | 802 | 524.2% |
| 10-19% | 372 | 304.9% | 375 | 386.6% | 372 | 483.1% | 378 | 247.1% |
| 20-29% | 362 | 296.7% | 372 | 383.5% | 374 | 485.7% | 380 | 248.4% |
| 30-39% | 226 | 185.2% | 221 | 227.8% | 250 | 324.7% | 253 | 165.4% |
| 40-49% | 130 | 106.6% | 140 | 144.3% | 137 | 177.9% | 140 | 91.5% |
| 50-59% | 108 | 88.5% | 115 | 118.6% | 137 | 177.9% | 141 | 92.2% |
| 60-69% | 101 | 82.8% | 103 | 106.2% | 99 | 128.6% | 99 | 64.7% |
| 70-79% | 137 | 112.3% | 144 | 148.5% | 139 | 180.5% | 140 | 91.5% |
| 80-89% | 262 | 214.8% | 236 | 243.3% | 238 | 309.1% | 239 | 156.2% |
| 90-100% | 1,213 | 994.3% | 1,213 | 1250.5% | 1,209 | 1570.1% | 1,390 | 908.5% |
| Elderly (Age 62+) Properties | ||||||||
| Properties with 50%+ Households designated as Elderly | 1,821 | 49.6% | 1,811 | 50.0% | 1,822 | 50.4% | 2009 | 50.7% |
| Properties with under 50% Households designated as Elderly | 1,853 | 50.4% | 1,814 | 50.0% | 1,796 | 49.6% | 1953 | 49.3% |
| Proportion of Households with at Least One Individual Age 62+ | Vermont | New Haven-Milford | Bridgeport- Stamford-Norwalk | Milwaukee- Waukesha-West Allis | San Francisco-Oakland- Fremont | Boston- Cambridge-Quincy | ||||||
| N | % | N | % | N | % | N | % | N | % | N | % | |
| Proportion of Households with at Least One Individual Age 62+ (2007) | ||||||||||||
| 0-9% | 43 | 26.9% | 20 | 16.7% | 6 | 7.4% | 44 | 22.1% | 64 | 17.6% | 94 | 14.6% |
| 10-19% | 10 | 6.3% | 12 | 10.0% | 7 | 8.6% | 14 | 7.0% | 31 | 8.5% | 93 | 14.5% |
| 20-29% | 10 | 6.3% | 11 | 9.2% | 4 | 4.9% | 13 | 6.5% | 22 | 6.0% | 65 | 10.1% |
| 30-39% | 5 | 3.1% | 3 | 2.5% | 5 | 6.2% | 6 | 3.0% | 22 | 6.0% | 38 | 5.9% |
| 40-49% | 5 | 3.1% | 4 | 3.3% | 2 | 2.5% | 9 | 4.5% | 8 | 2.2% | 21 | 3.3% |
| 50-59% | 3 | 1.9% | 3 | 2.5% | 3 | 3.7% | 11 | 5.5% | 8 | 2.2% | 27 | 4.2% |
| 60-69% | 7 | 4.4% | 3 | 2.5% | 5 | 6.2% | 21 | 10.6% | 4 | 1.1% | 24 | 3.7% |
| 70-79% | 15 | 9.4% | 7 | 5.8% | 8 | 9.9% | 18 | 9.0% | 3 | 0.8% | 32 | 5.0% |
| 80-89% | 28 | 17.5% | 11 | 9.2% | 7 | 8.6% | 19 | 9.5% | 17 | 4.7% | 75 | 11.7% |
| 90-100% | 34 | 21.3% | 46 | 38.3% | 34 | 42.0% | 44 | 22.1% | 185 | 50.8% | 174 | 27.1% |
| Proportion of Households with at Least One Individual Age 62+ (2008) | ||||||||||||
| 0-9% | 38 | 23.8% | 20 | 17.1% | 6 | 7.2% | 40 | 20.7% | 49 | 13.6% | 91 | 14.3% |
| 10-19% | 13 | 8.1% | 14 | 12.0% | 9 | 10.8% | 14 | 7.3% | 35 | 9.7% | 88 | 13.8% |
| 20-29% | 13 | 8.1% | 9 | 7.7% | 4 | 4.8% | 13 | 6.7% | 26 | 7.2% | 73 | 11.4% |
| 30-39% | 2 | 1.3% | 4 | 3.4% | 2 | 2.4% | 7 | 3.6% | 20 | 5.6% | 34 | 5.3% |
| 40-49% | 8 | 5.0% | 4 | 3.4% | 4 | 4.8% | 8 | 4.1% | 9 | 2.5% | 26 | 4.1% |
| 50-59% | 4 | 2.5% | 3 | 2.6% | 3 | 3.6% | 14 | 7.3% | 10 | 2.8% | 25 | 3.9% |
| 60-69% | 11 | 6.9% | 3 | 2.6% | 5 | 6.0% | 15 | 7.8% | 4 | 1.1% | 20 | 3.1% |
| 70-79% | 12 | 7.5% | 9 | 7.7% | 7 | 8.4% | 22 | 11.4% | 3 | 0.8% | 39 | 6.1% |
| 80-89% | 23 | 14.4% | 10 | 8.5% | 10 | 12.0% | 15 | 7.8% | 14 | 3.9% | 66 | 10.3% |
| 90-100% | 36 | 22.5% | 41 | 35.0% | 33 | 39.8% | 45 | 23.3% | 189 | 52.6% | 176 | 27.6% |
| Proportion of Households with at Least One Individual Age 62+ (2009) | ||||||||||||
| 0-9% | 33 | 21.2% | 22 | 19.1% | 6 | 7.3% | 40 | 20.1% | 41 | 11.7% | 84 | 13.1% |
| 10-19% | 12 | 7.7% | 8 | 7.0% | 7 | 8.5% | 15 | 7.5% | 29 | 8.3% | 94 | 14.7% |
| 20-29% | 12 | 7.7% | 12 | 10.4% | 4 | 4.9% | 13 | 6.5% | 29 | 8.3% | 73 | 11.4% |
| 30-39% | 7 | 4.5% | 5 | 4.3% | 3 | 3.7% | 7 | 3.5% | 24 | 6.8% | 36 | 5.6% |
| 40-49% | 4 | 2.6% | 3 | 2.6% | 6 | 7.3% | 9 | 4.5% | 7 | 2.0% | 20 | 3.1% |
| 50-59% | 5 | 3.2% | 4 | 3.5% | 3 | 3.7% | 14 | 7.0% | 13 | 3.7% | 33 | 5.2% |
| 60-69% | 10 | 6.4% | 3 | 2.6% | 6 | 7.3% | 13 | 6.5% | 3 | 0.9% | 15 | 2.3% |
| 70-79% | 12 | 7.7% | 7 | 6.1% | 3 | 3.7% | 23 | 11.6% | 6 | 1.7% | 44 | 6.9% |
| 80-89% | 26 | 16.7% | 11 | 9.6% | 12 | 14.6% | 14 | 7.0% | 13 | 3.7% | 64 | 10.0% |
| 90-100% | 35 | 22.4% | 40 | 34.8% | 32 | 39.0% | 51 | 25.6% | 186 | 53.0% | 177 | 27.7% |
| Proportion of Households with at Least One Individual Age 62+ (2007-2009) | ||||||||||||
| 0-9% | 39 | 23.6% | 24 | 18.6% | 7 | 8.2% | 45 | 21.0% | 54 | 13.9% | 96 | 14.3% |
| 10-19% | 12 | 7.3% | 8 | 6.2% | 7 | 8.2% | 16 | 7.5% | 29 | 7.5% | 95 | 14.2% |
| 20-29% | 12 | 7.3% | 12 | 9.3% | 4 | 4.7% | 13 | 6.1% | 30 | 7.7% | 73 | 10.9% |
| 30-39% | 7 | 4.2% | 5 | 3.9% | 3 | 3.5% | 7 | 3.3% | 24 | 6.2% | 36 | 5.4% |
| 40-49% | 4 | 2.4% | 3 | 2.3% | 6 | 7.1% | 9 | 4.2% | 7 | 1.8% | 20 | 3.0% |
| 50-59% | 5 | 3.0% | 5 | 3.9% | 3 | 3.5% | 14 | 6.5% | 13 | 3.3% | 33 | 4.9% |
| 60-69% | 10 | 6.1% | 3 | 2.3% | 6 | 7.1% | 13 | 6.1% | 3 | 0.8% | 15 | 2.2% |
| 70-79% | 12 | 7.3% | 7 | 5.4% | 3 | 3.5% | 23 | 10.7% | 6 | 1.5% | 44 | 6.6% |
| 80-89% | 26 | 15.8% | 11 | 8.5% | 12 | 14.1% | 14 | 6.5% | 13 | 3.3% | 65 | 9.7% |
| 90-100% | 38 | 23.0% | 51 | 39.5% | 34 | 40.0% | 60 | 28.0% | 210 | 54.0% | 193 | 28.8% |
| Elderly (Age 62+) Properties | ||||||||||||
| Properties with 50%+ Households designated as Elderly | 91 | 55.2% | 77 | 59.7% | 58 | 68.2% | 124 | 57.9% | 245 | 63.0% | 350 | 52.2% |
| Properties with under 50% Households designated as Elderly | 74 | 44.8% | 52 | 40.3% | 27 | 31.8% | 90 | 42.1% | 144 | 37.0% | 320 | 47.8% |
| Proportion of Households with at Least One Individual Age 62+ | Durham-Chapel Hill | Richmond | New York- NorthernNew Jersey- Long Island | Columbus | Akron | Cleveland | ||||||
| N | % | N | % | N | % | N | % | N | % | N | % | |
| NOTE: N represents the number of properties with X% of households with at least one individual age 62+. | ||||||||||||
| Proportion of Households with at Least One Individual Age 62+ (2007) | ||||||||||||
| 0-9% | 30 | 55.6% | 44 | 49.4% | 261 | 17.8% | 67 | 31.5% | 29 | 40.8% | 61 | 29.0% |
| 10-19% | 7 | 13.0% | 8 | 9.0% | 142 | 9.7% | 22 | 10.3% | 5 | 7.0% | 21 | 10.0% |
| 20-29% | 2 | 3.7% | 5 | 5.6% | 208 | 14.1% | 12 | 5.6% | 4 | 5.6% | 6 | 2.9% |
| 30-39% | 2 | 3.7% | 4 | 4.5% | 128 | 8.7% | 6 | 2.8% | 3 | 4.2% | 4 | 1.9% |
| 40-49% | 0 | 0.0% | 0 | 0.0% | 66 | 4.5% | 4 | 1.9% | 2 | 2.8% | 9 | 4.3% |
| 50-59% | 0 | 0.0% | 1 | 1.1% | 42 | 2.9% | 6 | 2.8% | 1 | 1.4% | 3 | 1.4% |
| 60-69% | 0 | 0.0% | 2 | 2.2% | 17 | 1.2% | 3 | 1.4% | 5 | 7.0% | 10 | 4.8% |
| 70-79% | 2 | 3.7% | 5 | 5.6% | 23 | 1.6% | 11 | 5.2% | 3 | 4.2% | 10 | 4.8% |
| 80-89% | 4 | 7.4% | 4 | 4.5% | 68 | 4.6% | 10 | 4.7% | 9 | 12.7% | 10 | 4.8% |
| 90-100% | 7 | 13.0% | 16 | 18.0% | 515 | 35.0% | 72 | 33.8% | 10 | 14.1% | 76 | 36.2% |
| Proportion of Households with at Least One Individual Age 62+ (2008) | ||||||||||||
| 0-9% | 29 | 55.8% | 46 | 50.0% | 232 | 16.1% | 69 | 32.1% | 29 | 39.2% | 57 | 27.8% |
| 10-19% | 5 | 9.6% | 7 | 7.6% | 137 | 9.5% | 28 | 13.0% | 4 | 5.4% | 21 | 10.2% |
| 20-29% | 2 | 3.8% | 4 | 4.3% | 204 | 14.2% | 11 | 5.1% | 4 | 5.4% | 9 | 4.4% |
| 30-39% | 0 | 0.0% | 3 | 3.3% | 134 | 9.3% | 7 | 3.3% | 5 | 6.8% | 3 | 1.5% |
| 40-49% | 0 | 0.0% | 1 | 1.1% | 67 | 4.7% | 4 | 1.9% | 2 | 2.7% | 7 | 3.4% |
| 50-59% | 2 | 3.8% | 1 | 1.1% | 44 | 3.1% | 5 | 2.3% | 0 | 0.0% | 4 | 2.0% |
| 60-69% | 0 | 0.0% | 2 | 2.2% | 24 | 1.7% | 4 | 1.9% | 6 | 8.1% | 9 | 4.4% |
| 70-79% | 3 | 5.8% | 6 | 6.5% | 24 | 1.7% | 8 | 3.7% | 3 | 4.1% | 8 | 3.9% |
| 80-89% | 2 | 3.8% | 2 | 2.2% | 59 | 4.1% | 10 | 4.7% | 10 | 13.5% | 15 | 7.3% |
| 90-100% | 9 | 17.3% | 20 | 21.7% | 512 | 35.6% | 69 | 32.1% | 11 | 14.9% | 72 | 35.1% |
| Proportion of Households with at Least One Individual Age 62+ (2009) | ||||||||||||
| 0-9% | 28 | 50.9% | 40 | 44.0% | 214 | 14.9% | 70 | 32.1% | 31 | 42.5% | 54 | 27.0% |
| 10-19% | 7 | 12.7% | 12 | 13.2% | 134 | 9.3% | 29 | 13.3% | 4 | 5.5% | 21 | 10.5% |
| 20-29% | 3 | 5.5% | 7 | 7.7% | 199 | 13.8% | 11 | 5.0% | 3 | 4.1% | 8 | 4.0% |
| 30-39% | 0 | 0.0% | 1 | 1.1% | 144 | 10.0% | 10 | 4.6% | 6 | 8.2% | 7 | 3.5% |
| 40-49% | 1 | 1.8% | 1 | 1.1% | 79 | 5.5% | 3 | 1.4% | 1 | 1.4% | 3 | 1.5% |
| 50-59% | 1 | 1.8% | 1 | 1.1% | 47 | 3.3% | 5 | 2.3% | 3 | 4.1% | 8 | 4.0% |
| 60-69% | 0 | 0.0% | 4 | 4.4% | 25 | 1.7% | 9 | 4.1% | 3 | 4.1% | 8 | 4.0% |
| 70-79% | 3 | 5.5% | 4 | 4.4% | 17 | 1.2% | 3 | 1.4% | 7 | 9.6% | 10 | 5.0% |
| 80-89% | 3 | 5.5% | 6 | 6.6% | 62 | 4.3% | 9 | 4.1% | 7 | 9.6% | 11 | 5.5% |
| 90-100% | 9 | 16.4% | 15 | 16.5% | 517 | 36.0% | 69 | 31.7% | 8 | 11.0% | 70 | 35.0% |
| Proportion of Households with at Least One Individual Age 62+ (2007-2009) | ||||||||||||
| 0-9% | 31 | 51.7% | 45 | 44.6% | 283 | 17.8% | 80 | 32.8% | 32 | 40.0% | 66 | 28.6% |
| 10-19% | 7 | 11.7% | 12 | 11.9% | 138 | 8.7% | 29 | 11.9% | 4 | 5.0% | 21 | 9.1% |
| 20-29% | 3 | 5.0% | 7 | 6.9% | 203 | 12.7% | 12 | 4.9% | 3 | 3.8% | 8 | 3.5% |
| 30-39% | 0 | 0.0% | 2 | 2.0% | 146 | 9.2% | 10 | 4.1% | 6 | 7.5% | 7 | 3.0% |
| 40-49% | 1 | 1.7% | 1 | 1.0% | 82 | 5.1% | 3 | 1.2% | 1 | 1.3% | 3 | 1.3% |
| 50-59% | 1 | 1.7% | 1 | 1.0% | 50 | 3.1% | 5 | 2.0% | 3 | 3.8% | 8 | 3.5% |
| 60-69% | 0 | 0.0% | 4 | 4.0% | 25 | 1.6% | 9 | 3.7% | 3 | 3.8% | 8 | 3.5% |
| 70-79% | 3 | 5.0% | 4 | 4.0% | 18 | 1.1% | 3 | 1.2% | 7 | 8.8% | 10 | 4.3% |
| 80-89% | 3 | 5.0% | 6 | 5.9% | 62 | 3.9% | 9 | 3.7% | 7 | 8.8% | 11 | 4.8% |
| 90-100% | 11 | 18.3% | 19 | 18.8% | 587 | 36.8% | 84 | 34.4% | 14 | 17.5% | 89 | 38.5% |
| Elderly (Age 62+) Properties | ||||||||||||
| Properties with 50%+ Households designated as Elderly | 18 | 30.0% | 34 | 33.7% | 742 | 46.5% | 110 | 45.1% | 34 | 42.5% | 126 | 54.5% |
| Properties with under 50% Households designated as Elderly | 42 | 70.0% | 67 | 66.3% | 852 | 53.5% | 134 | 54.9% | 46 | 57.5% | 105 | 45.5% |
| Proportion of Households with at Least One Individual Age 62+ or In a Property Designated as Elderly | Number of Properties 2007 | Percent of Properties 2007 | Number of Properties 2008 | Percent of Properties 2008 | Number of Properties 2009 | Percent of Properties 2009 |
| 0-9% | 228 | 15.8% | 91 | 11.4% | 101 | 12.1% |
| 10-19% | 221 | 15.3% | 110 | 13.8% | 119 | 14.3% |
| 20-29% | 191 | 13.2% | 104 | 13.0% | 116 | 13.9% |
| 30-39% | 152 | 10.5% | 99 | 12.4% | 93 | 11.2% |
| 40-49% | 89 | 6.2% | 58 | 7.3% | 53 | 6.4% |
| 50-59% | 48 | 3.3% | 44 | 5.5% | 43 | 5.2% |
| 60-69% | 25 | 1.7% | 20 | 2.5% | 20 | 2.4% |
| 70-79% | 17 | 1.2% | 23 | 2.9% | 23 | 2.8% |
| 80-89% | 14 | 1.0% | 14 | 1.8% | 13 | 1.6% |
| 90-100% | 462 | 31.9% | 234 | 29.4% | 253 | 30.3% |
| Elderly (Age 62+) Properties | ||||||
| Properties with 50%+ Households designated as Elderly or a Property Designated as Elderly | 566 | 39.1% | 335 | 42.0% | 352 | 42.2% |
| Properties with under 50% Households designated as Elderly and no Elderly Property Designation | 881 | 60.9% | 462 | 58.0% | 482 | 57.8% |
| Vermont | New Haven-Milford | Bridgeport- Stamford-Norwalk | Milwaukee- Waukesha-West Allis | San Francisco-Oakland- Fremont | Boston- Cambridge-Quincy | |||||||
| N | % | N | % | N | % | N | % | N | % | N | % | |
| Proportion of Households with at Least One Individual Age 62+ (2007) | ||||||||||||
| 0-9% | 7 | 26.9% | 19 | 26.0% | 19 | 24.7% | 16 | 34.8% | 23 | 15.0% | 18 | 9.4% |
| 10-19% | 3 | 11.5% | 14 | 19.2% | 18 | 23.4% | 8 | 17.4% | 43 | 28.1% | 24 | 12.5% |
| 20-29% | 0 | 0.0% | 7 | 9.6% | 12 | 15.6% | 4 | 8.7% | 24 | 15.7% | 26 | 13.5% |
| 30-39% | 0 | 0.0% | 0 | 0.0% | 1 | 1.3% | 1 | 2.2% | 13 | 8.5% | 7 | 3.6% |
| 40-49% | 0 | 0.0% | 1 | 1.4% | 2 | 2.6% | 0 | 0.0% | 4 | 2.6% | 7 | 3.6% |
| 50-59% | 0 | 0.0% | 0 | 0.0% | 2 | 2.6% | 0 | 0.0% | 4 | 2.6% | 1 | 0.5% |
| 60-69% | 0 | 0.0% | 0 | 0.0% | 0 | 0.0% | 0 | 0.0% | 3 | 2.0% | 1 | 0.5% |
| 70-79% | 0 | 0.0% | 0 | 0.0% | 0 | 0.0% | 0 | 0.0% | 2 | 1.3% | 1 | 0.5% |
| 80-89% | 0 | 0.0% | 0 | 0.0% | 0 | 0.0% | 0 | 0.0% | 2 | 1.3% | 1 | 0.5% |
| 90-100% | 16 | 61.5% | 32 | 43.8% | 23 | 29.9% | 17 | 37.0% | 35 | 22.9% | 106 | 55.2% |
| Proportion of Households with at Least One Individual Age 62+ (2008) | ||||||||||||
| 0-9% | 1 | 9.1% | 5 | 27.8% | 4 | 12.9% | 8 | 29.6% | 4 | 6.5% | 10 | 7.0% |
| 10-19% | 0 | 0.0% | 1 | 5.6% | 9 | 29.0% | 3 | 11.1% | 23 | 37.1% | 12 | 8.4% |
| 20-29% | 0 | 0.0% | 1 | 5.6% | 5 | 16.1% | 0 | 0.0% | 11 | 17.7% | 23 | 16.1% |
| 30-39% | 0 | 0.0% | 1 | 5.6% | 2 | 6.5% | 0 | 0.0% | 1 | 1.6% | 6 | 4.2% |
| 40-49% | 0 | 0.0% | 0 | 0.0% | 0 | 0.0% | 0 | 0.0% | 2 | 3.2% | 3 | 2.1% |
| 50-59% | 3 | 27.3% | 1 | 5.6% | 1 | 3.2% | 0 | 0.0% | 2 | 3.2% | 3 | 2.1% |
| 60-69% | 1 | 9.1% | 0 | 0.0% | 0 | 0.0% | 0 | 0.0% | 3 | 4.8% | 2 | 1.4% |
| 70-79% | 1 | 9.1% | 0 | 0.0% | 0 | 0.0% | 0 | 0.0% | 2 | 3.2% | 6 | 4.2% |
| 80-89% | 0 | 0.0% | 0 | 0.0% | 0 | 0.0% | 0 | 0.0% | 2 | 3.2% | 3 | 2.1% |
| 90-100% | 5 | 45.5% | 9 | 50.0% | 10 | 32.3% | 16 | 59.3% | 12 | 19.4% | 75 | 52.4% |
| Proportion of Households with at Least One Individual Age 62+ (2009) | ||||||||||||
| 0-9% | 1 | 9.1% | 10 | 21.7% | 6 | 19.4% | 7 | 25.0% | 6 | 8.0% | 8 | 5.7% |
| 10-19% | 0 | 0.0% | 7 | 15.2% | 7 | 22.6% | 5 | 17.9% | 23 | 30.7% | 16 | 11.3% |
| 20-29% | 0 | 0.0% | 4 | 8.7% | 5 | 16.1% | 0 | 0.0% | 12 | 16.0% | 20 | 14.2% |
| 30-39% | 0 | 0.0% | 1 | 2.2% | 1 | 3.2% | 0 | 0.0% | 1 | 1.3% | 5 | 3.5% |
| 40-49% | 0 | 0.0% | 1 | 2.2% | 1 | 3.2% | 0 | 0.0% | 3 | 4.0% | 2 | 1.4% |
| 50-59% | 3 | 27.3% | 1 | 2.2% | 1 | 3.2% | 0 | 0.0% | 3 | 4.0% | 4 | 2.8% |
| 60-69% | 2 | 18.2% | 0 | 0.0% | 0 | 0.0% | 0 | 0.0% | 3 | 4.0% | 2 | 1.4% |
| 70-79% | 0 | 0.0% | 0 | 0.0% | 0 | 0.0% | 0 | 0.0% | 3 | 4.0% | 5 | 3.5% |
| 80-89% | 0 | 0.0% | 0 | 0.0% | 0 | 0.0% | 0 | 0.0% | 1 | 1.3% | 4 | 2.8% |
| 90-100% | 5 | 45.5% | 22 | 47.8% | 10 | 32.3% | 16 | 57.1% | 20 | 26.7% | 75 | 53.2% |
| Elderly (Age 62+) Properties | ||||||||||||
| Properties with 50%+ Households Designated as Elderly | 10 | 90.9% | 10 | 55.6% | 11 | 35.5% | 16 | 59.3% | 21 | 33.9% | 89 | 62.2% |
| Properties with under 50% Households Designated as Elderly | 1 | 9.1% | 8 | 44.4% | 20 | 64.5% | 11 | 40.7% | 41 | 66.1% | 54 | 37.8% |
| Durham-Chapel Hill | Richmond | New York- NorthernNew Jersey- Long Island | Columbus | Akron | Cleveland | |||||||
| N | % | N | % | N | % | N | % | N | % | N | % | |
| NOTE: N represents the number of properties with X% of households with at least one individual age 62+. | ||||||||||||
| Proportion of Households with at Least One Individual Age 62+ (2007) | ||||||||||||
| 0-9% | 13 | 44.8% | 10 | 29.4% | 26 | 4.0% | 20 | 54.1% | 17 | 43.6% | 40 | 44.0% |
| 10-19% | 4 | 13.8% | 11 | 32.4% | 69 | 10.6% | 6 | 16.2% | 8 | 20.5% | 13 | 14.3% |
| 20-29% | 4 | 13.8% | 3 | 8.8% | 105 | 16.2% | 2 | 5.4% | 0 | 0.0% | 4 | 4.4% |
| 30-39% | 2 | 6.9% | 0 | 0.0% | 117 | 18.0% | 0 | 0.0% | 2 | 5.1% | 9 | 9.9% |
| 40-49% | 1 | 3.4% | 1 | 2.9% | 71 | 10.9% | 0 | 0.0% | 0 | 0.0% | 2 | 2.2% |
| 50-59% | 0 | 0.0% | 3 | 8.8% | 28 | 4.3% | 0 | 0.0% | 8 | 20.5% | 2 | 2.2% |
| 60-69% | 0 | 0.0% | 1 | 2.9% | 18 | 2.8% | 0 | 0.0% | 2 | 5.1% | 0 | 0.0% |
| 70-79% | 0 | 0.0% | 0 | 0.0% | 9 | 1.4% | 2 | 5.4% | 1 | 2.6% | 2 | 2.2% |
| 80-89% | 0 | 0.0% | 3 | 8.8% | 6 | 0.9% | 0 | 0.0% | 1 | 2.6% | 1 | 1.1% |
| 90-100% | 5 | 17.2% | 2 | 5.9% | 201 | 30.9% | 7 | 18.9% | 0 | 0.0% | 18 | 19.8% |
| Proportion of Households with at Least One Individual Age 62+ (2008) | ||||||||||||
| 0-9% | 8 | 42.1% | 6 | 35.3% | 11 | 2.8% | 13 | 43.3% | 13 | 48.1% | 8 | 30.8% |
| 10-19% | 4 | 21.1% | 5 | 29.4% | 41 | 10.6% | 7 | 23.3% | 2 | 7.4% | 3 | 11.5% |
| 20-29% | 1 | 5.3% | 1 | 5.9% | 58 | 15.0% | 1 | 3.3% | 1 | 3.7% | 2 | 7.7% |
| 30-39% | 2 | 10.5% | 0 | 0.0% | 78 | 20.2% | 0 | 0.0% | 1 | 3.7% | 8 | 30.8% |
| 40-49% | 0 | 0.0% | 0 | 0.0% | 52 | 13.5% | 0 | 0.0% | 1 | 3.7% | 0 | 0.0% |
| 50-59% | 0 | 0.0% | 1 | 5.9% | 24 | 6.2% | 0 | 0.0% | 7 | 25.9% | 2 | 7.7% |
| 60-69% | 0 | 0.0% | 0 | 0.0% | 12 | 3.1% | 1 | 3.3% | 1 | 3.7% | 0 | 0.0% |
| 70-79% | 0 | 0.0% | 0 | 0.0% | 11 | 2.8% | 0 | 0.0% | 1 | 3.7% | 2 | 7.7% |
| 80-89% | 0 | 0.0% | 3 | 17.6% | 6 | 1.6% | 0 | 0.0% | 0 | 0.0% | 0 | 0.0% |
| 90-100% | 4 | 21.1% | 1 | 5.9% | 93 | 24.1% | 8 | 26.7% | 0 | 0.0% | 1 | 3.8% |
| Proportion of Households with at Least One Individual Age 62+ (2009) | ||||||||||||
| 0-9% | 9 | 45.0% | 7 | 38.9% | 12 | 3.1% | 13 | 44.8% | 13 | 46.4% | 9 | 34.6% |
| 10-19% | 4 | 20.0% | 5 | 27.8% | 39 | 10.2% | 7 | 24.1% | 4 | 14.3% | 2 | 7.7% |
| 20-29% | 1 | 5.0% | 1 | 5.6% | 68 | 17.8% | 1 | 3.4% | 1 | 3.6% | 3 | 11.5% |
| 30-39% | 2 | 10.0% | 0 | 0.0% | 75 | 19.7% | 0 | 0.0% | 1 | 3.6% | 7 | 26.9% |
| 40-49% | 0 | 0.0% | 1 | 5.6% | 44 | 11.5% | 0 | 0.0% | 1 | 3.6% | 0 | 0.0% |
| 50-59% | 0 | 0.0% | 0 | 0.0% | 23 | 6.0% | 0 | 0.0% | 6 | 21.4% | 2 | 7.7% |
| 60-69% | 0 | 0.0% | 0 | 0.0% | 11 | 2.9% | 1 | 3.4% | 1 | 3.6% | 0 | 0.0% |
| 70-79% | 0 | 0.0% | 0 | 0.0% | 12 | 3.1% | 0 | 0.0% | 1 | 3.6% | 2 | 7.7% |
| 80-89% | 0 | 0.0% | 3 | 16.7% | 5 | 1.3% | 0 | 0.0% | 0 | 0.0% | 0 | 0.0% |
| 90-100% | 4 | 20.0% | 1 | 5.6% | 92 | 24.1% | 7 | 24.1% | 0 | 0.0% | 1 | 3.8% |
| Elderly (Age 62+) Properties | ||||||||||||
| Properties with 50%+ Households Designated as Elderly | 4 | 21.1% | 5 | 29.4% | 146 | 37.8% | 9 | 30.0% | 9 | 33.3% | 5 | 19.2% |
| Properties with under 50% Households Designated as Elderly | 15 | 78.9% | 12 | 70.6% | 240 | 62.2% | 21 | 70.0% | 18 | 66.7% | 21 | 80.8% |
Objective B: Calculate Number of HUD-Assisted Individual Medicare and/or Medicaid Match Rate in the 12 Study Jurisdictions, 2008
| 2008 HUD-Assisted Individuals | Age 65 Years(N=1,663,348) | Age 65+ Years(N=349,208) | ||
| N | % | N | % | |
| Medicare | ||||
| SSN Mate Rate (SSN only) | 116,803 | 7.0% | 325,589 | 93.2% |
| Restrictive Match Rate (SSN, gender, date of birth) | 110,395 | 6.7% | 297,227 | 85.1% |
| Medicaid | ||||
| SSN Mate Rate (SSN only) | 1,200,981 | 72.2% | 229,093 | 65.6% |
| Restrictive Match Rate (SSN, gender, date of birth) | 1,131,137 | 68.5% | 209,679 | 60.0% |
| Medicare & Medicaid | ||||
| SSN Mate Rate (SSN only) | 96,509 | 5.8% | 220,139 | 63.0% |
| Restrictive Match Rate (SSN, gender, date of birth) | 91,564 | 5.5% | 201,753 | 57.8% |
| 2008 HUD-Assisted Household Heads with SSI | Age 65 Years(N=158,323) | Age 65+ Years(N=131,335) | ||
| N | % | N | % | |
| Medicare | ||||
| SSN Mate Rate (SSN only) | 49,367 | 31.2% | 123,759 | 94.2% |
| Restrictive Match Rate (SSN, gender, date of birth) | 46,875 | 29.6% | 112,783 | 85.9% |
| Medicaid | ||||
| SSN Mate Rate (SSN only) | 143,443 | 90.6% | 124,730 | 95.0% |
| Restrictive Match Rate (SSN, gender, date of birth) | 134,320 | 84.8% | 113,711 | 86.6% |
| Medicare & Medicaid | ||||
| SSN Mate Rate (SSN only) | 46,717 | 29.5% | 120,811 | 92.0% |
| Restrictive Match Rate (SSN, gender, date of birth) | 44,389 | 28.0% | 110,254 | 83.9% |
| HUD (any year)(N=2,449,591) | HUD 2007(N=1,945,719) | HUD 2008(N=2,025,126) | HUD 2009(N=2,041,413) | |||||
| N | % | N | % | N | % | N | % | |
| NOTE: Shaded cells are of most interest for the column. | ||||||||
| Any Medicare or Medicaid enrollment (07, 08, or 09) | 1,793,283 | 73.2% | 1,444,006 | 74.2% | 1,526,087 | 75.4% | 1,537,949 | 75.3% |
| Any Medicare enrollment (07, 08, or 09) | 485,550 | 19.8% | 419,101 | 21.5% | 426,239 | 21.0% | 420,061 | 20.6% |
| Medicare 2007 enrollment | 445,329 | 18.2% | 389,008 | 20.0% | 391,974 | 19.4% | 382,873 | 18.8% |
| Medicare 2008 enrollment | 453,052 | 18.5% | 391,783 | 20.1% | 407,622 | 20.1% | 401,443 | 19.7% |
| Medicare 2009 enrollment | 455,569 | 18.6% | 389,881 | 20.0% | 410,851 | 20.3% | 417,416 | 20.4% |
| Any Medicaid enrollment (07 or 08) | 1,661,584 | 67.8% | 1,333,809 | 68.6% | 1,412,234 | 69.7% | 1,423,395 | 69.7% |
| Medicaid 2007 enrollment | 1,559,057 | 63.6% | 1,277,899 | 65.7% | 1,338,726 | 66.1% | 1,334,377 | 65.4% |
| Medicaid 2008 enrollment | 1,559,277 | 63.7% | 1,245,507 | 64.0% | 1,340,816 | 66.2% | 1,357,370 | 66.5% |
| Both Medicare & Medicaid 2007 enrollment | 313,633 | 12.8% | 278,168 | 14.3% | 277,732 | 13.7% | 270,088 | 13.2% |
| Both Medicare & Medicaid 2008 enrollment | 324,192 | 13.2% | 283,568 | 14.6% | 293,317 | 14.5% | 286,829 | 14.1% |
| HUD (any year)(N=1,970,548) | HUD 2007(N=1,563,245) | HUD 2008(N=1,627,667) | HUD 2009(N=1,635,510) | |||||
| N | % | N | % | N | % | N | % | |
| NOTE: Shaded cells are of most interest for the column. | ||||||||
| Any Medicare or Medicaid enrollment (07, 08, or 09) | 1,392,194 | 70.7% | 1,115,788 | 71.4% | 1,185,205 | 72.8% | 1,192,522 | 72.9% |
| Any Medicare enrollment (07, 08, or 09) | 115,689 | 5.9% | 104,573 | 6.7% | 104,791 | 6.4% | 101,110 | 6.2% |
| Medicare 2007 enrollment | 99,005 | 5.0% | 91,626 | 5.9% | 90,463 | 5.6% | 86,091 | 5.3% |
| Medicare 2008 enrollment | 106,031 | 5.4% | 96,791 | 6.2% | 97,336 | 6.0% | 93,363 | 5.7% |
| Medicare 2009 enrollment | 112,446 | 5.7% | 101,085 | 6.5% | 102,784 | 6.3% | 100,424 | 6.1% |
| Any Medicaid enrollment (07 or 08) | 1,375,484 | 69.8% | 1,100,711 | 70.4% | 1,170,474 | 71.9% | 1,178,335 | 72.0% |
| Medicaid 2007 enrollment | 1,286,974 | 65.3% | 1,054,412 | 67.5% | 1,108,342 | 68.1% | 1,100,609 | 67.3% |
| Medicaid 2008 enrollment | 1,292,358 | 65.6% | 1,028,380 | 65.8% | 1,108,860 | 68.1% | 1,121,572 | 68.6% |
| Both Medicare & Medicaid 2007 enrollment | 82,878 | 4.2% | 77,000 | 4.9% | 76,196 | 4.7% | 72,466 | 4.4% |
| Both Medicare & Medicaid 2008 enrollment | 88,726 | 4.5% | 80,896 | 5.2% | 81,899 | 5.0% | 78,742 | 4.8% |
| HUD (any year)(N=56,057) | HUD 2007(N=42,974) | HUD 2008(N=46,375) | HUD 2009(N=49,885) | |||||
| N | % | N | % | N | % | N | % | |
| NOTE: Shaded cells are of most interest for the column. | ||||||||
| Any Medicare or Medicaid enrollment (07, 08, or 09) | 35,279 | 62.9% | 33,253 | 77.4% | 32,659 | 70.4% | 31,648 | 63.4% |
| Any Medicare enrollment (07, 08, or 09) | 16,062 | 28.7% | 26,723 | 62.2% | 20,877 | 45.0% | 14,217 | 28.5% |
| Medicare 2007 enrollment | 14,497 | 25.9% | 12,178 | 28.3% | 12,439 | 26.8% | 12,742 | 25.5% |
| Medicare 2008 enrollment | 15,030 | 26.8% | 19,384 | 45.1% | 13,059 | 28.2% | 13,493 | 27.0% |
| Medicare 2009 enrollment | 15,379 | 27.4% | 25,963 | 60.4% | 20,512 | 44.2% | 14,157 | 28.4% |
| Any Medicaid enrollment (07 or 08) | 31,440 | 56.1% | 24,802 | 57.7% | 26,023 | 56.1% | 28,284 | 56.7% |
| Medicaid 2007 enrollment | 29,541 | 52.7% | 22,838 | 53.1% | 24,368 | 52.5% | 26,554 | 53.2% |
| Medicaid 2008 enrollment | 26,991 | 48.1% | 21,558 | 50.2% | 22,277 | 48.0% | 24,580 | 49.3% |
| Both Medicare & Medicaid 2007 enrollment | 10,743 | 19.2% | 9,025 | 21.0% | 9,231 | 19.9% | 9,471 | 19.0% |
| Both Medicare & Medicaid 2008 enrollment | 11,081 | 19.8% | 13,853 | 32.2% | 9,665 | 20.8% | 9,981 | 20.0% |
| HUD (any year)(N=421,559) | HUD 2007(N=338,128) | HUD 2008(N=349,658) | HUD 2009(N=354,609) | |||||
| N | % | N | % | N | % | N | % | |
| NOTE: Shaded cells are of most interest for the column. | ||||||||
| Any Medicare or Medicaid enrollment (07, 08, or 09) | 365,810 | 86.8% | 294,964 | 87.2% | 308,223 | 88.1% | 313,779 | 88.5% |
| Any Medicare enrollment (07, 08, or 09) | 353,799 | 83.9% | 287,805 | 85.1% | 300,571 | 86.0% | 304,734 | 85.9% |
| Medicare 2007 enrollment | 331,827 | 78.7% | 285,204 | 84.3% | 289,072 | 82.7% | 284,040 | 80.1% |
| Medicare 2008 enrollment | 331,991 | 78.8% | 275,608 | 81.5% | 297,227 | 85.0% | 294,587 | 83.1% |
| Medicare 2009 enrollment | 327,744 | 77.7% | 262,833 | 77.7% | 287,555 | 82.2% | 302,835 | 85.4% |
| Any Medicaid enrollment (07 or 08) | 254,660 | 60.4% | 208,295 | 61.6% | 215,737 | 61.7% | 216,776 | 61.1% |
| Medicaid 2007 enrollment | 242,542 | 57.5% | 200,648 | 59.3% | 206,016 | 58.9% | 207,214 | 58.4% |
| Medicaid 2008 enrollment | 239,928 | 56.9% | 195,568 | 57.8% | 209,679 | 60.0% | 211,218 | 59.6% |
| Both Medicare & Medicaid 2007 enrollment | 220,012 | 52.2% | 192,143 | 56.8% | 192,305 | 55.0% | 188,151 | 53.1% |
| Both Medicare & Medicaid 2008 enrollment | 224,385 | 53.2% | 188,819 | 55.8% | 201,753 | 57.7% | 198,106 | 55.9% |
| HUD (any year)(N=1,122,000) | HUD 2007(N=931,294) | HUD 2008(N=958,115) | HUD 2009(N=960,903) | |||||
| N | % | N | % | N | % | N | % | |
| NOTE: Shaded cells are of most interest for the column. | ||||||||
| Any Medicare or Medicaid enrollment (07, 08, or 09) | 843,187 | 75.2% | 705,020 | 75.7% | 732,786 | 76.5% | 737,491 | 76.7% |
| Any Medicare enrollment (07, 08, or 09) | 428,191 | 38.2% | 372,196 | 40.0% | 377,054 | 39.4% | 370,681 | 38.6% |
| Medicare 2007 enrollment | 395,174 | 35.2% | 347,420 | 37.3% | 348,819 | 36.4% | 339,785 | 35.4% |
| Medicare 2008 enrollment | 399,710 | 35.6% | 347,892 | 37.4% | 361,459 | 37.7% | 355,227 | 37.0% |
| Medicare 2009 enrollment | 400,087 | 35.7% | 344,759 | 37.0% | 362,235 | 37.8% | 368,194 | 38.3% |
| Any Medicaid enrollment (07 or 08) | 724,679 | 64.6% | 605,222 | 65.0% | 629,986 | 65.8% | 634,244 | 66.0% |
| Medicaid 2007 enrollment | 684,569 | 61.0% | 576,772 | 61.9% | 597,431 | 62.4% | 599,538 | 62.4% |
| Medicaid 2008 enrollment | 676,406 | 60.3% | 563,149 | 60.5% | 598,076 | 62.4% | 603,939 | 62.9% |
| Both Medicare & Medicaid 2007 enrollment | 275,784 | 24.6% | 246,323 | 26.4% | 244,853 | 25.6% | 237,378 | 24.7% |
| Both Medicare & Medicaid 2008 enrollment | 283,501 | 25.3% | 249,765 | 26.8% | 257,811 | 26.9% | 251,431 | 26.2% |
| HUD (any year)(N=702,852) | HUD 2007(N=592,293) | HUD 2008(N=608,852) | HUD 2009(N=606,692) | |||||
| N | % | N | % | N | % | N | % | |
| NOTE: Shaded cells are of most interest for the column. | ||||||||
| Any Medicare or Medicaid enrollment (07, 08, or 09) | 489,567 | 69.7% | 412,645 | 69.7% | 431,274 | 70.8% | 433,677 | 71.5% |
| Any Medicare enrollment (07, 08, or 09) | 99,811 | 14.2% | 91,102 | 15.4% | 91,219 | 15.0% | 88,166 | 14.5% |
| Medicare 2007 enrollment | 86,210 | 12.3% | 80,527 | 13.6% | 79,410 | 13.0% | 75,614 | 12.5% |
| Medicare 2008 enrollment | 91,801 | 13.1% | 84,556 | 14.3% | 85,069 | 14.0% | 81,727 | 13.5% |
| Medicare 2009 enrollment | 96,890 | 13.8% | 87,931 | 14.8% | 89,355 | 14.7% | 87,567 | 14.4% |
| Any Medicaid enrollment (07 or 08) | 475,213 | 67.6% | 399,556 | 67.5% | 418,503 | 68.7% | 421,347 | 69.4% |
| Medicaid 2007 enrollment | 446,996 | 63.6% | 379,544 | 64.1% | 395,762 | 65.0% | 396,124 | 65.3% |
| Medicaid 2008 enrollment | 444,399 | 63.2% | 372,223 | 62.8% | 395,251 | 64.9% | 399,087 | 65.8% |
| Both Medicare & Medicaid 2007 enrollment | 72,155 | 10.3% | 67,681 | 11.4% | 66,861 | 11.0% | 63,603 | 10.5% |
| Both Medicare & Medicaid 2008 enrollment | 76,837 | 10.9% | 70,700 | 11.9% | 71,582 | 11.8% | 68,922 | 11.4% |
| HUD (any year)(N=47,374) | HUD 2007(N=37,145) | HUD 2008(N=39,593) | HUD 2009(N=42,274) | |||||
| N | % | N | % | N | % | N | % | |
| NOTE: Shaded cells are of most interest for the column. | ||||||||
| Any Medicare or Medicaid enrollment (07, 08, or 09) | 30,629 | 64.7% | 29,094 | 78.3% | 28,448 | 71.9% | 27,530 | 65.1% |
| Any Medicare enrollment (07, 08, or 09) | 14,654 | 30.9% | 23,473 | 63.2% | 18,536 | 46.8% | 13,006 | 30.8% |
| Medicare 2007 enrollment | 13,273 | 28.0% | 11,233 | 30.2% | 11,444 | 28.9% | 11,702 | 27.7% |
| Medicare 2008 enrollment | 13,724 | 29.0% | 17,267 | 46.5% | 11,991 | 30.3% | 12,371 | 29.3% |
| Medicare 2009 enrollment | 14,014 | 29.6% | 22,767 | 61.3% | 18,180 | 45.9% | 12,947 | 30.6% |
| Any Medicaid enrollment (07 or 08) | 27,252 | 57.5% | 21,867 | 58.9% | 22,767 | 57.5% | 24,565 | 58.1% |
| Medicaid 2007 enrollment | 25,728 | 54.3% | 20,276 | 54.6% | 21,425 | 54.1% | 23,165 | 54.8% |
| Medicaid 2008 enrollment | 23,446 | 49.5% | 19,049 | 51.3% | 19,591 | 49.5% | 21,433 | 50.7% |
| Both Medicare & Medicaid 2007 enrollment | 9,954 | 21.0% | 8,422 | 22.7% | 8,584 | 21.7% | 8,801 | 20.8% |
| Both Medicare & Medicaid 2008 enrollment | 10,235 | 21.6% | 12,447 | 33.5% | 8,974 | 22.7% | 9,258 | 21.9% |
| HUD (any year)(N=371,728) | HUD 2007(N=301,856) | HUD 2008(N=309,626) | HUD 2009(N=311,891) | |||||
| N | % | N | % | N | % | N | % | |
| NOTE: Shaded cells are of most interest for the column. | ||||||||
| Any Medicare or Medicaid enrollment (07, 08, or 09) | 322,991 | 86.9% | 263,281 | 87.2% | 273,064 | 88.2% | 276,284 | 88.6% |
| Any Medicare enrollment (07, 08, or 09) | 313,726 | 84.4% | 257,621 | 85.3% | 267,299 | 86.3% | 269,509 | 86.4% |
| Medicare 2007 enrollment | 295,691 | 79.5% | 255,660 | 84.7% | 257,965 | 83.3% | 252,469 | 80.9% |
| Medicare 2008 enrollment | 294,185 | 79.1% | 246,069 | 81.5% | 264,399 | 85.4% | 261,129 | 83.7% |
| Medicare 2009 enrollment | 289,183 | 77.8% | 234,061 | 77.5% | 254,700 | 82.3% | 267,680 | 85.8% |
| Any Medicaid enrollment (07 or 08) | 222,214 | 59.8% | 183,799 | 60.9% | 188,716 | 60.9% | 188,332 | 60.4% |
| Medicaid 2007 enrollment | 211,845 | 57.0% | 176,952 | 58.6% | 180,244 | 58.2% | 180,249 | 57.8% |
| Medicaid 2008 enrollment | 208,561 | 56.1% | 171,877 | 56.9% | 183,234 | 59.2% | 183,419 | 58.8% |
| Both Medicare & Medicaid 2007 enrollment | 193,675 | 52.1% | 170,220 | 56.4% | 169,408 | 54.7% | 164,974 | 52.9% |
| Both Medicare & Medicaid 2008 enrollment | 196,429 | 52.8% | 166,618 | 55.2% | 177,255 | 57.2% | 173,251 | 55.5% |
| HUD (any year)(N=289,907) | HUD 2007(N=141,073) | HUD 2008(N=17,385) | HUD 2009(N=131,434) | |||||
| N | % | N | % | N | % | N | % | |
| Any Medicare or Medicaid enrollment (07, 08, or 09) | 258,431 | 89.1% | 126,545 | 89.7% | 14,639 | 84.2% | 117,247 | 89.2% |
| Any Medicare enrollment (07, 08, or 09) | 166,405 | 57.4% | 44,717 | 31.7% | 7,655 | 44.0% | 114,033 | 86.8% |
| Medicare 2007 enrollment | 153,064 | 52.8% | 39,062 | 27.7% | 4,494 | 25.8% | 109,508 | 83.3% |
| Medicare 2008 enrollment | 159,658 | 55.1% | 42,143 | 29.9% | 4,732 | 27.2% | 112,783 | 85.8% |
| Medicare 2009 enrollment | 161,125 | 55.6% | 44,015 | 31.2% | 7,539 | 43.4% | 109,571 | 83.4% |
| Any Medicaid enrollment (07 or 08) | 253,178 | 87.3% | 124,439 | 88.2% | 13,823 | 79.5% | 114,916 | 87.4% |
| Medicaid 2007 enrollment | 249,691 | 86.1% | 122,384 | 86.8% | 13,418 | 77.2% | 113,889 | 86.7% |
| Medicaid 2008 enrollment | 248,031 | 85.6% | 122,425 | 86.8% | 11,895 | 68.4% | 113,711 | 86.5% |
| Both Medicare & Medicaid 2007 enrollment | 147,984 | 51.0% | 36,985 | 26.2% | 4,215 | 24.2% | 106,784 | 81.2% |
| Both Medicare & Medicaid 2008 enrollment | 154,643 | 53.3% | 39,944 | 28.3% | 4,445 | 25.6% | 110,254 | 83.9% |
| HUD-Assisted Individuals (65 years)(N=1,970,702) | HUD-Assisted Individuals (>65 years)(N=56,060) | Restrictive Match Rate by Characteristic | |||||||||
| Linked to 2008 Medicaid Enrollment Files(N=1,121,137) | Did Not Link to 2008 Medicaid Enrollment Files(N=542,905) | p-Value | Linked to 2008 Medicaid Enrollment Files(N=305,153) | Did Not Link to 2008 Medicaid Enrollment Files(N=44,505) | p-Value | ||||||
| Mean | SD | Mean | SD | Mean | SD | Mean | SD | ||||
| NOTE: TOTAL N lower than Table 1 N due to individuals with unknown age.* Cell sizes of less than 11 are not displayed. | |||||||||||
| Age--All Persons | 24.56 | 17.90 | 30.42 | 18.39 | 0.0001 | 76.27 | 7.69 | 76.86 | 8.28 | 0.0001 | |
| Age--Household Heads | 42.61 | 11.81 | 45.49 | 11.50 | 0.0001 | 76.52 | 7.77 | 77.17 | 8.34 | 0.0001 | |
| N | % | N | % | N | % | N | % | ||||
| Gender | |||||||||||
| Male | 429,972 | 38.0% | 216,918 | 40.0% | 0.0001 | 91,241 | 29.9% | 13,416 | 30.1% | 0.0001 | 87.2% |
| Female | 701,165 | 62.0% | 325,903 | 60.0% | 213,912 | 70.1% | 30,965 | 69.6% | 87.4% | ||
| Unknown/declined to report | * | * | 84 | 0.0% | * | * | 124 | 0.3% | |||
| Age Group | |||||||||||
| 0-18 | 531,042 | 46.9% | 168,356 | 31.0% | 0.0001 | ||||||
| 18-44 | 383,522 | 33.9% | 220,231 | 40.6% | |||||||
| 45-61 | 194,296 | 17.2% | 130,220 | 24.0% | |||||||
| 62-64 | 22,277 | 2.0% | 24,098 | 4.4% | |||||||
| 65-69 | 70,529 | 23.1% | 10,466 | 23.5% | 0.0001 | 87.1% | |||||
| 70-74 | 70,838 | 23.2% | 9,332 | 21.0% | 88.4% | ||||||
| 75-79 | 62,319 | 20.4% | 8,341 | 18.7% | 88.2% | ||||||
| 80-84 | 51,798 | 17.0% | 7,600 | 17.1% | 87.2% | ||||||
| 85+ | 49,669 | 16.3% | 8,766 | 19.7% | 85.0% | ||||||
| Race/Ethnicity | |||||||||||
| White non-Hispanic | 196,344 | 17.4% | 59,773 | 11.0% | 0.0001 | 65,942 | 21.6% | 6,462 | 14.5% | 0.0001 | 91.1% |
| Hispanic | 293,367 | 25.9% | 131,007 | 24.1% | 46,760 | 15.3% | 8,528 | 19.2% | 84.6% | ||
| Black non-Hispanic | 456,226 | 40.3% | 241,907 | 44.6% | 48,785 | 16.0% | 10,729 | 24.1% | 82.0% | ||
| Asian | 29,199 | 2.6% | 14,199 | 2.6% | 11,373 | 3.7% | 1,250 | 2.8% | 90.1% | ||
| American Indian/Alaskan | 2,222 | 0.2% | 938 | 0.2% | 428 | 0.1% | 49 | 0.1% | 89.7% | ||
| Hawaiian/Pacific Islander | 1,492 | 0.1% | 790 | 0.1% | 351 | 0.1% | 39 | 0.1% | 90.0% | ||
| Other non-Hispanic | 146 | 0.0% | 66 | 0.0% | 33 | 0.0% | * | * | 82.5% | ||
| Mixed non-Hispanic | 132 | 0.0% | 56 | 0.0% | 73 | 0.0% | * | * | 90.1% | ||
| Unknown/declined to report | 152,009 | 13.4% | 94,169 | 17.3% | 131,408 | 43.1% | 17,433 | 39.2% | 88.3% | ||
| Property Type | |||||||||||
| Public housing | 314,201 | 27.8% | 206,232 | 38.0% | 0.0001 | 89,013 | 29.2% | 16,709 | 37.5% | 0.0001 | 84.2% |
| Housing choice vouchers | 630,610 | 55.8% | 226,884 | 41.8% | 74,796 | 24.5% | 9,005 | 20.2% | 89.3% | ||
| Other multifamily | 170,340 | 15.1% | 102,264 | 18.8% | 91,469 | 30.0% | 12,836 | 28.8% | 87.7% | ||
| Section 202 | 5,330 | 0.5% | 2,817 | 0.5% | 48,424 | 15.9% | 5,750 | 12.9% | 89.4% | ||
| Section 811 & 202/162 | 2,736 | 0.2% | 893 | 0.2% | 298 | 0.1% | 37 | 0.1% | 89.0% | ||
| Other | 7,920 | 0.7% | 3,815 | 0.7% | 1,153 | 0.4% | 168 | 0.4% | 87.3% | ||
| Subsidy Type | |||||||||||
| Public housing | 315,985 | 27.9% | 206,874 | 38.1% | 0.0001 | 89,290 | 29.3% | 16,753 | 37.6% | 0.0001 | 84.2% |
| Housing choice vouchers | 636,520 | 56.3% | 228,800 | 42.1% | 75,351 | 24.7% | 9,094 | 20.4% | 89.2% | ||
| Project-Based Section 8 | 155,410 | 13.7% | 88,143 | 16.2% | 113,582 | 37.2% | 15,259 | 34.3% | 88.2% | ||
| Section 202 | 467 | 0.0% | 485 | 0.1% | 18,258 | 6.0% | 1,996 | 4.5% | 90.1% | ||
| Section 202/162 | 31 | 0.0% | 11 | 0.0% | 51 | 0.0% | * | * | 87.9% | ||
| Section 811 | 2,627 | 0.2% | 855 | 0.2% | 294 | 0.1% | 37 | 0.1% | 88.8% | ||
| Other | 20,097 | 1.8% | 17,737 | 3.3% | 8,327 | 2.7% | 1,359 | 3.1% | 86.0% | ||
| Elderly Designated Property | |||||||||||
| Yes | 59,788 | 5.3% | 40,523 | 7.5% | 0.0001 | 160,398 | 52.6% | 20,102 | 45.2% | 0.0001 | 88.9% |
| No | 438,541 | 38.8% | 274,457 | 50.6% | 69,377 | 22.7% | 15,328 | 34.4% | 81.9% | ||
| Unknown | 632,808 | 55.9% | 227,925 | 42.0% | 75,378 | 24.7% | 9,075 | 20.4% | 89.3% | ||
| Disability or Handicapped Status | |||||||||||
| Yes | 213,843 | 18.9% | 53,557 | 9.9% | 0.0001 | 90,974 | 29.8% | 13,511 | 30.4% | 0.0001 | 87.1% |
| No | 793,739 | 70.2% | 407,938 | 75.1% | 213,603 | 70.0% | 30,833 | 69.3% | 87.4% | ||
| Unknown/declined to report | 123,555 | 10.9% | 81,410 | 15.0% | 576 | 0.2% | 161 | 0.4% | 78.2% | ||
| Living Arrangement | |||||||||||
| Lives Alone | 123,759 | 10.9% | 82,829 | 15.3% | 0.0001 | 209,450 | 68.6% | 29,612 | 66.5% | 0.0001 | 87.6% |
| Lives with Spouse | 12,890 | 1.1% | 13,267 | 2.4% | 55,419 | 18.2% | 6,626 | 14.9% | 89.3% | ||
| Other Adults | 58,816 | 5.2% | 59,545 | 11.0% | 20,713 | 6.8% | 4,277 | 9.6% | 82.9% | ||
| Children in Household | 925,455 | 81.8% | 375,234 | 69.1% | 14,537 | 4.8% | 3,082 | 6.9% | 82.5% | ||
| Live-in Aide | 2,655 | 0.2% | 2,779 | 0.5% | 1,316 | 0.4% | 224 | 0.5% | 85.5% | ||
| Other | 105 | 0.0% | 148 | 0.0% | 19 | 0.0% | * | * | 73.1% | ||
| Unknown/declined to report | 7,457 | 0.7% | 9,103 | 1.7% | 3,699 | 1.2% | 677 | 1.5% | 84.5% | ||
| SSI | |||||||||||
| Receives SSI | 198,457 | 17.5% | 34,140 | 6.3% | 134,484 | 44.1% | 16,944 | 38.1% | |||
| Geographic Area | |||||||||||
| Vermont | 14,956 | 1.3% | 2,910 | 0.5% | 0.0001 | 4,350 | 1.4% | 270 | 0.6% | 0.0001 | 94.2% |
| New Haven- Milford | 31,451 | 2.8% | 10,396 | 1.9% | 7,016 | 2.3% | 767 | 1.7% | 90.1% | ||
| Bridgeport- Stamford- Norwalk | 19,831 | 1.8% | 8,651 | 1.6% | 5,538 | 1.8% | 716 | 1.6% | 88.6% | ||
| Milwaukee- Waukesha- West Allis | 34,094 | 3.0% | 7,787 | 1.4% | 8,373 | 2.7% | 706 | 1.6% | 92.2% | ||
| San Francisco- Oakland- Fremont | 82,586 | 7.3% | 48,047 | 8.8% | 29,542 | 9.7% | 3,173 | 7.1% | 90.3% | ||
| Boston- Cambridge- Quincy | 147,750 | 13.1% | 46,386 | 8.5% | 43,124 | 14.1% | 4,799 | 10.8% | 90.0% | ||
| Durham- Chapel Hill | 11,877 | 1.1% | 4,271 | 0.8% | 1,380 | 0.5% | 206 | 0.5% | 87.0% | ||
| Richmond | 11,005 | 1.0% | 28,114 | 5.2% | 1,185 | 0.4% | 2,614 | 5.9% | 31.2% | ||
| New York- Northern New Jersey- Long Island | 628,304 | 55.5% | 349,780 | 64.4% | 182,507 | 59.8% | 29,141 | 65.5% | 86.2% | ||
| Columbus | 51,159 | 4.5% | 12,417 | 2.3% | 7,107 | 2.3% | 739 | 1.7% | 90.6% | ||
| Akron | 25,598 | 2.3% | 5,536 | 1.0% | 3,467 | 1.1% | 260 | 0.6% | 93.0% | ||
| Cleveland | 72,526 | 6.4% | 18,610 | 3.4% | 11,564 | 3.8% | 1,114 | 2.5% | 91.2% | ||
Objective C: Estimate HUD-Assisted Medicare Beneficiaries with Enrollment in Part D Subsidy Assistance Programs of Medical Savings Program
| All Ages | 62 Years of Age | |||||||||||
| 2007 Linked to Medicare or Medicaid 2007 | 2008 Linked to Medicare or Medicaid 2008 | 2009 Linked to Medicare 2009 | 2007 Linked to Medicare or Medicaid 2007 | >2008 Linked to Medicare or Medicaid 2008 | 2009 Linked to Medicare 2009 | |||||||
| N | % | N | % | N | % | N | % | N | % | N | % | |
| Individuals Linked to Medicare | 389,008 | 407,622 | 417,416 | 91,626 | 97,336 | 100,424 | ||||||
| Proportion with Part A coverage | 377,190 | 97.0% | 394,904 | 96.9% | 407,199 | 97.55% | 91,614 | 100.0% | 97,326 | 100.0% | 100,410 | 99.99% |
| Average months of Medicare Part A coverage (among those with Part A cov) | 11.56 | 11.59 | 11.59 | 11.55 | 11.54 | 11.54 | ||||||
| Proportion with Part B coverage | 379,662 | 97.6% | 398,480 | 97.8% | 408,535 | 97.87% | 88,188 | 96.2% | 94,190 | 96.8% | 97,418 | 97.01% |
| Average months of Medicare Part B coverage (among those with Part B cov) | 11.56 | 11.57 | 11.58 | 11.45 | 11.45 | 11.46 | ||||||
| Proportion enrolled in Medicare Part A & B during entire year | 338,861 | 87.1% | 357,082 | 87.6% | 367,881 | 88.13% | 80,033 | 87.3% | 85,493 | 87.8% | 88,591 | 88.22% |
| Proportion in Medicare managed care for at least one month | 86,722 | 22.3% | 108,499 | 26.6% | 115,231 | 27.61% | 11,643 | 12.7% | 16,668 | 17.1% | 18,974 | 18.89% |
| Average months of Medicare HMO coverage (among those with HMO cov) | 10.28 | 10.31 | 10.78 | 9.68 | 9.61 | 10.30 | ||||||
| Original Reason for Entitlement | ||||||||||||
| Old age & survivor's insurance | 240,777 | 61.9% | 249,547 | 61.2% | 253,112 | 60.64% | 42 | 0.0% | 34 | 0.0% | * | * |
| Disability insurance benefits | 144,761 | 37.2% | 154,452 | 37.9% | 160,598 | 38.47% | 88,941 | 97.1% | 94,575 | 97.2% | 97,648 | 97.24% |
| ESRD | 1,393 | 0.4% | 1,435 | 0.4% | 1,445 | 0.35% | 1,010 | 1.1% | 1,029 | 1.1% | 1,022 | 1.02% |
| Disability Insurance & ESRD | 2,077 | 0.5% | 2,188 | 0.5% | 2,261 | 0.54% | 1,633 | 1.8% | 1,698 | 1.7% | 1,744 | 1.74% |
| Current Reason for Entitlement | ||||||||||||
| Old age & survivor's insurance | 282,569 | 72.6% | 293,238 | 71.9% | 297,451 | 71.26% | 55 | 0.1% | 44 | 0.0% | 12 | 0.01% |
| Disability insurance benefits | 103,211 | 26.5% | 111,052 | 27.2% | 116,618 | 27.94% | 89,194 | 97.3% | 94,871 | 97.5% | 97,987 | 97.57% |
| ESRD | 1,589 | 0.4% | 1,627 | 0.4% | 1,632 | 0.39% | 957 | 1.0% | 978 | 1.0% | 968 | 0.96% |
| Disability Insurance & ESRD | 1,639 | 0.4% | 1,705 | 0.4% | 1,715 | 0.41% | 1,420 | 1.5% | 1,443 | 1.5% | 1,457 | 1.45% |
| Medicare Coverage Status | ||||||||||||
| Part A only | 7,946 | 2.0% | 7,686 | 1.9% | 7,422 | 1.78% | 2,917 | 3.2% | 2,659 | 2.7% | 2,488 | 2.48% |
| Part B only | 10,376 | 2.7% | 11,178 | 2.7% | 8,313 | 1.99% | * | * | * | * | 11 | 0.01% |
| Both Part A & B or combination of coverage | 370,686 | 95.3% | 388,758 | 95.4% | 401,681 | 96.23% | 88,699 | 96.8% | 94,668 | 97.3% | 97,925 | 97.51% |
| Medicare Part D coverage at any point during the year | 344,945 | 88.7% | 365,812 | 89.7% | 376,864 | 90.28% | 84,774 | 92.5% | 91,007 | 93.5% | 94,314 | 93.92% |
| Average months of Part D coverage (among those with Part D cov) | 11.43 | 11.50 | 11.52 | 0.00% | 11.40 | 11.41 | 11.43 | |||||
| Proportion with Part D Coverage by Cost Share Group Code | ||||||||||||
| Beneficiary deemed with 100% premium-subsidy & no copayment | 11,148 | 3.2% | 10,790 | 2.9% | 11,550 | 3.1% | 2,447 | 2.9% | 2,311 | 2.5% | 2,384 | 2.5% |
| Beneficiary deemed with 100% premium-subsidy & low copayment | 221,010 | 64.1% | 232,159 | 63.5% | 244,176 | 64.8% | 60,328 | 71.2% | 64,310 | 70.7% | 67,367 | 71.4% |
| Beneficiary deemed with 100% premium-subsidy & high copayment | 34,488 | 10.0% | 36,768 | 10.1% | 37,541 | 10.0% | 10,125 | 11.9% | 11,009 | 12.1% | 11,095 | 11.8% |
| Beneficiary with Low Income Subsidy (LIS), 100% premium-subsidy | 14,387 | 4.2% | 15,368 | 4.2% | 15,638 | 4.1% | 2,966 | 3.5% | 3,386 | 3.7% | 3,582 | 3.8% |
| Beneficiary with Low Income Subsidy (LIS), 100% premium-subsidy & 15% copayment | 1,213 | 0.4% | 1,105 | 0.3% | 1,044 | 0.3% | 75 | 0.1% | 83 | 0.1% | 78 | 0.1% |
| Beneficiary with LIS, 75% premium-subsidy & 15% copayment | 1,909 | 0.6% | 1,984 | 0.5% | 2,074 | 0.6% | 277 | 0.3% | 333 | 0.4% | 350 | 0.4% |
| Beneficiary with LIS, 50% premium-subsidy & 15% copayment | 1,810 | 0.5% | 1,866 | 0.5% | 1,851 | 0.5% | 299 | 0.4% | 303 | 0.3% | 301 | 0.3% |
| Beneficiary with LIS, 25% premium-subsidy & 15% copayment | 1,798 | 0.5% | 1,497 | 0.4% | 1,571 | 0.4% | 280 | 0.3% | 212 | 0.2% | 221 | 0.2% |
| No premium subsidy nor cost sharing | 42,050 | 12.2% | 45,761 | 12.5% | 48,547 | 12.9% | 3,734 | 4.4% | 4,041 | 4.4% | 4,322 | 4.6% |
| Missing | 15,132 | 4.4% | 18,514 | 5.1% | 12,872 | 3.4% | 4,243 | 5.0% | 5,019 | 5.5% | 4,614 | 4.9% |
| Individuals Linked to Medicaid | 1,277,899 | 1,340,816 | 1,054,412 | 1,108,860 | ||||||||
| Average months of Medicaid coverage (FFS or Managed care) | 10.92 | 10.97 | 10.86 | 10.92 | ||||||||
| Proportion enrolled in Medicaid during entire year (FFS or Managed care) | 1,010,821 | 79.1% | 1,071,619 | 79.9% | 817,090 | 77.5% | 868,218 | 78.3% | ||||
| In Medicaid managed care for at least one month | 218,959 | 17.1% | 247,620 | 18.5% | 106,382 | 10.1% | 131,019 | 11.8% | ||||
| Average months of Medicaid managed care (among those with managed care) | 8.43 | 8.34 | 8.47 | 8.33 | ||||||||
| Medicaid Basis for Eligibility | ||||||||||||
| Aged | 155,633 | 12.2% | 162,212 | 12.1% | 69 | 0.0% | 57 | 0.0% | ||||
| Blind/disabled | 280,808 | 22.0% | 291,812 | 21.8% | 216,458 | 20.5% | 225,466 | 20.3% | ||||
| Child | 525,097 | 41.1% | 546,178 | 40.7% | 525,072 | 49.8% | 546,167 | 49.3% | ||||
| Adult | 299,414 | 23.4% | 324,304 | 24.2% | 296,159 | 28.1% | 320,993 | 28.9% | ||||
| Child of unemployed adult | 979 | 0.1% | 750 | 0.1% | 979 | 0.1% | 750 | 0.1% | ||||
| Unemployed adult | 815 | 0.1% | 632 | 0.0% | 812 | 0.1% | 631 | 0.1% | ||||
| Foster care child | 6,778 | 0.5% | 6,461 | 0.5% | 6,778 | 0.6% | 6,461 | 0.6% | ||||
| Covered under Breast & Cervical Cancer Prevention Act | 75 | 0.0% | 97 | 0.0% | 61 | 0.0% | 81 | 0.0% | ||||
| Unknown | 783 | 0.1% | 336 | 0.0% | 538 | 0.1% | 254 | 0.0% | ||||
| 9011 | 7,517 | 0.6% | 8,034 | 0.6% | 7,486 | 0.7% | 8,000 | 0.7% | ||||
| Medicaid Maintenance of Assistance | ||||||||||||
| Receiving cash or eligible under Section 1931 of the Act | 665,503 | 52.1% | 716,485 | 53.4% | 527,986 | 50.1% | 573,898 | 51.8% | ||||
| Medically needy | 120,356 | 9.4% | 114,574 | 8.5% | 91,140 | 8.6% | 84,066 | 7.6% | ||||
| Poverty related (includes children eligible under SCHIP expansion) | 201,931 | 15.8% | 204,652 | 15.3% | 168,439 | 16.0% | 168,832 | 15.2% | ||||
| Other | 150,070 | 11.7% | 147,396 | 11.0% | 133,198 | 12.6% | 130,502 | 11.8% | ||||
| Foster care child | 6,778 | 0.5% | 6,461 | 0.5% | 6,778 | 0.6% | 6,461 | 0.6% | ||||
| 1115 demonstration expansion eligible | 124,961 | 9.8% | 142,878 | 10.7% | 118,847 | 11.3% | 136,847 | 12.3% | ||||
| Unknown | 783 | 0.1% | 336 | 0.0% | 538 | 0.1% | 254 | 0.0% | ||||
| Missing | 7,517 | 0.6% | 8,034 | 0.6% | 7,486 | 0.7% | 8,000 | 0.7% | ||||
| Proportion with 1915c waiver status code | 28,136 | 7.2% | 30,025 | 2.2% | 10,298 | 1.0% | 11,237 | 1.0% | ||||
| Type of 1915c Waiver Status Code | ||||||||||||
| Unknown--missing eligibility | 783 | 0.1% | 533 | 0.0% | 538 | 0.1% | 451 | 0.0% | ||||
| Aged & disabled | 13,575 | 1.1% | 14,772 | 1.1% | 1,912 | 0.2% | 2,341 | 0.2% | ||||
| Aged | 5,568 | 0.4% | 5,683 | 0.4% | 36 | 0.0% | 29 | 0.0% | ||||
| Disabled | 1,233 | 0.1% | 1,245 | 0.1% | 1,197 | 0.1% | 1,209 | 0.1% | ||||
| Brain injured | 104 | 0.0% | 127 | 0.0% | 99 | 0.0% | 122 | 0.0% | ||||
| HIV-AIDS | 279 | 0.0% | 241 | 0.0% | 248 | 0.0% | 213 | 0.0% | ||||
| MR/DD | 7,366 | 0.6% | 7,949 | 0.6% | 6,795 | 0.6% | 7,315 | 0.7% | ||||
| Mentally ill/severely emotionally disturbed | * | * | * | * | * | * | * | * | ||||
| Technology-dependent/ medically fragile | 11 | 0.0% | * | * | 11 | 0.0% | * | * | ||||
| Never enrolled in a 1915c waiver during the year | 1,248,980 | 97.7% | 1,310,258 | 97.7% | 1,043,576 | 99.0% | 1,097,172 | 98.9% | ||||
| Individuals Linked to Both Medicare & Medicaid in Given Year | 278,168 | 293,317 | 77,000 | 81,899 | ||||||||
| Average months of Medicare enrollment | 10.91 | 10.96 | 11.20 | 11.25 | ||||||||
| Average months of Medicaid enrollment | 11.29 | 11.34 | 11.31 | 11.36 | ||||||||
| Average months of both Medicare & Medicaid enrollment | 10.99 | 11.06 | 10.78 | 10.86 | ||||||||
| Proportion enrolled in Medicaid & Medicare during entire year | 233,048 | 83.8% | 247,856 | 84.5% | 62,580 | 5.9% | 66,926 | 81.7% | ||||
| Medicare & Medicaid Eligibility Status | ||||||||||||
| QMB only | 10,191 | 3.7% | 10,805 | 3.7% | 3,668 | 4.8% | 3,949 | 4.8% | ||||
| QMB plus | 187,826 | 67.5% | 196,167 | 66.9% | 51,317 | 66.6% | 53,462 | 65.3% | ||||
| SLMB only | 11,188 | 4.0% | 10,784 | 3.7% | 2,636 | 3.4% | 2,649 | 3.2% | ||||
| SLMB Plus | 3,770 | 1.4% | 4,661 | 1.6% | 1,123 | 1.5% | 1,457 | 1.8% | ||||
| Other dual | 62,307 | 22.4% | 68,471 | 23.3% | 16,862 | 21.9% | 19,128 | 23.4% | ||||
| Unknown | 209 | 0.1% | 83 | 0.0% | 39 | 0.1% | 21 | 0.0% | ||||
| NA | 2,677 | 1.0% | 2,346 | 0.8% | 1,355 | 1.8% | 1,233 | 1.5% | ||||
| Age 62 - 64 | Age 65+ | |||||||||||
| 2007 Linked to Medicare or Medicaid 2007 | 2008 Linked to Medicare or Medicaid 2008 | 2009 Linked to Medicare 2009 | 2007 Linked to Medicare or Medicaid 2007 | >2008 Linked to Medicare or Medicaid 2008 | 2009 Linked to Medicare 2009 | |||||||
| N | % | N | % | N | % | N | % | N | % | N | % | |
| * Cell sizes of less than 11 are not displayed. | ||||||||||||
| Individuals linked to Medicare | 12,178 | 13,059 | 14,157 | 285,204 | 297,227 | 302,835 | ||||||
| Proportion with Part A coverage | 12,159 | 100.00% | 13,038 | 99.84% | 14,133 | 99.83% | 273,417 | 95.87% | 284,540 | 95.73% | 292,656 | 96.64% |
| Average months of Medicare Part A coverage (among those with Part A cov) | 11.61 | 11.61 | 11.62 | 11.57 | 11.61 | 11.60 | ||||||
| Proportion with Part B coverage | 11,802 | 97.06% | 12,658 | 96.93% | 13,763 | 97.22% | 279,672 | 98.06% | 291,632 | 98.12% | 297,354 | 98.19% |
| Average months of Medicare Part B coverage (among those with Part B cov) | 11.55 | 11.56 | 11.55 | 11.60 | 11.61 | 11.62 | ||||||
| Proportion enrolled in Medicare Part A & B during entire year | 10,906 | 89.69% | 11,706 | 89.64% | 12,729 | 89.91% | 247,922 | 86.93% | 259,883 | 87.44% | 266,561 | 88.02% |
| Proportion in Medicare managed care for at least one month | 2,651 | 21.80% | 3,409 | 26.10% | 3,803 | 26.86% | 72,428 | 25.40% | 88,422 | 29.75% | 92,454 | 30.53% |
| Average months of Medicare HMO coverage (among those with HMO cov) | 10.00 | 10.07 | 10.69 | 10.38 | 10.45 | 10.88 | ||||||
| Original Reason for Entitlement | ||||||||||||
| Old age & survivor's insurance | 74 | 0.61% | 72 | 0.55% | 53 | 0.37% | 240,661 | 84.38% | 249,441 | 83.92% | 253,049 | 83.56% |
| Disability insurance benefits | 11,800 | 96.90% | 12,650 | 96.87% | 13,757 | 97.17% | 44,020 | 15.43% | 47,227 | 15.89% | 49,193 | 16.24% |
| ESRD | 107 | 0.88% | 122 | 0.93% | 130 | 0.92% | 276 | 0.10% | 284 | 0.10% | 293 | 0.10% |
| Disability Insurance & ESRD | 197 | 1.62% | 215 | 1.65% | 217 | 1.53% | 247 | 0.09% | 275 | 0.09% | 300 | 0.10% |
| Current Reason for Entitlement | ||||||||||||
| Old age & survivor's insurance | 100 | 0.82% | 91 | 0.70% | 64 | 0.45% | 282,414 | 99.02% | 293,103 | 98.61% | 297,375 | 98.20% |
| Disability insurance benefits | 11,790 | 96.81% | 12,666 | 96.99% | 13,785 | 97.37% | 2,227 | 0.78% | 3,515 | 1.18% | 4,846 | 1.60% |
| ESRD | 107 | 0.88% | 117 | 0.90% | 126 | 0.89% | 525 | 0.18% | 532 | 0.18% | 538 | 0.18% |
| Disability Insurance & ESRD | 181 | 1.49% | 185 | 1.42% | 182 | 1.29% | 38 | 0.01% | 77 | 0.03% | 76 | 0.03% |
| Medicare Coverage Status | ||||||||||||
| Part A only | 339 | 2.78% | 369 | 2.83% | 369 | 2.61% | 4,690 | 1.64% | 4,658 | 1.57% | 4,565 | 1.51% |
| Part B only | * | * | * | * | * | * | 10,362 | 3.63% | 11,166 | 3.76% | 8,300 | 2.74% |
| Both Part A & B or combination of coverage | 11,835 | 97.18% | 12,687 | 97.15% | 13,786 | 97.38% | 270,152 | 94.72% | 281,403 | 94.68% | 289,970 | 95.75% |
| Medicare Part D coverage at any point during the year | 10,927 | 89.73% | 11,920 | 91.28% | 12,939 | 91.40% | 249,244 | 87.39% | 262,885 | 88.45% | 269,611 | 89.03% |
| Average months of Part D coverage (among those with Part D cov) | 11.49 | 11.49 | 11.52 | 11.44 | 11.52 | 11.55 | ||||||
| Proportion with Part D Coverage by Cost Share Group Code | ||||||||||||
| Beneficiary deemed with 100% premium-subsidy & no copayment | 351 | 3.2% | 316 | 2.7% | 324 | 2.5% | 8,350 | 3.4% | 8,163 | 3.1% | 8,842 | 3.3% |
| Beneficiary deemed with 100% premium-subsidy & low copayment | 6,787 | 62.1% | 7,298 | 61.2% | 8,111 | 62.7% | 153,895 | 61.7% | 160,551 | 61.1% | 168,698 | 62.6% |
| Beneficiary deemed with 100% premium-subsidy & high copayment | 1,513 | 13.8% | 1,718 | 14.4% | 1,795 | 13.9% | 22,850 | 9.2% | 24,041 | 9.1% | 24,651 | 9.1% |
| Beneficiary with Low Income Subsidy (LIS), 100% premium-subsidy | 525 | 4.8% | 613 | 5.1% | 692 | 5.3% | 10,896 | 4.4% | 11,369 | 4.3% | 11,364 | 4.2% |
| Beneficiary with Low Income Subsidy (LIS), 100% premium-subsidy & 15% copayment | 18 | 0.2% | 19 | 0.2% | 20 | 0.2% | 1,120 | 0.4% | 1,003 | 0.4% | 946 | 0.4% |
| Beneficiary with LIS, 75% premium-subsidy & 15% copayment | 84 | 0.8% | 70 | 0.6% | 79 | 0.6% | 1,548 | 0.6% | 1,581 | 0.6% | 1,645 | 0.6% |
| Beneficiary with LIS, 50% premium-subsidy & 15% copayment | 62 | 0.6% | 76 | 0.6% | 83 | 0.6% | 1,449 | 0.6% | 1,487 | 0.6% | 1,467 | 0.5% |
| Beneficiary with LIS, 25% premium-subsidy & 15% copayment | 92 | 0.8% | 85 | 0.7% | 86 | 0.7% | 1,426 | 0.6% | 1,200 | 0.5% | 1,264 | 0.5% |
| No premium subsidy nor cost sharing | 1,056 | 9.7% | 1,130 | 9.5% | 1,276 | 9.9% | 37,260 | 14.9% | 40,590 | 15.4% | 42,949 | 15.9% |
| Missing | 439 | 4.0% | 595 | 5.0% | 473 | 3.7% | 10,450 | 4.2% | 12,900 | 4.9% | 7,785 | 2.9% |
| Individuals Linked to Medicaid | 22,838 | 22,277 | 200,648 | 209,679 | ||||||||
| Average months of Medicaid coverage (FFS or Managed care) | 11.23 | 11.28 | 11.26 | 11.32 | ||||||||
| Proportion enrolled in Medicaid during entire year (FFS or Managed care) | 19,634 | 85.97% | 19,357 | 86.89% | 174,096 | 86.77% | 184,044 | 87.77% | ||||
| In Medicaid managed care for at least one month | 4,126 | 18.07% | 4,847 | 21.76% | 108,451 | 54.05% | 111,754 | 53.30% | ||||
| Average months of Medicaid managed care (among those with managed care) | 7.96 | 8.24 | 8.22 | 8.47 | ||||||||
| Medicaid Basis for Eligibility | ||||||||||||
| Aged | 63 | 0.28% | 45 | 0.20% | 155,501 | 77.50% | 162,110 | 77.31% | ||||
| Blind/disabled | 19,683 | 86.19% | 19,067 | 85.59% | 44,667 | 22.26% | 47,279 | 22.55% | ||||
| Child | * | * | * | * | 24 | 0.01% | * | * | ||||
| Adult | 3,041 | 13.32% | 3,119 | 14.00% | 214 | 0.11% | 192 | 0.09% | ||||
| Child of unemployed adult | * | * | * | * | * | * | * | * | ||||
| Unemployed adult | * | * | * | * | * | * | * | * | ||||
| Foster care child | * | * | * | * | * | * | * | * | ||||
| Covered under Breast & Cervical Cancer Prevention Act | 12 | 0.05% | 14 | 0.06% | * | * | * | * | ||||
| Unknown | 21 | 0.09% | 13 | 0.06% | 224 | 0.11% | 69 | 0.03% | ||||
| 9011 | 15 | 0.07% | 17 | 0.08% | 16 | 0.01% | 17 | 0.01% | ||||
| Medicaid Maintenance of Assistance | ||||||||||||
| Receiving cash or eligible under Section 1931 of the Act | 13,079 | 57.27% | 12,306 | 55.24% | 124,438 | 62.02% | 130,281 | 62.13% | ||||
| Medically needy | 2,669 | 11.69% | 2,569 | 11.53% | 26,547 | 13.23% | 27,939 | 13.32% | ||||
| Poverty related (includes children eligible under SCHIP expansion) | 2,802 | 12.27% | 3,086 | 13.85% | 30,689 | 15.29% | 32,734 | 15.61% | ||||
| Other | 1,531 | 6.70% | 1,498 | 6.72% | 15,341 | 7.65% | 15,396 | 7.34% | ||||
| Foster care child | * | * | * | * | * | * | * | * | ||||
| 1115 demonstration expansion eligible | 2,721 | 11.91% | 2,788 | 12.52% | 3,393 | 1.69% | 3,243 | 1.55% | ||||
| Unknown | 21 | 0.09% | 13 | 0.06% | 224 | 0.11% | 69 | 0.03% | ||||
| Missing | 15 | 0.07% | 17 | 0.08% | 16 | 0.01% | 17 | 0.01% | ||||
| Proportion with 1915c waiver status code | 1,091 | 4.78% | 1,148 | 5.15% | 16,747 | 8.35% | 17,640 | 8.41% | ||||
| Type of 1915c Waiver Status Code | ||||||||||||
| Unknown--missing eligibility | 21 | 0.09% | 13 | 0.06% | 224 | 0.11% | 69 | 0.03% | ||||
| Aged & disabled | 784 | 3.43% | 831 | 3.73% | 10,879 | 5.42% | 11,600 | 5.53% | ||||
| Aged | 117 | 0.51% | 108 | 0.48% | 5,415 | 2.70% | 5,546 | 2.64% | ||||
| Disabled | 18 | 0.08% | 13 | 0.06% | 18 | 0.01% | 23 | 0.01% | ||||
| Brain injured | * | * | * | * | * | * | * | * | ||||
| HIV-AIDS | * | * | * | * | 23 | 0.01% | 24 | 0.01% | ||||
| MR/DD | 162 | 0.71% | 189 | 0.85% | 409 | 0.20% | 445 | 0.21% | ||||
| Mentally ill/severely emotionally disturbed | * | * | * | * | * | * | * | * | ||||
| Technology-dependent/ medically fragile | * | * | * | * | * | * | * | * | ||||
| Never enrolled in a 1915c waiver during the year | 21,726 | 95.13% | 21,116 | 94.79% | 183,677 | 91.54% | 191,970 | 91.55% | ||||
| Individuals Linked to Both Medicare & Medicaid in Given Year | 9,025 | 9,665 | 192,143 | 201,753 | ||||||||
| Average months of Medicare enrollment | 11.38 | 11.41 | 10.78 | 10.83 | ||||||||
| Average months of Medicaid enrollment | 11.15 | 11.28 | 11.29 | 11.34 | ||||||||
| Average months of both Medicare & Medicaid enrollment | 10.81 | 10.98 | 11.08 | 11.14 | ||||||||
| Proportion enrolled in Medicaid & Medicare during entire year | 7,253 | 80.37% | 8,019 | 82.97% | 163,215 | 84.94% | 172,911 | 85.70% | ||||
| Medicare & Medicaid Eligibility Status | ||||||||||||
| QMB only | 512 | 5.67% | 567 | 5.87% | 6,011 | 3.13% | 6,289 | 3.12% | ||||
| QMB plus | 5,545 | 61.44% | 5,880 | 60.84% | 130,964 | 68.16% | 136,825 | 67.82% | ||||
| SLMB only | 465 | 5.15% | 485 | 5.02% | 8,087 | 4.21% | 7,650 | 3.79% | ||||
| SLMB Plus | 152 | 1.68% | 201 | 2.08% | 2,495 | 1.30% | 3,003 | 1.49% | ||||
| Other dual | 2,237 | 24.79% | 2,450 | 25.35% | 43,208 | 22.49% | 46,893 | 23.24% | ||||
| Unknown | 11 | 0.12% | * | * | 159 | 0.08% | 56 | 0.03% | ||||
| NA | 103 | 1.14% | 76 | 0.79% | 1,219 | 0.63% | 1,037 | 0.51% | ||||
| All Ages | Age 62 | Age 62-64 | Age 65+ | |||||
| N | % | N | % | N | % | N | % | |
| * Cell sizes of less than 11 are not displayed. | ||||||||
| Individuals Linked to 2008 Medicare | 159,658 | 42,143 | 4,732 | 112,783 | ||||
| Proportion with Part A coverage | 151,062 | 94.6% | 42,140 | 100.0% | 4,716 | 99.7% | 104,206 | 92.4% |
| Average months of Medicare Part A coverage (among those with Part A cov) | 11.59 | 11.57 | 11.64 | 11.60 | ||||
| Proportion with Part B coverage | 158,717 | 99.4% | 41,566 | 98.6% | 4,673 | 98.8% | 112,478 | 99.7% |
| Average months of Medicare Part B coverage (among those with Part B cov) | 11.59 | 11.50 | 11.59 | 11.63 | ||||
| Proportion enrolled in Medicare Part A and B during entire year | 139,325 | 87.3% | 37,963 | 90.1% | 4,343 | 91.8% | 97,019 | 86.0% |
| Proportion in Medicare managed care for at least one month | 34,170 | 21.4% | 6,419 | 15.2% | 1,053 | 22.3% | 26,698 | 23.7% |
| Average months of Medicare HMO coverage (among those with HMO cov) | 9.67 | 9.16 | 9.64 | 9.79 | ||||
| Original Reason for Entitlement | ||||||||
| Old age and survivor's insurance | 97,812 | 61.3% | 11 | 0.0% | 31 | 0.7% | 97,770 | 86.7% |
| Disability insurance benefits | 60,300 | 37.8% | 40,928 | 97.1% | 4,559 | 96.3% | 14,813 | 13.1% |
| ESRD | 810 | 0.5% | 599 | 1.4% | 77 | 1.6% | 134 | 0.1% |
| Disability Insurance and ESRD | 736 | 0.5% | 605 | 1.4% | 65 | 1.4% | 66 | 0.1% |
| Current Reason for Entitlement | ||||||||
| Old age and survivor's insurance | 111,470 | 69.8% | 16 | 0.0% | 40 | 0.8% | 111,414 | 98.8% |
| Disability insurance benefits | 46,734 | 29.3% | 41,025 | 97.3% | 4,558 | 96.3% | 1,151 | 1.0% |
| ESRD | 851 | 0.5% | 577 | 1.4% | 76 | 1.6% | 198 | 0.2% |
| Disability Insurance and ESRD | 603 | 0.4% | 525 | 1.2% | 58 | 1.2% | 20 | 0.0% |
| Medicare Coverage Status | ||||||||
| Part A only | 802 | 0.5% | 498 | 1.2% | 54 | 1.1% | 250 | 0.2% |
| Part B only | 7,707 | 4.8% | * | * | * | * | 7,702 | 6.8% |
| Both Part A and B or combination of coverage | 151,149 | 94.7% | 41,643 | 98.8% | 4,675 | 98.8% | 104,831 | 92.9% |
| Medicare Part D coverage at any point during the year | 157,314 | 98.5% | 41,006 | 97.3% | 4,628 | 97.8% | 111,680 | 99.0% |
| Average months of Part D coverage (among those with Part D cov) | 11.56 | 11.44 | 11.53 | 11.61 | ||||
| Proportion with Part D Coverage by Cost Share Group Code | ||||||||
| Beneficiary deemed with 100% premium-subsidy and no copayment | 4,489 | 2.9% | 1,159 | 2.8% | 145 | 3.1% | 3,185 | 2.9% |
| Beneficiary deemed with 100% premium-subsidy and low copayment | 141,001 | 89.6% | 34,685 | 84.6% | 3,905 | 84.4% | 102,411 | 91.7% |
| Beneficiary deemed with 100% premium-subsidy and high copayment | 3,650 | 2.3% | 2,155 | 5.3% | 216 | 4.7% | 1,279 | 1.1% |
| Beneficiary with Low Income Subsidy (LIS), 100% premium-subsidy | 816 | 0.5% | 420 | 1.0% | 62 | 1.3% | 334 | 0.3% |
| Beneficiary with Low Income Subsidy (LIS), 100% premium-subsidy and 15% copayment | 42 | 0.0% | * | * | * | * | 30 | 0.0% |
| Beneficiary with LIS, 75% premium-subsidy and 15% copayment | 68 | 0.0% | 39 | 0.1% | * | * | 21 | 0.0% |
| Beneficiary with LIS, 50% premium-subsidy and 15% copayment | 70 | 0.0% | 34 | 0.1% | * | * | 30 | 0.0% |
| Beneficiary with LIS, 25% premium-subsidy and 15% copayment | 41 | 0.0% | 28 | 0.1% | * | * | * | * |
| No premium subsidy nor cost sharing | 1,236 | 0.8% | 464 | 1.1% | 85 | 1.8% | 687 | 0.6% |
| Missing | 5,901 | 3.8% | 2,013 | 4.9% | 195 | 4.2% | 3,693 | 3.3% |
| Individuals Linked to Medicaid | 248,031 | 122,425 | 11,895 | 113,711 | ||||
| Average months of Medicaid coverage (FFS or Managed care) | 11.70 | 11.69 | 11.69 | 11.71 | ||||
| Proportion enrolled in Medicaid during entire year (FFS or Managed care) | 233,708 | 94.2% | 114,744 | 93.7% | 11,193 | 94.1% | 107,771 | 94.8% |
| In Medicaid managed care for at least one month | 16,028 | 6.5% | 7,399 | 6.0% | 661 | 5.6% | 7,968 | 7.0% |
| Average months of Medicaid managed care (among those with managed care) | 8.31 | 8.20 | 7.78 | 8.46 | ||||
| Medicaid Basis for Eligibility | ||||||||
| Aged | 75,531 | 30.5% | 15 | 0.0% | 19 | 0.2% | 75,497 | 66.4% |
| Blind/disabled | 162,754 | 65.6% | 112,891 | 92.2% | 11,692 | 98.3% | 38,171 | 33.6% |
| Child | 74 | 0.0% | 74 | 0.1% | * | * | * | * |
| Adult | 9,505 | 3.8% | 9,299 | 7.6% | 176 | 1.5% | 30 | 0.0% |
| Child of Unemployed Adult | * | * | * | * | * | * | * | * |
| Unemployed Adult | * | * | * | * | * | * | * | * |
| Foster Care Child | * | * | * | * | * | * | * | * |
| Covered under Breast and Cervical Cancer Prevention Act | * | * | * | * | * | * | * | * |
| Unknown | 26 | 0.0% | 13 | 0.0% | * | * | * | * |
| Missing | 130 | 0.1% | 123 | 0.1% | * | * | * | * |
| Medicaid Maintenance of Assistance | ||||||||
| Receiving cash or eligible under section 1931 of the Act | 221,477 | 89.3% | 105,472 | 86.2% | 10,244 | 86.1% | 105,761 | 93.0% |
| Medically needy | 6,023 | 2.4% | 2,801 | 2.3% | 432 | 3.6% | 2,790 | 2.5% |
| Poverty related (includes children eligible under S-CHIP expansion) | 6,742 | 2.7% | 4,267 | 3.5% | 484 | 4.1% | 1,991 | 1.8% |
| Other | 10,766 | 4.3% | 7,095 | 5.8% | 572 | 4.8% | 3,099 | 2.7% |
| Foster Care Child | * | * | * | * | * | * | * | * |
| 1115 Demonostration expansion eligible | 2,865 | 1.2% | 2,652 | 2.2% | 156 | 1.3% | 57 | 0.1% |
| Unknown | 26 | 0.0% | 13 | 0.0% | * | * | * | * |
| Missing | 130 | 0.1% | 123 | 0.1% | * | * | * | * |
| Proportion with 1915c waiver status code | 13,790 | 5.6% | 4,299 | 3.5% | 639 | 5.4% | 8,852 | 7.8% |
| Type of 1915c Waiver Status Code | ||||||||
| Unknown--missing eligibility | 26 | 0.0% | 13 | 0.0% | * | * | * | * |
| Aged and disabled | 7,718 | 3.1% | 1,219 | 1.0% | 479 | 4.0% | 6,020 | 5.3% |
| Aged | 2,680 | 1.1% | 21 | 0.0% | 67 | 0.6% | 2,592 | 2.3% |
| Disabled | 756 | 0.3% | 746 | 0.6% | * | * | * | * |
| Brain injured | 43 | 0.0% | 42 | 0.0% | * | * | * | * |
| HIV-AIDS | 129 | 0.1% | 118 | 0.1% | * | * | * | * |
| MR/DD | 2,464 | 1.0% | 2,153 | 1.8% | 89 | 0.7% | 222 | 0.2% |
| Mentally ill/Severely emotionally disturbed | * | * | * | * | * | * | * | * |
| Technology-dependent/ medically fragile | * | * | * | * | * | * | * | * |
| Never enrolled in a 1915c waiver during the year | 234,215 | 94.4% | 118,113 | 96.5% | 11,251 | 94.6% | 104,851 | 92.2% |
| Individuals Linked to Both Medicare and Medicaid in Given Year | 154,643 | 39,944 | 4,445 | 110,254 | ||||
| Average months of Medicare enrollment | 10.89 | 11.39 | 11.48 | 10.69 | ||||
| Average months of Medicaid enrollment | 11.71 | 11.67 | 11.69 | 11.73 | ||||
| Average months of both Medicare & Medicaid enrollment | 11.45 | 11.20 | 11.36 | 11.55 | ||||
| Proportion enrolled in Medicaid & Medicare during entire year | 140,746 | 91.0% | 34,826 | 87.2% | 3,996 | 89.9% | 101,924 | 92.4% |
| Medicare and Medicaid Eligibility Status | ||||||||
| QMB only | 2,111 | 1.4% | 1,185 | 3.0% | 133 | 3.0% | 793 | 0.7% |
| QMB plus | 128,035 | 82.8% | 31,349 | 78.5% | 3,445 | 77.5% | 93,241 | 84.6% |
| SLMB only | 636 | 0.4% | 382 | 1.0% | 43 | 1.0% | 211 | 0.2% |
| SLMB Plus | 496 | 0.3% | 258 | 0.6% | 25 | 0.6% | 213 | 0.2% |
| Other dual | 22,719 | 14.7% | 6,396 | 16.0% | 769 | 17.3% | 15,554 | 14.1% |
| Unknown | * | * | * | * | * | * | * | * |
| NA | 637 | 0.4% | 370 | 0.9% | 29 | 0.7% | 238 | 0.2% |
Objective D: Compare Medicare and Medicaid Cost and Utilization for HUD-Assisted Medicare Beneficiaries and Unassisted Beneficiaries in the Community in the 12 Study Jurisdictions
| HUD-Assisted Beneficiaries (full year) | HUD-Assisted Beneficiaries (partial year) | Total HUD- Assisted Beneficiaries | Unassisted Beneficiaries in the Community | Total | |
| Exclusion Criteria | |||||
| All Medicare Beneficiaries | 362,162 | 45,460 | 407,622 | 5,345,040 | 5,752,662 |
| Medicare benes enrolled in A&B for entire 12 month period or up until death | 326,707 | 36,450 | 363,157 | 4,435,917 | 4,799,074 |
| No managed care/HMO (Medicare FFS only) | 232,630 | 26,807 | 259,437 | 3,302,595 | 3,562,032 |
| Subgroup Sample Sizes | |||||
| Subgroup A: Medicare-Medicaid benes, no SNF or NF days | 162,010 | 15,046 | 177,056 | 446,751 | 623,807 |
| Subgroup A1: Age 65+ | 104,416 | 7,629 | 112,045 | 249,490 | 361,535 |
| Subgroup B: Medicare-Medicaid benes with >0 and 365 SNF/NF days | 12,684 | 3,875 | 16,559 | 86,626 | 103,185 |
| Subgroup C: Medicare only, 65+ | 45,566 | 5,406 | 50,972 | 2,453,763 | 2,504,735 |
| Subgroup C1: Medicare only, 65+, No SNF days | 42,286 | 4,520 | 46,806 | 2,318,394 | 2,365,200 |
| 92% | 94% | ||||
| 2008 | |||||
| HUD-AssistedBeneficiaries(full year) | HUD-AssistedBeneficiaries(partial year) | Total HUD-Assisted Beneficiaries | Unassisted Beneficiariesin the Community | Total | |
| Subgroup A: Medicare-Medicaid benes, no SNF or NF days | 153,514 | 14,126 | 167,640 | 405,908 | 573,548 |
| Subgroup A1: Age 65+ | 99,568 | 7,196 | 106,764 | 227,186 | 333,950 |
| Subgroup B: Medicare-Medicaid benes with >0 and 365 SNF/NF days | 11,620 | 3,103 | 14,723 | 64,631 | 79,354 |
Sub-group A: Medicare-Medicaid Enrollees, with No Skilled Nursing Facility or Nursing Facility Use in 2008
| HUD-AssistedBeneficiaries(full year)(N=162,010) | HUD-AssistedBeneficiaries(partial year)(N=15,046) | Total HUD-Assisted Beneficiaries(N=177,056) | Unassisted Beneficiariesin the Community(N=446,751) | Assisted FullYear vs. Unassistedp-Value | Assisted PartialYear vs. Unassistedp-Value | Assisted Full Year vs.Assisted Partial Yearp-Value | Total HUD-Assistedvs. Unassisted Beneficiariesp-Value | |||||
| N | % | N | % | N | % | N | % | |||||
| * Cell sizes of less than 11 are not displayed. | ||||||||||||
| Demographic Characteristics | ||||||||||||
| Gender | 0.0001 | 0.0001 | 0.0001 | 0.0001 | ||||||||
| Male | 53,470 | 33.0% | 5,735 | 38.1% | 59,205 | 33.4% | 185,705 | 41.6% | ||||
| Female | 108,540 | 67.0% | 9,311 | 61.9% | 117,851 | 66.6% | 261,046 | 58.4% | ||||
| Race (based on RTI variable) | 0.0001 | 0.0001 | 0.0001 | 0.0001 | ||||||||
| Non-Hispanic White | 72,065 | 44.5% | 6,778 | 45.0% | 78,843 | 44.5% | 225,417 | 50.5% | ||||
| Hispanic | 33,686 | 20.8% | 2,782 | 18.5% | 36,468 | 20.6% | 77,647 | 17.4% | ||||
| Black | 37,254 | 23.0% | 4,037 | 26.8% | 41,291 | 23.3% | 79,703 | 17.8% | ||||
| Asian/Pacific Islander | 15,104 | 9.3% | 1,094 | 7.3% | 16,198 | 9.1% | 52,451 | 11.7% | ||||
| American Indian/Alaska Native | 219 | 0.1% | 26 | 0.2% | 245 | 0.1% | 911 | 0.2% | ||||
| Other | 3,219 | 2.0% | 302 | 2.0% | 3,521 | 2.0% | 9,430 | 2.1% | ||||
| Unknown | 463 | 0.3% | 27 | 0.2% | 490 | 0.3% | 1,192 | 0.3% | ||||
| Age Group | 0.0001 | 0.0001 | 0.0001 | 0.0001 | ||||||||
| Under 18 years | 14 | 0.0% | * | * | 15 | 0.0% | 82 | 0.0% | ||||
| 18 to 44 | 17,574 | 10.8% | 2,816 | 18.7% | 20,390 | 11.5% | 75,600 | 16.9% | ||||
| 45 to 64 | 40,006 | 24.7% | 4,600 | 30.6% | 44,606 | 25.2% | 121,579 | 27.2% | ||||
| 65 to 74 | 47,017 | 29.0% | 4,236 | 28.2% | 51,253 | 28.9% | 110,126 | 24.7% | ||||
| 75 to 79 | 23,256 | 14.4% | 1,472 | 9.8% | 24,728 | 14.0% | 50,505 | 11.3% | ||||
| 80 to 84 | 18,664 | 11.5% | 1,051 | 7.0% | 19,715 | 11.1% | 42,357 | 9.5% | ||||
| 85+ | 15,479 | 9.6% | 870 | 5.8% | 16,349 | 9.2% | 46,502 | 10.4% | ||||
| Geographic Area | 0.0001 | 0.0001 | 0.0001 | 0.0001 | ||||||||
| Vermont | 4,545 | 2.8% | 558 | 3.7% | 5,103 | 2.9% | 18,684 | 4.2% | ||||
| New Haven- Milford | 3,340 | 2.1% | 1,191 | 7.9% | 4,531 | 2.6% | 10,092 | 2.3% | ||||
| Bridgeport- Stamford- Norwalk | 3,123 | 1.9% | 312 | 2.1% | 3,435 | 1.9% | 7,017 | 1.6% | ||||
| Milwaukee- Waukesha- West Allis | 5,435 | 3.4% | 779 | 5.2% | 6,214 | 3.5% | 22,310 | 5.0% | ||||
| San Francisco- Oakland- Fremont | 18,645 | 11.5% | 1,136 | 7.6% | 19,781 | 11.2% | 53,090 | 11.9% | ||||
| Boston- Cambridge- Quincy | 29,951 | 18.5% | 2,630 | 17.5% | 32,581 | 18.4% | 60,731 | 13.6% | ||||
| Durham- Chapel Hill | 1,186 | 0.7% | 170 | 1.1% | 1,356 | 0.8% | 4,770 | 1.1% | ||||
| Richmond | 601 | 0.4% | 110 | 0.7% | 711 | 0.4% | 6,000 | 1.3% | ||||
| New York- Northern New Jersey- Long Island | 82,449 | 50.9% | 6,202 | 41.2% | 88,651 | 50.1% | 214,840 | 48.1% | ||||
| Columbus | 4,025 | 2.5% | 691 | 4.6% | 4,716 | 2.7% | 13,987 | 3.1% | ||||
| Akron | 2,230 | 1.4% | 367 | 2.4% | 2,597 | 1.5% | 5,742 | 1.3% | ||||
| Cleveland | 6,480 | 4.0% | 900 | 6.0% | 7,380 | 4.2% | 19,868 | 4.4% | ||||
| Missing | * | * | * | * | * | * | 9,620 | 2.2% | ||||
| Died during the year | 1,115 | 0.7% | 1,105 | 7.3% | 2,220 | 1.3% | 8,361 | 1.9% | 0.0001 | 0.0001 | 0.0001 | 0.0001 |
| Medicare Coverage Characteristics | ||||||||||||
| Original Reason for Entitlement | 0.0001 | 0.0001 | 0.0001 | 0.0001 | ||||||||
| Old age and survivor's insurance | 86,440 | 53.4% | 6,262 | 41.6% | 92,702 | 52.4% | 212,154 | 47.5% | ||||
| Disability insurance benefits | 73,507 | 45.4% | 8,473 | 56.3% | 81,980 | 46.3% | 226,970 | 50.8% | ||||
| ESRD | 790 | 0.5% | 101 | 0.7% | 891 | 0.5% | 2,872 | 0.6% | ||||
| Disability Insurance and ESRD | 1,273 | 0.8% | 210 | 1.4% | 1,483 | 0.8% | 4,755 | 1.1% | ||||
| Current reason for entitlement | 0.0001 | 0.0001 | 0.0001 | 0.0001 | ||||||||
| Old age and survivor's insurance | 102,553 | 63.3% | 7,531 | 50.1% | 110,084 | 62.2% | 245,204 | 54.9% | ||||
| Disability insurance benefits | 57,608 | 35.6% | 7,237 | 48.1% | 64,845 | 36.6% | 194,664 | 43.6% | ||||
| ESRD | 850 | 0.5% | 115 | 0.8% | 965 | 0.5% | 3,094 | 0.7% | ||||
| Disability Insurance and ESRD | 999 | 0.6% | 163 | 1.1% | 1,162 | 0.7% | 3,789 | 0.8% | ||||
| Medicare Part D coverage at any point during the year | 160,720 | 99.2% | 14,895 | 99.0% | 175,615 | 99.2% | 438,816 | 98.2% | 0.0001 | 0.0001 | 0.0001 | 0.0001 |
| Average months of Part D coverage (among those with Part D cov) | 11.92 | 11.64 | 11.90 | 11.81 | 0.0001 | 0.0001 | 0.0001 | 0.0001 | ||||
| Proportion with Part D Coverage by Cost Share Group Code | 0.0001 | 0.0001 | 0.0001 | 0.0001 | ||||||||
| Beneficiary deemed with 100% premium-subsidy and no copayment | 2,562 | 1.6% | 264 | 1.8% | 2,826 | 1.6% | 17,013 | 3.9% | ||||
| Beneficiary deemed with 100% premium-subsidy and low copayment | 139,497 | 86.8% | 12,369 | 83.0% | 151,866 | 86.5% | 348,889 | 79.5% | ||||
| Beneficiary deemed with 100% premium-subsidy and high copayment | 16,950 | 10.5% | 2,013 | 13.5% | 18,963 | 10.8% | 62,340 | 14.2% | ||||
| Beneficiary with Low Income Subsidy (LIS), 100% premium-subsidy | 394 | 0.2% | 68 | 0.5% | 462 | 0.3% | 2,113 | 0.5% | ||||
| Beneficiary with Low Income Subsidy (LIS), 100% premium-subsidy and 15% copayment | 31 | 0.0% | * | * | 34 | 0.0% | 112 | 0.0% | ||||
| Beneficiary with LIS, 75% premium-subsidy and 15% copayment | 53 | 0.0% | * | * | 58 | 0.0% | 193 | 0.0% | ||||
| Beneficiary with LIS, 50% premium-subsidy and 15% copayment | 64 | 0.0% | * | * | 69 | 0.0% | 271 | 0.1% | ||||
| Beneficiary with LIS, 25% premium-subsidy and 15% copayment | 49 | 0.0% | * | * | 53 | 0.0% | 195 | 0.0% | ||||
| No premium subsidy nor cost sharing | 285 | 0.2% | 32 | 0.2% | 317 | 0.2% | 2,409 | 0.5% | ||||
| Missing | 835 | 0.5% | 132 | 0.9% | 967 | 0.6% | 5,281 | 1.2% | ||||
| Medicaid Coverage Status | ||||||||||||
| Average months of Medicaid coverage (FFS or Managed care) | 11.72 | 11.12 | 11.66 | 11.27 | 0.0001 | 0.0001 | 0.0001 | 0.0001 | ||||
| Proportion enrolled in Medicaid during entire year (FFS or Managed care) | 151,842 | 93.7% | 12,063 | 80.2% | 163,905 | 92.6% | 382,471 | 85.6% | 0.0001 | 0.0001 | 0.0001 | 0.0001 |
| In Medicaid managed care for at least one month | 8,479 | 5.2% | 913 | 6.1% | 9,392 | 5.3% | 40,546 | 9.1% | 0.0001 | 0.0001 | 0.0001 | 0.0001 |
| Average months of Medicaid managed care (among those with managed care) | 8.27 | 7.33 | 8.18 | 8.69 | 0.0001 | 0.0001 | 0.0001 | 0.0001 | ||||
| Medicaid Basis for Eligibility | 0.0001 | 0.0001 | 0.0001 | 0.0001 | ||||||||
| Aged | 79,561 | 49.1% | 6,089 | 40.5% | 85,650 | 48.4% | 212,485 | 47.6% | ||||
| Blind/disabled | 80,923 | 49.9% | 8,680 | 57.7% | 89,603 | 50.6% | 227,892 | 51.0% | ||||
| Child | * | * | * | * | * | * | 31 | 0.0% | ||||
| Adult | 1,502 | 0.9% | 267 | 1.8% | 1,769 | 1.0% | 6,026 | 1.3% | ||||
| Child of unemployed adult | * | * | * | * | * | * | * | * | ||||
| Unemployed adult | * | * | * | * | * | * | * | * | ||||
| Foster care child | * | * | * | * | * | * | * | * | ||||
| Covered under Breast and Cervical Cancer Prevention Act | * | * | * | * | * | * | 16 | 0.0% | ||||
| Unknown | 16 | 0.0% | * | * | 23 | 0.0% | 268 | 0.1% | ||||
| Missing | * | * | * | * | * | * | 29 | 0.0% | ||||
| Medicaid Maintenance of Assistance | 0.0001 | 0.0001 | 0.0001 | 0.0001 | ||||||||
| Receiving cash or eligible under section 1931 of the Act | 100,292 | 61.9% | 7,871 | 52.3% | 108,163 | 61.1% | 221,480 | 49.6% | ||||
| Medically needy | 18,370 | 11.3% | 1,684 | 11.2% | 20,054 | 11.3% | 64,675 | 14.5% | ||||
| Poverty related (includes children eligible under SCHIP expansion) | 29,343 | 18.1% | 3,439 | 22.9% | 32,782 | 18.5% | 98,468 | 22.0% | ||||
| Other | 10,422 | 6.4% | 1,652 | 11.0% | 12,074 | 6.8% | 41,710 | 9.3% | ||||
| Foster Care Child | * | * | * | * | * | * | * | * | ||||
| 1115 Demonstration expansion eligible | 3,564 | 2.2% | 393 | 2.6% | 3,957 | 2.2% | 20,117 | 4.5% | ||||
| Unknown | 16 | 0.0% | * | * | 23 | 0.0% | 268 | 0.1% | ||||
| Missing | * | * | * | * | * | * | 29 | 0.0% | ||||
| Proportion with 1915c Waiver Status Code | 13,939 | 8.6% | 1,231 | 8.2% | 15,170 | 8.6% | 41,118 | 9.2% | 0.0001 | 0.0001 | 0.0001 | 0.0001 |
| Type of 1915c Waiver Status Code | 0.0001 | 0.0001 | 0.0001 | 0.0001 | ||||||||
| Unknown--missing eligibility | 16 | 0.0% | * | * | 23 | 0.0% | 268 | 0.1% | ||||
| Aged and disabled | 7,196 | 4.4% | 577 | 3.8% | 7,773 | 4.4% | 12,645 | 2.8% | ||||
| Aged | 2,976 | 1.8% | 297 | 2.0% | 3,273 | 1.8% | 3,757 | 0.8% | ||||
| Disabled | 428 | 0.3% | 58 | 0.4% | 486 | 0.3% | 946 | 0.2% | ||||
| Brain injured | 58 | 0.0% | * | * | 61 | 0.0% | 561 | 0.1% | ||||
| HIV-AIDS | 126 | 0.1% | * | * | 130 | 0.1% | 261 | 0.1% | ||||
| MR/DD | 3,154 | 1.9% | 292 | 1.9% | 3,446 | 1.9% | 22,942 | 5.1% | ||||
| Mentally ill/Severely emotionally disturbed | * | * | * | * | * | * | * | * | ||||
| Technology-dependent/ medically fragile | * | * | * | * | * | * | * | * | ||||
| Never enrolled in a 1915c waiver during the year | 148,055 | 91.4% | 13,808 | 91.8% | 161,863 | 91.4% | 405,365 | 90.7% | ||||
| Average Months of both Medicare & Medicaid Enrollment | 11.69 | 11.06 | 11.63 | 11.22 | 0.0001 | 0.0001 | 0.0001 | 0.0001 | ||||
| Proportion Enrolled in Medicaid & Medicare During Entire Year | 151,222 | 93.3% | 12,000 | 79.8% | 163,222 | 92.2% | 380,037 | 85.1% | 0.0001 | 0.0001 | 0.0001 | 0.0001 |
| Medicare & Medicaid Eligibility Status | 0.0001 | 0.0001 | 0.0001 | 0.0001 | ||||||||
| QMB only | 5,377 | 3.3% | 886 | 5.9% | 6,263 | 3.5% | 18,807 | 4.2% | ||||
| QMB plus | 123,126 | 76.0% | 10,453 | 69.5% | 133,579 | 75.4% | 286,049 | 64.0% | ||||
| SLMB only | 4,917 | 3.0% | 555 | 3.7% | 5,472 | 3.1% | 18,612 | 4.2% | ||||
| SLMB Plus | 2,231 | 1.4% | 283 | 1.9% | 2,514 | 1.4% | 7,280 | 1.6% | ||||
| Other dual | 26,202 | 16.2% | 2,823 | 18.8% | 29,025 | 16.4% | 114,929 | 25.7% | ||||
| Unknown | 16 | 0.0% | * | * | 23 | 0.0% | 268 | 0.1% | ||||
| NA | 141 | 0.1% | 39 | 0.3% | 180 | 0.1% | 806 | 0.2% | ||||
| CCW Condition | Total HUD-AssistedBeneficiaries | Unassisted Beneficiariesin the Community | P-Value | ||
| N | % | N | % | ||
| Prevalence of Chronic Conditions | 0.0001 | ||||
| 0 Conditions | 19,022 | 10.7% | 75,519 | 16.9% | |
| 1 Condition | 18,526 | 10.5% | 59,827 | 13.4% | |
| 2 Conditions | 19,850 | 11.2% | 58,407 | 13.1% | |
| 3 Conditions | 22,169 | 12.5% | 58,461 | 13.1% | |
| 4 Conditions | 22,075 | 12.5% | 53,155 | 11.9% | |
| 5 or More Conditions | 75,414 | 42.6% | 141,382 | 31.6% | |
| Prevalence of Chronic Conditions by Category | |||||
| Cardiovascular | 77,226 | 43.6% | 160,603 | 35.9% | 0.0001 |
| Cancer | 10,920 | 6.2% | 21,515 | 4.8% | 0.0001 |
| Endocrine and Renal | 83,307 | 47.1% | 179,734 | 40.2% | 0.0001 |
| Alzheimer's-related | 18,206 | 10.3% | 46,561 | 10.4% | 0.1088 |
| Depression | 41,194 | 23.2% | 85,196 | 19.1% | 0.0001 |
| Musculoskeletal | 70,015 | 39.5% | 128,187 | 28.7% | 0.0001 |
| Pulmonary | 33,660 | 19.0% | 67,928 | 15.2% | 0.0001 |
| Opthalmic | 51,161 | 28.9% | 96,823 | 21.7% | 0.0001 |
| Other | 134,176 | 75.8% | 299,149 | 66.9% | 0.0001 |
| HUD-Assisted Beneficiaries | Unassisted Beneficiaries in the Community | p-Value | |||||
| Mean | SD | Median | Mean | SD | Median | ||
| Total Admissions | 35.4 | 94.4 | 0 | 35.23 | 99.25 | 0 | 0.5912 |
| Acute stay admissions | 31.39 | 86.67 | 0 | 29.61 | 87.38 | 0 | 0.0001 |
| Other inpatient admissions | 4 | 28.67 | 0 | 5.62 | 36.92 | 0 | 0.0001 |
| Hospital Readmissions | 5.49 | 39.26 | 0 | 5.47 | 41.47 | 0 | 0.8163 |
| Medicare home health visits | 450.44 | 2752.27 | 0 | 317.87 | 2303.14 | 0 | 0.0001 |
| Medicare hospice days | 27.95 | 693.46 | 0 | 126.79 | 1754.93 | 0 | 0.0001 |
| Hospital Outpatient visits | 896.07 | 2063.01 | 333.33 | 822.82 | 2179.92 | 250 | 0.0001 |
| Total emergency room visits (total) | 80.26 | 216.39 | 0 | 77.85 | 209.05 | 0 | 0.0001 |
| Hospital outpatient ER visits | 57.42 | 190.47 | 0 | 55.29 | 175.57 | 0 | 0.0001 |
| Hospital inpatient ER visits | 22.84 | 69.9 | 0 | 22.57 | 72.89 | 0 | 0.1923 |
| Physician office visits | 1605.79 | 1877.55 | 1083.33 | 1356.05 | 1940.13 | 833.33 | 0.0001 |
| Ambulatory surgery center visits | 12.03 | 85.28 | 0 | 8.51 | 59.64 | 0 | 0.0001 |
| Dialysis events | 25.69 | 229.91 | 0 | 27.42 | 234.23 | 0 | 0.0098 |
| Anesthesia events | 27.8 | 84.41 | 0 | 24.56 | 84.33 | 0 | 0.0001 |
| Imaging events | 467.35 | 654.78 | 250 | 385.9 | 646.42 | 166.67 | 0.0001 |
| Test events | 1523.4 | 2284.72 | 666.67 | 1299.09 | 2121.31 | 500 | 0.0001 |
| Other procedures | 1089.99 | 3168.87 | 166.67 | 625.6 | 2187.99 | 83.33 | 0.0001 |
| Durable medical equipment (DME) | 351.86 | 743.07 | 0 | 270.44 | 695.6 | 0 | 0.0001 |
| Part B Drugs | 261.44 | 680.9 | 83.33 | 217.56 | 629.95 | 0 | 0.0001 |
| Part D* Drugs | 4846.77 | 3962.12 | 4083.33 | 4037.48 | 3610.16 | 3250 | 0.0001 |
| Any Use of Medicare Service During Year(% with any use) | N | % | N | % | p-Value | ||
| Total Admissions | 38509 | 21.7% | 93427 | 20.9% | 0.0001 | ||
| Acute stay admissions | 35966 | 20.3% | 84464 | 18.9% | 0.0001 | ||
| Other inpatient admissions | 5210 | 2.9% | 16792 | 3.8% | 0.0001 | ||
| Hospital Readmissions | 6504 | 3.7% | 15762 | 3.5% | 0.0058 | ||
| Medicare home health | 19651 | 11.1% | 37983 | 8.5% | 0.0001 | ||
| Medicare hospice | 734 | 0.4% | 4156 | 0.9% | 0.0001 | ||
| Hospital Outpatient | 135778 | 76.7% | 315763 | 70.7% | 0.0001 | ||
| Total emergency room | 69994 | 39.5% | 164650 | 36.9% | 0.0001 | ||
| Hospital outpatient ER | 56051 | 31.7% | 130407 | 29.2% | 0.0001 | ||
| Hospital inpatient ER | 28942 | 16.3% | 70215 | 15.7% | 0.0001 | ||
| Physician office | 164683 | 93.0% | 398772 | 89.3% | 0.0001 | ||
| Ambulatory surgery center | 9764 | 5.5% | 19923 | 4.5% | 0.0001 | ||
| Dialysis | 3519 | 2.0% | 9542 | 2.1% | 0.0003 | ||
| Anesthesia | 31909 | 18.0% | 69273 | 15.5% | 0.0001 | ||
| Imaging | 130775 | 73.9% | 293855 | 65.8% | 0.0001 | ||
| Test | 140238 | 79.2% | 331172 | 74.1% | 0.0001 | ||
| Other procedures | 110295 | 62.3% | 242306 | 54.2% | 0.0001 | ||
| Durable medical equipment (DME) | 73039 | 41.3% | 141492 | 31.7% | 0.0001 | ||
| Part B Drugs | 92300 | 52.1% | 213748 | 47.8% | 0.0001 | ||
| Part D* Drugs | 164600 | 93.7% | 391597 | 87.7% | 0.0001 | ||
| HUD-Assisted Beneficiaries | Unassisted Beneficiaries in the Community | p-Value | |||||
| N | % | N | % | ||||
| * Limited to those who have Part D coverage for entire year or up until death. | |||||||
| Limited to Those with Medicaid Fee-for-Service (FFS)--No Managed Care | 167,640 | 95% | 405,908 | 91% | |||
| Medicaid Service Utilization per 1000 Member Months | Mean | SD | Median | Mean | SD | Median | p-Value |
| Personal Care services | 3244.43 | 8680.31 | 0 | 1434.04 | 5868.36 | 0 | 0.0001 |
| Residential care | 55.15 | 849.47 | 0 | 130.89 | 1607.23 | 0 | 0.0001 |
| DME | 368.86 | 1330.65 | 0 | 238.73 | 1153.17 | 0 | 0.0001 |
| Other HCBS services (*private duty nursing, adult day care, home health, rehab, targeted case management, transportation, and hospice) | 3081.62 | 8567.01 | 0 | 2311.06 | 7827.64 | 0 | 0.0001 |
| Any Use of Medicare Service During Year(% with any use) | N | % | N | % | p-Value | ||
| Personal Care services | 35,858 | 21% | 41,904 | 10% | 0.0001 | ||
| Residential care | 3,401 | 2% | 12,430 | 3% | 0.0001 | ||
| DME | 76,918 | 46% | 131,421 | 32% | 0.0001 | ||
| Other HCBS services | 64,469 | 38% | 116,205 | 29% | 0.0001 | ||
| Medicare Payment PMPM ($) | Total HUD-Assisted Beneficiaries | Unassisted Beneficiaries in the Community | p-Value | ||||
| Mean | SD | Median | Mean | SD | Median | ||
| Total Admissions PMPM | $375 | $1,356 | $0 | $373 | $1,408 | $0 | 0.5962 |
| Acute stay admission PMPM | $329 | $1,248 | $0 | $311 | $1,259 | $0 | 0.0001 |
| Other inpatient admission PMPM | $46 | $400 | $0 | $62 | $495 | $0 | 0.0001 |
| Medicare home health PMPM (Medicare only) | $52 | $235 | $0 | $39 | $203 | $0 | 0.0001 |
| Medicare hospice PMPM (Medicare only) | $5 | $122 | $0 | $20 | $277 | $0 | 0.0001 |
| Hospital Outpatient PMPM | $153 | $519 | $38 | $142 | $486 | $24 | 0.0001 |
| Physician office PMPM | $100 | $133 | $62 | $83 | $138 | $45 | 0.0001 |
| Ambulatory surgery center PMPM | $4 | $26 | $0 | $3 | $23 | $0 | 0.0001 |
| Dialysis PMPM | $4 | $32 | $0 | $4 | $32 | $0 | 0.0156 |
| Anesthesia PMPM | $4 | $11 | $0 | $3 | $11 | $0 | 0.0001 |
| Imaging PMPM | $31 | $56 | $8 | $23 | $46 | $4 | 0.0001 |
| Test PMPM | $34 | $64 | $11 | $26 | $57 | $8 | 0.0001 |
| Other procedures PMPM | $64 | $158 | $10 | $43 | $128 | $3 | 0.0001 |
| Durable medical equipment (DME) PMPM | $29 | $95 | $0 | $22 | $92 | $0 | 0.0001 |
| Part B Drugs PMPM | $23 | $260 | $0 | $23 | $642 | $0 | 0.8782 |
| Part D* Drugs PMPM | $398 | $547 | $243 | $367 | $570 | $195 | 0.0001 |
| Total Medical and Rx PMPM (sum of all above) | $1,269 | $2,043 | $648 | $1,161 | $2,178 | $508 | 0.0001 |
| Total Medical PMPM (sum of all above except part D PMPM) | $854 | $1,832 | $272 | $783 | $1,876 | $184 | 0.0001 |
| Medicaid Service Utilization per 1000 Member Months | Total HUD-Assisted Beneficiaries | Unassisted Beneficiaries in the Community | p-Value | ||||
| N | % | N | % | ||||
| * Limited to those who have Part D coverage for entire year or up until death. | |||||||
| Limited to Those with Medicaid Fee-for-Service (FFS)--No Managed Care | 167,640 | 95% | 405,908 | 91% | |||
| Medicaid Payment PMPM--Divide by Total Medicaid Months | Mean | SD | Median | Mean | SD | Median | p-Value |
| Total Medicaid payment amount | $1,057 | $1,892 | $193 | $1,127 | $2,667 | $105 | 0.0001 |
| Fee-for-service Medicaid payment amount | $947 | $1,844 | $156 | $1,044 | $2,648 | $83 | 0.0001 |
| Personal Care services | $392 | $1,176 | $0 | $204 | $902 | $0 | 0.0001 |
| Residential care | $47 | $474 | $0 | $165 | $1,153 | $0 | 0.0001 |
| DME | $22 | $122 | $0 | $18 | $128 | $0 | 0.0001 |
| Other HCBS services (*private duty nursing, adult day care, home health, rehab, targeted case management, transportation, and hospice) | $254 | $996 | $0 | $220 | $919 | $0 | 0.0001 |
Sub-group A1: Medicare-Medicaid Enrollees (MMEs), Age 65+, with No SNF or NF Use in 2008
| HUD-AssistedBeneficiaries(full year)(N=104,416) | HUD-AssistedBeneficiaries(partial year)(N=7,629) | Total HUD-Assisted Beneficiaries(N=112,045) | Unassisted Beneficiariesin the Community(N=249,490) | Assisted FullYear vs. Unassistedp-Value | Assisted PartialYear vs. Unassistedp-Value | Assisted Full Year vs.Assisted Partial Yearp-Value | Total HUD-Assistedvs. Unassisted Beneficiariesp-Value | |||||
| N | % | N | % | N | % | N | % | |||||
| * Cell sizes of less than 11 are not displayed. | ||||||||||||
| Demographic Characteristics | ||||||||||||
| Gender | 0.0001 | 0.0249 | 0.0001 | 0.0001 | ||||||||
| Male | 30,479 | 29.2% | 2,526 | 33.1% | 33,005 | 29.5% | 79,565 | 31.9% | ||||
| Female | 73,937 | 70.8% | 5,103 | 66.9% | 79,040 | 70.5% | 169,925 | 68.1% | ||||
| Race (based on RTI variable) | 0.0001 | 0.0001 | 0.0008 | 0.0001 | ||||||||
| Non-Hispanic White | 46,343 | 44.4% | 3,438 | 45.1% | 49,781 | 44.4% | 109,981 | 44.1% | ||||
| Hispanic | 22,447 | 21.5% | 1,501 | 19.7% | 23,948 | 21.4% | 50,563 | 20.3% | ||||
| Black | 18,659 | 17.9% | 1,457 | 19.1% | 20,116 | 18.0% | 35,837 | 14.4% | ||||
| Asian/Pacific Islander | 13,959 | 13.4% | 990 | 13.0% | 14,949 | 13.3% | 45,773 | 18.3% | ||||
| American Indian/Alaska Native | 97 | 0.1% | 10 | 0.1% | 107 | 0.1% | 418 | 0.2% | ||||
| Other | 2,582 | 2.5% | 214 | 2.8% | 2,796 | 2.5% | 6,289 | 2.5% | ||||
| Unknown | 329 | 0.3% | 19 | 0.2% | 348 | 0.3% | 629 | 0.3% | ||||
| Age Group | 0.0001 | 0.0001 | 0.0001 | 0.0001 | ||||||||
| Under 18 years | * | * | * | * | * | * | * | * | ||||
| 18 to 44 | * | * | * | * | * | * | * | * | ||||
| 45 to 64 | * | * | * | * | * | * | * | * | ||||
| 65 to 74 | 47,017 | 45.0% | 4,236 | 55.5% | 51,253 | 45.7% | 110,126 | 44.1% | ||||
| 75 to 79 | 23,256 | 22.3% | 1,472 | 19.3% | 24,728 | 22.1% | 50,505 | 20.2% | ||||
| 80 to 84 | 18,664 | 17.9% | 1,051 | 13.8% | 19,715 | 17.6% | 42,357 | 17.0% | ||||
| 85+ | 15,479 | 14.8% | 870 | 11.4% | 16,349 | 14.6% | 46,502 | 18.6% | ||||
| Geographic Area | 0.0001 | 0.0001 | 0.0001 | 0.0001 | ||||||||
| Vermont | 2,362 | 2.3% | 259 | 3.4% | 2,621 | 2.3% | 10,881 | 4.4% | ||||
| New Haven- Milford | 1,871 | 1.8% | 477 | 6.3% | 2,348 | 2.1% | 4,408 | 1.8% | ||||
| Bridgeport- Stamford- Norwalk | 1,888 | 1.8% | 135 | 1.8% | 2,023 | 1.8% | 3,541 | 1.4% | ||||
| Milwaukee- Waukesha- West Allis | 3,206 | 3.1% | 359 | 4.7% | 3,565 | 3.2% | 12,130 | 4.9% | ||||
| San Francisco- Oakland- Fremont | 13,397 | 12.8% | 747 | 9.8% | 14,144 | 12.6% | 32,726 | 13.1% | ||||
| Boston- Cambridge- Quincy | 14,769 | 14.1% | 933 | 12.2% | 15,702 | 14.0% | 25,419 | 10.2% | ||||
| Durham- Chapel Hill | 428 | 0.4% | 39 | 0.5% | 467 | 0.4% | 2,134 | 0.9% | ||||
| Richmond | 263 | 0.3% | 27 | 0.4% | 290 | 0.3% | 2,933 | 1.2% | ||||
| New York- Northern New Jersey- Long Island | 60,310 | 57.8% | 4,035 | 52.9% | 64,345 | 57.4% | 137,642 | 55.2% | ||||
| Columbus | 1,672 | 1.6% | 258 | 3.4% | 1,930 | 1.7% | 4,572 | 1.8% | ||||
| Akron | 890 | 0.9% | 89 | 1.2% | 979 | 0.9% | 1,930 | 0.8% | ||||
| Cleveland | 3,360 | 3.2% | 271 | 3.6% | 3,631 | 3.2% | 7,558 | 3.0% | ||||
| Missing | * | * | * | * | * | * | 3,616 | 1.4% | ||||
| Died during the year | 899 | 0.9% | 820 | 10.7% | 1,719 | 1.5% | 6,456 | 2.6% | 0.0001 | 0.0001 | 0.0001 | 0.0001 |
| Medicare Coverage Characteristics | ||||||||||||
| Original Reason for Entitlement | 0.0001 | 0.0001 | 0.0013 | 0.0001 | ||||||||
| Old age and survivor's insurance | 86,439 | 82.8% | 6,262 | 82.1% | 92,701 | 82.7% | 212,132 | 85.0% | ||||
| Disability insurance benefits | 17,701 | 17.0% | 1,333 | 17.5% | 19,034 | 17.0% | 36,587 | 14.7% | ||||
| ESRD | 149 | 0.1% | 12 | 0.2% | 161 | 0.1% | 408 | 0.2% | ||||
| Disability Insurance and ESRD | 127 | 0.1% | 22 | 0.3% | 149 | 0.1% | 363 | 0.1% | ||||
| Current Reason for Entitlement | 0.0138 | 0.0001 | 0.0001 | 0.1429 | ||||||||
| Old age and survivor's insurance | 102,549 | 98.2% | 7,530 | 98.7% | 110,079 | 98.2% | 245,192 | 98.3% | ||||
| Disability insurance benefits | 1,572 | 1.5% | 64 | 0.8% | 1,636 | 1.5% | 3,493 | 1.4% | ||||
| ESRD | 256 | 0.2% | 30 | 0.4% | 286 | 0.3% | 721 | 0.3% | ||||
| Disability Insurance and ESRD | 39 | 0.0% | * | * | 44 | 0.0% | 84 | 0.0% | ||||
| Medicare Part D Coverage at Any Point During the Year | 103,314 | 98.9% | 7,510 | 98.4% | 110,824 | 98.9% | 242,664 | 97.3% | 0.0001 | 0.0001 | 0.0001 | 0.0001 |
| Average Months of Part D Coverage(among those with Part D cov) | 11.94 | 11.51 | 11.91 | 11.80 | 0.0001 | 0.0001 | 0.0001 | 0.0001 | ||||
| Proportion with Part D Coverage by Cost Share Group Code | 0.0001 | 0.0001 | 0.0001 | 0.0001 | ||||||||
| Beneficiary deemed with 100% premium-subsidy and no copayment | 1,292 | 1.3% | 117 | 1.6% | 1,409 | 1.3% | 6,802 | 2.8% | ||||
| Beneficiary deemed with 100% premium-subsidy and low copayment | 91,550 | 88.6% | 6,322 | 84.2% | 97,872 | 88.3% | 196,474 | 81.0% | ||||
| Beneficiary deemed with 100% premium-subsidy and high copayment | 9,467 | 9.2% | 915 | 12.2% | 10,382 | 9.4% | 32,736 | 13.5% | ||||
| Beneficiary with Low Income Subsidy(LIS), 100% premium-subsidy | 258 | 0.2% | 39 | 0.5% | 297 | 0.3% | 1,230 | 0.5% | ||||
| Beneficiary with Low Income Subsidy(LIS), 100% premium-subsidy and 15% copayment | 27 | 0.0% | * | * | 30 | 0.0% | 90 | 0.0% | ||||
| Beneficiary with LIS, 75% premium-subsidy and 15% copayment | 38 | 0.0% | * | * | 40 | 0.0% | 129 | 0.1% | ||||
| Beneficiary with LIS, 50% premium-subsidy and 15% copayment | 48 | 0.0% | * | * | 52 | 0.0% | 200 | 0.1% | ||||
| Beneficiary with LIS, 25% premium-subsidy and 15% copayment | 32 | 0.0% | * | * | 34 | 0.0% | 146 | 0.1% | ||||
| No premium subsidy nor cost sharing | 235 | 0.2% | 28 | 0.4% | 263 | 0.2% | 2,068 | 0.9% | ||||
| Missing | 367 | 0.4% | 78 | 1.0% | 445 | 0.4% | 2,789 | 1.1% | ||||
| Medicaid Coverage Status | ||||||||||||
| Average Months of Medicaid Coverage(FFS or Managed care) | 11.76 | 11.05 | 11.71 | 11.33 | 0.0001 | 0.0001 | 0.0001 | 0.0001 | ||||
| Proportion Enrolled in Medicaid During Entire Year(FFS or Managed care) | 98,987 | 94.8% | 6,017 | 78.9% | 105,004 | 93.7% | 216,696 | 86.9% | 0.0001 | 0.0001 | 0.0001 | 0.0001 |
| In Medicaid Managed Care for at Least One Month | 4,840 | 4.6% | 431 | 5.6% | 5,271 | 4.7% | 22,122 | 8.9% | 0.0001 | 0.0001 | 0.0001 | 0.0001 |
| Average Months of Medicaid Managed Care(among those with managed care) | 8.55 | 7.79 | 8.48 | 8.89 | 0.0001 | 0.0001 | 0.0003 | 0.0001 | ||||
| Medicaid Basis for Eligibility | 0.0001 | 0.0001 | 0.0001 | 0.0001 | ||||||||
| Aged | 79,550 | 76.2% | 6,085 | 79.8% | 85,635 | 76.4% | 212,431 | 85.1% | ||||
| Blind/disabled | 24,816 | 23.8% | 1,533 | 20.1% | 26,349 | 23.5% | 36,636 | 14.7% | ||||
| Child | * | * | * | * | * | * | * | * | ||||
| Adult | 41 | 0.0% | * | * | 49 | 0.0% | 234 | 0.1% | ||||
| Child of Unemployed Adult | * | * | * | * | * | * | * | * | ||||
| Unemployed Adult | * | * | * | * | * | * | * | * | ||||
| Foster Care Child | * | * | * | * | * | * | * | * | ||||
| Covered under Breast and Cervical Cancer Prevention Act | * | * | * | * | * | * | * | * | ||||
| Unknown | * | * | * | * | * | * | 174 | 0.1% | ||||
| Missing | * | * | * | * | * | * | * | * | ||||
| Medicaid Maintenance of Assistance | 0.0001 | 0.0001 | 0.0001 | 0.0001 | ||||||||
| Receiving cash or eligible under section 1931 of the Act | 71,529 | 68.5% | 4,554 | 59.7% | 76,083 | 67.9% | 136,914 | 54.9% | ||||
| Medically needy | 10,584 | 10.1% | 762 | 10.0% | 11,346 | 10.1% | 36,414 | 14.6% | ||||
| Poverty related(includes children eligible under S-CHIP expansion) | 15,144 | 14.5% | 1,353 | 17.7% | 16,497 | 14.7% | 46,345 | 18.6% | ||||
| Other | 5,198 | 5.0% | 742 | 9.7% | 5,940 | 5.3% | 16,739 | 6.7% | ||||
| Foster Care Child | * | * | * | * | * | * | * | * | ||||
| 1115 Demonstration expansion eligible | 1,953 | 1.9% | 216 | 2.8% | 2,169 | 1.9% | 12,896 | 5.2% | ||||
| Unknown | * | * | * | * | * | * | 174 | 0.1% | ||||
| Missing | * | * | * | * | * | * | * | * | ||||
| Proportion with 1915c Waiver Status Code | 9,460 | 9.1% | 788 | 10.3% | 10,248 | 9.1% | 15,886 | 6.4% | 0.0001 | 0.0001 | 0.0003 | 0.0001 |
| Type of 1915c Waiver Status Code | 0.0001 | 0.0001 | 0.0001 | 0.0001 | ||||||||
| Unknown--missing eligibility | * | * | * | * | * | * | 174 | 0.1% | ||||
| Aged and disabled | 6,241 | 6.0% | 473 | 6.2% | 6,714 | 6.0% | 10,656 | 4.3% | ||||
| Aged | 2,913 | 2.8% | 292 | 3.8% | 3,205 | 2.9% | 3,660 | 1.5% | ||||
| Disabled | 11 | 0.0% | * | * | 12 | 0.0% | 19 | 0.0% | ||||
| Brain injured | * | * | * | * | * | * | 22 | 0.0% | ||||
| HIV-AIDS | 15 | 0.0% | * | * | 17 | 0.0% | 17 | 0.0% | ||||
| MR/DD | 280 | 0.3% | 20 | 0.3% | 300 | 0.3% | 1,511 | 0.6% | ||||
| Mentally ill/Severely emotionally disturbed | * | * | * | * | * | * | * | * | ||||
| Technology-dependent/ medically fragile | * | * | * | * | * | * | * | * | ||||
| Never enrolled in a 1915c waiver during the year | 94,948 | 90.9% | 6,839 | 89.6% | 101,787 | 90.8% | 233,430 | 93.6% | ||||
| Average Months of both Medicare & Medicaid Enrollment | 11.74 | 11.00 | 11.69 | 11.29 | 0.0001 | 0.0001 | 0.0001 | 0.0001 | ||||
| Proportion Enrolled in Medicaid & Medicare During Entire Year | 98,797 | 94.6% | 5,992 | 78.5% | 104,789 | 93.5% | 215,783 | 86.5% | 0.0001 | 0.0001 | 0.0001 | 0.0001 |
| Medicare & Medicaid Eligibility Status | 0.0001 | 0.0001 | 0.0001 | 0.0001 | ||||||||
| QMB only | 2,812 | 2.7% | 326 | 4.3% | 3,138 | 2.8% | 8,829 | 3.5% | ||||
| QMB plus | 81,667 | 78.2% | 5,444 | 71.4% | 87,111 | 77.7% | 163,146 | 65.4% | ||||
| SLMB only | 3,267 | 3.1% | 300 | 3.9% | 3,567 | 3.2% | 11,540 | 4.6% | ||||
| SLMB Plus | 1,194 | 1.1% | 123 | 1.6% | 1,317 | 1.2% | 3,020 | 1.2% | ||||
| Other dual | 15,403 | 14.8% | 1,414 | 18.5% | 16,817 | 15.0% | 62,374 | 25.0% | ||||
| Unknown | * | * | * | * | * | * | 174 | 0.1% | ||||
| NA | 65 | 0.1% | 20 | 0.3% | 85 | 0.1% | 407 | 0.2% | ||||
| CCW Condition | HUD-Assisted MMEs | Unassisted MMEs in the Community | Total HUD vs. None | ||
| N | % | N | % | ||
| Prevalence of Chronic Conditions | 0.0001 | ||||
| 0 Conditions | 6,031 | 5.4% | 24,404 | 9.8% | |
| 1 Condition | 6,571 | 5.9% | 20,686 | 8.3% | |
| 2 Conditions | 9,765 | 8.7% | 27,678 | 11.1% | |
| 3 Conditions | 13,398 | 12.0% | 34,387 | 13.8% | |
| 4 Conditions | 15,210 | 13.6% | 34,878 | 14.0% | |
| 5 or More Conditions | 61,070 | 54.5% | 107,457 | 43.1% | |
| Prevalence of Chronic Conditions by Category | |||||
| Cardiovascular | 62,012 | 55.3% | 120,344 | 48.3% | 0.0001 |
| Cancer | 9,162 | 8.2% | 17,269 | 6.9% | 0.0001 |
| Endocrine and Renal | 60,076 | 53.6% | 118,124 | 47.4% | 0.0001 |
| Alzheimer's-related | 16,427 | 14.7% | 39,691 | 15.9% | 0.0001 |
| Depression | 18,603 | 16.6% | 28,774 | 11.5% | 0.0001 |
| Musculoskeletal | 55,129 | 49.2% | 94,354 | 37.9% | 0.0001 |
| Pulmonary | 21,352 | 19.0% | 39,209 | 15.7% | 0.0001 |
| Opthalmic | 42,910 | 38.3% | 76,172 | 30.6% | 0.0001 |
| Other | 96,642 | 86.2% | 196,465 | 78.8% | 0.0001 |
| Medicare Services Annual Utilization per 1000 Member Months | Total HUD-Assisted Beneficiaries | Unassisted Beneficiaries in the Community | p-Value | ||||
| Mean | SD | Median | Mean | SD | Median | ||
| Total Admissions | 32.8 | 85.52 | 0 | 30.93 | 83.05 | 0 | 0.0001 |
| Acute stay admissions | 31.39 | 82.08 | 0 | 29.38 | 79.16 | 0 | 0.0001 |
| Other inpatient admissions | 1.41 | 13.98 | 0 | 1.56 | 15.2 | 0 | 0.0064 |
| Hospital Readmissions | 5.15 | 35.31 | 0 | 4.87 | 34.11 | 0 | 0.0238 |
| Medicare home health visits | 581.48 | 3158.27 | 0 | 445.46 | 2724.07 | 0 | 0.0001 |
| Medicare hospice days | 36.93 | 791.19 | 0 | 208.13 | 2258.93 | 0 | 0.0001 |
| Hospital Outpatient visits | 686.51 | 1607.06 | 250 | 590.49 | 1631.05 | 166.67 | 0.0001 |
| Total emergency room visits (total) | 58.43 | 137.9 | 0 | 51.57 | 119.05 | 0 | 0.0001 |
| Hospital outpatient ER visits | 36.55 | 108.59 | 0 | 30.61 | 86.91 | 0 | 0.0001 |
| Hospital inpatient ER visits | 21.88 | 64.57 | 0 | 20.96 | 63.54 | 0 | 0.0001 |
| Physician office visits | 1652.34 | 1811.57 | 1166.67 | 1307.9 | 1820 | 833.33 | 0.0001 |
| Ambulatory surgery center visits | 14.48 | 95.11 | 0 | 10 | 56.76 | 0 | 0.0001 |
| Dialysis events | 16.96 | 187.04 | 0 | 17.3 | 181.78 | 0 | 0.6564 |
| Anesthesia events | 27.81 | 73.6 | 0 | 23.73 | 70.9 | 0 | 0.0001 |
| Imaging events | 510.5 | 659.82 | 333.33 | 420.07 | 650.69 | 250 | 0.0001 |
| Test events | 1762.15 | 2384.11 | 916.67 | 1428.51 | 2127.43 | 666.67 | 0.0001 |
| Other procedures | 1464.61 | 3748.74 | 250 | 821.56 | 2641.4 | 83.33 | 0.0001 |
| Durable medical equipment (DME) | 369.16 | 714.71 | 0 | 301.43 | 692.36 | 0 | 0.0001 |
| Part B Drugs | 296.11 | 718.58 | 166.67 | 241.84 | 638.52 | 83.33 | 0.0001 |
| Part D* Drugs | 5080.11 | 3905.36 | 4333.33 | 4094.33 | 3514.21 | 3333.33 | 0.0001 |
| Any Use of Medicare Service During Year (% with any use) | N | % | N | % | p-Value | ||
| Total Admissions | 23895 | 21% | 50273 | 20% | 0.0001 | ||
| Acute stay admissions | 23611 | 21% | 49473 | 20% | 0.0001 | ||
| Other inpatient admissions | 1452 | 1% | 3492 | 1% | 0.0138 | ||
| Hospital Readmissions | 4061 | 4% | 8680 | 3% | 0.0327 | ||
| Medicare home health | 15321 | 14% | 28582 | 11% | 0.0001 | ||
| Medicare hospice | 623 | 1% | 3655 | 1% | 0.0001 | ||
| Hospital Outpatient | 80932 | 72% | 163161 | 65% | 0.0001 | ||
| Total emergency room | 38451 | 34% | 78362 | 31% | 0.0001 | ||
| Hospital outpatient ER | 28087 | 25% | 55191 | 22% | 0.0001 | ||
| Hospital inpatient ER | 18358 | 16% | 38993 | 16% | 0.0001 | ||
| Physician office | 105588 | 94% | 224435 | 90% | 0.0001 | ||
| Ambulatory surgery center | 7365 | 7% | 13611 | 5% | 0.0001 | ||
| Dialysis | 1515 | 1% | 3435 | 1% | 0.596 | ||
| Anesthesia | 21263 | 19% | 39849 | 16% | 0.0001 | ||
| Imaging | 87217 | 78% | 173913 | 70% | 0.0001 | ||
| Test | 93508 | 83% | 194128 | 78% | 0.0001 | ||
| Other procedures | 76573 | 68% | 146429 | 59% | 0.0001 | ||
| Durable medical equipment (DME) | 51253 | 46% | 91265 | 37% | 0.0001 | ||
| Part B Drugs | 65880 | 59% | 135611 | 54% | 0.0001 | ||
| Part D* Drugs | 104910 | 94% | 218252 | 87% | 0.0001 | ||
| Total HUD-Assisted Beneficiaries | Unassisted Beneficiaries in the Community | p-Value | |||||
| N | % | N | % | ||||
| * Limited to those who have Part D coverage for entire year or up until death. | |||||||
| Limited to those with no Medicaid managed care | 106,764 | 95% | 227,186 | 91% | |||
| Medicaid Service Utilization per 1000 Member Months | Mean | SD | Median | Mean | SD | Median | p-Value |
| Personal Care services | 4512.37 | 10047.12 | 0 | 2149.11 | 7128.17 | 0 | 0.0001 |
| Residential care | 38.99 | 682.95 | 0 | 63.68 | 1164.33 | 0 | 0.0001 |
| DME | 380.04 | 946.18 | 83.33 | 227.71 | 746.9 | 0 | 0.0001 |
| Other HCBS services (*private duty nursing, adult day care, home health, rehab, targeted case management, transportation, and hospice) | 3309.83 | 8321.71 | 0 | 1840.56 | 6675.4 | 0 | 0.0001 |
| Any Use of Medicaid Services During Year(% with any use) | N | % | N | % | p-Value | ||
| Personal Care services | 30,186 | 28% | 32,885 | 14% | 0.0001 | ||
| Residential care | 1,931 | 2% | 2,696 | 1% | 0.0001 | ||
| DME | 53,927 | 51% | 79,598 | 35% | 0.0001 | ||
| Other HCBS services | 43,929 | 41% | 57,815 | 25% | 0.0001 | ||
| Medicare Payment PMPM($) | Total HUD-Assisted Beneficiaries | Unassisted Beneficiaries in the Community | p-Value | ||||
| Mean | SD | Median | Mean | SD | Median | ||
| Total Admissions PMPM | $361 | $1,326 | $0 | $349 | $1,355 | $0 | 0.0124 |
| Acute stay admission PMPM | $336 | $1,252 | $0 | $320 | $1,237 | $0 | 0.0002 |
| Other inpatient admission PMPM | $25 | $282 | $0 | $29 | $385 | $0 | 0.0005 |
| Medicare home health PMPM (Medicare only) | $66 | $267 | $0 | $54 | $238 | $0 | 0.0001 |
| Medicare hospice PMPM (Medicare only) | $7 | $139 | $0 | $33 | $353 | $0 | 0.0001 |
| Hospital Outpatient PMPM | $121 | $397 | $29 | $105 | $370 | $16 | 0.0001 |
| Physician office PMPM | $107 | $134 | $71 | $85 | $137 | $49 | 0.0001 |
| Ambulatory surgery center PMPM | $5 | $28 | $0 | $4 | $22 | $0 | 0.0001 |
| Dialysis PMPM | $3 | $26 | $0 | $3 | $26 | $0 | 0.9825 |
| Anesthesia PMPM | $4 | $11 | $0 | $3 | $10 | $0 | 0.0001 |
| Imaging PMPM | $37 | $61 | $12 | $27 | $50 | $7 | 0.0001 |
| Test PMPM | $39 | $66 | $15 | $27 | $49 | $10 | 0.0001 |
| Other procedures PMPM | $79 | $172 | $18 | $51 | $141 | $7 | 0.0001 |
| Durable medical equipment (DME) PMPM | $28 | $77 | $0 | $22 | $77 | $0 | 0.0001 |
| Part B Drugs PMPM | $22 | $235 | $2 | $19 | $183 | $1 | 0.0001 |
| Part D* Drugs PMPM | $349 | $437 | $238 | $282 | $398 | $177 | 0.0001 |
| Total Medical and Rx PMPM (sum of all above) | $1,222 | $1,924 | $648 | $1,054 | $1,935 | $463 | 0.0001 |
| Total Medical PMPM (sum of all above except part D PMPM) | $856 | $1,749 | $304 | $764 | $1,795 | $196 | 0.0001 |
| Total HUD-Assisted Beneficiaries | Unassisted Beneficiaries in the Community | p-Value | |||||
| N | % | N | % | ||||
| * Limited to those who have Part D coverage for entire year or up until death. | |||||||
| Limited to those with no Medicaid managed care | 106,764 | 95% | 227,186 | 91% | |||
| Medicaid Payment PMPM--Divide by Total Medicaid Months | Mean | SD | Median | Mean | SD | Median | p-Value |
| Total Medicaid payment amount | $1,180 | $1,938 | $227 | $895 | $2,017 | $70 | 0.0001 |
| Fee-for-service Medicaid payment amount | $1,035 | $1,884 | $169 | $771 | $1,961 | $54 | 0.0001 |
| Personal Care services | $533 | $1,336 | $0 | $305 | $1,099 | 0 | 0.0001 |
| Residential care | $23 | $246 | $0 | $40 | $506 | 0 | 0.0001 |
| DME | $19 | $77 | $0 | $14 | $70 | 0 | 0.0001 |
| Other HCBS services (*private duty nursing, adult day care, home health, rehab, targeted case management, transportation, and hospice) | $295 | $1,122 | $0 | $195 | $976 | 0 | 0.0001 |
Sub-group B: Medicare-Medicaid Enrollees (MMEs), with >0 and 365 Days of SNF or NF Use in 2008
| HUD-AssistedBeneficiaries(full year)(N=12,684) | HUD-AssistedBeneficiaries(partial year)(N=3,875) | Unassisted Beneficiariesin the Community(N=86,626) | Assisted FullYear vs. Unassistedp-Value | Assisted PartialYear vs. Unassistedp-Value | Assisted Full Year vs.Assisted Partial Yearp-Value | ||||
| N | % | N | % | N | % | ||||
| * Cell sizes of less than 11 are not displayed. | |||||||||
| Demographic Characteristics (available in Medicare data) | |||||||||
| Gender | 0.0001 | 0.0001 | 0.3205 | ||||||
| Male | 3,497 | 27.6% | 1,100 | 28.4% | 28,275 | 32.7% | |||
| Female | 9,187 | 72.4% | 2,775 | 71.6% | 58,351 | 67.4% | |||
| Race (based on RTI variable) | 0.0001 | 0.0001 | 0.0001 | ||||||
| Non-Hispanic White | 7,112 | 56.1% | 2,424 | 62.6% | 59,031 | 68.2% | |||
| Hispanic | 1,663 | 13.1% | 385 | 9.9% | 7,056 | 8.1% | |||
| Black | 2,942 | 23.2% | 895 | 23.1% | 15,804 | 18.3% | |||
| Asian/Pacific Islander | 622 | 4.9% | 117 | 3.0% | 3,499 | 4.0% | |||
| American Indian/Alaska Native | 13 | 0.1% | * | * | 94 | 0.1% | |||
| Other | 270 | 2.1% | 44 | 1.1% | 912 | 1.1% | |||
| Unknown | 62 | 0.5% | * | * | 230 | 0.3% | |||
| Age Group | 0.0001 | 0.0009 | 0.0001 | ||||||
| Under 18 years | * | * | * | * | * | * | |||
| 18 to 44 | 242 | 1.9% | 78 | 2.0% | 1,639 | 1.9% | |||
| 45 to 64 | 1,692 | 13.3% | 474 | 12.2% | 10,468 | 12.1% | |||
| 65 to 74 | 2,966 | 23.4% | 727 | 18.8% | 14,217 | 16.4% | |||
| 75 to 79 | 2,339 | 18.4% | 551 | 14.2% | 10,678 | 12.3% | |||
| 80 to 84 | 2,577 | 20.3% | 686 | 17.7% | 15,170 | 17.5% | |||
| 85+ | 2,868 | 22.6% | 1,359 | 35.1% | 34,454 | 39.8% | |||
| Geographic Area | 0.0001 | 0.0001 | 0.0001 | ||||||
| Vermont | 255 | 2.0% | 130 | 3.4% | 2,201 | 2.5% | |||
| New Haven- Milford | 333 | 2.6% | 189 | 4.9% | 3,143 | 3.6% | |||
| Bridgeport- Stamford- Norwalk | 254 | 2.0% | 121 | 3.1% | 2,018 | 2.3% | |||
| Milwaukee- Waukesha- West Allis | 347 | 2.7% | 168 | 4.3% | 2,966 | 3.4% | |||
| San Francisco- Oakland- Fremont | 852 | 6.7% | 201 | 5.2% | 6,149 | 7.1% | |||
| Boston- Cambridge- Quincy | 1,796 | 14.2% | 626 | 16.2% | 9,285 | 10.7% | |||
| Durham- Chapel Hill | 53 | 0.4% | 33 | 0.9% | 851 | 1.0% | |||
| Richmond | 18 | 0.1% | 27 | 0.7% | 1,012 | 1.2% | |||
| New York- Northern New Jersey- Long Island | 7,675 | 60.5% | 1,736 | 44.8% | 46,008 | 53.1% | |||
| Columbus | 329 | 2.6% | 188 | 4.9% | 3,143 | 3.6% | |||
| Akron | 197 | 1.6% | 132 | 3.4% | 1,597 | 1.8% | |||
| Cleveland | 575 | 4.5% | 324 | 8.4% | 6,420 | 7.4% | |||
| Missing | * | * | * | * | 1,833 | 2.1% | |||
| Died During the Year | 742 | 5.8% | 1,042 | 26.9% | 15,533 | 17.9% | 0.0001 | 0.0001 | 0.0001 |
| Medicare Coverage Characteristics | |||||||||
| Original Reason for Entitlement | 0.0001 | 0.0020 | 0.1071 | ||||||
| Old age and survivor's insurance | 8,578 | 67.6% | 2,674 | 69.0% | 61,436 | 71.0% | |||
| Disability insurance benefits | 3,920 | 30.9% | 1,139 | 29.4% | 24,157 | 27.9% | |||
| ESRD | 67 | 0.5% | 15 | 0.4% | 386 | 0.4% | |||
| Disability Insurance and ESRD | 119 | 0.9% | 47 | 1.2% | 647 | 0.7% | |||
| Current Reason for Entitlement | 0.0001 | 0.0036 | 0.0017 | ||||||
| Old age and survivor's insurance | 10,602 | 83.6% | 3,303 | 85.2% | 73,757 | 85.2% | |||
| Disability insurance benefits | 1,898 | 15.0% | 508 | 13.1% | 11,819 | 13.6% | |||
| ESRD | 97 | 0.8% | 22 | 0.6% | 531 | 0.6% | |||
| Disability Insurance and ESRD | 87 | 0.7% | 42 | 1.1% | 519 | 0.6% | |||
| Medicare Part D Coverage at Any Point During the Year | 12,548 | 98.9% | 3,826 | 98.7% | 84,930 | 98.1% | 0.0001 | 0.0031 | 0.2573 |
| Average Months of Part D Coverage (among those with Part D cov) | 11.73 | 10.69 | 11.00 | 0.0001 | 0.0001 | 0.0001 | |||
| Proportion with Part D Coverage by Cost Share Group Code | 0.0001 | 0.0001 | 0.0001 | ||||||
| Beneficiary deemed with 100% premium-subsidy and no copayment | 2,649 | 21.1% | 1,633 | 42.7% | 55,822 | 65.7% | |||
| Beneficiary deemed with 100% premium-subsidy and low copayment | 8,489 | 67.7% | 1,537 | 40.2% | 19,611 | 23.1% | |||
| Beneficiary deemed with 100% premium-subsidy and high copayment | 1,087 | 8.7% | 296 | 7.7% | 4,097 | 4.8% | |||
| Beneficiary with Low Income Subsidy (LIS), 100% premium-subsidy | 68 | 0.5% | 51 | 1.3% | 499 | 0.6% | |||
| Beneficiary with Low Income Subsidy (LIS), 100% premium-subsidy and 15% copayment | * | * | * | * | 64 | 0.1% | |||
| Beneficiary with LIS, 75% premium-subsidy and 15% copayment | * | * | * | * | 77 | 0.1% | |||
| Beneficiary with LIS, 50% premium-subsidy and 15% copayment | 16 | 0.1% | 11 | 0.3% | 54 | 0.1% | |||
| Beneficiary with LIS, 25% premium-subsidy and 15% copayment | * | * | * | * | 53 | 0.1% | |||
| No premium subsidy nor cost sharing | 15 | 0.1% | * | * | 142 | 0.2% | |||
| Missing | 201 | 1.6% | 268 | 7.0% | 4,511 | 5.3% | |||
| Medicaid Coverage Status | |||||||||
| Average Months of Medicaid Coverage(FFS or managed care) | 11.40 | 9.97 | 10.41 | 0.0001 | 0.0001 | 0.0001 | |||
| Proportion Enrolled in Medicaid During Entire Year(FFS or managed care) | 11,021 | 86.9% | 2,117 | 54.6% | 57,813 | 66.7% | 0.0001 | 0.0001 | 0.0001 |
| In Medicaid Managed Care for at Least One Month | 1,059 | 8.3% | 769 | 19.8% | 21,956 | 25.3% | 0.0001 | 0.0001 | 0.0001 |
| Average Months of Medicaid Managed Care (among those with managed care) | 7.87 | 6.74 | 8.29 | 0.0009 | 0.0001 | 0.0001 | |||
| Medicaid Basis for Eligibility | 0.0001 | 0.4871 | 0.0001 | ||||||
| Aged | 9,044 | 71.3% | 3,108 | 80.2% | 70,623 | 81.5% | |||
| Blind/disabled | 3,617 | 28.5% | 760 | 19.6% | 15,871 | 18.3% | |||
| Child | * | * | * | * | * | * | |||
| Adult | 17 | 0.1% | * | * | 91 | 0.1% | |||
| Child of Unemployed Adult | * | * | * | * | * | * | |||
| Unemployed Adult | * | * | * | * | * | * | |||
| Foster Care Child | * | * | * | * | * | * | |||
| Covered under Breast and Cervical Cancer Prevention Act | * | * | * | * | * | * | |||
| Unknown | * | * | * | * | 35 | 0.0% | |||
| Missing | * | * | * | * | * | * | |||
| Medicaid Maintenance of Assistance | 0.0001 | 0.0001 | 0.0001 | ||||||
| Receiving cash or eligible under section 1931 of the Act | 6,487 | 51.1% | 986 | 25.4% | 13,625 | 15.7% | |||
| Medically needy | 2,471 | 19.5% | 764 | 19.7% | 32,908 | 38.0% | |||
| Poverty related(includes children eligible under S-CHIP expansion) | 1,662 | 13.1% | 530 | 13.7% | 7,821 | 9.0% | |||
| Other | 1,889 | 14.9% | 1,548 | 39.9% | 30,950 | 35.7% | |||
| Foster Care Child | * | * | * | * | * | * | |||
| 1115 demonstration expansion eligible | 170 | 1.3% | 44 | 1.1% | 1,283 | 1.5% | |||
| Unknown | * | * | * | * | 35 | 0.0% | |||
| Missing | * | * | * | * | * | * | |||
| Proportion with 1915c waiver status code | 2,329 | 18.4% | 704 | 18.2% | 7,036 | 8.1% | 0.0001 | 0.0001 | 0.7865 |
| Type of 1915c Waiver Status Code | 0.0001 | 0.0001 | 0.0441 | ||||||
| Unknown--missing eligibility | * | * | * | * | 35 | 0.0% | |||
| Aged and disabled | 1,383 | 10.9% | 431 | 11.1% | 4,321 | 5.0% | |||
| Aged | 756 | 6.0% | 227 | 5.9% | 1,678 | 1.9% | |||
| Disabled | 52 | 0.4% | 25 | 0.6% | 146 | 0.2% | |||
| Brain injured | * | * | * | * | 75 | 0.1% | |||
| HIV-AIDS | 11 | 0.1% | * | * | 32 | 0.0% | |||
| MR/DD | 122 | 1.0% | 18 | 0.5% | 784 | 0.9% | |||
| Mentally ill/Severely emotionally disturbed | * | * | * | * | * | * | |||
| Technology-dependent/ medically fragile | * | * | * | * | * | * | |||
| Never enrolled in a 1915c waiver during the year | 10,352 | 81.6% | 3,168 | 81.8% | 79,555 | 91.8% | |||
| Average Months of Both Medicare & Medicaid Enrollment | 11.36 | 0.1% | 9.89 | 0.3% | 10.24 | 0.0% | 0.0001 | 0.0001 | 0.0001 |
| Proportion Enrolled in Medicaid & Medicare During Entire Year | 10,965 | 86.4% | 2,097 | 54.1% | 56,863 | 65.6% | 0.0001 | 0.0001 | 0.0001 |
| Medicare & Medicaid Eligibility Status | 0.0001 | 0.0001 | 0.0001 | ||||||
| QMB only | 231 | 1.8% | 66 | 1.7% | 894 | 1.0% | |||
| QMB plus | 8,954 | 70.6% | 2,256 | 58.2% | 36,675 | 42.3% | |||
| SLMB only | 281 | 2.2% | 67 | 1.7% | 909 | 1.0% | |||
| SLMB Plus | 389 | 3.1% | 187 | 4.8% | 2,902 | 3.4% | |||
| Other dual | 2,811 | 22.2% | 1,281 | 33.1% | 44,418 | 51.3% | |||
| Unknown | * | * | * | * | 35 | 0.0% | |||
| NA | 15 | 0.1% | 15 | 0.4% | 793 | 0.9% | |||
| Average SNF days | 30.51 | 44.57 | 30.86 | 0.2681 | 0.0001 | 0.0001 | |||
| Average NF days | 57.4 | 93.11 | 151.91 | 0.0001 | 0.0001 | 0.0001 | |||
| Average SNF stays | 1.13 | 1.43 | 1 | 0.0001 | 0.0001 | 0.0001 | |||
| CCW Condition | HUD-AssistedBeneficiaries(full year) | HUD-AssistedBeneficiaries(partial year) | Unassisted Beneficiariesin the Community | Assisted FullYear vs. Unassistedp-Value | Assisted PartialYear vs. Unassistedp-Value | Assisted Full Year vs.Assisted Partial Yearp-Value | |||
| N | % | N | % | N | % | ||||
| Prevalence of Chronic Conditions | 0.0001 | 0.0001 | 0.4779 | ||||||
| 0 Conditions | 54 | 0.4% | 16 | 0.4% | 472 | 0.5% | |||
| 1 Condition | 98 | 0.8% | 27 | 0.7% | 1166 | 1.3% | |||
| 2 Conditions | 199 | 1.6% | 75 | 1.9% | 2347 | 2.7% | |||
| 3 Conditions | 436 | 3.4% | 126 | 3.3% | 4406 | 5.1% | |||
| 4 Conditions | 702 | 5.5% | 193 | 5.0% | 6778 | 7.8% | |||
| 5 or More Conditions | 11195 | 88.3% | 3438 | 88.7% | 71457 | 82.5% | |||
| Prevalence of Chronic Conditions by Category | |||||||||
| Cardiovascular | 10358 | 81.7% | 3215 | 83.0% | 69218 | 79.9% | 0.0001 | 0.0001 | 0.0596 |
| Cancer | 1545 | 12.2% | 548 | 14.1% | 8676 | 10.0% | 0.0001 | 0.0001 | 0.0009 |
| Endocrine and Renal | 9461 | 74.6% | 2880 | 74.3% | 59832 | 69.1% | 0.0001 | 0.0001 | 0.7701 |
| Alzheimer's-related | 5083 | 40.1% | 2237 | 57.7% | 58785 | 67.9% | 0.0001 | 0.0001 | 0.0001 |
| Depression | 5268 | 41.5% | 1865 | 48.1% | 36989 | 42.7% | 0.0095 | 0.0001 | 0.0001 |
| Musculoskeletal | 8624 | 68.0% | 2309 | 59.6% | 43691 | 50.4% | 0.0001 | 0.0001 | 0.0001 |
| Pulmonary | 4795 | 37.8% | 1548 | 39.9% | 27964 | 32.3% | 0.0001 | 0.0001 | 0.0171 |
| Opthalmic | 4747 | 37.4% | 1192 | 30.8% | 29989 | 34.6% | 0.0001 | 0.0001 | 0.0001 |
| Other | 12303 | 97.0% | 3733 | 96.3% | 80442 | 92.9% | 0.0001 | 0.0001 | 0.0413 |
| Medicare Services Annual Utilization per 1000 Member Months | HUD-AssistedBeneficiaries(full year) | HUD-AssistedBeneficiaries(partial year) | Unassisted Beneficiariesin the Community | Assisted FullYear vs. Unassistedp-Value | Assisted PartialYear vs. Unassistedp-Value | Assisted Full Year vs.Assisted Partial Yearp-Value | ||||||
| Mean | SD | Median | Mean | SD | Median | Mean | SD | Median | ||||
| Total Admissions | 191.12 | 201.61 | 166.67 | 234.26 | 218.67 | 166.67 | 161.64 | 188.73 | 83.33 | 0.0001 | 0.0001 | 0.0001 |
| Acute stay admissions | 178.02 | 190.67 | 83.33 | 216.72 | 205.65 | 166.67 | 148.95 | 176.76 | 83.33 | 0.0001 | 0.0001 | 0.0001 |
| Other inpatient admissions | 13.1 | 44.52 | 0 | 17.54 | 57.79 | 0 | 12.69 | 48.42 | 0 | 0.377 | 0.0001 | 0.0001 |
| Hospital Readmissions | 53.59 | 122.6 | 0 | 70.69 | 136.01 | 0 | 41.71 | 106.56 | 0 | 0.0001 | 0.0001 | 0.0001 |
| Medicare Skilled Nursing Facility (SNF) days | 2583.19 | 2786.26 | 1666.67 | 4058.46 | 3515.16 | 3333.33 | 2717.57 | 3257.26 | 1416.67 | 0.0001 | 0.0001 | 0.0001 |
| Medicare Skilled Nursing Facility (SNF) stays | 96.09 | 100.01 | 83.33 | 135.27 | 123.37 | 83.33 | 90.03 | 109.67 | 83.33 | 0.0001 | 0.0001 | 0.0001 |
| Medicare home health visits | 2207.5 | 4764.78 | 333.33 | 1454.13 | 3515.17 | 0 | 783.79 | 2785.92 | 0 | 0.0001 | 0.0001 | 0.0001 |
| Medicare hospice days | 98.85 | 1086.97 | 0 | 601.59 | 2778.44 | 0 | 782.59 | 3498.68 | 0 | 0.0001 | 0.0015 | 0.0001 |
| Hospital Outpatient visits | 1504.46 | 2828.44 | 500 | 2041.02 | 3253.52 | 833.33 | 1850.87 | 3162.88 | 666.67 | 0.0001 | 0.0004 | 0.0001 |
| Total emergency room visits (total) | 218.65 | 277.36 | 166.67 | 280.44 | 293.73 | 222.22 | 193.29 | 257.65 | 125 | 0.0001 | 0.0001 | 0.0001 |
| Hospital outpatient ER visits | 84.17 | 179.39 | 0 | 98.72 | 198.81 | 0 | 70.25 | 168.65 | 0 | 0.0001 | 0.0001 | 0.0001 |
| Hospital inpatient ER visits | 134.48 | 163.96 | 83.33 | 181.72 | 184.48 | 166.67 | 123.04 | 156.49 | 83.33 | 0.0001 | 0.0001 | 0.0001 |
| Physician office visits | 4970.81 | 4732.24 | 3666.67 | 6036.06 | 5729.76 | 4272.73 | 4733.54 | 4860.06 | 3250 | 0.0001 | 0.0001 | 0.0001 |
| Ambulatory surgery center visits | 12.74 | 84.06 | 0 | 7.13 | 48.46 | 0 | 5.14 | 50.23 | 0 | 0.0001 | 0.0146 | 0.0001 |
| Dialysis events | 108.07 | 585.11 | 0 | 124.47 | 650.27 | 0 | 81.31 | 501.78 | 0 | 0.0001 | 0.0001 | 0.1394 |
| Anesthesia events | 85.7 | 151.78 | 0 | 77.65 | 152.39 | 0 | 59.68 | 144.39 | 0 | 0.0001 | 0.0001 | 0.0035 |
| Imaging events | 1514.96 | 1404.6 | 1166.67 | 1713.88 | 1738.65 | 1250 | 1193.14 | 1373.51 | 833.33 | 0.0001 | 0.0001 | 0.0001 |
| Test events | 2866.48 | 3091.72 | 1833.33 | 2689.74 | 2991.27 | 1714.29 | 2540.6 | 3115.87 | 1500 | 0.0001 | 0.0035 | 0.0015 |
| Other procedures | 1975.76 | 4114.62 | 583.33 | 976.46 | 2317.45 | 428.57 | 785.82 | 1852.82 | 416.67 | 0.0001 | 0.0001 | 0.0001 |
| Durable medical equipment (DME) | 774.5 | 1063.86 | 333.33 | 579.32 | 952.52 | 166.67 | 411.25 | 850.04 | 0 | 0.0001 | 0.0001 | 0.0001 |
| Part B Drugs | 458.82 | 887.35 | 250 | 385.49 | 624.7 | 166.67 | 345.64 | 606.23 | 166.67 | 0.0001 | 0.0001 | 0.0001 |
| Part D* Drugs | 6574.83 | 4191.01 | 5916.67 | 6372.83 | 4271.12 | 5750 | 6563.33 | 4229.44 | 5916.67 | 0.8978 | 0.0109 | 0.0148 |
| Any Use of Medicare Service During Year(% with any use) | Mean | SD | Median | Mean | SD | Median | Mean | SD | Median | |||
| Total Admissions | 10,175 | 80% | 3,347 | 86% | 62,183 | 72% | 0.0001 | 0.0001 | 0.0001 | |||
| Acute stay admissions | 10,046 | 79% | 3,277 | 85% | 60,446 | 70% | 0.0001 | 0.0001 | 0.0001 | |||
| Other inpatient admissions | 1,409 | 11% | 497 | 13% | 8,352 | 10% | 0.0001 | 0.0001 | 0.0023 | |||
| Hospital Readmissions | 3,813 | 30% | 1,387 | 36% | 20,376 | 24% | 0.0001 | 0.0001 | 0.0001 | |||
| Medicare home health | 6,726 | 53% | 1,609 | 42% | 19,921 | 23% | 0.0001 | 0.0001 | 0.0001 | |||
| Medicare hospice | 280 | 2% | 451 | 12% | 8,900 | 10% | 0.0001 | 0.0066 | 0.0001 | |||
| Hospital Outpatient | 10,752 | 85% | 3,487 | 90% | 75,508 | 87% | 0.0001 | 0.0001 | 0.0001 | |||
| Total emergency room | 9,746 | 77% | 3,383 | 87% | 63,474 | 73% | 0.0001 | 0.0001 | 0.0001 | |||
| Hospital outpatient ER | 5,610 | 44% | 1,928 | 50% | 33,592 | 39% | 0.0001 | 0.0001 | 0.0001 | |||
| Hospital inpatient ER | 8,608 | 68% | 3,063 | 79% | 55,298 | 64% | 0.0001 | 0.0001 | 0.0001 | |||
| Physician office | 12,629 | 100% | 3,870 | 100% | 85,818 | 99% | 0.0001 | 0.0001 | 0.005 | |||
| Ambulatory surgery center | 706 | 6% | 141 | 4% | 2,280 | 3% | 0.0001 | 0.0001 | 0.0001 | |||
| Dialysis | 706 | 6% | 249 | 6% | 3,692 | 4% | 0.0001 | 0.0001 | 0.0453 | |||
| Anesthesia | 5,833 | 46% | 1,442 | 37% | 26,230 | 30% | 0.0001 | 0.0001 | 0.0001 | |||
| Imaging | 12,250 | 97% | 3,730 | 96% | 77,494 | 89% | 0.0001 | 0.0001 | 0.324 | |||
| Test | 12,263 | 97% | 3,738 | 96% | 78,812 | 91% | 0.0001 | 0.0001 | 0.4747 | |||
| Other procedures | 11,545 | 91% | 3,493 | 90% | 76,419 | 88% | 0.0001 | 0.0002 | 0.1301 | |||
| Durable medical equipment (DME) | 9,084 | 72% | 2,191 | 57% | 37,616 | 43% | 0.0001 | 0.0001 | 0.0001 | |||
| Part B Drugs | 9,469 | 75% | 2,804 | 72% | 60,094 | 69% | 0.0001 | 0.0001 | 0.004 | |||
| Part D* Drugs | 12,020 | 96% | 3,428 | 90% | 76,211 | 90% | 0.0001 | 0.5049 | 0.0014 | |||
| HUD-AssistedBeneficiaries(full year) | HUD-AssistedBeneficiaries(partial year) | Unassisted Beneficiariesin the Community | Assisted FullYear vs. Unassistedp-Value | Assisted PartialYear vs. Unassistedp-Value | Assisted Full Year vs.Assisted Partial Yearp-Value | |||||||
| N | % | N | % | N | % | |||||||
| * Limited to those who have Part D coverage for entire year or up until death. | ||||||||||||
| Limited to those with no Medicaid managed care | 11,620 | 92% | 3,103 | 80% | 64,631 | 75% | ||||||
| Medicaid Service Utilization per 1000 Member Months | Mean | SD | Median | Mean | SD | Median | Mean | SD | Median | |||
| Personal Care services | 5222.88 | 9443.57 | 0 | 2190.98 | 6237.28 | 0 | 1078.9 | 4657.87 | 0 | 0.0001 | 0.0001 | 0.0001 |
| Residential care | 75.61 | 1047.98 | 0 | 225.5 | 1784.33 | 0 | 203.33 | 1765.91 | 0 | 0.0001 | 0.3818 | 0.0001 |
| DME | 685.34 | 1306.46 | 250 | 518.96 | 1289.6 | 83.33 | 327.78 | 887.81 | 0 | 0.0001 | 0.0001 | 0.0001 |
| Other HCBS services (*private duty nursing, adult day care, home health, rehab, targeted case management, transportation, and hospice) | 6705.76 | 10444.02 | 1916.67 | 4139.23 | 8454.95 | 888.89 | 3019.3 | 7735.14 | 416.67 | 0.0001 | 0.0001 | 0.0001 |
| Nursing facility days per member month | 5094.47 | 8601.37 | 0 | 8624.17 | 10301.08 | 2916.67 | 13860.57 | 12766.88 | 14500 | 0.0001 | 0.0001 | 0.0001 |
| Other long-term days (excluding NF) | 10.51 | 447.33 | 0 | 45.3 | 1221.11 | 0 | 90.85 | 1653.29 | 0 | 0.0001 | 0.1164 | 0.0249 |
| Any Use of Medicaid Service During Year (% with any use) | N | % | N | % | N | % | ||||||
| Personal Care services | 4,444 | 38% | 715 | 23% | 6,445 | 10% | 0.0001 | 0.0001 | 0.0001 | |||
| Residential care | 313 | 3% | 144 | 5% | 2,344 | 4% | 0.0001 | 0.0008 | 0.0001 | |||
| DME | 7,814 | 67% | 1,649 | 53% | 26,897 | 42% | 0.0001 | 0.0001 | 0.0001 | |||
| Other HCBS services | 9,489 | 82% | 2,425 | 78% | 44,924 | 70% | 0.0001 | 0.0001 | 0.0001 | |||
| Medicare Payment PMPM($) | HUD-AssistedBeneficiaries(full year) | HUD-AssistedBeneficiaries(partial year) | Unassisted Beneficiariesin the Community | Assisted FullYear vs. Unassistedp-Value | Assisted PartialYear vs. Unassistedp-Value | Assisted Full Year vs.Assisted Partial Yearp-Value | ||||||
| Mean | SD | Median | Mean | SD | Median | Mean | SD | Median | ||||
| Total Admissions PMPM | $2,527 | $3,652 | $1,331 | $2,916 | $4,361 | $1,483 | $2,027 | $3,584 | $858 | 0.0001 | 0.0001 | 0.0001 |
| Acute stay admission PMPM | $2,256 | $3,351 | $1,211 | $2,601 | $4,095 | $1,310 | $1,800 | $3,278 | $762 | 0.0001 | 0.0001 | 0.0001 |
| Other inpatient admission PMPM | $271 | $1,037 | $0 | $316 | $1,137 | $0 | $228 | $1,034 | $0 | 0.0001 | 0.0001 | 0.0176 |
| Medicare Skilled Nursing Facility (SNF) PMPM | $1,059 | $1,104 | $779 | $1,497 | $1,336 | $1,260 | $991 | $1,197 | $587 | 0.0001 | 0.0001 | 0.0001 |
| Medicare home health PMPM (Medicare only) | $273 | $423 | $51 | $192 | $349 | $0 | $110 | $294 | $0 | 0.0001 | 0.0001 | 0.0001 |
| Medicare hospice PMPM (Medicare only) | $19 | $193 | $0 | $111 | $482 | $0 | $128 | $555 | $0 | 0.0001 | 0.0684 | 0.0001 |
| Hospital Outpatient PMPM | $268 | $619 | $75 | $297 | $610 | $107 | $236 | $545 | $72 | 0.0001 | 0.0001 | 0.0116 |
| Physician office PMPM | $362 | $383 | $254 | $440 | $472 | $289 | $329 | $390 | $213 | 0.0001 | 0.0001 | 0.0001 |
| Ambulatory surgery center PMPM | $5 | $29 | $0 | $3 | $20 | $0 | $2 | $17 | $0 | 0.0001 | 0.0002 | 0.0006 |
| Dialysis PMPM | $13 | $60 | $0 | $13 | $58 | $0 | $9 | $51 | $0 | 0.0001 | 0.0001 | 0.8861 |
| Anesthesia PMPM | $15 | $24 | $0 | $12 | $25 | $0 | $9 | $21 | $0 | 0.0001 | 0.0001 | 0.0001 |
| Imaging PMPM | $62 | $73 | $39 | $47 | $55 | $30 | $33 | $46 | $18 | 0.0001 | 0.0001 | 0.0001 |
| Test PMPM | $57 | $78 | $29 | $41 | $56 | $23 | $34 | $48 | $19 | 0.0001 | 0.0001 | 0.0001 |
| Other procedures PMPM | $145 | $214 | $76 | $96 | $173 | $33 | $72 | $150 | $21 | 0.0001 | 0.0001 | 0.0001 |
| Durable medical equipment (DME) PMPM | $71 | $154 | $18 | $58 | $160 | $7 | $38 | $128 | $0 | 0.0001 | 0.0001 | 0.0001 |
| Part B Drugs PMPM | $34 | $252 | $4 | $23 | $110 | $5 | $21 | $123 | $5 | 0.0001 | 0.3558 | 0.0096 |
| Part D* Drugs PMPM | $485 | $607 | $339 | $414 | $468 | $300 | $435 | $466 | $320 | 0.0001 | 0.0108 | 0.0001 |
| Total Medical & Rx PMPM (sum of all above) | $5,378 | $4,906 | $4,008 | $6,134 | $5,599 | $4,653 | $4,444 | $4,806 | $3,143 | 0.0001 | 0.0001 | 0.0001 |
| Total Medical PMPM(sum of all above except Part D PMPM) | $4,873 | $4,827 | $3,530 | $5,724 | $5,572 | $4,244 | $4,019 | $4,768 | $2,721 | 0.0001 | 0.0001 | 0.0001 |
| HUD-AssistedBeneficiaries(full year) | HUD-AssistedBeneficiaries(partial year) | Unassisted Beneficiariesin the Community | Assisted FullYear vs. Unassistedp-Value | Assisted PartialYear vs. Unassistedp-Value | Assisted Full Year vs.Assisted Partial Yearp-Value | |||||||
| N | % | N | % | N | % | |||||||
| * Limited to those who have Part D coverage for entire year or up until death. | ||||||||||||
| Limited to those with no Medicaid managed care | 11,620 | 92% | 3,103 | 80% | 64,631 | 75% | ||||||
| Medicaid Payment PMPM--Divide by Total Medicaid Months | Mean | SD | Median | Mean | SD | Median | Mean | SD | Median | |||
| Total Medicaid payment amount | 2789.89 | 2763.94 | 2174.46 | 3053.57 | 2428.68 | 2733.7 | 4202.64 | 3244.14 | 4129.33 | 0.0001 | 0.0001 | 0.0001 |
| Fee-for-service Medicaid payment amount | 2653.55 | 2783.66 | 1914.63 | 2947.46 | 2466.85 | 2595.14 | 4137.06 | 3278.99 | 4081.42 | 0.0001 | 0.0001 | 0.0001 |
| Personal care services | 575.75 | 1174.36 | 0 | 218.14 | 651.21 | 0 | 138.39 | 645.69 | 0 | 0.0001 | 0.0001 | 0.0001 |
| Residential care | 36.19 | 359.06 | 0 | 52.2 | 364.89 | 0 | 74.07 | 616.5 | 0 | 0.0001 | 0.0597 | 0.0094 |
| DME | 42.68 | 132.08 | 5.25 | 39.67 | 139.2 | 1.75 | 29.53 | 114.8 | 0 | 0.0001 | 0.0001 | 0.0028 |
| Other HCBS services (*private duty nursing, adult day care, home health, rehab, targeted case management, transportation, and hospice) | 602.78 | 1490.43 | 89.08 | 299.18 | 906.21 | 34 | 256.62 | 896.23 | 18.5 | 0.0001 | 0.0001 | 0.0001 |
| Nursing facility | 989.46 | 1772.4 | 192 | 1954.43 | 2269.35 | 1096.91 | 3305.68 | 3089.31 | 3156.83 | 0.0001 | 0.0001 | 0.0001 |
| Other long-term days | 0.01 | 0.26 | 0 | 0 | 0 | 0 | 0.01 | 0.48 | 0 | 0.0001 | 0.1164 | 0.0249 |
Sample C: Medicare Beneficiaries with No Medicaid Enrollment, Regardless of SNF Use in 2008
| HUD-AssistedBeneficiaries(full year)(N=45,566) | HUD-AssistedBeneficiaries(partial year)(N=5,406) | Total HUD-Assisted Beneficiaries(N=50,972) | Unassisted Beneficiariesin the Community(N=2,453,763) | Assisted FullYear vs. Unassistedp-Value | Assisted PartialYear vs. Unassistedp-Value | Assisted Full Year vs.Assisted Partial Yearp-Value | Total HUD-Assistedvs. Unassisted Beneficiariesp-Value | |||||
| N | % | N | % | N | % | N | % | |||||
| * Cell sizes of less than 11 are not displayed. | ||||||||||||
| Demographic Characteristics (available in Medicare data) | ||||||||||||
| Gender | 0.0001 | 0.0001 | 0.0001 | 0.0001 | ||||||||
| Male | 12,745 | 28.0% | 1,672 | 30.9% | 14,417 | 28.3% | 1,046,136 | 42.6% | ||||
| Female | 32,821 | 72.0% | 3,734 | 69.1% | 36,555 | 71.7% | 1,407,627 | 57.4% | ||||
| Race (based on RTI variable) | 0.0001 | 0.0001 | 0.0001 | 0.0001 | ||||||||
| Non-Hispanic White | 29,655 | 65.1% | 3,833 | 70.9% | 33,488 | 65.7% | 2,148,123 | 87.5% | ||||
| Hispanic | 4,211 | 9.2% | 371 | 6.9% | 4,582 | 9.0% | 77,104 | 3.1% | ||||
| Black | 10,871 | 23.9% | 1,108 | 20.5% | 11,979 | 23.5% | 160,116 | 6.5% | ||||
| Asian/Pacific Islander | 529 | 1.2% | 60 | 1.1% | 589 | 1.2% | 46,367 | 1.9% | ||||
| American Indian/Alaska Native | 24 | 0.1% | * | * | 28 | 0.1% | 727 | 0.0% | ||||
| Other | 235 | 0.5% | 30 | 0.6% | 265 | 0.5% | 19,375 | 0.8% | ||||
| Unknown | 41 | 0.1% | * | * | 41 | 0.1% | 1,951 | 0.1% | ||||
| Age Group | 0.0001 | 0.0001 | 0.0001 | 0.0001 | ||||||||
| 65 to 69 | 7,386 | 16.2% | 1,081 | 20.0% | 8,467 | 16.6% | 539,614 | 22.0% | ||||
| 70 to 74 | 8,742 | 19.2% | 1,048 | 19.4% | 9,790 | 19.2% | 560,485 | 22.8% | ||||
| 75 to 79 | 8,842 | 19.4% | 1,002 | 18.5% | 9,844 | 19.3% | 490,659 | 20.0% | ||||
| 80 to 84 | 9,395 | 20.6% | 999 | 18.5% | 10,394 | 20.4% | 431,969 | 17.6% | ||||
| 85+ | 11,201 | 24.6% | 1,276 | 23.6% | 12,477 | 24.5% | 431,036 | 17.6% | ||||
| Geographic Area | 0.0001 | 0.0001 | 0.0001 | 0.0001 | ||||||||
| Vermont | 574 | 1.3% | 114 | 2.1% | 688 | 1.3% | 55,962 | 2.3% | ||||
| New Haven- Milford | 1,545 | 3.4% | 297 | 5.5% | 1,842 | 3.6% | 67,397 | 2.7% | ||||
| Bridgeport- Stamford- Norwalk | 1,187 | 2.6% | 155 | 2.9% | 1,342 | 2.6% | 71,240 | 2.9% | ||||
| Milwaukee- Waukesha- West Allis | 1,062 | 2.3% | 201 | 3.7% | 1,263 | 2.5% | 108,716 | 4.4% | ||||
| San Francisco- Oakland- Fremont | 1,262 | 2.8% | 131 | 2.4% | 1,393 | 2.7% | 165,824 | 6.8% | ||||
| Boston- Cambridge- Quincy | 9,746 | 21.4% | 1,107 | 20.5% | 10,853 | 21.3% | 309,454 | 12.6% | ||||
| Durham- Chapel Hill | 233 | 0.5% | 40 | 0.7% | 273 | 0.5% | 31,851 | 1.3% | ||||
| Richmond | 245 | 0.5% | 45 | 0.8% | 290 | 0.6% | 71,697 | 2.9% | ||||
| New York- Northern New Jersey- Long Island | 26,618 | 58.4% | 2,763 | 51.1% | 29,381 | 57.6% | 1,194,284 | 48.7% | ||||
| Columbus | 975 | 2.1% | 205 | 3.8% | 1,180 | 2.3% | 94,577 | 3.9% | ||||
| Akron | 496 | 1.1% | 87 | 1.6% | 583 | 1.1% | 48,037 | 2.0% | ||||
| Cleveland | 1,623 | 3.6% | 261 | 4.8% | 1,884 | 3.7% | 164,689 | 6.7% | ||||
| Missing | * | * | * | * | * | * | 70,035 | 2.9% | ||||
| Died During the Year | 450 | 1.0% | 778 | 14.4% | 1,228 | 2.4% | 57,513 | 2.3% | 0.0001 | 0.0001 | 0.0001 | 0.0001 |
| Medicare Coverage Characteristics | ||||||||||||
| Original Reason for Entitlement | 0.0001 | 0.0001 | 0.0001 | 0.0001 | ||||||||
| Old age and survivor's insurance | 38,747 | 85.0% | 4,665 | 86.3% | 43,412 | 85.2% | 2,306,856 | 94.0% | ||||
| Disability insurance benefits | 6,754 | 14.8% | 731 | 13.5% | 7,485 | 14.7% | 144,351 | 5.9% | ||||
| ESRD | 26 | 0.1% | * | * | 32 | 0.1% | 1,442 | 0.1% | ||||
| Disability Insurance and ESRD | 39 | 0.1% | * | * | 43 | 0.1% | 1,114 | 0.0% | ||||
| Current Reason for Entitlement | 0.0001 | 0.0613 | 0.0001 | 0.0001 | ||||||||
| Old age and survivor's insurance | 44,925 | 98.6% | 5,367 | 99.3% | 50,292 | 98.7% | 2,435,998 | 99.3% | ||||
| Disability insurance benefits | 569 | 1.2% | 29 | 0.5% | 598 | 1.2% | 15,364 | 0.6% | ||||
| ESRD | 63 | 0.1% | * | * | 73 | 0.1% | 2,122 | 0.1% | ||||
| Disability Insurance and ESRD | * | * | * | * | * | * | 279 | 0.0% | ||||
| Medicare Part D Coverage at Any Point During the Year | 25,421 | 55.8% | 2,824 | 52.2% | 28,245 | 55.4% | 922,021 | 37.6% | 0.0001 | 0.0001 | 0.0001 | 0.0001 |
| Average Months of Part D Coverage (among those with Part D cov) | 11.79 | 11.15 | 11.72 | 11.75 | 0.0001 | 0.0001 | 0.0001 | 0.0011 | ||||
| Proportion with Part D Coverage by Cost Share Group Code | 0.0001 | 0.0001 | 0.0001 | 0.0001 | ||||||||
| Beneficiary deemed with 100% premium-subsidy and no copayment | 13 | 0.1% | * | * | 21 | 0.1% | 340 | 0.0% | ||||
| Beneficiary deemed with 100% premium-subsidy and low copayment | 329 | 1.3% | 55 | 1.9% | 384 | 1.4% | 2,395 | 0.3% | ||||
| Beneficiary deemed with 100% premium-subsidy and high copayment | 461 | 1.8% | 40 | 1.4% | 501 | 1.8% | 3,153 | 0.3% | ||||
| Beneficiary with Low Income Subsidy (LIS), 100% premium-subsidy | 4,885 | 19.2% | 469 | 16.6% | 5,354 | 19.0% | 34,165 | 3.7% | ||||
| Beneficiary with Low Income Subsidy (LIS), 100% premium-subsidy and 15% copayment | 520 | 2.0% | 59 | 2.1% | 579 | 2.0% | 4,212 | 0.5% | ||||
| Beneficiary with LIS, 75% premium-subsidy and 15% copayment | 732 | 2.9% | 63 | 2.2% | 795 | 2.8% | 3,665 | 0.4% | ||||
| Beneficiary with LIS, 50% premium-subsidy and 15% copayment | 700 | 2.8% | 43 | 1.5% | 743 | 2.6% | 3,507 | 0.4% | ||||
| Beneficiary with LIS, 25% premium-subsidy and 15% copayment | 535 | 2.1% | 44 | 1.6% | 579 | 2.0% | 2,971 | 0.3% | ||||
| No premium subsidy nor cost sharing | 16,265 | 64.0% | 1,602 | 56.7% | 17,867 | 63.3% | 818,191 | 88.7% | ||||
| Missing | 981 | 3.9% | 441 | 15.6% | 1,422 | 5.0% | 49,422 | 5.4% | ||||
| CCW Condition | Total HUD-Assisted Beneficiaries | Unassisted Beneficiaries in the Community | Total HUD-Assistedvs. Unassisted Beneficiariesp-Value | ||
| N | % | N | % | ||
| Prevalence of Chronic Conditions | 0.0001 | ||||
| 0 Conditions | 6,625 | 13.0% | 300,020 | 12.2% | |
| 1 Condition | 3,985 | 7.8% | 250,430 | 10.2% | |
| 2 Conditions | 5,293 | 10.4% | 314,219 | 12.8% | |
| 3 Conditions | 6,603 | 13.0% | 362,624 | 14.8% | |
| 4 Conditions | 6,931 | 13.6% | 348,247 | 14.2% | |
| 5 or More Conditions | 21,535 | 42.2% | 878,223 | 35.8% | |
| Prevalence of Chronic Conditions by Category | |||||
| Cardiovascular | 24,058 | 47.2% | 1,061,551 | 43.3% | 0.0001 |
| Cancer | 4,853 | 9.5% | 263,760 | 10.7% | 0.0001 |
| Endocrine and Renal | 22,257 | 43.7% | 891,227 | 36.3% | 0.0001 |
| Alzheimer's-related | 4,935 | 9.7% | 234,617 | 9.6% | 0.3695 |
| Depression | 5,281 | 10.4% | 213,345 | 8.7% | 0.0001 |
| Musculoskeletal | 18,212 | 35.7% | 808,818 | 33.0% | 0.0001 |
| Pulmonary | 8,392 | 16.5% | 291,710 | 11.9% | 0.0001 |
| Opthalmic | 16,473 | 32.3% | 891,809 | 36.3% | 0.0001 |
| Other | 39,127 | 76.8% | 1,828,469 | 74.5% | 0.0001 |
| Medicare Services Annual Utilization per 1000 Member Months | Total HUD-Assisted Beneficiaries | Unassisted Beneficiaries in the Community | Total HUD-Assistedvs. Unassisted Beneficiariesp-Value | ||||
| Mean | SD | Median | Mean | SD | Median | ||
| * Limited to those who have Part D coverage for entire year or up until death. | |||||||
| Total Admissions | 37.43 | 91.53 | 0 | 28.91 | 78.68 | 0 | 0.0001 |
| Acute stay admissions | 35.36 | 86.36 | 0 | 27.25 | 73.81 | 0 | 0.0001 |
| Other inpatient admissions | 2.07 | 16.61 | 0 | 1.66 | 14.41 | 0 | 0.0001 |
| Hospital Readmissions | 6.43 | 37.63 | 0 | 4.69 | 31.23 | 0 | 0.0001 |
| Medicare home health visits | 368.54 | 1710.97 | 0 | 221.31 | 1321.7 | 0 | 0.0001 |
| Medicare hospice days | 50.59 | 879.67 | 0 | 91.47 | 1285.45 | 0 | 0.0001 |
| Hospital Outpatient visits | 490.01 | 1233.45 | 166.67 | 449.42 | 1150.54 | 166.67 | 0.0001 |
| Total emergency room visits (total) | 57.01 | 116.67 | 0 | 39.56 | 92.82 | 0 | 0.0001 |
| Hospital outpatient ER visits | 30.37 | 75.88 | 0 | 21.1 | 59.09 | 0 | 0.0001 |
| Hospital inpatient ER visits | 26.64 | 71.65 | 0 | 18.46 | 58.57 | 0 | 0.0001 |
| Physician office visits | 1430.19 | 2002.1 | 916.67 | 1331.89 | 1903.06 | 833.33 | 0.0001 |
| Ambulatory surgery center visits | 12.63 | 57.77 | 0 | 15.9 | 64.73 | 0 | 0.0001 |
| Dialysis events | 10.07 | 136 | 0 | 6.91 | 122.21 | 0 | 0.0001 |
| Anesthesia events | 31.35 | 83.99 | 0 | 33.05 | 84.17 | 0 | 0.0001 |
| Imaging events | 471.2 | 696 | 250 | 447.59 | 671.91 | 250 | 0.0001 |
| Test events | 1427.72 | 2001.96 | 750 | 1474.86 | 2011.49 | 833.33 | 0.0001 |
| Other procedures | 566.22 | 1493.82 | 166.67 | 667.79 | 1654.15 | 166.67 | 0.0001 |
| Durable medical equipment (DME) | 204.33 | 514.42 | 0 | 159.36 | 473.4 | 0 | 0.0001 |
| Part B Drugs | 217.97 | 549.05 | 83.33 | 251.43 | 613.44 | 166.67 | 0.0001 |
| Part D* Drugs | 3075.98 | 2489.13 | 2583.33 | 2590.61 | 2214.88 | 2083.33 | 0.0001 |
| Any Use of Medicare Service During Year (% with any use) | N | % | N | % | p-Value | ||
| Total Admissions | 11,876 | 23% | 467,059 | 19% | 0.0001 | ||
| Acute stay admissions | 11,740 | 23% | 462,489 | 19% | 0.0001 | ||
| Other inpatient admissions | 992 | 2% | 39,416 | 2% | 0.0001 | ||
| Hospital Readmissions | 2,340 | 5% | 84,863 | 3% | 0.0001 | ||
| Medicare home health | 7,323 | 14% | 230,862 | 9% | 0.0001 | ||
| Medicare hospice | 504 | 1% | 32,012 | 1% | 0.0001 | ||
| Hospital Outpatient | 33,856 | 66% | 1,605,649 | 65% | 0.0001 | ||
| Total emergency room | 17,448 | 34% | 645,195 | 26% | 0.0001 | ||
| Hospital outpatient ER | 11,641 | 23% | 429,523 | 18% | 0.0001 | ||
| Hospital inpatient ER | 9,705 | 19% | 339,233 | 14% | 0.0001 | ||
| Physician office | 45,027 | 88% | 2,253,638 | 92% | 0.0001 | ||
| Ambulatory surgery center | 3,734 | 7% | 233,620 | 10% | 0.0001 | ||
| Dialysis | 419 | 1% | 14,097 | 1% | 0.0001 | ||
| Anesthesia | 10,082 | 20% | 527,054 | 21% | 0.0001 | ||
| Imaging | 36,067 | 71% | 1,794,385 | 73% | 0.0001 | ||
| Test | 39,905 | 78% | 2,025,523 | 83% | 0.0001 | ||
| Other procedures | 31,826 | 62% | 1,663,036 | 68% | 0.0001 | ||
| Durable medical equipment (DME) | 14,953 | 29% | 582,130 | 24% | 0.0001 | ||
| Part B Drugs | 28,358 | 56% | 1,590,177 | 65% | 0.0001 | ||
| Part D* Drugs | 24,919 | 88% | 836,932 | 91% | 0.0001 | ||
| Medicare Payment PMPM($) | HUD-Assisted Beneficiaries | Unassisted Beneficiaries in the Community | Total HUD-Assistedvs. Unassisted Beneficiariesp-Value | ||||
| Mean | SD | Median | Mean | SD | Median | ||
| Total Admissions PMPM | $379 | $1,259 | $0 | $313 | $1,199 | $0 | 0.0001 |
| Acute stay admission PMPM | $343 | $1,116 | $0 | $283 | $1,074 | $0 | 0.0001 |
| Other inpatient admission PMPM | $36 | $346 | $0 | $30 | $317 | $0 | 0.0001 |
| Medicare home health PMPM (Medicare only) | $55 | $189 | $0 | $38 | $167 | $0 | 0.0001 |
| Medicare hospice PMPM (Medicare only) | $10 | $154 | $0 | $16 | $210 | $0 | 0.0001 |
| Hospital Outpatient PMPM | $91 | $303 | $15 | $86 | $311 | $11 | 0.0007 |
| Physician office PMPM | $96 | $157 | $53 | $86 | $146 | $48 | 0.0001 |
| Ambulatory surgery center PMPM | $5 | $22 | $0 | $6 | $26 | $0 | 0.0001 |
| Dialysis PMPM | $2 | $19 | $0 | $1 | $15 | $0 | 0.0001 |
| Anesthesia PMPM | $4 | $12 | $0 | $4 | $12 | $0 | 0.0007 |
| Imaging PMPM | $26 | $43 | $9 | $27 | $47 | $9 | 0.0001 |
| Test PMPM | $25 | $41 | $11 | $27 | $43 | $14 | 0.0001 |
| Other procedures PMPM | $47 | $114 | $10 | $55 | $130 | $14 | 0.0001 |
| Durable medical equipment (DME) PMPM | $16 | $61 | $0 | $13 | $55 | $0 | 0.0001 |
| Part B Drugs PMPM | $21 | $194 | $2 | $28 | $220 | $3 | 0.0001 |
| Part D* Drugs PMPM | $137 | $297 | $97 | $105 | $208 | $84 | 0.0001 |
| Total Medical and Rx PMPM (sum of all above) | $953 | $1,959 | $282 | $808 | $1,830 | $226 | 0.0001 |
| Total Medical PMPM (sum of all above except part D PMPM) | $859 | $1,902 | $197 | $741 | $1,778 | $176 | 0.0001 |
Sample C1: Medicare Beneficiaries with No Medicaid Enrollment, Age 65+, No SNF Use in 2008
| HUD-AssistedBeneficiaries(full year)(N=42,286) | HUD-AssistedBeneficiaries(partial year)(N=4,520) | Total HUD-Assisted Beneficiaries(N=46,806) | Unassisted Beneficiariesin the Community(N=2,318,394) | Assisted FullYear vs. Unassistedp-Value | Assisted PartialYear vs. Unassistedp-Value | Assisted Full Year vs.Assisted Partial Yearp-Value | Total HUD-Assistedvs. Unassisted Beneficiariesp-Value | |||||
| N | % | N | % | N | % | N | % | |||||
| * Cell sizes of less than 11 are not displayed. | ||||||||||||
| Demographic Characteristics (available in Medicare data) | ||||||||||||
| Gender | 0.0001 | 0.0001 | 0.0001 | 0.0001 | ||||||||
| Male | 11,986 | 28.3% | 1,442 | 31.9% | 13,428 | 28.7% | 997,877 | 43.0% | ||||
| Female | 30,300 | 71.7% | 3,078 | 68.1% | 33,378 | 71.3% | 1,320,517 | 57.0% | ||||
| Race (based on RTI variable) | 0.0001 | 0.0043 | 0.0001 | 0.0001 | ||||||||
| Non-hispanic white | 27,034 | 63.9% | 3,081 | 68.2% | 30,115 | 64.3% | 2,023,130 | 87.3% | ||||
| Hispanic | 4,108 | 9.7% | 352 | 7.8% | 4,460 | 9.5% | 75,090 | 3.2% | ||||
| Black | 10,341 | 24.5% | 997 | 22.1% | 11,338 | 24.2% | 153,339 | 6.6% | ||||
| Asian/pacific Islander | 514 | 1.2% | 56 | 1.2% | 570 | 1.2% | 45,354 | 2.0% | ||||
| American Indian/Alaska Native | 24 | 0.1% | * | * | 28 | 0.1% | 679 | 0.0% | ||||
| Other | 228 | 0.5% | 30 | 0.7% | 258 | 0.6% | 18,994 | 0.8% | ||||
| Unknown | 37 | 0.1% | * | * | 37 | 0.1% | 1,808 | 0.1% | ||||
| Age Group | 0.0001 | 0.0001 | 0.0001 | 0.0001 | ||||||||
| 65 to 69 | 7,173 | 17.0% | 1,034 | 22.9% | 8,207 | 17.5% | 531,472 | 22.9% | ||||
| 70 to 74 | 8,376 | 19.8% | 971 | 21.5% | 9,347 | 20.0% | 546,599 | 23.6% | ||||
| 75 to 79 | 8,315 | 19.7% | 877 | 19.4% | 9,192 | 19.6% | 468,478 | 20.2% | ||||
| 80 to 84 | 8,618 | 20.4% | 797 | 17.6% | 9,415 | 20.1% | 398,836 | 17.2% | ||||
| 85+ | 9,804 | 23.2% | 841 | 18.6% | 10,645 | 22.7% | 373,009 | 16.1% | ||||
| Geographic Area | 0.0001 | 0.0001 | 0.0001 | 0.0001 | ||||||||
| Vermont | 547 | 1.3% | 98 | 2.2% | 645 | 1.4% | 53,954 | 2.3% | ||||
| New Haven- Milford | 1,404 | 3.3% | 260 | 5.8% | 1,664 | 3.6% | 62,465 | 2.7% | ||||
| Bridgeport- Stamford- Norwalk | 1,087 | 2.6% | 131 | 2.9% | 1,218 | 2.6% | 66,882 | 2.9% | ||||
| Milwaukee- Waukesha- West Allis | 992 | 2.3% | 174 | 3.8% | 1,166 | 2.5% | 102,795 | 4.4% | ||||
| San Francisco- Oakland- Fremont | 1,214 | 2.9% | 111 | 2.5% | 1,325 | 2.8% | 158,523 | 6.8% | ||||
| Boston- Cambridge- Quincy | 8,826 | 20.9% | 873 | 19.3% | 9,699 | 20.7% | 289,114 | 12.5% | ||||
| Durham- Chapel Hill | 220 | 0.5% | 36 | 0.8% | 256 | 0.5% | 30,585 | 1.3% | ||||
| Richmond | 227 | 0.5% | 40 | 0.9% | 267 | 0.6% | 69,316 | 3.0% | ||||
| New York- Northern New Jersey- Long Island | 24,938 | 59.0% | 2,331 | 51.6% | 27,269 | 58.3% | 1,132,747 | 48.9% | ||||
| Columbus | 885 | 2.1% | 170 | 3.8% | 1,055 | 2.3% | 89,072 | 3.8% | ||||
| Akron | 459 | 1.1% | 73 | 1.6% | 532 | 1.1% | 45,169 | 1.9% | ||||
| Cleveland | 1,487 | 3.5% | 223 | 4.9% | 1,710 | 3.7% | 153,553 | 6.6% | ||||
| Missing | * | * | * | * | * | * | 64,219 | 2.8% | ||||
| Died During the Year | 277 | 0.7% | 410 | 9.1% | 687 | 1.5% | 37,424 | 1.6% | 0.0001 | 0.0001 | 0.0001 | 0.0001 |
| Medicare Coverage Characteristics | ||||||||||||
| Original Reason for Entitlement | 0.0001 | 0.0001 | 0.1714 | 0.0001 | ||||||||
| Old age and survivor's insurance | 35,941 | 85.0% | 3,888 | 86.0% | 39,829 | 85.1% | 2,181,228 | 94.1% | ||||
| Disability insurance benefits | 6,294 | 14.9% | 627 | 13.9% | 6,921 | 14.8% | 134,856 | 5.8% | ||||
| ESRD | 24 | 0.1% | * | * | 28 | 0.1% | 1,316 | 0.1% | ||||
| Disability Insurance and ESRD | 27 | 0.1% | * | * | 28 | 0.1% | 994 | 0.0% | ||||
| Current Reason for Entitlement | 0.0001 | 0.8083 | 0.0015 | 0.0001 | ||||||||
| Old age and survivor's insurance | 41,674 | 98.6% | 4,486 | 99.2% | 46,160 | 98.6% | 2,301,302 | 99.3% | ||||
| Disability insurance benefits | 555 | 1.3% | 29 | 0.6% | 584 | 1.2% | 14,960 | 0.6% | ||||
| ESRD | 52 | 0.1% | * | * | 57 | 0.1% | 1,883 | 0.1% | ||||
| Disability Insurance and ESRD | * | * | * | * | * | * | 249 | 0.0% | ||||
| Medicare Part D Coverage at Any Point During the Year | 23,447 | 55.4% | 2,335 | 51.7% | 25,782 | 55.1% | 866,629 | 37.4% | 0.0001 | 0.0001 | 0.0001 | 0.0031 |
| Average Months of Part D Coverage (among those with Part D cov) | 11.79 | 11.35 | 11.75 | 11.77 | 0.0223 | 0.0001 | 0.0001 | 0.0001 | ||||
| Proportion with Part D Coverage by Cost Share Group Code | 0.0001 | 0.0001 | 0.0001 | 0.0001 | ||||||||
| Beneficiary deemed with 100% premium-subsidy and no copayment | 11 | 0.0% | * | * | 17 | 0.1% | 248 | 0.0% | ||||
| Beneficiary deemed with 100% premium-subsidy and low copayment | 316 | 1.3% | 51 | 2.2% | 367 | 1.4% | 2,263 | 0.3% | ||||
| Beneficiary deemed with 100% premium-subsidy and high copayment | 438 | 1.9% | 38 | 1.6% | 476 | 1.8% | 3,019 | 0.3% | ||||
| Beneficiary with Low Income Subsidy (LIS), 100% premium-subsidy | 4,604 | 19.6% | 419 | 17.9% | 5,023 | 19.5% | 32,425 | 3.7% | ||||
| Beneficiary with Low Income Subsidy (LIS), 100% premium-subsidy and 15% copayment | 486 | 2.1% | 42 | 1.8% | 528 | 2.0% | 3,917 | 0.5% | ||||
| Beneficiary with LIS, 75% premium-subsidy and 15% copayment | 687 | 2.9% | 53 | 2.3% | 740 | 2.9% | 3,411 | 0.4% | ||||
| Beneficiary with LIS, 50% premium-subsidy and 15% copayment | 637 | 2.7% | 37 | 1.6% | 674 | 2.6% | 3,268 | 0.4% | ||||
| Beneficiary with LIS, 25% premium-subsidy and 15% copayment | 497 | 2.1% | 41 | 1.8% | 538 | 2.1% | 2,750 | 0.3% | ||||
| No premium subsidy nor cost sharing | 14,902 | 63.6% | 1,377 | 59.0% | 16,279 | 63.1% | 774,363 | 89.4% | ||||
| Missing | 869 | 3.7% | 271 | 11.6% | 1,140 | 4.4% | 40,965 | 4.7% | ||||
| CCW Condition | Total HUD-Assisted Beneficiaries | Unassisted Beneficiaries in the Community | Total HUD-Assistedvs. Unassisted Beneficiariesp-Value | ||
| N | % | N | % | ||
| Prevalence of Chronic Conditions | 0.0001 | ||||
| 0 Conditions | 6,624 | 14.2% | 299,936 | 12.9% | |
| 1 Condition | 3,972 | 8.5% | 249,962 | 10.8% | |
| 2 Conditions | 5,245 | 11.2% | 312,462 | 13.5% | |
| 3 Conditions | 6,472 | 13.8% | 358,219 | 15.5% | |
| 4 Conditions | 6,669 | 14.2% | 339,586 | 14.6% | |
| 5 or More Conditions | 17,824 | 38.1% | 758,229 | 32.7% | |
| Prevalence of Chronic Conditions by Category | |||||
| Cardiovascular | 20,638 | 44.1% | 952,061 | 41.1% | 0.0001 |
| Cancer | 4,105 | 8.8% | 238,416 | 10.3% | 0.0001 |
| Endocrine and Renal | 19,313 | 41.3% | 800,924 | 34.5% | 0.0001 |
| Alzheimer's-related | 3,543 | 7.6% | 179,304 | 7.7% | 0.1825 |
| Depression | 3,930 | 8.4% | 167,119 | 7.2% | 0.0001 |
| Musculoskeletal | 15,494 | 33.1% | 719,065 | 31.0% | 0.0001 |
| Pulmonary | 6,777 | 14.5% | 246,619 | 10.6% | 0.0001 |
| Opthalmic | 15,098 | 32.3% | 847,512 | 36.6% | 0.0001 |
| Other | 35,030 | 74.8% | 1,696,319 | 73.2% | 0.0001 |
| Medicare Services Annual Utilization per 1000 Member Months | HUD-Assisted Beneficiaries | Unassisted Beneficiaries in the Community | Total HUD-Assistedvs. Unassisted Beneficiariesp-Value | ||||
| Mean | SD | Median | Mean | SD | Median | ||
| * Limited to those who have Part D coverage for entire year or up until death. | |||||||
| Total Admissions | 23 | 65.83 | 0 | 19.27 | 58.89 | 0 | 0.0001 |
| Acute stay admissions | 21.69 | 62.11 | 0 | 18.17 | 55.28 | 0 | 0.0001 |
| Other inpatient admissions | 1.31 | 13.45 | 0 | 1.09 | 11.52 | 0 | 0.0001 |
| Hospital Readmissions | 2.69 | 23.42 | 0 | 2.29 | 20.59 | 0 | 0.0001 |
| Medicare home health visits | 220.49 | 1433.71 | 0 | 135.96 | 1100.29 | 0 | 0.0001 |
| Medicare hospice days | 36.49 | 778.4 | 0 | 77.55 | 1229.74 | 0 | 0.0001 |
| Hospital Outpatient visits | 444.77 | 1140.2 | 166.67 | 409.47 | 1069.64 | 83.33 | 0.0001 |
| Total emergency room visits (total) | 43.04 | 94.73 | 0 | 30.38 | 74.76 | 0 | 0.0001 |
| Hospital outpatient ER visits | 27.21 | 71.16 | 0 | 18.83 | 54.53 | 0 | 0.0001 |
| Hospital inpatient ER visits | 15.83 | 49.15 | 0 | 11.55 | 41.5 | 0 | 0.0001 |
| Physician office visits | 1145.16 | 1406.1 | 833.33 | 1129.11 | 1378.64 | 750 | 0.0128 |
| Ambulatory surgery center visits | 12.65 | 57.14 | 0 | 16.01 | 64.45 | 0 | 0.0001 |
| Dialysis events | 6.51 | 96.92 | 0 | 4.77 | 94.33 | 0 | 0.0001 |
| Anesthesia events | 25.87 | 74.98 | 0 | 29.22 | 77.38 | 0 | 0.0001 |
| Imaging events | 378.19 | 530.96 | 250 | 382.24 | 544.22 | 250 | 0.1145 |
| Test events | 1346.96 | 1938.25 | 666.67 | 1416.92 | 1952.61 | 833.33 | 0.0001 |
| Other procedures | 527.23 | 1438.38 | 83.33 | 635.38 | 1616.68 | 166.67 | 0.0001 |
| Durable medical equipment (DME) | 180.65 | 478.62 | 0 | 139.02 | 435.64 | 0 | 0.0001 |
| Part B Drugs | 205.65 | 536.07 | 83.33 | 242.2 | 597.12 | 166.67 | 0.0001 |
| Part D* Drugs | 2983.91 | 2461.09 | 2500 | 2495.97 | 2143.14 | 2000 | 0.0001 |
| Any Use of Medicare Service During Year (% with any use) | N | % | N | % | |||
| Total Admissions | 7,849 | 17% | 336,509 | 15% | 0.0001 | ||
| Acute stay admissions | 7,730 | 17% | 332,644 | 14% | 0.0001 | ||
| Other inpatient admissions | 588 | 1% | 25,327 | 1% | 0.0001 | ||
| Hospital Readmissions | 1,005 | 2% | 43,527 | 2% | 0.0001 | ||
| Medicare home health | 4,422 | 9% | 145,974 | 6% | 0.0001 | ||
| Medicare hospice | 274 | 1% | 21,742 | 1% | 0.0001 | ||
| Hospital Outpatient | 30,203 | 65% | 1,485,549 | 64% | 0.0001 | ||
| Total emergency room | 13,768 | 29% | 529,308 | 23% | 0.0001 | ||
| Hospital outpatient ER | 9,883 | 21% | 374,634 | 16% | 0.0001 | ||
| Hospital inpatient ER | 6,272 | 13% | 232,234 | 10% | 0.0001 | ||
| Physician office | 40,864 | 87% | 2,118,416 | 91% | 0.0001 | ||
| Ambulatory surgery center | 3,440 | 7% | 223,232 | 10% | 0.0001 | ||
| Dialysis | 285 | 1% | 10,246 | 0% | 0.0001 | ||
| Anesthesia | 7,980 | 17% | 455,298 | 20% | 0.0001 | ||
| Imaging | 31,952 | 68% | 1,660,480 | 72% | 0.0001 | ||
| Test | 35,818 | 77% | 1,893,014 | 82% | 0.0001 | ||
| Other procedures | 28,048 | 60% | 1,537,448 | 66% | 0.0001 | ||
| Durable medical equipment (DME) | 12,370 | 26% | 496,468 | 21% | 0.0001 | ||
| Part B Drugs | 25,260 | 54% | 1,484,609 | 64% | 0.0001 | ||
| Part D* Drugs | 22,604 | 88% | 784,924 | 91% | 0.0001 | ||
| Medicare Payment PMPM($) | HUD-Assisted Beneficiaries | Unassisted Beneficiaries in the Community | p-Value | ||||
| Mean | SD | Median | Mean | SD | Median | ||
| Total Admissions PMPM | $219 | $875 | $0 | $199 | $886 | $0 | 0.0001 |
| Acute stay admission PMPM | $196 | $760 | $0 | $181 | $801 | $0 | 0.0001 |
| Other inpatient admission PMPM | $22 | $280 | $0 | $18 | $229 | $0 | 0.0001 |
| Medicare home health PMPM (Medicare only) | $32 | $145 | $0 | $23 | $130 | $0 | 0.0001 |
| Medicare hospice PMPM (Medicare only) | $7 | $135 | $0 | $13 | $199 | $0 | 0.0001 |
| Hospital Outpatient PMPM | $82 | $283 | $12 | $80 | $299 | $10 | 0.1331 |
| Physician office PMPM | $74 | $105 | $46 | $71 | $101 | $45 | 0.0001 |
| Ambulatory surgery center PMPM | $5 | $23 | $0 | $6 | $26 | $0 | 0.0001 |
| Dialysis PMPM | $1 | $16 | $0 | $1 | $13 | $0 | 0.0001 |
| Anesthesia PMPM | $3 | $10 | $0 | $4 | $11 | $0 | 0.0001 |
| Imaging PMPM | $24 | $42 | $7 | $25 | $46 | $8 | 0.0001 |
| Test PMPM | $24 | $40 | $10 | $27 | $43 | $13 | 0.0001 |
| Other procedures PMPM | $41 | $106 | $8 | $50 | $126 | $12 | 0.0001 |
| Durable medical equipment (DME) PMPM | $14 | $57 | $0 | $11 | $49 | $0 | 0.0001 |
| Part B Drugs PMPM | $20 | $195 | $1 | $27 | $218 | $3 | 0.0001 |
| Part D* Drugs PMPM | $135 | $303 | $94 | $102 | $205 | $81 | 0.0001 |
| Total Medical and Rx PMPM (sum of all above) | $617 | $1,263 | $240 | $574 | $1,284 | $205 | 0.0001 |
| Total Medical PMPM (sum of all above except part D PMPM) | $525 | $1,181 | $163 | $510 | $1,218 | $157 | 0.0057 |
Part D LIS Enrollment
| HUD-Assisted | Unassisted inthe Community | |
| Subgroup A : Medicare-Medicaid benes, no SNF or NF days | 99% | 98% |
| Subgroup A1 : Age 65+ | 99% | 98% |
| Subgroup B : Medicare-Medicaid benes with >0 and 365 SNF/NF days | 98% | 95% |
| Subgroup C : Medicare only, 65+ | 32% | 6% |
| Subgroup C1 : Medicare only, 65+, No SNF days | 32% | 6% |
NOTES
U.S. Department of Housing and Urban Development.(2013). Worst Case Housing Needs 2011: Report to Congress. Washington, D.C. Available at: http://www.huduser.org/portal/publications/affhsg/wc_HsgNeeds11_report.html.
Summit on Aging in Place in Public Housing. (2011). Hosted by Enterprise Community Partners, Inc., LeadingAge. Supported by the Atlantic Philanthropies.
Gibler, K. (2003). Aging Subsidized Housing Residents: A Growing Problem in U.S. Cities. Journal of Real Estate Research 25, (4) 395-420.
Long-term services and supports include institutional (e.g., nursing facility) and home and community-based services (HCBS) (e.g., personal care to assist with bathing, dressing, eating and other ADLs in an individual's home or residential group setting, homemaker services, and transportation).
Assisted households are categorized by property type in which they live, despite minor variations in subsidy type. "Housing choice vouchers" include all types of buildings in which housing choice voucher holders live, from a single-family home to a large apartment complex.
For this report, "elderly properties" include properties designated as elderly by PHAs and properties in which 50 percent or more of households had an individual aged 62 years or older.
Before calculating the match rates, we excluded all Medicare or Medicaid beneficiaries that were duplicates in the CMS administrative data. We excluded these individuals from both the CMS administrative data and the HUD data, for those that were also individuals receiving HUD-assisted housing. This way, the rates were accurate and did not overestimate the rates due to an individual being counted multiple times. We also excluded any individuals receiving HUD-assisted housing without a valid SSN from the denominator (invalid SSNs are those that begin with "999" or a letter).
We examined HUD-assisted individuals age 65 and older since most individuals over age 65 would be eligible for Medicare based on age (more than 97% of Americans age 65 and older are enrolled in Medicare, http://www.ssa.gov/history/pdf/WhatMedicareMeant.pdf).
For the sample included in Figure 6, HUD-assisted individuals age 65 and older, over 40% of the sample has unknown/declined to report race/ethnicity.
Center on Budget and Policy Priorities. October 2012. Reducing HUD Program Costs Associated with the Medical Deduction Policy.
We excluded individuals with any managed care enrollment as the CMS administrative data only has enrollment for individuals in managed care, but does not have their claims data (i.e., health care cost and utilization data).
Kaiser Family Foundation, Issue Brief, "Medicare's Role for Dual Eligible Beneficiaries", Gretchen Jacobson, Tricia Neuman, and Anthony Damico, April 2012.
Given that beneficiaries residing in a nursing facility, for even a portion of the year, have poorer health status and therefore utilize more health care services compared to beneficiaries not in a nursing facility, accounting for that use becomes an important control factor. Due to incomplete information regarding the use of nursing facilities in the data available to us for this study and the fact that a higher proportion of individuals in the community sample used nursing facilities than in the HUD-assisted sample based on what we could observe (15% of unassisted beneficiaries in the community used Medicare SNF services compared to 8% HUD-assisted beneficiaries), we elected to remove all individuals with any nursing facility use that we could identify from both samples.
Services only available through Medicaid health insurance, not covered by Medicare. We excluded MMEs with Medicaid managed care enrollment from the calculation of Medicaid cost and utilization because we do not have their complete health care cost and utilization data (similarly to those with Medicare managed care or Medicare Advantage.
Personal Care Services include a range of human assistance provided to persons with disabilities and chronic conditions of all ages, enabling them to accomplish tasks they would normally do for themselves if they did not have a disability, including ADLs (such as eating, bathing, dressing, and bladder and bowel requirements) or IADLs (such as taking medications and shopping for groceries).
Althought Medicaid does not cover room and board services provided in residential care facilities, other components of residential care -- for example, personal care, 24-hour services, and chore services -- can be covered. Residential care includes group, family or individual home residential care; cluster residential care; and therapeutic residential care services, assisted living, supported living, and nigh supervision. (DME and services for mental health or substance abuse treatment are excluded.) We would expect HUD-assisted beneficiaries to be less likely to use Medicaid residential services because: (1) only under limited circumstances would HUD properties be considered residential for Medicaid purposes -- assisted living conversion and 811 group homes; and (2) few housing voucher recipients use them for assisted living.
No Medicaid eligibility; in other words, excluding individuals who are dually eligible for both Medicare and Medicaid.
For purposes of determining income and rent contributions, HUD's public and assisted housing programs define "elderly" as 62 years of age and over, as provided by authorizing statutes.
For further information about types of public and assisted housing, see "Programs of HUD 2011," (HUD 2013). http://www.huduser.org/portal/publications/progs_of_hud.html.
Note that some tables refer to both "Section 202" and "Section 202/162". A small number of 202 properties contain units for non-elderly disabled that were funded with rental assistance created by Section 162 of the Housing and Community Development Act of 1987. Section 162 has been superseded by the Section 811 program, which supports housing for disabled individuals.
Ended participation in HUD, death of sole family member.
Before calculating the match rates, we excluded all Medicare or Medicaid beneficiaries that were duplicates in the CMS administrative data. We excluded these individuals from both the CMS administrative data and the HUD data, for those that were also HUD-assisted housing recipients. This way, the Rates were accurate and did not overestimate the rates due to an individual being counted multiple times. We also excluded any HUD-assisted housing recipient without a valid SSN from the denominator (invalid SSNs are those that begin with "999" or a letter.
See http://www.medicare.gov/what-medicare-covers/part-b/what-medicare-part-b-covers.html.
See https://www.ccwdata.org/cs/groups/public/documents/document/ccw_partddata_userguide.pdf.
See https://www.ccwdata.org/cs/groups/public/documents/document/ccw_partddata_userguide.pdf.
See http://www.cms.gov/Research-Statistics-Data-and-Systems/Statistics-Trends-and-Reports/MedicareEnrpts/Downloads/Buy-InDefinitions.pdf.
See http://www.cms.gov/Research-Statistics-Data-and-Systems/Research/MedicareMedicaidStatSupp/Downloads/07Glossary.pdf.
See https://www.ccwdata.org/summary-statistics/demographics/a2-assistance-1999-2007.htm.
See http://aspe.hhs.gov/health/reports/transition/welfare.htm.
For additional information see Dartmouth Atlas: http://www.dartmouthatlas.org/.
For example, if current year of analysis is 2008 and their move out date was 2007, we removed them from 2008 dataset.
We excluded individuals with any managed care enrollment as the CMS administrative data only has enrollment for individuals in managed care but does not have their claims data (i.e., health care cost and utilization data).
For this report, "elderly properties" include properties designated as elderly by PHAs and properties in which 50% or more of households had an individual aged 62 years or older.
Before calculating the match rates, we excluded all Medicare or Medicaid beneficiaries that were duplicates in the CMS administrative data. We excluded these individuals from both the CMS administrative data and the HUD data, for those that were also individuals receiving HUD-assisted housing. This way, the rates were accurate and did not overestimate the rates due to an individual being counted multiple times. We also excluded any individuals receiving HUD-assisted housing without a valid SSN from the denominator (invalid SSNs are those that begin with "999" or a letter).
Center on Budget and Policy Priorities. October 2012. Reducing HUD Program Costs Associated with the Medical Deduction Policy.
We excluded individuals with any managed care enrollment as the CMS administrative data only has enrollment for individuals in managed care but does not have their claims data (i.e., health care cost and utilization data).
Kaiser Family Foundation, Issue Brief, "Medicare's Role for Dual Eligible Beneficiaries", Gretchen Jacobson, Tricia Neuman, and Anthony Damico, April 2012.
Given that beneficiaries residing in a nursing facility, for even a portion of the year, have poorer health status and therefore utilize more health care services compared to beneficiaries not in a nursing facility, accounting for that use becomes an important control factor. Due to incomplete information regarding the use of nursing facilities in the data available to us for this study and the fact that a higher proportion of individuals in the community sample used nursing facilities than in the HUD-assisted sample based on what we could observe 15% of unassisted beneficiaries in the community used Medicare SNF services compared to 8% HUD-assisted beneficiaries), we elected to remove all individuals with any nursing facility use that we could identify from both samples.
Those determined "medically needy" have high medical expenditures, but have an income that exceeds maximum Medicaid income threshold. These individuals would otherwise be eligible for the program.
Services only available through Medicaid health insurance, not covered by Medicare. We excluded MMEs with Medicaid managed care enrollment from the calculation of Medicaid cost and utilization as we do not have their complete health care cost and utilization data (similarly to those with Medicare managed care).
Personal Care Services include a range of human assistance provided to persons with disabilities and chronic conditions of all ages, enabling them to accomplish tasks they would normally do for themselves if they did not have a disability, including ADLs (such as eating, bathing, dressing, and bladder and bowel requirements) or IADLs (such as taking medications and shopping for groceries.
No Medicaid enrollment.
DESIGN OF A DEMONSTRATION OF COORDINATED HOUSING, HEALTH AND LONG-TERM CARE SERVICES AND SUPPORTS FOR LOW INCOME OLDER ADULTS -- Reports Available
- Design of a Demonstration of Coordinated Housing, Health and Long-Term Care Services and Supports for Low-Income Older Adults
- Full HTML Version http://aspe.hhs.gov/daltcp/reports/2011/lioaDemo.shtml
- Full PDF Version http://aspe.hhs.gov/daltcp/reports/2011/lioaDemo.pdf
- Picture of Housing and Health: Medicare and Medicaid Use Among Older Adults in HUD-Assisted Housing
- Executive Summary http://aspe.hhs.gov/daltcp/reports/2014/HUDpices.shtml
- Full HTML Version http://aspe.hhs.gov/daltcp/reports/2014/HUDpic.shtml
- Full PDF Version http://aspe.hhs.gov/daltcp/reports/2014/HUDpic.pdf
- The "Value Added" of Linking Publicly Assisted Housing for Low-Income Older Adults with Enhanced Services: A Literature Syntheses and Environmental Scan
- Executive Summary http://aspe.hhs.gov/daltcp/reports/2012/ValueAddes.shtml
- Full HTML Version http://aspe.hhs.gov/daltcp/reports/2012/ValueAdd.shtml
- Full PDF Version http://aspe.hhs.gov/daltcp/reports/2012/ValueAdd.pdf
To obtain a printed copy of this report, send the full report title and your mailing information to:
U.S. Department of Health and Human ServicesOffice of Disability, Aging and Long-Term Care PolicyRoom 424E, H.H. Humphrey Building200 Independence Avenue, S.W.Washington, D.C. 20201FAX: 202-401-7733Email: webmaster.DALTCP@hhs.gov