
Medicaid-Financed Institutional Services: Patterns of Care for Residents of Nursig Homes and Intermediate Care Facilities for Individuals with Intellectual Disabilities in 2008 and 2009
May 7, 2014
Robert Schmitz, Victoria Peebles, Rosemary Borck and Dean Miller
Mathematica Policy Research
Abstract
Although states have begun to rebalance their long-term care systems toward a greater emphasis on home and community-based services (HCBS), many low-income elderly, persons with physical disabilities, and persons with intellectual/developmental disabilities (ID/DD) continue to reside in institutions such as nursing homes or intermediate care facilities for the intellectually disabled (ICFs/IID). The vast majority of people with institutional stays were already enrolled in Medicaid during the months before their stay began. Through an analysis of Medicaid enrollment and long-term care claims data, this report provides information on the characteristics of institutionalized enrollees, their stays, and the interaction of institutional services and HCBS.
DISCLAIMER: The opinions and views expressed in this report are those of the authors. They do not necessarily reflect the views of the Department of Health and Human Services, the contractor or any other funding organization.
TABLE OF CONTENTS
- I. BACKGROUND AND OBJECTIVES
- A. Role of Medicaid Institutional Services in Long-Term Care
- B. Research Questions
- C. Summary of Data and Methods
- II. CHARACTERISTICS OF ENROLLEES USING NURSING HOME SERVICES AND THEIR SPELLS OF CARE
- A. Characteristics of Enrollees Using Nursing Home Services
- B. Characteristics of Enrollees' Nursing Home Spells
- C. Associates Between Lengths of Stay in Nursing Homes and HCBS Use
- D. Summary of Nursing Home Findings
- III. CHARACTERISTICS OF ENROLLEES USING ICF/IID SERVICES AND THEIR SPELLS OF CARE
- A. Characteristics of Enrollees using ICF/IID Services
- B. Characteristics of Enrollees' ICF/IID Spells
- C. Associations Between Lengths of Stay in ICFs/IID and State Policy-Related Variables
- D. Summary of ICF/IID Findings
- IV. POLICY IMPLICATIONS AND DIRECTIONS FOR FUTURE RESEARCH
- A. Summary of Results and Policy Implications
- B. Directions for Future Research
- APPENDICES
- APPENDIX A: Glossary of Terms
- APPENDIX B: Data and Methods
- APPENDIX C: State Nursing Home and ICF/IID Data Anomalies
- APPENDIX D: Supplementary Data Tables
- LIST OF FIGURES
- FIGURE II.1: Percentage of Medicaid Enrollees Who Were Aged or Had Disabilities Using Nursing Home Care, July 2008-December 2009
- FIGURE II.2: Length of First New Nursing Home Spells among Medicaid Enrollees Who Were Aged or Had Disabilities
- FIGURE II.3: Length of First New Nursing Home Spells among Aged or Disabled Medicaid Enrollees with New Nursing Home Spells
- FIGURE II.4: Length-of-Stay among Nursing Home Spells for Which Medicaid Coverage Commenced
- FIGURE II.5: Time Lapsed Between Admission Date and Medicaid Coverage Start Date for Nursing Home Spells for Which Medicaid Coverage Commenced, 35 States
- FIGURE II.6: Time Lapsed Between Admission Date and Medicaid Coverage Start Date for Nursing Home Spells for Which Medicaid Coverage Commenced, 35 States (percentage of spells)
- FIGURE II.7: Relationship Betweenthe Percentage of Medicaid Long-Term Care Expenditures Allocated to HCBS and the Length of Nursing Home Spells for Aged Enrollees
- FIGURE II.8: Relationship Betweenthe Percentage of Medicaid Long-Term Care Recipients Using HCBS and the Length of Nursing Home Spells for Aged Enrollees
- FIGURE III.1: Length of First New ICF/IID Spells among Enrollees Who Were Aged or Disabled with New Medicaid-Financed ICF/IID Spells
- FIGURE III.2: Relationship Betweenthe Percentage of Medicaid Long-Term Care Expenditures Allocated to HCBS and the Percentage of Short ICF/IID Spells
- FIGURE III.3: Relationship Betweenthe Percentage of Medicaid Long-Term Care Recipients Using HCBS and the Percentage of Short ICF/IID Spells
- LIST OF TABLES
- TABLE II.1: Medicaid FFS Nursing Home Use among Medicaid Enrollees Who Were Aged or Had Disabilities and Eligible for Full Medicaid Benefits, July 2008-December 2009
- TABLE II.2: Percentage Changes in Number of Medicaid Enrollees Who Were Aged or Had Disabilities with New FFS Nursing Home Use from 2001-2002 to 2008-2009
- TABLE II.3: Characteristics of Aged or Disabled Enrollees with New Medicaid-Financed Nursing Home Spells Between July 2008 and December 2009
- TABLE II.4: MAS in the 2 Months Preceding the First New Medicaid-Financed Nursing Home Spells of Aged or Disabled Enrollees Between July 2008 and December 2009
- TABLE II.5: MAS in First Month of New Medicaid-Financed Nursing Home Spell Among Aged or Disabled Enrollees Eligible for Full Medicaid Benefits Began, July 2008-December 2009
- TABLE II.6: Transitions in MAS at the Start of First New Nursing Home Spells Between July 2008 and December 2009
- TABLE II.7: HCBS Use among Enrollees Who Were Aged or Had Disabilities and Had New Nursing Home Spells Between July 2008 and December 2009
- TABLE II.8: Change in the Percentage of Very Short and Very Long Nursing Home Stays Associated with Increases in State Policy Variables for Medicaid Enrollees Aged 65+
- TABLE III.1: Medicaid FFS ICF/IID Use among Enrollees Who Were Aged or Disabled Eligible for Full Medicaid Benefits, July 2008-December 2009
- TABLE III.2: Characteristics of Enrollees Who Were Aged or Disabled with New ICF/IID Spells, or Both New ICF/IID and Nursing Home Spells, July 2008-December 2009
- TABLE III.3: MAS in First Month of First New Medicaid-Financed ICF/IID Spell among Enrollees Who Were Aged or Disabled and Eligible for Full Medicaid Benefits, July 2008-December 2009
- TABLE III.4: MAS in the 2 Months Preceding the First New Medicaid-Financed ICF/IID Spells for Enrollees Who Were Aged or Disabled, July 2008-December 2009
- TABLE III.5: Transitions in MAS at the Start of First New Medicaid-Financed ICF/IID Spell Between July 2008 and December 2009
- TABLE III.6: Use of Nursing Homes and ICFs/IID by Enrollees Who Were Aged or Disabled and Who Have Multiple New Spells of Care, July 2008-December 2009
- TABLE III.7: HCBS Use among Enrollees Who Were Aged or Disabilities with New ICF/IID Spells Between July 2008 and December 2009
- TABLE C.1: Medicaid Analytic Extract State-Specific Data Anomalies, 2009
- TABLE D.1: Length of First New Nursing Home Spells among Medicaid Enrollees Who Were Aged or Had Disabilities with New Medicaid-Financed Nursing Home Spells, by State
- TABLE D.2: Length of First New Nursing Home Spells among Medicaid Enrollees Who Are Aged or Have Disabilities with New Medicaid-Financed Nursing Home Spells, by State and Medicare SNF Status
- TABLE D.3: Comparison of Length of First New Nursing Home Spells among Medicaid Enrollees Who Are Aged or Have Disabilities Based on Admission Date and Medicaid Coverage Start Date, for 35 States with Reliable Admission Dates
- TABLE D.4: Difference in Admission Date and Medicaid State Date of First New Nursing Home Spells among Medicaid Enrollees Who Are Aged or Have Disabilities with New Medicaid-Financed Nursing Home Spells, 35 States
- TABLE D.5: HCBS Use among Medicaid Enrollees Who Were Aged or Had Disabilities with New Nursing Home Spells Between July 2008 and December 2009, by State
- TABLE D.6: Length of First New ICF/IID Spells among Medicaid Enrollees Who Are Aged or Have Disabilities with New Medicaid-Financed ICF/IID Spells, by State
- TABLE D.7: Use of Nursing Homes and ICFs/IID by Medicaid Enrollees Who Are Aged or Have Disabilities with Multiple Spells Between July 2008 and December 2009
- TABLE D.8: HCBS Use among Enrollees Who Are Aged or Have Disabilities with ICF/IID Spells Between July 2008 and December 2009, by State
ACRONYMS
The following acronyms are mentioned in this report and/or appendices.
| Acronyms | |
| ASPE | U.S. Department of Health and Human Services, Office of the Assistant Secretary for Planning and Evaluation |
| BOE | Basis of Eligibility |
| CMS | Centers for Medicare and Medicaid Services |
| FFS | Fee-For-Service |
| FY | Fiscal Year |
| HCBS | Home and Community-Based Services |
| ICF/IID | Intermediate Care Facility for Individuals with Intellectual Disabilities |
| ID | MSIS Individual Identifier |
| ID/DD | Intellectual and/or Developmental Disabilities |
| ILTC | Institutional Long-Term Care |
| KCMU | Kaiser Commission on Medicaid and the Uninsured |
| LT | MAX Long-Term Care File |
| LTSS | Long-Term Services and Supports |
| MAS | Maintenance Assistance Status |
| MAX | Medicaid Analytic eXtract |
| MDS | Minimum Data Set |
| MSIS | Medicaid Statistical Information System |
| PACE | Program of All-Inclusive Care for the Elderly |
| PS | MAX Person Summary File |
| SNF | Skilled Nursing Facility |
| SSI | Supplemental Security Income |
| USCF | University of California, San Francisco |
EXECUTIVE SUMMARY
Through an analysis of Medicaid enrollment and long-term care claims data, this report seeks to provide researchers and policymakers with information on the characteristics of institutionalized enrollees, their stays, and the interaction of institutional services and home and community-based services (HCBS).1 To better understand the population of Medicaid enrollees living in nursing homes or intermediate care facilities for individuals with intellectual disabilities (ICFs/IID), we analyzed data from the Medicaid Analytic eXtract from 2008 and 2009 to address the following two sets of research questions:
-
What are the characteristics of enrollees remaining in nursing homes and ICFs/IID and their stays?
- How many enrollees had new spells of nursing home care or ICF/IID care?
- How did the number of enrollees with new spells of nursing home care change over time?
- What were the demographic characteristics of enrollees who used nursing home or ICF/IID care?
- How did enrollees residing in nursing homes or ICFs/IID become eligible for Medicaid?
- How long do spells of Medicaid-financed nursing home or ICF/IID care last?
- How long do enrollees live in nursing homes before Medicaid coverage begins?
- Did enrollees receiving nursing home or ICF/IID care also use HCBS before or after their institutional stay?
- How many enrollees used both nursing home and ICF/IID care?
-
How does the length of institutional spells vary at the state level with changes in state constraints and policies? State-level variables examined included the following:
- The percentage of Medicaid long-term care spending allocated to HCBS.
- The percentage of Medicaid long-term care recipients using HCBS.
Key findings from the analysis of enrollees living in nursing homes included the following:
-
In 2008-2009, among the 12.5 million aged or disabled Medicaid enrollees in our analysis sample, 12 percent received Medicaid-financed nursing home care between July 2008 and December 2009. Of those enrollees receiving nursing home care during this period, about 46 percent started new nursing home spells. Relative to the 2001-2002 period studied by Wenzlow et al. (2008) and the 2006-2007 period studied by Ballou et al. (2013), the number of Medicaid enrollees with new nursing home spells in 2008-2009 declined.
-
Most enrollees with Medicaid-financed nursing home stays tended to have either stays that lasted less than three months (35 percent) or stays that lasted for over a year (40 percent), indicating a mix of residents some of whom likely needed only temporary care (for example, post-acute cases) and others who required long-term access to nursing and medical services. Additional analysis indicates that a small percentage of new nursing home spells were covered under the Medicare skilled nursing facility benefit, introducing a slight downward bias in the length of Medicaid-financed nursing home spells.
-
A significant number of enrollees with new spells (30 percent) were not enrolled in Medicaid prior to the beginning of their Medicaid-financed spell, at which point approximately half (49 percent) qualified for benefits under "other" eligibility criteria--which include the 300 percent rule--while most others qualified under cash assistance-related or medically needy provisions. One possible explanation for this finding is that many enrollees had incomes that were higher than the Supplemental Security Income standard prior to beginning their Medicaid-financed spells, and some were already residing in the nursing home, paying for services through Medicare, private insurance, or out-of-pocket. Further investigation of the length of spells based on facility admission dates (rather than Medicaid coverage start dates) supports this theory. We found that nursing home admission dates preceded the start of Medicaid coverage for nursing home care for some spells in the 35 states that reported facility admission dates, with about 21 percent of nursing home spells starting more than three months prior to the start of Medicaid coverage.
-
We also found that a substantial minority of enrollees with new spells also used HCBS at some point during 2008 or 2009. Among those with spells of six months or less, 31 percent used HCBS prior to receiving nursing home services, while more than one in four used HCBS following discharge. This suggests the possibility that a significant number of enrollees with nursing home stays used HCBS and institutional care in an integrated fashion and therefore that single-point of entry or "no wrong door" approaches to allowing individuals to access long-term services and supports--as embodied by the Aging and Disability Resource Centers and other approaches--could be particularly valuable in helping individuals and their family members navigate the system of long-term care as their needs change over time.
-
Although the percentage of nursing home spells lasting three months or less was generally higher in states with larger investments in HCBS relative to nursing homes and higher HCBS utilization rates, these associations were not especially large. The small associations are not surprising, given the many variables that determine both length-of-stay and HCBS use that were not considered here. It is likely that further analysis of the relationship between patterns of HCBS and nursing home use at the person level, as explained by individual enrollees' distinct characteristics and needs, will yield results with a clearer interpretation.
Key findings from the analysis of enrollees living in ICFs/IID included the following:
-
New ICF/IID spells are not as common as new spells of nursing home care. Of the over 90,000 Medicaid enrollees with ICF/IID spells of care during the study period, only 9 percent had new spells of care. States varied in the number of spells and the number of new spells, with three states reporting less than ten enrollees in an ICF/IID, and Texas reporting over 12,000. These state-level differences reflect not only population differences, but also different state policies with respect to long-term care. The majority (72 percent) of new ICF/IID stays lasted more than one year, and more than 40 percent used HCBS either before or after their first new spell.
-
ICF/IID enrollees differ from nursing home enrollees, in that they are more likely to be male, under 65, and eligible for Medicaid via the cash assistance pathway, and enrolled in Medicaid prior to their first spell of ICF/IID care. We did not find a statistically significant relationship between lengths of ICF/IID spells and state policy variables.
-
Medicaid enrollees that use ICFs/IID often use HCBS before or after their stay. About 39 percent of new spells beginning in 2009 were preceded by Medicaid HCBS use in 2008. Looking at 2009 stays that ended June 30, 2009, 41 percent used HCBS after discharge.
-
Overall, our findings based on 2009 data are consistent with the results reported based on 2006 data, even though these two reports are based on a slightly different mix of states. We did see notable decreases in percentage of enrollees with first new ICF/IID spell followed by a nursing home spells and in HCBS use among aged or enrollees with disabilities.
I. BACKGROUND AND OBJECTIVES
Although states have continued to re-balance their long-term care systems toward a greater emphasis on home and community-based services (HCBS), many low-income elderly, persons with physical disabilities, and persons with ID/DD continue to reside in institutions such as nursing homes or intermediate care facilities for individuals with intellectual disabilities (ICFs/IID). Through an analysis of Medicaid enrollee and long-term care claims data, this report seeks to provide researchers and policymakers with information on the characteristics of these enrollees, their stays, and the interaction of institutional services and HCBS, building on the earlier work of Wenzlow et al. (2008) and Ballou et al. (2013) by using more recent data.
A. Role of Medicaid Institutional Services in Long-Term Care
Many elderly and persons with physical disabilities or ID/DD receive care in institutions. Nursing homes serve the needs of the elderly and people with disabilities who have difficulty performing activities of daily living, such as eating or dressing, and who often have complex medical needs that require continual access to skilled nursing and medical care. ICFs/IID serve individuals with ID/DD who require specialized care and lack the necessary supports to live comfortably in the community. Many nursing home and ICF/IID residents are low-income individuals whose care is financed by state Medicaid programs. Kaye et al. (2010) estimate that Medicaid paid nearly 70 percent of nursing home residents' expenditures in 2004, after excluding three-month periods following a hospitalization. Medicaid ICF/IID expenditures in fiscal year (FY) 2009 for approximately 91,000 residents totaled roughly $12.5 billion, or $137,000 per resident (Lakin et al. 2010).
Many states actively accommodate the desire of individuals requiring long-term services and supports (LTSS), including those with low incomes, to live in their communities. They do this by working to "re-balance" their long-term care systems, making HCBS more accessible to individuals who would otherwise qualify for institutional care. The increased emphasis on independent living for the elderly began with the establishment of Section 1915(c) waivers in the early 1980s. For people with developmental disabilities, the movement away from larger state-run ICFs/IID toward smaller group homes with a closer connection to the surrounding community began earlier. As Braddock et al. (1995) point out, by 1992, the number of people with ID/DD residing in large institutions had declined to 35 percent, from 71 percent just 15 years before. The U.S. Supreme Court provided further stimulus by ruling in Olmstead v. LC (1999) that unjustified segregation of persons with disabilities constitutes discrimination in violation of Title II of the Americans with Disabilities Act. The Court held that public entities must provide community-based services to persons with disabilities when: (1) such services are appropriate; (2) the affected persons do not oppose community-based treatment; and (3) community-based services can be reasonably accommodated, taking into account the resources available to the public entity and the needs of others who are receiving disability services from the entity. Although these principles apply to individuals of all ages and all types of disabilities, the majority of Olmstead lawsuits and settlements have addressed de-institutionalization of individuals with ID/DD and/or serious mental illness.
Despite the increased emphasis on community services, many Medicaid enrollees continue to receive services in institutions. In general, persons with severe functional or cognitive limitations and who lack informal support are more likely than others to reside in institutions (Gaugler et al. 2007). Residents of rural areas frequently have limited access to community care and so may be more likely than others to receive LTSS in institutional settings (Wiener, Anderson, and Brown 2009).
A better understanding of who uses institutional long-term care (ILTC) and how they use it is critical to the continued development of effective policy. Although re-balancing LTSS is an important and highly visible component of many states' long-term care strategies, progress has been uneven across states. The results reported in this study characterize state variation in the use of ILTC and in the typical length of Medicaid-covered nursing home and ICF/IID stays. Whether differences across states arise primarily from differences in need for care or from differences in the extent of state re-balancing cannot be ascertained at present.
B. Research Questions
To better understand the population of Medicaid enrollees qualifying for benefits on the basis of age or disability and living in nursing homes or ICFs/IID, we analyzed data from the Medicaid Analytic eXtract (MAX) from 2008 and 2009 to address the following two sets of research questions:
-
What are the characteristics of enrollees remaining in nursing homes and ICFs/IID and their stays?
- How many enrollees had new spells of nursing home care or ICF/IID care?
- How did the number of enrollees with new spells of nursing home care change over time?
- What were the demographic characteristics of enrollees who used nursing home or ICF/IID care?
- How did enrollees residing in nursing homes or ICFs/IID become eligible for Medicaid?
- How long do spells of Medicaid-financed nursing home or ICF/IID care last?
- How long do enrollees live in nursing homes before Medicaid coverage begins?
- Did enrollees receiving nursing home or ICF/IID care also use HCBS before or after their institutional stay?
- How many enrollees used both nursing home and ICF/IID care?
-
How does the length of institutional spells vary at the state level with changes in state constraints and policies? State-level variables examined included the following:
- The percentage of Medicaid long-term care spending allocated to HCBS.
- The percentage of Medicaid long-term care recipients using HCBS.
Given the differences in the characteristics and needs of the two populations, we performed the analyses separately by facility type (nursing home and ICF/IID), though we also examined enrollees who had stays at both types of facility. We also compare some of the findings reported here to those from the earlier report led by Ballou et al. (2013).
C. Summary of Data and Methods
This report draws on MAX data to construct a profile of Medicaid enrollees and their Medicaid-financed institutional stays (also referred to as spells) in 2008 and 2009.2 The MAX data set is a set of person-level data files on Medicaid eligibility, service utilization, and payments. The sample includes all enrollees who were elderly or entitled on the basis of disability to full Medicaid benefits in 2008 or in 2009. Because some enrollees with disabilities qualify for benefits on a basis other than disability, it is important to note that references to enrollees with disabilities in this report indicate only those enrollees with a basis of eligibility (BOE) code in the MAX data corresponding to persons with disabilities.
To construct spells of care, we examined the beginning and end dates of contiguous claims for nursing home and ICF/IID services contained in the MAX Long-Term Care file. Because a spell of long-term care can be interrupted by a hospitalization or for other reasons, we defined "new" spells of care conservatively: a claim for institutional services was interpreted as triggering the beginning of a new spell only if the individual to whom the services were provided did not incur a claim for the same type of institutional service (for example, nursing home or ICF/IID) in the two months prior to the beginning of the claim. The first six months of 2008 were reserved as a look-back period, allowing us to examine aspects of enrollees' experience prior to their Medicaid-financed spell of institutional care.3 This definition of a spell follows the approach adopted by Wenzlow et al. (2008) and Ballou et al. (2013) in their earlier work.
Medicaid spells thus refer to the span of time during which claims were submitted to and paid by Medicaid. In many cases, the actual stay began earlier, prior to the Medicaid-financed portion, as commonly occurs when an individual enters a nursing home as a private-payer but then spends down assets to Medicaid eligibility levels. For example, an individual who resided in a nursing home from November 1, 2008, through June 30, 2009, but who had Medicaid claims for nursing home services only from June 1, 2009, through June 30, 2009, would only be considered to have had a one-month (Medicaid-financed) spell of nursing home care in our analysis, even though that individual was actually institutionalized for eight months. Analyses reported in Chapter II examine the typical span of time between nursing home admission and the inception of Medicaid coverage in those states in which Medicaid claims reliably report the date of nursing home admission.
Analyses were carried out in those states where fee-for-service (FFS) claims data were both complete and believed to be reliable. Eight states were therefore excluded from all analyses: Arizona, Hawaii, Maine, Minnesota, New Mexico, Oregon, Tennessee, and Wisconsin. In addition, analyses of state policy variables, several of which related to HCBS spending and utilization at the state level, excluded four other states that are believed to have unreliable HCBS data: Massachusetts, Michigan, Montana, and Rhode Island.
A more detailed discussion of the MAX data and methods used to construct the analytic file and perform the analysis, along with their limitations, is in Appendix B.
In the following chapters, we separately discuss the characteristics of nursing home (Chapter II) and ICF/IID (Chapter III) residents and their Medicaid-financed spells of care. We also examine in each chapter how the percentages of stays that are very short (less than three months) or very long (more than one year) vary across states with changes in policy-related variables such as the percentage of enrollees of Medicaid-financed long-term care who used HCBS. In Chapter IV, we discuss policy implications and directions for future research.
II. CHARACTERISTICS OF ENROLLEES USING NURSING HOME SERVICES AND THEIR SPELLS OF CARE
As use of HCBS has grown in recent years and rates of institutional care have declined, policymakers are interested in understanding which Medicaid enrollees continue to receive care in nursing homes and the characteristics of their nursing home stays and pathways to Medicaid eligibility. In this chapter, we examine the characteristics of nursing home enrollees and their spells of Medicaid-financed nursing care, focusing on those enrollees who began new spells during the 18-month period from July 2008 through December 2009. We compare our findings to similar analyses conducted using data from July 2001-December 2002 and July 2006-December 2007. We also examine how the characteristics of these nursing home stays differ across key subsets of these spells. To explore how the length of these institutional stays might be related to rates of HCBS use, we also measured the association between the percentage of an individual state's institutional spells that lasted less than three months and measures of HCBS use in a state.
A. Characteristics of Enrollees Using Nursing Home Services
1. How Many Enrollees Received Nursing Home Care?
Of the 12.5 million Medicaid enrollees living in the 43 selected study states who were elderly or eligible on the basis of disability, almost 12 percent received Medicaid-financed nursing home care between July 2008 and December 2009 (Table II.1). This rate is similar to the rate of 13 percent of enrollees found by Ballou et al. (2013) using data from 2006 and 2007 and a slightly different group of states. This rate ranged from less than 8 percent of enrollees in Alaska, California, the District of Columbia, and South Carolina to more than 25 percent of enrollees in Connecticut and North Dakota (Figure II.1). Thus, relatively few aged and disabled Medicaid enrollees received nursing home care.
About 677,253 of the enrollees who received nursing home care between July 2008 and December 2009, or just over 5 percent of all Medicaid enrollees who were aged or had disabilities, had at least one new spell of nursing home care during this period.4 This rate is also similar to the rate of almost 6 percent found using data from 2006 and 2007 (Ballou et al. 2013). In a few states, including Alaska, California, and South Carolina, this rate was as low as 3 percent or less of enrollees who were aged or had disabilities. At the other end of the range, enrollees with new spells accounted for at least 11 percent of all enrollees who were aged or had disabilities in Connecticut and North Dakota, consistent with the overall higher rates of nursing home use in these states.
| State | Total Number ofAged and Disabled Enrollees | Number of Enrolleeswith Nursing Home Spells | Percentage of Enrolleeswith Nursing Home Spells | Number of Enrolleeswith New NursingHome Spells | Percentage of Enrolleeswith New NursingHome Spells | Percentage of NursingHome Enrollees withNew Nursing Home Spells |
| All 43 states | 12,594,903 | 1,477,137 | 11.7 | 677,253 | 5.4 | 45.8 |
| SOURCE: Mathematica analysis of 2008-2009 MAX data for 42 states and the District of Columbia with representative FFS nursing home data (excludes data from Arizona, Hawaii, Maine, Minnesota, New Mexico, Oregon, Tennessee, and Wisconsin). NOTE: New spells are spells beginning on or after July 1, 2008. | ||||||
| Alabama | 228,763 | 26,745 | 11.7 | 10,100 | 4.4 | 37.8 |
| Alaska | 24,917 | 1,120 | 4.5 | 625 | 2.5 | 55.8 |
| Arkansas | 160,807 | 19,678 | 12.2 | 7,499 | 4.7 | 38.1 |
| California | 2,033,361 | 137,190 | 6.7 | 73,307 | 3.6 | 53.4 |
| Colorado | 137,853 | 16,575 | 12.0 | 7,638 | 5.5 | 46.1 |
| Connecticut | 122,572 | 31,965 | 26.1 | 13,767 | 11.2 | 43.1 |
| Delaware | 26,222 | 4,028 | 15.4 | 1,648 | 6.3 | 40.9 |
| District of Columbia | 51,159 | 3,860 | 7.5 | 2,041 | 4.0 | 52.9 |
| Florida | 791,125 | 77,467 | 9.8 | 39,694 | 5.0 | 51.2 |
| Georgia | 359,347 | 41,041 | 11.4 | 17,617 | 4.9 | 42.9 |
| Idaho | 49,347 | 5,135 | 10.4 | 2,546 | 5.2 | 49.6 |
| Illinois | 517,590 | 82,201 | 15.9 | 37,455 | 7.2 | 45.6 |
| Indiana | 213,873 | 40,589 | 19.0 | 19,392 | 9.1 | 47.8 |
| Iowa | 110,053 | 20,045 | 18.2 | 8,372 | 7.6 | 41.8 |
| Kansas | 100,660 | 16,152 | 16.0 | 7,464 | 7.4 | 46.2 |
| Kentucky | 270,502 | 29,750 | 11.0 | 15,243 | 5.6 | 51.2 |
| Louisiana | 259,312 | 30,588 | 11.8 | 14,443 | 5.6 | 47.2 |
| Maryland | 184,400 | 25,723 | 13.9 | 11,060 | 6.0 | 43.0 |
| Massachusetts | 412,281 | 55,105 | 13.4 | 28,261 | 6.9 | 51.3 |
| Michigan | 464,112 | 48,058 | 10.4 | 22,975 | 5.0 | 47.8 |
| Mississippi | 193,100 | 21,552 | 11.2 | 9,338 | 4.8 | 43.3 |
| Missouri | 300,722 | 42,833 | 14.2 | 19,879 | 6.6 | 46.4 |
| Montana | 30,374 | 5,546 | 18.3 | 2,468 | 8.1 | 44.5 |
| Nebraska | 60,216 | 12,228 | 20.3 | 5,806 | 9.6 | 47.5 |
| Nevada | 51,786 | 5,092 | 9.8 | 2,562 | 4.9 | 50.3 |
| New Hampshire | 37,355 | 7,937 | 21.2 | 3,511 | 9.4 | 44.2 |
| New Jersey | 314,178 | 46,786 | 14.9 | 20,382 | 6.5 | 43.6 |
| New York | 1,179,772 | 152,430 | 12.9 | 57,672 | 4.9 | 37.8 |
| North Carolina | 463,381 | 46,490 | 10.0 | 22,594 | 4.9 | 48.6 |
| North Dakota | 18,988 | 5,388 | 28.4 | 2,203 | 11.6 | 40.9 |
| Ohio | 520,136 | 89,969 | 17.3 | 42,296 | 8.1 | 47.0 |
| Oklahoma | 171,452 | 22,538 | 13.1 | 9,624 | 5.6 | 42.7 |
| Pennsylvania | 774,899 | 89,935 | 11.6 | 39,350 | 5.1 | 43.8 |
| Rhode Island | 66,073 | 10,784 | 16.3 | 4,312 | 6.5 | 40.0 |
| South Carolina | 230,958 | 18,127 | 7.8 | 8,226 | 3.6 | 45.4 |
| South Dakota | 25,185 | 6,243 | 24.8 | 2,610 | 10.4 | 41.8 |
| Texas | 898,873 | 104,016 | 11.6 | 45,523 | 5.1 | 43.8 |
| Utah | 55,953 | 5,682 | 10.2 | 3,005 | 5.4 | 52.9 |
| Vermont | 32,531 | 3,952 | 12.1 | 1,960 | 6.0 | 49.6 |
| Virginia | 235,899 | 30,052 | 12.7 | 14,299 | 6.1 | 47.6 |
| Washington | 267,887 | 21,468 | 8.0 | 11,729 | 4.4 | 54.6 |
| West Virginia | 133,233 | 12,452 | 9.3 | 5,608 | 4.2 | 45.0 |
| Wyoming | 13,696 | 2,622 | 19.1 | 1,149 | 8.4 | 43.8 |
Although only a small percentage of Medicaid enrollees who were aged or had disabilities had new nursing home spells, they accounted for about 46 percent of the enrollees who had a Medicaid-financed nursing home stay during this period, demonstrating a relatively high rate of entrance in Medicaid-financed nursing home stays. This pattern could result from shorter stays due to hospitalization, death, or admissions for post-acute care. The percentage of nursing home enrollees with new spells ranged somewhat across states, from less than 40 percent of enrollees in Alabama, Arkansas, and New York to over 55 percent in Alaska. The nine states in which at least half of nursing home enrollees had new spells were diverse, representing a mix of states based on geography, urbanicity, and sociodemographic characteristics.5
FIGURE II.1. Percentage of Medicaid Enrollees Who Were Aged or Had Disabilities Using Nursing Home Care, July 2008-December 2009
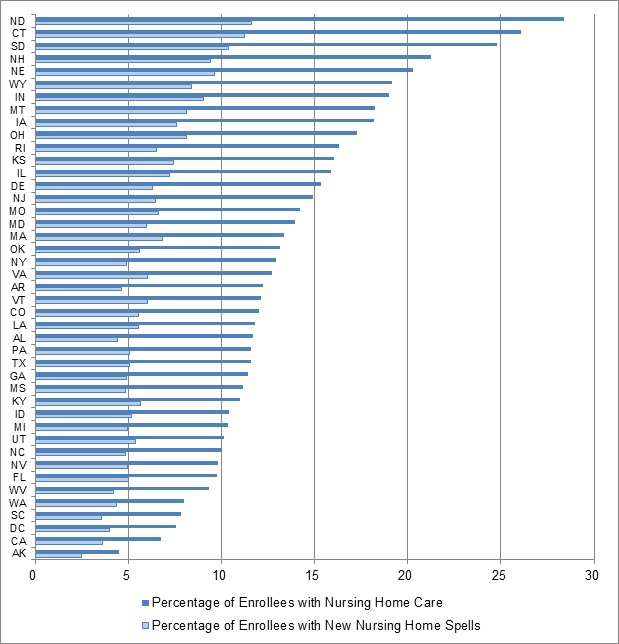
SOURCE: Mathematica analysis of 2008-2009 MAX data for 42 states and the District of Columbia with representative FFS nursing home data (excludes data from Arizona, Hawaii, Maine, Minnesota, New Mexico, Oregon, Tennessee, and Wisconsin).
NOTE: New spells are spells beginning on or after July 1, 2008.
2. How Did Nursing Home Utilization Change Over Time?
If HCBS offer a substitute for (or a method of delaying) nursing home care, then the expansion of HCBS programs over the previous decades might have contributed to changes in the number and characteristics of enrollees entering nursing homes. Expansions of HCBS might encourage individuals who previously lacked access to community-based options to enroll in Medicaid, while also allowing some individuals who would have previously been institutionalized to remain in their communities. As a result, both the number of enrollees who might become Medicaid long-term care users and the population and characteristics of enrollees living in nursing homes could change over time.
To assess changes in Medicaid-financed nursing home use over time, we compared the number of Medicaid enrollees who were aged or had disabilities with new nursing home spells in three time periods (2001-2002, 2006-2007, and 2008-2009) for 38 states with reliable data throughout all three time periods (Table II.2).6 In these 38 states, the number of enrollees with new nursing home spells dropped almost 6 percent from 2001-2002 to 2006-2007 and then remained stable in 2008-2009, representing an overall decline of about 6 percent during this period. This stabilization of the number of enrollees with new nursing home spells is of particular interest because it occurred in a period of economic hardship for individuals in many states and during a period when Medicaid enrollment among individuals who are aged or have disabilities was increasing. This stabilization may result from a variety of factors, including lower rates of nursing home entrance or lower rates of nursing home turnover at the end of the decade than at the beginning.
| State | Number of Medicaid Enrollees Who Are Aged or Have Disabilities with New Nursing Home Spells | ||
| % Change 2001-2002to 2006-2007 | % Change 2006-2007to 2008-2009 | % Change from 2001-2002to 2008-2009 | |
| All 38 states | -5.6 | 0.1 | -5.5 |
| SOURCE: Mathematica analysis of 2001-2002, 2006-2007, and 2008-2009 MAX data for 38 states with representative FFS nursing home data and ICF/IID data for all years (excludes data from Arizona, District of Columbia, Hawaii, Indiana, Maine, Michigan, Minnesota, New Hampshire, New Mexico, Oregon, Tennessee, Utah, and Wisconsin). NOTE: New spells are spells beginning between July 1, 2001 and December 31, 2002 (for 2001-2002 data), July 1, 2006 and December 31, 2007 (for 2006-2007 data), and July 1, 2008 and December 31, 2009 (for 2008-2009 data). | |||
| Alabama | -11.7 | -5.7 | -16.7 |
| Alaska | 69.1 | -23.3 | 29.7 |
| Arkansas | -9.5 | -3.0 | -12.2 |
| California | -1.4 | 3.9 | 2.4 |
| Colorado | -14.1 | 3.1 | -11.4 |
| Connecticut | -1.4 | -3.4 | -4.8 |
| Delaware | -6.2 | -0.3 | -6.5 |
| Florida | -24.5 | 7.3 | -19.0 |
| Georgia | -19.2 | 6.2 | -14.2 |
| Idaho | -19.9 | -1.2 | -20.8 |
| Illinois | 10.2 | -2.9 | 7.0 |
| Iowa | -11.1 | -0.5 | -11.6 |
| Kansas | -9.3 | 1.3 | -8.1 |
| Kentucky | 12.8 | -2.8 | 9.7 |
| Louisiana | -6.3 | 0.3 | -6.0 |
| Maryland | -7.2 | 1.7 | -5.7 |
| Massachusetts | -5.6 | 0.7 | -4.9 |
| Mississippi | 16.9 | -12.6 | 2.2 |
| Missouri | -2.5 | -0.5 | -3.0 |
| Montana | -11.6 | 2.7 | -9.3 |
| Nebraska | 0.6 | -1.4 | -0.8 |
| Nevada | -11.9 | -1.7 | -13.4 |
| New Jersey | -10.3 | 1.9 | -8.6 |
| New York | -13.2 | -4.4 | -17.0 |
| North Carolina | 15.8 | 0.1 | 16.0 |
| North Dakota | -15.5 | 0.1 | -15.5 |
| Ohio | 7.1 | -4.9 | 1.9 |
| Oklahoma | -17.3 | -9.7 | -25.3 |
| Pennsylvania | -5.1 | 4.7 | -0.6 |
| Rhode Island | 19.2 | -1.1 | 17.8 |
| South Carolina | -6.6 | 1.5 | -5.2 |
| South Dakota | -1.9 | -1.4 | -3.2 |
| Texas | -4.6 | -0.5 | -5.0 |
| Vermont | -10.3 | 6.5 | -4.5 |
| Virginia | -9.9 | 7.8 | -2.9 |
| Washington | -13.2 | 2.1 | -11.3 |
| West Virginia | -10.6 | 6.6 | -4.7 |
| Wyoming | -16.4 | 6.9 | -10.7 |
The 5.5 percent decline in new nursing home spells across all states was not characteristic of changes in individual states. From 2002 to 2009, the number of enrollees with new nursing home stays declined in 30 states; in 13 of these states the number with new spells dropped by at least 10 percent. The number with new nursing home spells increased in only eight states during this period, with only three states experiencing increases of more than 10 percent, including Alaska where the numbers using nursing home care are extremely small. This finding suggests an overall decline in new nursing home use over the decade, but without more information about the functional and cognitive needs of the typical nursing home enrollee and how the composition of the Medicaid population changed over this period, the full implications of these changes and explanations for the changes seen in specific states are difficult to interpret. In Alaska, for example, the number of enrollees with new nursing home spells increased by almost 30 percent from 2001-2002 to 2008-2009.7 Such changes could be the result of changes in the composition of the population of Medicaid enrollees who were aged or had disabilities as well as factors related to changes in nursing home and other Medicaid-financed long-term care use in this period, including differences in rates of HCBS use, variation in the number of transitions from nursing homes to the community, different rates of change in the health of the Medicaid population, and differences in the extent to which nursing homes are used for post-acute care as opposed to long-term care.
The decline in nursing home use occurred against a backdrop of increasing reliance on HCBS, suggesting that HCBS use contributed to this decline. Unfortunately, this relationship is impossible to demonstrate in a descriptive analysis. State Medicaid programs can enhance the availability of HCBS for any number of reasons. If HCBS use increases for reasons that are unrelated to the actual or expected use of institutional care, then no cause-effect inference can be drawn by comparing them. A preliminary assessment suggests that declines in the number of new nursing home spells from 2001-2002 to 2008-2009 were not obviously related to high rates of HCBS use in 2009. We compared changes in nursing home use for nine high-HCBS states with changes for all states during this time period.8 Four of the nine states (Colorado, Kansas, Nevada, and Washington) reported greater declines in new nursing home spells from 2001-2002 to 2008-2009 than the rate for all states, but the other five states either reported smaller declines than all states (Vermont and Virginia) or reported increases in the number of new spells (Alaska, California, North Carolina).
Comparison of these results with those of Ballou et al. (2013), indicate that new spells increased in Virginia (8 percent) and dramatically in the District of Columbia (40 percent) while declining in Alaska (-23 percent), Mississippi (-13 percent), and Oklahoma (-10 percent). The increase in new Medicaid nursing home stays in the District of Columbia cannot easily be reconciled with: (1) high and stable nursing home occupancy over the 2007-2009 period (CMS 2012); and (2) a moderate (6 percent) increase in the number of certified nursing home beds over the period (Harrington et al. 2010). The possibility remains, of course, that offsetting changes occurred for non-Medicaid nursing home stays.
3. Who are Nursing Home Entrants?
Consistent with previous findings, enrollees with new spells of nursing home care were likely to be older, White women. About 28 percent were at least 85 years old, with an additional 30 percent between ages 75 and 84 (Table II.3). Almost three-quarters were non-Hispanic White, and slightly less than two-thirds were female.
| Characteristic | Number or Percentage |
| SOURCE: Mathematica analysis of 2008-2009 MAX data for 42 states and the District of Columbia with representative FFS nursing home data (excludes data from Arizona, Hawaii, Maine, Minnesota, New Mexico, Oregon, Tennessee, and Wisconsin). NOTE: New spells are spells beginning on or after July 1, 2008. | |
| Number of enrollees with new spells in all states | 677,253 |
| Percentage female | 64.3 |
| Percentage non-Hispanic White | 73.2 |
| Age (Percentage of Subgroup) | |
| Under age 21 | 0.3 |
| 2144 years | 4.2 |
| 4564 years | 20.7 |
| 6574 years | 17.2 |
| 7584 years | 29.7 |
| 85 years and older | 27.9 |
| Percentage with multiple new spells | 6.6 |
| Percentage with spells in both nursing homes and ICFs/IID | 0.2 |
Relatively few enrollees with new nursing home stays (7 percent) had multiple spells of care during the 18-month study period window.
4. How Did New Nursing Home Entrants Become Eligible for Medicaid?
Nursing home care is expensive and some long-term nursing home residents who do not qualify for Medicaid prior to admission become Medicaid-eligible during their stay as they spend down their assets to pay for care. Other residents, however, receive Medicaid services prior to the beginning of their spell because they had another pathway to Medicaid eligibility. To understand how new nursing home entrants qualified for Medicaid, we examined their eligibility category, known as the maintenance assistance status (MAS) both two months prior to and at the beginning of their Medicaid-financed nursing home stays. Individuals may qualify for full Medicaid benefits under a wide array of MAS categories including cash assistance-related, medically-needy, poverty-related, Section 1115 demonstration waiver-related, or other eligibility criteria. Those qualifying under cash assistance-related criteria generally have incomes below the Supplemental Security Income (SSI) standard. Many states have medically-needy programs, in addition to or instead of the 300 percent rule, which allow individuals with higher incomes to "spend down" to Medicaid eligibility levels by offsetting their incomes against the costs of institutional care.9 States also have the option of extending Medicaid coverage to individuals with incomes above the SSI level and up to about 100 percent of the federal poverty level, called poverty-related eligibility. States may also obtain Section 1115 demonstration waivers to extend Medicaid coverage to individuals who would otherwise not be eligible. Finally, the "other" category includes a number of smaller categories of eligibles, including individuals who qualify under the 300 percent rule, which permits individuals with a level of need requiring institutionalization to qualify for Medicaid services if their income is less than 300 percent of the SSI standard. While it is common for states to have either a medically-needy program or use the 300 percent rule, a few states use both.
Roughly 30 percent of persons who began a Medicaid-covered spell of nursing home care between July 2008 and December 2009 were not enrolled in Medicaid two months prior to the start of the Medicaid spell. Variability in enrollment was considerable across the states, ranging from more than 50 percent in Montana who were not eligible prior to the stay to just 18 percent in the District of Columbia. The vast majority of individuals who were not enrolled in Medicaid prior to their first new spell of Medicaid-financed nursing home care qualified for benefits during their stay either through the "other" pathway (62 percent) or a medically-needy program (31 percent) (Table II.4). These persons may have been community residents who became eligible for Medicaid immediately upon nursing home entry or they may have been nursing home residents who were using their own resources to pay for their nursing home stay, and who became eligible for Medicaid having exhausted those resources.
Many new nursing home enrollees were enrolled in Medicaid prior to the start of their nursing home care. Across all states, about 23 percent of enrollees were enrolled in the "other" category prior to nursing home coverage (representing the most common category of enrollees in 15 states) and about 24 percent were enrolled in the cash assistance category (representing the largest group of enrollees in seven states). About 10 percent each were also covered under medically-needy and poverty-related eligibility criteria. Some individuals who qualified via the "other" criteria may have qualified through their participation in an HCBS waiver program.10
| State(by largest MAS group) | Percentage in MAS Group 2 Months Before First New Nursing Home Spell | ||||||
| Total Number ofEnrollees with NewNursing Home Spells | Not Enrolled | "Other" | Cash Assistance- Related | Medically- Needy | Poverty- Related | Section 1115 Demonstration Waiver | |
| All 43 states | 677,253 | 30.4 | 23.4 | 23.5 | 9.5 | 9.6 | 0.3 |
| SOURCE: Mathematica analysis of 2008-2009 MAX data for 42 states and the District of Columbia with representative FFS nursing home data (excludes data from Arizona, Hawaii, Maine, Minnesota, New Mexico, Oregon, Tennessee, and Wisconsin). Information about medically-needy, special income standards for institutional level-of-care, and Section 209(b) status from MAX 2009 Eligibility Anomaly Tables. NOTES: New spells are spells beginning on or after July 1, 2008.
| |||||||
| Not Enrolled | |||||||
| Montanaab | 2,468 | 52 | 10 | 17 | 17 | 0 | 0 |
| North Dakotaac | 2,203 | 49 | 1 | 13 | 25 | 7 | 0 |
| New Hampshireabc | 3,511 | 46 | 27 | 7 | 11 | 5 | 0 |
| Pennsylvaniaab | 39,350 | 45 | 25 | 14 | 3 | 8 | 0 |
| Wyomingb | 1,149 | 44 | 33 | 9 | 0 | 6 | 0 |
| South Dakotab | 2,610 | 43 | 23 | 19 | 0 | 10 | 0 |
| Marylandab | 11,060 | 41 | 2 | 19 | 28 | 5 | 0 |
| Rhode Islandab | 4,312 | 41 | 21 | 20 | 9 | 3 | 2 |
| Michiganab | 22,975 | 39 | 17 | 16 | 6 | 18 | 0 |
| Delawareb | 1,648 | 38 | 20 | 21 | 0 | 15 | 1 |
| Kansasab | 7,464 | 38 | 38 | 11 | 3 | 6 | 0 |
| Ohiobc | 42,296 | 37 | 37 | 17 | 0 | 5 | 0 |
| Oklahomabc | 9,624 | 37 | 33 | 12 | 0 | 15 | 0 |
| West Virginiaab | 5,608 | 37 | 30 | 19 | 5 | 6 | 0 |
| Nebraskaab | 5,806 | 37 | 0 | 16 | 22 | 23 | 0 |
| New Jerseyab | 20,382 | 36 | 32 | 17 | 4 | 6 | 0 |
| Floridaab | 39,694 | 35 | 33 | 17 | 1 | 10 | 2 |
| Arkansasab | 7,499 | 33 | 28 | 24 | 0 | 11 | 0 |
| Utahab | 3,005 | 31 | 29 | 15 | 10 | 12 | 0 |
| Massachusettsa | 28,261 | 29 | 8 | 25 | 13 | 20 | 2 |
| "Other" | |||||||
| Indianac | 19,392 | 27 | 53 | 11 | 0 | 6 | 0 |
| Missouric | 19,879 | 32 | 46 | 18 | 0 | 1 | 0 |
| South Carolinab | 8,226 | 25 | 44 | 17 | 0 | 12 | 0 |
| Louisianaab | 14,443 | 27 | 44 | 15 | 2 | 9 | 0 |
| Washingtonab | 11,729 | 29 | 44 | 18 | 6 | 2 | 0 |
| Georgiaab | 17,617 | 27 | 42 | 20 | 0 | 7 | 0 |
| Connecticutabc | 13,767 | 31 | 42 | 9 | 10 | 5 | 0 |
| Iowaab | 8,372 | 40 | 41 | 10 | 2 | 2 | 0 |
| Mississippib | 9,338 | 19 | 41 | 24 | 0 | 14 | 1 |
| Idahob | 2,546 | 30 | 38 | 26 | 0 | 3 | 0 |
| Nevadab | 2,562 | 26 | 38 | 26 | 0 | 7 | 0 |
| Virginiaabc | 14,299 | 29 | 36 | 21 | 4 | 7 | 0 |
| Texasab | 45,523 | 28 | 31 | 27 | 0 | 11 | 0 |
| Vermontab | 1,960 | 24 | 29 | 17 | 17 | 1 | 11 |
| Cash Assistance | |||||||
| Alaskab | 625 | 19 | 12 | 67 | 0 | 1 | 0 |
| Californiaa | 73,307 | 20 | 3 | 48 | 14 | 14 | 0 |
| Kentuckyab | 15,243 | 23 | 30 | 39 | 2 | 5 | 0 |
| Coloradob | 7,638 | 32 | 24 | 39 | 0 | 2 | 0 |
| Alabamab | 10,100 | 29 | 13 | 35 | 0 | 19 | 0 |
| New Yorka | 57,672 | 30 | 1 | 33 | 28 | 3 | 1 |
| North Carolinaa | 22,594 | 25 | 0 | 28 | 19 | 26 | 0 |
| Medically-Needy | |||||||
| Illinoisac | 37,455 | 19 | 16 | 11 | 41 | 11 | 0 |
| District of Columbiaa | 2,041 | 18 | 18 | 26 | 27 | 10 | 0 |
When the analysis shifts to examine Medicaid eligibility during the first month of the Medicaid-financed nursing home spell, we found that more enrollees qualified for Medicaid services during the first month of their Medicaid-financed spell via the "other" MAS category than any other eligibility category. In 33 of 43 states, "other" was the most common eligibility category at the start of the Medicaid-financed nursing home stay, with at least 70 percent of all new nursing home enrollees receiving benefits under this category in 20 states (Table II.5). For all states together, just under half of all enrollees qualified for benefits through the "other" category, compared with 22 percent who qualified via the cash assistance criterion and 22 percent who qualified through a medically-needy program. Of the 33 states in which "other" was the most common way of qualifying for benefits, 30 had adopted the 300 percent rule, making it likely that many of the "other" enrollees actually qualified via this rule.11
| States(by largest MAS group) | Total Number ofEnrollees with NewNursing Home Spells | Percentage in MAS Group at Start of First New Nursing Home Spell | ||||
| "Other" | Cash Assistance- Related | Medically- Needy | Poverty- Related | Section 1115 Demonstration Waiver | ||
| All 43 states | 677,253 | 49.1 | 22.0 | 21.6 | 7.0 | 0.3 |
| SOURCE: Mathematica analysis of 2008-2009 MAX data for 42 states and the District of Columbia with representative FFS nursing home data (excludes data from Arizona, Hawaii, Maine, Minnesota, New Mexico, Oregon, Tennessee, and Wisconsin). Information about medically-needy, special income standards for institutional level-of-care, and Section 209(b) status from MAX 2009 Eligibility Anomaly Tables. NOTES: New spells are spells beginning on or after July 1, 2008.
| ||||||
| "Other" | ||||||
| Iowaab | 8,372 | 95 | 5 | 0 | 0 | 0 |
| Wyomingb | 1,149 | 88 | 10 | 0 | 2 | 0 |
| Indianac | 19,392 | 87 | 12 | 0 | 1 | 0 |
| Kansasab | 7,464 | 86 | 11 | 1 | 2 | 0 |
| Missouric | 19,879 | 85 | 15 | 0 | 0 | 0 |
| South Dakotab | 2,610 | 84 | 14 | 0 | 2 | 0 |
| Louisianaab | 14,443 | 83 | 11 | 5 | 0 | 0 |
| Oklahomabc | 9,624 | 82 | 7 | 0 | 11 | 0 |
| South Carolinab | 8,226 | 82 | 10 | 0 | 8 | 0 |
| Georgiaab | 17,617 | 81 | 18 | 0 | 0 | 0 |
| Ohiobc | 42,296 | 79 | 19 | 0 | 2 | 0 |
| Mississippib | 9,338 | 77 | 22 | 0 | 1 | 0 |
| Connecticutabc | 13,767 | 76 | 7 | 17 | 1 | 0 |
| Washingtonab | 11,729 | 75 | 12 | 12 | 1 | 0 |
| Delawareb | 1,648 | 74 | 20 | 0 | 5 | 0 |
| Pennsylvaniaab | 39,350 | 74 | 12 | 11 | 3 | 0 |
| New Hampshireabc | 3,511 | 73 | 6 | 20 | 2 | 0 |
| Floridaab | 39,694 | 72 | 18 | 0 | 7 | 3 |
| Texasab | 45,523 | 72 | 27 | 0 | 1 | 0 |
| Arkansasab | 7,499 | 71 | 24 | 1 | 5 | 0 |
| Idahob | 2,546 | 71 | 29 | 0 | 0 | 0 |
| Virginiaabc | 14,299 | 69 | 19 | 8 | 4 | 0 |
| West Virginiaab | 5,608 | 68 | 20 | 11 | 1 | 0 |
| Nevadab | 2,562 | 68 | 29 | 0 | 3 | 0 |
| Vermontab | 1,960 | 67 | 18 | 15 | 0 | 1 |
| New Jerseyab | 20,382 | 65 | 16 | 14 | 6 | 0 |
| Utahab | 3,005 | 63 | 16 | 12 | 9 | 0 |
| Alabamab | 10,100 | 60 | 30 | 0 | 10 | 0 |
| Kentuckyab | 15,243 | 55 | 40 | 3 | 2 | 0 |
| Coloradob | 7,638 | 55 | 45 | 0 | 0 | 0 |
| Montanaab | 2,468 | 50 | 16 | 34 | 0 | 0 |
| Michiganab | 22,975 | 48 | 16 | 12 | 24 | 0 |
| Rhode Islandab | 4,312 | 45 | 19 | 34 | 0 | 2 |
| Medically-Needy | ||||||
| North Dakotaac | 2,203 | 0 | 12 | 87 | 1 | 0 |
| Marylandab | 11,060 | 1 | 15 | 84 | 1 | 0 |
| New Yorka | 57,672 | 1 | 26 | 72 | 2 | 0 |
| Nebraskaab | 5,806 | 0 | 17 | 67 | 16 | 0 |
| Illinoisac | 37,455 | 20 | 11 | 60 | 9 | 0 |
| North Carolinaa | 22,594 | 0 | 23 | 45 | 32 | 0 |
| District of Columbiaa | 2,041 | 29 | 25 | 42 | 5 | 0 |
| Massachusettsa | 28,261 | 11 | 26 | 37 | 25 | 2 |
| Cash Assistance | ||||||
| Alaskab | 625 | 28 | 72 | 0 | 0 | 0 |
| Californiaa | 73,307 | 3 | 48 | 35 | 14 | 0 |
Other common pathways were state medically-needy or cash assistance programs. Medically-needy classifications were the most common pathway to benefits in eight states, with at least half qualifying under a medically-needy program in five of these states. Cash assistance recipients were the most common qualifying group in only two states but the second most common group in 33 other states. Although poverty-related expansions were not the most common pathway to eligibility in any state, qualifying via poverty-related criteria was more common in a few states that had adopted poverty-related expansions to Medicaid eligibility but not the 300 percent rule, such as California, Massachusetts, and North Carolina.
In almost all states, the MAS pathway with the largest number of enrollees at the start of nursing home spells was consistent with results from 2006-2007 data. Exceptions were Massachusetts, where the medically-needy pathway became the largest MAS group for enrollees in the first month of new nursing home care, and Montana, where the "other" pathway became the largest group in 2008-2009. In Massachusetts the shift may be the result of a new Medicaid data system that was implemented during this time period with MAS assignments shifting in the state following the implementation of the new system. Montana implemented a 300 percent rule in the period following the 2006-2007 analysis and this new program likely resulted in the greater number of enrollees in the "other" category. Otherwise, pathways to Medicaid enrollment for new nursing home entrants by state were very similar from 2006-2007 to 2008-2009.
Most of those who were enrolled in Medicaid under "other", cash assistance, or medically-needy criteria prior to a new nursing home stay retained the same eligibility criteria at the start of the nursing home spell (Table II.6). By comparison, sizeable numbers of those who were enrolled under poverty-related and Section 1115 waiver criteria moved to different eligibility categories (primarily "other" criteria) at the start of the nursing home spell, possibly reflecting limited coverage for institutional care under their initial coverage categories.12
| MAS Group 2 Months Before Start of Spell | Number in MASGroup 2 MonthsBefore Start of Spell | Percentage in MAS Group at Start of Spell | ||||
| "Other" | Cash Assistance- Related | Medically- Needy | Poverty- Related | Section 1115 Demonstration Waiver | ||
| SOURCE: Mathematica analysis of 2008-2009 MAX data for 42 states and the District of Columbia with representative FFS nursing home data (excludes data from Arizona, Hawaii, Maine, Minnesota, New Mexico, Oregon, Tennessee, and Wisconsin). NOTES: New spells are spells beginning on or after July 1, 2008. Totals may not add to 100% because status for some enrollees 2 months prior to start of spell could not be determined. | ||||||
| Not enrolled | 205,885 | 61.7 | 3.2 | 31.1 | 3.7 | 0.2 |
| "Other" | 158,477 | 95.9 | 1.0 | 2.0 | 1.1 | 0.0 |
| Cash assistance-related | 159,154 | 7.7 | 87.0 | 4.1 | 1.1 | 0.0 |
| Medically-needy | 64,339 | 5.7 | 1.5 | 91.5 | 1.3 | 0.0 |
| Poverty-related | 65,016 | 36.9 | 1.3 | 8.5 | 53.2 | 0.1 |
| Section 1115 demonstration waiver | 2,032 | 21.9 | 11.5 | 12.0 | 5.8 | 48.7 |
B. Characteristics of Enrollees' Nursing Home Spells
1. How Long Did New Entrants Stay in Nursing Homes?
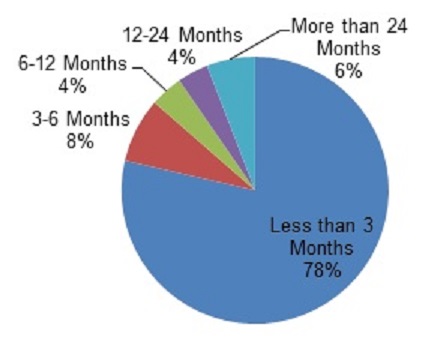
Three-quarters of enrollees with new spells of nursing home care had either very short stays or very long stays (Figure II.2), with 35 percent of all new nursing home enrollees discharged within three months of the beginning of the spell and 40 percent having spells of over one year.13 These results were consistent with findings from 2006-2007, suggesting that overall increases in HCBS use across states during the time period did not immediately affect lengths of new nursing home stays (Borck et al. 2014). The shorter stays are likely a combination of enrollees receiving some post-acute care, those who died shortly after admission, and those who were temporarily placed in institutional care because they could not be placed in a community setting.
FIGURE II.2. Length of First New Nursing Home Spells (beginning July 2008-December 2008) among Medicaid Enrollees Who Were Aged or Had Disabilities
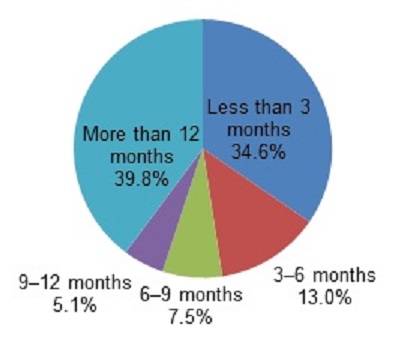
SOURCE: Mathematica analysis of 2008-2009 MAX data for 42 states and the District of Columbia with representative FFS nursing home data (excludes data from Arizona, Hawaii, Maine, Minnesota, New Mexico, Oregon, Tennessee, and Wisconsin).
NOTES: New spells in this figure are spells beginning between July 1, 2008, and December 31, 2008, inclusive; spells are censored at December 31, 2009. 234,463 enrollees had new nursing home spells beginning between July and December 2008. State-level detail is provided in Appendix Table D.1.
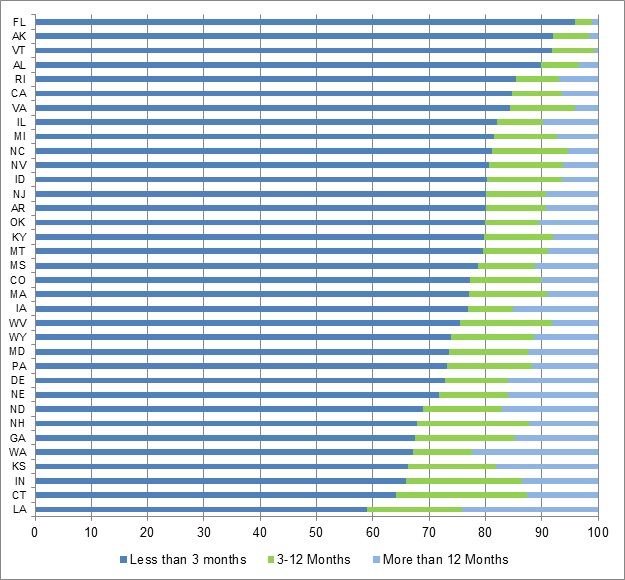
Across states, the percentage of new nursing home spells that were less than three months ranged considerably from less than one-quarter of spells in three states (Georgia, Iowa, and Maryland) to over half of new spells in Alaska and Utah. (Appendix Table D.1 shows state-specific results.). As with other variations across states in patterns in nursing home care these differences probably result from differences in state demographics and differences in state data reporting practices (in particular whether states report copayments for Medicare skilled nursing facility [SNF] stays) as well as in characteristics of the state's long-term care system, including available resources for care in the community and institutions, state policies, and historical factors. In Alaska, for example, the traditionally low rate of nursing home use and the small population of aged Medicaid enrollees help to explain the tendency for shorter nursing home spells in that state.
Given the complexity of comparing nursing home spell patterns across states, policymakers may be interested in understanding more about states that experienced a change in the lengths of new nursing home spells. From 2006-2007 to 2008-2009 both Florida and Mississippi reported changes in the lengths of new nursing home spells, with both states reporting fewer new spells that lasted less than three months and more spells that lasted at least three months, particularly spells lasting for more than a year.
What Proportion of New Nursing Home Spells Were Financed by the Medicare SNF Benefit?
As noted above, some of the new nursing home spells that end within three months may be spells that represent a need for short-term post-acute nursing home care. This type of nursing home care, consisting primarily of therapeutic interventions to increase functioning, represents a use of nursing homes that is distinct from the custodial care that is characteristic of most spells covered by Medicaid. We would not expect that efforts to increase rates of HCBS use and other nursing home related reforms would have the same implications for the two types of spells.
Although all of the nursing home spells in the MAX database involve Medicaid payment, some of the shorter spells may be largely paid for by Medicare. Such spells are difficult to identify without using Medicare as well as Medicaid claims. Lacking Medicare claims, we nevertheless attempted to identify new spells that appeared to have been financed by the Medicare SNF benefit with the goal of removing SNF-only stays, while retaining SNF stays that were coupled with a regular Medicaid nursing facility stay. For Medicaid enrollees who are dually enrolled in Medicare, the SNF benefit provides primary coverage for short-term nursing home stays that follow inpatient hospitalization.14 (See Appendix B for a description of how these spells were identified. Few states appeared to report Medicare co-insurance coverage for all nursing home claims in 2008. Consequently, Medicare-financed SNF stays in other states could not be reliably identified.15) We identified 10,796 new nursing home spells that started in the second half of 2008 and were covered under the Medicare SNF benefit (or about 5 percent of new spells in our analysis). Although these spells represent a small percentage of new spells, when they are removed from analysis the percentage of spells lasting more than 12 months increases from 40 percent to 42 percent of spells and the percentage of stays under three months decreases from 35 percent to 32 percent of spells (Figure II.3). This finding suggests that the inclusion of short-term post-acute care nursing home spells in our analysis likely biases the average length-of-stay downward.
FIGURE II.3. Length of First New Nursing Home Spells (beginning July 2008-December 2008) among Aged or Disabled Medicaid Enrollees with new Nursing Home Spells
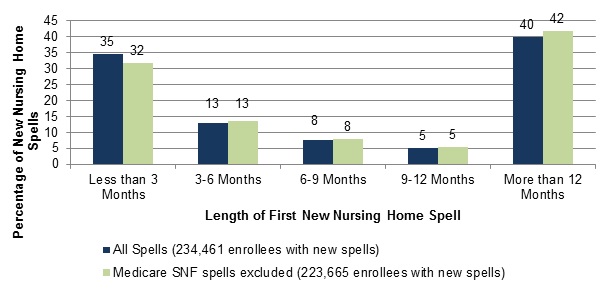
SOURCE: Mathematica analysis of 2008-2009 MAX data for 42 states and the District of Columbia with representative FFS nursing home data (excludes data from Arizona, Hawaii, Maine, Minnesota, New Mexico, Oregon, Tennessee, and Wisconsin).
NOTE: New spells in this figure are spells beginning between July 1, 2008, and December 31, 2008, inclusive; spells are censored at December 31, 2009.
In some states, the removal of Medicare-financed SNF-only spells had greater implications for the length of nursing home spells in the state than in other states. In seven states (Alaska, California, Connecticut, Delaware, Massachusetts, Utah, and Vermont) at least 15 percent of spells were excluded from the analysis when we removed the SNF spells (Appendix Table D.2). As a result, the percentage of nursing home spells lasting less than three months dropped by at least ten percentage points in each of these states. With the exception of Delaware, all of these states reported larger percentages of new stays lasting less than three months than the all-state rate for 2008-2009 and the relatively large number of Medicare SNF spells in the MAX data in these states, as indicated by the relatively greater declines in the number of spells in this analysis, may help to explain their higher rates of short-term stays. In addition to the eight states that reported no Medicare co-insurance payments, there were an additional 14 states where excluding Medicare SNF stays changed the percentage of short spells by less than one percentage point, suggesting few Medicare SNF stays in these states or, more likely, that there may be additional Medicare SNF stays remaining in the population of nursing home spells that cannot be identified in these states, producing a downward bias in spell length.16 This analysis suggests that the prevalence of Medicare SNF spells in the MAX data for each state may influence the percentage of new spells in that state that last three months or less. Nevertheless, in the seven states reporting the highest proportion of SNF-only stays, the percent of stays that were three months or less was substantial (ranging from 17 percent to 46 percent).
How Does Length of New Nursing Home Spells Vary When Based on Nursing Home Admission Date?
FIGURE II.4. Length-of-Stay (beginning July 2008-December 2008) among Nursing Home Spells for Which Medicaid Coverage Commenced
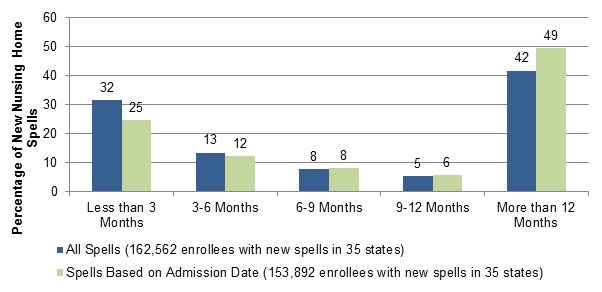
SOURCE: Mathematica analysis of 2008-2009 MAX data for 35 states with representative FFS nursing home data and nursing home admission dates (excludes data from Arizona, District of Columbia, Hawaii, Maine, Minnesota, Missouri, New Mexico, New York, Ohio, Oregon, South Carolina, South Dakota, Tennessee, Texas, Utah, and Wisconsin).
NOTES: Spells included in this figure are those for which Medicaid coverage commenced between July 1, 2008, and December 31, 2008, inclusive; spells are censored at December 31, 2008. Medicare SNF spells are excluded from this analysis. Spells with missing admission dates were excluded from the analysis based on admission date.
Another factor influencing the analyses of length of nursing home spells among Medicaid enrollees is the selected start date for new spells. Because our analysis focuses on Medicaid-financed nursing home care, we use the start of Medicaid coverage for nursing home care on Medicaid claims to mark the beginning of nursing home spells. We found, however, that a sizeable number of Medicaid enrollees with new nursing home spells were not enrolled in Medicaid two months before the start of the nursing home spell. We hypothesize that a number of these enrollees became eligible for Medicaid because they spent down their resources on nursing home care, suggesting that the actual start date for their nursing home spells predated the Medicaid payment start date.17 For the 35 states that reported nursing home admission dates in MAX, we re-assessed length-of-spells, using the admission date reported on the claim as the start of the spell (Figure II.4). For the population of spells for which Medicaid coverage started in the second half of 2008, spell lengths that were estimated based on admission date tended to be somewhat longer than spells based on Medicaid payment start dates, with 49 percent of admission date spells lasting more than 12 months, compared to 42 percent of spells based on Medicaid payment start date. Results in most states were consistent with the nationwide pattern (Appendix Table D.3).
FIGURE II.5. Time Lapsed (beginning July 2008-December 2008) Between Admission Date and Medicaid Coverage Start Date for Nursing Home Spells for Which Medicaid Coverage Commenced, 35 States
SOURCE: Mathematica analysis of 2008-2009 MAX data for 35 states with representative FFS nursing home data and nursing home admission dates (excludes data from Arizona, District of Columbia, Hawaii, Maine, Minnesota, Missouri, New Mexico, New York, Ohio, Oregon, South Carolina, South Dakota, Tennessee, Texas, Utah, and Wisconsin).
NOTES: Spells included in this figure are those for which Medicaid coverage commenced between July 1, 2008, and December 31, 2008, inclusive. Medicare SNF spells are excluded from this analysis. Spells with missing admission dates were excluded from the analysis based on admission date.
In most states, the time that lapsed between the admission date and start of Medicaid coverage was short for most enrollees.18 Across the 35 states that reported admission dates, Medicaid coverage started within three months of nursing home admission for almost 80 percent of the enrollees with nursing home stays for which Medicaid coverage started between July and December 2008 (Figure II.5). The median number of days between admission date and Medicaid start date for these spells was three days (Appendix Table D.4). As the median suggests, this distribution is heavily affected by the large percentage of spells in many states where the admission date was equal to the Medicaid coverage start date, including about 48 percent of spells in all 35 states. A Medicaid start date that is the same as the admission date would be expected for individuals who were enrolled in Medicaid when they entered the nursing facility. For about one in five enrollees, however, this time period was longer. These enrollees likely include the population of enrollees whose nursing home stays started before they were Medicaid enrollees. About 10 percent of enrollees were in a nursing home for at least a year before they started receiving Medicaid coverage for this care, including about 4 percent of enrollees whose nursing home stay lasted more than three years prior to Medicaid coverage. An additional 12 percent of enrollees were in nursing home care for three months to a year before Medicaid coverage started.
FIGURE II.6. Time Lapsed Between (beginning July 2008-December 2008) Admission Date and Medicaid Coverage Start Date for Nursing Home Spells for Which Medicaid Coverage Commenced, 35 States(percentage of spells)
SOURCE: Mathematica analysis of 2008-2009 MAX data for 35 states with representative FFS nursing home data and nursing home admission dates (excludes data from Arizona, District of Columbia, Hawaii, Maine, Minnesota, Missouri, New Mexico, New York, Ohio, Oregon, South Carolina, South Dakota, Tennessee, Texas, Utah, and Wisconsin).
NOTES: Spells included in this figure are those for which Medicaid coverage commenced between July 1, 2008, and December 31, 2008, inclusive. Medicare SNF spells are excluded from this analysis. Spells with missing admission dates were excluded from the analysis based on admission date. Accuracy of reported nursing home admission dates was not assessed.
The percentage of enrollees who received nursing home care for less than three months before Medicaid coverage started varied considerably across states, from 59 percent of enrollees in Louisiana to more than 90 percent in Alaska, Florida, and Vermont (Figure II.6 and Appendix Table D.4). Thus, in a state at the lower end of this range, like Louisiana, enrollees with new Medicaid coverage for nursing home care were more likely to have been receiving that care for several months before they received Medicaid coverage. These differences across states in the length of time from nursing facility admission to Medicaid start date may reflect differences related to nursing home use and Medicaid eligibility policies across states as well as differences in data reporting practices by nursing facilities and Medicaid agencies.19 This analysis also suggests that using the Medicaid start date as the beginning of the nursing home spell for most spells does not greatly shorten the estimated length of time in nursing homes but may underestimate average lengths of nursing home care, particularly in states with a greater-than-average fraction of spells starting more than three months prior to the start of Medicaid coverage.
2. Did Enrollees Who Entered Nursing Home Care Also Use HCBS?
Although HCBS are an alternative to nursing home care, HCBS and institutional services can be complementary services in an integrated system of care, with each type of service meeting a specific level of need. To understand the extent to which these services are used together, we examined patterns of HCBS use prior to and after a nursing home stay. As a benchmark, in 2009, about 20 percent of all Medicaid enrollees who were aged or had disabilities used any HCBS, across 38 states with reliable data (Borck et al. 2014). Of all enrollees with new nursing home spells in 2009, more than one in five (23 percent) used HCBS in 2008 (Table II.7), prior to their stay. Among those with shorter spells of nursing home care--beginning and ending during the first half of 2009--an even greater fraction (31 percent) had previously used HCBS. Similarly, 32 percent of enrollees with spells beginning and ending in the second half of 2008 used HCBS in the following year. These results represent slight increases in rates of HCBS use from our previous study (Ballou et al. 2013).
In many states, enrollees who start nursing homes spells also used HCBS. However, there was notable variation in these rates across states. (State-specific results are shown in Appendix Table D.5) For example, the percentage of first new spells in 2009 preceded by HCBS use in 2008 ranged from less than 10 percent of spells in three states (Florida, Louisiana, and Pennsylvania) to over 35 percent of spells in California and Idaho, two states that also reported lower than average rates of enrollees with nursing home stays (as shown in Table II.1). Similarly, the percentage of first new spells ending in 2008 that were followed by HCBS use in 2009 ranged from less than 15 percent in Pennsylvania to more than 45 percent in Connecticut, Idaho, and New York.20
| Timing of HCBS Use | Percentage |
| SOURCE: Mathematica analysis of 2008-2009 MAX data for 38 states and the District of Columbia with representative FFS nursing home data and reliable HCBS data (excludes data from Arizona, Hawaii, Maine, Massachusetts, Michigan, Minnesota, Montana, New Mexico, Oregon, Rhode Island, Tennessee, and Wisconsin). NOTES: New spells are spells beginning on or after July 1, 2008. HCBS includes Section 1915(c) waiver services, personal care services, residential care services, home health, adult day services, and private duty nursing services. Spells are censored at December 31, 2009. New spells beginning in 2009 preceded by HCBS use in 2008 refers to all spells beginning and ending at any time in 2009 (including spells censored as of December 31, 2009) that were associated with an enrollee who used HCBS at any time in 2008; the percentage is taken with respect to all first new spells beginning and ending (possibly censored) in 2009. The percentage of first new spells beginning in 2009 and ending on or before June 30, 2009 preceded by HCBS use in 2008 and the percentage of first new spells ending in 2008 followed by HCBS use in 2009 are defined analogously. State-level detail is provided in Appendix Table D.5. | |
| First new spells beginning in 2009 preceded by HCBS use in 2008 | 22.6 |
| First new spells beginning in 2009 and ending on or before June 30, 2009 preceded by HCBS Use in 2008 | 31.2 |
| First new spells ending in 2008 followed by HCBS Use in 2009 | 32.4 |
C. Associations Between Lengths of Stay in ICFs/IID and State Policy-Related Variables
Given states' efforts to re-balance their systems of LTSS toward greater provision of HCBS, it is natural to ask whether the length of nursing home stays in a state is related to the amount of HCBS that the state provides. We examined the relationship between length-of-stay and two different measures of balance: (1) the percentage of Medicaid long-term care expenditures allocated to HCBS; and (2) the percentage of Medicaid long-term care recipients who used HCBS. Although these associations may be informative to those who seek to improve long-term care services, we caution that causal relationships cannot be inferred from our findings.
In general, states that allocated a greater share of their Medicaid long-term care expenditures to HCBS or had higher HCBS participation rates had a greater proportion of short nursing home stays, although the magnitude of the measured associations was small. Increases of ten percentage points in each of the re-balancing measures were associated with an increase in the percentage of first new spells lasting less than three months of about three percentage points for enrollees aged 65 and over (Table II.8). There were corresponding decreases in the percentage of spells lasting more than 12 months.21 These findings are consistent with Wenzlow et al. (2008) and Ballou et al. (2013), who reached a similar conclusion using earlier data.
| Type of HCBS Change | Change in the Percentageof First New SpellsLasting Less Than 3 Months(percentage points) | Change in the Percentageof First New SpellsLasting More than 12 Months(percentage points) |
| SOURCE: Mathematica analysis of 2006-2007 MAX data for 38 states and the District of Columbia with representative FFS nursing home and reliable HCBS data (excludes data from Arizona, Hawaii, Maine, Massachusetts, Michigan, Minnesota, Montana, New Mexico, Oregon, Rhode Island, Tennessee, and Wisconsin). NOTES: New spells in this table are spells beginning between July 1, 2008 and December 31, 2008, inclusive; spells are censored at December 31, 2009. HCBS includes Section 1915(c) waiver services, personal care services, residential care services, home health, adult day services, and private duty nursing services. | ||
| A 10 percentage point increase in the percentage of Medicaid long-term care expenditures allocated to HCBS | +3.0 | -2.7 |
| A 10 percentage point increase in the percentage of Medicaid long-term care recipients using HCBS | +2.3 | -2.0 |
The interpretation of these relationships is difficult, primarily because these correlations do not represent causal relationships, as noted earlier. Greater spending on HCBS could reflect a state's commitment to providing services in the community to a broad population or more intensive services to a limited population, both of which would enable more elderly and individuals with disabilities to continue living in the community. Increased use of HCBS could plausibly lead to either shorter or longer stays among new nursing home entrants. First, if HCBS diverts people from nursing home care, the share of nursing home stays lasting three months or less might increase as long-term care users were either transitioned or diverted from nursing home care while individuals requiring shorter-term post-acute care continued to use nursing facilities. On the other hand, nursing home stays that were prevented by use of HCBS may have tended to be those stays that were shorter than average. Thus, the mean of the remaining nursing home stays would be greater than it would be if those prevented stays had been included. The results reported here suggest, on balance, a shortening rather than a lengthening of stays with increased expenditures on HCBS (Figure II.7).
Greater rates of HCBS utilization were also associated with somewhat shorter stays (Figure II.8). Although higher HCBS utilization rates could reflect an increase in the provision of HCBS as an alternative to institutional care, it is also possible that high utilization rates only reflects the health status of the Medicaid programs in states. States with higher HCBS utilization rates may have healthier populations that are easier to serve in the community whereas states with higher levels of frailty or disability have higher rates of institutionalization, something that we did not control for in this study.
FIGURE II.7. Relationship Between the Percentage of Medicaid Long-Term Care Expenditures Allocated to HCBS and the Length of Nursing Home Spells for Aged Enrollees
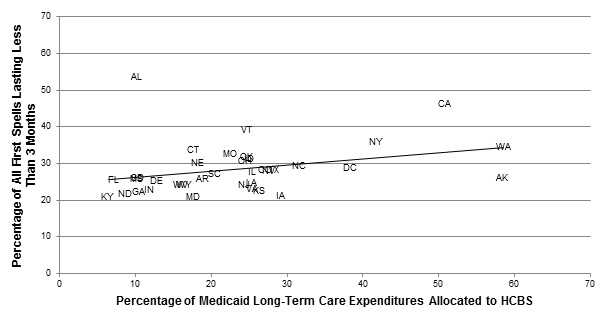
SOURCE: MAX, 2008-2009.
FIGURE II.8. Relationship Between the Percentage of Medicaid Long-Term Care Recipients Using HCBS and the Length of Nursing Home Spells for Aged Enrollees
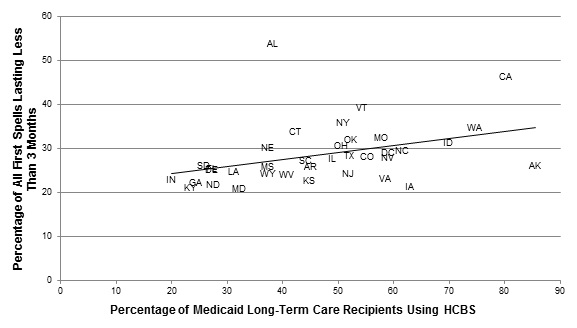
SOURCE: MAX, 2008-2009.
D. Summary of Nursing Home Findings
In 2008-2009, among the 12.5 million aged or disabled Medicaid enrollees in our analysis sample, 12 percent received Medicaid-financed nursing home care between July 2008 and December 2009. Of those enrollees receiving nursing home care during this period, about 46 percent started new nursing home spells. Relative to the 2001-2002 period studied by Wenzlow et al. (2008) and the 2006-2007 period studied by Ballou et al. (2013), the number of Medicaid enrollees with new nursing home spells in 2008-2009 declined.
Most enrollees with Medicaid-financed nursing home stays tended to have either stays that lasted less than three months (35 percent) or stays that lasted for over a year (40 percent), indicating a mix of residents some of whom likely needed only temporary care (for example, post-acute cases) and others who required long-term access to nursing and medical services. Additional analysis indicates that a small percentage of new nursing home spells were covered under the Medicare SNF benefit, introducing a slight downward bias in the length of Medicaid-financed nursing home spells.
A significant number of enrollees with new spells (30 percent) were not enrolled in Medicaid prior to the beginning of their Medicaid-financed spell, at which point approximately half (49 percent) qualified for benefits under "other" eligibility criteria--which include the 300 percent rule--while most others qualified under cash assistance-related or medically-needy provisions. One possible explanation for this finding is that many enrollees had incomes that were higher than the SSI standard prior to beginning their Medicaid-financed spells, and some were already residing in the nursing home, paying for services through Medicare, private insurance, or out-of-pocket. Further investigation of the length of spells based on facility admission dates (rather than Medicaid coverage start dates) supports this theory. We found that nursing home admission dates preceded the start of Medicaid coverage for nursing home care for some spells in the 35 states that reported facility admission dates, with about 21 percent of nursing home spells starting more than three months prior to the start of Medicaid coverage.
We also found that a substantial minority of enrollees with new spells also used HCBS at some point during 2008 or 2009. Among those with spells of six months or less, 31 percent used HCBS prior to receiving nursing home services, while more than one in four used HCBS following discharge. This suggests the possibility that a significant number of enrollees with nursing home stays used HCBS and institutional care in an integrated fashion and therefore that single-point of entry or "no wrong door" approaches to allowing individuals to access LTSS--as embodied by the Aging and Disability Resource Centers and other approaches--could be particularly valuable in helping individuals and their family members navigate the system of long-term care as their needs change over time.
Although the percentage of nursing home spells lasting three months or less was generally higher in states with larger investments in HCBS relative to nursing homes and higher HCBS utilization rates, these associations were not especially large. The small associations are not surprising, given the many variables that determine both length-of-stay and HCBS use that were not considered here. It is likely that further analysis of the relationship between patterns of HCBS and nursing home use at the person level, as explained by individual enrollees' distinct characteristics and needs, will yield results with a clearer interpretation.
III. CHARACTERISTICS OF ENROLLEES USING ICF/IID SERVICES AND THEIR SPELLS OF CARE
Braddock and Rizzolo (2013) estimate that 4.9 million persons with ID/DD lived in the United States as of 2011. Most of these individuals live with family caregivers (3.5 million), or live alone or with a roommate (0.8 million). The remaining 0.6 million lived in supervised residential settings, often referred to as "out-of-home placements". Of those in supervised settings, 77 percent lived in settings with six or fewer persons, 9 percent lived in settings with 7-15 persons, and 14 percent lived in public/private institutions serving 16 or more persons. Most of those in settings with six or fewer persons were in supported living (44 percent), with the remaining 33 percent in group, foster, host homes or apartments.
Government programs, especially Medicaid, provide health and supportive services to many of those with ID/DD. Braddock and Rizzolo estimate that Medicaid provides 77 percent of $57 billion in the governmental support for those with ID/DD in 2011 (2013). (Thirteen percent came from other state funds, while 10 percent came from other federal programs). It is not possible to estimate the number of persons by setting and by type Medicaid expenditures (HCBS, ICF/IID). Although more than 627,000 persons were served through ID/DD Medicaid waivers in 2011, Medicaid ICFs/IID are an important component of the ID/DD support system, with 22 percent of government expenditures for ID/DD.
Medicaid enrollees with ID/DD generally receive a range of social and educational, employment, rehabilitative, and medical services. To help meet their needs, states designed ICFs/IID to provide 24 hour residential care and a variety of specialized services. In recent years, states have offered increased access to HCBS to individuals with ID/DD partly as a result of the Olmstead decision which mandated that states serve people with disabilities in the most integrated setting possible, and partly due to pressure from the advocacy community that sensed many more people with ID/DD could live in community settings. Many people with ID/DD who receive HCBS live in small group homes, and because not all ICFs/IID are large--some with as few as four beds--the distinction between ICF/IID and HCBS use is not a sharp one (despite the clean separation between the two types of service implied by some of the analyses below).
ICFs/IID were originally conceived as large institutions, but caregivers and policymakers quickly recognized the potential benefits of greater community integration, spawning the growth in the early 1980s of community ICFs/IID with between four and 15 beds (Prouty et al. 2008). CMS regulations define facilities with 16 or more beds to be "large", and facilities with less than 15 beds are considered "community" ICFs/IID, with many housing six or fewer individuals (ASPE 2010). The number of individuals residing in large public ICFs/IID has decreased steadily over time. Many states have either closed these facilities completely or downsized them as smaller institutions and community settings have gained favor as more integrated settings in which to deliver care. By June 30, 2009, nine states had closed all state-operated residential facilities with 16 or more residents with ID/DD (Alaska, District of Columbia, Hawaii, Maine, New Hampshire, New Mexico, Rhode Island, Vermont and West Virginia) (Lakin et al. 2010). In other states, however, state-run ICFs/IID are active portals to the ID/DD service system, especially for crisis/emergency situations. Between 1980 and 2009, the average daily population of large state ID/DD residential settings declined from 131,345 to 33,682. Since 2000, the average daily population of large state settings has declined by 29.6 percent nationally, and has decreased in every state (Lakin et al. 2010).
While all ICFs/IID are technically institutions, smaller community ICFs/IID represent an intermediate alternative on the continuum of ID/DD care between HCBS and care in larger institutions. Although we discuss ICFs/IID as a single group below, it is important to bear in mind that larger state-run ICFs/IID often look different from the smaller community ICFs/IID and the extent to which one type or another dominates varies extensively across states. These differences may reflect different approaches to the care of the ID/DD population, including how HCBS is integrated with institutional services.22 Future research would benefit from the availability of data that permit the use of services in large state-run ICFs/IID and smaller community ICFs/IID to be explicitly analyzed and compared. Such data could be used to explore the movement of institutionalized individuals from larger care settings to smaller ones, as well as the variation in the use of services provided by large and smaller ICF/IID across states.
A. Characteristics of Enrollees Using ICF/IID Services
1. How Many Enrollees Had New Spells of ICF/IID Care?
Few Medicaid enrollees used ICF/IID services, relative to the over 12 million Medicaid enrollees who were either elderly or eligible for coverage on the basis of disability between July 1, 2008, and December 31, 2009. Only 91,519 of these enrollees had been in an ICF/IID, and only 9 percent (8,577) of those individuals--representing less than one-tenth of 1 percent of all elderly or enrollees with disabilities--had new spells of care (Table III.1). Thus, the number of new spells among enrollees in ICFs/IID was significantly lower than the rate reported for enrollees with new nursing home stays, which was 5 percent (Chapter II). Although a different mix of states was analyzed in 2006, these numbers are consistent with the population mix and turnover rate reported in Ballou et al. (2013).
| State | Total Number ofAged and Enrolleeswith Disabilities | Number of Enrolleeswith ICF/IID Spells | Number of Enrolleeswith New ICF/IID Spells | Enrollees with NewICF/IID Spells(per 1,000) | Percentage of ICF/IIDEnrollees with NewICF/IID Spells | Percentage of TotalOut-of-Home Placementsin Settings for6 or Fewer Persons(2011) |
| All 43 states | 12,594,903 | 91,519 | 8,577 | 0.7 | 9.4 | 77 |
| SOURCE: Mathematica analysis of 2008-2009 MAX data for 42 states and the District of Columbia with representative FFS nursing home and ICF/IID data (excludes data from Arizona, Hawaii, Maine, Minnesota, New Mexico, Oregon, Tennessee, and Wisconsin); The percent of out-of-home placements in settings for six or less individuals is based on Persons by Setting in FY 2011 (University of Colorado 2013). NOTES: New spells are spells beginning on or after July 1, 2008. Cell counts less than 11 are replaced with 11. Rates and percentages are calculated based on these replaced values. | ||||||
| Alabama | 228,763 | 244 | 16 | 0.1 | 6.6 | 64 |
| Alaska | 24,917 | 11 | 11 | 0.4 | 100.0 | 98 |
| Arkansas | 160,807 | 1,772 | 227 | 1.4 | 12.8 | 58 |
| California | 2,033,361 | 8,343 | 1066 | 0.5 | 12.8 | 88 |
| Colorado | 137,853 | 170 | 53 | 0.4 | 31.2 | 94 |
| Connecticut | 122,572 | 1,151 | 44 | 0.4 | 3.8 | 81 |
| Delaware | 26,222 | 140 | 11 | 0.4 | 5.7 | 84 |
| District of Columbia | 51,159 | 546 | 164 | 3.2 | 30.0 | 96 |
| Florida | 791,125 | 2,956 | 220 | 0.3 | 7.4 | 73 |
| Georgia | 359,347 | 1,229 | 319 | 0.9 | 26.0 | 84 |
| Idaho | 49,347 | 572 | 69 | 1.4 | 12.1 | 85 |
| Illinois | 517,590 | 9,013 | 559 | 1.1 | 6.2 | 42 |
| Indiana | 213,873 | 4,176 | 406 | 1.9 | 9.7 | 67 |
| Iowa | 110,053 | 2,265 | 174 | 1.6 | 7.7 | 60 |
| Kansas | 100,660 | 610 | 33 | 0.3 | 5.4 | 92 |
| Kentucky | 270,502 | 628 | 223 | 0.8 | 35.5 | 76 |
| Louisiana | 259,312 | 5,436 | 446 | 1.7 | 8.2 | 56 |
| Maryland | 184,400 | 286 | 16 | 0.1 | 5.6 | 92 |
| Massachusetts | 412,281 | 916 | 65 | 0.2 | 7.1 | 84 |
| Michigan | 464,112 | 76 | 11 | 0.0 | 14.5 | 90 |
| Mississippi | 193,100 | 2,962 | 329 | 1.7 | 11.1 | 37 |
| Missouri | 300,722 | 872 | 56 | 0.2 | 6.4 | 71 |
| Montana | 30,374 | 55 | 16 | 0.5 | 29.1 | 72 |
| Nebraska | 60,216 | 520 | 11 | 0.2 | 1.9 | 75 |
| Nevada | 51,786 | 120 | 14 | 0.3 | 11.7 | 93 |
| New Hampshire | 37,355 | 11 | 11 | 0.3 | 100 | 96 |
| New Jersey | 314,178 | 2,881 | 132 | 0.4 | 4.6 | 67 |
| New York | 1,179,772 | 8,102 | 699 | 0.6 | 8.6 | 65 |
| North Carolina | 463,381 | 4,202 | 234 | 0.5 | 5.6 | 81 |
| North Dakota | 18,988 | 589 | 70 | 3.7 | 11.9 | 65 |
| Ohio | 520,136 | 7,757 | 731 | 1.4 | 9.4 | 73 |
| Oklahoma | 171,452 | 1,778 | 233 | 1.4 | 13.1 | 54 |
| Pennsylvania | 774,899 | 3,906 | 178 | 0.2 | 4.6 | 81 |
| Rhode Island | 66,073 | 43 | 11 | 0.2 | 11.6 | 91 |
| South Carolina | 230,958 | 1,575 | 136 | 0.6 | 8.6 | 67 |
| South Dakota | 25,185 | 197 | 52 | 2.1 | 26.4 | 67 |
| Texas | 898,873 | 12,068 | 1191 | 1.3 | 9.9 | 83 |
| Utah | 55,953 | 831 | 83 | 1.5 | 10.0 | 69 |
| Vermont | 32,531 | 11 | 0 | --- | 0.0 | 98 |
| Virginia | 235,899 | 1,796 | 176 | 0.7 | 9.8 | 67 |
| Washington | 267,887 | 62 | 11 | 0.0 | 8.1 | 90 |
| West Virginia | 133,233 | 563 | 92 | 0.7 | 16.3 | 86 |
| Wyoming | 13,696 | 88 | 11 | 0.8 | 6.8 | 86 |
Differences across states in the number of spells or new spells were likely due in part to different state policies with respect to ICFs/IID. Alaska, New Hampshire, and Vermont all reported less than ten new spells. All states report less than 3.2 enrollees with new ICF/IID spells per 1,000 enrollees. A large number of new ICF/IID spells were concentrated in a handful of large states, with California, Illinois, Ohio, New York, and Texas together accounting for almost 50 percent of all new spells. Although the percentage of ICF/IID spells that were new was substantially higher in some states, including Alaska (50 percent), New Hampshire (71 percent), Kentucky (36 percent) Colorado (31 percent), District of Columbia (30 percent), and Montana (29 percent) the actual numbers of new spells in these states were low, together accounting for only 5 percent of all new spells nationwide.
The percentage of out-of-home placements in settings for six or less individuals also varies by state reflecting differences in state policies and infrastructure. Because this variable was not yet available in MAX data, we chose to analyze existing data from the University of Colorado on persons by setting in FY 2011 (2013). Eleven states reported 90 percent or more of placements in smaller settings, and only 37 percent of placements in Mississippi were to settings of six or fewer. Although North Dakota and the District of Columbia had the highest rate of new ICF/IID spells, 96 percent of out-of-home placements in the District of Columbia are in facilities for six or fewer, compared to 65 percent of enrollees in North Dakota. Although the percentage of out-of-home placements includes not just Medicaid-paid spells, and also includes other small settings besides ICFs/IID such as group homes or supported living, similar rates of new spells may mean very different things for enrollees across states, with enrollees in some states more likely to receive services in a large ICF setting as opposed to a smaller ICF/IID.
The percentage of all ICF/IID enrollees with new ICF/IID spells during our study period remained fairly consistent within states between 2006 and 2009. Notable changes occurred in Alaska, Rhode Island, and Colorado, however the low number of enrollees with new ICF/IID spells in these states make these rates sensitive to small changes. (Alaska decreased from 100 percent in 2006 to 50 percent in 2009. Rhode Island also dropped by almost half, from 22 percent to 12 percent. Colorado increased from 20 percent to over 30 percent (Ballou et al. 2013).
Although much emphasis has been placed on re-balancing services for the ID/DD population toward community settings in the wake of the Olmstead decision, concerns have been raised about the lack of institutional capacity in some states for individuals with complex needs (Western Interstate Commission for Higher Education 2009). For example, because there are no ICF/IID facilities in Alaska during the study period, the state may have placed its enrollees requiring institutional services in out-of-state facilities.23
2. Who Used ICF/IID Care?
Unlike nursing homes, whose residents are more likely to be female and elderly, the majority of enrollees with new ICF/IID spells were male and under 65 years old, and more likely to have multiple new spells. Over 60 percent of the 8,577 enrollees with new ICF/IID spells were male, and 38 percent were between 21 and 44 years old (Table III.2). Significant percentages of enrollees residing in ICFs/IID were younger than 21 (28 percent) or between 45 and 64 years old (29 percent), and very few were over 75 years old.
| Characteristics of People with New Spells of ICF/IID Care | Enrollees with 1 orMore New ICF/IID Spells | Enrollees with Both NewNursing Home and NewICF/IID Spells |
| SOURCE: Mathematica analysis of 2008-2009 MAX data for 42 states and the District of Columbia with representative FFS nursing home and ICF/IID data (excludes data from Arizona, Hawaii, Maine, Minnesota, New Mexico, Oregon, Tennessee, and Wisconsin). | ||
| Number of enrollees with new spells in all states | 8,577 | 1,020 |
| Percentage female | 38.1 | 44.7 |
| Percentage non-Hispanic White | 71.1 | 77.9 |
| Age (percentage of subgroup) | --- | --- |
| Under age 21 | 27.6 | 4.2 |
| 21-44 years | 37.7 | 30.9 |
| 45-64 years | 29.0 | 49.5 |
| 65-74 years | 3.8 | 11.3 |
| 75-84 years | 1.3 | 3.5 |
| 85 years and older | 0.3 | 0.5 |
| Percentage with multiple new spells | 14.2 | 100.0 |
| Percentage with spells in both nursing homes and ICFs/IID | 11.9 | 100.0 |
Of all enrollees with new spells of ICF/IID care, a small percentage reported multiple new spells during the reporting period. Fourteen percent had more than one new spell between July 2008 and December 2009, and 12 percent, or 1,020 enrollees, had spells in both ICFs/IID and nursing homes. Enrollees with both new nursing home spells and new ICF/IID spells have similar characteristics to enrollees with new ICF/IID spells with both populations more likely to be male and under 65 years old.
| States(by largest MAS group) | Total Number ofEnrollees with NewICF/IID Spells | Percentage in MAS Group at Start of Spell | ||||
| "Other" | Cash Assistance- Related | Medically- Needy | Poverty- Related | Section 1115 Demonstration Waiver | ||
| All states | 8,577 | 31.1 | 51.1 | 13.8 | 3.8 | 0.2 |
| SOURCE: Mathematica analysis of 2008-2009 MAX data for 42 states and the District of Columbia with representative FFS nursing home and ICF/IID data (excludes data from Arizona, Hawaii, Maine, Minnesota, New Mexico, Oregon, Tennessee, and Wisconsin). There were no enrollees with new ICF/IID stays in Vermont. Information about medically-needy, special income standards for institutional level-of-care, and Section 209(b) status from MAX 2009 Eligibility Anomaly Tables. NOTES: New spells are spells beginning on or after July 1, 2008. Data are not reported for states with fewer than 11 ICF/IID spells. Percentages that would result in a total of less than 11 for a cell or combination of cells are replaced by an asterisk (*).
| ||||||
| Cash Assistance | ||||||
| Georgiaab | 319 | 19 | 81 | 0 | 0 | 0 |
| Coloradob | 53 | 30 | 70 | 0 | 0 | 0 |
| Idahob | 69 | 32 | 68 | 0 | 0 | 0 |
| Texasab | 1,191 | 34 | 66 | 0 | 0 | 0 |
| Mississippib | 329 | 34 | 66 | 0 | 1 | 0 |
| Nevadab | 14 | * | * | * | * | * |
| Kansasab | 33 | * | 64 | 0 | * | 0 |
| Arkansasab | 227 | * | 63 | 0 | 0 | * |
| Alabamab | 16 | * | * | * | * | * |
| North Carolinaa | 234 | 0 | 58 | 9 | 33 | 0 |
| Louisianaab | 446 | 43 | 57 | 0 | 0 | 0 |
| Ohiobc | 731 | 41 | 57 | 0 | 3 | 0 |
| Montanaab | 16 | * | * | * | * | * |
| North Dakotaac | 70 | * | 56 | * | 0 | 0 |
| South Carolinab | 136 | 29 | 54 | 0 | 17 | 0 |
| District of Columbiaa | 164 | * | 53 | 34 | * | 0 |
| Californiaa | 1,066 | 6 | 53 | 38 | 3 | 0 |
| South Dakotab | 52 | 48 | 52 | 0 | 0 | 0 |
| Marylandabd | 16 | * | * | * | * | * |
| Floridaab | 220 | 43 | 48 | 0 | * | 6 |
| "Other" | ||||||
| Connecticutabc | 44 | * | * | * | * | * |
| Missouric | 56 | * | 29 | 0 | 0 | 0 |
| New Jerseyab | 132 | * | 24 | 0 | * | 0 |
| Kentuckyab | 223 | 70 | 27 | * | * | 0 |
| Iowaab | 174 | 69 | 31 | 0 | 0 | 0 |
| Oklahomabc | 233 | 68 | 22 | 0 | 10 | 0 |
| Virginiaabc | 176 | 55 | 44 | 0 | * | 0 |
| West Virginiaab | 92 | 54 | 44 | * | * | 0 |
| Indianac | 406 | 54 | 45 | 0 | * | 0 |
| Utahab | 83 | 52 | 43 | 0 | * | 0 |
| Pennsylvaniaab | 178 | 49 | 42 | 1 | 7 | 0 |
| Michiganabd | 11 | * | * | * | * | * |
| Medically-Needy | ||||||
| New Yorka | 699 | 0 | 47 | 52 | 0 | 0 |
| Illinoisac | 559 | 16 | 22 | 51 | 11 | 0 |
| Poverty-Related | ||||||
| Massachusettsa | 65 | * | * | * | * | * |
3. How Did Enrollees Residing in ICFs/IID Become Eligible for Medicaid?
Across all 43 states, the majority of enrollees in ICFs/IID qualified for full Medicaid benefits via the cash assistance pathway (51 percent) in 2009, followed by "other" criteria (31 percent) and medically-needy programs (14 percent) (Table III.3).24 In 24 of the states, the majority of ICF/IID residents with new spells qualified for Medicaid under cash assistance-related criteria in the first month of their spell. In all states cash assistance-related criteria represented either the most common or second most common pathway to Medicaid eligibility. Cash assistance was also the most common pathway to eligibility in the two states with the largest number of new spells: California and Texas. "Other" criteria were the most common pathway to eligibility in 13 states--ten of which are Section 209(b) states--while medically-needy programs were the most common pathway in three states. Poverty-related expansions were a common pathway to eligibility only in Massachusetts. These findings for enrollees in ICFs/IID differ from the nursing home population, where almost 50 percent of nursing home enrollees qualified for benefits via "other" criteria.
In contrast to enrollees in nursing homes, over 90 percent of enrollees living in an ICF/IID were enrolled in Medicaid prior to their first spell of institutional care (Table III.4). Of all enrollees with ICF/IID spells, most qualified either via cash assistance (49 percent) or "other" (23 percent). Cash assistance was either the most common or second most common pathway to eligibility in all states except Illinois. Thus, recipients of Medicaid-financed ICF/IID services generally had low incomes before they entered institutional care, and the type of coverage remained the same upon entry for most enrollees living in ICFs/IID, unlike enrollees in nursing homes. Although our 2006 analysis looked at a slightly different mix of states, we see very similar patterns, with the majority of ICF/IID enrollees qualifying for benefits via cash assistance and enrolled via cash assistance in the first month of ICF/IID care.
| State | Total Number ofEnrollees with NewICF/IID Spells | Percentage in MAS Group 2 Months Before Spell | |||||
| Not Enrolled | "Other" | Cash Assistance- Related | Medically- Needy | Poverty- Related | Section 1115 Demonstration Waiver | ||
| All states | 8,577 | 9.5 | 23.4 | 49.3 | 10.7 | 5.6 | 0.3 |
| SOURCE: Mathematica analysis of 2008-2009 MAX data for 42 states and the District of Columbia with representative FFS nursing home and ICF/IID data (excludes data from Arizona, Hawaii, Maine, Minnesota, New Mexico, Oregon, Tennessee, and Wisconsin). There were no enrollees with new ICF/IID stays in Vermont. Information about medically-needy, special income standards for institutional level-of-care, and Section 209(b) status from MAX 2009 Eligibility Anomaly Tables. NOTES: New spells are spells beginning on or after July 1, 2008. The percentages in each MAS group preceding the first new Medicaid-financed ICF/IID spells do not always add up to 100 because we were unable to identify the MAS group for a small percentage of enrollees with new stays. Data are not reported for states with fewer than 11 ICF/IID spells. Percentages that would result in a total of less than 11 for a cell or combination of cells are replaced by an asterisk (*).
| |||||||
| Cash Assistance | |||||||
| Georgiaab | 319 | 5 | 18 | 77 | 0 | 0 | 0 |
| Mississippib | 329 | 10 | 18 | 63 | 0 | 8 | 0 |
| Alabamab | 16 | * | * | * | * | * | * |
| Coloradob | 53 | * | * | 62 | 0 | 0 | 0 |
| South Carolinab | 136 | 6 | 17 | 62 | 0 | 15 | 0 |
| Louisianaab | 446 | 12 | 22 | 61 | 0 | * | 0 |
| Texasab | 1,191 | 15 | 16 | 61 | 0 | 6 | 0 |
| North Dakotaac | 70 | * | * | 9 | 31 | 0 | 0 |
| Arkansasab | 227 | 7 | 26 | 58 | 0 | * | * |
| South Dakotab | 52 | 25 | 15 | 58 | 0 | * | 0 |
| Kansasab | 33 | * | * | 58 | 0 | * | 0 |
| Idahob | 69 | * | 25 | 57 | 0 | * | 0 |
| North Carolinaa | 234 | 17 | * | 56 | * | 23 | 0 |
| Montanaab | 16 | * | * | * | * | * | * |
| Californiaa | 1,066 | 4 | 5 | 55 | 33 | 3 | 0 |
| Ohiobc | 731 | 9 | 34 | 53 | 0 | 34 | 0 |
| District of Columbiaa | 164 | * | * | 52 | 32 | 7 | 0 |
| New Yorka | 699 | 10 | 0 | 51 | 37 | 0 | 0 |
| Pennsylvaniaab | 178 | * | 40 | 50 | 0 | * | 0 |
| West Virginiaab | 92 | 12 | 39 | 47 | * | * | 0 |
| Virginiaabc | 176 | 15 | 35 | 47 | * | * | 0 |
| Floridaab | 220 | 14 | * | 41 | 5 | * | 5 |
| "Other" | |||||||
| Kentuckyab | 223 | * | 76 | 15 | 5 | * | 0 |
| Connecticutabc | 44 | * | * | 18 | * | 0 | 0 |
| Iowaab | 174 | 8 | * | 18 | 0 | * | 0 |
| Missouric | 56 | * | * | 29 | 0 | 0 | 0 |
| New Jerseyab | 132 | 13 | * | 16 | 0 | * | 0 |
| Nevadab | 14 | * | * | * | * | * | * |
| Indianac | 406 | 7 | 42 | 41 | 0 | 8 | 0 |
| Utahab | 83 | 17 | 37 | 35 | 0 | 10 | 0 |
| Michiganab | 11 | * | * | * | * | * | * |
| Oklahomabc | 233 | 14 | 36 | 35 | 0 | 13 | 0 |
| Medically-Needy | |||||||
| Illinoisac | 559 | 8 | 26 | 15 | 37 | 13 | 0 |
| Marylandab | 16 | 38 | 6 | 31 | 25 | 0 | 0 |
| Poverty-Related | |||||||
| Massachusettsa | 65 | * | 19 | 32 | 0 | 46 | * |
ICF/IID residents who were enrolled in Medicaid prior to admission generally continued to qualify for benefits according to the same eligibility criteria following admission, with 87-91 percent of those who qualified via the "other," cash assistance, and medically-needy pathways remaining in the same MAS group (Table III.5), a result consistent with findings in Ballou et al. (2013). As with nursing homes, the percentage remaining in the poverty-related group (46 percent) was lower, with most of those enrollees qualifying for benefits under the "other" criteria following admission. Among those residents who were not enrolled in Medicaid two months prior to admission, approximately half qualified for Medicaid via the "other" pathway, with the remainder qualifying via the cash assistance (33 percent) and medically-needy (14 percent) pathways.
| MAS Group 2 Months Before Start of Spell | Number in MASGroup 2 MonthsBefore Start of Spell | Percentage in MAS Group at Start of Spell | ||||
| "Other" | Cash Assistance- Related | Medically- Needy | Poverty- Related | Section 1115 Demonstration Waiver | ||
| SOURCE: Mathematica analysis of 2008-2009 MAX data for 42 states and the District of Columbia with representative FFS nursing home and ICF/IID data (excludes data from Arizona, Hawaii, Maine, Minnesota, New Mexico, Oregon, Tennessee, and Wisconsin). Vermont did not have any enrollees with new ICF/IID spells during the analysis period. NOTE: New spells are spells beginning on or after July 1, 2008. The number in each MAS group preceding the first new Medicaid-financed ICF/IID spells do not add up to the total number of new spells because we were unable to identify the MAS group for a small percentage of enrollees with new stays. Methods used to determine which states utilized the 300% rule or had a medically-needy program in 2009 are described in Appendix B. | ||||||
| Not enrolled | 817 | 47.6 | 33.4 | 14.2 | 4.8 | 0.0 |
| "Other" | 2,009 | 87.1 | 9.0 | 2.8 | 1.2 | 0.0 |
| Cash assistance-related | 4,228 | 6.4 | 89.6 | 3.3 | 0.5 | 0.0 |
| Medically-needy | 920 | 1.2 | 6.8 | 90.8 | 1.1 | 0.1 |
| Poverty-related | 483 | 39.8 | 7.7 | 4.6 | 48.0 | 0.0 |
| Section 1115 demonstration waiver | 24 | 16.7 | 20.8 | 4.2 | 4.2 | 54.2 |
B. Characteristics of Enrollees' ICF/IID Spells
1. How Long Did Enrollees Live in ICFs/IID?
Most enrollees living in ICFs/IID were long-term residents, with over 72 percent of individuals with new spells staying for more than one year (Figure III.1). Long stays are expected as people with ID/DD often have impairments so severe that they may require institutional care for years, or even decades.
Short stays occur, but they are uncommon. Twelve percent of enrollees living in ICFs/IID, had very short stays of three months or less.25 California (16 percent), Mississippi (9.5 percent), New York (10 percent), Ohio (9.5 percent), and South Dakota (13 percent) together represent a majority of these short stays (Appendix Table D.6). Some of these short stays may correspond to large ICF/IID closings. Sixty-eight large facilities closed between 2000 and 2009. In 2009, large state facilities closed in California, Maryland, Michigan, and Oregon (Lakin et al. 2010).
FIGURE III.1. Length of First New ICF/IID Spells (beginning July 2008-December 2008) among Enrollees Who Were Aged or Disabled with New Medicaid-Financed ICF/IID Spells
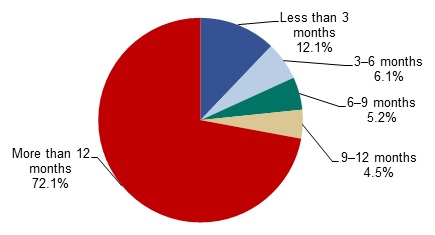
SOURCE: Mathematica analysis of 2008-2009 MAX data for 42 states and the District of Columbia with representative FFS nursing home data (excludes data from Arizona, Hawaii, Maine, Minnesota, New Mexico, Oregon, Tennessee, and Wisconsin). Vermont did not have any enrollees with new ICF/IID spells during the analysis period.
NOTE: New spells are spells beginning between July 1, 2008 and December 31, 2008, inclusive; spells are censored at December 31, 2009.
2. Did Enrollees with ICF/IID Stays also have Nursing Home Stays?
Ideally, an individual with ID/DD who qualifies for Medicaid benefits and requires LTSS will be placed in the environment best suited to address his or her specific needs. Individuals with complex medical needs who require more or less continual access to nursing care might be best served in a nursing home.26 Historically, however, the lack of availability of certain services has sometimes resulted in individuals being placed in less-than-ideal settings. Early in the development of the ICF/IID program, for example, many persons with ID/DD who did not require a high level of nursing care were placed in nursing homes rather than facilities specifically designed for their needs (Lakin and Hall 1990).27
The continued closure of larger ICFs/IID in recent years, combined with the greater emphasis on HCBS for the ID/DD population, raises a natural question. Where are enrollees who had previously used ICF/IID services now served: in other smaller ICFs/IID, in nursing homes, or in the community?
A substantial minority of enrollees in ICFs/IID were admitted to multiple types of institutions, with 1,020 of the 8,577 (12 percent) with ICF/IID admissions also receiving nursing home care during the 18-month study period (Table III.6). These 1,020 individuals represented a small share (0.2 percent) of all enrollees in nursing homes. Thus, while it is unusual for a nursing home resident to require ICF/IID care, it is not uncommon for ICF/IID residents to require nursing home services at some point. Because more enrollees transfer from nursing homes to ICFs/IID, than from ICFs/IID to nursing homes, this order of service use may suggest that nursing home placements are often used as temporary placements until ICF/IID placements are available. (Additional state-level detail can be found in Appendix Table D.7.)
| Enrollees with Multiple Spells and the Order of Spells | Number of Percentage |
| SOURCE: Mathematica analysis of 2008-2009 MAX data for 42 states and the District of Columbia with representative FFS nursing home data (excludes data from Arizona, Hawaii, Maine, Minnesota, New Mexico, Oregon, Tennessee, and Wisconsin). Vermont did not have any enrollees with new ICF/IID spells during the analysis period. NOTE: New spells are spells beginning between July 1, 2008 and December 31, 2008, inclusive; spells are censored at December 31, 2009. | |
| Enrollees with both ICF/IID and nursing home spells | 1,020 |
| Percentage of all ICF/IID residents | 11.9 |
| Percentage of all nursing home residents | 0.2 |
| Enrollees with a first new ICF/IID spell followed by a nursing home spell | 148 |
| Percentage with no gap between spells | 35.8 |
| Percentage with a gap of 60 days or less between spells | 86.5 |
| Enrollees with a first new nursing home spell followed by an ICF/IID spell | 871 |
| Percentage with no gap between spells | 65.7 |
| Percentage with a gap of 60 days or less between spells | 92.2 |
Our analysis based on 2006 data portrayed a similar story, with almost 12 percent of ICF/IID residents also receiving nursing home care during the study period. We found very similar results for the measures listed in Table III.6, except for the percentage of enrollees with first new ICF/IID spell immediately followed by a nursing home spell. This measure decreased from 47 percent in our previous report to 36 percent in this analysis. This decline may be related to the drop in nursing home spells in most states between 2006 and 2009. However because only 148 enrollees had a first new ICF/IID spell followed by a nursing home spell (and only 122 in 2006-2007), the percentages are driven by small changes in the number of enrollees, and the actual number of enrollees without a gap in institutional coverage only decreased by four between the two reporting periods.
3. Did Enrollees Receiving ICF/IID Care also use HCBS?
Many enrollees admitted to ICFs/IID used HCBS either before entering the ICF/IID or after returning to the community. Approximately 39 percent of all enrollees with ICF/IID spells beginning in 2009 used HCBS prior to their spell, and 43 percent of those enrollees with shorter stays (beginning and ending in the first half of 2009) used HCBS in the previous year (Table III.7). Similarly, 41 percent of enrollees with shorter stays used HCBS after their spell in 2009.28
| HCBS Use Relative to First New Spell of Institutional Care | Percentage |
| SOURCE: Mathematica analysis of 2008-2009 MAX data for 42 states and the District of Columbia with representative FFS nursing home data (excludes data from Arizona, Hawaii, Maine, Minnesota, New Mexico, Oregon, Tennessee, and Wisconsin). Vermont did not have any enrollees with new ICF/IID spells during the analysis period. NOTE: New spells are spells beginning between July 1, 2008 and December 31, 2008, inclusive; spells are censored at December 31, 2009. | |
| First new spells beginning in 2009 preceded by HCBS use in 2008 | 38.8 |
| First new spells beginning in 2009 and ending on or before June 30, 2009 preceded by HCBS Use in 2008 | 43.2 |
| First new spells ending in 2008 followed by HCBS Use in 2009 | 40.5 |
Despite the higher percentage of long-term stays in ICFs/IID, as compared with nursing homes (Figure II.1 and Figure III.1), slightly higher percentages of ICF/IID residents used HCBS before or following their stays (Table II.7 and Table III.7). This use of both institutional and community care could reflect: (1) changing levels of need for persons with ID/DD--with the same individual using either HCBS or ICF/IID services depending on his or her needs at a point in time; (2) a trial-and-error approach to identifying the most appropriate care setting for the individual; (3) placement in HCBS in response to closure of some ICFs/IID; or (4) ICFs/IID serving as crisis/emergency placement sites for individuals already being served either through HCBS or for people entering the Medicaid system in a crisis/emergency circumstance who are awaiting an alternative placement as soon as such a placement can be arranged. In addition, the Money Follows the Person Demonstration, which began in 2008, allows states to provide HCBS to residents of institutions before they move to a community setting.
Table III.7 masks substantial variation across states. Considering shorter ICF/IID spells that began in 2009, in every state except two (Nebraska and New Hampshire), at least some spells had been preceded by HCBS use in 2008 (Appendix Table D.8). Similarly, 100 percent of shorter spells beginning and ending in the first half of 2008 were followed by HCBS use in 2009 in two states, whereas no such spells were followed by HCBS use in another 16 states. These results should be interpreted with caution as the number of new spells varies across states from zero new stays in Vermont, to over 1,000 in California and Texas.
HCBS use overall among aged or enrollees with disabilities has dropped since our previous study. Forty-two percent of enrollees with new spells beginning in 2007 were preceded by HCBS use in 2006; 54 percent of first new spells beginning and ending in 2007 were preceded by HCBS; and 53 percent of first new spells ending in 2006 were followed by HCBS use (Ballou et al. 2013). Although many states reported lower rates of HCBS use compared to 2006-2007, several stayed the same or increased HCBS use (data not shown). For example, new spells followed by HCBS use decreased by over 13 percentage points, however if we look by state, 16 states reported a lower rate in 2008-2009, 16 reported a higher rate, and nine stayed the same. The different mix of states analyzed in these two studies seems to have impacted our overall results. For instance, we previously included Oregon and Wisconsin, which traditionally report higher HCBS expenditures (KCMU & UCSF 2012).
C. Associations Between Lengths of Stay in ICFs/IID and State Policy-Related Variables
To understand how policy may be related to ICF/IID use, we assessed the associations between the length of enrollees' ICF/IID stays and rates of HCBS use among people with ID/DD.29 Although these associations may be informative to policymakers seeking to improve ICF/IID services and LTSS more generally for the ID/DD population, it is not possible to determine causal relationships from the data presented here. The following scatterplots look at the relationship between the percentage of first ICF/IID spells that last less than three months and:
-
The percentage of Medicaid long-term care expenditures allocated to HCBS.
-
The relationship between the percentage of Medicaid long-term care recipients using HCBS.
FIGURE III.2. Relationship Between the Percentage of Medicaid Long-Term Care Expenditures Allocated to HCBS and the Percentage of Short ICF/IID Spells
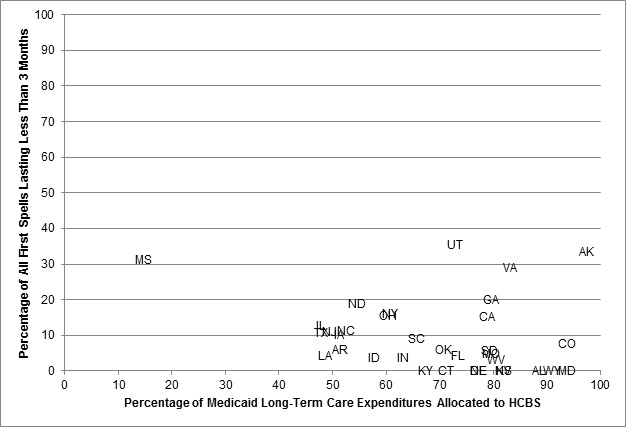
SOURCE: Mathematica analysis of 2008-2009 MAX data for 42 states and the District of Columbia with representative FFS nursing home data (excludes data from Arizona, Hawaii, Maine, Minnesota, New Mexico, Oregon, Tennessee, and Wisconsin). Vermont did not have any enrollees with new ICF/IID spells during the analysis period. New Hampshire reports 100% of their first spells lasting less than 3 months, however the state only reported 5 ICF/IID spells, so this outlier has been excluded.
NOTE: New spells are spells beginning between July 1, 2008 and December 31, 2008, inclusive; spells are censored at December 31, 2009.
In general, we did not find a statistically significant relationship between the percentage of short ICF/IID spells and the level of HCBS, either measured by expenditures or users (Figure III.2 and Figure III.3).
FIGURE III.3. Relationship Between the Percentage of Medicaid Long-Term Care Recipients Using HCBS and the Percentage of Short ICF/IID Spells
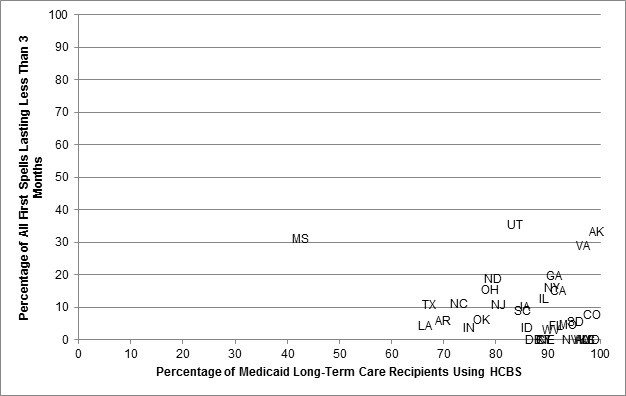
SOURCE: Mathematica analysis of 2008-2009 MAX data for 42 states and the District of Columbia with representative FFS nursing home data (excludes data from Arizona, Hawaii, Maine, Minnesota, New Mexico, Oregon, Tennessee, and Wisconsin). Vermont did not have any enrollees with new ICF/IID spells during the analysis period. New Hampshire reports 100% of their first spells lasting less than 3 months, however the state only reported 5 ICF/IID spells, so this outlier has been excluded.
NOTE: New spells are spells beginning between July 1, 2008 and December 31, 2008, inclusive; spells are censored at December 31, 2009. The relationship between the two variables was not statistically significant.
Given the small population of ICF/IID users, most of whom are young or middle-aged adults who live in these facilities for very long periods of time,30 these results are not entirely surprising. To the extent that policy affects how individuals with an ICF/IID level of need receive their care, it is likely through the diversion of would-be residents to community-based services or smaller group homes that new resources for HCBS will have their greatest effects.
D. Summary of ICF/IID Findings
New ICF/IID spells are not as common as new spells of nursing home care. Of the over 90,000 Medicaid enrollees with ICF/IID spells of care during the study period, only 9 percent had new spells of care. States varied in the number of spells and the number of new spells, with three states reporting less than ten enrollees in an ICF/IID, and Texas reporting over 12,000. These state-level differences reflect not only population differences, but also different state policies with respect to long-term care. The majority (72 percent) of new ICF/IID stays lasted more than one year, and more than 40 percent used HCBS either before or after their first new spell.
ICF/IID enrollees differ from nursing home enrollees, in that they are more likely to be male, under 65, and eligible for Medicaid via the cash assistance pathway, and enrolled in Medicaid prior to their first spell of ICF/IID care. We did not find a statistically significant relationship between lengths of ICF/IID spells and state policy variables.
Overall, our findings based on 2009 data are consistent with the results reported based on 2006 data, even though these two reports are based on a slightly different mix of states. We did see notable decreases in percentage of enrollees with first new ICF/IID spell followed by a nursing home spells and in HCBS use among aged or enrollees with disabilities.
IV. POLICY IMPLICATIONS AND DIRECTIONS FOR FUTURE RESEARCH
This study provided detailed information across 42 states and the District of Columbia on users of nursing home and ICF/IID care services in Medicaid FFS programs using MAX data for 2008-2009. Ballou et al. (2013) and Wenzlow et al. (2008) conducted similar studies using data for 2006-2007 and 2001-2002 respectively. Over that time, states have altered their delivery of HCBS and the United States entered a significant economic recession, perhaps resulting in an increase in Medicaid enrollment. This study analyzed the characteristics of residents receiving care in nursing homes and specialized institutions for developmentally disabled adults (ICFs/IID). It examined changes in the population of nursing home residents over years from 2001-2002 to 2008-2009 and examined alternative definitions of nursing home stays.
A. Summary of Results and Policy Implications
Nursing Home Utilization. In most states, there were fewer new Medicaid-funded nursing home spells during 2008 and 2009 than in 2006 and 2007 (Ballou et al. 2013). The gradual decline in nursing home care is a continuation of a trend that has been observed since 1995 (CMS 2012). The decline surely reflects efforts by states to re-balance long-term care systems away from institutional care and toward HCBS. A substantial minority of enrollees who began Medicaid nursing home spells in 2008 and 2009 also used HCBS at some point during those years. Among those with spells of six months or less, 31 percent used HCBS prior to receiving nursing home services. More than one in four used HCBS following discharge.
The measured duration of nursing home spells is sensitive to the way in which those spells are defined. When all stays were defined to begin with the inception of Medicaid payment, 35 percent of spells lasted less than three months and 40 percent lasted more than 12 months. When Medicare SNF stays were removed (as completely as possible), 32 percent lasted less than three months and 42 percent lasted more than 12 months. Finally, when the spell was defined using the nursing home admission date recorded on the claim, 25 percent of spells lasted less than three months and 47 percent lasted more than 12 months.31
Roughly 30 percent of those beginning new Medicaid spells of nursing home care were not enrolled in Medicaid prior to the beginning of their Medicaid-financed spell (unchanged since 2006-2007), at which point approximately half (49 percent) qualified for benefits under "other" eligibility criteria--which include the 300 percent rule--while most others qualified under cash assistance-related or medically-needy provisions.
Although the percentage of nursing home spells lasting three months or less was typically higher in states with larger investments in HCBS relative to nursing homes and with higher HCBS utilization rates, these associations were not particularly large. Analysis using units of observation smaller than a state will be required to assess the relationship between HCBS and nursing home use more closely.
The Population of ICF/IID Residents. ICF/IID placements are uncommon, reflecting the long lengths of stay of most ICF/IID residents, the general trend toward closing larger institutions and placing developmentally disabled persons in group homes and HCBS, and the small size of the ID/DD population in general. ICF/IID residents are generally young or middle-aged adults, the majority of whom had low incomes and assets prior to being admitted (in contrast to some nursing home residents). Because large state-run ICFs/IID and smaller community ICFs/IID represent markedly different care settings, additional research that explicitly considers utilization of services provided by large and small institutions is critical to fully understanding how low-income individuals with ID/DD are being served in different states, and how to serve them better.
Multiple Episodes of Care. About 14 percent of enrollees with an ICF/IID stay during 2008 and 2009 had a second stay during the period. Over 80 percent of these had stays in both nursing facilities and ICFs/IID during the period, nearly always moving from nursing facility to ICF/IID. This suggests that people with multiple stays may be placed in nursing homes while awaiting placement in an ICF/IID. This pattern could become more frequent as more states close larger ICFs/IID, possibly making it more difficult to find residential placements near an enrollee's home.
Eligibility for Medicaid Benefits. Over 90 percent of ICF/IID residents were enrolled in Medicaid two months prior to the start of their Medicaid stay, with nearly half qualifying for benefits via cash assistance. In contrast, most nursing home residents qualified for benefits via "other" criteria (including the 300 percent rule) during their stays. The large percentage of ICF/IID residents who qualified for Medicaid prior to their stay is unsurprising, since many disabilities are lifelong and (in the absence of and sometimes even with support services) limit an individual's ability to earn income. That nursing home stays often precipitate enrollment in Medicaid reflects the high cost of nursing home services for individuals with modest incomes and assets who previously did not require institutional care.
B. Directions for Future Research
This study is primarily descriptive, relying on Medicaid eligibility and claims data to characterize state variation in the use of institutional care. Its findings lend themselves to only tentative conclusions but suggest directions for future study. Analyses that use detailed person-level and claim-level data, including the information available through MAX, are especially likely to enhance our understanding of the potential for replacing institutional care with community care. Analyses that merge Medicare and Medicaid claims data for those who are enrolled in both programs, and that draw on nursing home Minimum Data Set (MDS) data offer the greatest potential for understanding the relationship between individual characteristics and the locus of care.
Exploring the Continuum of Long-Term Care. As Chapter III pointed out, large ICFs/IID have lost favor among states and among the advocacy community, largely because of a feeling that large facilities are less likely to promote a sense of personal independence and a high quality of life. At the same time, there has been little examination of the outcomes of residents at large and small ICFs/IID in terms of probability of emergency room or inpatient use, probability of returning to the community, and overall Medicaid expenditure. By categorizing facilities according to size and combining data from all MAX files over a span of 3-4 years, issues such as these could be addressed, both within and across states.
Level of Need and Level-of-Care. Enrollees with different levels of impairment naturally require different levels of service. People with few limitations, especially those who have informal community supports from family or others might benefit from access to HCBS, yet would probably manage to function in the community without it. Others with more severe limitations and with little or no informal supports may require significant levels of community service if they are to avoid institutionalization. Still others may have needs so great that institutional care becomes a necessity. To date, however, there has been no systematic examination of variation across states and over time in the relationship of individual functional and cognitive limitations to the nature of LTSS provided. This dearth of research has been due largely to the absence of systematic data on the characteristics of people receiving HCBS. The situation stands in contrast to that for persons entering nursing homes, all of whom are assessed using the Resident Assessment Instrument, which itself produces data for the nursing home MDS. To carry out such a study now would require making contact with state Medicaid programs to ascertain whether there are at least 10-12 states that systematically assess HCBS recipients and who would be willing to share data with investigators. Merging such individual assessment data on people receiving HCBS with data on nursing home residents drawn from the MDS and with MAX nursing home and HCBS claims would permit a rich set of analyses linking use of care and transitions among care locations to the cognitive and functional limitations of care recipients.
Defining Recipients of Medicaid-Financed Long-Term Care. The analyses reported in Chapter II attempted to separate Medicare-covered SNF stays from other Medicaid-covered stays by deleting claims that cover only co-insurance for Medicare SNF stays. This way of identifying Medicare SNF stays is imprecise because some states do not clearly indicate that a claim covers only co-insurance amounts. Merging Medicare claims data to Medicaid MAX long-term care claims would permit more reliable and accurate discrimination among Medicare-only SNF stays, Medicaid-only nursing home stays, and Medicare SNF stays that transition to Medicaid stays.
Person-Level Analyses of LTSS Use and Transition Over Several Years. While comparisons across states such as those presented here can be informative, the two-year time span and state-level focus limits the depth of conclusions that can be drawn. Creating a person-level file over 3-4 years would permit more thorough investigation of issues such as: (1) the duration of time in nursing homes and ICFs/IID; (2) the span of continuous time over which enrollees receive HCBS; (3) the median duration of time in HCBS before nursing home entry, death, or other exit from HCBS; and (4) the degree of within-state variation in HCBS use, both across urban areas and between urban and rural areas of a state.
REFERENCES
Ballou, Jeffrey, Valerie Cheh, Dean Miller, and Audra Wenzlow. "Medicaid-Financed Institutional Services: Characteristics of Nursing Home and ICF-MR Residents and Their Patterns of Care." Cambridge, MA: Mathematica Policy Research, 2013.
Borck, Rosemary, Allison Hedley Dodd, Ashley Zlatinov, Shinu Verghese, and Rosalie Malsberger. "MAX 2008 Chartbook and Appendix Tables." Report submitted to CMS. Washington, DC: Mathematica Policy Research, 2012.
Borck, Rosemary, Robert Schmitz, Victoria Peebles, and Dean Miller. "An Investigation of Interstate Variation and Progress Toward Balance in Medicaid Long-Term Care Service Use and Expenditures in 2009." Cambridge, MA: Mathematica Policy Research, 2014.
Braddock, David, and Mary Kay Rizzolo. "Intellectual and Developmental Disabilities in the U.S.: 2013." American Association on Intellectual and Developmental Disabilities Webinar, February 27 2013. Available at http://www.acphd.org/media/292360/webinar_intellectual_and_dds.pdf.
Braddock, David, Richard Hemp, Susan Parish, and James Westrick. "The State of the States in Developmental Disabilities." Washington, DC: American Association of Mental Retardation, 1995, vol. 4.
Centers for Medicare and Medicaid Services (CMS). "Eligibility Anomaly Tables--MAX 2009." Baltimore, MD: CMS, 2013. Available at http://www.cms.gov/Research-Statistics-Data-and-Systems/Computer-Data-and-Systems/MedicaidDataSourcesGenInfo/MAXGeneralInformation.html. Accessed December 17, 2013.
Centers for Medicare and Medicaid Services. "Medicare Coverage of Skilled Nursing Facility Care." Baltimore, MD: CMS, 2010. Available at http://www.medicaid.gov/Medicaid-CHIP-Program-Information/By-Topics/Delivery-Systems/Institutional-Care/Nursing-Facilities-NF.html. Accessed December 21, 2013.
Centers for Medicare and Medicaid Services. "Nursing Home Data Compendium 2012 Edition." 2012. Available at http://www.cms.gov/Medicare/Provider-Enrollment-and-Certification/CertificationandComplianc/downloads/nursinghomedatacompendium_508.pdf. Accessed December 17, 2013.
Eiken, Steve, Kate Sredl, Brian Burwell, and Lisa Gold. "Medicaid Long Term Care Expenditures FY 2009." Cambridge, MA: Thomson Reuters, 2010. Available at http://nasuad.org/hcbs/article/medicaid-long-term-care-expenditures-fy-2009. Accessed December 17, 2013.
Gaugler, Joseph, Sue Duval, Keith Anderson, and Robert Kane. "Predicting Nursing Home Admission in the US: A Meta-Analysis."BMC Geriatrics, 2007, vol. 7, no. 13, pp. 1-14.
Harrington, Charlene, Helen Carrillo, Brandee Blank, and Teena O'Brian. "Nursing Facilities, Staffing, Residents and Facility Deficiencies, 2004 Through 2009." San Francisco, CA: University of California, San Francisco, 2010. Available at http://www.pascenter.org/documents/OSCAR_complete_2010.pdf.
Kaiser Commission on Medicaid and the Uninsured (KCMU). "Medicaid Financial Eligibility: Primary Pathways for the Elderly and People with Disabilities." Menlo Park, CA: Kaiser Family Foundation, 2010. Available at http://www.kff.org/medicaid/upload/8048.pdf. Accessed December 17, 2013.
Kaiser Commission on Medicaid and the Uninsured and the University of California, San Francisco (UCSF). "Medicaid Home and Community-Based Service Programs: 2009 Data Update." 2010. Analysis by KCMU and USCF based on CMS Form 372, December 2012, Table 6. Available at http://kff.org/medicaid/state-indicator/aged-ageddisabled-hcbs-expenditures/. Accessed December 17, 2013.
Kaye, H. Stephen, Charlene Harrington, and Mitchell P. LaPlante. "Long-Term Care: Who Gets It, Who Provides It, Who Pays, and How Much?" Health Affairs, 2010, vol. 29, no. 1, pp. 11-21.
Lakin, K. Charlie, and Margaret J. Hall. "Medicaid-Financed Residential Care for Persons with Mental Retardation." Health Care Financing Review, 1990, vol. 11, no. 2, pp. 149-160.
Lakin, K. Charlie, Sheryl Larson, Patricia Salmi, and Amanda Webster. "Residential Services for Persons with Developmental Disabilities: Status and Trends Through 2009." Minneapolis, MN: University of Minnesota, Research and Training Center on Community Living, Institute on Community Integration, 2010. Available at http://www.rtc.umn.edu/risp/docs/risp2009.pdf. Accessed on December 11, 2013.
Lakin, K. Charlie, Naomi Scott, Kathryn Alba, and Robert W. Prouty. "Utilization and Expenditures for Medicaid Institutional and Home and Community Based Services." In Residential Services for Persons with Developmental Disabilities: Status and Trends Through 2007, edited by Robert W. Prouty, Kathryn Alba, and K. Charlie Lakin. Minneapolis, MN: University of Minnesota, Research and Training Center on Community Living, Institute on Community Integration, 2008. Available at http://rtc.umn.edu/risp/docs/risp2007.pdf. Accessed on December 17, 2013.
Li, Yue. "Provision of Mental Health Services in U.S. Nursing Homes, 1995-2004." Psychiatric Services, 2010, vol. 61, no 4, pp. 349-355.
Molinari, Victor, David Chiriboga, Laurence G. Branch, Soyeon Cho, Kristen Turner, Jing Guo, and Kathryn Hyer. "Provision of Psychopharmacological Services in Nursing Homes." Journals of Gerontology: Series B, 2009, vol. 65B, no. 1, pp. 57-60.
Prouty, Robert W., Kathryn Alba, and K. Charlie Lakin. "Background and Summary of Medicaid Long-Term Care Programs." In Residential Services for Persons with Developmental Disabilities: Status and Trends Through 2007, edited by Robert W. Prouty, Kathryn Alba, and K. Charlie Lakin. Minneapolis, MN: University of Minnesota, Research and Training Center on Community Living, Institute on Community Integration, 2008. Available at http://rtc.umn.edu/risp/docs/risp2007.pdf.
State of Alaska, Department of Health and Social Services. "Alaska Medicaid Recipient Services." Revised September 2013. Available at http://dhss.alaska.gov/dhcs/Documents/PDF/Recipient-Handbook.pdf. Accessed December 23, 2013.
University of Colorado. "The State of the States in Developmental Disabilities Project." 2013. Available at http://www.stateofthestates.org/index.php/intellectualdevelopmental-disabilities/state-profiles. Accessed December 17, 2013.
U.S. Department of Health and Human Services, Office of the Assistant Secretary for Planning and Evaluation (ASPE). "Understanding Medicaid Home and Community Services: A Primer, 2010 Edition." Available at http://aspe.hhs.gov/daltcp/reports/2010/primer10.htm. Accessed December 19, 2013.
U.S. Supreme Court. "Olmstead v. L. C. (98-536) 527 U.S. 581." 1999. Available at http://www.law.cornell.edu/supct/pdf/98-536P.ZO. Accessed December 17, 2013.
Wiener, Joshua M., Wayne L. Anderson, and David Brown. "Why Are Nursing Home Utilization Rates Declining?" Research Triangle Park, NC: RTI International, 2009. Available at http://nasuad.org/sites/nasuad/files/hcbs/files/160/7990/SCGNursing.pdf. Accessed on November 19, 2013.
Western Interstate Commission for Higher Education Mental Health Program. "Alaskans At Risk of Out-of-State Placement Due to Complex Behavior Management Needs." Boulder, CO: Western Interstate Commission for Higher Education, 2009. Available at http://dhss.alaska.gov/dsds/Documents/pdfs/Issue_Analysis_and_Options_Brief_Final_7-31.pdf. Accessed on December 17, 2013.
Wenzlow, Audra T., Robert Schmitz, and Jill Gurvey. "Volume II: Medicaid-Financed Nursing Home Services: Characteristics of People Served and Their Patterns of Care, 2001-2002." Cambridge, MA: Mathematica Policy Research, 2008. Available at http://www.mathematica-mpr.com/publications/PDFs/medicaidfinanced.pdf. Accessed on December 8, 2010.
APPENDIX A. GLOSSARY OF TERMS
This glossary provides summary definitions of the terms used in this report.
Admission: Date at which an individual was reported to have been admitted to the institution for which a Medicaid claim has been paid. Admission may occur before the beginning of a Medicaid-financed institutional spell if a person entered the facility with a separate source of payment--for example, Medicare or private insurance--before Medicaid began covering services.
Adult (BOE Group): A BOE group that includes pregnant women and caretaker relatives in families with dependent children. (Adults who are eligible for Medicaid due to disability are coded as disabled.)
Age: Age is defined as the enrollee's age at the beginning of his or her first new Medicaid-covered institutional spell between July 1, 2008, and December 31, 2009.
Aged (BOE Group): A BOE group that includes enrollees age 65 or older who qualified for Medicaid due to their age. Because some states code all people over 65 as aged, enrollees who were older than 65 but were categorized in another BOE group in MAX were recorded as aged for this study.
Basis of Eligibility (BOE): Eligibility grouping that CMS has traditionally used to classify enrollees as children, adults, aged, or eligible on the basis of disability.
Cash Assistance-Related (MAS Group): A MAS group that includes individuals receiving SSI benefits or mandatory state supplements and those who would have qualified under the pre-welfare reform Aid to Families with Dependent Children rule. Among enrollees who are aged or have disabilities, the cash assistance-related MAS group consists of people satisfying the first, SSI-related requirement.
Child (BOE Group): A BOE group that includes persons under age 18 or under age 21 in states electing to cover older children. (Children who are eligible for Medicaid due to disability are coded as disabled.)
Disabled (BOE Group): A BOE group that includes persons of any age (including children) who are unable to engage in substantial gainful activity by reason of any medically determinable physical or mental impairment that can be expected to result in death or that has lasted or can be expected to last for a continuous period of at least 12 months. Because people over 65 with disabilities are often but not always categorized as aged, all people over 65 with disabilities were recoded as aged in this study.
Dual-Eligibles: Persons dually enrolled in Medicare and Medicaid. In MAX, dual-eligibles are identified as people in the Medicaid Statistical Information System (MSIS) with matching records in the Medicare Enrollment Database, indicating enrollment in both Medicare and Medicaid in at least one month during the study period.
Fee-for-Service (FFS): A payment mechanism in which Medicaid pays for each utilized service and does not include services provided under capitated arrangements.
Home and Community-Based Services (HCBS): Services covered under Section 1915(c) waivers and personal care, residential care, home health care, adult day care, and private duty nursing services that are mandatory or are provided at state option. Because unduplicated measures of HCBS waiver use and service-specific use are not available in the MAX Person Summary files, this analysis identified HCBS recipients as those who either received services through an HCBS waiver or used one or more of the following state plan community-based services: personal care, residential care, home health care, adult day care, and private duty nursing.
Intermediate Care Facility for Individuals with Intellectual Disabilities (ICF/IID): ICFs/IID are Medicaid-financed facilities for the care of individuals with ID/DD. These institutions are an optional Medicaid benefit that states may choose to offer; they are required to have four or more beds and offer treatment or rehabilitative services to people with ID/DD.
Maintenance Assistance Status (MAS): Eligibility grouping traditionally used by CMS to classify enrollees by the financial-related criteria by which they are eligible for Medicaid. MAS groups include cash assistance-related, medically-needy, poverty-related, Section 1115 demonstration waiver, and other.
Managed Care: Payment mechanism used to manage health care, including services provided by health maintenance organizations or PACE, prepaid health plans, and primary care case management plans. Services provided under managed care plans are not included in the measures summarized in this report.
Medically-Needy (MAS Group): An MAS group that includes persons qualifying for Medicaid through the medically-needy provision (a state option) that enables states to cover persons with higher incomes who may have significant medical expenses. Persons with income above the medically-needy threshold can deduct incurred medical expenses from their income and/or assets--or "spend down" their income/assets--to determine financial eligibility.
Other (MAS Group): An MAS group that comprises a mixture of mandatory and optional coverage groups not reported under the other MAS categories, including many institutionalized people who are aged or have disabilities qualifying under the "300 percent rule," which allows individuals with income up to 300 percent of the SSI threshold to qualify for Medicaid assistance for institutional care; those qualifying through HCBS waivers; individuals ineligible for SSI due only to their Social Security Disability Insurance benefits; and those covered under more restrictive requirements than SSI standards in Section 209(b) states. This MAS group also includes many other groups, such as children receiving Title IV-E foster care payments or adoption assistance and caretaker relatives.
Poverty-Related (MAS Group): An MAS group that consists of persons qualifying through any poverty-related Medicaid expansions enacted from 1988 on. For example, states can elect to extend full Medicaid benefits to otherwise ineligible people who are aged or have disabilities up to 100 percent of the federal poverty level. In addition, this group includes people qualifying only as Qualified Medicare Beneficiaries, Specified Low-Income Medicare Beneficiaries, or Qualified Individuals.
Program of All-Inclusive Care for the Elderly (PACE): A managed care plan that coordinates both acute care and long-term care for eligible enrollees (those who are 55 and older, living in a PACE area, and otherwise eligible for nursing home care). A capitated payment mechanism is used for PACE plan enrollees. As a result, service-specific information is not available for services provided under PACE or other managed plans.
Restricted-Benefit Enrollees: Enrollees who receive limited Medicaid coverage, including unqualified aliens only eligible for emergency hospital benefits, Medicare enrollees eligible only for cost-sharing, people eligible only for premium assistance, and people eligible for only family-planning services. Some enrollees may be eligible for a restricted set of services but are coded as full-benefit enrollees--for example, those eligible for only prescription drug coverage.
Section 1115 Demonstration Waiver (MAS Group): An MAS group that consists of people eligible for Medicaid via a state Section 1115 waiver program. The Secretary of Health and Human Services may authorize Section 1115 demonstrations to permit states to test innovative approaches to providing health services to low-income residents, including extending benefits to certain otherwise ineligible persons. Some states provide only pharmacy benefits or other limited services to Section 1115 enrollees, although a few states provide full Medicaid benefits to persons qualifying through Section 1115 provisions. Many Section 1115 waivers also have other provisions such as mandatory managed care coverage but the Section 1115 eligibility category only relates to eligibility extensions. Individuals who are aged or have disabilities in the Section 1115 group typically qualify under poverty-related expansions.
Section 209(b) State: A state that elected to use more restrictive eligibility requirements than those of the SSI program, but these requirements cannot be more restrictive than those in place in the state's Medicaid plan as of January 1, 1972. Section 209(b) states include Connecticut, Hawaii, Illinois, Indiana, Minnesota, Missouri, New Hampshire, North Dakota, Ohio, Oklahoma, and Virginia.
Skilled Nursing Facility (SNF) Care: Medicare Part A (hospital insurance) covers skilled nursing care in a SNF following a qualifying inpatient hospital stay for up to 100 days. For individuals who are dually enrolled in Medicaid and Medicare, Medicaid covers only the copayments associated with this care.
Spell: A period during which a person received Medicaid-covered nursing home or ICF/IID services. Because MAX data were available only through December 31, 2009, at the time of this study, all spells are censored on that date.
APPENDIX B. DATA AND METHODS
The 2008 and 2009 MAX Person Summary (PS) and Long-Term Care (LT) files were the primary data sources for this study. In this chapter, we summarize these data and describe the construction of institutional spells. We then describe the construction of the analytic file and conclude with a discussion of the strengths and limitations of the MAX data for assessing patterns of institutional use.
The Centers for Medicare and Medicaid Services (CMS) produces the MAX data from the MSIS, to which states submit enrollee eligibility and claims data on a quarterly basis. MAX is an extract of MSIS designed for research use. Each year of MAX data consists of a person-level summary file--containing data on enrollees' eligibility, demographic characteristics, and a summary of claims--and claims files that include detailed data on claims for services used during the calendar year.
A. Demographic and Eligibility Measures from the MAX PS Files
The MAX PS file contains demographic data on each person enrolled in Medicaid in a given year. These data include date of birth, gender, race, and ethnicity. They also provide information regarding the person's eligibility, including each enrollee's BOE and MAS. Finally, the PS file includes summary claims information derived from the MAX claims-based files. Of the four BOE groupings--children, adults, aged, and individuals with disabilities--we limited our analysis to the elderly and enrollees eligible on the basis of disability, as they are the most likely to require institutional care. Following Wenzlow et al. (2013) and Ballou et al. (2013), we recoded all individuals over 65 as elderly. Consequently, the category of disabled refers to all enrollees under 65 living with disabilities.
People with disabilities and the elderly can qualify for Medicaid benefits in a variety of ways. The MAX data categorize an enrollee's MAS as cash assistance-related, medically-needy, poverty-related, Section 1115 demonstration expansion, or other.
-
Cash Assistance-Related. Individuals qualify through receipt of SSI benefits or state supplements.
-
Medically-Needy. States with medically-needy programs permit individuals with higher incomes but significant medical expenses to "spend down" their income, computing financial eligibility for benefits by deducting qualifying medical expenses from income. In 2009, 33 states and the District of Columbia had medically-needy programs covering the elderly and people with disabilities (CMS 2013).
-
Poverty-Related. In states that have enacted poverty-related expansions to their Medicaid programs, otherwise ineligible individuals who are over 65 or living with disabilities can qualify for benefits if their incomes are less than a specified percentage of the federal poverty level. In 2009, 17 states and the District of Columbia set their eligibility levels at 100 percent of the federal poverty level or higher (KCMU 2010).
-
Section 1115 Demonstration Expansion. People with disabilities and the elderly may qualify for benefits in states that have been granted Section 1115 demonstration waivers to expand eligibility, generally through less restrictive poverty-related criteria. In many circumstances, expanded eligibility is available only to individuals enrolled in managed care. In 2009, 35 states and the District of Columbia had Section 1115 expanded eligibility waivers (CMS 2013).
-
Other. Individuals may qualify for benefits for reasons other than those described by the groupings above, depending on a state's particular eligibility rules. In particular, many individuals living in medical institutions qualify under the "300 percent rule," under which institutionalized persons with income up to 300 percent of the SSI standard are eligible to receive Medicaid benefits. In 2009, 40 states utilized rules to set special income levels for institutionalized individuals (CMS 2013).
B. Using the MAX LT Claims Files to Construct Spells of Care
We used the MAX LT files from 2008 and 2009 to identify spells of nursing home or ICF/IID care. These files include all Medicaid claims for long-term care incurred in the 2008 and 2009 calendar years by enrollees in nursing facilities, ICFs/IID, mental hospitals for the aged, and inpatient psychiatric facilities for individuals under 21. In keeping with the focus of this study, we excluded all claims not indicating services provided in either nursing facilities or ICFs/IID.
To construct spells, we input the LT claims records for nursing facility and ICF/IID services for each enrollee, and sorted them by enrollee, service beginning date, and service ending date. A spell begins with the service beginning date of the enrollee's first nursing facility or ICF/IID claim and continues at least until the claim's service ending date. If the same enrollee has a separate subsequent claim for the same type of service (nursing facility or ICF/IID) with a service beginning date within two calendar months, then the spell is extended. We continued linking claims of the same type of service until no additional claims had service beginning dates within two calendar months of the previous claim's ending date of service. At this point, we considered the spell complete and calculated its length in days by subtracting the initial claim's service beginning date from the final claim's ending date and adding one day. Any subsequent claims for the same type of service beyond the two calendar month window marked the beginning of a separate spell or spells. In addition, the service beginning date of claims indicating a different type of service (ICF/IID instead of nursing home, or vice versa) also marked the beginning of separate spells, even if these claims began within two months of the ending date of service for another long-term care claim.
We considered a nursing home spell to be "Medicaid-financed" whenever a Medicaid claim for services rendered in a nursing facility or ICF/IID was identified in the data. Because Medicaid is a payer of last resort, in some cases spells might have been defined as Medicaid-financed solely because Medicaid paid copayments for Medicare services. Medicare covers SNF care for dually eligible individuals who require it following a qualifying inpatient hospital stay (CMS 2007).32 Thus, some of the shorter spells included in this analysis, while indicating use of institutional care, likely do not reflect the use of true long-term care by individuals who expect to be institutionalized for an extended period of time. We identified spells that likely represent SNF care by comparing the Medicare co-insurance payments with the total amount Medicaid paid for a claim. Spells in which the total Medicaid payment was within $5 of the Medicare co-insurance payment were identified as SNF spells. However, states do not consistently report Medicare co-insurance on all claims and we were only able to identify SNF spells for claims that contained this information. Appendix C lists states for which we were able to identify less than 1 percent of nursing home spells as SNF spells, which may represent an undercounting of such spells in these states.
We also assessed an alternate approach to identifying the length of institutional spells. In MAX 2009, many states reported facility admission dates in addition to service start dates for most institutional claims. For claims that contained admission dates, we also assessed spell length based on this date. Seven states (Missouri, New York, Ohio, South Carolina, South Dakota, Texas, and Utah) and the District of Columbia did not report nursing home admission date on any nursing home claims and were excluded from this analysis. For stays with a Medicaid coverage start date from July 2008 through December 2008, we compared the length of nursing home spells based on Medicaid start date and on facility admission date by state and for all 35 states with reliable data. We also calculated the median length of time between facility admission date and Medicaid start date for these spells.
C. Construction of the Analysis File
We appended data on spells to data on demographic, eligibility, and enrollment information from the PS file to create a person-level analysis file for the calendar years 2008 and 2009. As indicated earlier, we limited the analysis to enrollees with disabilities and the elderly. We further restricted our attention to individuals qualifying for full Medicaid benefits (as opposed to, for example, individuals qualifying for the Qualified Medicare Beneficiary program).
Creation of the data set required merging two separate years of data. Some states changed enrollee MSIS individual identifiers (IDs) between years or at other times for certain individuals. To maximize our match rate, we supplemented unique IDs with Social Security numbers, when available, in the matching process to construct our analytic file. Records with the same Social Security number and date of birth were assumed to be for the same person. We created a link file containing new analysis IDs for each individual within a state and utilized these IDs to collapse claim records, merge demographic and enrollment data over the two years, and finally, merge institutional (nursing home or ICF/IID) spell characteristics with the person-level enrollment data.
Although we only analyzed spells that occurred during the 18-month period from July 1, 2008, through December 31, 2009, we retained data from all 24 months to enhance our analysis of individuals' enrollment status prior to nursing home or ICF/IID use. Following Wenzlow et al. (2013) and Ballou et al. (2013), we chose to analyze 18 months of data in order to obtain the largest possible sample of institutional care users while utilizing the most current MAX data available.
Our analysis of spells focused exclusively on new spells of nursing facility or ICF/IID care and primarily on first new spells. We defined a new spell as a spell with a service beginning date on or after July 1, 2008, as distinguished from spells that existed prior to our period of analysis. Some individuals had multiple new spells of care because they received services at both a nursing facility and an ICF/IID, because their stays were separated by two months in which no institutional care was received, or both. When not explicitly analyzing these multiple spells, we restricted the analysis to enrollees' first new spells during the period of analysis. Because spells were censored at December 31, 2009, length-of-spell statistics based on all first new spells are biased downward. In analyzing the length of spells and the association between spell length and policy variables, we sought to mitigate this problem by restricting the analysis to first new spells beginning between July 1, 2008, and December 31, 2008, inclusive.
D. Data Strengths and Limitations
Using the MAX data offers several advantages for this type of analysis. Because detailed person-level and claim-level data are required to construct spells of institutional care, it is possible to analyze institutional stays with MAX data but not aggregate data. Unlike survey data, which are typically limited in sample size and period of observation, MAX claim records provide continuous information about Medicaid-covered service use throughout the period for which MAX data are available. This enables researchers to observe the order in which institutional services and HCBS were used for individuals using both institutional and community-based services. Finally, while reporting errors and data anomalies often limit analyses based on administrative files, nursing home and ICF/IID services are easily identifiable by place of service when reported by states to MSIS. MAX data for nursing facility and ICF/IID care in most states are generally thought to be reliable.
Nevertheless, there are limitations to using MAX data for person-level and spell-level analyses of institutional care that should be kept in mind when interpreting our results, including incomplete information, double-counting of enrollees, censoring of spells, data anomalies, and timeliness.
1. Incomplete Information
Some types of information about nursing facility and ICF/IID service use are not included in MAX, as follows:
-
Managed Care. Nursing facility use reported here reflects use of services paid under FFS arrangements only.33 Nursing facility services are rarely covered under managed care arrangements, with Arizona's program being a notable exception. However, managed care now also covers all elderly in Minnesota and most long-term care users in New Mexico and is growing in other states.
-
Bulk Payments. Because MAX contains only person-level data, services that are paid (or debited) for multiple individuals in lump sum--for example, services paid for nursing facilities in bulk, some capitated payments, and disproportionate-share hospital payments--are not included in the files.
-
Services Not Covered by Medicaid. While Medicaid is the primary provider of nursing home care nationally, it is important to keep in mind that other nursing home stays--for example, those covered only by Medicare, private insurance, or the patient--are not captured in MAX, even for low-income individuals who are aged or have disabilities. For example, while Medicare does not cover long-term nursing home care, short rehabilitative stays for acute conditions requiring skilled nursing care are covered. Such stays will not be identified in MAX unless Medicaid made supplementary payments for the stay on behalf of the enrollee.34
Because payments made in bulk and managed care payments are not included in MAX, expenditures for nursing home care can be severely underestimated for states with large long-term care managed care programs or those paying a large portion of their nursing facility expenditures in bulk. However, because many bulk payments are paid over and above services used by individuals, biases in estimates of utilization, the focus of this study, are expected to be less severe. Similarly, even small payments made by Medicaid for services largely covered by Medicare will be identified in our utilization measures. Because low-income people who are aged or have disabilities typically have few alternatives to Medicaid, we expect the estimates in this report to closely match the characteristics of all nursing facility users among aged or disabled enrollees except for those with very short stays under 20 days that are fully covered by Medicare.
2. Double-Counting of Enrollees
Individuals who use Medicaid services in more than one state are observed as two people living in separate states in MAX. This double-counting implies that national measures of Medicaid nursing facility and ICF/IID use are overestimated. We expect movement across states among the institutionalized elderly and people with disabilities to be limited and have a small impact on our estimates.
3. Censoring of Spells
All observations of nursing home spells in our analysis are censored on December 31, 2009. Consequently, the length-of-spells is biased downward. We sought to mitigate this problem in analyses of spell lengths by further restricting our sample to include only spells beginning between July 1, 2008, and December 31, 2008, inclusive.
4. Data Anomalies
As with most administrative files of similar size and scope, MAX data contain a variety of data anomalies. Inconsistent reporting practices with respect to changes in eligibility status over time, admission dates, and patient discharge status codes limit the generalizations possible from the results presented in this report. A table of data anomalies associated with MAX nursing facility and ICF/IID data in 2008 and 2009 is provided in Appendix C.
5. Timeliness
Due to extensive reporting, data cleaning, and file construction requirements, MAX data are not as current as may be needed to address certain nursing facility and ICF/IID policy questions. For example, to the extent that the increased emphasis on HCBS in recent years has driven declines in the use of institutional care, the most recently available MAX data (for the year 2009) might not reflect current nursing facility and ICF/IID utilization rates. The statistics in this report reflect the population and state Medicaid programs in place in 2008 and 2009.
Due to some of the MAX data limitations described above, MAX data for Arizona, Hawaii, Maine, Minnesota, New Mexico, Oregon, Tennessee, and Wisconsin were excluded from analyses presented in this report. In addition, analyses of state policy variables excluded the following four states because their HCBS data were not believed to be reliable: Massachusetts, Michigan, Montana, and Rhode Island. Appendix C provides information about the data quality issues and data anomalies that resulted in exclusion of these states as well as known data anomalies in all other states.
APPENDIX C. STATE NURSING HOME AND ICF/IID DATA ANOMALIES
MAX data contain a variety of anomalies, many of which are specific to individual states and to specific years of data. The anomalies most likely to affect analyses of nursing home or ICF/IID care are listed in Table C.1, by state. A full list of anomalies is available from the CMS website.35 Unless otherwise indicated, all anomalies and notes below relate to 2009 MAX data.
As a result of these anomalies, eight states were excluded from all analyses: Maine because 2009 inpatient, long-term care, and other claims were unavailable; Arizona, Hawaii, Minnesota, New Mexico, Oregon, and Tennessee because these states provide most services to Medicaid enrollees who are aged or have disabilities via managed care arrangements or provide many long-term care services via managed care contracts, whereas this study analyzes services provided on a FFS basis; and Wisconsin, because its expenditure data for ILTC varied substantially from corresponding CMS Form 64 data in 2009 and also a lag in the submission of claims files for 2009 suggest that the MAX data may be unreliable or incomplete.
Analyses of the association between institutional care and HCBS use omitted four other states because the quality of their HCBS data was believed to be unreliable: Massachusetts, Michigan, Montana, and Rhode Island (see Borck et al. 2014 for details on data quality concerns related to HCBS data in these states).
In all states, expenditures reported as service tracking claims are not included in MAX as they cannot be attributed to specific persons for specific services. In addition, states use a variety of time periods for billing long-term care services ranging from weekly to monthly and sometimes reflecting the actual time period with covered days. This means that the number of covered days per claim varies between and within states.
| State | Excluded from All Analyses | Excluded from Analysisof State PoliciesDue to UnreliableHCBS Data | High Managed CarePenetration Among EnrolleesWho are Agedor Have Disabilities(>50%) or HighManaged Long-TermCare Penetration | MAX ILTC ExpendituresDiffer from CMSForm 64 Expendituresby at Least30% in 2009a | Less Than 1%of Nursing HomeStays Were Identifiedas Medicare SNFStaysb | Long-Term CareClaims with MissingAdmission Datesc | Other |
| SOURCE: Mathematica analysis of MAX 2008 and 2009 data, MAX 2008 and 2009 claims and eligibility data anomaly tables, CMS Form 64 FY 2009 (Eiken et al. 2010). NOTES:
| |||||||
| Alabama | |||||||
| Alaska | -31% | ||||||
| Arizona | X | X | |||||
| Arkansas | |||||||
| California | |||||||
| Colorado | |||||||
| Connecticut | |||||||
| Delaware | |||||||
| District of Columbia | X (98%) | ||||||
| Florida | X | ||||||
| Georgia | X | ||||||
| Hawaii | X | X | -99% | ||||
| Idaho | Lag in claim submissions in 2009 | ||||||
| Illinois | X | ||||||
| Indiana | X | ||||||
| Iowa | 11% | ||||||
| Kansas | X | ||||||
| Kentucky | |||||||
| Louisiana | X | ||||||
| Maine | X | -100% | Claims data incomplete in 2008 and 2009 | ||||
| Maryland | X | ||||||
| Massachusetts | X | ||||||
| Michigan | X | ||||||
| Minnesota | X | X | -68% | X | |||
| Mississippi | |||||||
| Missouri | X (100%) | ||||||
| Montana | X | X | . | ||||
| Nebraska | |||||||
| Nevada | |||||||
| New Hampshire | -31% | ||||||
| New Jersey | 13% | ||||||
| New Mexico | X | X | -53% | 46% | |||
| New York | X (99%) | ||||||
| North Carolina | |||||||
| North Dakota | |||||||
| Ohio | X (100%) | ||||||
| Oklahoma | |||||||
| Oregon | X | X | -35% | ||||
| Pennsylvania | X | ||||||
| Rhode Island | X | -65% | X | ||||
| South Carolina | X | X (94%) | |||||
| South Dakota | X (100%) | ||||||
| Tennessee | X | X | -99% | X | |||
| Texas | X | X (100%) | |||||
| Utah | X (99%) | ||||||
| Vermont | |||||||
| Virginia | X | ||||||
| Washington | -36% | X | |||||
| West Virginia | X | ||||||
| Wisconsin | X | X | -32% | Lag in submission of claims data in 2009 | |||
| Wyoming | |||||||
APPENDIX D. SUPPLEMENTARY DATA TABLES
| State | Number of Enrolleeswith New NursingHome Spells | Distribution of Length of First Spell (percentage) | ||||
| Less than 3 Months | 3-6 Months | 6-9 Months | 9-12 Months | More than 12 Months | ||
| All 43 states | 234,461 | 34.6 | 13.0 | 7.5 | 5.1 | 39.8 |
| SOURCE: Mathematica analysis of 2008-2009 MAX data for 42 states and the District of Columbia with representative FFS nursing home and ICF/IID data (excludes data from Arizona, Hawaii, Maine, Minnesota, New Mexico, Oregon, Tennessee, and Wisconsin). NOTE: New spells in this table are spells beginning between July 1, 2008 and December 31, 2008, inclusive; spells are censored at December 31, 2009. | ||||||
| Alabama | 3,599 | 30.0 | 12.0 | 6.3 | 4.9 | 46.8 |
| Alaska | 234 | 59.0 | 10.3 | 7.3 | 1.7 | 21.8 |
| Arkansas | 2,456 | 27.5 | 12.0 | 7.4 | 4.9 | 48.2 |
| California | 25,545 | 49.1 | 12.6 | 6.0 | 3.9 | 28.3 |
| Colorado | 2,712 | 30.5 | 12.0 | 7.1 | 5.4 | 44.9 |
| Connecticut | 4,754 | 39.1 | 11.1 | 5.9 | 3.9 | 39.9 |
| Delaware | 611 | 27.5 | 14.1 | 7.7 | 4.7 | 46.0 |
| District of Columbia | 915 | 32.2 | 9.7 | 6.3 | 4.6 | 47.1 |
| Florida | 13,775 | 28.2 | 15.4 | 9.0 | 6.3 | 41.0 |
| Georgia | 6,018 | 24.7 | 13.5 | 7.9 | 6.0 | 47.9 |
| Idaho | 913 | 37.9 | 11.7 | 7.3 | 4.7 | 38.3 |
| Illinois | 12,815 | 32.5 | 13.8 | 8.9 | 5.6 | 39.3 |
| Indiana | 7,233 | 27.8 | 13.2 | 9.2 | 6.2 | 43.6 |
| Iowa | 2,949 | 24.3 | 12.6 | 9.2 | 5.9 | 47.9 |
| Kansas | 2,675 | 26.2 | 12.9 | 8.7 | 6.3 | 45.8 |
| Kentucky | 5,690 | 41.9 | 10.1 | 6.8 | 6.1 | 35.1 |
| Louisiana | 5,100 | 27.0 | 14.0 | 9.5 | 6.7 | 42.7 |
| Maryland | 3,777 | 24.4 | 13.5 | 8.4 | 5.8 | 47.9 |
| Massachusetts | 8,733 | 46.3 | 11.9 | 6.5 | 4.0 | 31.3 |
| Michigan | 8,046 | 34.5 | 12.9 | 7.6 | 5.5 | 39.6 |
| Mississippi | 3,353 | 27.5 | 12.1 | 7.5 | 6.0 | 46.8 |
| Missouri | 7,091 | 35.9 | 12.1 | 6.5 | 5.0 | 40.5 |
| Montana | 914 | 35.3 | 12.9 | 9.0 | 3.1 | 39.7 |
| Nebraska | 2,025 | 34.9 | 12.6 | 8.0 | 4.9 | 39.5 |
| Nevada | 982 | 35.5 | 14.4 | 8.2 | 6.5 | 35.3 |
| New Hampshire | 1,225 | 30.0 | 11.3 | 6.3 | 4.5 | 48.0 |
| New Jersey | 6,893 | 27.2 | 13.0 | 8.3 | 5.9 | 45.6 |
| New York | 20,313 | 39.3 | 13.9 | 5.8 | 4.0 | 37.0 |
| North Carolina | 7,959 | 32.6 | 13.0 | 7.8 | 5.4 | 41.2 |
| North Dakota | 712 | 26.3 | 11.5 | 8.4 | 5.1 | 48.7 |
| Ohio | 14,763 | 37.1 | 13.3 | 7.6 | 4.6 | 37.4 |
| Oklahoma | 3,140 | 34.6 | 12.7 | 7.9 | 4.9 | 39.9 |
| Pennsylvania | 13,512 | 26.4 | 13.0 | 7.8 | 5.7 | 47.2 |
| Rhode Island | 1,471 | 30.2 | 11.8 | 8.0 | 4.5 | 45.6 |
| South Carolina | 2,800 | 28.3 | 12.0 | 7.9 | 5.9 | 45.8 |
| South Dakota | 948 | 29.9 | 12.6 | 6.8 | 4.3 | 46.5 |
| Texas | 15,211 | 31.1 | 12.9 | 7.5 | 5.4 | 43.1 |
| Utah | 642 | 51.6 | 13.1 | 6.5 | 4.7 | 24.1 |
| Vermont | 697 | 42.2 | 11.5 | 6.6 | 3.9 | 35.9 |
| Virginia | 4,953 | 28.6 | 13.5 | 8.2 | 5.7 | 43.9 |
| Washington | 3,996 | 41.7 | 14.7 | 8.0 | 4.4 | 31.3 |
| West Virginia | 1,936 | 30.4 | 13.3 | 7.2 | 6.0 | 43.0 |
| Wyoming | 375 | 32.0 | 10.7 | 6.7 | 7.5 | 43.2 |
| State | All Spells | Medicare SNF Spells Excluded | ||||||||||
| Number of Enrolleeswith New NursingHome Spells | Less than3 Months | 3-6Months | 6-9Months | 9-12Months | More than12 Months | Number of Enrolleeswith New NursingHome Spells | Less than3 Months | 3-6Months | 6-9Months | 9-12Months | More than12 Months | |
| All 43 states | 234,461 | 34.6 | 13.0 | 7.5 | 5.1 | 39.8 | 223,665 | 31.6 | 13.4 | 7.8 | 5.4 | 41.8 |
| SOURCE: Mathematica analysis of 2008-2009 MAX data for 42 states and the District of Columbia with representative FFS nursing home and ICF/IID data (excludes data from Arizona, Hawaii, Maine, Minnesota, New Mexico, Oregon, Tennessee, and Wisconsin). NOTE: New spells are spells beginning between July 1, 2008 and December 31, 2008. Medicare SNF spells are spells for which total Medicaid payments were within $5 of Medicare co-insurance amounts. | ||||||||||||
| Alabama | 3,599 | 30.0 | 12.0 | 6.3 | 4.9 | 46.8 | 3,200 | 22.2 | 12.3 | 7.2 | 5.5 | 52.8 |
| Alaska | 234 | 59.0 | 10.3 | 7.3 | 1.7 | 21.8 | 175 | 45.7 | 13.1 | 9.7 | 2.3 | 29.1 |
| Arkansas | 2,456 | 27.5 | 12.0 | 7.4 | 4.9 | 48.2 | 2,146 | 18.1 | 12.5 | 8.5 | 5.6 | 55.4 |
| California | 25,545 | 49.1 | 12.6 | 6.0 | 3.9 | 28.3 | 21,107 | 39.2 | 14.3 | 7.3 | 4.7 | 34.4 |
| Colorado | 2,712 | 30.5 | 12.0 | 7.1 | 5.4 | 44.9 | 2,599 | 27.7 | 12.5 | 7.4 | 5.6 | 46.9 |
| Connecticut | 4,754 | 39.1 | 11.1 | 5.9 | 3.9 | 39.9 | 3,917 | 27.4 | 12.2 | 7.1 | 4.7 | 48.6 |
| Delaware | 611 | 27.5 | 14.1 | 7.7 | 4.7 | 46.0 | 522 | 16.5 | 15.1 | 9.0 | 5.6 | 53.8 |
| District of Columbia | 915 | 32.2 | 9.7 | 6.3 | 4.6 | 47.1 | 878 | 29.3 | 10.1 | 6.6 | 4.8 | 49.2 |
| Florida | 13,775 | 28.2 | 15.4 | 9.0 | 6.3 | 41.0 | 13,775 | 28.2 | 15.4 | 9.0 | 6.3 | 41.0 |
| Georgia | 6,018 | 24.7 | 13.5 | 7.9 | 6.0 | 47.9 | 5,999 | 24.5 | 13.5 | 7.9 | 6.0 | 48.1 |
| Idaho | 913 | 37.9 | 11.7 | 7.3 | 4.7 | 38.3 | 903 | 37.2 | 11.7 | 7.4 | 4.8 | 38.9 |
| Illinois | 12,815 | 32.5 | 13.8 | 8.9 | 5.6 | 39.3 | 12,815 | 32.5 | 13.8 | 8.9 | 5.6 | 39.3 |
| Indiana | 7,233 | 27.8 | 13.2 | 9.2 | 6.2 | 43.6 | 7,222 | 27.7 | 13.3 | 9.2 | 6.2 | 43.6 |
| Iowa | 2,949 | 24.3 | 12.6 | 9.2 | 5.9 | 47.9 | 2,940 | 24.0 | 12.7 | 9.3 | 5.9 | 48.1 |
| Kansas | 2,675 | 26.2 | 12.9 | 8.7 | 6.3 | 45.8 | 2,672 | 26.2 | 12.9 | 8.7 | 6.3 | 45.9 |
| Kentucky | 5,690 | 41.9 | 10.1 | 6.8 | 6.1 | 35.1 | 5,664 | 41.6 | 10.2 | 6.8 | 6.2 | 35.2 |
| Louisiana | 5,100 | 27.0 | 14.0 | 9.5 | 6.7 | 42.7 | 5,099 | 27.0 | 14.0 | 9.5 | 6.7 | 42.7 |
| Maryland | 3,777 | 24.4 | 13.5 | 8.4 | 5.8 | 47.9 | 3,777 | 24.4 | 13.5 | 8.4 | 5.8 | 47.9 |
| Massachusetts | 8,733 | 46.3 | 11.9 | 6.5 | 4.0 | 31.3 | 7,110 | 35.1 | 13.4 | 8.0 | 5.0 | 38.5 |
| Michigan | 8,046 | 34.5 | 12.9 | 7.6 | 5.5 | 39.6 | 8,016 | 34.2 | 12.9 | 7.6 | 5.5 | 39.7 |
| Mississippi | 3,353 | 27.5 | 12.1 | 7.5 | 6.0 | 46.8 | 3,259 | 25.3 | 12.4 | 7.8 | 6.2 | 48.3 |
| Missouri | 7,091 | 35.9 | 12.1 | 6.5 | 5.0 | 40.5 | 7,080 | 35.8 | 12.1 | 6.5 | 5.0 | 40.5 |
| Montana | 914 | 35.3 | 12.9 | 9.0 | 3.1 | 39.7 | 914 | 35.3 | 12.9 | 9.0 | 3.1 | 39.7 |
| Nebraska | 2,025 | 34.9 | 12.6 | 8.0 | 4.9 | 39.5 | 1,820 | 28.0 | 13.6 | 9.0 | 5.5 | 43.9 |
| Nevada | 982 | 35.5 | 14.4 | 8.2 | 6.5 | 35.3 | 980 | 35.4 | 14.4 | 8.3 | 6.5 | 35.4 |
| New Hampshire | 1,225 | 30.0 | 11.3 | 6.3 | 4.5 | 48.0 | 1,075 | 20.9 | 12.0 | 7.1 | 5.2 | 54.8 |
| New Jersey | 6,893 | 27.2 | 13.0 | 8.3 | 5.9 | 45.6 | 6,851 | 26.7 | 13.1 | 8.3 | 6.0 | 45.9 |
| New York | 20,313 | 39.3 | 13.9 | 5.8 | 4.0 | 37.0 | 19,294 | 36.1 | 14.6 | 6.2 | 4.2 | 39.0 |
| North Carolina | 7,959 | 32.6 | 13.0 | 7.8 | 5.4 | 41.2 | 7,751 | 30.8 | 13.4 | 8.0 | 5.5 | 42.4 |
| North Dakota | 712 | 26.3 | 11.5 | 8.4 | 5.1 | 48.7 | 693 | 24.2 | 11.7 | 8.7 | 5.3 | 50.1 |
| Ohio | 14,763 | 37.1 | 13.3 | 7.6 | 4.6 | 37.4 | 14,394 | 35.5 | 13.5 | 7.8 | 4.8 | 38.4 |
| Oklahoma | 3,140 | 34.6 | 12.7 | 7.9 | 4.9 | 39.9 | 2,779 | 26.2 | 14.1 | 8.9 | 5.5 | 45.3 |
| Pennsylvania | 13,512 | 26.4 | 13.0 | 7.8 | 5.7 | 47.2 | 13,512 | 26.4 | 13.0 | 7.8 | 5.7 | 47.2 |
| Rhode Island | 1,471 | 30.2 | 11.8 | 8.0 | 4.5 | 45.6 | 1,471 | 30.2 | 11.8 | 8.0 | 4.5 | 45.6 |
| South Carolina | 2,800 | 28.3 | 12.0 | 7.9 | 5.9 | 45.8 | 2,800 | 28.3 | 12.0 | 7.9 | 5.9 | 45.8 |
| South Dakota | 948 | 29.9 | 12.6 | 6.8 | 4.3 | 46.5 | 924 | 28.4 | 12.6 | 6.9 | 4.4 | 47.7 |
| Texas | 15,211 | 31.1 | 12.9 | 7.5 | 5.4 | 43.1 | 15,211 | 31.1 | 12.9 | 7.5 | 5.4 | 43.1 |
| Utah | 642 | 51.6 | 13.1 | 6.5 | 4.7 | 24.1 | 522 | 40.6 | 15.9 | 8.0 | 5.7 | 29.7 |
| Vermont | 697 | 42.2 | 11.5 | 6.6 | 3.9 | 35.9 | 574 | 30.8 | 12.9 | 8.0 | 4.7 | 43.6 |
| Virginia | 4,953 | 28.6 | 13.5 | 8.2 | 5.7 | 43.9 | 4,953 | 28.6 | 13.5 | 8.2 | 5.7 | 43.9 |
| Washington | 3,996 | 41.7 | 14.7 | 8.0 | 4.4 | 31.3 | 3,996 | 41.7 | 14.7 | 8.0 | 4.4 | 31.3 |
| West Virginia | 1,936 | 30.4 | 13.3 | 7.2 | 6.0 | 43.0 | 1,932 | 30.3 | 13.4 | 7.2 | 6.1 | 43.1 |
| Wyoming | 375 | 32.0 | 10.7 | 6.7 | 7.5 | 43.2 | 344 | 25.6 | 11.6 | 7.3 | 8.1 | 47.4 |
| State | Spell Length Based on Medicaid Coverage Start Date | Spell Length Based on Admission Date | ||||||||||
| Number of Enrolleeswith New NursingHome Spells | Less than3 Months | 3-6Months | 6-9Months | 9-12Months | More than12 Months | Number of Enrolleeswith New NursingHome Spells | Less than3 Months | 3-6Months | 6-9Months | 9-12Months | More than12 Months | |
| All 35 states | 162,562 | 31.6 | 13.4 | 7.8 | 5.4 | 41.8 | 153,892 | 24.6 | 12.3 | 8.0 | 5.7 | 49.5 |
| SOURCE: Mathematica analysis of 2008-2009 MAX data for 35 states with representative FFS nursing home and ICF/IID data and reliable admission dates on nursing home claims (excludes data from Arizona, the District of Columbia, Hawaii, Maine, Minnesota, Missouri, New Mexico, New York, Ohio, Oregon, South Carolina, South Dakota, Tennessee, Texas, Utah, and Wisconsin). NOTES: New spells are spells beginning between July 1, 2008 and December 31, 2008. Medicare SNF spells are spells for which total Medicaid payments were within $5 of Medicare co-insurance amounts. All Medicare SNF spells are excluded from this analysis. Spells with missing or invalid admission date are excluded from analysis based on admission date. | ||||||||||||
| Alabama | 3,200 | 22.2 | 12.3 | 7.2 | 5.5 | 52.8 | 3,199 | 19.8 | 11.5 | 7.5 | 5.5 | 55.7 |
| Alaska | 175 | 45.7 | 13.1 | 9.7 | 2.3 | 29.1 | 175 | 42.9 | 14.3 | 10.3 | 2.3 | 30.3 |
| Arkansas | 2,146 | 18.1 | 12.5 | 8.5 | 5.6 | 55.4 | 2,146 | 12.8 | 12.1 | 8.0 | 5.9 | 61.2 |
| California | 21,107 | 39.2 | 14.3 | 7.3 | 4.7 | 34.4 | 15,133 | 39.5 | 11.8 | 6.6 | 4.6 | 37.5 |
| Colorado | 2,599 | 27.7 | 12.5 | 7.4 | 5.6 | 46.9 | 2,560 | 20.2 | 12.4 | 7.5 | 5.3 | 54.6 |
| Connecticut | 3,917 | 27.4 | 12.2 | 7.1 | 4.7 | 48.6 | 3,071 | 23.9 | 8.6 | 6.3 | 4.7 | 56.6 |
| Delaware | 522 | 16.5 | 15.1 | 9.0 | 5.6 | 53.8 | 522 | 11.9 | 12.1 | 7.5 | 5.9 | 62.6 |
| Florida | 13,775 | 28.2 | 15.4 | 9.0 | 6.3 | 41.0 | 13,481 | 26.5 | 15.3 | 9.1 | 6.6 | 42.5 |
| Georgia | 5,999 | 24.5 | 13.5 | 7.9 | 6.0 | 48.1 | 5,930 | 15.8 | 11.4 | 8.4 | 6.0 | 58.5 |
| Idaho | 903 | 37.2 | 11.7 | 7.4 | 4.8 | 38.9 | 900 | 29.7 | 13.4 | 7.9 | 5.4 | 43.6 |
| Illinois | 12,815 | 32.5 | 13.8 | 8.9 | 5.6 | 39.3 | 12,443 | 27.7 | 12.1 | 8.4 | 5.5 | 46.3 |
| Indiana | 7,222 | 27.7 | 13.3 | 9.2 | 6.2 | 43.6 | 7,220 | 18.9 | 11.3 | 8.9 | 6.4 | 54.5 |
| Iowa | 2,940 | 24.0 | 12.7 | 9.3 | 5.9 | 48.1 | 2,800 | 19.1 | 10.8 | 8.1 | 5.3 | 56.7 |
| Kansas | 2,672 | 26.2 | 12.9 | 8.7 | 6.3 | 45.9 | 2,652 | 18.1 | 10.1 | 7.1 | 5.4 | 59.3 |
| Kentucky | 5,664 | 41.6 | 10.2 | 6.8 | 6.2 | 35.2 | 5,659 | 36.8 | 9.5 | 6.5 | 5.8 | 41.4 |
| Louisiana | 5,099 | 27.0 | 14.0 | 9.5 | 6.7 | 42.7 | 5,029 | 15.5 | 10.4 | 8.1 | 6.3 | 59.7 |
| Maryland | 3,777 | 24.4 | 13.5 | 8.4 | 5.8 | 47.9 | 3,768 | 16.1 | 12.5 | 8.7 | 6.2 | 56.5 |
| Massachusetts | 7,110 | 35.1 | 13.4 | 8.0 | 5.0 | 38.5 | 7,110 | 28.7 | 12.5 | 7.8 | 5.5 | 45.5 |
| Michigan | 8,016 | 34.2 | 12.9 | 7.6 | 5.5 | 39.7 | 8,016 | 27.7 | 13.0 | 7.5 | 6.0 | 45.7 |
| Mississippi | 3,259 | 25.3 | 12.4 | 7.8 | 6.2 | 48.3 | 3,240 | 19.0 | 11.5 | 7.5 | 6.3 | 55.7 |
| Montana | 914 | 35.3 | 12.9 | 9.0 | 3.1 | 39.7 | 914 | 28.8 | 13.0 | 8.1 | 4.9 | 45.2 |
| Nebraska | 1,820 | 28.0 | 13.6 | 9.0 | 5.5 | 43.9 | 1,820 | 22.4 | 11.0 | 7.9 | 5.7 | 53.0 |
| Nevada | 980 | 35.4 | 14.4 | 8.3 | 6.5 | 35.4 | 979 | 27.7 | 15.5 | 7.8 | 7.6 | 41.5 |
| New Hampshire | 1,075 | 20.9 | 12.0 | 7.1 | 5.2 | 54.8 | 1,050 | 14.5 | 9.1 | 7.3 | 5.4 | 63.6 |
| New Jersey | 6,851 | 26.7 | 13.1 | 8.3 | 6.0 | 45.9 | 6,850 | 20.8 | 11.9 | 8.2 | 6.2 | 52.9 |
| North Carolina | 7,751 | 30.8 | 13.4 | 8.0 | 5.5 | 42.4 | 7,751 | 23.3 | 14.1 | 9.1 | 5.8 | 47.7 |
| North Dakota | 693 | 24.2 | 11.7 | 8.7 | 5.3 | 50.1 | 693 | 20.1 | 9.1 | 7.4 | 4.5 | 59.0 |
| Oklahoma | 2,779 | 26.2 | 14.1 | 8.9 | 5.5 | 45.3 | 2,778 | 20.4 | 12.9 | 8.5 | 6.0 | 52.2 |
| Pennsylvania | 13,512 | 26.4 | 13.0 | 7.8 | 5.7 | 47.2 | 13,508 | 18.8 | 12.3 | 7.9 | 5.7 | 55.3 |
| Rhode Island | 1,471 | 30.2 | 11.8 | 8.0 | 4.5 | 45.6 | 1,460 | 25.3 | 11.4 | 7.5 | 5.8 | 50.0 |
| Vermont | 574 | 30.8 | 12.9 | 8.0 | 4.7 | 43.6 | 573 | 26.9 | 11.3 | 9.1 | 4.5 | 48.2 |
| Virginia | 4,953 | 28.6 | 13.5 | 8.2 | 5.7 | 43.9 | 4,952 | 23.3 | 13.9 | 8.9 | 6.2 | 47.7 |
| Washington | 3,996 | 41.7 | 14.7 | 8.0 | 4.4 | 31.3 | 3,243 | 27.2 | 14.0 | 6.8 | 4.0 | 48.1 |
| West Virginia | 1,932 | 30.3 | 13.4 | 7.2 | 6.1 | 43.1 | 1,923 | 23.0 | 13.8 | 7.1 | 5.8 | 50.3 |
| Wyoming | 344 | 25.6 | 11.6 | 7.3 | 8.1 | 47.4 | 344 | 18.6 | 9.0 | 8.7 | 6.1 | 57.6 |
| State | Number of Enrolleeswith New NursingHome Spells | Difference Between Admission Date and Medicaid Start Date (percentage of spells) | Median Number ofDays Between Admissionand Medicaid Start | Mean Number ofDays Between Admissionand Medicaid Start | Percentage of SpellsWhere Admission DateEquals MedicaidStart Date | ||||||
| Less than3 Months | 3-6Months | 6-9Months | 9-12Months | 12-24Months | 24-36Months | More than36 Months | |||||
| All 35 states | 153,892 | 78.6 | 7.8 | 2.3 | 1.7 | 3.8 | 2.1 | 3.7 | 3.0 | 146.3 | 48.1 |
| SOURCE: Mathematica analysis of 2008-2009 MAX data for 35 states with representative FFS nursing home and ICF/IID data and reliable admission dates on nursing home claims (excludes data from Arizona, the District of Columbia, Hawaii, Maine, Minnesota, Missouri, New Mexico, New York, Ohio, Oregon, South Carolina, South Dakota, Tennessee, Texas, Utah, and Wisconsin). NOTES: New spells are spells beginning between July 1, 2008 and December 31, 2008. Medicare SNF spells are spells for which total Medicaid payments were within $5 of Medicare co-insurance amounts. All Medicare SNF spells are excluded from this analysis. Spells with missing or invalid admission date are excluded from analysis based on admission date. Percentages that would result in a total of less than 11 for a cell or combination of cells are replaced by an asterisk (*). | |||||||||||
| Alabama | 3,199 | 89.8 | 3.7 | 2.0 | 1.1 | 1.5 | 0.8 | 1.0 | 0 | 57.3 | 60.6 |
| Alaska | 175 | 92.0 | 4.6 | * | 0.0 | * | 0.0 | 0.0 | 0 | 23.7 | 62.3 |
| Arkansas | 2,146 | 80.1 | 6.2 | 2.9 | 1.4 | 3.4 | 2.2 | 3.7 | 1 | 141.5 | 49.1 |
| California | 15,133 | 84.7 | 5.4 | 2.1 | 1.3 | 2.9 | 1.2 | 2.4 | 0 | 113.1 | 52.6 |
| Colorado | 2,560 | 77.1 | 8.5 | 2.2 | 2.1 | 5.0 | 2.3 | 2.7 | 6 | 135.5 | 47.1 |
| Connecticut | 3,071 | 64.1 | 15.1 | 5.0 | 3.1 | 5.7 | 2.6 | 4.5 | 34 | 191.4 | 39.7 |
| Delaware | 522 | 72.8 | 5.9 | * | * | 6.5 | 3.8 | 5.7 | 12 | 211.4 | 43.9 |
| Florida | 13,481 | 95.9 | 2.3 | 0.3 | 0.3 | 0.6 | 0.3 | 0.3 | 0 | 18.1 | 87.9 |
| Georgia | 5,930 | 67.4 | 12.5 | 2.5 | 2.8 | 4.8 | 3.5 | 6.4 | 41 | 244.0 | 29.6 |
| Idaho | 900 | 80.2 | 9.3 | 2.9 | * | 2.9 | * | 2.0 | 0 | 114.4 | 50.6 |
| Illinois | 12,443 | 82.0 | 5.5 | 1.3 | 1.3 | 3.4 | 2.4 | 4.1 | 0 | 142.7 | 67.1 |
| Indiana | 7,220 | 65.9 | 14.3 | 3.8 | 2.4 | 5.8 | 2.5 | 5.2 | 45 | 199.3 | 33.4 |
| Iowa | 2,800 | 76.8 | 4.5 | 2.0 | 1.5 | 5.1 | 3.4 | 6.7 | 0 | 223.6 | 57.4 |
| Kansas | 2,652 | 66.2 | 8.1 | 3.6 | 3.8 | 7.4 | 3.9 | 6.9 | 30 | 244.9 | 35.6 |
| Kentucky | 5,659 | 79.7 | 8.9 | 1.9 | 1.5 | 3.4 | 1.8 | 2.8 | 0 | 116.9 | 55.8 |
| Louisiana | 5,029 | 59.0 | 11.2 | 2.9 | 2.7 | 7.7 | 5.7 | 10.8 | 53 | 365.8 | 35.2 |
| Maryland | 3,768 | 73.4 | 9.3 | 3.0 | 1.8 | 4.3 | 2.7 | 5.5 | 31 | 227.7 | 31.1 |
| Massachusetts | 7,110 | 77.1 | 9.2 | 3.0 | 1.6 | 4.1 | 1.7 | 3.2 | 2 | 127.3 | 49.0 |
| Michigan | 8,016 | 81.6 | 7.4 | 2.3 | 1.3 | 3.1 | 1.7 | 2.6 | 18 | 112.8 | 33.8 |
| Mississippi | 3,240 | 78.6 | 7.5 | 1.5 | 1.0 | 4.0 | 2.6 | 4.8 | 2 | 165.6 | 49.3 |
| Montana | 914 | 79.5 | 6.9 | 2.6 | 2.0 | 4.3 | 2.1 | 2.6 | 17 | 116.2 | 36.3 |
| Nebraska | 1,820 | 71.8 | 6.9 | 2.9 | 2.5 | 6.0 | 3.8 | 6.1 | 8 | 219.1 | 41.7 |
| Nevada | 979 | 80.6 | 10.5 | 1.7 | * | 3.6 | * | 1.9 | 14 | 88.1 | 41.5 |
| New Hampshire | 1,050 | 67.9 | 11.4 | 5.2 | 3.1 | 6.4 | 2.9 | 3.0 | 26 | 168.3 | 30.8 |
| New Jersey | 6,850 | 80.1 | 6.4 | 2.4 | 1.8 | 4.3 | 1.8 | 3.3 | 1 | 139.5 | 49.7 |
| North Carolina | 7,751 | 81.2 | 10.6 | 1.7 | 1.2 | 2.7 | 1.1 | 1.7 | 21 | 92.9 | 39.4 |
| North Dakota | 693 | 69.0 | 6.3 | 4.2 | 3.3 | 6.9 | 4.6 | 5.6 | 8 | 214.2 | 44.2 |
| Oklahoma | 2,778 | 79.9 | 4.8 | 2.8 | 2.1 | 3.3 | 1.4 | 5.8 | 0 | 176.6 | 54.7 |
| Pennsylvania | 13,508 | 73.1 | 9.3 | 3.5 | 2.3 | 5.1 | 2.9 | 3.7 | 31 | 169.1 | 26.5 |
| Rhode Island | 1,460 | 85.3 | 4.9 | 1.6 | 1.2 | 3.4 | 1.6 | 2.0 | 14 | 94.9 | 40.5 |
| Vermont | 573 | 82.7 | 7.2 | 2.3 | * | 2.3 | * | 2.6 | 0 | 98.6 | 50.4 |
| Virginia | 4,952 | 84.4 | 8.9 | 1.5 | 1.2 | 2.0 | 0.9 | 1.2 | 0 | 69.4 | 50.6 |
| Washington | 3,243 | 67.1 | 8.3 | 1.3 | 0.9 | 2.3 | 5.2 | 14.9 | 27 | 340.6 | 39.7 |
| West Virginia | 1,923 | 75.4 | 11.2 | 3.1 | 2.1 | 3.5 | 1.8 | 2.9 | 31 | 128.5 | 32.7 |
| Wyoming | 344 | 73.8 | 7.3 | 6.1 | * | 4.9 | * | 4.1 | 11 | 155.8 | 38.1 |
| State | Percentage of First NewSpells Beginning in 2009Preceded by HCBSUse in 2008 | Percentage of First NewSpells Beginning and EndingDuring the First Halfof 2009 Preceded byHCBS Use in 2008 | Percentage of First NewSpells Ending in 2008Followed by HCBSUse in 2009 |
| All 39 states | 22.6 | 31.2 | 32.4 |
| SOURCE: Mathematica analysis of 2008-2009 MAX data for 38 states and the District of Columbia with representative FFS nursing home data and reliable HCBS data (excludes data from Arizona, Hawaii, Maine, Massachusetts, Michigan, Minnesota, Montana, New Mexico, Oregon, Rhode Island, Tennessee, and Wisconsin). NOTE: New spells are spells beginning between July 1, 2008 and December 31, 2009, inclusive; spells are censored at December 31, 2009. HCBS includes Section 1915(c) waiver services, personal care services, residential care services, home health, adult day services, and private duty nursing services. | |||
| Alabama | 21.9 | 31.1 | 29.7 |
| Alaska | 34.8 | 38.0 | 40.2 |
| Arkansas | 25.4 | 35.7 | 27.5 |
| California | 36.9 | 43.2 | 38.9 |
| Colorado | 33.0 | 41.9 | 41.3 |
| Connecticut | 30.8 | 46.7 | 46.3 |
| Delaware | 20.4 | 33.7 | 36.9 |
| District of Columbia | 22.2 | 33.8 | 26.7 |
| Florida | 8.8 | 10.8 | 18.6 |
| Georgia | 12.4 | 15.5 | 17.7 |
| Idaho | 38.4 | 48.1 | 47.0 |
| Illinois | 18.3 | 26.1 | 24.6 |
| Indiana | 12.2 | 17.5 | 23.9 |
| Iowa | 32.7 | 45.3 | 40.5 |
| Kansas | 23.6 | 35.6 | 36.7 |
| Kentucky | 23.8 | 20.6 | 15.6 |
| Louisiana | 9.8 | 14.5 | 20.9 |
| Maryland | 10.0 | 14.9 | 17.9 |
| Mississippi | 16.2 | 22.8 | 16.8 |
| Missouri | 29.9 | 39.7 | 38.7 |
| Nebraska | 27.0 | 33.0 | 36.4 |
| Nevada | 18.7 | 22.9 | 22.0 |
| New Hampshire | 19.6 | 32.7 | 36.7 |
| New Jersey | 20.6 | 29.1 | 27.3 |
| New York | 27.8 | 38.0 | 48.1 |
| North Carolina | 31.8 | 38.7 | 34.7 |
| North Dakota | 20.1 | 30.5 | 23.8 |
| Ohio | 21.7 | 34.3 | 38.4 |
| Oklahoma | 24.2 | 33.5 | 27.5 |
| Pennsylvania | 9.3 | 14.7 | 14.7 |
| South Carolina | 22.8 | 28.3 | 21.9 |
| South Dakota | 20.3 | 21.9 | 23.7 |
| Texas | 21.8 | 28.4 | 28.9 |
| Utah | 10.9 | 13.5 | 19.9 |
| Vermont | 34.9 | 46.1 | 44.3 |
| Virginia | 20.4 | 23.8 | 32.7 |
| Washington | 31.5 | 34.0 | 42.7 |
| West Virginia | 18.3 | 24.0 | 27.6 |
| Wyoming | 22.5 | 35.1 | 36.9 |
| State | Number of Enrollees withNew ICF/IID Spells | Distribution of Length of First Spell(percentage) | |
| 12 Monthsor Less | More than12 Months | ||
| All states with data | 2,881 | 28 | 72 |
| SOURCE: Mathematica analysis of 2008-2009 MAX data for 42 states and the District of Columbia with representative FFS nursing home and ICF/IID data (excludes data from Arizona, Hawaii, Maine, Minnesota, New Mexico, Oregon, Tennessee, and Wisconsin). NOTE: New spells are spells beginning between July 1, 2008 and December 31, 2008, inclusive; spells are censored at December 31, 2009. | |||
| Arkansas | 68 | 31 | 69 |
| California | 376 | 32 | 68 |
| District of Columbia | 112 | 13 | 87 |
| Florida | 116 | 12 | 88 |
| Georgia | 111 | 59 | 41 |
| Illinois | 165 | 23 | 77 |
| Indiana | 135 | 11 | 89 |
| Iowa | 59 | 19 | 81 |
| Louisiana | 144 | 18 | 83 |
| Mississippi | 106 | 43 | 57 |
| New Jersey | 46 | 30 | 70 |
| New York | 223 | 27 | 73 |
| North Carolina | 72 | 21 | 79 |
| Ohio | 213 | 31 | 69 |
| Oklahoma | 83 | 26 | 74 |
| Pennsylvania | 51 | 18 | 82 |
| South Carolina | 56 | 25 | 75 |
| Texas | 433 | 32 | 68 |
| Virginia | 59 | 51 | 49 |
| State | Number of Enrolleeswith Multiple Spells | Percentage of Enrolleeswith Multiple SpellsWho Had Spellsin Both NursingHomes and ICFs/IID | Percentage of ICF/IIDSpells Followed Immediatelyby NursingHome Spell | Percentage of ICF/IIDSpells Followed Within60 Days byNursing Home Spell | Percentage of NursingHome Spells FollowedImmediately byICF/IID Spell | Percentage of NursingHome Spells FollowedWithin 60 Daysby ICF/IID Spell |
| All 43 states | 44,637 | 2.3 | 15.5 | 37.4 | 1.3 | 1.8 |
| SOURCE: Mathematica analysis of 2008-2009 MAX data for 42 states and the District of Columbia with representative FFS nursing home data (excludes data from Arizona, Hawaii, Maine, Minnesota, New Mexico, Oregon, Tennessee, and Wisconsin). NOTES: New spells are spells beginning on or after July 1, 2008. Spells are censored at December 31, 2009. The percentages of ICF/IID spells were computed relative to the total number of ICF/IID spells for those enrollees with multiple spells of institutional care between July 1, 2008 and December 31, 2009, and similarly for the percentages of nursing home spells. Percentages that would result in a total of less than 11 for a cell or combination of cells are replaced by an asterisk (*). | ||||||
| Alabama | 531 | 0.0 | 0.0 | 0.0 | 0.0 | 0.0 |
| Alaska | 36 | 0.0 | 0.0 | 0.0 | 0.0 | 0.0 |
| Arkansas | 446 | * | 8.3 | 8.3 | * | * |
| California | 5,423 | 6.4 | 17.9 | 58.2 | 4.5 | 5.5 |
| Colorado | 446 | 0.0 | 0.0 | 0.0 | 0.0 | 0.0 |
| Connecticut | 1,123 | 1.5 | 0.0 | 50.0 | 0.6 | 1.0 |
| Delaware | 78 | * | * | * | * | * |
| District of Columbia | 140 | * | 0.0 | 10.0 | 0.0 | * |
| Florida | 2,870 | 0.6 | 16.7 | 33.3 | 0.3 | 0.4 |
| Georgia | 1,124 | * | 5.3 | 5.3 | * | * |
| Idaho | 144 | * | 100.0 | 100.0 | * | * |
| Illinois | 2,995 | 2.3 | 11.1 | 22.2 | 1.3 | 1.9 |
| Indiana | 1,738 | 3.3 | 16.7 | 66.7 | 2.1 | 2.9 |
| Iowa | 434 | 3.0 | 0.0 | 0.0 | * | * |
| Kansas | 488 | * | * | * | * | * |
| Kentucky | 1,299 | * | * | * | * | * |
| Louisiana | 1,349 | 1.9 | 0.0 | 22.2 | * | 1.3 |
| Maryland | 507 | 0.0 | 0.0 | 0.0 | 0.0 | 0.0 |
| Massachusetts | 2,170 | * | 50.0 | 50.0 | * | * |
| Michigan | 1,407 | 0.0 | 0.0 | 0.0 | 0.0 | 0.0 |
| Mississippi | 646 | 2.2 | 0.0 | 15.4 | 1.7 | 1.9 |
| Missouri | 1,412 | 0.8 | 0.0 | 33.3 | * | * |
| Montana | 123 | 0.0 | 0.0 | 0.0 | 0.0 | 0.0 |
| Nebraska | 384 | 0.0 | 0.0 | 0.0 | 0.0 | 0.0 |
| Nevada | 184 | * | 0.0 | 100.0 | 0.0 | 0.0 |
| New Hampshire | 213 | 0.0 | 0.0 | 0.0 | 0.0 | 0.0 |
| New Jersey | 1,193 | * | 0.0 | 11.1 | 0.0 | * |
| New York | 2,927 | 3.0 | 30.8 | 57.7 | 1.5 | 2.2 |
| North Carolina | 1,527 | * | * | * | * | * |
| North Dakota | 116 | 12.9 | 0.0 | 57.1 | * | 10.1 |
| Ohio | 3,311 | 3.6 | 36.8 | 36.8 | 1.5 | 2.9 |
| Oklahoma | 679 | 2.7 | 0.0 | 44.4 | * | * |
| Pennsylvania | 1,557 | 1.1 | 0.0 | 25.0 | 0.8 | 0.9 |
| Rhode Island | 222 | 0.0 | 0.0 | 0.0 | 0.0 | 0.0 |
| South Carolina | 456 | * | * | * | * | * |
| South Dakota | 130 | * | * | * | * | * |
| Texas | 2,346 | 3.0 | 8.9 | 37.8 | 1.2 | 2.1 |
| Utah | 280 | 6.1 | 50.0 | 50.0 | * | * |
| Vermont | 138 | 0.0 | 0.0 | 0.0 | 0.0 | 0.0 |
| Virginia | 905 | 5.1 | 52.6 | 63.2 | 3.2 | 3.6 |
| Washington | 771 | 0.0 | 0.0 | 0.0 | 0.0 | 0.0 |
| West Virginia | 308 | * | 0.0 | 100.0 | 0.0 | * |
| Wyoming | 61 | * | * | * | * | * |
| State | Percentage of First NewSpells Beginning in 2009Preceded by HCBSUse in 2008 | Percentage of First NewSpells Beginning and EndingDuring the First Halfof 2009 Preceded byHCBS Use in 2008 | Percentage of First NewSpells Ending in 2008Followed by HCBSUse in 2009 |
| All 38 states | 38.8 | 43.2 | 40.5 |
| SOURCE: Mathematica analysis of 2008-2009 MAX data for 38 states and the District of Columbia with representative FFS nursing home data and reliable HCBS data (excludes data from Arizona, Hawaii, Maine, Massachusetts, Michigan, Minnesota, Montana, New Mexico, Oregon, Rhode Island, Tennessee, and Wisconsin). Vermont reported no new ICF/IID spells beginning between July 2008 and December 2009. NOTE: New spells in this table are spells beginning between July 1, 2008 and December 31, 2009, inclusive; spells are censored at December 31, 2009. HCBS includes Section 1915(c) waiver services personal care services, residential care services, home health, adult day services, and private duty nursing services. | |||
| Alabama | 71.4 | 0.0 | 0.0 |
| Alaska | 100.0 | 0.0 | 100.0 |
| Arkansas | 15.1 | 50.0 | 0.0 |
| California | 42.6 | 39.7 | 19.0 |
| Colorado | 90.0 | 0.0 | 0.0 |
| Connecticut | 53.1 | 0.0 | 0.0 |
| Delaware | 28.6 | 0.0 | 0.0 |
| District of Columbia | 5.8 | 22.2 | 20.0 |
| Florida | 35.6 | 50.0 | 40.0 |
| Georgia | 18.3 | 28.6 | 8.7 |
| Idaho | 41.5 | 100.0 | 100.0 |
| Illinois | 45.9 | 63.2 | 50.0 |
| Indiana | 23.2 | 11.1 | 0.0 |
| Iowa | 72.2 | 75.0 | 60.0 |
| Kansas | 71.4 | 0.0 | 0.0 |
| Kentucky | 94.3 | 100.0 | 0.0 |
| Louisiana | 31.5 | 23.1 | 40.0 |
| Maryland | 26.7 | 0.0 | 0.0 |
| Mississippi | 22.0 | 41.7 | 41.4 |
| Missouri | 17.1 | 16.7 | 0.0 |
| Nebraska | 0.0 | 0.0 | 0.0 |
| Nevada | 70.0 | 0.0 | 0.0 |
| New Hampshire | 0.0 | 0.0 | 80.0 |
| New Jersey | 24.4 | 0.0 | 14.3 |
| New York | 62.4 | 90.0 | 61.1 |
| North Carolina | 47.5 | 60.0 | 57.1 |
| North Dakota | 55.3 | 0.0 | 42.9 |
| Ohio | 40.0 | 64.3 | 60.6 |
| Oklahoma | 20.7 | 0.0 | 42.9 |
| Pennsylvania | 59.8 | 50.0 | 0.0 |
| South Carolina | 78.8 | 0.0 | 50.0 |
| South Dakota | 38.2 | 75.0 | 100.0 |
| Texas | 12.3 | 9.4 | 34.9 |
| Utah | 15.2 | 33.3 | 28.6 |
| Virginia | 54.7 | 71.4 | 88.2 |
| Washington | 60.0 | 0.0 | 0.0 |
| West Virginia | 44.3 | 50.0 | 100.0 |
| Wyoming | 66.7 | 0.0 | 100.0 |
NOTES
-
This study builds upon earlier work of Ballou et al. (2013) and Wenzlow et al. (2008).
-
Consequently, references in this report to "residents" or "recipients" of institutional care refer only to those institutionalized individuals enrolled in Medicaid.
-
Because data were censored at the end of 2009, the analysis of spell duration was limited to spells beginning in the latter half of 2008. Each spell of 12 months or more could therefore be observed for at least 12 months. Details appear in Appendix B.
-
Our sample includes individuals enrolled in Medicaid at some point between July 1, 2008 and December 31, 2009, and living in the study states. Enrollees with new spells of nursing home care include those using Medicaid-financed nursing home services for the first time, as well as those who had previously resided in a nursing home but had more recently been hospitalized or living in the community. Those with new spells also include individuals who were already nursing home residents but became eligible for Medicaid coverage during the spell.
-
The nine states are Alaska, California, the District of Columbia, Florida, Kentucky, Massachusetts, Nevada, Utah, and Washington.
-
The Ballou et al. (2013) analysis of 2006-2007 Medicaid spells did not correctly calculate the number of aged and disabled persons who were enrolled in Medicaid during the 18-month period of analysis. Our best estimate is that the population was understated by about 5 percent. These errors were corrected in this analysis of 2008-2009 data. Consequently, the counts of aged and disabled enrollees and counts of nursing home enrollees cannot be reliably compared with corresponding counts from tabulations of Ballou et al. The methodology used to count the number of enrollees with new spells was consistent across the time periods, however, and we can compare the results for this group over time. Although we could not precisely determine differences in the number of Medicaid enrollees who were aged or had disabilities we were able to confirm that these populations did not decline from 2001-2002 to 2008-2009, and probably increased.
-
In this analysis, Alaska stands out as having dramatic changes in number of enrollees using nursing home spells. One factor to consider when analyzing nursing home use in Alaska is the very low number of enrollees in nursing home care in the state. There were fewer than 1,000 enrollees with new nursing home spells in each of the time periods we analyzed, and fewer than 500 in the 2001-2002 period. The small size of this population should be considered when analyzing percentage change.
-
High-HCBS states were those where the share of Medicaid long-term care expenditures for HCBS and also the percentage of long-term care users receiving HCBS were above the all-state average, suggesting strong penetration of HCBS (Borck et al. 2013). The high-HCBS states in 2009 were Alaska, California, Colorado, Kansas, Nevada, North Carolina, Vermont, Virginia, and Washington.
-
Full definitions of the cash assistance-related, medically-needy, poverty-related, Section 1115 demonstration waiver-related, and "other" criteria are in Appendix A.
-
Identifying exactly when a new nursing home resident became eligible for Medicaid is difficult. Since coverage is retroactive up to three months prior to application for benefits, it is likely that some individuals qualified for benefits upon admission and are reported in the data as Medicaid enrollees in the two months prior to admission because Medicaid retroactively covered unpaid medical bills.
-
The "other" category also includes those covered under more restrictive requirements than SSI standards in Section 209(b) states. States use unique state-specific codes to identify populations within the "other" category and these enrollees cannot be systematically identified in MAX data.
-
Most of the individuals (2,094 out of 2,349) who qualified for benefits through a Section 1115 demonstration waiver two months prior to admission were enrolled in Section 1115 programs in Florida (970 enrollees), Massachusetts (616 enrollees), New York (298 enrollees), and Vermont (210 enrollees), but these programs typically include limited or no coverage for long-term care benefits.
-
Because the study period ended on December 31, 2009, all spells that were active on that date were censored. To obtain more meaningful statistics regarding length-of-stay, for this portion of the analysis we followed Wenzlow et al. (2013) and Ballou et al. (2013) and considered only spells beginning in the last six months of 2008 to ensure that each spell could potentially last at least one year. (Otherwise, spells beginning, for example, in October 2009 would appear to represent short stays because they would be censored at the end of the year, yielding an incorrectly high number of shorter stays as a percentage of all stays.) We likewise limited the analysis to spells beginning in the latter half of 2008 when analyzing (below) the associations between length-of-stay and state policy variables.
-
The population of dual-eligibles includes almost all Medicaid enrollees who are aged and many who are eligible on the basis of disability. In 2008, about 93 percent of aged Medicaid enrollees and 43 percent of Medicaid enrollees with disabilities were dual-eligibles (Borck et al. 2012).
-
Because the Medicaid data that form the basis of the MAX data are collected and submitted by states to CMS there are some state differences in the quality and completeness of MAX data. When the comparison of length-of-spell is repeated and states that reported no Medicare coinsurance are excluded, the findings were very similar to the results presented for all 43 states (data not shown).
-
The 14 states are Georgia, Idaho, Indiana, Iowa, Kansas, Kentucky, Louisiana, Michigan, Missouri, Nevada, New Jersey, Virginia, Washington, and West Virginia.
-
In 2009, seven states and the District of Columbia did not report nursing home admission date on any nursing home claims and were excluded from this analysis. The states include Missouri, New York, Ohio, South Carolina, South Dakota, Texas, and Utah.
-
Because the Medicaid spell start date is determined by an auditable action (payment of a claim) and the admission date is not, there is reason to consider the nursing home admission date as less reliable than the Medicaid spell start date.
-
In particular, we have no means of assessing the accuracy with which facilities report nursing home admission dates if residents were not enrolled in Medicaid at the time of admission.
-
Although a detailed analysis of the relationship between the use of HCBS and nursing home services by the same individual was beyond the scope of this report, the person-level and claim-level data available through MAX are well suited for pursuing such an analysis in the future.
-
These associations were statistically significant at the 5 percent level or better.
-
For example, Indiana and Louisiana had comparable numbers of ICFs/IID in 2007 (533 and 513, respectively), but Louisiana had 18 large facilities (16 beds or more) whereas Indiana had only six (Lakin et al. 2008).
-
Alaska authorizes a number of different out-of-state services for Medicaid recipients when these services are not available in-state (State of Alaska 2013).
-
See Chapter II for detailed definitions of the Medicaid assistance pathways.
-
State-level detail is provided in Appendix Table D.6. ICFs/IID can be used to provide respite care, which could also explain some shorter stays, but respite care is covered through HCBS waivers and does not include room and board, which the individual must finance with non-Medicaid sources of payment (Prouty et al. 2008). We believe it is also likely that some of the short ICF/IID stays may reflect coding errors in the data.
-
For individuals with ID/DD who have more limited medical needs, nursing services are available through Medicaid in ICFs/IID (both larger and community facilities) and community settings.
-
There is a larger literature on a similar question surrounding treatment of persons with chronic mental illness in nursing homes and whether nursing homes are adequately equipped to provide appropriate treatment for people with mental illness (Molinari et al. 2009; Li 2010).
-
Because most ICF/IID stays are very long, the population of individuals with new spells of ICF/IID care followed by HCBS use in our 18-month study period is unlikely to be representative of the population of all ICF/IID residents unless these shorter stays can be attributed primarily to ICF/IID closings and would have otherwise been long stays had the facility remained open.
-
This population includes Medicaid enrollees who used ICF/IID services and enrollees who used Section 1915(c) services for ID/DD waiver services. Individuals with ID/DD who received state plan Medicaid services but not through a designated 1915(c) ID/DD waiver could not be identified as ID/DD.
-
The measured median length-of-stay for ICF/IID spells in this analysis was 428 days, which is longer than the 12-month look-ahead period that we used when limiting the analysis to spells beginning in the second half of 2008; hence, the true median length-of-stay is likely to be greater than 428 days.
-
Note that only 35 states reported reliable dates of nursing home admission on Medicaid claims.
-
Within a single benefit period, Medicare provides up to 100 days of such coverage. A benefit period begins upon admission to an inpatient hospital or SNF, and ends 60 days after the date on which inpatient hospital or skilled nursing care was last used. In practice, Medicare usually reimburses less than 100 days of skilled nursing care for qualifying individuals.
-
Services covered under managed care (including any for long-term care) generally cannot be identified in MAX as they are reported in "encounter records," which are known to be incomplete in many states in MSIS and MAX (Borck et al. 2013).
-
Although admission dates provide additional information about institutional services that might not be captured in other MAX variables, not all states and facilities include admission dates on their claims records, and this information only reflects services used in the facility in which the person resided at the time the claim was paid.
-
See https://medicaid.gov/Medicaid-CHIP-Program-Information/By-Topics/Data-an....
MEASURING STATES' PROGRESS IN MAINTAINING AND EXPANDING MEDICAID HOME AND COMMUNITY-BASED SERVICES
This report was prepared under contract #HHSP23320095642WC between the U.S. Department of Health and Human Services (HHS), Office of Disability, Aging and Long-Term Care Policy (DALTCP) and Mathematica Policy Research. For additional information about this subject, you can visit the DALTCP home page at http://aspe.hhs.gov/office_specific/daltcp.cfm or contact the ASPE Project Officers, John Drabek and Pamela Doty, at HHS/ASPE/DALTCP, Room 424E, H.H. Humphrey Building, 200 Independence Avenue, S.W., Washington, D.C. 20201. Their e-mail addresses are: John.Drabek@hhs.gov and Pamela.Doty@hhs.gov.
Reports Available
- An Investigation of Interstate Variation in Medicaid Long-Term Care Use and Expenditures Across 40 States in 2006
- Executive Summary http://aspe.hhs.gov/daltcp/reports/2013/40Statees.shtml
- Full HTML Version http://aspe.hhs.gov/daltcp/reports/2013/40State.shtml
- Full PDF Version http://aspe.hhs.gov/daltcp/reports/2013/40State.pdf
- Interstate Variation and Progress Toward Balance in Use of and Expenditure for Long-Term Services and Supports in 2009
- Executive Summary http://aspe.hhs.gov/daltcp/reports/2014/ProgBales.cfm
- Full HTML Version http://aspe.hhs.gov/daltcp/reports/2014/ProgBal.cfm
- Full PDF Version http://aspe.hhs.gov/daltcp/reports/2014/ProgBal.pdf
- Medicaid-Financed Institutional Services: Characteristics of Nursing Home and ICF/IID Residents and Their Patterns of Care
- Executive Summary http://aspe.hhs.gov/daltcp/reports/2013/MFISes.shtml
- Full HTML Version http://aspe.hhs.gov/daltcp/reports/2013/MFIS.shtml
- Full PDF Version http://aspe.hhs.gov/daltcp/reports/2013/MFIS.pdf
- Medicaid-Financed Institutional Services: Patterns of Care for Residents of Nursing Homes and Intermediate Care Facilities for Individuals with Intellectual Disabilities in 2008 and 2009
- Executive Summary http://aspe.hhs.gov/daltcp/reports/2014/CarePattes.cfm
- Full HTML Version http://aspe.hhs.gov/daltcp/reports/2014/CarePatt.cfm
- Full PDF Version http://aspe.hhs.gov/daltcp/reports/2014/CarePatt.pdf
U.S. Department of Health and Human ServicesOffice of Disability, Aging and Long-Term Care PolicyRoom 424E, H.H. Humphrey Building200 Independence Avenue, S.W.Washington, D.C. 20201FAX: 202-401-7733Email: webmaster.DALTCP@hhs.gov