
U.S. Department of Health and Human Services
A Profile of Medicaid Institutional and Community-Based Long-Term Care Service Use and Expenditures Among the Aged and Disabled Using MAX 2002: Final Report
Audra T. Wenzlow, Robert Schmitz and Kathy Shepperson
Mathematica Policy Research, Inc.
January 18, 2008
PDF Version (74 PDF pages)
This report was prepared under contract #HHS-100-97-0013 between the U.S. Department of Health and Human Services (HHS), Office of Disability, Aging and Long-Term Care Policy (DALTCP) and Mathematica Policy Research, Inc. For additional information about this subject, you can visit the DALTCP home page at http://aspe.hhs.gov/_/office_specific/daltcp.cfm or contact the ASPE Project Officer, John Drabek, at HHS/ASPE/DALTCP, Room 424E, H.H. Humphrey Building, 200 Independence Avenue, S.W., Washington, D.C. 20201. His e-mail address is: John.Drabek@hhs.gov.
The opinions and views expressed in this report are those of the authors. They do not necessarily reflect the views of the Department of Health and Human Services, the contractor or any other funding organization.
TABLE OF CONTENTS
- I. BACKGROUND AND OBJECTIVES
- Federal and State Long-Term Care Policies
- Recent Literature
- The Goals of This Study
- II. DATA AND METHODS
- Using MAX PS Files to Analyze Long-Term Care
- Data Strengths and Limitations
- Analysis Methods
- III. USING MAX TO EXAMINE INSTITUTIONAL AND COMMUNITY-BASED LONG-TERM CARE SERVICE USE AND EXPENDITURES IN 2002
- Measuring the Balance of Institutional and Community-Based Long-Term Care: Expenditure Versus Utilization-Based Measures
- Analyses by Subgroup: Comparing Aged and Disabled Enrollees
- Examining Service-Level Detail for Community-Based Services
- Other Medicaid Service Use and Expenditures Among Long-Term Care Users
- IV. SUMMARY AND CONCLUSIONS
- Summary of Key Results and Their Implications
- The Future of MAX for the Study of Medicaid Long-Term Care
- APPENDICES
- APPENDIX A: MAX Long-Term Care and Other Service Types
- APPENDIX B: Glossary of Terms
- APPENDIX C: State Long-Term Care Data Anomalies
- APPENDIX D: Tables
- LIST OF FIGURES
- FIGURE III.1: Composition of Medicaid Long-Term Care Users and Expenditures Among Aged and Disabled Enrollees in 2002
- FIGURE III.2: Composition of Medicaid Long-Term Care Expenditures Among Aged and Disabled Enrollees in 2002
- LIST OF TABLES
- TABLE I.1: Optional Long-Term Care Services Covered by State Medicaid Programs in 2002
- TABLE II.1: Definitions of Community-Based Long-Term Care MAX Service and Program Types
- TABLE III.1: Expenditure and Utilization-Based Measures of the Balance of Institutional and Community-Based Long-Term Care for Aged and Disabled Enrollees in Select States in 2002, Ranked by Community-Based Service Share
- TABLE III.2: Composition of Medicaid FFS Long-Term Care Expenditures Among Aged and Disabled Enrollees for Select States in 2002, Ranked by Community-Based Service Share
- TABLE III.3: Percentage of Medicaid FFS Long-Term Care Users Who Used Community-Based Services for Select States in 2002, Ranked by Percentage Using Community-Based Services
- TABLE III.4: Characteristics of Aged and Disabled Enrollees Using Medicaid Fee-for-Service Long-Term Care Services Compared with Those of All Full-Benefit Enrollees in 2002
- TABLE III.5: FFS Expenditures for Personal Care, Residential Care, Home Health, and Adult Day Care per Aged or Disabled Medicaid Enrollee Using Long-Term Care Services: Top 10 States
- TABLE III.6: Average Medicaid Expenditures for Aged or Disabled Enrollees Using Medicaid Fee-for-Service Long-Term Care Services in 2002, by Type of Service and Program Type
- TABLE III.7: Average Medicaid Expenditures for Aged or Disabled Duals Using Medicaid Fee-for-Service Long-Term Care Services in 2002, by Type of Service and Program Type
- TABLE A.1: Type-of-Service Codes in MAX, by Claim File Type
- TABLE A.2: Medicaid Analytic eXtract Long-Term Care Service and Program Type Definitions
- TABLE C.1: Medicaid Analytic eXtract Long-Term Care Anomalies
- TABLE C.2: Expenditures for Waiver Services, Personal Care, and Home Health Reported in CY MAX, FY MSIS, and FY Form 64 Data for All States and the District of Columbia in 2002
- TABLE D.1: Percentage of Medicaid FFS Long-Term Care Expenditures for Community-Based Services and Percentage of Long-Term Care Users Using Community-Based Services Among Aged and Disabled Enrollees for Select States in 2002
- TABLE D.2: Average Expenditures and Expenditures per User for Medicaid FFS Institutional and Community-Based Long-Term Care Services Among Aged and Disabled Enrollees for Select States in 2002
- TABLE D.3: Composition of Medicaid Long-Term Care Expenditures Among Aged and Disabled Enrollees in 2002, by Demographic and Enrollment Characteristics
- TABLE D.4: Composition of Medicaid FFS Long-Term Care Expenditures Among Aged and Disabled Enrollees for Select States in 2002, by Detailed Type of Service
- TABLE D.5: Average Medicaid FFS Long-Term Care Expenditures per Aged or Disabled Enrollee Using Any Long-Term Care Service for Select States in 2002, by Detailed Type of Service
- TABLE D.6: FFS Expenditures per Enrollee Among All Full-Benefit Enrollees and Among Users of Long-Term Care Services in 2002, by Service Type
- TABLE D.7: Percentage Using Specified FFS Among All Full-Benefit Enrollees and Among Users of Long-Term Care Services in 2002, by Service Type
- TABLE D.8: FFS Expenditures per User Among All Full-Benefit Enrollees and Among Users of Long-Term Care Services in 2002, by Service Type
EXECUTIVE SUMMARY
Since 1982, states have increasingly utilized Section 1915(c) waivers and optional state community-based programs to shift long-term care for the aged and disabled from institutions to the community. New rules introduced under the Deficit Reduction Act (DRA) of 2005 provide states with even more flexibility to provide home and community-based long-term care services to their low-income populations. Two overarching goals underlie these policies: (1) to provide long-term care services more cost-effectively; and (2) to give aged and disabled people more options in how they receive their care. As baby boomers enter their senior years and increase the need for long-term care services nationally, information about how Medicaid community long-term care programs have functioned in the past will be critical for assisting states in choosing how to utilize the new options provided under the DRA. Until recently, only limited aggregate data and some national surveys have been available to examine Medicaid community-based long-term care service use and compare it with use of institutional care. The Medicaid Analytic eXtract (MAX) data system produced by Centers for Medicare & Medicaid Services now enables much more detailed analyses of long-term care utilization and expenditures at the person level.
This study evaluates the potential of using MAX Person Summary files to examine how successfully states have rebalanced their long-term care systems and how Medicaid enrollees who utilize community-based long-term care services differ from people in institutions. For 37 states we believe have reliable MAX long-term care data, we: (1) compare utilization-based measures of the balance of community versus institutional long-term care with traditional expenditure-based measures; (2) contrast patterns of long-term care service utilization and expenditures of aged and disabled subgroups; (3) examine the detailed service types that compose community-based long-term care; and (4) summarize other services used and costs incurred by long-term care users. Each analysis highlights the utility of using person-level data available in MAX to extend our knowledge of how home and community-based long-term care services are used across the country.
Key Findings About Medicaid Long-Term Care Service Use in 2002
The findings presented in this report suggest that there is significant variation across measures, across states, and across population subgroups in patterns of institutional and community-based long-term care use and expenditures. While our national estimates are based on MAX data from only 37 states, our results suggest that further person-level analyses are warranted. In comparing expenditure with utilization-based measures, we find that:
-
Only 34 percent of Medicaid long-term care expenditures paid for persons served were for community-based services in 2002, while almost 59 percent of long-term care users used community-based services.
-
National estimates mask significant variation across states. Community-based services accounted for over 60 percent of long-term care expenditures in Alaska and New Mexico but less than 12 percent in the District of Columbia and Mississippi. Use of community-based services among long-term care users ranged from 87 percent in Alaska to 23 percent in Indiana.
-
While the utilization-based measure was larger than the expenditure measure in every state, there was significant variation across states in how the two measures compared. Illinois and Alabama ranked 31st and 32nd out of the 37 states in the percent of expenditures that were for community-based services but ranked 10th and 8th, respectively, in the percent of long-term care users who used community-based services. In contrast, the two measures of long-term care balance were most similar in New Mexico, which ranked 1st and 3rd in expenditures and use of community-based services.
Our subgroup analyses for aged and disabled enrollees suggest that:
-
Institutional and community long-term care expenditures were much more balanced among young disabled Medicaid enrollees than their aged counterparts in 2002. Over half of long-term care expenditures were for community-based services among disabled enrollees but less than 20 percent were for community-based care among those over 65. Community-based service expenditures as a share of total long-term care expenditures ranged from 50 percent for people under age 65, 31 percent for people between ages 65 and 74, 21 percent for people between ages 75 and 84, and 13 percent for those age 85 and older. Rates of community-based service utilization were higher but followed a similar pattern by age.
-
The primary distinguishing factor between people using community-based and those using institutional long-term care was age. Eighty percent of people using only institutional care were over age 65, compared with 63 percent of those using both types of services, and 43 percent of those using community services only. Compared with people using community-based services, a higher percentage of people in institutions were non-Hispanic White, female, dual Medicare and Medicaid enrollees, and enrolled in Medicaid for only part of the year--all factors associated with age.
Service type decompositions suggest that MAX data could be used to gain much better understanding of the types of community-based services that are used in Medicaid:
-
For example, residential care--community-based services provided in residential settings (excluding home health, adult day care, and private duty nursing)--made up over 6 percent of total long-term care and about 23 percent of community-based long-term care expenditures reported as service types in 2002. However, because waiver services are often not reported as specific service types but grouped with all Other services in MAX, the usefulness of MAX for detailed analyses of the composition of Medicaid waiver services is limited.
Finally, our examination of non-long-term care Medicaid service use provides a broader perspective of the types of individuals that use Medicaid long-term care:
-
People using both institutional and community-based services (6 percent of long-term care users) had higher average total Medicaid expenditures ($46,055) than users of institutional care only ($38,844) or community care only ($24,966). The high overall expenditures for people using both types of long-term care were due to hospitalization: almost half used Medicaid inpatient services in 2002 compared with about a quarter of other long-term care users. Because short nursing facility stays for acute conditions after hospitalization are covered by Medicare but may include Medicaid cost-sharing, use of both community and institutional care among dual enrollees may reflect stays primarily paid by Medicare rather than Medicaid.
-
Overall, aged and disabled enrollees using Medicaid long-term care services accounted for 7.7 percent of all full-benefit Medicaid enrollees in our 37 sample states but represented over 50 percent of their total Medicaid expenditures (including fee-for-service and managed care premiums paid).
The Potential of MAX Data for Understanding Patterns of Long-Term Care
While more current data are available at the aggregate level, MAX 2002 provides the most detailed and current person-level information on all Medicaid enrollees and the services they used during a calendar year. As illustrated by our study findings, MAX can be used to address Medicaid long-term care policy questions that require knowledge about patterns of utilization and expenditures incurred by individuals. MAX could potentially be used to examine whether new enrollees, new long-term care users, or others are utilizing community-based services, and with the use of claims files, how individuals use of community services is associated with their future patterns of care.
Several factors that limit the usefulness of MAX data--its timeliness, its completeness, and reporting errors--have greatly improved in recent years and are expected to continue to do so. However, the utility of MAX to examine Medicaid institutional and community-based long-term care services nationally will greatly depend on improvements made by states in the accuracy and detail of long-term care data they report to the Medicaid Statistical Information System (the source data for MAX) and enhancements to MAX coding of community long-term care. We recommend the development of more detailed service-level information for services covered under Section 1915(c) waivers and state plans in future editions of MAX.
I. BACKGROUND AND OBJECTIVES
Medicaid is the largest insurer for long-term care services in the United States, covering over 60 percent of long-term care users and accounting for 45 percent of nursing home expenditures in 2002 (CMS 2006b). As health care and nursing home costs have risen nationally, states have made significant efforts to limit these costs within their state Medicaid programs (Grabowski et al. 2004). One key method used to try to control long-term care costs has been to shift long-term care provision from traditional institutional care to the community.
Studying the effects of these policy changes has been challenging because most data measuring Medicaid long-term care--for example, data reported in Form 64--are at the aggregate state level. Because expenditures depend on both utilization and service costs, aggregate expenditure measures may mask important differences in the cost and utilization rate of community relative to institutional services. Furthermore, aggregate summaries cannot be used to examine patterns of long-term care use for subgroups of Medicaid enrollees, which is essential for targeting new interventions. Meanwhile, survey data typically enable the estimation of national but not state-level summaries of use of and expenditures for Medicaid long-term care services. Because state Medicaid programs vary widely in the people they cover, services they provide, and cost of care, national measures alone provide little information about how people utilize the long-term care services that are available to them.
Since 1999, Centers for Medicare & Medicaid Services (CMS) has produced and made publicly available Medicaid administrative data collected from each state and the District of Columbia. The Medicaid Analytic eXtract (MAX) provides calendar year, person-level, eligibility and claims information for all Medicaid enrollees in the United States. In this report we examine the potential for using these data to examine long-term care use and expenditures in ways not possible using aggregate or survey data. The statistics presented in this report provide detailed information about patterns of institutional and community-based service use and expenditures for 37 states that we believe have reliable long-term care information in MAX 2002.
Our results have potential policy implications but must be interpreted in the context of Medicaid policies in place in 2002. This chapter briefly describes the federal and state long-term care policies that affect Medicaid long-term care service provision, summarizes what is known to date about utilization of these services, and describes our goals to examine Medicaid community and institutional long-term care patterns in 2002 using MAX in this report.
Federal and State Long-Term Care Policies
Historically, Medicaid had a reputation of having an institutional bias stemming from the requirement that all states provide nursing home care to their enrollees whereas most community-based long-term care services can be provided at state option. Like nursing home care, provision of basic home health services has also been mandatory but there is a great deal of variability in other types of institutional and community-based long-term care services that states choose to cover in their programs. Table I.1 shows the optional long-term care services covered by state Medicaid programs in 2002, including those provided via waivers and managed care programs. (For detail, see Doty 2000, Schneider et al. 2002, and Smith et al. 2000).
In general, most aged or disabled people receiving Supplemental Security Income (SSI) benefits are eligible for full Medicaid benefits including long-term care services covered in their state.1 However, states have some flexibility regarding additional populations eligible for Medicaid services. States have the option to cover all aged and disabled at higher income thresholds up to 100 percent of the federal poverty level, to cover medically needy individuals who have higher incomes but may have significant medical expenses, and/or cover only institutional care for people up to 300 percent of the SSI limit (known as the 300 percent rule).
Since 1982, states have increasingly utilized Section 1915(c) waivers to expand community-based service coverage for their aged and disabled enrollees eligible for institutional care. The goals of the Section 1915(c) waivers and related legislation were to provide states with the flexibility to find more cost-effective ways to provide long-term care and to give aged and disabled people more options in the type of long-term care services they use. States can choose to cover only certain services under waivers. The can also limit the populations covered under waivers to specific age groups or people with specific conditions. Eligibility for waiver services is limited to people who meet the clinical criteria for institutionalization and are eligible for Medicaid institutional care. However, waivers can be used to cover people who would typically not be eligible for Medicaid services unless they resided in an institution (for example, people eligible for only institutional care services under the 300 percent rule).
Rules stipulated under the Deficit Reduction Act (DRA) of 2005 provide states with new options and even more flexibility to provide home and community-based long-term care services to their populations (Crowley 2006; Shirk 2006). Two key components of the DRA relevant to long-term care include: (1) new state options to cover community-based services to aged and disabled enrollees without waivers; and (2) the introduction of the Money Follows the Person Demonstration in January 2007 that provides selected states with enhanced federal matching funds to assist institutionalized individuals to transition to and live in the community.
Long-term care managed care programs are another tool that states can use to manage long-term care services. Except for Arizona, few states with managed care long-term care programs in 2002 covered a significant number of individuals in the state (Saucier 2005). Arizonas long-term care program covered almost all the states elderly population. A number of states had Programs of All-Inclusive Care for the Elderly (PACE) but these were typically small and covered only several hundred people in each state with one or more PACE programs (National Pace Association 2004).
Recent Literature
Several state Medicaid reporting requirements have enabled analyses of Medicaid community and institutional long-term care service use nationally and by state. CMS Form 64 data are aggregate summaries of state Medicaid program expenditures that are submitted quarterly by states for services reimbursable by the Federal Government. Form 64 contains information about both institutional and community-based long-term care expenditures, which have been summarized yearly by Burwell and colleagues (see, for example, Burwell, Sredl, and Eiken 2003). Information about waiver expenditures by program type is reported in CMS Form 372 and has been used to summarize trends in expenditures for community-based waiver services nationally and by state (Eiken, Burwell, and Selig 2006; Kitchener et al. 2005a, 2005b, 2007; Reester, Missmar, Tumlinson 2004). One key result from these analyses is the finding that three-fourths of waiver services have gone to support programs for people with mental retardation and other developmental disabilities (MR/DD) (Eiken, Burwell, and Selig 2006).
The limitations of Form 64 and Form 372 data are that they provide little information about the types of people utilizing long-term care services and they do not provide any information on the other types of Medicaid services that they use. They are also limited in detail about the composition of expenditures by the type of service specified in the form. Expenditures can be examined only by the program types and service types reported. While claims data contain procedure codes that enable investigation of the services provided under waivers, for example, reporting in Forms 64 and 372 is much more aggregated. As a result, states that have investigated their Medicaid long-term care programs have often examined their states claims records to gain insight into how their long-term care programs function (see, for example, Robison et al. 2007). However, national data are required to understand how state experiences compare to those of other states and to examine implications of federal policies.
The Goals of This Study
The goals of this study are to examine how person-level data in the MAX data system can be used to better understand Medicaid long-term care service use and expenditures, and to evaluate the utility of MAX data for further study of long-term care. In our analyses we:
-
Compare expenditure and utilization-based measures of the balance of institutional and community-based long-term care services.
-
Examine Medicaid long-term care expenditures and utilization for two key groups of enrollees: young disabled enrollees and enrollees ages 65 or older.
-
Decompose community-based long-term care service expenditures by type of service.
-
Summarize other Medicaid services used and costs incurred by long-term care users.
We use MAX data for calendar year 2002 for the analysis. It should be kept in mind that these data represent the long-term care legislative environment in 2002 and do not reflect changes in utilization and expenditures expected with the implementation Medicare Part D in 2006 and the DRA in 2007. In the next chapter we describe MAX Person Summary (PS) file data, how they can be used for long-term care analyses, and their strengths and limitations. Chapter III presents our analysis results. Chapter IV discusses policy implications and the utility of MAX for future long-term care research.
| TABLE I.1. Optional Long-Term Care Services Covered by State Medicaid Programs in 2002 |
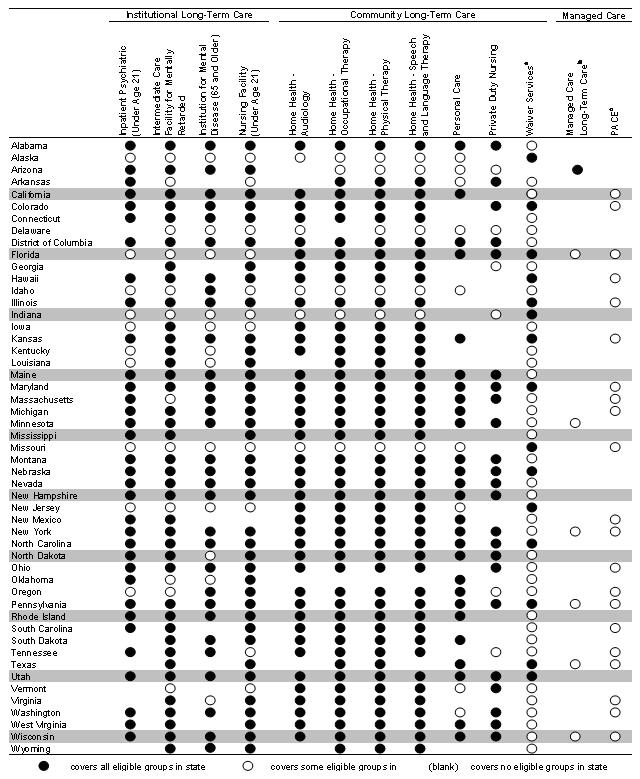 |
SOURCE: Centers for Medicare & Medicaid Services 2006a, with the exception of footnoted columns.
|
II. DATA AND METHODS
The MAX and its source data--the Medicaid Statistical Information System (MSIS)--are the primary sources of information about each of the over 50 million people enrolled in Medicaid each year. CMS produces both MSIS and MAX and makes them available publicly (with a data use agreement) for research purposes. Because Medicaid is the largest insurer of long-term care in the United States, these data provide the most detailed information currently available about people using long-term care services nationally.
Most MAX data are derived directly from MSIS.2 MSIS contains fiscal year (FY) Medicaid enrollment and claims paid information for each state and the District of Columbia. Submission of data to MSIS became a requirement as of January 1, 1999 for all states under the Balanced Budget Act of 1997, replacing form HCFA-2082 reporting requirements. The MAX data system is a cleaned version of MSIS that enables analyses of enrollment, utilization, and expenditures at the person level.
Unlike MSIS, which reflects claims as of the date they were paid, MAX reflects the services used by Medicaid enrollees during a calendar year. The MAX PS files for 2002 were used for the analyses presented in this report.3 The MAX PS files are person-level files that contain information on enrollee demographic and eligibility characteristics and summary information on claims paid for services used by each enrollee in 2002.
This chapter summarizes the long-term care use and expenditure measures in the MAX 2002 PS files, discusses the strengths and limitations of these data, and describes the methods used to analyze institutional and community long-term care in this study. Important components of this chapter are three appendices that elaborate on the definitions of MAX long-term care measures (Appendix A), provide a glossary of terms used in this report (Appendix B), and detail state MAX data anomalies (Appendix C).
Using MAX PS Files to Analyze Long-Term Care
Measures contained in the MAX 2002 PS files generally consist of: (1) demographic and enrollment measures; and (2) summary claims information that has been aggregated from claims files. Demographic and enrollment measures include age, race, gender, basis of Medicaid eligibility, dual Medicaid and Medicare enrollment, months enrolled, managed care enrollment, and other enrollment and eligibility information that can be used to characterize people using long-term care services. Summary claims information includes utilization and expenditure measures by service type, and when relevant, by program type. Both service type and program type measures in MAX PS files can be used to identify the types of Medicaid institutional and community long-term care services used and their overall expenditures in 2002.
Medicaid institutional long-term care services can generally be identified solely using service type information. There are 33 service type categories that are summarized in the MAX PS files. (See Appendix A for a listing of all MAX service types.) The four institutional long-term care types of service (TOS) include nursing facility services (TOS 07), services provided in intermediate care facilities for persons with mental retardation (ICFs/MR) (TOS 05), mental hospital services for people age 65 and older (TOS 02), and inpatient psychiatric facility services for people under age 21 (TOS 04).
Compared with institutional long-term care, Medicaid community-based long-term care services are more difficult to identify because home or community-based long-term care may include a variety of services--for example, transportation or targeted case management--that may also be used for reasons unrelated to long-term care. We consider five MAX service type measures as capturing solely home or community-based long-term care services: personal care (TOS 30), residential care (TOS 52), home health (TOS 13), adult day (TOS 54), and private duty nursing (TOS 38). Table II.1 summarizes these service types. (More detailed information about each of the institutional and community long-term care measures is provided in Appendix A.)
An important component of Medicaid community-based long-term care is waiver services. All states except Arizona cover some community-based long-term care services under Section 1915(c) provisions of the Social Security Act that enable states to waive certain federal regulations to provide home and community-based services (HCBS) to people who otherwise would require institutional care. Because services provided under waivers make up a significant portion of community long-term care expenditures--about 65 percent (Kitchener et al. 2006; authors computations using MSIS 2002)--waiver service information is critical to measuring community long-term care. MSIS FY 2002 data suggest that over 75 percent of waiver expenditures were for claims coded in the Other (or unspecified service type TOS 19), which implies that MAX type of service codes cannot be used to capture a significant share of community long-term care expenditures. A mode of identifying community-based long-term care in MAX is through program types. Total expenditures for an individual under Section 1915(c) waivers are measured by program type codes 6 and 7 in MAX PS files.4
| TABLE II.1. Definitions of Community-Based Long-Term Care MAX Service and Program Types |
| Description of Measure |
| Personal Care (TOS 30). Personal services such as bathing and toileting, sometimes expanded to include light housekeeping furnished to an individual who is not an inpatient or a resident of a group home, assisted living facility, or long-term facility such as a hospital, nursing facility, ICF/MR, or institution for mental disease. Personal care services are those that individuals would typically accomplish themselves if they did not have a disability.a |
| Residential Care (TOS 52). Although room and board services provided in residential care facilities are not covered by Medicaid, other components of residential care--for example, personal care, 24-hour services, and chore services--can be covered. Residential care includes group, family or individual home residential care; cluster residential care; and therapeutic residential care services, assisted living, supported living, and night supervision.a |
| Home Health (TOS 13). Services provided at a patient's place of residence (typically a patients home), in compliance with a physician's written plan of care that is reviewed every 62 days--including nursing services, as defined in the State Nurse Practice Act, home health aide services, physical therapy, occupational therapy or speech pathology, and audiology services--that are provided by a home health agency or by a facility licensed by the state to provide these medical rehabilitation services.a |
| Adult Day Care (TOS 54). Day care services including day health and rehabilitation care, day treatment, habilitation, psoriasis day care, services in an adult day care center, and transportation to adult day care.a |
| Private Duty Nursing (TOS 38). Services provided by registered nurses or licensed practical nurses under direction of a physician to recipients in their own homes, hospitals, or nursing facilities as specified by the state.a |
| HCBS Waivers (Program Types 6 and 7). Services provided under Sections 1915(c) of the Social Security Act that enable states to provide Medicaid-financed community-based long-term care for people who would otherwise require Medicaid-covered hospital care, nursing facility care, or care in an ICF/MR. These programs can be designed to target individuals in specific age groups and with specific conditions, and the services can be restricted to certain areas of the state. |
|
Unfortunately, summary expenditure measures in the MAX PS files are reported by service type and by program type, but not by service and program types in MAX 2002.5 As a result, using both measures to identify community long-term care can lead to double-counting because waiver expenditures may also be reported under one or more service type categories. This also implies that waiver service expenditures cannot typically be disaggregated by service type using MAX PS data. (See Appendix A and Table A.1 for the composition of waiver service expenditures reported in MSIS for FY 2002 by TOS.)
To avoid duplicate counting while incorporating waiver expenditures, we use the following method to compute community long-term care expenditures:
-
For persons using fee-for-service (FFS) waiver services, community long-term care expenditures are set equal to waiver expenditures.
-
For persons not using FFS waiver services, community long-term care expenditures are set equal to the sum of personal care (TOS 30), residential care (TOS 52), home health (TOS 13), adult day (TOS 54), and private duty nursing (TOS 38) service type expenditures.
This computational method underestimates community long-term care expenditures because: (1) overall expenditures for people using waiver services are underestimated if they also use non-waiver community long-term care services provided at state option; and (2) services provided at state option (non-waiver services) but not included among the five community long-term care service types are not captured in the cost measures for either subgroup identified above. The first cause of the underestimate could potentially be resolved using MAX claims data, which were not available for this study. The second cause results from lack of information about which services are provided for long-term care purposes when not categorized within a specific long-term care service type or program. This data limitation could potentially be improved in future years of MAX data with more detailed reporting of service type in MSIS or with new data elements that enabled researchers to identify those services that were for long-term care but coded as more general service types.
Data Strengths and Limitations
MAX provides the potential to examine patterns of long-term care use and expenditures in much more detail than is possible with aggregated data. MAX enables researchers to analyze utilization-based rather than just expenditure-based measures and to examine service use and expenditures by subgroup. Whereas aggregate data only provide total Medicaid long-term care expenditures, MAX data can be used to additionally estimate total Medicaid expenditures among people using long-term care services. When claims data are available, MAX can also be used to examine the composition of waiver expenditures as well as variation in services used over time. MAX also provides more extensive service type information than is available in other data sources. For example, residential care, adult day care, and durable medical equipment service types are not reported on Form 64 or Form 372. Procedure codes available on claims can also be used to further examine the types of Medicaid long-term care services that are provided by individual states.
Such detailed data about over 50 million enrollees comes with some limitations. In addition to the underestimation of MAX community long-term care when using MAX PS files, there are a number of other caveats that should be considered when using MAX data to analyze patterns of long-term care:
-
Timeliness of MAX. Due to extensive reporting, data cleaning, and file construction requirements, MAX data are not as current as may be needed to address certain policy questions. In recent years, community long-term care expenditures have grown faster than institutional long-term care (OBrien 2005) and are higher than the statistics presented in this report.
-
Information Not Captured in MAX. Some Medicaid long-term care expenditures are not included in MAX:
-
Bulk Payments. Because MAX contains only person-level data, claims paid or adjustments made for multiple individuals as a lump sum--for example, some home and community-based waiver services, some capitated payments, and Disproportionate Share Hospital payments--are not included in the files.
-
Managed Care. Long-term care utilization and expenditures reported here reflect fee-for-services (FFS) use and expenditures only.6 (Institutional care is rarely covered under managed care arrangements, with Arizonas program being a notable exception.)
-
Cost-Sharing for Dual Enrollees. Medicaid premium payments paid on behalf of dual Medicare and Medicaid enrollees are not included in MAX. Co-insurance payments for duals are included in MAX only if Medicaid made payments for such services.
-
Missing Waiver Claims. Some states were not able to include all waiver claims in their MSIS submissions.
Because these data are not included in MAX, statistics for states with a significant portion of their long-term care expenditures paid in bulk or with extensive long-term care managed care programs cannot be directly compared with statistics computed for other states using MAX.
-
-
Double-Counting. Individuals who use Medicaid services in more than one state are observed as two people living in separate states. Double-counting implies that national measures of Medicaid long-term care use are somewhat overestimated. However, while movement across states among the general elderly population is common, we expect movement across states among the aged or disabled poor using long-term care services to be very limited and have a small impact on our estimates overall.
-
Data Anomalies. As with most administrative files of its size and scope, MAX data contain a variety of known and unknown data anomalies. A list of data anomalies associated with MAX long-term care measures used in this analysis is provided in Appendix C. Among other known anomalies, the list identifies states with significantly different long-term care expenditures reported in MAX, MSIS and Form 64.
Analysis Methods
The analyses presented in the following chapter capitalize on the strengths of MAX while taking into account the limitations of the data discussed above. Our analyses represent Medicaid enrollees from 37 states we believe have reliable data. We exclude states with extensive missing data or data that varies significantly from summary measures reported for other data sources. Specifically, we exclude Arizona, Hawaii, Massachusetts, Michigan, Montana, North Carolina, Oregon, Pennsylvania, Rhode Island, South Carolina, Tennessee, Texas, Virginia, and Washington. (See Appendix C for details regarding data anomalies in each state.) Exclusion decisions were based on comparisons made with statistics prepared by Burwell, Sredl, and Eiken (2003) from CMS Form 64, comparisons with waiver statistics reported by Kitchener, Ng, and Harrington from CMS Form 372, and knowledge about the structure of state Medicaid programs in terms of their institutional and community long-term care service provisions.
We note that not all excluded states are known to have problematic long-term care data in MAX. We excluded states from the analysis when statistics obtained using MAX varied substantially from published reports, and the accuracy of MAX data could not be confirmed (see Appendix C for more detail). MAX data for such states may be indeed be accurate but are not included in the results presented in the following chapter.
We also limit the population of long-term care users to those eligible for Medicaid as a result of age or disability and those eligible for comprehensive benefits at some point during the entire year.7 Aged enrollees include all enrollees age 65 and older in 2002. Disabled enrollees include people of all ages who are under 65 in 2002 and became eligible for Medicaid as a result of their disability. These two groups include almost all enrollees using Medicaid long-term care services. See Appendix B for further detail about basis of eligibility groups.
While we present national averages based on 37 states, the exclusion of 14 states from our analyses may bias our results. Some excluded states--Oregon and Washington, for example--are known to have strong community-based long-term care programs. However, others--Pennsylvania and Tennessee, for example--have typically spent less on community-based services than institutional care in the past. Overall, half the excluded states had lower-than-average and half had higher-than-average percentage of long-term care expenditures spent on community-based services in 2004 (OBrien 2005). As a result, it is plausible that our national totals based on the 37 represented states closely match true averages for all Medicaid enrollees, although it is also possible that significant biases are present. Our national estimates should be interpreted with caution.
III. USING MAX TO EXAMINE INSTITUTIONAL AND COMMUNITY-BASED LONG-TERM CARE SERVICE USE AND EXPENDITURES IN 2002
In this chapter we use data from MAX 2002 to illustrate four key ways in which MAX data can be used to gain better understanding of Medicaid long-term care service use and expenditures. We first compare utilization-based measures with traditionally-computed expenditure-based measures of the balance of institutional versus community-based long-term care. We then examine differences in Medicaid long-term care use and expenditure for two important subgroups of long-term care users: aged and disabled enrollees. In the next section, we summarize use and expenditures by detailed community-based long-term care service types that are not available in other data sources. In the final analysis presented in this chapter, we investigate total and service-specific Medicaid expenditures for three groups of long-term care: users of only institutional care, users of only community-based care, and users of both TOS. Each analysis highlights the potential of using person-level or service-specific data available in MAX to better understand patterns of long-term care use in Medicaid. The chapter also provides detailed estimates of Medicaid institutional and community-based long-term care utilization and expenditures in 37 states, with potential policy or future research implications. We discuss the implications of our results in Chapter IV.
Measuring the Balance of Institutional and Community-Based Long-Term Care: Expenditure- Versus Utilization-Based Measures
To capture the extent to which community-based programs have shifted long-term care from institutional care to the community, researchers have typically relied on aggregate measures summarizing community-based long-term care expenditures as a share of total long-term care expenditures. The problem with this approach is that total expenditures depend on the number of users that utilize services as well as the cost of those services. If community-based services are less costly alternatives to institutional care, expenditure share values would naturally be skewed towards institutional long-term care. Utilization-based measures provide an important alternative measure of the balance of institutional and community-based long-term care in Medicaid.
MAX data enable the examination of utilization-based as well as expenditure-based measures. They also enable state-level analyses. Table III.1 shows our 37 sample states ranked by two alternative measures of balance of community-based care: (1) an expenditure measure defined as the percentage of expenditures that were for community-based services in 2002; and (2) a utilization-based measure defined as the percentage of long-term care users that used community-based services in 2002. (See Appendix Table D.1 for information in Table III.1 ordered alphabetically by state.) The two measures can lead to different inferences about long-term care service balance nationally and across states.
| TABLE III.1. Expenditure and Utilization-Based Measures of the Balance of Institutional and Community-Based Long-Term Care for Aged and Disabled Enrollees in Select States in 2002, Ranked by Community-Based Service Share | |||||||
| Rank | States Ranked by Percentage of Expenditure for CLTC | States Ranked by Percentage Using CLTC | |||||
| $ | # | State | Total LTC Expenditures | Percentage of Total LTC Expenditures for CLTC | State | Number of LTC Users | Percentage of Total LTC Users Using CLTC |
| 1 | 3 | New Mexico | 542,600,816 | 65.1 | Alaska | 5,351 | 86.5 |
| 2 | 1 | Alaska | 170,053,768 | 62.1 | California | 442,150 | 77.2 |
| 3 | 12 | Vermont | 188,769,963 | 54.8 | New Mexico | 20,436 | 67.7 |
| 4 | 6 | Maine | 523,719,228 | 52.7 | Colorado | 40,666 | 67.6 |
| 5 | 16 | Wyoming | 134,720,415 | 51.9 | Idaho | 15,065 | 67.1 |
| 6 | 9 | Minnesota | 2,156,559,593 | 48.3 | Maine | 21,126 | 67.1 |
| 7 | 4 | Colorado | 789,483,284 | 47.3 | New York | 376,597 | 66.6 |
| 8 | 13 | Kansas | 721,488,818 | 47.0 | Alabama | 63,540 | 65.1 |
| 9 | 2 | California | 6,474,012,070 | 45.7 | Minnesota | 83,752 | 63.1 |
| 10 | 28 | New Hampshire | 347,963,248 | 43.1 | Illinois | 182,040 | 62.8 |
| 11 | 7 | New York | 14,262,218,168 | 39.4 | Missouri | 86,969 | 62.3 |
| 12 | 27 | Utah | 254,038,802 | 38.4 | Vermont | 8,200 | 61.6 |
| 13 | 11 | Missouri | 1,269,674,117 | 35.0 | All 37 States | 2,470,774 | 58.8 |
| 14 | 20 | Oklahoma | 840,695,921 | 34.0 | Kansas | 37,474 | 58.8 |
| All 37 States | 55,853,564,420 | 33.8 | West Virginia | 26,331 | 58.6 | ||
| 15 | 5 | Idaho | 271,976,684 | 33.3 | Arkansas | 46,856 | 56.8 |
| 16 | 14 | West Virginia | 538,084,789 | 32.9 | Wyoming | 5,316 | 56.2 |
| 17 | 31 | South Dakota | 208,020,237 | 32.3 | Iowa | 42,299 | 54.4 |
| 18 | 24 | Maryland | 1,229,324,525 | 32.1 | New Jersey | 94,780 | 53.3 |
| 19 | 26 | Connecticut | 1,845,597,817 | 30.9 | Florida | 158,986 | 52.1 |
| 20 | 18 | New Jersey | 2,545,888,294 | 30.8 | Oklahoma | 49,223 | 51.6 |
| 21 | 30 | Nebraska | 479,154,285 | 30.5 | Nevada | 9,478 | 50.8 |
| 22 | 25 | Delaware | 242,973,383 | 28.9 | Kentucky | 51,946 | 50.2 |
| 23 | 33 | Wisconsin | 1,434,230,775 | 27.8 | District of Columbia | 9,222 | 49.7 |
| 24 | 29 | Georgia | 1,294,811,205 | 27.0 | Maryland | 45,071 | 49.6 |
| 25 | 19 | Florida | 3,091,499,328 | 26.4 | Delaware | 6,851 | 49.1 |
| 26 | 21 | Nevada | 188,035,239 | 26.2 | Connecticut | 53,933 | 49.0 |
| 27 | 15 | Arkansas | 737,779,689 | 23.6 | Utah | 11,196 | 48.2 |
| 28 | 17 | Iowa | 797,603,243 | 23.5 | New Hampshire | 12,465 | 46.3 |
| 29 | 22 | Kentucky | 911,441,510 | 22.2 | Georgia | 72,476 | 44.9 |
| 30 | 35 | North Dakota | 252,311,287 | 21.8 | Nebraska | 19,525 | 44.0 |
| 31 | 10 | Illinois | 2,724,087,990 | 21.4 | South Dakota | 10,049 | 42.6 |
| 32 | 8 | Alabama | 949,247,839 | 20.6 | Ohio | 139,378 | 40.9 |
| 33 | 32 | Ohio | 3,936,270,515 | 20.3 | Wisconsin | 62,026 | 40.3 |
| 34 | 36 | Louisiana | 1,149,262,277 | 17.1 | Mississippi | 36,131 | 39.6 |
| 35 | 37 | Indiana | 1,402,625,664 | 16.9 | North Dakota | 8,838 | 37.7 |
| 36 | 23 | District of Columbia | 267,951,360 | 11.6 | Louisiana | 57,558 | 31.1 |
| 37 | 34 | Mississippi | 679,388,274 | 8.6 | Indiana | 57,474 | 23.0 |
| SOURCE: Medicaid Analytic eXtract, 2002 for a sample of 37 states with valid long-term care data. CLTC = community-based long-term care; LTC = long-term care. | |||||||
The utilization-based measure far exceeded the expenditure-based measure overall and in almost all states, suggesting far greater use of community-based services than the expenditure measure might suggest. Overall, only 33.8 percent of expenditures in our 37 sample states were for community-based services whereas a majority, 58.8 percent, of long-term care users utilized community-based services.8 The share of long-term care expenditures that were used for community-based services ranged from 65.1 percent in New Mexico to 8.6 percent in Mississippi. Aside from New Mexico, other states with high expenditure-based balance measures included Alaska (62.1 percent), Vermont (54.8 percent), Maine (52.7 percent), and Wyoming (51.9 percent). In comparison, over half the sample states had a utilization-based balance measure of more than 50 percent. The community-based service utilization rate ranged from 86.5 percent in Alaska to 23.0 percent in Indiana.
While the utilization-based measure was larger than the expenditure-based measure in every state, there was significant variation across states in how the two measures compared. For example, Illinois and Alabama ranked 31st and 32nd out of the 37 states in the percent of expenditures that were for community-based services but ranked 10th and 8th, respectively, in the percent of long-term care users who used community-based services. In these two states, the utilization rate of community-based services was much higher than their share of expenditures. In contrast, the two measures of long-term care balance were most similar in New Mexico and New Hampshire.
It should be kept in mind that states differ greatly in their Medicaid programs, service costs within the state, and the scope of covered services. Community-based waiver programs, for example, can cover a large number of individuals but provide only a limited set of long-term care services. Similarly, states vary greatly in the costs of institutionalization within the state as illustrated by the two highest ranked states in terms of community-based expenditure share--New Mexico and Alaska. While community-based service expenditures per user were only slightly lower ($25,547) than costs for institutional care ($26,507) in New Mexico, they were only a third of per-user institutional care expenditures in Alaska (see Appendix Table D.2). However, less than a thousand individuals were institutionalized in Alaska at the cost of $66,934 per user. Per-user expenditures for community-based care in Alaska, at $22,792, are not so different from those in New Mexico. (See Appendix Table D.2 for total expenditures, number of users, and per-user expenditures for institutional, community-based, and both types of long-term care services by state.)
In addition to variation in cost of care and program characteristics, many other factors can affect expenditure and utilization-based measures of long-term care balance. Utilization of community-based services at some point in the year does not preclude use of institutional services during the same year; states may differ in the proportion utilizing both services. Other factors, such as the enrollee age distribution, can also affect summary measures by state. Subgroup analyses investigating these factors provide insight into how long-term care services are used across states.
Analyses by Subgroup: Comparing Aged and Disabled Enrollees
Figure III.1 illustrates how aggregate numbers can mask considerable variation in the overall balance of community and institutional long-term care expenditures by subgroup. Community and institutional long-term care service expenditures were far more balanced among young disabled enrollees than among enrollees aged 65 or older who traditionally use nursing facility care. The percentage of total long-term care expenditures accounted for by community-based services ranged from 50.4 for people under age 65, 30.8 for people between ages 65 and 74, 21.0 for people between ages 75 and 84, and 12.9 for those age 85 and older. (See Appendix Table D.3 for these and other expenditure balance statistics by population subgroup.) Community-based services accounted for an average of 19.5 percent of long-term care expenditures among all enrollees age 65 and older.
| FIGURE III.1. Composition of Medicaid Long-Term Care (LTC) Users and Expenditures Among Aged and Disabled Enrollees in 2002 |
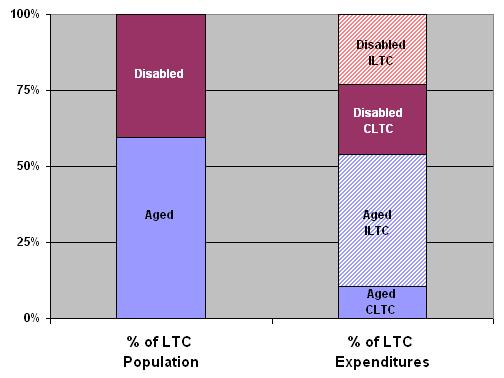 |
| SOURCE: Medicaid Analytic eXtract, 2002 for a sample of 37 states with valid long-term care data. CLTC = community long-term care; ILTC = institutional long-term care. |
Table III.2 shows the composition of Medicaid expenditures and Table III.3 shows the counterpart utilization-based measures separately for aged and disabled enrollees by state (also see Appendix Table D.1 for both types of information compared by state). Each table is ranked by the overall balance of long-term care service that is for community-based care. The measures depend on the people eligible, services covered, and the population composition in each state. To capture the long-term care cost burden to states, Table III.2 and Table III.3 also present the percentage of long-term care users who were aged and the percentage of Medicaid enrollees who were aged or disabled.
| TABLE III.2. Composition of Medicaid FFS Long-Term Care Expenditures Among Aged and Disabled Enrollees for Select States in 2002, Ranked by Community-Based Service Share | ||||||||
| Rank | State | Total LTC Expenditures | Community-Based LTC Expenditures as a Percentage of Total LTC Expenditures | % of LTC Users Who Were Ageda | % of All Medicaid Enrollees Who Were Aged or Disabled (Burden) | |||
| $ | # | Overall | Among Ageda | Among Disabled | ||||
| 1 | 3 | New Mexico | 542,600,816 | 65.1 | 44.3 | 83.6 | 57.8 | 16.6 |
| 2 | 1 | Alaska | 170,053,768 | 62.1 | 36.8 | 81.4 | 46.0 | 15.4 |
| 3 | 12 | Vermont | 188,769,963 | 54.8 | 20.6 | 91.7 | 57.5 | 18.8 |
| 4 | 6 | Maine | 523,719,228 | 52.7 | 23.0 | 78.4 | 56.2 | 29.9 |
| 5 | 16 | Wyoming | 134,720,415 | 51.9 | 11.6 | 79.8 | 51.4 | 17.9 |
| 6 | 9 | Minnesota | 2,156,559,593 | 48.3 | 14.2 | 74.9 | 50.9 | 23.9 |
| 7 | 4 | Colorado | 789,483,284 | 47.3 | 18.6 | 77.9 | 54.8 | 23.9 |
| 8 | 13 | Kansas | 721,488,818 | 47.0 | 20.4 | 72.2 | 56.0 | 25.5 |
| 9 | 2 | California | 6,474,012,070 | 45.7 | 38.1 | 54.1 | 60.1 | 26.1 |
| 10 | 28 | New Hampshire | 347,963,248 | 43.1 | 12.4 | 86.8 | 67.3 | 22.9 |
| 11 | 7 | New York | 14,262,218,168 | 39.4 | 30.9 | 48.8 | 58.7 | 25.0 |
| 12 | 27 | Utah | 254,038,802 | 38.4 | 6.8 | 54.1 | 44.7 | 16.1 |
| 13 | 11 | Missouri | 1,269,674,117 | 35.0 | 16.1 | 60.1 | 62.6 | 22.4 |
| 14 | 20 | Oklahoma | 840,695,921 | 34.0 | 11.3 | 57.0 | 66.6 | 20.2 |
| All 37 States | 55,853,564,420 | 33.8 | 19.5 | 50.4 | 59.5 | 25.0 | ||
| 15 | 5 | Idaho | 271,976,684 | 33.3 | 19.4 | 46.2 | 52.2 | 20.2 |
| 16 | 14 | West Virginia | 538,084,789 | 32.9 | 13.1 | 59.4 | 59.3 | 31.4 |
| 17 | 31 | South Dakota | 208,020,237 | 32.3 | 6.7 | 61.6 | 64.2 | 20.8 |
| 18 | 24 | Maryland | 1,229,324,525 | 32.1 | 10.9 | 62.4 | 56.4 | 22.7 |
| 19 | 26 | Connecticut | 1,845,597,817 | 30.9 | 11.3 | 55.8 | 66.0 | 23.0 |
| 20 | 18 | New Jersey | 2,545,888,294 | 30.8 | 21.5 | 43.2 | 65.9 | 28.0 |
| 21 | 30 | Nebraska | 479,154,285 | 30.5 | 9.7 | 55.9 | 63.1 | 19.5 |
| 22 | 25 | Delaware | 242,973,383 | 28.9 | 8.9 | 53.2 | 57.8 | 16.2 |
| 23 | 33 | Wisconsin | 1,434,230,775 | 27.8 | 10.1 | 52.6 | 65.8 | 26.1 |
| 24 | 29 | Georgia | 1,294,811,205 | 27.0 | 9.8 | 53.6 | 64.0 | 22.8 |
| 25 | 19 | Florida | 3,091,499,328 | 26.4 | 9.4 | 52.6 | 59.1 | 27.7 |
| 26 | 21 | Nevada | 188,035,239 | 26.2 | 11.8 | 42.2 | 59.2 | 19.8 |
| 27 | 15 | Arkansas | 737,779,689 | 23.6 | 14.0 | 36.3 | 62.0 | 27.7 |
| 28 | 17 | Iowa | 797,603,243 | 23.5 | 9.0 | 37.5 | 59.9 | 26.6 |
| 29 | 22 | Kentucky | 911,441,510 | 22.2 | 9.1 | 42.9 | 64.5 | 33.6 |
| 30 | 35 | North Dakota | 252,311,287 | 21.8 | 5.0 | 43.7 | 63.9 | 25.8 |
| 31 | 10 | Illinois | 2,724,087,990 | 21.4 | 9.5 | 31.4 | 50.5 | 21.4 |
| 32 | 8 | Alabama | 949,247,839 | 20.6 | 6.7 | 52.5 | 60.4 | 33.3 |
| 33 | 32 | Ohio | 3,936,270,515 | 20.3 | 8.8 | 37.4 | 63.5 | 23.3 |
| 34 | 36 | Louisiana | 1,149,262,277 | 17.1 | 2.0 | 28.1 | 49.9 | 25.1 |
| 35 | 37 | Indiana | 1,402,625,664 | 16.9 | 2.8 | 33.3 | 65.3 | 21.8 |
| 36 | 23 | District of Columbia | 267,951,360 | 11.6 | 5.6 | 19.1 | 47.3 | 25.6 |
| 37 | 34 | Mississippi | 679,388,274 | 8.6 | 5.8 | 13.1 | 67.9 | 32.9 |
SOURCE: Medicaid Analytic eXtract, 2002 for a sample of 37 states with valid long-term care data.
| ||||||||
In every state in our sample, expenditures for and utilization of community-based services relative to institutional care were significantly higher for disabled enrollees than for aged enrollees. On average, only 44.9 percent of aged but 79.3 percent of disabled used community-based care (reflecting 19.5 percent and 50.4 percent of costs, respectively). As a result, the states with the highest balance of community versus institutional long-term care expenditures and service use overall were those with the highest community-based service expenditures or use among the aged.
| TABLE III.3. Percentage of Medicaid FFS Long-Term Care Users Who Used Community-Based Services in Select States in 2002, Ranked by Percentage Using Community-Based Services | ||||||||
| Rank | State | Number of LTC Users | Community-Based LTC Users as a Percentage of Total LTC Users | % of LTC Users Who Were Ageda | % of All Medicaid Enrollees Who Were Aged or Disabled (Burden) | |||
| # | $ | Overall | Among Ageda | Among Disabled | ||||
| 1 | 2 | Alaska | 5,351 | 86.5 | 80.1 | 92.0 | 46.0 | 15.4 |
| 2 | 9 | California | 442,150 | 77.2 | 71.6 | 85.7 | 60.1 | 26.1 |
| 3 | 1 | New Mexico | 20,436 | 67.7 | 53.4 | 87.2 | 57.8 | 16.6 |
| 4 | 7 | Colorado | 40,666 | 67.6 | 49.6 | 89.3 | 54.8 | 23.9 |
| 5 | 15 | Idaho | 15,065 | 67.1 | 56.1 | 79.2 | 52.2 | 20.2 |
| 6 | 4 | Maine | 21,126 | 67.1 | 48.0 | 91.6 | 56.2 | 29.9 |
| 7 | 11 | New York | 376,597 | 66.6 | 52.5 | 86.7 | 58.7 | 25.0 |
| 8 | 32 | Alabama | 63,540 | 65.1 | 49.1 | 89.7 | 60.4 | 33.3 |
| 9 | 6 | Minnesota | 83,752 | 63.1 | 38.6 | 88.4 | 50.9 | 23.9 |
| 10 | 31 | Illinois | 182,040 | 62.8 | 47.0 | 78.9 | 50.5 | 21.4 |
| 11 | 13 | Missouri | 86,969 | 62.3 | 50.6 | 81.9 | 62.6 | 22.4 |
| 12 | 3 | Vermont | 8,200 | 61.6 | 37.7 | 93.8 | 57.5 | 18.8 |
| All 37 States | 2,470,774 | 58.8 | 44.9 | 79.3 | 59.5 | 25.0 | ||
| 13 | 8 | Kansas | 37,474 | 58.8 | 36.8 | 86.8 | 56.0 | 25.5 |
| 14 | 16 | West Virginia | 26,331 | 58.6 | 42.9 | 81.4 | 59.3 | 31.4 |
| 15 | 27 | Arkansas | 46,856 | 56.8 | 47.0 | 72.9 | 62.0 | 27.7 |
| 16 | 5 | Wyoming | 5,316 | 56.2 | 28.3 | 85.6 | 51.4 | 17.9 |
| 17 | 28 | Iowa | 42,299 | 54.4 | 39.1 | 77.1 | 59.9 | 26.6 |
| 18 | 20 | New Jersey | 94,780 | 53.3 | 42.0 | 75.0 | 65.9 | 28.0 |
| 19 | 25 | Florida | 158,986 | 52.1 | 33.3 | 79.2 | 59.1 | 27.7 |
| 20 | 14 | Oklahoma | 49,223 | 51.6 | 43.8 | 67.1 | 66.6 | 20.2 |
| 21 | 26 | Nevada | 9,478 | 50.8 | 38.1 | 69.3 | 59.2 | 19.8 |
| 22 | 29 | Kentucky | 51,946 | 50.2 | 35.9 | 76.3 | 64.5 | 33.6 |
| 23 | 36 | District of Columbia | 9,222 | 49.7 | 25.0 | 71.9 | 47.3 | 25.6 |
| 24 | 18 | Maryland | 45,071 | 49.6 | 26.7 | 79.2 | 56.4 | 22.7 |
| 25 | 22 | Delaware | 6,851 | 49.1 | 30.0 | 75.3 | 57.8 | 16.2 |
| 26 | 19 | Connecticut | 53,933 | 49.0 | 35.3 | 75.5 | 66.0 | 23.0 |
| 27 | 12 | Utah | 11,196 | 48.2 | 20.8 | 70.3 | 44.7 | 16.1 |
| 28 | 10 | New Hampshire | 12,465 | 46.3 | 25.1 | 89.9 | 67.3 | 22.9 |
| 29 | 24 | Georgia | 72,476 | 44.9 | 26.9 | 76.9 | 64.0 | 22.8 |
| 30 | 21 | Nebraska | 19,525 | 44.0 | 25.8 | 75.2 | 63.1 | 19.5 |
| 31 | 17 | South Dakota | 10,049 | 42.6 | 23.4 | 77.0 | 64.2 | 20.8 |
| 32 | 33 | Ohio | 139,378 | 40.9 | 29.3 | 61.3 | 63.5 | 23.3 |
| 33 | 23 | Wisconsin | 62,026 | 40.3 | 22.8 | 73.8 | 65.8 | 26.1 |
| 34 | 37 | Mississippi | 36,131 | 39.6 | 33.0 | 53.4 | 67.9 | 32.9 |
| 35 | 30 | North Dakota | 8,838 | 37.7 | 17.9 | 72.6 | 63.9 | 25.8 |
| 36 | 34 | Louisiana | 57,558 | 31.1 | 11.5 | 50.5 | 49.9 | 25.1 |
| 37 | 35 | Indiana | 57,474 | 23.0 | 7.7 | 51.7 | 65.3 | 21.8 |
SOURCE: Medicaid Analytic eXtract, 2002 for a sample of 37 states with valid long-term care data.
| ||||||||
Many factors can contribute to variation in long-term care expenditures and utilization across states. New Mexico and Alaska--among the top three states in both community-based service expenditure share and utilization--had relatively young Medicaid populations but also had higher-than-average community-based service utilization and expenditure share among the aged. It should also be noted that while the balance of community to institutional care was higher for disabled than aged in every state, they were more closely balanced in some states like California and New York.
While the balance of expenditures between community and institutional care for younger (disabled) enrollees suggests that rebalancing initiatives have been successful for this population, another potential explanation for a rise in community care service use is utilization of services among people who would otherwise not have used institutional long-term care. Our cross-section of 2002 MAX data does not allow us to further investigate this issue. MAX claims files or additional years of MAX data would be needed for such an analysis. The results presented here, however, illustrate the utility of using MAX to better understand who has access to and is receiving services.
| TABLE III.4. Characteristics of Aged and Disabled Enrollees Using Medicaid Fee-for-Service Long-Term Care Services Compared with Those of All Full-Benefit Enrollees in 2002 | ||||||
| All Full-Benefit Medicaid Enrollees | Non-LTC Enrolleesa | Aged or Disabled Enrollees Using LTC Services | ||||
| Any FFS LTC | ILTC Only | Both ILTC and CLTC | CLTC Only | |||
| Percentage of Total Population | 100.0 | 92.3 | 7.7 | 3.2 | 0.5 | 4.1 |
| Demographic Characteristics | ||||||
| Age (Percentage of Subgroup) | ||||||
| Under age 21 | 58.1 | 62.5 | 5.3 | 1.6 | 2.7 | 8.5 |
| 21-64 years | 31.3 | 31.0 | 35.2 | 18.7 | 34.0 | 48.2 |
| 65-74 years | 4.2 | 3.4 | 14.3 | 12.6 | 15.8 | 15.6 |
| 75-84 years | 3.6 | 2.0 | 22.2 | 28.1 | 25.0 | 17.3 |
| 85 years and older | 2.4 | 0.7 | 23.0 | 39.0 | 22.6 | 10.5 |
| Percentage Non-Hispanic White | 43.6 | 41.8 | 64.6 | 75.9 | 65.4 | 55.8 |
| Percentage Male | 42.5 | 43.1 | 35.6 | 32.8 | 34.6 | 37.9 |
| Enrollment Characteristics | ||||||
| Basis of Eligibility (Percentage) | ||||||
| Agedb | 10.2 | 6.1 | 59.5 | 79.7 | 63.3 | 43.4 |
| Disabled | 14.9 | 12.7 | 40.5 | 20.3 | 36.7 | 56.6 |
| Percentage Enrolled all Year | 58.7 | 57.2 | 77.5 | 65.9 | 77.6 | 86.6 |
| Medicare Status (Percentage) | ||||||
| Not a dual | 85.8 | 90.9 | 25.2 | 12.5 | 21.9 | 35.5 |
| Part-year dualc | 0.8 | 0.6 | 3.2 | 3.3 | 4.5 | 3.0 |
| Full-year dualc | 13.4 | 8.6 | 71.6 | 84.1 | 73.6 | 61.5 |
| Percentage Enrolled in Medicaid Managed Care | 62.8 | 65.6 | 28.9 | 17.2 | 21.5 | 39.0 |
SOURCE: Medicaid Analytic eXtract, 2002 sample of 37 states with valid long-term care data. ILTC = institutional long-term care; CLTC = community long-term care.
| ||||||
MAX can be used for more detailed subgroup analyses that can help identify potential target populations for new programs. Table III.4 profiles long-term care users who used community, institutional, or both types of Medicaid long-term care services in 2002. Compared with Medicaid enrollees with no long-term care use, aged or disabled people using long-term care services were more likely to include older individuals and those eligible for Medicaid as a result of their age or disability. Other dominant characteristics among long-term care users were correlated with age--including non-Hispanic White race and female gender. Because children and adult enrollees tend to have shorter spells of Medicaid enrollment, people using long-term care services are more likely to be enrolled all year. They also are less likely than other enrollees to be enrolled in managed care because, in 2002, Medicaid managed care plans often exempted duals and other aged or disabled enrollees and excluded long-term care services from their plans.
Examining Service-Level Detail for Community-Based Services
Community-based long-term care services differ greatly in type and scope when compared with institutional care. Consequently, it is important to examine such service not just relative to institutional care but also in their composition and component parts. MAX PS and claims files can potentially be used to examine community-based long-term care service types in much more detail than possible using more aggregated data such as those in Form 64.
Community-based services can be provided in any setting that is not an institution (such as a nursing home or ICF/MR) if the state chooses to do so. Community care is provided in traditional homes or apartments, but it also can be provided in group homes or assisted living facilities. Home health, adult day care, and private duty nursing service types in MAX reflect services received by a particular agency or provider type. Personal care includes all other services provided in traditional homes. While Medicaid cannot pay for room and board outside institutions, many support services can be covered. Usually a persons SSI or state supplement payments cover room and board, while Medicaid pays for the other services they receive in such facilities. These services may be provided by the operator of the home or facility, by an outside agency, or both. The MAX residential care service type includes Medicaid-covered services that people receive in such group settings. Residential care and adult day care are service types not differentiated in other data sources (including Form 64) and provide additional detail about the location and type of community-based Medicaid services that are used.
Overall, we estimate that almost 34 percent of Medicaid FFS long-term care expenditures in 2002 were for community-based services (Figure III.2). This estimate is slightly higher than the 30 percent computed using data in Form 64 (Burwell, Sredl, and Eiken 2003). This difference is potentially due to changes in the distribution of expenditures over time captured in the calendar year MAX data compared with FY Form 64 and/or other differences in institutional or community-based long-term care reporting between the two data sources. Another possible explanation for the higher estimates of community long-term care using MAX compared with Form 64 is the additional information about service type available in MAX. We estimate that 1.7 percent of non-waiver long-term care expenditures went to adult day care (1.5 percent) and residential care (0.2 percent). Although relatively small, these service expenditures have typically not been included in past estimates of long-term care. Nevertheless, community long-term care is known to be underestimated in this study for our 37 sample states (see Chapter II) and as a result, the true balance of expenditures between community and institutional services is expected to be more equal.
| FIGURE III.2. Composition of Medicaid Long-Term Care Expenditures Among Aged and Disabled Enrollees in 2002 |
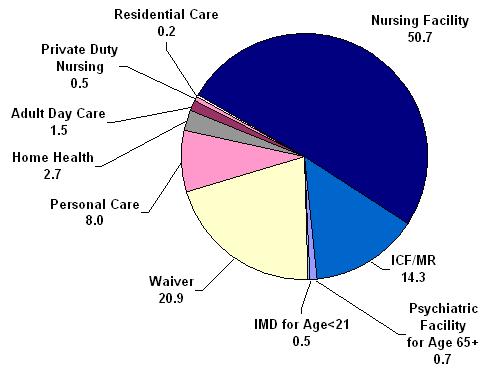 |
| SOURCE: Medicaid Analytic eXtract, 2002 for a sample of 37 states with valid long-term care data.: Medicaid Analytic eXtract, 2002 for a sample of 37 states with valid long-term care data. |
Community long-term care expenditures were dominated by costs for Section 1915(c) waiver services, which consist of a wide range of service types. Waivers accounted for 20.9 percent of Medicaid long-term care expenditures in our sample states. Other non-waiver community-based services that contributed to long-term care expenditures include personal care (8.0 percent), home health (2.7 percent), adult day care (1.5 percent), private duty nursing (0.5 percent), and residential care (0.2 percent). (See Appendix Table D.4 for state-level detail about the composition of Medicaid long-term care expenditures in each state in our sample.)
National averages can be skewed by large states like New York and California. These two states have the largest state personal care programs in the country and they alone accounted for 83 percent of non-waiver personal care expenditures in the 37 states in our sample.9
Because such a large portion of community long-term care is provided by waiver services and thus is aggregated over service type, we also examine expenditures by service type regardless of waiver coverage. (Many waiver services are grouped as Other types and thus will not be captured in these estimates.) Table III.5 shows average expenditures per enrollee using any long-term care service for the top ten states in average expenditures for each of four community-based service types. Each measure captures both the frequency of use in the state and the cost per user of service. While non-waiver community long-term care in residential settings contributed only 0.2 percent to long-term care expenditures, residential care was a significant component of waiver services. Waiver and non-waiver services reported under residential care together composed 6 percent of total long-term care expenditures and 23 percent of community-based long-term care expenditures reported as service types. We estimate that overall, at least $1,354 was spent on residential care per user of any long-term care in our sample states, compared with $2,413 for personal care, $968 for home health, $946 for adult day and $184 for private duty nursing services (not shown). The highest personal care and residential care dollars per long-term care user were spent in Alaska ($8,132 and $11,074, respectively). Maryland had the highest home health expenditures ($6,578) and Wyoming the highest adult day expenditures ($3,141) per long-term care user. (See Appendix Table D.5 for additional state-level detail.)
| TABLE III.5. FFS Expenditures for Personal Care, Residential Care, Home Health, and Adult Day Care per Aged or Disabled Medicaid Enrollee Using Long-Term Care Services (Includes Waiver Services with Reported Service Type): Top 10 States | |||||||
| Personal Care | Residential Care | Home Health | Adult Day | ||||
| State | Dollars | State | Dollars | State | Dollars | State | Dollars |
| Alaska | 8,132 | Alaska | 11,074 | Maryland | 6,578 | Wyoming | 3,141 |
| New Mexico | 7,236 | Wyoming | 5,553 | Connecticut | 3,043 | New York | 2,772 |
| California | 5,565 | Utah | 5,196 | New York | 2,402 | New Hampshire | 2,393 |
| New York | 5,145 | Connecticut | 5,114 | Colorado | 1,768 | Oklahoma | 2,130 |
| Kansas | 3,656 | New York | 4,327 | District of Columbia | 1,749 | Maine | 2,033 |
| Idaho | 3,115 | Kansas | 3,673 | Iowa | 1,415 | District of Columbia | 2,013 |
| Minnesota | 3,010 | Iowa | 2,814 | Georgia | 1,072 | Maryland | 1,558 |
| New Jersey | 2,519 | West Virginia | 2,544 | Florida | 984 | Kansas | 1,415 |
| Missouri | 2,202 | Indiana | 2,303 | Kentucky | 935 | Minnesota | 1,283 |
| Nevada | 1,900 | Delaware | 2,192 | Nebraska | 881 | Alaska | 1,253 |
| All 37 States | 2,413 | All 37 States | 1,354 | All 37 States | 968 | All 37 States | 946 |
| SOURCE: Medicaid Analytic eXtract, 2002 for a sample of 37 states with valid long-term care data. | |||||||
Other Medicaid Service Use and Expenditures Among Long-Term Care Users
A critically important feature of MAX and other person-level data for understanding Medicaid long-term care utilization is the ability to examine not just long-term care service use and expenditures, but also other Medicaid service use and expenditures among people using long-term care services. Aged or disabled enrollees using Medicaid long-term care services accounted for 7.7 percent of all full-benefit Medicaid enrollees in our 37 sample states but represented over 50 percent of their total Medicaid expenditures (including FFS and managed care premiums paid). The combinations of services they use can give additional insight into their characteristics and their long-term care needs.
Total Medicaid expenditures were highest, on average, for people using both institutional and community long-term care (Table III.6). These individuals incurred an average of $46,055 in 2002 compared with $38,844 among those with institutional care only and $24,966 for those with only community-based long-term care use. However, their long-term care service expenditures were similar to those of enrollees using only institutional services. Instead, their large Medicaid expenditures were accounted for primarily by expenditures for inpatient hospital services ($5,991 on average compared with $2,741 and $1,460 for people using only community or institutional care services, respectively) and prescription drugs ($3,842 compared with $3,534 and $2,775 for people using only community or institutional care services, respectively). (See Appendix Table D.6 for average expenditures incurred by long-term care users by detailed type of service.)
| TABLE III.6. Average Medicaid Expenditures for Aged or Disabled Enrollees Using Medicaid Fee-for-Service Long-Term Care Services in 2002, by Type of Service and Program Type | ||||
| Aged or Disabled Enrollees Using LTC Services | ||||
| Any FFS LTC | ITLC Only | Both ILTC and CLTC | CLTC Only | |
| Number of Enrollees | 2,470,774 | 1,016,844 | 152,755 | 1,301,175 |
| Total Medicaid Expenditures per Enrollee | 31,981 | 38,844 | 46,055 | 24,966 |
| Total Long-Term Care Expenditures per Enrollee | 22,606 | 32,833 | 31,605 | 13,557 |
| Long-Term Care Expenditures per Enrollee by Type of Servicea | ||||
| All long-term care service types (excludes non-categorized waiver services)a | 20,837 | 32,833 | 30,065a | 10,379a |
| Institutional long-term care | ||||
| Nursing facility | 11,469 | 25,889 | 13,170 | 0 |
| ICF/MR | 3,243 | 6,427 | 9,675 | 0 |
| Inpatient psychiatric for those under 21 | 151 | 298 | 456 | 0 |
| Mental hospital services for the aged (65 and older) | 110 | 219 | 320 | 0 |
| Community long-term care | ||||
| Personal care | 2,413 | 0 | 2,612 | 4,275 |
| Residential care | 1,354 | 0 | 836 | 2,469 |
| Home health | 968 | 0 | 1,426 | 1,671 |
| Adult day care | 946 | 0 | 1,477 | 1,623 |
| Private duty nursing | 184 | 0 | 67 | 341 |
| Long-Term Care Expenditures per Enrollee by Program Type | ||||
| Section 1915(c) waiver servicesa | 4,713 | 0 | 3,279 | 8,565 |
| Other Service Type Expenditures per Enrollee | ||||
| Inpatient care | 2,415 | 1,460 | 5,991 | 2,741 |
| Prescription drugs | 3,241 | 2,775 | 3,842 | 3,534 |
SOURCE: Medicaid Analytic eXtract, 2002 sample of 37 states with valid long-term care data. CLTC = community long-term care; ILTC = institutional long-term care; LTC = long-term care.
| ||||
The high average inpatient and prescription drug expenditures for people using both community and institutional long-term care services relative to other long-term care users is due to both high utilization of these services and high expenditures per user. Over 49 percent used inpatient services and almost 96 percent used prescription drugs, compared with 24.4 percent and 85.8 percent, respectively, among people using only institutional long-term care and 26.0 percent and 89.5 percent, respectively, among people using only community-based service (see Appendix Table D.7). Inpatient expenditures were $12,214 and prescription drug expenditures were $4,016 per user among people with both institutional and community-based service use, compared with $10,564 and $3,947, respectively, for people using community-based services only and $5,993 and $3,234, respectively, for those using only institutional care (see Appendix Table D.8). A similar pattern is evident among dual enrollees--for whom Medicare covers most acute inpatient care for short hospital stays (Table III.7).
| TABLE III.7. Average Medicaid Expenditures for Aged or Disabled Duals Using Medicaid Fee-for-Service Long-Term Care Services in 2002, by Type of Service and Program Type | ||||
| Aged or Disabled Duals Using LTC Services | ||||
| Any FFS LTC | ITLC Only | Both ILTC and CLTC | CLTC Only | |
| Number of Dual Enrollees | 1,848,148 | 889,335 | 119,270 | 839,542 |
| Total Medicaid Expenditures per Dual Enrollee | 29,402 | 35,548 | 37,977 | 21,673 |
| Total Long-Term Care Expenditures per Dual Enrollee | 23,0120 | 30,996 | 28,618 | 13,758 |
| Long-Term Care Expenditures per Dual Enrollee by Type of Servicea | ||||
| All long-term care service types (excludes non-categorized waiver services)a | 21,449 | 30,996 | 27,267a | 10,509a |
| Institutional long-term care | ||||
| Nursing facility | 13,507 | 26,286 | 13,290 | 0 |
| ICF/MR | 2,650 | 4,511 | 4,426 | 0 |
| Inpatient psychiatric for those under 21 | 3 | 6 | 9 | 0 |
| Mental hospital services for the aged (65 and older) | 112 | 194 | 289 | 0 |
| Community long-term care | ||||
| Personal care | 4,064 | 0 | 2,842 | 4,790 |
| Residential care | 2,359 | 0 | 835 | 2,656 |
| Home health | 1,219 | 0 | 1,308 | 1,455 |
| Adult day care | 801 | 0 | 1,240 | 1,586 |
| Private duty nursing | 53 | 0 | 27 | 114 |
| Long-Term Care Expenditures per Dual Enrollee by Program Type | ||||
| Section 1915(c) waiver servicesa | 4,064 | 0 | 3,019 | 8,518 |
| Other Service Type Expenditures per Dual Enrollee | ||||
| Inpatient care | 791 | 544 | 2,509 | 809 |
| Prescription drugs | 3,091 | 2,658 | 3,501 | 3,492 |
SOURCE: Medicaid Analytic eXtract, 2002 sample of 37 states with valid long-term care data. CLTC = community long-term care; ILTC = institutional long-term care; LTC = long-term care.
| ||||
While these summary statistics may give some indication of the type of enrollees that utilize both institutional and community-based services and their overall and service-specific costs, it should be kept in mind that they represent data from only 37 states that were not randomly selected. These data do, however, illustrate the utility of MAX for better understanding use and costs of Medicaid long-term care and patterns of utilization and expenditures by subgroup.
IV. SUMMARY AND CONCLUSIONS
In this report we utilize MAX PS file data to examine patterns of institutional and community-based long-term care use and expenditures in 37 states. We illustrate the types of analyses possible using MAX, describe MAX data limitations, and present summary long-term care statistics that have potential policy or future research implications. Below we summarize the lessons learned from our analyses. We also describe the potential for further study of long-term care using MAX data based on our experience analyzing MAX 2002 data for this report.
Summary of Key Results and Their Implications
Our investigation of long-term care use and expenditures in 2002 highlights four key ways in which individual-level MAX data can be used to answer important policy questions that are not possible using more aggregated data and are typically not possible using survey data. We examine: (1) utilization-based measures as complements to expenditure-based measures of the balance of community versus institutional long-term care; (2) utilization and expenditures by subgroup; (3) composition of community-based services by type; and (4) other services used and costs incurred by long-term care users. Each analysis highlights the utility of using person-level data available in MAX. In many cases we present state-level statistics for the 37 sample states.
In this report we compare traditionally-computed expenditure-based measures of the balance of institutional and community-based long-term care (percent of expenditures that are for community-based services) with a utilization-based measure (percent of long-term care users who used community-based services). Because expenditures are a function both use and cost of services and because community-based services are typically less costly than institutionalization, aggregate institutional and community-based expenditure comparisons mask key differences in utilization. While only 34 percent of long-term care expenditures paid for persons served were for community-based services in 2002, almost 59 percent of long-term care users used community-based services. In every state, the utilization-based measure was far larger than the expenditure-based measure. Community-based service expenditures as a share of total long-term care expenditures ranged from over 60 percent in Alaska and New Mexico to less than 12 percent in the District of Columbia and Mississippi. Meanwhile, utilization of community-based services among long-term care users ranged from 87 percent in Alaska to 23 percent in Indiana. These results illustrate that alternative measures of the balance of community-based and institutional long-term care services provide a very different understanding of long-term care utilization and could potentially lead to different conclusions about rebalancing efforts across states.
A second way in which MAX person-level data can shed light on long-term care is through subgroup analyses. We identified the most significant differences in measures of community-based service share by population age group. Over half of long-term care expenditures were for community-based services among young disabled enrollees compared with less than 20 percent among those over 65. Community-based service expenditures as a share of total long-term care expenditures declined by age from 50 percent for people under age 65 to 13 percent for those age 85 and older. Rates of community-based service utilization were higher but followed a similar pattern by age.
Subgroup analyses by state suggest that differences between aged and disabled enrollees in their patterns of long-term care were widespread across the states. Among young disabled enrollees, Medicaid community-based service expenditures exceeded those of institutional long-term care in more than half of our sample states. Among aged enrollees, the highest share of expenditures for community-based services was in New Mexico, at 44.3 percent. Community service utilization among the aged--traditional users of nursing homes--exceeded 50 percent in only six states. Furthermore, states with long-term care systems most balanced toward community-based care were those with services most balanced among the aged. These findings are consistent with those of Eiken, Burwell, and Selig (2006) suggesting that almost three-fourths of waiver expenditures go to programs for MR/DD. It also suggests that further efforts to rebalance long-term care towards community-based services may need to target a broader population of long-term care users that include the elderly.
The third benefit of MAX data for long-term care studies is availability of service-level detail that is not available in Form 64 or other data sources. In addition to Section 1915(c) waiver, personal care, and home health expenditures reported elsewhere, MAX claims for adult day care and residential care are also distinguished and summarized in MAX PS files. While non-waiver residential care represented only 0.2 percent of total long-term care expenditures in our sample states, waiver and non-waiver residential care together made up over 6 percent of long-term care expenditures and 23 percent of community-based long-term care expenditures reported under service types in 2002. However, because waiver services are often reported in the aggregate Other service type in MAX, the usefulness of these data for detailed analyses of the composition of Medicaid waiver services is limited.
Finally, MAX data can be used to examine use of other, non-long-term care services among long-term care users throughout the year, as well as utilization of combinations of services. About 6 percent of Medicaid long-term care users used both institutional and community-based services in 2002. This group represented 13 percent of enrollees using institutional care and 11 percent of enrollees using community-based long-term care in our 37 sample states. People using both services had higher average Medicaid expenditures ($46,055) than users of institutional care only ($38,844) or community care only ($24,966). The high overall expenditures for people using both types of long-term care were due to hospitalizations: over half used Medicaid inpatient services in 2002 compared with less than a quarter of other long-term care users. Because short nursing facility stays for acute conditions after hospitalization are covered by Medicare but may include Medicaid cost-sharing, use of both community and institutional care among dual enrollees may reflect stays primarily paid by Medicare rather than Medicaid. However, most people using community-based long-term care services used only such services, implying that relatively few transitioned from institutions to the community in 2002.
It is important to keep in mind that the results presented in this report are based on data from only 37 states and consequently, care should be taken when drawing implications from our results. Nevertheless, the results do indicate several interesting areas for further research, including the measurement of rebalancing efforts, the role of community-based long-term care services for aged enrollees, and the service patterns of people using both community and institutional care. Because person-level data is needed to address these and other important Medicaid long-term care policy questions, the development of MAX in the coming years will be critical to long-term care research.
The Future of MAX for the Study of Medicaid Long-Term Care
Great strides have been made to improve the quality of MAX since state reporting to MSIS became mandatory in 1999. The most important changes expected for the MAX data systems for calendar years 2003, 2004, and 2005 will address some key limitations of MAX 2002 for long-term care analyses:
-
MAX 2003 data has recently been made available and the production of MAX data is expected to speed up substantially in the coming years.
-
New information about enrollment in waiver programs has been collected in MSIS and will be available for researchers in MAX 2005. These new measures will enable researchers to identify people enrolled in specific types of Section 1915(c) waiver programs as well as those enrolled in waiver programs but not receiving services or who, due to reporting errors or bulk paid costs, do not have expenditures reported in MAX.
-
New community long-term care measures are in development for MAX 2005 and MAX 2006 that will enable researchers to use MAX PS files to better estimate community care service use and expenditures by service type (including waiver services). These efforts are ongoing but have the potential to make estimating long-term care use and cost simpler and much more accurate using MAX data.
These improvements along with the utility of person-level MAX data illustrated in this report have the potential to make MAX the gold standard for understanding patterns of Medicaid long-term care use and spending across states and nationally. However, the utility of using MAX for extensive national study of Medicaid long-term care in the United States will in the long-run depend on the quality and detail of institutional and community-based data reported by states in MSIS in future years. It will also depend on how well new measures developed in MAX capture community long-term care services. We recommend that MAX 2005 data include new measures summarizing waiver expenditure by type of service to enable researchers to more accurately estimate overall utilization and total expenditures for community-based long-term care services. Such new measures would greatly improve the accuracy of estimates and the utility of MAX as a research tool for examining rebalancing efforts and other long-term care policy issues nationwide.
REFERENCES
Burwell, Brian, Kate Sredl, and Steve Eiken. Medicaid Long-Term Care Expenditures in FY 2002. Memorandum, Cambridge, MA: Medstat, May 13, 2003. Accessed June 2006 at [http://www.hcbs.org/moreInfo.php/nb/doc/120/Medicaid_Long_Term_Care_Expenditures,_FY2002].
Centers for Medicare & Medicaid Services. Medicaid-at-a-Glance 2002: A Medicaid Information Source. Washington, DC: U.S. Department of Health and Human Services, CMS, Center for Medicaid and State Operations, Publication No. CMS-11024-02. Accessed June 2006a, at [http://www.hhs.gov/od/documents/MA2002.pdf].
Centers for Medicare & Medicaid Services. National Health Expenditures by Type of Service and Source of Funds, CY 1960-2004. Washington, DC: U.S. Department of Health and Human Services, CMS, Office of the Actuary, National Health Statistics Group. Accessed August 2006b, at [http://www.cms.hhs.gov/NationalHealthExpendData/downloads/tables.pdf].
Crowley, Jeffrey S. Medicaid Long-Term Services Reforms in the Deficit Reduction Act. Issue Paper no. 7486, Washington, DC: Kaiser Commission on Medicaid and the Uninsured, April 2006. Accessed on May 17, 2006 at [http://www.kff.org/medicaid/upload/7486.pdf].
Doty, Pamela. Cost-Effectiveness of Home and Community-Based Long-Term Care Services. Washington, D.C.: Department of Health and Human Services, Office of the Assistant Secretary for Planning and Evaluation, Office of Disability, Aging and Long-Term Care Policy, June 2000. [http://aspe.hhs.gov/daltcp/reports/costeff.htm]
Eiken, Steve, Brian Burwell, and Becky Selig. Medicaid HCBS Waiver Expenditures FY2000 Through FY2005. Memorandum, Cambridge, MA: Medstat, July 6, 2006. Accessed June 2007 at [http://www.hcbs.org/moreInfo.php/nb/doc/1637 ].
Grabowski, David C., Zhanlian Feng, Orna Intrator, and Vincent Mor. Recent Trends in State Nursing Home Payment Policies. Health Affairs, Web Exclusives, June 16, 2004. Accessed on June 26, 2006 at [http://content.healthaffairs.org/cgi/content/abstract/hlthaff.w4.363].
Kitchener, Martin, Terence Ng, and Charlene Harrington. Medicaid Home and Community-Based Services for the Elderly: Trends in Programs and Policies. Journal of Applied Gerontology, vol. 26, no. 3, 2007, pp. 305-324.
Kitchener, Martin, Terence Ng, Charlene Harrington, and Molly OMalley. Medicaid 1915(c) Home and Community-Based Service Programs: Data Update. Issue Paper no. 7345, Washington, DC: Kaiser Commission on Medicaid and the Uninsured, November 2005a. Accessed May 2007 at [http://www.kff.org/medicaid/7345.cfm ].
Kitchener, Martin, Terence Ng, Nancy Miller, and Charlene Harrington. Medicaid Home and Community-Based Services: National Program Trends. Health Affairs, vol. 24, no. 1, January/February 2005b, pp. 206-212.
National PACE Association. ASAP Guidebook. Alexandria, VA: National PACE Association, March 2004. Accessed on June 15, 2007 at [http://www.npaonline.org/website/article.asp?id=119 ].
OBrien Ellen. Long-Term Care: Understanding Medicaids Role for the Elderly and Disabled. Washington, DC: Kaiser Commission on Medicaid and the Uninsured, November 2005. Accessed June 12, 2007, at [http://www.kff.org/medicaid/7428.cfm ].
Reester, Heidi, Raad Missmar, and Anne Tumlinson. Recent Growth in Medicaid Home and Community-Based Service Waivers. Issue Paper no. 7077, Washington, DC: Kaiser Commission on Medicaid and the Uninsured, April 2004. Accessed September 2006 at [http://www.kff.org/medicaid/7077-index.cfm ].
Robison, Julie, Cynthia Gruman, Leslie Curry, Noreen Shugrue, Kathy Kellet, Martha Porter, Irene Reed, Robert Kane, and Rosalie Kane. Connecticut Long-Term Care Needs Assessment, Part II: Rebalancing Long-Term Care Systems in Connecticut and Recommendations. Farmington, CT: University of Connecticut Health Center, June 2007. Accessed July 2007 at [http://www.cga.ct.gov/coa/PDFs/Rebalancing%20report%20FINAL%20June%2025%2007.pdf ].
Schneider, Andy, Risa Elias, Rachel Garfield, David Rousseau, and Victoria Wachino. The Medicaid Resource Book. Washington, DC: Kaiser Commission on Medicaid and the Uninsured, July 2002.
Shirk, Cynthia. Rebalancing Long-Term Care: The Role of the Medicaid HCBS Waiver Program. National Health Policy Forum Background Paper, Washington, DC: The George Washington University, March 3, 2006. Accessed on July 17, 2007 at [http://www.nhpf.org/pdfs_bp/BP_HCBS.Waivers_03-03-06.pdf ].
Saucier, Paul. Medicaid Managed Long-Term Care. AARP Public Policy Institute Issue Brief, Washington, DC: AARP Public Policy Institute, November 2005. Accessed on June 14, 2007 at [http://assets.aarp.org/rgcenter/il/ib79_mmltc.pdf ].
Smith, Gary, Janet O'Keefe, Letty Carpenter, Pamela Doty, and Gavin Kennedy. Understanding Medicaid Home and Community Services: A Primer. Washington, DC: U.S. Department of Health and Human Services, Office of the Assistant Secretary for Planning and Evaluation, October 2000. [http://aspe.hhs.gov/daltcp/reports/primer.htm]
Wenzlow, Audra T., Dan Finkelstein, Ben Le Cook, Kathy Shepperson, Christine Yip, and David Baugh. The Medicaid Analytic eXtract Chartbook. Baltimore, MD: Centers for Medicare & Medicaid Services, 2007. Accessed June 15, 2007, at [http://www.cms.hhs.gov/MedicaidDataSourcesGenInfo/Downloads/MAX_Chartboo... ].
APPENDIX A. MAX LONG-TERM CARE AND OTHER SERVICE TYPES
As described in Chapter II, the MAX data system consists of data derived from the Medicaid Statistical Information System (MSIS). While MSIS contains fiscal year (FY) Medicaid enrollment and claims paid data submitted by states each quarter, MAX is a calendar year, cleaned version of MSIS that is intended to enable person-level analyses of enrollment, utilization, and expenditures reflecting services used during the year.
While there are a variety of differences between MSIS and MAX (see MAX documentation on the Center for Medicare & Medicaid Services (CMS) website [http://www.cms.hhs.gov/MedicaidDataSourcesGenInfo/07_MAXGeneralInformation. asp] or Wenzlow et al. 2007), one key difference affecting long-term care measurement is a remapping of some MSIS type of service data into four additional types of service (TOS) categories in MAX. These new codes were developed to provide further information about services that are often coded by the states in the large MSIS service group called "Other Services" (TOS 19). The new codes include two community long-term care categories--residential care (TOS 52) and adult day care (TOS 54). This appendix provides background information about these and other service and program types in MAX, including their definitions and planned changes for these measures in future years.
MAX Service and Program Types
MAX claims are grouped into 33 service type categories and the service type code is specified on each claim in the MAX claim files. Service use and total expenditures incurred during the year for each service type are summarized for each enrollee in the MAX PS files. Table A.1 lists these services along with their TOS code, grouped by the claim file in which the claims are typically found. Services considered to be long-term care services in this study are shown in bold. Table A.1 also shows the composition of home and community-based waiver expenditures, measured in program types 6 and 7 (services provided under 1915(c) waivers) as reported in MSIS for FY 2002. The table suggests that most waiver services (75 percent) had Other TOS codes in MSIS for that year.10 (Four MAX service types are not available in MSIS and are described in more detail below.) Both service types as well as waiver program types 6 and 7 are critical for constructing community long-term care measures using MAX.
| TABLE A.1. Type-of-Service (TOS) Codes in MAX, by Claim File Type | ||
| Type of Service | TOS Code | % of Waiver Service $ in FY 2002a |
| Inpatient (IP) File | ||
| Inpatient hospital | 01 | |
| Institutional Long-Term Care (LT) File | ||
| Mental hospital services for the aged | 02 | |
| Inpatient psychiatric facility services for individuals under age 21 | 04 | |
| Intermediate care facilities for persons with mental retardation (ICFs/MR) | 05 | |
| Nursing facility services | 07 | |
| Prescription Drug (RX) File | ||
| Prescription drugs | 16 | |
| Other (OT) File | ||
| Physician services | 08 | |
| Dental care | 09 | |
| Other practitioner services | 10 | |
| Outpatient hospital | 11 | 0.4 |
| Clinic | 12 | |
| Home health | 13 | 6.7 |
| Lab and X-ray | 15 | |
| Other services b | 19 | 75.2 |
| Managed care payments to HMOs, HIOs, or PACE plans | ||
| Managed care payments to prepaid health plans | ||
| Managed care payments to primary care case management (PCCM) | ||
| Sterilization b | 24 | |
| Abortions b | 25 | |
| Transportation | 26 | 0.3 |
| Personal care services | 30 | 5.8 |
| Targeted case management | 31 | 1.1 |
| Rehabilitation | 33 | 4.3 |
| Physical therapy, occupational therapy, speech, or hearing services | 34 | |
| Hospice benefits | 35 | |
| Nurse midwife services | 36 | |
| Nurse practitioner services | 37 | |
| Private duty nursing | 38 | 0.5 |
| Religious non-medical health care institutions b | 39 | |
| Durable medical equipment and supplies b | 51 | na |
| Residential care | 52 | na |
| Psychiatric services | 53 | na |
| Adult day care | 54 | na |
| Unknown | 99 | 5.5 |
NOTE: Bolded service types include those coded as institutional long-term care services and community long-term care services in this study. Claims for other types of home and community-based services (HCBS), such as those provided under 1915 waivers, may be included under other services (TOS 19), transportation (TOS 26), targeted case management (TOS 31), durable medical equipment (TOS 51), psychiatric services (TOS 53), or other categories. FY = fiscal year; HIO = health insuring organization; HMO = health maintenance organization; PACE = Program of All-Inclusive Care for the Elderly; na = not applicable because this service type is not included in MSIS.
| ||
Definitions of MAX Long-Term Care Measures
Most MAX service types and all program types are mapped directly from MSIS to similar measures in MAX. Because there are ambiguities in the service category types and each state has its own reporting procedures, the catch-all Other MSIS service category (TOS 19) is large. To help address this limitation, state-specific service codes have been used to construct four additional service types in MAX, including durable medical equipment and supplies (TOS 51), psychiatric and mental health services (TOS 53), as well as two community long-term care measures:11
- Residential care (TOS 52)
- Adult day care (TOS 54)
The state-specific crosswalks to group services into these codes are produced by MPR rather than by the submitting states and are based only on national and state-specific procedure codes (for example, HCPCS level II and III codes and other state system codes). To construct these measures, claims grouped under other services in MSIS, most commonly Other services (TOS 19), are recoded to reflect one of the four new service types.12 Otherwise the MSIS TOS categories are simply repeated to develop MAX TOS.
Summary definitions of all MSIS TOS--including all institutional and three community long-term care service measures--are available in Attachment 4 of the MSIS Tape Specifications and Data Dictionary.13 States use these definitions to group claims into service types when submitting MSIS data. Definitions from the MSIS data dictionary for institutional and community long-term care service types are reproduced in Table A.2 with minor adjustments to reflect changes due to MAX remapping. Table A.2 also contains definitions for the two new community long-term care measures added in MAX, and expected changes to these definitions in future years.
| TABLE A.2. Medicaid Analytic eXtract (MAX) Long-Term Care Service and Program Type Definitions | ||
| MAX Service | MAX Code | Definition in MAX 1999-2002 |
| Institutional Long-Term Care TOS Measures | ||
| Mental hospital for the aged | TOS 02 | An institution for mental diseases is a hospital, nursing facility, or other institution that is primarily engaged in providing diagnosis, treatment or care of individuals with mental diseases, including medical care, nursing care, and related services. These are services provided under the direction of a physician for the care and treatment of recipients in an institution for mental diseases that meets the requirements specified in 42 CFR 440.140(a). (MSIS data dictionary) Expected Changes to Definition in Future MAX Years: No change expected. |
| Inpatient psychiatric age 21 | TOS 04 | An institution for mental diseases is a hospital, nursing facility, or other institution that is primarily engaged in providing diagnosis, treatment or care of individuals with mental diseases, including medical care, nursing care, and related services.
These are services that:
Expected Changes to Definition in Future MAX Years: No change expected. |
| ICF/MR | TOS 05 | These are services provided in an institution for mentally retarded persons or persons with related conditions if the: a. Primary purpose of the institution is to provide health or rehabilitative services to such individuals; b. Institution meets the requirements in 42 CFR 442, Subpart C (certification of ICF/MR); and, c. The mentally retarded recipients for whom payment is requested are receiving active treatment as defined in 42 CFR 483.440(a). (MSIS data dictionary) Expected Changes to Definition in Future MAX Years: No change expected. |
| Nursing facility | TOS 07 | These are services provided in an institution (or a distinct part of an institution) which:
Expected Changes to Definition in Future MAX Years: No change expected. |
| Community Long-Term Care TOS Measures | ||
| Home Health | TOS 13 | These are services provided at the patient's place of residence, in compliance with a physician's written plan of care that is reviewed every 62 days. The following items and services are mandatory.
The following therapy services are optional: physical therapy, occupational therapy, or speech pathology and audiology services provided by a home health agency or by a facility licensed by the state to provide these medical rehabilitation services. (See 42 CFR 441.15.) Place of residence is normally interpreted to mean the patient's home and does not apply to hospitals or nursing facilities. Services received in a nursing facility that are different from those normally provided as part of the institution's care may qualify as home health services. For example, a registered nurse may provide short-term care for a recipient in a nursing facility during an acute illness to avoid the recipient's transfer to another nursing facility. (See 42 CFR 440.70.) (MSIS data dictionary) Expected Changes to Definition in Future MAX Years: Some changes, yet to be determined, will be implemented in future MAX years. |
| Personal Care | TOS 30 | These are services furnished to an individual who is not an inpatient or resident of a hospital, nursing facility, ICF/MR, or institution for mental disease that are:
(See 42 CFR 440.167.) (MSIS data dictionary)Note: Personal care services are typically services that an individual could accomplish oneself, such as cleaning or cooking, were it not for their disability. Services provided in group homes or other residential settings usually include personal care services in bundled rates; if the claim service code indicates residential care, then it is recoded to TOS 52. Otherwise, personal care remains where coded by the state. Expected Changes to Definition in Future MAX Years: No change expected. |
| Private Duty Nursing | TOS 38 | These are services of registered nurses or licensed practical nurses provided under direction of a physician to recipients in their own homes, hospitals or nursing facilities (as specified by the state). (See 42 CFR 440.80.) (MSIS data dictionary) Expected Changes to Definition in Future MAX Years: No change expected. |
| Residential Care | TOS 52 | Community-based services can be provided in traditional homes but it can also be provided in group homes or assisted living facilities. Services received in such facilities but not institutions (and excluding services for mental health or substance abuse treatment) are included in the residential care MAX TOS. Included are the following TOS:
Residential care does NOT include the following services, unless specifically mentioned as being provided in residential care setting: respite care, child care, daily living skills, and general foster care. Residential care NEVER includes home modifications, mental health or psychiatric care, day treatment, physical, occupational, or speech therapy. (MAX MPR internal mapping rules) Expected Changes to Definition in Future MAX Years: The MAX 2003 mapping rule for residential care will include the following services provided in residential settings and specified in MAX 1999-2002 definition:
It will also include:
|
| Adult Day Care | TOS 54 | This MAX TOS is for all day care services except those specifically described as related to mental health or substance abuse treatment. Many of these programs are for individuals with dementia or disabilities. [If separately billed, transportation services to and from day treatment remain where coded by the state.] Specifically included are:
Day treatment does NOT include supported employment or support for daily living skills unless clear that it is provided in a day care facility. (MAX MPR internal mapping rules) Expected Changes to Definition in Future MAX Years: No change currently planned but new data elements may be developed in future years that distinguish adult day services for mental health or substance abuse care from other adult day services. |
| Community Long-Term Care Program Type Measures | ||
| Waivers - CLTC services provided under 1915(c) waivers | PGR 6PGR 7 | Program Type 6: Home and Community-Based Care for Functionally Disabled Elderly (See §1929 of the Act) and for Individuals Age 65 and Older (See 42 CFR 441, Subpart H).--This program is for §1915(d) recipients of HCBS for individuals age 65 or older. This is an option within the Medicaid program to provide home and community-based care to functionally disabled individuals age 65 or older who are otherwise eligible for Medicaid or for non-disabled elderly individuals. Program Type 7: Home and Community-Based Waivers (See §1915(c) of the Act and 42 CFR 440.180).--This program includes services furnished under a waiver approved under the provisions in 42 CFR Part 441, Subpart G (HCBS; waiver requirements). (MSIS data dictionary) Note: States do not differentiate between Program Type 6 and 7 codes. Waiver services generally include services not provided under a state plan and can include case management, homemaker, home health, personal care, adult day, habilitation, respite care, and day treatment services among others. Expected Changes to Definition in Future MAX Years: No changes have yet been determined for MSIS program type codes, but there may be changes related to new provisions from the DRA. In 2005, waiver enrollment information will be collected in MSIS for the first time and included in MAX 2005; this information will enable researchers to identify people enrolled in 1915(c) or combined 1915(b)(c) waivers. Researchers will be able to use MAX 2005 to compare waiver enrollment with waiver service utilization identified by program type. |
| CLTC = community long-term care; DRA = Deficit Reduction Act; MAX = Medicaid Analytic eXtract; MSIS = Medicaid Statistical Information System; NF = nursing facility; TOS = type of service. | ||
APPENDIX B. GLOSSARY OF TERMS
This glossary summarizes the operational definitions of terms used in this report. For more general definitions of Medicaid terms, see Schneider et al. (2002).
Age = age is defined as of December 31, 2002.
Adult (BOE Group) = a BOE group that includes pregnant women and caretaker relatives in families with dependent (minor) children. (Adults who are eligible for Medicaid due to disability are coded as disabled.)
Adult Day = day care services, except those for mental health or substance abuse treatment, including day health and rehabilitation care, day treatment, habilitation, psoriasis day care, services in an adult day care center, and transportation to adult day care. (For further detail, see Appendix A.)
Aged (BOE Group) = a BOE group that includes enrollees age 65 or older. People over age 65 but categorized in another BOE group in MAX were recoded as aged.
Basis of Eligibility (BOE) = eligibility grouping that traditionally has been used by CMS to classify enrollees as children, adults, aged, and disabled.
Child (BOE Group) = a BOE group that includes persons under age 18 or under age 21 in states electing to cover older children. (Children who are eligible for Medicaid due to disability are coded as disabled.)
Community Long-Term Care (CLTC) = services covered under 1915(c) waivers and personal care, residential care, home health, adult day, and private duty nursing services provided at state option. Because unduplicated measures of community long-term care waiver use and service-specific use are not available in MAX PS files, CLTC is operationally defined as services covered under waivers for people receiving waiver services, and use of personal care, residential care, home health, adult day, and private duty nursing for all other enrollees. This operational definition results in an underestimate of CLTC use and expenditures in this study.
Disabled (BOE Group) = a BOE group that includes persons of any age (including children) who are unable to engage in substantial gainful activity by reason of any medically determinable physical or mental impairment that can be expected to result in death or that has lasted or can be expected to last for a continuous period of not less than 12 months. Because disabled people over age 65 are often but not always categorized as aged, all disabled people over 65 were recoded as aged for this study.
Duals = persons dually enrolled in Medicare and Medicaid. In MAX, duals are identified as people in MSIS with matching records in the Medicare Enrollment Database (EDB) indicating enrollment in both Medicare and Medicaid in at least one month in 2002. Part-year duals are enrollees who are duals during a portion of their enrollment period. Full-year duals were identified as duals their entire period of Medicaid enrollment.
Fee-for-Service (FFS) = a payment mechanism in which payment is made for each utilized service. FFS services exclude services provided under capitated arrangements.
Home Health = services provided at a patient's place of residence (typically a patients home), in compliance with a physician's written plan of care that is reviewed every 62 days--including nursing services, as defined in the State Nurse Practice Act, home health aide services, physical therapy, occupational therapy or speech pathology, and audiology services--that are provided by a home health agency or by a facility licensed by the state to provide these medical rehabilitation services. (For further detail, see Appendix A.)
Institutional Long-Term Care (ILTC) = nursing facility services, services provided in ICFs/MR, mental hospital services for people over age 65, and inpatient psychiatric facility services for individuals under age 21.
Managed Care (MC) = payment mechanism used to manage health care, including services provided by health maintenance organizations (HMOs) or Programs of All-Inclusive Care for the Elderly (PACE), prepaid health plans (PHPs), and primary care case management plans (PCCMs). Services provided under managed care plans are not included in long-term care or other service-specific measures summarized in this report.
Personal Care = personal services such as bathing and toileting, sometimes expanded to include light housekeeping furnished to an individual who is not an inpatient or a resident of a group home, assisted living facility, or long-term facility such as a hospital, nursing facility, ICF/MR, or institution for mental disease. Personal care services are those that individuals would typically accomplish themselves if they did not have a disability. (For further detail, see Appendix A.)
Private Duty Nursing = services, except those for mental health or substance abuse treatment, provided by registered nurses or licensed practical nurses under direction of a physician to recipients in their own homes, hospitals, or nursing facilities as specified by the state. (For further detail, see Appendix A.)
Residential Care = Although room and board services provided in residential care facilities is not covered by Medicaid, other components of residential care--for example, personal care, 24-hour services, and chore services--can be covered. Residential care includes group, family or individual home residential care; cluster residential care; and therapeutic residential care services, assisted living, supported living, and night supervision. (For further detail, see Appendix A.)
Restricted-Benefit Enrollees = enrollees who receive limited Medicaid coverage, including unqualified aliens only eligible for emergency hospital benefits, duals receiving only Medicare cost-sharing benefits, and people eligible for only family-planning services.
Program of All-Inclusive Care for the Elderly (PACE) = a managed care plan that coordinates Medicare and Medicaid acute care and long-term care for dual eligible enrollees (those age 55 and older, living in a PACE area, and otherwise eligible for nursing home care). A capitated payment mechanism is used for PACE plan enrollees. As a result, service-specific information is not available for services provided under PACE in MAX.
Waiver = services provided under Section 1915(c) of the Social Security Act that enable states to provide Medicaid-financed community-based long-term care for people who would otherwise require Medicaid-covered hospital care, nursing facility care, or care in an ICF/MR. These programs can be designed to target individuals in specific age groups and with specific conditions, and the services can be restricted to certain areas of the state. (Other types Medicaid waivers--for example, 1115 waivers that cover population subgroups not generally covered under Medicaid or fundamentally change service delivery--are not discussed in this report.)
APPENDIX C. STATE LONG-TERM CARE DATA ANOMALIES
Table C.1 lists MAX 2002 long-term care data anomalies by state. The table includes any known problems with MAX institutional and community-based measures that have been identified through review or analysis of MSIS or MAX data. A full listing of anomalous MAX data is available on the CMS MAX web site at [http://www.cms.hhs.gov/MedicaidDataSourcesGenInfo/07_MAXGeneralInformati... ].
Because Medicaid community long-term care is so difficult to measure, we also compare MAX, MSIS, and Form 64 statistics to gauge the consistency between these data sources and identify any potential MAX or other file data problems. Form 64 data are aggregate summaries about state Medicaid program expenditures that are submitted quarterly by states for services reimbursable by the Federal Government. Form 64 data cited in Table C.1 are those reported by Burwell, Sredl, and Eiken (2003). We present any significant differences between MAX estimated expenditures and those MSIS and MAX and Form 64 for three key components of community long-term care--waiver, personal care, and home health. In all three data sources, waivers are the default category and expenditures for waivers are not duplicated in personal care or home health. All three data sources include only FFS long-term care expenditures. Significant differences are defined as expenditures that differed between the files by a factor of two or cost differences that could potentially represent 10 percent or more of total long-term care expenditures in the state. Summary expenditure measures from each data source for all states are provided in Table C.2. See Chapter II and Appendix A for additional detail about MSIS.
There are some inherent differences between MAX, MSIS, and Form 64 that should be kept in mind when interpreting the presented cost differentials between the files.
-
Both MSIS and Form 64 use FY data, whereas MAX reflects services used during the calendar year.
-
Both MSIS and MAX are built from state administrative data used for program operation rather than research. While MSIS data contain claims based on payment date, MAX data contain claims based on service date. Form 64 data are not claims based, but are Medicaid state agency accounting data on total program expenditures by service type. Differences are naturally expected.
-
MSIS and Form 64 may contain expenditures for service that cannot be matched to individual enrollees, whereas MAX is a person-level file and does not include bulk expenditures.
-
MAX estimates presented here are based on a subgroup of Medicaid enrollees who are aged or disabled and exclude certain restricted-benefit groups--duals receiving Medicare cost-sharing only, immigrants eligible for only emergency benefits, and people eligible for only family-planning services. Because most people using long-term care services are aged or disabled and have full scope of Medicaid coverage, this should have little effect on the estimates.
-
MAX includes two specific types of community long-term care--residential care and adult day care--that are not identifiable in Form 64 data. Some MSIS home health and other service type claims may be remapped to one of these two service types in MAX.
-
The five MAX community-based long-term care service types (personal care, home health, adult day care, private duty nursing, and residential care) exclude durable medical equipment and services for mental health and substance abuse treatment.
-
Finally, so as not to duplicate expenditures, our MAX long-term care estimates for people who received HCBS waiver services exclude non-waiver community long-term care expenditures provided at state option.
While significant differences are expected, discrepancies can identify potential problems and areas for data improvement. Fourteen states (Arizona, Hawaii, Massachusetts, Michigan, Montana, North Carolina, Oregon, Pennsylvania, Rhode Island, South Carolina, Tennessee, Texas, Virginia, and Washington) were excluded from national statistics presented in this report as a result of noted anomalies.
| TABLE C.1. Medicaid Analytic eXtract (MAX) Long-Term Data Anomalies | ||
| State | Service Type | Anomaly |
| All States | Service Tracking Claims | Expenditures submitted by the states as service tracking claims (lump sum payments to providers for more than one person and multiple services) are not included in MAX as they cannot be linked to specific beneficiaries. States are not required to submit service tracking claims and there may be no submissions or partial submissions. For the most part, these expenditures are for bulk payments--for example, Disproportionate Share Hospital payments. However, some states submit some adjustments, payments for waiver services, and/or capitation claims as service tracking claims. |
| Waivers | Program type indicates claims that were paid under special circumstances. Some program types identify services covered at a higher federal matching rate than most services, while others provide information on special coverage programs. Values 6 and 7 identify HCBS covered under Section 1915(c) waivers. The two codes should not be differentiated and MAX data users should sum services with these values, as done for this report. | |
| AK | Nursing Facility, Waivers | AK had a lower-than-average percent of people with nursing facility claims because they had a relatively small aged population and an active waiver program. They also had a state operated Pioneers Home System, not included in Medicaid, that provided services to many people who might otherwise be in a nursing facility. |
| ICF/MR | There were no claims for ICF/MR (TOS 05) even though the service was covered under AK's state plan. | |
| Inpatient Psychiatric 21 | At least half of institutional long-term care claims in AK were for inpatient psychiatric facility services for individuals under age 21, which is much higher than expected. | |
| Personal Care, Home Health | Personal care service (PCS) expenditures for aged and disabled were lower in MAX 2002 (about $8 million) than overall expenditures reported in Form 64 (about $20 million). Because personal care expenditures in MSIS correspond to those in Form 64, this discrepancy is likely due to use of state-covered community-based long-term care services by people enrolled in waiver programs. Similarly, MAX home health expenditures ($126,000) were significantly lower than overall expenditures reported in MSIS and Form 64 (about $660,000-$680,000). Nevertheless, because these services made up only a small portion of AK total long-term care expenditures, the states data are represented in this study. | |
| Managed Care | AK did not have a managed care program. | |
| AL | All | AL did not include service code on adjustment claims, making the adjustment process difficult and resulting in some improperly adjusted claims and thus potentially inaccurate expenditure measures. |
| Inpatient Psychiatric 21 | There were no claims for inpatient psychiatric facility services for individuals under age 21 (TOS 04) even though this service was covered under ALs state plan. | |
| Home Health | Home health expenditures were lower in MAX 2002 (about $12 million) than overall expenditures reported in Form 64 (about $42 million). Most of this discrepancy is likely due to some claims being reported as Other services or service tracking claims. | |
| AR | All | The few debit claims in the source MSIS files appear to be service tracking claims rather than individual adjustments. As a result, some adjustments could not be made and some expenditure measures may be overestimated. |
| Home Health | Home health expenditures were much lower in MAX and MSIS 2002 (about $6 million and $11 million, respectively) compared with Form 64 data (about $24 million). Nevertheless, because home health made up a small share of total long-term care expenditures in AR and the cause of the discrepancy is unknown, the states data are represented in this study. | |
| Dual Status | Dual enrollment may not be fully reliable in AR. AR reported 9,000 dual enrollees who were not matched to the Medicare EDB. | |
| AZa | All | Because most people in AZ were enrolled in capitated managed care plans, there are few or no FFS claims for most long-term care services in MAX. As a result, AZ is excluded from national totals presented in this report. |
| Managed Care | AZ sometimes made multiple capitation payments per person/month/plan to cover different plan services. Capitation payments in AZ may not be accurate. | |
| CA | Personal Care, Residential Care | Starting in 2002, there was a dramatic shift in claims between personal care services (PCS), residential care, and hospice. This was the result of a change in MAX type of service crosswalks. There were almost six million claims with a service code of Z9525 that were moved from PCS to residential care. There were no PCS expenditures in MAX and about $1.7 billion in MSIS and $1.2 billion in Form 64. Residential care totaled $1.7 billion in MAX 2002. These expenditures were re-coded as personal care expenditures for the analyses presented in this report. |
| Waivers | CA waiver expenditures in 2002 were substantially higher in MAX ($975 billion) and MSIS ($1,128 billion) than in Form 64 ($492 billion). Revised Form 64 expenditures for FY 2002 in subsequent reports correspond more closely with those in MAX and MSIS. | |
| CO | Waivers, Home Health | Service codes were missing on home health and waiver claims as they were billed on a UB-92 form. Consequently, the MAX and MSIS 2002 files cannot be used to identify service-specific use or expenditures for these services (totaling about $370 million for both services). Also, home health expenditures were much lower in MAX ($10 million) than in MSIS or Form 64 ($66 million and $80 million, respectively). This is likely due to use of state-covered home health services by people enrolled in waiver programs, which are not captured in the MAX PS file calculation. |
| CT | Home Health | CT was an outlier, with the highest proportion of FFS non-duals with home health care use (11 percent in 2002) and the largest average per-user expenditures for these services ($10,525 in 2002). This has not yet been investigated. |
| DC | Personal Care | Personal care expenditures were about $13,000 in MAX 2002, $324 in MSIS, and $3.2 million in Form 64. Home health service expenditures were also lower in MAX ($10.3 million) than in Form 64 ($14.8 million). Because personal care and home health made up a small share of total long-term care expenditures in DC and the cause of the discrepancy is unknown, the states data are represented in this study. |
| Dual Status | Dual enrollees were probably undercounted in DC. | |
| DE | All | Some drugs are part of the long-term care rate, so separate expenditures for prescription drugs were unusually low. |
| FL | Inpatient Psychiatric 21 | FL did not submit claims for inpatient psychiatric services for individuals under age 21 even though this service was covered under the state plan. |
| GA | All | GA did not correctly report adjustments in their 1999-2003 files making the adjustment process difficult and resulting in some improperly adjusted claims and thus potentially inaccurate expenditure measures. |
| Home Health, Waivers | Home health expenditures were lower in MAX ($9 million) and MSIS ($15 million) than in Form 64 data ($62 million). However, waiver expenditures in MAX and MSIS exceeded those in Form 64 by about the same amount. This discrepancy is likely due to difference in reporting of certain home health services as waiver or non-waiver services between the two data reporting vehicles. | |
| HIa | All | The number of institutional long-term care users increased from 3,006 in MAX 2001 to 11,745 in MAX 2002 (cause unknown). The 2002 long-term care users data do not appear to be reliable and HI data are excluded from national totals presented in this report. |
| Waivers | MAX 1999-2002 files did not include waiver claims as they were processed by a different state agency (Arizona) that was not provided information needed as input for those files. As a result, HI data are excluded from national totals presented in this report. Claims with a waiver Program Type start occurring in the 2003 files. | |
| IA | Home Health | Home health expenditures were lower in MAX ($18 million) compared with MSIS and Form 64 data ($56-59 million). This discrepancy is likely due to use of state-covered home health services by people enrolled in waiver programs, which are not captured in the MAX PS file calculation. |
| ID | ICF/MR | Almost 20 percent of long-term care claims had a type of service of ICF/MR (TOS 05), which is much higher than expected. |
| Personal Care | Personal care expenditures were higher in MAX and MSIS 2002 than those reported in Form 64 for FY 2002 (about $31 million in MAX, $47 million in MSIS, compared with $17 million in Form 64). The reason for this discrepancy is unknown. | |
| IN | Home Health | Home health expenditures were lower in MAX ($20 million) compared with MSIS and Form 64 data (over $50 million). This is likely due to use of state-covered home health services by people enrolled in waiver programs, which are not captured in the MAX PS file calculation. |
| IL | Nursing Facility | Up until FFY MSIS Q3 2001, IL incorrectly reported claims for inpatient psychiatric facility services for individuals under age 21 (TOS 04) as nursing facility (TOS 07) services. |
| Home Health | Of the over $36 million expenditures for Home Health reported MSIS and Form 64, only $2 million were captured in MAX. This is likely due to use of state-covered home health services by people enrolled in waiver programs, which are not captured in the MAX PS file calculation. | |
| Waivers | Waiver expenditures were higher in MAX and MSIS 2002 ($580 million and $644 million, respectively) compared with Form 64 data ($461 million). The reason for this discrepancy is unknown. | |
| KS | Personal Care, Home Health | Personal Care and Home Health expenditures were lower in MAX 2002 ($6 million and $7 million, respectively) than those reported in Form 64 ($14 million and $29 million). These discrepancies are likely due to use of state-covered home health services by people enrolled in waiver programs. |
| Managed Care | KS managed care enrollment was over-counted in MSIS and MAX data for 2002. They should be more reliable in FY 2003. | |
| KY | Home Health | Home health expenditures were much lower in MAX 2002 (about $16 million) than in MSIS ($70 million) and Form 64 data (about $111 million). Because home health made up a small share of total long-term care expenditures in KY and the cause of the discrepancy is unknown, the states data are represented in this study. |
| LA | Nursing Facility | Nursing facility expenditures were much lower in MAX ($568 million) than in Form 64 data ($1.327 billion). However, Form 64 reported nursing home expenditures were $515 million in FY 2000, $1.158 billion in FY 2001, $1.328 billion in FY 2002, and $597 million in FY 2003. We believe FY 2001 and FY 2002 Form 64 data are anomalies. |
| MAa | Personal Care, Adult Day Care, Residential Care | MA reported only $4 million in personal care services to MSIS compared with $276 million in Form 64. However, residential care and adult day care were reported in MAX but not Form 64 and totaled $146 million in 2002. The reasons for these discrepancies are unknown but because of their scope, MA is excluded from national totals presented in this report. |
| MD | All | Nearly two-thirds of Medicaid recipients were enrolled in the HealthChoice Program. The remaining one-third tended to be either sicker (many institutionalized) or covered by Medicare. As a result, the distribution of MD's FFS claims may seem quite different from the distribution for other states. |
| All | The distribution of claims by Type of Service was unusual due to the high percentage of individuals enrolled in managed care. Most of the original, non-dual FFS claims were for home health, physical/occupational therapy or rehabilitation. | |
| Home Health, Waivers | Home health expenditures were less than $2 million in MAX compared with about $83 million in Form 64 data. This discrepancy is likely due to use of state-covered home health services by people enrolled in waiver programs. However, waiver service expenditures in MAX exceeded those in Form 64 by $83 million ($298 million in MAX compared with $214 in Form 64). | |
| ME | All | MEs long-term care user rates for aged and disabled were lower than in most states because the denominator of aged and disabled enrollees included a large group of enrollees in the states 1115 prescription drug plan. |
| MIa | Nursing Facility | MI pulled out part of the Nursing Facility (TOS 07) bundled rate and paid them as service tracking claims. As a result, expenditures for nursing facility services may be underestimated and MI data are not included in this report. Nursing facility expenditures totaled $1.1 billion in MAX compared with almost $1.8 million in Form 64. |
| Personal Care | There were no personal care expenditures computed in MAX, while $46 million were reported in MSIS and $177 million in Form 64. The reason for this discrepancy is unknown. | |
| Waivers | Also, while almost $385 million in waiver expenditures were reported in Form 64 for FY 2002, only $51 million were identified in MAX and $67 million in MSIS. The cause is unknown. However, community long-term care service expenditures are potentially severely underestimated in MAX for MI and as a result, MI data are excluded from national totals presented in this report. | |
| MN | Institutional Long-Term Care | Unlike most states, MN reported chemical dependency claims as a long-term care service. |
| ICF/MR | The percent of ICF/MR claims was greater than expected. | |
| Home Health, Personal Care, Waivers | Home health and personal care expenditures were lower in MAX than in both MSIS and Form 64, whereas waiver expenditures were higher. Expenditures for home health were $10 million in MAX and about $64 million in MSIS and Form 64. Personal care expenditures were $88 million in MAX and about $135 million in MSIS and Form 64. Finally, waivers totaled $929 million in MAX, $876 million in MSIS, and $854 million in Form 64. These discrepancies could be due to changes in coverage over time (CY versus FY), reporting of community care in Other service category, or many other factors. Because these services made up a small share of total long-term care expenditures in MN and the cause of the discrepancies is unknown, the states data are represented in this study. | |
| MO | Home Health | Home health expenditures were less than $1.5 million in MAX compared with about $7.1 million in MSIS and $5.5 million in Form 64 data. This discrepancy is likely due to reporting differences and use of state-covered home health services by people enrolled in waiver programs. Because home health represented a small share of MO total long-term care expenditures, MO data are represented in this study. |
| MS | Home Health | Home health expenditures were less than $3 million in MAX compared with about $14 million in MSIS and Form 64 data. This discrepancy is likely due to use of state-covered home health services by people enrolled in waiver programs. Because home health represented a small share of MS total long-term care expenditures, MS data are represented in this study. |
| MTa | Personal Care, Waivers | Personal care expenditures were much lower in MAX ($10 million) than in MSIS 2002 ($24 million) and Form 64 data ($28 million). Waiver expenditures in MT were $21 million in MAX, $25 million in MSIS, and $64 million in Form 64. The reason for these discrepancies is unknown but due to their scope, MT data are excluded from national totals presented in this report. |
| NCa | ICF/MR | There was a somewhat higher than expected percentage of ICF/MR claims, but the state confirmed that this was correct. |
| Personal Care | Some personal care services (PCS) were reported as Other services (TOS 19) and some as PCS. As a result, PCS services may be underestimated in NC. Personal care expenditures were $120 million in MAX, $164 million in MSIS, and $269 million in Form 64 data. We exclude NC data from national estimates in this report. | |
| ND | Home Health | Home health expenditures were about $1 million in MAX compared with over $2 million in MSIS and Form 64 data. This discrepancy is likely due to use of state-covered home health services by people enrolled in waiver programs. Because home health represented a small share of ND total long-term care expenditures, ND data are represented in this study. |
| NE | Waivers | NE submitted about $28 million in waiver expenditures as service tracking claims. As a result, NEs community long-term care expenditures are underestimated. |
| Managed Care | From 2002-2003 the state did not submit behavioral health organization (BHO) capitation claims as either service tracking or individual claims and thus managed care expenditures may be underestimated. | |
| NH | All | Many claims could not be properly adjusted because of how adjustment claims were submitted to MSIS. |
| ICF/MR | ICF/MR expenditures were lower in MAX ($819,616) compared with Form 64 data (about $2 million). Because home health represented a small share of NH total long-term care expenditures, NH data are represented in this study. | |
| MH for Aged | There were no claims mental hospitals for the aged (TOS 02) even though the state opted to cover the service. | |
| Personal Care, Home Health | Personal care and home health expenditures were much lower in MAX than MSIS or Form 64. This is likely due to use of state-covered Home Health services by people enrolled in waiver programs, which cannot be computed using MAX PS files. However, expenditures for personal care and home health made up a small share of total long-term care expenditures in NH. | |
| NJ | Inpatient Psych 21 | Inpatient psychiatric services may be underestimated because claims from 5-6 inpatient psych hospitals were inadvertently left out of the files prior to FFY 2003. |
| NM | Home Health | Home health expenditures were much lower in MAX ($378,663) than in MSIS ($947,925) and Form 64 FY data ($933,632). Nevertheless, because home health made up a very small share of total long-term care expenditures in NM and the cause of the discrepancy is unknown, the state was represented in this study. |
| NV | MH for Aged, Inpatient Psychiatric 21 | There were very few claims for mental hospital services for the aged (TOS 02) and inpatient psychiatric facility services for individuals under age 21 (TOS 04) even though services were covered under NVs state plan. |
| NY | Service Tracking | NY switched from submitting its long-term care managed care (Lombardi) payments as service tracking claims in 1999/2000 (not included in MAX) to supplemental claims which are in MAX. |
| OH | There are no notes for OH. | |
| OK | Community Long-Term Care | About 25-30 percent of claims had Other type service codes (TOS 19) such that community long-term care service expenditures may be underestimated in this study for OK. |
| Personal Care | Personal care expenditures were lower in MAX ($18 million) than in MSIS and Form 64 data (about $44 million) perhaps due to use of state-covered home health services by people enrolled in waiver programs, which cannot be computed with MAX PS files. | |
| Residential Care | Some residential treatment centers may have been incorrectly reported as inpatient services in MAX. | |
| ORa | Waivers | Waiver expenditures were much lower in MAX and MSIS than in Form 64 data (about $300 million compared with $525 million). The cause is unknown. OR community long-term care expenditures are likely to be severely underestimated and thus OR data are excluded from national totals presented in this report. |
| Personal Care | Personal care expenditures were also much lower in MAX and MSIS compared with Form 64 FY data (about $3 million or less compared with $35 million). This provides further support for the exclusion of OR from study analyses. | |
| PAa | Waivers | Waiver claims were included in MAX files, but they were not flagged as waivers and thus community long-term care is severely underestimated in MAX for PA. Waiver expenditures totaled $183 million using MAX compared with $977 million in Form 64 data. As a result, PA data are excluded from national totals presented in this report. |
| RIa | Community Long-Term Care | About 30 percent of claims had Other type service codes (TOS 19). Also, while almost $182 million in waiver expenditures were reported in Form 64 for FY 2002, only $22 million were identified using MAX or MSIS. The cause is unknown. However, community long-term care service expenditures are potentially severely underestimated in MAX for RI and as a result, RI data are excluded from national estimates presented in this report. |
| SCa | All | No IP, OT, or RX adjustment claims were reported on SC's MSIS files through 2004, and only a very small number of LT claims were adjustment records. The absence of adjustment records probably means that expenditures are overestimated. |
| Waivers | Waiver expenditures were much lower in MAX and MSIS than in Form 64 data (about $102 million compared with $284 million). Although the cause is unknown, SC community long-term care expenditures are likely to be underestimated. As a result, SC data are excluded from national estimates in this report. | |
| SD | Home Health | Home health expenditures were much lower in MAX 2002 than in Form 64 data (less than $500,000 compared with $3.8 million). However, personal care expenditures estimated in MAX far exceeded those using Form 64 data ($6.3 million compared with $1.3 million) suggesting that there may be coding discrepancies. |
| TNa | All | Long-term care services in TN were carved out of managed care such that FFS expenditures can severely underestimate long-term care expenditures in TN. TN data are excluded from national estimates in this report. |
| All | In July 2002, TN switched from reimbursing its managed care plans with monthly capitation payments to paying the plans for services on a FFS basis plus an administrative fee. As a result, some FFS information is available for TN Medicaid enrollees. | |
| TXa | All | It was difficult to properly adjust some claims due to how they were submitted to MSIS. As a result, TX FFS expenditures may be overestimated. |
| Personal Care, Home Health | Personal care service (PCS) expenditures were much lower in MAX CY and MSIS FY 2002 compared with Form 64 FY data (there were no PCS expenditures in MAX or MSIS compared with $318 million in Form 64). In contrast, $69 million in home health expenditures were reported in MAX ($279 million in MSIS) compared with no reported home health expenditures in Form 64. Nevertheless, personal care and total community long-term care measures are potentially severely underestimated in MAX and TX data are excluded from national estimates in this report. | |
| PACE | TX had a PACE program, but PACE enrollment was not separately reported in MAX and individuals enrolled in PACE were not reflected in TX long-term care estimates. | |
| UT | Home Health, Personal Care | Home health and personal care expenditures were much lower in MAX than in Form 64 data. However, both services comprised a very small percentage of estimated community long-term care expenditures in UT. |
| VAa | Inpatient Psychiatric 21 | According to the "Medicaid at a Glance" chart, VA did not cover inpatient psychiatric care for those under 21 (TOS 04) but MAX 2002 data showed a small number of users and expenditures for this type of service. |
| Waivers | Some of the state's waiver services were either not included in MSIS or not identified as waiver services. Waiver expenditures were much lower in MAX and MSIS (less than $114 million) compared with Form 64 FY data ($331 million). As a result, VA data are excluded from national estimates in this report. | |
| VT | Home Health, Personal Care | Home health and personal care expenditures were much lower in MAX than in Form 64 data. However, both services comprised a very small percentage of estimated community long-term care expenditures in VT. |
| WAa | All | WA did not include individual claims processed by six agencies within the Department of Social and Health Services. These agencies are Children's Administration, Juvenile Rehab. Administration, Mental Health, Division of Developmental Disabilities, Aging and Disabled Administration, Division of Alcohol and Substance Abuse). They were submitted as service tracking claims in the 2002 MAX. Starting with 2003, WA will submit some of these claims as service tracking and some as individual claims. |
| Nursing Facility | Nursing facility expenditures were much lower in MAX ($452 million) compared with Form 64 data ($710 million). WA data are not included in this report. | |
| ICF/MR | ICF/MR expenditures were lower in MAX (less than $4 million) compared with Form 64 data ($129 million). | |
| Inpatient Psychiatric 21 | Payments for inpatient psychiatric facility services for individuals under age 21 (TOS 04) were submitted as service tracking claims and were thus not included in MAX 2002. | |
| Waivers | WA reported their waiver services as service tracking claims so they were not included in the MAX files. They also bundled their behavioral health organization (BHO) capitation payments with those waiver services. Starting in 2004 they will be able to submit some, but not all of the waiver services as individual claims. The BHO capitation payments will continue to be bundled on service tracking claims. Waiver service expenditures were estimated as $846 million in MSIS data for FY 2002. WA data are not included in statistics presented in this report. | |
| Personal Care | Personal care services were also not reported in WA MAX data in 2002. Personal care expenditures were estimated at $204 million using Form 64 data. | |
| WI | All | The WI capitation claims could not be properly adjusted because the dates on the adjustment claims do not match those on the original claims. The result is that there are some capitation claims in the file that were actually voided. WI capitation expenditures may be overstated. |
| Home Health | Home health expenditures were much lower in MAX ($13.5 million) and MSIS ($25 million) compared with Form 64 FY data ($57 million). Nevertheless, because home health made up a small share of total long-term care expenditures in WI and the cause of the discrepancy is unknown, the states data are represented in this study. | |
| WV | Personal Care | Personal care expenditures were much lower in CY MAX than FY MSIS and Form 64 data (about $0.6 million compared with $26 million in MSIS and $22 million in Form 64). Nevertheless, because personal care made up a small share of total long-term care expenditures in WV and the cause of the discrepancy is unknown, the states data are represented in this study. |
| Home Health | Home health expenditures were much lower in MAX ($2.3 million) than in MSIS ($18 million) and Form 64 FY data ($28 million). Nevertheless, because home health made up a small share of total long-term care expenditures in WV and the cause of the discrepancy is unknown, the states data are represented in this study. | |
| WY | MH for Aged | There were very few claims for mental hospital services for the aged (TOS 02) even though WY covered these services under their state plan. |
| Inpatient Psychiatric 21 | According to the "Medicaid at a Glance" chart, WY did not cover inpatient psychiatric care for those under 21 (TOS 04) but the MAX data showed some users and expenditures for this type of service. | |
| Home Health | Home health expenditures were much lower in MAX ($200,000) and MSIS 2002 ($1 million) compared with Form 64 data ($6 million). Nevertheless, because home health made up a small share of total long-term care expenditures in WY, the states data were represented the study analyses. | |
SOURCE: Comparison of data from Medicaid Analytic eXtract 2002, Medicaid Statistical Information System 2002 data cube, and Form 64 statistics reported in Burwell, Sredl, and Eiken (2003); and MAX data anomaly reports available at http://www.cms.hhs.gov/MedicaidDataSourcesGenInfo/07_MAXGeneralInformati.... CY = calendar year; FY = fiscal year; ICF/MR = intermediate care facility for persons with mental retardation; MAX = Medicaid Analytic eXtract; MSIS = Medicaid Statistical Information System; PACE = Programs of All-Inclusive Care for the Elderly; PCS = personal care services; TOS = type of service.
| ||
| TABLE C.2. Expenditures for Waiver Services, Personal Care, and Home Health Reported in CY MAX, FY MSIS, and FY Form 64 Data for All States and the District of Columbia in 2002 | |||||||||
| Section 1915(c) Waiver Expenditures | Personal Care Expendituresa | Home Health Expendituresa | |||||||
| MAX | MSIS | Form 64 | MAX | MSIS | Form 64 | MAXb | MSIS | Form 64 | |
| United States | 14,531,991,806 | 15,451,448,783 | 16,408,179,008 | 4,636,348,148 | 4,985,597,453 | 5,546,614,062 | 1,774,685,729 | 2,896,850,584 | 2,764,849,512 |
| Alabama | 181,625,787 | 177,857,455 | 183,328,387 | 0 | 0 | 0 | 11,759,853 | 34,733,551 | 41,866,981 |
| Alaska | 97,544,779 | 94,845,245 | 91,336,298 | 7,776,594 | 20,077,619 | 19,596,914 | 126,039 | 680,032 | 659,948 |
| Arizona | 0 | 0 | 0 | 3,496,199 | 3,039,764 | 2,870,919 | 480,667 | 536,981 | 702,634 |
| Arkansas | 91,675,970 | 89,111,197 | 95,673,291 | 48,957,672 | 69,887,026 | 57,746,164 | 6,422,619 | 10,693,848 | 24,484,938 |
| California | 975,595,817 | 1,128,276,345 | 492,448,336 | 1,694,455,421 | 1,742,259,514 | 1,248,213,134 | 82,821,577 | 147,200,328 | 146,123,077 |
| Colorado | 359,455,725 | 354,306,454 | 354,827,983 | 0 | 0 | 0 | 9,987,003 | 66,482,669 | 80,361,874 |
| Connecticut | 464,079,146 | 473,863,825 | 484,882,977 | 0 | 4,053 | 0 | 105,457,708 | 154,792,035 | 170,027,277 |
| Delaware | 55,561,915 | 52,757,202 | 51,628,636 | 0 | 0 | 0 | 3,079,546 | 5,274,140 | 6,011,997 |
| District of Columbia | 2,850,567 | 936,558 | 3,394,464 | 12,695 | 324 | 3,183,121 | 10,363,031 | 16,323,000 | 14,787,891 |
| Florida | 670,056,808 | 652,058,717 | 635,652,485 | 12,951,614 | 20,522,372 | 18,415,826 | 106,664,916 | 228,095,839 | 101,235,456 |
| Georgia | 321,543,473 | 317,053,406 | 261,261,296 | 0 | 0 | 0 | 9,446,366 | 14,691,790 | 62,273,733 |
| Hawaii | 17,317,033 | 0 | 63,192,354 | 0 | 0 | 0 | 1,196,591 | 6,015,153 | 1,655,715 |
| Idaho | 53,286,677 | 49,876,529 | 76,567,159 | 31,029,958 | 46,571,461 | 16,681,628 | 2,019,591 | 3,473,923 | 6,490,856 |
| Illinois | 579,661,941 | 644,269,531 | 461,203,880 | 18,115 | 0 | 0 | 2,085,777 | 37,764,546 | 36,106,764 |
| Indiana | 217,579,056 | 173,660,682 | 184,016,008 | 2,184 | -18,095 | -16,259 | 19,660,626 | 52,929,725 | 51,584,790 |
| Iowa | 165,864,450 | 158,257,590 | 158,718,176 | 0 | 0 | 0 | 18,316,152 | 59,364,681 | 56,594,447 |
| Kansas | 325,637,955 | 321,705,483 | 329,110,034 | 6,411,426 | 14,738,687 | 13,767,757 | 7,311,618 | 27,974,995 | 29,143,650 |
| Kentucky | 180,013,786 | 168,634,122 | 171,798,043 | 0 | 0 | 0 | 15,935,896 | 70,087,392 | 111,390,130 |
| Louisiana | 178,723,257 | 185,600,914 | 158,415,544 | 1,875,822 | 1,873,308 | 0 | 15,369,856 | 24,570,127 | 25,856,334 |
| Maine | 201,492,982 | 198,313,092 | 180,917,108 | 5,867,181 | 5,548,775 | 5,770,962 | 4,625,967 | 6,895,557 | 5,643,054 |
| Maryland | 297,781,271 | 205,926,922 | 214,261,020 | 28,591,788 | 32,003,785 | 32,895,960 | 1,708,891 | 65,322,539 | 83,226,012 |
| Massachusetts | 562,746,152 | 643,527,160 | 535,006,066 | 3,130,226 | 4,025,177 | 276,718,176 | 70,884,698 | 101,339,592 | 66,761,086 |
| Michigan | 51,230,575 | 66,914,936 | 384,539,984 | 0 | 46,272,735 | 177,415,203 | 13,037,371 | 12,749,479 | 17,565,356 |
| Minnesota | 929,456,121 | 876,687,521 | 854,130,837 | 88,111,534 | 134,339,522 | 136,513,324 | 10,401,462 | 63,326,211 | 64,117,616 |
| Mississippi | 55,791,363 | 57,163,296 | 76,452,490 | 20,082 | 55,352 | 0 | 2,784,405 | 14,297,524 | 14,266,881 |
| Missouri | 235,803,356 | 242,176,556 | 338,290,340 | 183,028,544 | 186,979,628 | 185,061,775 | 1,424,229 | 7,144,869 | 5,469,666 |
| Montana | 20,900,969 | 25,304,049 | 63,581,809 | 9,808,433 | 23,953,856 | 28,295,804 | 403,327 | 770,679 | 657,498 |
| Nebraska | 115,056,730 | 160,729,634 | 163,022,600 | 7,024,674 | 7,134,018 | 8,140,062 | 16,159,068 | 20,005,146 | 20,394,053 |
| Nevada | 34,682,867 | 32,992,366 | 31,062,691 | 10,452,725 | 13,428,619 | 13,427,607 | 4,211,365 | 5,408,973 | 5,379,848 |
| New Hampshire | 146,843,333 | 150,888,338 | 150,915,240 | 814,904 | 4,607,840 | 4,265,560 | 1,292,168 | 5,641,530 | 5,578,354 |
| New Jersey | 415,572,261 | 402,925,409 | 403,282,782 | 230,486,309 | 240,137,783 | 239,111,735 | 56,610,311 | 39,046,040 | 41,097,797 |
| New Mexico | 205,955,239 | 193,992,526 | 193,587,529 | 146,680,607 | 110,227,035 | 109,037,723 | 378,663 | 947,925 | 933,632 |
| New York | 2,284,105,393 | 2,327,897,282 | 2,351,457,987 | 1,895,835,643 | 1,880,908,845 | 1,940,028,905 | 877,481,047 | 983,299,000 | 1,076,490,174 |
| North Carolina | 458,052,693 | 478,824,665 | 481,491,981 | 120,335,043 | 164,460,252 | 269,059,896 | 61,756,129 | 96,022,709 | 97,169,928 |
| North Dakota | 52,939,321 | 54,028,039 | 52,853,661 | 0 | 0 | 0 | 1,060,233 | 2,272,981 | 2,383,264 |
| Ohio | 683,803,230 | 621,420,048 | 581,681,914 | 0 | 0 | 0 | 66,362,187 | 93,815,740 | 95,976,143 |
| Oklahoma | 267,514,727 | 265,667,955 | 274,409,309 | 17,618,116 | 43,370,907 | 43,777,203 | 700,504 | 1,274,660 | 1,278,873 |
| Oregon | 305,094,047 | 299,539,800 | 524,887,136 | 881,803 | 3,164,805 | 34,844,958 | 128,872 | 967,649 | 980,461 |
| Pennsylvania | 183,148,326 | 160,913,160 | 977,468,740 | 9,546,551 | 8,146,862 | 0 | 32,687,909 | 42,909,089 | 62,040,381 |
| Rhode Island | 22,200,410 | 21,598,941 | 181,565,582 | 0 | 0 | 0 | 1,168,117 | 3,018,824 | 2,918,576 |
| South Carolina | 102,421,471 | 103,147,687 | 284,313,978 | 1,212,762 | 2,039,596 | 2,046,279 | 5,678,033 | 12,760,384 | 12,867,786 |
| South Dakota | 60,295,742 | 58,992,489 | 64,335,527 | 6,269,397 | 6,652,179 | 1,342,600 | 495,949 | 499,588 | 3,809,298 |
| Tennessee | 209,968,959 | 217,759,297 | 220,740,342 | 0 | 0 | 0 | 18,747,974 | 11,471,581 | 128,831 |
| Texas | 839,674,698 | 745,197,178 | 765,013,032 | 0 | 0 | 318,139,514 | 69,445,512 | 279,228,444 | 0 |
| Utah | 94,410,619 | 105,202,481 | 103,420,136 | 172,005 | 659,966 | 693,520 | 763,155 | 2,485,473 | 4,199,155 |
| Vermont | 97,436,627 | 99,900,773 | 105,054,360 | 2,256,955 | 6,103,996 | 6,075,612 | 3,689,876 | 8,186,761 | 7,211,482 |
| Virginia | 113,460,027 | 113,422,277 | 330,989,875 | 2,802,507 | 2,997,632 | 0 | 2,132,852 | 4,750,009 | 4,714,760 |
| Washington | 5,805 | 845,918,263 | 536,249,941 | 4,253 | 0 | 203,784,210 | 3,893,115 | 4,413,395 | 13,459,137 |
| West Virginia | 171,838,113 | 164,820,329 | 178,985,401 | 566,976 | 25,761,451 | 21,567,583 | 2,334,446 | 18,560,451 | 18,464,695 |
| Wisconsin | 304,510,140 | 402,342,087 | 484,427,096 | 57,841,429 | 113,660,804 | 108,140,687 | 13,530,136 | 25,244,249 | 56,608,192 |
| Wyoming | 69,724,097 | 64,242,972 | 62,327,163 | 0 | 0 | 0 | 202,324 | 1,088,778 | 5,699,031 |
SOURCE: Data form Medicaid Analytic eXtract, 2002, for aged and disabled enrollees; Medicaid Statistical Information System 2002 data cube; Form 64 data (Burwell, Sredl, and Eiken 2003). CY = calendar year; FY = fiscal year.
| |||||||||
APPENDIX D. VOLUME 1 TABLES
This appendix contains supplementary tables for the main section of this report. Table D.1 shows expenditure and utilization-based measures of the balance of community long-term care services in each of the 37 states in our study. Table D.2 provides average expenditures, number of users, and expenditures per user for institutional and community-based services in each state. Table D.3 presents national statistics for the balance of institutional and community-based long-term care expenditures by enrollee subgroup based on data from our sample states. Table D.4 presents the composition of Medicaid long-term care expenditures by detailed type of service in each of the 37 states in our sample. Table D.5 summarizes long-term care expenditures per user of long-term care services in each state. Table D.6, Table D.7, and Table D.8 present national measures of average expenditures, rate of service utilization, and expenditures per user, respectively, for each service identified in MAX.
| TABLE D.1. Percentage of Medicaid FFS Long-Term Care Expenditures for Community-Based Services and Percentage of Long-Term Care Users Using Community-Based Services Among Aged and Disabled Enrollees for Select States in 2002 | ||||||||||||
| Total LTC Expenditures | Community-Based LTC Expenditures as a Percentage of Total LTC Expendituresa | Total LTC Users | Community-Based LTC Users as a Percentage of Total LTC Users | % of LTC Users Who Were Agedb | % of All Medicaid Enrollees Who Were Aged or Disabled (Burden) | |||||||
| Overall | Among Agedb | Among Disabled | State Rank | Overall | Among Agedb | Among Disabled | State Rank | |||||
| All Sample States | 55,853,564,420 | 33.8 | 19.5 | 50.4 | 2,470,774 | 58.8 | 44.9 | 79.3 | 59.5 | 25.0 | ||
| Alabama | 949,247,839 | 20.6 | 6.7 | 52.5 | 32 | 63,540 | 65.1 | 49.1 | 89.7 | 8 | 60.4 | 33.3 |
| Alaska | 170,053,768 | 62.1 | 36.8 | 81.4 | 2 | 5,351 | 86.5 | 80.1 | 92.0 | 1 | 46.0 | 15.4 |
| Arkansas | 737,779,689 | 23.6 | 14.0 | 36.3 | 27 | 46,856 | 56.8 | 47.0 | 72.9 | 15 | 62.0 | 27.7 |
| California | 6,474,012,070 | 45.7 | 38.1 | 54.1 | 9 | 442,150 | 77.2 | 71.6 | 85.7 | 2 | 60.1 | 26.1 |
| Colorado | 789,483,284 | 47.3 | 18.6 | 77.9 | 7 | 40,666 | 67.6 | 49.6 | 89.3 | 4 | 54.8 | 23.9 |
| Connecticut | 1,845,597,817 | 30.9 | 11.3 | 55.8 | 19 | 53,933 | 49.0 | 35.3 | 75.5 | 26 | 66.0 | 23.0 |
| Delaware | 242,973,383 | 28.9 | 8.9 | 53.2 | 22 | 6,851 | 49.1 | 30.0 | 75.3 | 25 | 57.8 | 16.2 |
| District of Columbia | 267,951,360 | 11.6 | 5.6 | 19.1 | 36 | 9,222 | 49.7 | 25.0 | 71.9 | 23 | 47.3 | 25.6 |
| Florida | 3,091,499,328 | 26.4 | 9.4 | 52.6 | 25 | 158,986 | 52.1 | 33.3 | 79.2 | 19 | 59.1 | 27.7 |
| Georgia | 1,294,811,205 | 27.0 | 9.8 | 53.6 | 24 | 72,476 | 44.9 | 26.9 | 76.9 | 29 | 64.0 | 22.8 |
| Idaho | 271,976,684 | 33.3 | 19.4 | 46.2 | 15 | 15,065 | 67.1 | 56.1 | 79.2 | 5 | 52.2 | 20.2 |
| Illinois | 2,724,087,990 | 21.4 | 9.5 | 31.4 | 31 | 182,040 | 62.8 | 47.0 | 78.9 | 10 | 50.5 | 21.4 |
| Indiana | 1,402,625,664 | 16.9 | 2.8 | 33.3 | 35 | 57,474 | 23.0 | 7.7 | 51.7 | 37 | 65.3 | 21.8 |
| Iowa | 797,603,243 | 23.5 | 9.0 | 37.5 | 28 | 42,299 | 54.4 | 39.1 | 77.1 | 17 | 59.9 | 26.6 |
| Kansas | 721,488,818 | 47.0 | 20.4 | 72.2 | 8 | 37,474 | 58.8 | 36.8 | 86.8 | 13 | 56.0 | 25.5 |
| Kentucky | 911,441,510 | 22.2 | 9.1 | 42.9 | 29 | 51,946 | 50.2 | 35.9 | 76.3 | 22 | 64.5 | 33.6 |
| Louisiana | 1,149,262,277 | 17.1 | 2.0 | 28.1 | 34 | 57,558 | 31.1 | 11.5 | 50.5 | 36 | 49.9 | 25.1 |
| Maine | 523,719,228 | 52.7 | 23.0 | 78.4 | 4 | 21,126 | 67.1 | 48.0 | 91.6 | 6 | 56.2 | 29.9 |
| Maryland | 1,229,324,525 | 32.1 | 10.9 | 62.4 | 18 | 45,071 | 49.6 | 26.7 | 79.2 | 24 | 56.4 | 22.7 |
| Minnesota | 2,156,559,593 | 48.3 | 14.2 | 74.9 | 6 | 83,752 | 63.1 | 38.6 | 88.4 | 9 | 50.9 | 23.9 |
| Mississippi | 679,388,274 | 8.6 | 5.8 | 13.1 | 37 | 36,131 | 39.6 | 33.0 | 53.4 | 34 | 67.9 | 32.9 |
| Missouri | 1,269,674,117 | 35.0 | 16.1 | 60.1 | 13 | 86,969 | 62.3 | 50.6 | 81.9 | 11 | 62.6 | 22.4 |
| Nebraska | 479,154,285 | 30.5 | 9.7 | 55.9 | 21 | 19,525 | 44.0 | 25.8 | 75.2 | 30 | 63.1 | 19.5 |
| Nevada | 188,035,239 | 26.2 | 11.8 | 42.2 | 26 | 9,478 | 50.8 | 38.1 | 69.3 | 21 | 59.2 | 19.8 |
| New Hampshire | 347,963,248 | 43.1 | 12.4 | 86.8 | 10 | 12,465 | 46.3 | 25.1 | 89.9 | 28 | 67.3 | 22.9 |
| New Jersey | 2,545,888,294 | 30.8 | 21.5 | 43.2 | 20 | 94,780 | 53.3 | 42.0 | 75.0 | 18 | 65.9 | 28.0 |
| New Mexico | 542,600,816 | 65.1 | 44.3 | 83.6 | 1 | 20,436 | 67.7 | 53.4 | 87.2 | 3 | 57.8 | 16.6 |
| New York | 14,262,218,168 | 39.4 | 30.9 | 48.8 | 11 | 376,597 | 66.6 | 52.5 | 86.7 | 7 | 58.7 | 25.0 |
| D-3 North Dakota | 252,311,287 | 21.8 | 5.0 | 43.7 | 30 | 8,838 | 37.7 | 17.9 | 72.6 | 35 | 63.9 | 25.8 |
| Ohio | 3,936,270,515 | 20.3 | 8.8 | 37.4 | 33 | 139,378 | 40.9 | 29.3 | 61.3 | 32 | 63.5 | 23.3 |
| Oklahoma | 840,695,921 | 34.0 | 11.3 | 57.0 | 14 | 49,223 | 51.6 | 43.8 | 67.1 | 20 | 66.6 | 20.2 |
| South Dakota | 208,020,237 | 32.3 | 6.7 | 61.6 | 17 | 10,049 | 42.6 | 23.4 | 77.0 | 31 | 64.2 | 20.8 |
| Utah | 254,038,802 | 38.4 | 6.8 | 54.1 | 12 | 11,196 | 48.2 | 20.8 | 70.3 | 27 | 44.7 | 16.1 |
| Vermont | 188,769,963 | 54.8 | 20.6 | 91.7 | 3 | 8,200 | 61.6 | 37.7 | 93.8 | 12 | 57.5 | 18.8 |
| West Virginia | 538,084,789 | 32.9 | 13.1 | 59.4 | 16 | 26,331 | 58.6 | 42.9 | 81.4 | 14 | 59.3 | 31.4 |
| Wisconsin | 1,434,230,775 | 27.8 | 10.1 | 52.6 | 23 | 62,026 | 40.3 | 22.8 | 73.8 | 33 | 65.8 | 26.1 |
| Wyoming | 134,720,415 | 51.9 | 11.6 | 79.8 | 5 | 5,316 | 56.2 | 28.3 | 85.6 | 16 | 51.4 | 17.9 |
SOURCE: Medicaid Analytic eXtract, 2002 for a sample of 37 states with valid long-term care data. LTC = long-term care.
| ||||||||||||
| TABLE D.2. Average Expenditures and Expenditures per User for Medicaid FFS Institutional and Community-Based Long-Term Care Services Among Aged and Disabled Enrollees for Select States in 2002 | |||||||||
| Total Expenditures | Total Number of Users | Expenditures per User | |||||||
| Overall | ILTC | CLTCa | Overall | ILTC | CLTC | Overall | ILTC | CLTCa | |
| All Sample States | 55,853,564,420 | 36,994,236,071 | 18,859,328,349 | 2,470,774 | 1,169,599 | 1,453,930 | 22,606 | 31,630 | 12,971 |
| Alabama | 949,247,839 | 754,159,036 | 195,088,803 | 63,540 | 26,718 | 41,395 | 14,939 | 28,227 | 4,713 |
| Alaska | 170,053,768 | 64,525,356 | 105,528,412 | 5,351 | 964 | 4,630 | 31,780 | 66,935 | 22,792 |
| Arkansas | 737,779,689 | 563,353,194 | 174,426,495 | 46,856 | 22,510 | 26,630 | 15,746 | 25,027 | 6,550 |
| California | 6,474,012,070 | 3,516,675,186 | 2,957,336,884 | 442,150 | 121,719 | 341,291 | 14,642 | 28,892 | 8,665 |
| Colorado | 789,483,284 | 416,040,146 | 373,443,138 | 40,666 | 15,471 | 27,474 | 19,414 | 26,892 | 13,593 |
| Connecticut | 1,845,597,817 | 1,276,008,385 | 569,589,432 | 53,933 | 31,523 | 26,428 | 34,220 | 40,479 | 21,552 |
| Delaware | 242,973,383 | 172,851,473 | 70,121,910 | 6,851 | 3,853 | 3,364 | 35,465 | 44,862 | 20,845 |
| District of Columbia | 267,951,360 | 236,960,010 | 30,991,350 | 9,222 | 4,913 | 4,585 | 29,056 | 48,231 | 6,759 |
| Florida | 3,091,499,328 | 2,274,093,918 | 817,405,410 | 158,986 | 82,312 | 82,834 | 19,445 | 27,628 | 9,868 |
| Georgia | 1,294,811,205 | 945,076,959 | 349,734,246 | 72,476 | 41,787 | 32,520 | 17,865 | 22,617 | 10,754 |
| Idaho | 271,976,684 | 181,354,894 | 90,621,790 | 15,065 | 6,307 | 10,114 | 18,054 | 28,755 | 8,960 |
| Illinois | 2,724,087,990 | 2,140,793,932 | 583,294,058 | 182,040 | 87,674 | 114,264 | 14,964 | 24,418 | 5,105 |
| Indiana | 1,402,625,664 | 1,165,312,430 | 237,313,234 | 57,474 | 45,782 | 13,197 | 24,405 | 25,454 | 17,982 |
| Iowa | 797,603,243 | 610,076,941 | 187,526,302 | 42,299 | 22,591 | 22,992 | 18,856 | 27,005 | 8,156 |
| Kansas | 721,488,818 | 382,127,819 | 339,360,999 | 37,474 | 17,248 | 22,028 | 19,253 | 22,155 | 15,406 |
| Kentucky | 911,441,510 | 709,545,233 | 201,896,277 | 51,946 | 28,122 | 26,100 | 17,546 | 25,231 | 7,735 |
| Louisiana | 1,149,262,277 | 953,293,342 | 195,968,935 | 57,558 | 42,625 | 17,875 | 19,967 | 22,365 | 10,963 |
| Maine | 523,719,228 | 247,638,587 | 276,080,641 | 21,126 | 9,022 | 14,177 | 24,790 | 27,448 | 19,474 |
| Maryland | 1,229,324,525 | 834,395,419 | 394,929,106 | 45,071 | 23,698 | 22,334 | 27,275 | 35,210 | 17,683 |
| Minnesota | 2,156,559,593 | 1,114,133,546 | 1,042,426,047 | 83,752 | 37,475 | 52,821 | 25,749 | 29,730 | 19,735 |
| Mississippi | 679,388,274 | 620,792,424 | 58,595,850 | 36,131 | 22,905 | 14,297 | 18,803 | 27,103 | 4,098 |
| Missouri | 1,269,674,117 | 825,294,166 | 444,379,951 | 86,969 | 39,817 | 54,218 | 14,599 | 20,727 | 8,196 |
| Nebraska | 479,154,285 | 332,950,687 | 146,203,598 | 19,525 | 12,195 | 8,595 | 24,541 | 27,302 | 17,010 |
| Nevada | 188,035,239 | 138,688,282 | 49,346,957 | 9,478 | 5,157 | 4,814 | 19,839 | 26,893 | 10,251 |
| New Hampshire | 347,963,248 | 197,869,813 | 150,093,435 | 12,465 | 7,312 | 5,776 | 27,915 | 27,061 | 25,986 |
| New Jersey | 2,545,888,294 | 1,762,381,003 | 783,507,291 | 94,780 | 47,004 | 50,484 | 26,861 | 37,494 | 15,520 |
| New Mexico | 542,600,816 | 189,309,510 | 353,291,306 | 20,436 | 7,142 | 13,829 | 26,551 | 26,507 | 25,547 |
| New York | 14,262,218,168 | 8,636,185,022 | 5,626,033,146 | 376,597 | 163,087 | 250,991 | 37,871 | 52,954 | 22,415 |
| North Dakota | 252,311,287 | 197,396,078 | 54,915,209 | 8,838 | 5,965 | 3,331 | 28,548 | 33,092 | 16,486 |
| Ohio | 3,936,270,515 | 3,135,573,529 | 800,696,986 | 139,378 | 90,182 | 57,053 | 28,242 | 34,769 | 14,034 |
| Oklahoma | 840,695,921 | 554,591,129 | 286,104,792 | 49,223 | 26,232 | 25,375 | 17,079 | 21,142 | 11,275 |
| South Dakota | 208,020,237 | 140,851,436 | 67,168,801 | 10,049 | 6,203 | 4,278 | 20,701 | 22,707 | 15,701 |
| Utah | 254,038,802 | 156,509,773 | 97,529,029 | 11,196 | 6,205 | 5,397 | 22,690 | 25,223 | 18,071 |
| Vermont | 188,769,963 | 85,386,505 | 103,383,458 | 8,200 | 3,616 | 5,049 | 23,021 | 23,614 | 20,476 |
| West Virginia | 538,084,789 | 361,236,474 | 176,848,315 | 26,331 | 11,871 | 15,424 | 20,435 | 30,430 | 11,466 |
| Wisconsin | 1,434,230,775 | 1,036,010,439 | 398,220,336 | 62,026 | 39,840 | 24,980 | 23,123 | 26,004 | 15,942 |
| Wyoming | 134,720,415 | 64,793,994 | 69,926,421 | 5,316 | 2,552 | 2,986 | 25,342 | 25,389 | 23,418 |
SOURCE: Medicaid Analytic eXtract, 2002 for a sample of 37 states with valid long-term care data. CLTC = community-based long-term care; ILTC = institutional long-term care.
| |||||||||
| TABLE D.3. Composition of Medicaid Long-Term Care Expenditures Among Aged and Disabled Enrollees in 2002, by Demographic and Enrollment Characteristics | ||||
| Population Subgroup | Total LTC Expenditures in MAX (in 1,000s) | Among Enrollees in 37 Sample States | ||
| Total LTC Expenditures (in 1,000s) | Percentage for Community-Based LTCa | Percentage for Waivers | ||
| All Enrollees | 73,101,064 | 55,853,564 | 33.8 | 20.9 |
| Age | ||||
| Under 65 years | 32,444,997 | 25,774,942 | 50.4 | 37.9 |
| 65-74 years | 8,156,488 | 6,216,263 | 30.8 | 14.0 |
| 75-84 years | 14,647,440 | 10,841,501 | 21.0 | 6.1 |
| 85 years and older | 17,851,935 | 13,020,685 | 12.9 | 3.4 |
| Race and Ethnicity | ||||
| Non-Hispanic White | 51,062,749 | 38,434,299 | 31.0 | 22.7 |
| Non-White | 21,942,170 | 17,347,037 | 39.8 | 16.6 |
| Gender | ||||
| Female | 44,404,713 | 33,417,369 | 30.7 | 16.4 |
| Male | 28,695,315 | 22,435,202 | 38.3 | 27.6 |
| Enrollment Period | ||||
| All year | 64,486,024 | 49,444,881 | 36.2 | 22.5 |
| Part year | 8,615,039 | 6,408,684 | 15.0 | 7.8 |
| Medicare Status | ||||
| Not a dual | 16,667,044 | 13,323,620 | 48.0 | 31.0 |
| Part-year dual | 1,630,774 | 1,120,424 | 36.6 | 19.0 |
| Full-year dual | 54,803,244 | 41,409,521 | 29.1 | 17.6 |
| Basis of Eligibility | ||||
| Agedb | 40,656,064 | 30,078,621 | 19.5 | 6.2 |
| Disabled | 32,444,999 | 25,774,943 | 50.4 | 37.9 |
| Basis of Eligibility by Enrollment Status | ||||
| Aged duals | 39,235,656 | 28,919,508 | 19.3 | 6.2 |
| Aged non-duals | 1,420,409 | 1,159,113 | 25.7 | 7.3 |
| Disabled duals | 17,198,363 | 13,610,437 | 50.6 | 42.0 |
| Disabled non-duals | 15,246,636 | 12,164,506 | 50.2 | 33.3 |
SOURCE: Medicaid Analytic eXtract, 2002 for a sample of 37 states with valid long-term care data. LTC = long-term care.
| ||||
| TABLE D.4. Composition of Medicaid FFS Long-Term Care Expenditures Among Aged and Disabled Enrollees for Select States in 2002, by Detailed Type of Service | |||||||||||||
| Total LTC Expenditures | Institutional Long-Term Care Expenditures (Percent) | Community-Based Long-Term Care Expenditures (Unduplicated Percent)a | |||||||||||
| Overall | Nursing Facility | ICF/MR | Inpatient Psych | MH for Aged | Overall | Waivers | PCS | Home Health | Adult Day | PDN | Res Care | ||
| All Sample States | 55,853,564,420 | 66.2 | 50.7 | 14.3 | 0.7 | 0.5 | 33.8 | 20.9 | 8.0 | 2.7 | 1.5 | 8.0 | 0.2 |
| Alabama | 949,247,839 | 79.4 | 70.8 | 6.2 | 0.0 | 2.5 | 20.6 | 19.1 | 0.0 | 1.2 | 0.0 | 0.2 | 0.0 |
| Alaska | 170,053,768 | 37.9 | 35.8 | 0.0 | 2.1 | 0.0 | 62.1 | 57.4 | 4.6 | 0.1 | 0.0 | 0.0 | 0.0 |
| Arkansas | 737,779,689 | 76.4 | 56.9 | 15.6 | 3.8 | 0.0 | 23.6 | 12.4 | 6.6 | 0.9 | 2.6 | 1.1 | 0.0 |
| California | 6,474,012,070 | 54.3 | 43.8 | 10.4 | 0.1 | 0.0 | 45.7 | 15.1 | 26.2 | 1.3 | 3.1 | 0.0 | 0.0 |
| Colorado | 789,483,284 | 52.7 | 50.2 | 2.1 | 0.1 | 0.4 | 47.3 | 45.5 | 0.0 | 1.3 | 0.0 | 0.5 | 0.0 |
| Connecticut | 1,845,597,817 | 69.1 | 56.8 | 12.2 | 0.0 | 0.1 | 30.9 | 25.1 | 0.0 | 5.7 | 0.0 | 0.0 | 0.0 |
| Delaware | 242,973,383 | 71.1 | 58.1 | 12.0 | 0.3 | 0.7 | 28.9 | 22.9 | 0.0 | 1.3 | 1.1 | 3.1 | 0.6 |
| District of Columbia | 267,951,360 | 88.4 | 59.5 | 27.7 | 0.3 | 0.9 | 11.6 | 1.1 | 0.0 | 3.9 | 6.6 | 0.0 | 0.0 |
| Florida | 3,091,499,328 | 73.6 | 63.2 | 10.1 | 0.0 | 0.2 | 26.4 | 21.7 | 0.4 | 3.5 | 0.0 | 0.0 | 0.9 |
| Georgia | 1,294,811,205 | 73.0 | 64.0 | 9.0 | 0.0 | 0.0 | 27.0 | 24.8 | 0.0 | 0.7 | 0.7 | 0.0 | 0.8 |
| Idaho | 271,976,684 | 66.7 | 44.4 | 20.1 | 1.0 | 1.2 | 33.3 | 19.6 | 11.4 | 0.7 | 0.0 | 1.3 | 0.3 |
| Illinois | 2,724,087,990 | 78.6 | 54.1 | 22.7 | 0.4 | 1.4 | 21.4 | 21.3 | 0.0 | 0.1 | 0.0 | 0.1 | 0.0 |
| Indiana | 1,402,625,664 | 83.1 | 59.1 | 23.4 | 0.3 | 0.3 | 16.9 | 15.5 | 0.0 | 1.4 | 0.0 | 0.0 | 0.0 |
| Iowa | 797,603,243 | 76.5 | 49.8 | 26.0 | 0.6 | 0.1 | 23.5 | 20.8 | 0.0 | 2.3 | 0.4 | 0.0 | 0.0 |
| Kansas | 721,488,818 | 53.0 | 43.2 | 8.9 | 0.2 | 0.6 | 47.0 | 45.1 | 0.9 | 1.0 | 0.0 | 0.0 | 0.0 |
| Kentucky | 911,441,510 | 77.8 | 64.2 | 11.5 | 2.1 | 0.0 | 22.2 | 19.8 | 0.0 | 1.7 | 0.1 | 0.0 | 0.6 |
| Louisiana | 1,149,262,277 | 82.9 | 49.4 | 31.3 | 0.4 | 1.8 | 17.1 | 15.6 | 0.2 | 1.3 | 0.0 | 0.0 | 0.0 |
| Maine | 523,719,228 | 47.3 | 38.9 | 6.0 | 2.4 | 0.1 | 52.7 | 38.5 | 1.1 | 0.9 | 3.0 | 0.7 | 8.5 |
| Maryland | 1,229,324,525 | 67.9 | 61.5 | 4.8 | 1.1 | 0.4 | 32.1 | 24.2 | 2.3 | 0.1 | 4.3 | 1.2 | 0.0 |
| Minnesota | 2,156,559,593 | 51.7 | 41.5 | 9.8 | 0.2 | 0.1 | 48.3 | 43.1 | 4.1 | 0.5 | 0.0 | 0.7 | 0.0 |
| Mississippi | 679,388,274 | 91.4 | 64.4 | 26.1 | 0.8 | 0.0 | 8.6 | 8.2 | 0.0 | 0.4 | 0.0 | 0.0 | 0.0 |
| Missouri | 1,269,674,117 | 65.0 | 56.3 | 8.6 | 0.1 | 0.0 | 35.0 | 18.6 | 14.4 | 0.1 | 0.4 | 0.0 | 1.5 |
| Nebraska | 479,154,285 | 69.5 | 59.3 | 9.8 | 0.3 | 0.1 | 30.5 | 24.0 | 1.5 | 3.4 | 0.7 | 0.2 | 0.7 |
| Nevada | 188,035,239 | 73.8 | 57.2 | 13.9 | 2.5 | 0.1 | 26.2 | 18.4 | 5.6 | 2.2 | 0.0 | 0.0 | 0.0 |
| New Hampshire | 347,963,248 | 56.9 | 56.4 | 0.2 | 0.2 | 0.0 | 43.1 | 42.2 | 0.2 | 0.4 | 0.1 | 0.2 | 0.0 |
| New Jersey | 2,545,888,294 | 69.2 | 50.7 | 17.1 | 0.7 | 0.7 | 30.8 | 16.3 | 9.1 | 2.2 | 2.7 | 0.4 | 0.0 |
| New Mexico | 542,600,816 | 34.9 | 30.6 | 3.2 | 1.1 | 0.0 | 65.1 | 38.0 | 27.0 | 0.1 | 0.0 | 0.1 | 0.0 |
| New York | 14,262,218,168 | 60.6 | 41.4 | 17.1 | 1.2 | 0.9 | 39.4 | 16.0 | 13.3 | 6.2 | 3.0 | 0.9 | 0.0 |
| North Dakota | 252,311,287 | 78.2 | 57.9 | 19.9 | 0.0 | 0.5 | 21.8 | 21.0 | 0.0 | 0.4 | 0.0 | 0.0 | 0.4 |
| Ohio | 3,936,270,515 | 79.7 | 64.2 | 15.4 | 0.1 | 0.0 | 20.3 | 17.4 | 0.0 | 1.7 | 0.0 | 1.3 | 0.0 |
| Oklahoma | 840,695,921 | 66.0 | 52.6 | 12.6 | 0.7 | 0.0 | 34.0 | 31.8 | 2.1 | 0.1 | 0.0 | 0.0 | 0.0 |
| South Dakota | 208,020,237 | 67.7 | 54.2 | 8.4 | 3.6 | 1.5 | 32.3 | 29.0 | 3.0 | 0.2 | 0.0 | 0.0 | 0.0 |
| Utah | 254,038,802 | 61.6 | 39.4 | 19.1 | 2.5 | 0.6 | 38.4 | 37.2 | 0.1 | 0.3 | 0.4 | 0.0 | 0.5 |
| Vermont | 188,769,963 | 45.2 | 44.1 | 1.0 | 0.0 | 0.2 | 54.8 | 51.6 | 1.2 | 2.0 | 0.0 | 0.0 | 0.0 |
| West Virginia | 538,084,789 | 67.1 | 57.2 | 9.0 | 1.0 | 0.0 | 32.9 | 31.9 | 0.1 | 0.4 | 0.0 | 0.3 | 0.1 |
| Wisconsin | 1,434,230,775 | 72.2 | 56.1 | 14.8 | 1.0 | 0.3 | 27.8 | 21.2 | 4.0 | 0.9 | 0.4 | 1.2 | 0.0 |
| Wyoming | 134,720,415 | 48.1 | 40.5 | 7.2 | 0.4 | 0.1 | 51.9 | 51.8 | 0.0 | 0.2 | 0.0 | 0.0 | 0.0 |
SOURCE: Medicaid Analytic eXtract, 2002 for a sample of 37 states with valid long-term care data. ICF/MR = intermediate care facility for persons with mental retardation; LTC = long-term care; MH = mental hospital; PCS = personal care services; PDN = private duty nursing.
| |||||||||||||
| TABLE D.5. Average Medicaid FFS Long-Term Care Expenditures per Aged or Disabled Enrollee Using Any Long-Term Care Service for Select States in 2002, by Detailed Type of Service | |||||||||||||
| Average Long-Term Care Expenditures | Average Institutional Long-Term Care Expenditures | Average Community-Based Long-Term Care Expenditures (Duplicated Dollars)a | |||||||||||
| Overall | Nursing Facility | ICF/MR | Inpatient Psych | MH for Aged | Overall | Waivers | PCS | Res Care | Home Health | Adult Day | PDN | ||
| All Sample States | 22,606 | 14,973 | 11,469 | 3,243 | 151 | 110 | 7,633 | 4,713 | 2,413 | 1,354 | 968 | 946 | 184 |
| Alabama | 14,939 | 11,869 | 10,577 | 919 | 0 | 373 | 3,070 | 2,858 | 0 | 1,425 | 295 | 9 | 36 |
| Alaska | 31,780 | 12,059 | 11,375 | 0 | 682 | 2 | 19,721 | 18,229 | 8,132 | 11,074 | 116 | 1,253 | 127 |
| Arkansas | 15,746 | 12,023 | 8,966 | 2,456 | 601 | 0 | 3,723 | 1,957 | 1,450 | 8 | 184 | 468 | 204 |
| California | 14,642 | 7,954 | 6,417 | 1,521 | 14 | 2 | 6,689 | 2,206 | 5,565 | 0 | 357 | 859 | 103 |
| Colorado | 19,414 | 10,231 | 9,749 | 400 | 13 | 69 | 9,183 | 8,839 | 0 | 741 | 1,768 | 110 | 262 |
| Connecticut | 34,220 | 23,659 | 19,426 | 4,179 | 10 | 44 | 10,561 | 8,605 | 1,396 | 5,114 | 3,043 | 1,238 | 0 |
| Delaware | 35,465 | 25,230 | 20,615 | 4,265 | 113 | 237 | 10,235 | 8,110 | 0 | 2,192 | 752 | 741 | 1,121 |
| District of Columbia | 29,056 | 25,695 | 17,296 | 8,044 | 86 | 269 | 3,361 | 309 | 15 | 0 | 1,749 | 2,013 | 0 |
| Florida | 19,445 | 14,304 | 12,299 | 1,961 | 0 | 44 | 5,141 | 4,215 | 94 | 1,963 | 984 | 415 | 0 |
| Georgia | 17,865 | 13,040 | 11,436 | 1,604 | 0 | 0 | 4,826 | 4,437 | 0 | 722 | 1,072 | 1,021 | 0 |
| Idaho | 18,054 | 12,038 | 8,012 | 3,620 | 181 | 225 | 6,015 | 3,537 | 3,115 | 1,386 | 189 | 32 | 237 |
| Illinois | 14,964 | 11,760 | 8,094 | 3,400 | 56 | 210 | 3,204 | 3,184 | 602 | 8 | 52 | 24 | 109 |
| Indiana | 24,405 | 20,275 | 14,415 | 5,705 | 83 | 72 | 4,129 | 3,786 | 0 | 2,303 | 789 | 181 | 0 |
| Iowa | 18,856 | 14,423 | 9,387 | 4,909 | 115 | 12 | 4,433 | 3,921 | 0 | 2,814 | 1,415 | 117 | 0 |
| Kansas | 19,253 | 10,197 | 8,319 | 1,710 | 44 | 124 | 9,056 | 8,690 | 3,656 | 3,673 | 614 | 1,415 | 0 |
| Kentucky | 17,546 | 13,659 | 11,266 | 2,016 | 369 | 8 | 3,887 | 3,465 | 0 | 1,295 | 935 | 441 | 0 |
| Louisiana | 19,967 | 16,562 | 9,871 | 6,250 | 79 | 362 | 3,405 | 3,105 | 34 | 0 | 373 | 77 | 0 |
| Maine | 24,790 | 11,722 | 9,639 | 1,484 | 583 | 15 | 13,068 | 9,538 | 302 | 2,191 | 251 | 2,033 | 197 |
| Maryland | 27,275 | 18,513 | 16,776 | 1,314 | 304 | 119 | 8,762 | 6,607 | 688 | 0 | 6,578 | 1,558 | 695 |
| Minnesota | 25,749 | 13,303 | 10,691 | 2,533 | 59 | 21 | 12,447 | 11,098 | 3,010 | 103 | 513 | 1,283 | 375 |
| Mississippi | 18,803 | 17,182 | 12,117 | 4,905 | 155 | 5 | 1,622 | 1,544 | 1 | 11 | 359 | 91 | 0 |
| Missouri | 14,599 | 9,490 | 8,214 | 1,262 | 13 | 1 | 5,110 | 2,711 | 2,202 | 1,152 | 18 | 78 | 0 |
| Nebraska | 24,541 | 17,053 | 14,554 | 2,417 | 66 | 16 | 7,488 | 5,893 | 372 | 176 | 883 | 177 | 59 |
| Nevada | 19,839 | 14,633 | 11,357 | 2,767 | 496 | 13 | 5,206 | 3,659 | 1,900 | 0 | 545 | 0 | 0 |
| New Hampshire | 27,915 | 15,874 | 15,747 | 66 | 61 | 0 | 12,041 | 11,780 | 395 | 462 | 197 | 2,393 | 168 |
| New Jersey | 26,861 | 18,594 | 13,619 | 4,601 | 180 | 193 | 8,267 | 4,385 | 2,519 | 366 | 810 | 901 | 161 |
| New Mexico | 26,551 | 9,264 | 8,122 | 856 | 282 | 4 | 17,288 | 10,078 | 7,236 | 0 | 20 | 952 | 14 |
| New York | 37,871 | 22,932 | 15,665 | 6,479 | 464 | 324 | 14,939 | 6,065 | 5,145 | 4,327 | 2,402 | 2,772 | 394 |
| North Dakota | 28,548 | 22,335 | 16,524 | 5,669 | 12 | 129 | 6,214 | 5,990 | 0 | 202 | 255 | 6 | 0 |
| Ohio | 28,242 | 22,497 | 18,142 | 4,340 | 15 | 0 | 5,745 | 4,906 | 0 | 1 | 689 | 77 | 660 |
| Oklahoma | 17,079 | 11,267 | 8,989 | 2,154 | 116 | 8 | 5,812 | 5,435 | 867 | 10 | 32 | 2,130 | 0 |
| South Dakota | 20,701 | 14,016 | 11,224 | 1,746 | 741 | 306 | 6,684 | 6,000 | 626 | 0 | 49 | 1 | 9 |
| Utah | 22,690 | 13,979 | 8,948 | 4,333 | 561 | 137 | 8,711 | 8,433 | 67 | 5,196 | 359 | 1,220 | 1 |
| Vermont | 23,021 | 10,413 | 10,145 | 221 | 9 | 38 | 12,608 | 11,883 | 576 | 0 | 850 | 0 | 0 |
| West Virginia | 20,435 | 13,719 | 11,693 | 1,831 | 195 | 0 | 6,716 | 6,526 | 38 | 2,544 | 126 | 1,126 | 64 |
| Wisconsin | 23,123 | 16,703 | 12,978 | 3,432 | 229 | 64 | 6,420 | 4,909 | 1,819 | 719 | 360 | 86 | 423 |
| Wyoming | 25,342 | 12,188 | 10,259 | 1,818 | 90 | 20 | 13,154 | 13,116 | 0 | 5,553 | 182 | 3,141 | 0 |
SOURCE: Medicaid Analytic eXtract, 2002 for a sample of 37 states with valid long-term care data. ICF/MR = intermediate care facility for persons with mental retardation; LTC = long-term care; MH = mental hospital; PCS = personal care services; PDN = private duty nursing.
| |||||||||||||
| TABLE D.6. FFS Expenditures per Enrollee Among All Full-Benefit Enrollees and Among Users of Long-Term Care Services in 2002, by Service Type | ||||||
| All Full-Benefit Medicaid Enrollees | Non-LTC Enrolleesa | Aged or Disabled Enrollees Using LTC Services | ||||
| Any FFS LTC | ILTC Only | Both ILTC and CLTC | CLTC Only | |||
| Number of Enrollees | 32,088,448 | 29,617,674 | 2,470,774 | 1,016,844 | 152,755 | 1,301,175 |
| Long-Term Care Expenditures per Enrollee | ||||||
| Institutional Long-Term Care | ||||||
| Nursing facility | 886 | 3 | 11,469 | 25,889 | 13,170 | 0 |
| ICF/MR | 251 | 1 | 3,243 | 6,427 | 9,675 | 0 |
| Inpatient psychiatric for age21 | 35 | 25 | 151 | 298 | 456 | 0 |
| Mental hospital for the aged | 9 | 0 | 110 | 219 | 320 | 0 |
| Community-Based Long-Term Care | ||||||
| 1915(c) waiver servicesb | 363 | 0 | 4,713 | 0 | 3,279 | 8,565 |
| Personal care | 188 | 3 | 2,413 | 0 | 2,612 | 4,275 |
| Residential care | 109 | 5 | 1,354 | 0 | 863 | 2,469 |
| Home health | 80 | 5 | 968 | 0 | 1,426 | 1,671 |
| Adult day care | 75 | 3 | 946 | 0 | 1,477 | 1,623 |
| Private duty nursing | 16 | 2 | 184 | 0 | 67 | 341 |
| Other Medicaid Service Expenditures per Enrollee | ||||||
| Prescription drug | 663 | 448 | 3,241 | 2,775 | 3,842 | 3,534 |
| Inpatient hospital | 582 | 429 | 2,415 | 1,460 | 5,991 | 2,741 |
| Outpatient hospital | 130 | 115 | 315 | 141 | 471 | 434 |
| Physician | 148 | 128 | 378 | 230 | 668 | 459 |
| Psychiatric | 176 | 144 | 549 | 112 | 437 | 904 |
| Clinic | 93 | 81 | 240 | 77 | 398 | 348 |
| Lab and X-ray | 77 | 69 | 177 | 92 | 264 | 234 |
| Durable medical equipment | 58 | 30 | 388 | 153 | 471 | 563 |
| Rehabilitation | 64 | 45 | 291 | 122 | 213 | 433 |
| Dental care | 48 | 48 | 49 | 34 | 68 | 58 |
| Targeted case management | 39 | 29 | 155 | 16 | 122 | 267 |
| Transportation | 37 | 18 | 264 | 176 | 554 | 300 |
| Hospice care | 15 | 7 | 116 | 232 | 114 | 26 |
| Other practitioner | 11 | 10 | 27 | 22 | 31 | 31 |
| Physical, occupational, and speech therapy | 15 | 13 | 38 | 15 | 37 | 56 |
| Sterilization | 2 | 2 | 0 | 0 | 0 | 1 |
| Nurse practitioner | 3 | 3 | 4 | 3 | 5 | 4 |
| Nurse midwife | 1 | 1 | 0 | 0 | 0 | 0 |
| Abortion | 0 | 0 | 0 | 0 | 0 | 0 |
| Other | 203 | 46 | 2,083 | 120 | 2,018 | 3,624 |
| Unknown | 14 | 9 | 79 | 39 | 82 | 111 |
SOURCE: Medicaid Analytic eXtract, 2002 sample of 37 states with valid long-term care data. CLTC = community long-term care; ILTC = institutional long-term care; LTC = long-term care.
| ||||||
| TABLE D.7. Percentage Using Specified FFS Service Among All Full-Benefit Enrollees and Among Users of Long-Term Care Services in 2002, by Service Type | ||||||
| All Full-Benefit Medicaid Enrollees | Non-LTC Enrolleesa | Aged or Disabled Enrollees Using LTC Services | ||||
| Any FFS LTC | ILTC Only | Both ILTC and CLTC | CLTC Only | |||
| Number of Enrollees | 32,088,448 | 29,617,674 | 2,470,774 | 1,016,844 | 152,755 | 1,301,175 |
| Percentage Using Medicaid Long-Term Care Service | ||||||
| Institutional Long-Term Care | ||||||
| Nursing facility | 3.3 | 0.0 | 43.1 | 92.1 | 83.7 | 0.0 |
| ICF/MR | 0.3 | 0.0 | 3.3 | 6.1 | 12.7 | 0.0 |
| Inpatient psychiatric for age21 | 0.2 | 0.1 | 0.6 | 1.1 | 1.8 | 0.0 |
| Mental hospital for the aged | 0.1 | 0.0 | 0.7 | 1.2 | 2.9 | 0.0 |
| Community-Based Long-Term Care | ||||||
| 1915(c) waiver services | 2.0 | 0.0 | 26.3 | 0.0 | 41.9 | 45.0 |
| Personal care | 1.0 | 0.0 | 12.9 | 0.0 | 22.6 | 21.8 |
| Residential care | 1.6 | 0.3 | 17.4 | 0.0 | 20.5 | 30.7 |
| Home health | 1.8 | 0.5 | 17.4 | 0.0 | 38.2 | 28.5 |
| Adult day care | 0.8 | 0.1 | 8.8 | 0.0 | 11.8 | 15.3 |
| Private duty nursing | 0.1 | 0.0 | 0.7 | 0.0 | 1.5 | 1.1 |
| Percentage Using Other Medicaid Service | ||||||
| Prescription drug | 49.5 | 46.2 | 88.4 | 85.8 | 95.7 | 89.5 |
| Inpatient hospital | 9.1 | 7.6 | 26.7 | 24.4 | 49.1 | 26.0 |
| Outpatient hospital | 26.4 | 25.1 | 42.5 | 29.9 | 58.7 | 50.5 |
| Physician | 40.7 | 38.3 | 68.5 | 61.7 | 82.1 | 72.3 |
| Psychiatric | 10.9 | 10.4 | 16.8 | 10.3 | 20.9 | 21.4 |
| Clinic | 17.3 | 17.0 | 20.6 | 13.6 | 26.2 | 25.5 |
| Lab and X-ray | 31.4 | 30.1 | 47.5 | 40.4 | 63.2 | 51.2 |
| Durable medical equipment | 17.3 | 15.1 | 43.7 | 24.8 | 62.4 | 56.3 |
| Rehabilitation | 2.0 | 1.8 | 5.0 | 2.1 | 6.6 | 7.0 |
| Dental care | 15.2 | 15.1 | 16.5 | 15.8 | 19.7 | 16.7 |
| Targeted case management | 4.9 | 4.5 | 9.9 | 1.2 | 8.6 | 16.8 |
| Transportation | 7.4 | 5.0 | 36.9 | 39.1 | 63.5 | 32.0 |
| Hospice care | 0.2 | 0.1 | 1.7 | 3.4 | 1.8 | 0.4 |
| Other practitioner | 10.5 | 8.8 | 31.7 | 35.8 | 44.3 | 27.1 |
| Physical, occupational, and speech therapy | 1.8 | 1.5 | 4.6 | 4.3 | 6.7 | 4.5 |
| Sterilization | 0.2 | 0.2 | 0.0 | 0.0 | 0.0 | 0.1 |
| Nurse practitioner | 2.3 | 2.2 | 3.7 | 4.5 | 5.7 | 2.8 |
| Nurse midwife | 0.3 | 0.3 | 0.1 | 0.2 | 0.1 | 0.1 |
| Abortion | 0.0 | 0.0 | 0.0 | 0.0 | 0.0 | 0.0 |
| Other | 12.0 | 9.9 | 38.1 | 15.8 | 57.5 | 53.2 |
| Unknown | 6.5 | 6.1 | 10.4 | 4.2 | 13.1 | 14.8 |
SOURCE: Medicaid Analytic eXtract, 2002 sample of 37 states with valid long-term care data. CLTC = community long-term care; ILTC = institutional long-term care; LTC = long-term care.
| ||||||
| TABLE D.8. FFS Expenditures per User Among All Full-Benefit Enrollees and Among Users of Long-Term Care Services in 2002, by Service Type | ||||||
| All Full-Benefit Medicaid Enrollees | Non-LTC Enrolleesa | Aged or Disabled Enrollees Using LTC Services | ||||
| Any FFS LTC | ILTC Only | Both ILTC and CLTC | CLTC Only | |||
| Number of Enrollees | 32,088,448 | 29,617,674 | 2,470,774 | 1,016,844 | 152,755 | 1,301,175 |
| Long-Term Care Expenditures Per User | ||||||
| Institutional Long-Term Care | ||||||
| Nursing facility | 26,591 | 17,741 | 26,630 | 28,119 | 15,732 | - |
| ICF/MR | 97,648 | 67,195 | 97,860 | 104,547 | 76,280 | - |
| Inpatient psychiatric for age21 | 21,972 | 20,351 | 26,110 | 26,151 | 25,933 | - |
| Mental hospital for the aged | 15,919 | 3,262 | 16,625 | 18,591 | 11,216 | - |
| Community-Based Long-Term Care | ||||||
| 1915(c) waiver services | 17,918 | - | 17,918 | - | 7,832 | 19,019 |
| Personal care | 18,315 | 6,690 | 18,737 | - | 11,558 | 19,610 |
| Residential care | 6,856 | 1,888 | 7,761 | - | 4,212 | 8,039 |
| Home health | 4,530 | 1,204 | 5,575 | - | 3,732 | 5,865 |
| Adult day care | 9,317 | 1,798 | 10,741 | - | 12,564 | 10,577 |
| Private duty nursing | 17,130 | 4,443 | 27,719 | - | 4,413 | 31,543 |
| Other Medicaid Service Expenditures per User | ||||||
| Prescription drug | 1,341 | 969 | 3,667 | 3,234 | 4,016 | 3,947 |
| Inpatient hospital | 6,396 | 5,624 | 9,036 | 5,993 | 12,214 | 10,564 |
| Outpatient hospital | 492 | 457 | 742 | 472 | 802 | 860 |
| Physician | 363 | 335 | 552 | 373 | 814 | 635 |
| Psychiatric | 1,616 | 1,392 | 3,271 | 1,087 | 2,090 | 4,227 |
| Clinic | 538 | 475 | 1,162 | 567 | 1,519 | 1,368 |
| Lab and X-ray | 245 | 228 | 374 | 228 | 417 | 457 |
| Durable medical equipment | 335 | 201 | 889 | 616 | 754 | 1,000 |
| Rehabilitation | 3,155 | 2,528 | 5,862 | 5,710 | 3,232 | 6,189 |
| Dental care | 315 | 316 | 297 | 215 | 345 | 350 |
| Targeted case management | 780 | 636 | 1,569 | 1,393 | 1,420 | 1,587 |
| Transportation | 493 | 354 | 717 | 450 | 873 | 937 |
| Hospice care | 7,717 | 9,600 | 6,786 | 6,845 | 6,316 | 6,639 |
| Other practitioner | 106 | 112 | 86 | 62 | 70 | 114 |
| Physical, occupational, and speech therapy | 837 | 837 | 835 | 355 | 558 | 1,249 |
| Sterilization | 1,125 | 1,130 | 884 | 808 | 1,208 | 875 |
| Nurse practitioner | 121 | 122 | 109 | 77 | 88 | 156 |
| Nurse midwife | 237 | 244 | 63 | 47 | 61 | 88 |
| Abortion | 365 | 366 | 253 | 45 | 616 | 291 |
| Other | 1,687 | 470 | 5,468 | 760 | 3,507 | 6,808 |
| Unknown | 216 | 139 | 768 | 926 | 629 | 747 |
SOURCE: Medicaid Analytic eXtract, 2002 sample of 37 states with valid long-term care data. CLTC = community long-term care; ILTC = institutional long-term care; LTC = long-term care.
| ||||||
NOTES
-
Certain individuals in Section 209(b) states--states that have elected to use more restrictive Medicaid eligibility requirements than those of the SSI program--receive SSI but are not eligible for Medicaid benefits.
-
Some examples of non-MSIS data in MAX include measures of dual enrollment in Medicare and Medicaid that are obtained from the Medicare Enrollment Database and prescription drug category codes included on prescription drug claims, although the latter data are proprietary.
-
MAX consists of claims files and PS files. Claims are grouped into four sets of files containing all Medicaid claims paid for persons using institutional long-term care services, inpatient care, prescription drugs, and all other services used during a given year. MAX PS files contain person-level records with demographic and enrollment information and summary information about claims paid for services used during the year. MAX PS data are separated into one or more files per state. For further detail, see Wenzlow et al. 2007 or the CMS MAX website at [http://www.cms.hhs.gov/MedicaidDataSourcesGenInfo/07_MAXGeneralInformati....
-
Section 1915(c) (program type 7) of the Social Security Act applies to Medicaid enrollees that would otherwise require Medicaid-covered hospital, nursing facility, or ICF/MR care. Section 1915(d) (program type 6) applies specifically to individuals over age 65 requiring such level of care. No state operated a 1915(d) program in 2002 although most states do not differentiate between the two program types in MSIS and report all waiver services under one or the other program code. As suggested in MAX documentation, we sum expenditures reported under the two program codes for our analysis.
-
Unduplicated counts by service and program type can be calculated by processing MAX claims records, which were not available for use in this study. We expect that expenditures for Section 1915(c) waiver services will be disaggregated by service type in 2005 and later editions of MAX PS files.
-
Expenditures for any institutional or community-based long-term care services provided under managed care are subsumed into managed care premiums. Expenditures for specific services covered under managed care (including any for long-term care) generally cannot be identified in MAX. The use of MAX to examine long-term care in states with managed care programs like Arizonas is limited to overall expenditure analyses. Utilization of managed care services is reported in encounter records, although encounter records are known to be incomplete in MSIS and MAX.
-
We exclude people eligible for only family-planning services, unqualified aliens eligible for only emergency hospital services, and restricted-benefit duals receiving only coverage for Medicare premiums and cost sharing. Some enrollees may be eligible for a restricted set of services but are included in our analysis--for example, those eligible for only prescription drug coverage and Medicare cost sharing.
-
To the extent that individuals use services in more than one state, national measures of Medicaid long-term care use are somewhat overestimated.
-
Personal care services were erroneously coded as residential care in Californias MAX 2002 data. All residential care in California was recoded as personal care for the analyses presented in this report.
-
The waiver statistics presented in Table A.1 reflect fiscal year information obtained from MSIS and may differ from information available in calendar year MAX. For example, some services in the Other MSIS service category may be recoded as durable medical equipment (TOS 51), residential care (TOS 52), psychiatric care (TOS 53), or adult day (TOS 54) in MAX 2002.
-
In mapping service types in MAX, psychiatric and mental health services is the default category. That is, if a claim can be grouped into psychiatric or mental health services as well as another MAX service type, the default coding is to psychiatric and mental health services.
-
Additionally, for calendar year 2000 and later years, MPR also recoded services to MAX TOS 15 (lab/X-ray) even though there is already a corresponding MSIS type of service. In 1999, MAX TOS 15 merely duplicated state coding into MSIS TOS 15. However, since some states did not use service-code-specific crosswalks to report services to this service type, lab and X-ray utilization and expenditures in 1999 were more uneven than they should have been;. Accordingly, CMS opted to recode MAX TOS 15 for 2000 and later years.
-
The MSIS data dictionary can be found online at http://www.cms.hhs.gov/MSIS/Downloads/msisdd05.pdf.