
U.S. Department of Health and Human Services
Medicaid-Financed Nursing Home Services: Characteristics of People Served and Their Patterns of Care, 2001-2002
Audra T. Wenzlow, Robert Schmitz and Jill Gurvey
Mathematica Policy Research, Inc.
January 30, 2008
PDF Version (63 PDF pages)
This report was prepared under contract #HHS-100-97-0013 between the U.S. Department of Health and Human Services (HHS), Office of Disability, Aging and Long-Term Care Policy (DALTCP) and Mathematica Policy Research, Inc. For additional information about this subject, you can visit the DALTCP home page at http://aspe.hhs.gov/_/office_specific/daltcp.cfm or contact the ASPE Project Officer, John Drabek, at HHS/ASPE/DALTCP, Room 424E, H.H. Humphrey Building, 200 Independence Avenue, S.W., Washington, D.C. 20201. His e-mail address is: John.Drabek@hhs.gov.
The opinions and views expressed in this report are those of the authors. They do not necessarily reflect the views of the Department of Health and Human Services, the contractor or any other funding organization.
TABLE OF CONTENTS
- I. BACKGROUND AND OBJECTIVES
- The Role of Medicaid Nursing Home Services in Long-Term Care
- Medicaid Nursing Home Policies
- The Goals of This Study
- II. DATA AND METHODS
- Demographic and Eligibility Measures From the MAX Person Summary Files
- The MAX Claims Files and the Construction of Nursing Home Spells
- Analysis Data File Construction
- Data Strengths and Limitations
- III. CHARACTERISTICS OF PEOPLE WITH NEW MEDICAID-FINANCED NURSING HOME SPELLS AND A DESCRIPTION OF THEIR STAYS
- Number of Enrollees with New Medicaid-Financed Nursing Home Spells Between July 2001 and December 2002
- Characteristics of People with Medicaid-Financed Nursing Home Spells Between July 2001 and December 2002
- Medicaid Eligibility Pathways for Nursing Home Users
- Number and Length of Medicaid-Financed Nursing Home Spells
- IV. SUMMARY AND DIRECTIONS FOR FUTURE RESEARCH
- Summary of Key Results and Their Policy Implications
- Directions for Future Research
- APPENDICES
- APPENDIX A: Glossary of Terms
- APPENDIX B: State Nursing Home Data Anomalies
- APPENDIX C: Tables
- LIST OF FIGURES
- FIGURE III.1: Transitions in Maintenance Assistance Status at the Start of First Medicaid-Financed Nursing Home Spell Between July 2001 and December 2002
- FIGURE III.2: Association Between Percentage of Aged Long-Term Care Expenditures That Were for Community-Based Services in 2002 and Length of Spells
- FIGURE III.3: Association Between Percentage of Aged Long-Term Care Enrollees That Used Community-Based Services in 2002 and Length of Spells
- LIST OF TABLES
- TABLE I.1: Eligibility Expansions for Aged or Disabled Enrollees, Optionally Covered Long-Term Care Services, and Long-Term Care Managed Care Programs in Place in 2001-2002, by State
- TABLE II.1: Medicaid Maintenance Assistance Status Eligibility Groups for Aged and Disabled Enrollees
- TABLE III.1: Medicaid FFS Nursing Home Use Among Aged or Disabled Enrollees Eligible for Full Medicaid Benefits Any Time Between July 2001 and December 2002
- TABLE III.2: Characteristics of Aged or Disabled Enrollees with New Medicaid-Financed Nursing Home Spells Between July 2001 and December 2002
- TABLE III.3: Maintenance Assistance Status in First Month of First Medicaid-Financed Nursing Home Spell Among Aged or Disabled Enrollees Eligible for Full Medicaid Benefits Any Time Between July 2001 and December 2002
- TABLE III.4: Maintenance Assistance Status in the Two Months Preceding the First Medicaid-Financed Nursing Home Spells of Aged or Disabled Enrollees Between July 2001 and December 2002
- TABLE III.5: Medicaid and Non-Medicaid Nursing Home Use Prior to Medicaid-Financed Nursing Home Spells Starting Between July 2001 and December 2002 Among People with Valid Admission Dates
- TABLE III.6: Number and Length of Nursing Home Spells Among Aged or Disabled Medicaid Enrollees with New Medicaid-Financed Nursing Home Spells Between July 2001 and December 2001
- TABLE B.1: Medicaid Analytic eXtract (MAX) Long-Term Care 2001 and 2002 Data Anomalies
- TABLE C.1: Demographic Characteristics of Aged or Disabled Medicaid Enrollees with New Medicaid-Financed Nursing Home Spells Between July 2001 and December 2002
- TABLE C.2: Eligibility Characteristics of Aged or Disabled Medicaid Enrollees with New Medicaid-Financed Nursing Home Spells Between July 2001 and December 2002
- TABLE C.3: Maintenance Assistance Status of Aged or Disabled Medicaid Enrollees Prior to New Medicaid-Financed Nursing Home Spells Between July 2001 and December 2002
- TABLE C.4: Transitions in Eligibility Status Among Aged or Disabled Medicaid Enrollees with New Medicaid-Financed Nursing Home Spells Between July 2001 and December 2002: Transitions from Non-Enrollment and Cash
- TABLE C.5: Transitions in Eligibility Status Among Aged or Disabled Medicaid Enrollees with New Medicaid-Financed Nursing Home Spells Between July 2001 and December 2002: Transitions from Medically Needy and Other
- TABLE C.6: Medicaid Enrollment and Non-Medicaid Nursing Home Use Prior to Medicaid-Financed Nursing Home Spells Starting Between July 2001 and December 2002
EXECUTIVE SUMMARY
Although Medicaid expenditures for nursing home care are well-documented, little is known about the characteristics of people who use nursing home services. All Medicaid enrollees who reside in nursing homes must meet Medicaid income and asset requirements but pathways to Medicaid eligibility can vary greatly. Some have always had low incomes and are long-term Medicaid enrollees. Others may have met the financial and clinical eligibility criteria for Medicaid after depleting their assets while in a nursing home. Nursing home users can also vary by age, disability status, and other characteristics. As policymakers are considering community-based service programs as alternatives to nursing home care, and debating strategies for securing long-term care insurance for larger subsets of the population, greater knowledge of nursing home utilization in Medicaid--the largest insurer of nursing home care--would provide timely information about those who could potentially benefit from alternative forms of care and new long-term care financing strategies.
Past studies based on the National Nursing Home Survey have provided some insight into characteristics of Medicaid nursing home users and patterns of their Medicaid utilization nationally. However, most of these studies were conducted during the 1980s and 1990s and national averages provide little information about how nursing facilities are utilized across the country in Medicaid programs that vary substantially across states. The Medicaid Analytic eXtract (MAX) data system now enables detailed examination of Medicaid nursing home use not just nationally, but for every state and the District of Columbia. This study capitalizes on the enrollment and claims-level information in MAX to characterize people starting new spells of nursing home use, examine how they became eligible for Medicaid nursing home services, and summarize the number and duration of their spells. We examine Medicaid eligibility codes prior to nursing home spells to distinguish new enrollees from persons who were already enrolled in Medicaid at the start of their spell. By comparing the first Medicaid payment date with the nursing home admission date, we are able to distinguish those who may have spent down their assets to become Medicaid eligible from those who were on Medicaid when they were admitted.
Our examination of enrollees beginning spells of Medicaid-financed nursing facility service use between July 1, 2001 and December 31, 2002 in 46 states suggests that:
-
Almost 46 percent of all nursing home users had new spells of nursing home care paid in part by Medicaid during the 18-month period of observation. That almost half of the people utilizing any Medicaid nursing facility services were observed at onset of a new Medicaid-covered spell suggests that there is considerable transition in and out of Medicaid nursing home care--due to death, extended hospital stays, Medicare-covered acute care stays, limited need, or availability of community-based services--over time.
-
The primary eligibility pathways for Medicaid-covered nursing home care nationwide were through the long-term care associated eligibility criteria, which include people qualifying under the 300 percent rule. Almost 48 percent qualified under this long-term care associated eligibility group, 23 percent qualified as a result of Supplemental Security Income receipt, 22 percent qualified under medically needy provisions, and 6 percent qualified under their states poverty criteria.
-
About 64 percent of enrollees with new nursing home spells were already enrolled in Medicaid at the start of their spell whereas 36 percent were new enrollees. The percentage who were new enrollees ranged from 56 percent in New Hampshire to just 17 percent in North Carolina. Those newly enrolled in Medicaid typically qualified for coverage under long-term care associated eligibility criteria (58 percent) or as medically needy (29 percent). We estimate that almost half of new enrollees were already in a nursing home prior to their spell start, most likely because they entered as Medicare skilled nursing facility residents or spent down their savings while institutionalized to become Medicaid eligible.
-
Over half of enrollees beginning Medicaid-financed nursing home spells were already residing in nursing homes when Medicaid began financing part of their stay: 29 percent for 1-6 months, 5 percent for 7-12 months, 7 percent for 13-24 months, and 9 percent for over 2 years.
-
Almost 15 percent of enrollees beginning nursing home spells had more than one spell and almost 2 percent had three or more spells during the observation period. The duration of spells was bimodal, indicating that two distinct types of people utilized Medicaid-covered nursing home care: those needing care for acute conditions and those requiring longer term care.
-
Duration of nursing home spells was negatively associated with availability of community-based services in a state. Oregon, a state with an extensive community-based waiver program, had the smallest percentage of enrollees with spells lasting longer than a year. States with significant community-based programs tended to have a higher percentage of people using community-based services before entering nursing homes.
Summary information about the number of people using Medicaid services, their demographic and eligibility characteristics, how they became eligible for Medicaid, and their patterns of care are provided at state-level detail in the tables of this report.
The breadth of information available in the MAX data system enables far more detailed analyses than could be presented in this report. In this report we focus on characterizing people utilizing services. Several particularly interesting avenues for future research include: an examination of nursing home stays to gain better understanding of how people utilize nursing homes over time; research on patterns of Medicaid expenditures to gain insight into potentially more or less costly service patterns; tracking of nursing home expenditures, rate of utilization, and intensity of utilization over time to better understand expenditure trends; and finally, studies of the effects of state policies, particularly options provided to enrollees for community-based long-term care, on patterns of nursing home utilization among the aged and disabled. Each of these analyses is possible using the data available in MAX.
I. BACKGROUND AND OBJECTIVES
Medicaid is the largest provider of nursing home care in the nation, both in terms of people served and expenditure share. To control rising nursing home costs and better serve an increasing population of elderly and disabled Medicaid enrollees, national and state efforts have been underway for over a decade to shift the balance of long-term care service provision from nursing facilities to the community. As a result of these efforts, the types of enrollees who use long-term care services vary considerably across states and national estimates summarizing patterns of nursing home care provide little insight into how Medicaid nursing home services function within states.
While national and some state-level estimates of nursing home utilization have been available in the past, Medicaid Analytic eXtract (MAX) administrative data now enable detailed examination of Medicaid nursing home use not just nationally, but for each state and the District of Columbia. This study capitalizes on individual and claims-level data available in MAX 2001 and MAX 2002 to examine the characteristics of people beginning spells of Medicaid-financed (receiving any Medicaid financing) nursing facility use in all but five states in the nation. Arizona, District of Columbia, Hawaii, Michigan, and Tennessee are excluded because nursing home utilization could not be accurately estimated for these states using the 2001 and 2002 MAX data files.1 We characterize people starting new spells of Medicaid-financed nursing home use, examine how they became eligible for Medicaid nursing home services, and summarize the number and duration of their spells.
In this chapter we provide the background information needed to interpret our national and state-level estimates. We summarize the role of Medicaid in providing nursing home care to disabled and elderly individuals, describe Medicaid policies that affect who becomes eligible and what types of services are covered, and describe the specific goals of this report.
The Role of Medicaid Nursing Home Services in Long-Term Care
Medicaid covers the largest share of nursing home costs and provides nursing home coverage to the largest number of people in the United States. Over 45 percent of total nursing home expenditures were covered by Medicaid in 2002 (CMS 2006b). An even larger share of nursing home users were covered by Medicaid nationally. A higher share of nursing home users than nursing home expenditures are covered by Medicaid because as payor of last resort, Medicaid often pays only a small share of nursing home costs after Medicare or private insurance coverage have paid to their coverage limits or a patient has contributed his or her own income for the stay. Also, payment limits and reimbursement rates for Medicaid-covered services are typically more stringent than those in place under private long-term care insurance and among those able to pay for services out of pocket.
People entering nursing facilities typically fall into one of two groups: (1) those requiring short-term care following a hospital stay or other acute event; and (2) those requiring longer term nursing facility services. For most aged and many disabled low income people, Medicare finances most short stays in skilled nursing facilities, although Medicaid pays coinsurance and deductible amounts up to the Medicaid fee schedule for such stays. These Medicaid payments will appear in Medicaid claims files but only if Medicaid makes such payments. Because Medicare covers the full cost of nursing facility stays of less than 21 days, estimates based on MAX data alone do not capture many very short stays among dual Medicare and Medicaid enrollees.
With the exception of short stays covered by Medicare, Medicaid nursing home utilization data generally reflect most nursing home service use among low income aged and disabled enrollees nationwide. However, the composition of these low income enrollees receiving nursing home care varies greatly by state as described below.
Medicaid Nursing Home Policies
Nursing home care is a mandatory Medicaid service that states must cover to receive federal matching funds. As a result, all states cover nursing home care for a certain portion of their populations--those with mandatory eligibility--in their Medicaid programs. Most relevant to nursing home care are the aged and disabled-related eligibility groups. With the exception of some individuals living in Section 209(b) states, all state Medicaid programs are required to cover nursing home care for aged or disabled people receiving Supplemental Security Income (SSI) benefits.2
States have the flexibility to set clinical criteria for nursing home admission, cover nursing home care for a wider range of individuals, to cover community-based long-term care as an alternative to nursing home care, and to choose payment methods and reimbursement rates for nursing home services. Nearly all states employ one or more methods to expand eligibility to additional people and to cover optionally covered services. Some states utilize a variety of payment mechanisms.
Eligibility Expansions. States have various options to expand Medicaid eligibility to people not otherwise covered under federal rules. The three main mechanisms for covering populations that commonly utilize nursing homes include:
-
The 300 Percent Rule. States can expand eligibility for only long-term care services to people who meet the clinical criteria for institutionalization and have incomes up to 300 percent of the SSI limit. Many users of nursing home services would not qualify for Medicaid if they were not in a nursing home because their incomes exceed other Medicaid eligibility thresholds. However, states can also choose to provide community services under Section 1915(c) waivers to those who meet the clinical criteria for institutionalization and would meet the 300 percent rule income requirements, but are not institutionalized. States have discretion regarding whom they cover under waiver services. They can, for example, limit the qualifying income level to 200 percent of SSI or less, or target a waiver towards people with specific conditions or in certain age groups. They can also limit the amount of services provided (as described below under Optionally Covered Services), and place individuals on a waiting list.
-
Medically Needy Option. The medically needy provision enables states to provide full-benefits to persons with higher incomes who may have significant medical expenses. If a state elects to set a medically needy threshold, persons with income above the threshold can deduct incurred medical expenses from their income and/or assets--or spend down their income/assets--to determine financial eligibility.
-
Higher Income Threshold. States can choose to cover all aged and disabled with full Medicaid benefits at a higher income threshold up to 100 percent of the poverty level.
Optionally Covered Services. While provision of nursing home care is a mandatory service, provision of most community-based long-term care services--potentially used as an alternative to nursing home care--is optional. For example, expanded home health services and private duty nursing are covered at state option. Additionally, as discussed above, Section 1915(c) waivers enable states to provide Medicaid-financed community-based long-term care for people who would otherwise require Medicaid-covered hospital care, nursing facility care, or care in an intermediate care facility for persons with mental retardation. States that cover a large number of optional community-based services may have fewer people utilizing nursing home services for their long-term care.
Payment Mechanisms and Rates. Long-term care managed care programs are another tool that states can use to manage their long-term care service system. Except for Arizona, few states with managed care long-term care programs covered a significant number of individuals during our 2001 and 2002 study period (Saucier 2005). Arizonas long-term care program covered almost all the states elderly population. A number of states had a Program of All-Inclusive Care for the Elderly (PACE), but these were typically small and covered only several hundred people in each state with one or more PACE programs (National Pace Association 2004).
Table I.1 summarizes the eligibility expansions, optionally covered services, and long-term care managed care programs in place in states in 2001 or 2002. The variability across states in terms of eligibility criteria and coverage options should be kept in mind when interpreting differences in patterns of nursing home utilization across states.
The Goals of This Study
Our goal in this study is to describe patterns of Medicaid nursing home utilization for each state and nationally. We address three specific research questions in this report:
-
What are the characteristics of people who use Medicaid nursing home services?
-
How do people who use Medicaid nursing home services become eligible for Medicaid? What proportion are long-time Medicaid enrollees entering a nursing home? What proportion are new enrollees?
-
How long do Medicaid-covered nursing home spells last and how often do individuals return to nursing homes?
While addressing these questions, we also examine how state long-term care policies are associated with variation across states in patterns of nursing home utilization.
We utilize MAX 2001 and 2002 data files that contain detailed information about Medicaid enrollees and their nursing facility service use in calendar years 2001 and 2002. In the next chapter we describe the MAX data and how it was used to examine spells of nursing facility use in this study. Chapter III presents our analysis results. Chapter IV summarizes the main conclusions of the study and suggests avenues for future research.
| TABLE I.1. Eligibility Expansions for Aged or Disabled Enrollees, Optionally Covered Long-Term Care Services, and Long-Term Care Managed Care Programs in Place in 2001-2002, by State |
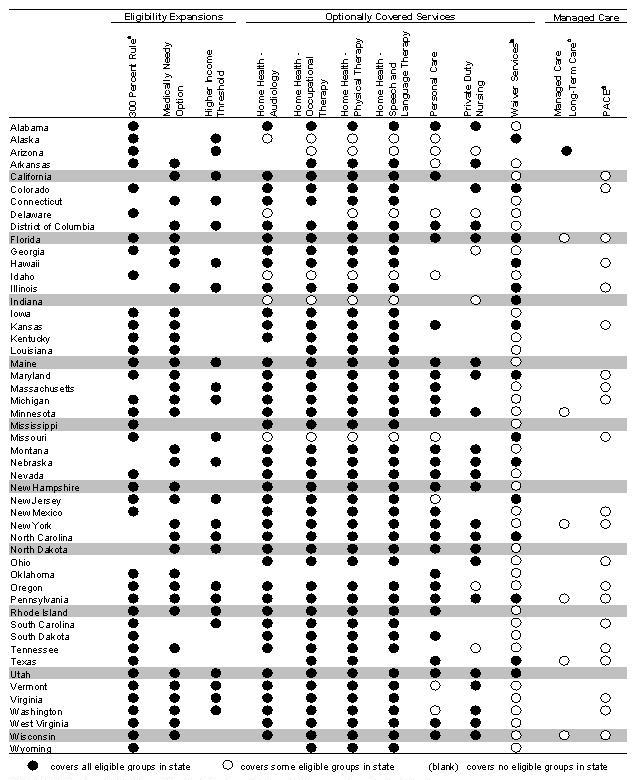 |
SOURCE: Centers for Medicare & Medicaid Services (CMS) 2006a, with the exception of footnoted columns.
|
II. DATA AND METHODS
The MAX enables detailed analyses of Medicaid-financed nursing home care in the United States. The MAX data system contains summary information about demographic and eligibility characteristics of all Medicaid enrollees in the nation and claims information about the Medicaid services they used throughout the year. Unlike more aggregated data sources, MAX can be used to examine population subgroups utilizing services and patterns of nursing home use over time. While surveys of nursing home residents provide important information about how nursing homes function, MAX can be used to construct accurate state-level estimates about people using Medicaid-financed nursing home care, how they qualify for Medicaid nursing home coverage, and the characteristics of their stays. Because Medicaid is the largest insurer of nursing home care in the nation, and because states differ in their Medicaid programs and the people they serve, the administrative data available in MAX are critical to better understanding use of this single most costly service to Medicaid.
Both the MAX data system and its source data--the Medicaid Statistical Information System (MSIS)--are produced by the Centers for Medicare & Medicaid Services (CMS). MSIS consists of data submitted quarterly by states about Medicaid enrollment and claims paid in each state during the federal fiscal year. MAX is a research extract of MSIS and is intended for analytic purposes. MAX consists of person summary files (containing demographic, enrollment, and summary claim information) and claims files that that reflect enrollment and claims for services used by enrollees during each calendar year.3
This chapter summarizes the MAX 2001 and MAX 2002 person-level and nursing home data and how it was used in this study. First we describe the demographic and eligibility information in MAX person summary files. We then provide an overview of MAX claims records and how they were used to construct nursing home spells. The next section summarizes how we constructed our analytic file. We conclude the chapter with an elaboration of the strengths and limitations of MAX data for studying patterns of nursing home use. Two appendices provide supplementary information on MAX data and our methods: the glossary in Appendix A summarizes the operational definitions of study measures and data anomaly notes in Appendix B provide more detail about the limitations of MAX data for each state.
Demographic and Eligibility Measures From the MAX Person Summary Files
MAX Person Summary (PS) files contain demographic and summary eligibility and claims information for each person enrolled in Medicaid during a given year. Demographic characteristics in the PS files include race, gender, date of birth, and date of death. Date of birth enables us to determine the average age of people who begin utilizing nursing home services covered by Medicaid. We supplement date of death information in Medicaid files, which are often unreliable, with those from Medicare eligibility files to summarize discharges from nursing facilities due to death. We use these demographic measures to characterize people who began using Medicaid-covered nursing facility services during our studys observation period.
The eligibility information in MAX PS files includes measures indicating monthly enrollment in the program and how an individual qualified for Medicaid each month. Medicaid enrollees are classified by two eligibility groupings: basis of eligibility (BOE) and maintenance assistance status (MAS). The four BOE groups are children, adults, aged, and disabled. We recode BOE as aged for all people over age 65 because there is significant variation across states and facilities in the frequency with which these categories are updated over time. Disabled enrollees include people of all ages but with our recoding of the BOE aged group, the disabled group in our analyses includes only people who were under 65 in 2002 and became eligible for Medicaid as a result of their disability.
We focus our analysis on aged and disabled enrollees because they represent virtually all users of Medicaid nursing home care.4 Aged and disabled enrollees represented a small percentage of all Medicaid enrollees--about 25 percent in 2002--but were the most costly enrollees, accounting for over 80 percent of Medicaid expenditures during the year (Wenzlow et al. 2007). (See Appendix B for further detail about BOE groups.)
All states provide Medicaid to aged and disabled who qualify for SSI, with the exception of 209(b) states that have a more stringent asset test than required for SSI. Also, as described in Chapter I, nearly all states employ one or more methods to expand Medicaid eligibility to additional people who traditionally use long-term care. The three main approaches states can use to expand eligibility for nursing home users include using the 300 percent rule, setting a higher income threshold, and using the medically needy option. These financial eligibility pathways are measured in MAX using MAS codes.
The MAS classification indicates the primary financial eligibility criteria met by an enrollee in a given month. The five MAS groups--cash assistance-related, poverty-related, medically needy, other, and 1115 demonstration waiver--are summarized in Table II.1. The cash assistance-related, medically needy, and other MAS groups are the most common pathways to eligibility for aged and disabled enrollees. The cash assistance group includes those qualifying because they receive an SSI payment (or state supplement). The medically needy group includes people who satisfy a higher income threshold set by the state (optionally) for this group; people can deduct incurred medical expenses from their income to meet the state medically needy threshold. The third MAS group that is common among aged and disabled is Other, which includes enrollees qualifying under the 300 percent rule that allows individuals with income up to 300 percent of the SSI threshold to qualify for Medicaid assistance for only institutional level of care. Also included in the Other MAS group are mandatory and optional coverage groups not reported under the other MAS groups.5
| TABLE II.1. Medicaid Maintenance Assistance Status Eligibility Groups for Aged and Disabled Enrollees |
| ELIGIBILITY GROUP DESCRIPTION |
| Cash Assistance-Related. Persons receiving SSI benefits or state supplements. |
| Medically Needy. Persons qualifying for Medicaid through the medically needy provision (a state option) that enables states to cover persons with higher incomes who may have significant medical expenses. Persons with income above the medically needy threshold can deduct incurred medical expenses from their income and/or assets--or spend down their income/assets--to determine financial eligibility. |
| Poverty-Related. Persons qualifying through any poverty-related Medicaid expansions enacted from 1988 on. For example, states can elect to extend full Medicaid benefits to otherwise ineligible aged and disabled people up to 100 percent of the federal poverty level. In addition, this group includes people qualifying only as Qualified Medicare Beneficiaries, Specified Low Income Medicare Beneficiaries, or Qualified Individual dual eligibles. For details, see Schneider et al. (2002) or Wenzlow et al. (2007). |
| 1115 Demonstration Waiver. Persons eligible for Medicaid via a state 1115 waiver program that extends benefits to certain otherwise ineligible persons. Some states provide only prescription drug benefits or other limited services to 1115 enrollees, although a few states provide full Medicaid benefits to persons qualifying through 1115 provisions. Many 1115 waivers also have other provisions such as mandatory managed care coverage but the 1115 eligibility group only relates to eligibility extensions. |
| Other. A mixture of mandatory and optional coverage groups not reported under the other MAS groups, including institutionalized aged and disabled qualifying under the 300 percent rule that allows individuals with income up to 300 percent of SSI to qualify for Medicaid assistance for institutional care; those qualifying through home and community-based care waivers; individuals ineligible for SSI due only to their Social Security Disability Insurance (SSDI) benefits, and those covered under more restrictive requirement than SSI standards in Section 209(b) states. |
It should be kept in mind that many factors affect the characteristics of Medicaid programs across states, including their provision of state SSI supplements, existence of a medically needy program, utilization of the 300 percent rule, and the provision of services under Section 1915(c) waivers. Differences in program characteristics, variation in reporting practices, and characteristics of the state population also affect the enrollment characteristics of nursing home residents. Summary statistics for MAS codes capture a composite of these factors but can be used to gain insight into the eligibility pathways nursing-home residents use to qualify for Medicaid coverage.
Finally, Medicaid eligibility information in MAX also includes a quarterly measure of dual Medicare and Medicaid enrollment. Almost all aged Medicaid enrollees also qualify for Medicare coverage while about 41 percent of disabled Medicaid enrollees are dual eligibles. Because Medicare covers some short-term acute care nursing facility services for dual enrollees, such services are not captured in MAX unless Medicaid has made payments for the services. Medicaid will make payments for such nursing facility stays up to the Medicaid fee schedules only if costs remain after Medicare has made payments up to its own coverage limits. Note that some higher income Medicaid enrollees receive only Medicare cost-sharing but do not receive Medicaid services. Although our study includes only enrollees eligible for full Medicaid nursing home benefits at some time during the study period, it is likely that the study population includes people who were eligible for only Medicare cost-sharing at the time they entered the nursing home and who became eligible for full Medicaid benefits during their stay.
The MAX Claims Files and the Construction of Nursing Home Spells
MAX long-term care files contain all Medicaid claims paid for services used by an enrollee and identified as nursing facility claims (Type of Service code 07) by the state. Each nursing facility claim has a begin date and an end date indicating the period of service for which the claim was paid. This information was used to determine whether nursing home services were used in any given month during the study period. Enrollees with a claim paid for a service used for at least one day in a given calendar month were coded as having nursing home utilization during the month. A nursing home spell was defined as a period of continuous months in which at least one claim was paid for at least one day in each month of the series. Breaks in nursing home use that spanned an entire calendar month were identified as multiple spells of nursing home use. For example, if a person had begin and end dates of nursing home service that suggested nursing home use in July, August, September, and November 2001, but no use in June, October, or December 2001, that person was coded as having had two spells, with July, August, and September comprising the first spell, and November comprising the second. Because MAX data were available only through December 31, 2002 at the time of this study, all spells are censored on that date.
To better understand what occurred before and after a person utilized Medicaid-covered nursing facility services, several additional measures available in MAX nursing home claims were examined. Date of initial admission to the nursing facility indicates how long a person has been in a nursing home, regardless of when Medicaid began covering services. The patients discharge status indicates whether an enrollee was discharged from the nursing home to a hospital, another institution, to home or self care, against medical advice, or due to death. Initial admission discharge status provides some indication of the proportion of nursing home users who return to live in the community. Reporting of both admission dates and patient discharge status is incomplete for many states in MAX. National summaries for these measures reflect people for which these data were collected and may not be representative of all nursing facility users.
It is important to understand that while sometimes Medicaid will pay fully for nursing home services, as a payor of last resort, Medicaid may pay only a small portion of total nursing home costs for a stay. In this study we include all claims paid by Medicaid for the nursing home care of enrollees who are eligible for full Medicaid nursing home benefits during the study period. This includes copayments for dual Medicare and Medicaid enrollees for stays lasting 21 days or more that transition to stays that are fully financed by Medicaid.6 It also includes small Medicaid payments for nursing facility stays that are largely financed by a persons SSI or other financial sources.
Analysis Data File Construction
We created a person-level analysis file containing summary information about demographic and enrollment characteristics and longitudinal (monthly) information about eligibility status and nursing facility use for the 18-month period between July 1, 2001 and December 31, 2002. Our analysis was limited to this 18-month period for two reasons. First, nursing home spell observations beginning in the middle of the year enabled the analysis of Medicaid enrollment in the six months prior to the start of Medicaid-covered nursing home spells. This lag enabled us to examine how people became eligible for Medicaid-covered nursing home care. The second reason we used the 18-month observation period was to obtain the largest possible sample of nursing home users in each state while utilizing the most current MAX data available.
The construction of the analysis file for this study required collapsing claims for each individual and merging the resulting summary nursing home spell information with summary demographic and eligibility information available in MAX PS files. It also required merging of data between years 2001 and 2002 of MAX. Some states changed enrollee MSIS individual identifiers (IDs) between years or at other times for certain individuals. To maximize our match rate, we supplemented unique IDs with Social Security numbers (when available) in the matching process to construct our analytic file. Two or more records with the same Social Security number and month of birth were assumed to be for the same person. We created a link file containing new analysis IDs for each individual within a state and utilized these IDs to collapse claim records, merge demographic and enrollment data over the two years, and finally, merge nursing home spell characteristics with the person-level enrollment data. In the District of Columbia, a change in MSIS IDs between 2001 and 2002 resulted in a relatively low match rate between the two years, and as a result, data from District of Columbia were excluded from our analyses.7
Data Strengths and Limitations
MAX can be used for national and state-level analyses of Medicaid nursing home use that are not possible with more aggregated data or survey data. Compared with aggregated data on program characteristics or expenditures, MAX enables analyses of the number of people who actually enrolled in the Medicaid program and utilized a specific service such as nursing home care, by subgroup. Compared with survey data that are typically limited in sample size and period of observation, MAX claim records provide continuous information about Medicaid-covered nursing home use throughout a period for which MAX data are available. Although reporting errors and data anomalies often limit analyses based on administrative files, nursing home services are easily identifiable by place of service when reported by states to MSIS. MAX data for nursing home care in most states is generally thought to be reliable.
Nevertheless, there are some limitations to MAX data for analyses of nursing home use that should be kept in mind when interpreting our results:
-
Information Not Captured in MAX. Some types of information about nursing home service use are not included in MAX:
- Managed Care. Nursing facility use reported here reflects use of services paid under fee-for-service (FFS) arrangements only.8 Nursing facility services are rarely covered under managed care arrangements, with Arizonas program being a notable exception. A number of states had PACE in 2002 but these were typically small and covered only several hundred people in each state (National Pace Association 2004).
- Bulk Payments. Because MAX contains only person-level data, services that are paid (or debited) for multiple individuals in lump sum--for example, services paid for nursing facilities in bulk, some capitated payments, and Disproportionate Share Hospital payments--are not included in the files.
- Services Not Covered by Medicaid. While Medicaid is the primary provider of nursing home care nationally, it is important to keep in mind that other nursing home stays--for example, those covered only by Medicare, private insurance, or by the patient--are not captured in MAX, even for the aged or disabled poor. For example, while Medicare does not cover long-term nursing home care, short rehabilitative stays for acute conditions requiring skilled nursing care are covered. Such stays will not be identified in MAX unless Medicaid made supplementary payments for the stay on behalf of the enrollee.9
Because payments made in bulk and managed care payments are not included in MAX, expenditures for nursing home care can be severely underestimated for states with large long-term care managed care programs or those paying a large portion of their nursing facility expenditures in bulk. However, because many bulk payments are paid over and above services used by individuals, biases in estimates of utilization, the focus of this study, are expected to be less severe. Similarly, even small payments made by Medicaid for services largely covered by Medicare will be identified in our utilization measures. Because low income aged and disabled typically have few alternatives to Medicaid, we expect the estimates in this report to closely match the characteristics of all nursing facility users among aged or disabled enrollees except for those with very short, under 20 day, stays that are fully covered by Medicare.
-
Double Counting of Enrollees. Individuals who use Medicaid services in more than one state are observed as two people living in separate states in MAX. This double counting implies that national measures of Medicaid nursing facility use are overestimated. Similarly, number of nursing facility spells is overestimated and length of spells underestimated both nationally and within a state. However, while movement across states among the general elderly population is common, we expect movement across states among the aged or disabled poor using nursing facility services to be limited and have a small impact on our estimates overall.
-
Censoring. All observations of nursing home spells in our analysis are censored on December 31, 2002. Because we observe people beginning their nursing homes spells at different times (e.g., some in 2001 and others in late 2002), estimates of death rates within the study period, for example, cannot be used to infer the death rate of the population at any given time.
-
Data Anomalies. As with most administrative files of similar size and scope, MAX data contain a variety of known and unknown data anomalies. Inconsistent reporting practices with respect to changes in eligibility status over time, admission dates, and patient discharge status codes limit the generalizations possible from the results presented in this report. A list of data anomalies associated with MAX nursing facility data in 2001 and 2002 is provided in Appendix B.
-
Timeliness of MAX. Due to extensive reporting, data cleaning, and file construction requirements, MAX data are not as current as may be needed to address certain nursing home policy questions. In recent years, while the number of aged and disabled enrollees has increased, the percent of expenditures that are for nursing facility services has declined and the actual expenditure amount has only slightly increased (OBrien 2005) suggesting a reduced utilization rate. The statistics in this report reflect the population and state Medicaid programs in place in 2001 and 2002.
Due to some of the MAX data limitations described above, MAX data for Arizona, District of Columbia, Hawaii, Michigan, and Tennessee were excluded from analyses presented in this report. Appendix B provides detailed information about anomalies that resulted in exclusion of these states as well as known data anomalies in all other states. The analyses presented in the next chapter represent all Medicaid enrollees in the remaining 46 states who had new spells of Medicaid-financed nursing home care between July 1, 2001 and December 31, 2002.
III. CHARACTERISTICS OF PEOPLE WITH NEW MEDICAID-FINANCED NURSING HOME SPELLS AND A DESCRIPTION OF THEIR STAYS
In this chapter we provide a combined national- and state-level characterization of people with new spells of Medicaid-financed nursing home use. We use MAX 2001 and 2002 data to describe the population beginning such spells, how they became eligible for such services, and the length and number of their stays. We first identify individuals that are covered by Medicaid when they either enter nursing homes or as they become eligible for Medicaid coverage while residing in a nursing home. Then we characterize them by their demographic and eligibility characteristics. Next, we examine how people become eligible for their Medicaid-financed nursing home care. We describe the eligibility pathway they used to obtain coverage and what portion of the population was already in a nursing home at the time they enrolled in Medicaid. Finally, we summarize the characteristics of nursing home stays in terms of their frequency and duration of care. These results are based on Medicaid administrative data from all but five states (excluded from analysis are Arizona, District of Columbia, Hawaii, Michigan, and Tennessee), reflecting almost the entire universe of Medicaid enrollees nationwide.
Number of Enrollees with New Medicaid-Financed Nursing Home Spells Between July 2001 and December 2002
The 743,011 persons with new Medicaid-financed nursing home spells identified in this study represent a key subgroup of enrollees--those transitioning into the most costly care for Medicaid--and are the primary focus of this study. This subgroup includes people entering nursing homes (newly or after a period of at least one month outside the nursing home) as well as those in nursing homes when Medicaid begins paying for their stay. These 743,011 persons exclude enrollees from five states and reflect people with new spells of nursing home care receiving Medicaid financing during a non-standard period of 18 months. However, the number of enrollees with new spells identified in any given state in our study can be multiplied by two-thirds to obtain a rough estimate of the number of people with new (and possibly multiple) spells in the state for a one-year period during 2001 and 2002.
Enrollees with new nursing home spells reflect almost 6 percent of all full-benefit aged and disabled enrollees and almost 46 percent of all nursing home users identified in the 46 states between July, 2001 and December, 2002 (Table III.1).10 That almost half of nursing facility users had new spells during the study period suggests that turnover in nursing homes--due to short stays before discharge to the community, death, cycling between home and institutional care, hospitalization, or other factors--is common.
| TABLE III.1. Medicaid FFS Nursing Home Use Among Aged or Disabled Enrollees Eligible for Full Medicaid Benefits Any Time Between July 2001 and December 2002a | ||||||
| Total Number of Aged and Disabled Enrollees | Enrollees With Medicaid-Financed Nursing Home Use | Enrollees With New Medicaid-Financed Nursing Home Spells(Study Population) | ||||
| Number | Percentage of Total | Number | Percentage of Total | Percentage of Enrollees With Any Use | ||
| All 46 States | 11,924,346 | 1,625,698 | 13.6 | 743,011 | 6.2 | 45.7 |
| Alabama | 241,277 | 29,339 | 12.2 | 12,122 | 5.0 | 41.3 |
| Alaska | 21,131 | 999 | 4.7 | 482 | 2.3 | 48.2 |
| Arkansas | 168,305 | 21,996 | 13.1 | 8,541 | 5.1 | 38.8 |
| California | 1,783,219 | 132,731 | 7.4 | 71,609 | 4.0 | 54.0 |
| Colorado | 115,688 | 17,790 | 15.4 | 8,620 | 7.5 | 48.5 |
| Connecticut | 125,842 | 33,946 | 27.0 | 14,455 | 11.5 | 42.6 |
| Delaware | 25,268 | 3,904 | 15.5 | 1,763 | 7.0 | 45.2 |
| Florida | 780,346 | 93,494 | 12.0 | 49,032 | 6.3 | 52.4 |
| Georgia | 367,761 | 45,977 | 12.5 | 20,535 | 5.6 | 44.7 |
| Idaho | 42,405 | 5,890 | 13.9 | 3,215 | 7.6 | 54.6 |
| Illinois | 456,992 | 90,440 | 19.8 | 34,997 | 7.7 | 38.7 |
| Indiana | 214,878 | 46,648 | 21.7 | 21,990 | 10.2 | 47.1 |
| Iowa | 105,656 | 22,952 | 21.7 | 9,469 | 9.0 | 41.3 |
| Kansas | 87,906 | 18,468 | 21.0 | 8,125 | 9.2 | 44.0 |
| Kentucky | 283,056 | 30,109 | 10.6 | 13,897 | 4.9 | 46.2 |
| Louisiana | 264,972 | 35,908 | 13.6 | 15,361 | 5.8 | 42.8 |
| Maine | 96,855 | 10,055 | 10.4 | 5,261 | 5.4 | 52.3 |
| Maryland | 186,847 | 26,141 | 14.0 | 11,729 | 6.3 | 44.9 |
| Massachusetts | 384,415 | 62,187 | 16.2 | 29,725 | 7.7 | 47.8 |
| Minnesota | 175,807 | 39,814 | 22.6 | 17,384 | 9.9 | 43.7 |
| Mississippi | 255,658 | 21,939 | 8.6 | 9,138 | 3.6 | 41.7 |
| Missouri | 278,006 | 44,275 | 15.9 | 20,492 | 7.4 | 46.3 |
| Montana | 32,030 | 6,049 | 18.9 | 2,720 | 8.5 | 45.0 |
| Nebraska | 58,849 | 13,319 | 22.6 | 5,854 | 9.9 | 44.0 |
| Nevada | 47,998 | 5,442 | 11.3 | 2,959 | 6.2 | 54.4 |
| New Hampshire | 31,532 | 8,322 | 26.4 | 3,599 | 11.4 | 43.2 |
| New Jersey | 306,720 | 49,423 | 16.1 | 22,295 | 7.3 | 45.1 |
| New Mexico | 75,703 | 7,744 | 10.2 | 3,597 | 4.8 | 46.4 |
| New York | 1,185,278 | 166,042 | 14.0 | 69,508 | 5.9 | 41.9 |
| North Carolina | 407,991 | 38,948 | 9.5 | 19,484 | 4.8 | 50.0 |
| North Dakota | 22,265 | 6,110 | 27.4 | 2,606 | 11.7 | 42.7 |
| Ohio | 482,377 | 94,356 | 19.6 | 41,519 | 8.6 | 44.0 |
| Oklahoma | 152,411 | 27,378 | 18.0 | 12,886 | 8.5 | 47.1 |
| Oregon | 114,286 | 12,983 | 11.4 | 7,143 | 6.3 | 55.0 |
| Pennsylvania | 627,848 | 88,508 | 14.1 | 39,603 | 6.3 | 44.7 |
| Rhode Island | 55,988 | 9,670 | 17.3 | 3,659 | 6.5 | 37.8 |
| South Carolina | 228,042 | 20,205 | 8.9 | 8,678 | 3.8 | 42.9 |
| South Dakota | 25,848 | 6,635 | 25.7 | 2,697 | 10.4 | 40.6 |
| Texas | 708,864 | 105,624 | 14.9 | 47,936 | 6.8 | 45.4 |
| Utah | 45,272 | 6,262 | 13.8 | 3,139 | 6.9 | 50.1 |
| Vermont | 30,627 | 4,167 | 13.6 | 2,052 | 6.7 | 49.2 |
| Virginia | 225,122 | 30,718 | 13.6 | 14,720 | 6.5 | 47.9 |
| Washington | 235,205 | 25,589 | 10.9 | 13,228 | 5.6 | 51.7 |
| West Virginia | 128,986 | 12,573 | 9.7 | 5,882 | 4.6 | 46.8 |
| Wisconsin | 219,634 | 41,836 | 19.0 | 18,019 | 8.2 | 43.1 |
| Wyoming | 13,180 | 2,793 | 21.2 | 1,286 | 9.8 | 46.0 |
SOURCE: MAX, 2001-2002 for 46 states with representative FFS nursing home data (excludes data from Arizona, District of Columbia, Hawaii, Michigan, and Tennessee).
| ||||||
Table III.1 also suggests there is significant variation across states in the proportion of aged and disabled enrollees using any Medicaid-financed nursing home care and the proportion with new spells of such service use. The percent using such services is associated with the age of the Medicaid population in the state, state Medicaid program characteristics, available nursing facility beds, and many other factors. In Alaska, for example, only 4.7 percent of aged and disabled enrollees used any nursing facility services and only 2.3 percent had a new spell of such service between July 2001 and December 2002. However, Alaskas overall Medicaid population is relatively young--Alaska had a smaller share of aged enrollees (5.8 percent) than any other state except Utah (5.4 percent) in 2002 (Wenzlow et al. 2007). (The national average was 10.7.)11 Conversely, North Dakota and Connecticut, states with the highest proportion of aged and disabled with new spells, also had a higher-than-average percentage of Medicaid enrollees who were aged.
Enrollees from four states--California, Florida, New York, and Texas--made up almost a third of all enrollees with new spells. This should be kept in mind when interpreting national totals presented in this report. We present state-level detail when there are significant differences in the characteristics of users or their service use across states. Supplementary tables with state-level detail are provided in Appendix C. We also identify cases in which we expect our national estimates to vary significantly from those obtained if the five excluded states (Arizona, District of Columbia, Hawaii, Michigan, and Tennessee) were included in our analyses.
Characteristics of People with Medicaid-Financed Nursing Home Spells Between July 2001 and December 2002
Table III.2 provides a summary of the characteristics of all enrollees with new Medicaid-financed nursing home spells during the study period in the 46 states. Of the 743,011 identified enrollees with new nursing home spells, 73.4 percent were non-Hispanic White and 66.4 percent were female. The racial composition of enrollees varied greatly across states (see Appendix Table C.1) and we expect the percentage that were non-Hispanic White nationally to be skewed by the exclusion of Arizona, District of Columbia, and Hawaii. There was also significant variation across states in the percentage that were female, corresponding with the age of the states population and accounted for by higher life expectancy among females than males. Average age was 76 years at the month of each persons first spell of nursing facility service use between July 2001 and December 2002. Over 32 percent of people with new spells were in each of two oldest age groups--32.4 percent were 75 to 84 year olds and 32.3 percent were people age 85 or older--compared with only 19.5 percent who were under age 65.
| TABLE III.2. Characteristics of Aged or Disabled Enrollees with New Medicaid-Financed Nursing Home Spells Between July 2001 and December 2002 | |||||||
| Number of Enrollees with New Spells in All 46 States | Percentage Non-Hispanic White | Percentage Female | Age at Month of First New Medicaid-Financed Nursing Home Spell | ||||
| Average Age | Percentage | ||||||
| Under Age 65 | 64-74 | 75-84 | 85 and Older | ||||
| 743,011 | 73.4 | 66.4 | 76 | 19.5 | 15.8 | 32.4 | 32.3 |
| SOURCE: MAX, 2001-2002 for 46 states with representative FFS nursing home data (excludes data from Arizona, District of Columbia, Hawaii, Michigan, and Tennessee). | |||||||
As shown in Appendix Table C.1, Alaska and Illinois had the youngest populations (average age of 70 and 71, respectively), with over 30 percent of nursing home entrants under age 65 and thus eligible for Medicaid as a result of a disability rather than age. In comparison, North Dakotas enrollees with new spells had the highest average age (80 years). Only 14.4 percent of people with new spells in North Dakota were under age 65 whereas 40.9 percent were age 85 or older.
People with new Medicaid-financed nursing home spells most often qualify under the 300 percent rule or other provisions included in the Other MAS group. Table III.3 presents the percentage of people with new spells who were classified in each of four largest MAS groups among aged and disabled enrollees--Other, cash assistance, medically needy, and poverty-related--grouped by the largest MAS group within the state and ranked by percent of the population in that MAS group. (Appendix Table C.2 includes these and other summary eligibility measures ordered alphabetically by state).
| TABLE III.3. Maintenance Assistance Status in First Month of First Medicaid-Financed Nursing Home Spell Among Aged or Disabled Enrollees Eligible for Full Medicaid Benefits Any Time Between July, 2001 and December, 2002a | |||||
| Total Number of Enrollees | Percentage in Maintenance Assistance (MAS) Group at Start of First Spell | ||||
| Other | Cash Assistance | Medically Needy | Poverty-Related | ||
| States with Largest MAS Group: Other | |||||
| Louisianabc | 15,361 | 87.7 | 0.5 | 11.6 | 0.2 |
| Wyomingc | 1,286 | 87.6 | 0.0 | 9.1 | 0.8 |
| Iowabc | 9,469 | 87.5 | 1.7 | 9.8 | 0.2 |
| Kansasbc | 8,125 | 85.3 | 2.2 | 10.5 | 1.3 |
| South Dakotac | 2,697 | 84.1 | 0.0 | 14.5 | 1.2 |
| Missouric | 20,492 | 83.5 | 0.0 | 14.0 | 1.2 |
| Delawarec | 1,763 | 83.0 | 0.0 | 14.7 | 1.8 |
| Indianad | 21,990 | 80.5 | 0.0 | 18.3 | 0.3 |
| Oregonbc | 7,143 | 80.0 | 0.2 | 17.6 | 0.2 |
| Texasc | 47,936 | 78.1 | 0.1 | 21.4 | 0.4 |
| New Mexicoc | 3,597 | 77.8 | 0.0 | 20.7 | 0.7 |
| Idahoc | 3,215 | 77.4 | 0.0 | 21.6 | 0.8 |
| Oklahomabcd | 12,886 | 77.1 | 0.2 | 12.4 | 9.8 |
| Ohiod | 41,519 | 77.1 | 0.0 | 17.6 | 1.3 |
| Connecticutbd | 14,455 | 76.5 | 15.8 | 6.9 | 0.5 |
| Washingtonbc | 13,228 | 76.4 | 5.6 | 13.9 | 0.9 |
| South Carolinac | 8,678 | 74.7 | 0.0 | 15.6 | 9.6 |
| Vermontbc | 2,052 | 73.2 | 10.3 | 13.8 | 0.0 |
| Virginiabcd | 14,720 | 72.5 | 4.9 | 16.8 | 5.7 |
| Georgiabc | 20,535 | 71.1 | 6.1 | 14.4 | 4.4 |
| Wisconsinbc | 18,019 | 70.9 | 12.7 | 16.0 | 0.2 |
| Nevadac | 2,959 | 70.9 | 0.0 | 25.0 | 2.0 |
| New Jerseybc | 22,295 | 70.3 | 12.2 | 11.9 | 5.4 |
| Arkansasbc | 8,541 | 70.3 | 0.3 | 21.4 | 1.7 |
| Alabamac | 12,122 | 68.0 | 0.0 | 21.1 | 5.9 |
| Utahbc | 3,139 | 67.8 | 8.2 | 14.9 | 9.1 |
| Rhode Islandbc | 3,659 | 66.4 | 5.8 | 27.7 | 0.1 |
| Mississippic | 9,138 | 60.9 | 0.0 | 31.7 | 6.3 |
| Coloradoc | 8,620 | 58.4 | 0.0 | 40.3 | 0.3 |
| Mainebc | 5,261 | 57.2 | 3.8 | 28.3 | 9.3 |
| Kentuckybc | 13,897 | 50.5 | 17.6 | 29.1 | 1.2 |
| Floridabc | 49,032 | 50.1 | 0.2 | 24.1 | 24.7 |
| Alaskac | 482 | 49.4 | 0.0 | 46.5 | 0.0 |
| Pennsylvaniabc | 39,603 | 48.9 | 34.8 | 8.4 | 7.7 |
| All 46 States | 743,011 | 47.7 | 23.1 | 21.8 | 6.3 |
| Massachusettsb | 29,725 | 34.6 | 9.1 | 26.3 | 28.8 |
| States with Largest MAS Group: Cash Assistance-Related | |||||
| Marylandbc | 11,729 | 0.3 | 87.5 | 11.5 | 0.4 |
| North Dakotabd | 2,606 | 0.1 | 87.3 | 12.4 | 0.2 |
| New Yorkb | 69,508 | 0.4 | 74.9 | 24.1 | 0.2 |
| Nebraskab | 5,854 | 0.1 | 70.8 | 15.5 | 13.3 |
| Montanab | 2,720 | 14.3 | 70.2 | 14.0 | 0.0 |
| Illinoisbd | 34,997 | 14.3 | 65.3 | 16.1 | 2.7 |
| New Hampshirebcd | 3,599 | 44.7 | 47.0 | 4.5 | 0.6 |
| Minnesotabcd | 17,384 | 40.3 | 43.1 | 16.2 | 0.3 |
| Californiab | 71,609 | 2.0 | 48.9 | 44.1 | 4.4 |
| State with Largest MAS Group: Medically Needy | |||||
| West Virginiabc | 5,882 | 20.2 | 0.1 | 76.8 | 1.8 |
| State with Largest MAS Group: Poverty-Related | |||||
| North Carolinab | 19,484 | 0.0 | 17.7 | 37.9 | 44.3 |
SOURCE: MAX, 2001-2002 for 46 states with representative FFS nursing home data (excludes data from Arizona, District of Columbia, Hawaii, Michigan, and Tennessee).
| |||||
Table III.3 also includes footnotes indicating whether a state had a medically needy program, utilized the 300 percent rule Medicaid provision, or was a Section 209(b) state. Information about these state program characteristics was obtained from Crowley (2003) and reflects policies in place in October of 2001.
The largest MAS group in each state corresponded with program rules implemented within the state. The 36 states that had Other as their largest MAS group typically utilized the 300 percent rule in their program. Massachusetts, which has a medically needy program but does not use the 300 percent rule, had the most evenly distributed population by MAS group, with over 26 percent in each of Other, medically needy, and poverty-related MAS groups. In nine states, the cash assistance-related group was the largest subgroup of enrollees with new spells. In West Virginia, the most common qualifying group was the medically needy group--almost 77 percent were classified as medically needy. In North Carolina, 44.3 percent of study enrollees were coded in the poverty-related MAS group and another 37.9 percent as medically needy. North Carolina has a medically needy program but its large poverty-related group is due to the state extending full Medicaid benefits to the aged and disabled with incomes under 100 percent of the federal poverty level.
Medicaid Eligibility Pathways for Nursing Home Users
Across the 46 states, 35.7 percent of people with new Medicaid-financed nursing home spells were not enrolled in Medicaid in the two months preceding the start of their spell (Table III.4 and Appendix Table C.3). This subgroup reflects people whose need for nursing facility services prompted Medicaid enrollment. It also includes any persons whose Medicaid enrollment lapsed for over two months prior to the start of their spell.12 The percentage with new spells that were new enrollees ranged from only 16.6 percent in North Carolina to over half the population with new spells in New Hampshire and Montana, indicating large variation across states in number of new Medicaid enrollees receiving nursing facility services.
| TABLE III.4. Maintenance Assistance Status in the Two Months Preceding the First Medicaid-Financed Nursing Home Spells of Aged or Disabled Enrollees Between July 2001 and December 2002a | ||||||
| Total Number of Enrollees | Percentage in Maintenance Assistance (MAS) Group at Start of Spell | |||||
| Not Enrolled | Other | Cash Assistance | Medically Needy | Poverty-Related | ||
| States with Largest Group: Not Enrolled | ||||||
| New Hampshirebcd | 3,599 | 56.2 | 20.1 | 6.8 | 15.6 | 0.8 |
| Montanab | 2,720 | 52.9 | 7.8 | 13.0 | 25.8 | 0.2 |
| Wyomingc | 1,286 | 48.7 | 36.5 | 9.4 | 0.0 | 3.0 |
| North Dakotabd | 2,606 | 48.2 | 0.1 | 14.3 | 35.5 | 1.8 |
| Marylandbc | 11,729 | 47.0 | 0.9 | 15.4 | 32.4 | 3.7 |
| Pennsylvaniabc | 39,603 | 47.0 | 20.6 | 11.7 | 12.4 | 8.2 |
| Utahbc | 3,139 | 46.5 | 23.3 | 13.6 | 4.7 | 11.8 |
| South Dakotac | 2,697 | 46.4 | 30.3 | 17.7 | 0.0 | 5.5 |
| Wisconsinbc | 18,019 | 45.4 | 30.3 | 15.1 | 7.6 | 0.8 |
| Ohiod | 41,519 | 44.0 | 34.2 | 15.8 | 0.0 | 1.6 |
| Floridabc | 49,032 | 43.3 | 17.5 | 21.4 | 1.3 | 16.5 |
| Arkansasbc | 8,541 | 43.1 | 25.4 | 22.7 | 0.4 | 3.9 |
| West Virginiabc | 5,882 | 42.7 | 9.4 | 41.6 | 0.6 | 4.2 |
| Kansasbc | 8,125 | 41.6 | 38.7 | 10.5 | 5.3 | 3.9 |
| Nebraskab | 5,854 | 41.1 | 0.1 | 14.8 | 25.2 | 18.7 |
| Delawarec | 1,763 | 40.6 | 34.4 | 14.4 | 0.0 | 9.8 |
| New Jerseybc | 22,295 | 40.5 | 35.7 | 12.8 | 5.4 | 5.5 |
| Louisianabc | 15,361 | 39.6 | 32.5 | 19.5 | 1.2 | 7.2 |
| Alabamac | 12,122 | 39.3 | 15.6 | 28.5 | 0.0 | 13.6 |
| Oklahomabcd | 12,886 | 39.1 | 38.7 | 13.5 | 0.9 | 7.8 |
| New Mexicoc | 3,597 | 38.6 | 33.2 | 21.8 | 0.0 | 3.7 |
| Missouric | 20,492 | 37.5 | 43.0 | 17.8 | 0.0 | 1.7 |
| Iowabc | 9,469 | 37.2 | 35.1 | 11.8 | 12.3 | 2.8 |
| Minnesotabcd | 17,384 | 37.1 | 23.0 | 15.5 | 22.1 | 2.1 |
| All 46 States | 743,011 | 35.7 | 22.5 | 21.9 | 12.1 | 6.7 |
| Kentuckybc | 13,897 | 35.0 | 26.0 | 28.0 | 6.5 | 4.0 |
| Massachusettsb | 29,725 | 32.0 | 16.2 | 24.3 | 5.1 | 21.1 |
| States with Largest MAS Group: Other | ||||||
| Oregonbc | 7,143 | 32.7 | 46.3 | 16.8 | 1.3 | 0.9 |
| Washingtonbc | 13,228 | 33.6 | 45.1 | 13.5 | 3.1 | 1.3 |
| Indianad | 21,990 | 37.7 | 42.3 | 15.8 | 0.0 | 4.2 |
| Idahoc | 3,215 | 39.0 | 42.1 | 17.4 | 0.0 | 1.5 |
| Virginiabcd | 14,720 | 28.2 | 41.9 | 19.7 | 3.4 | 6.8 |
| Nevadac | 2,959 | 27.8 | 39.6 | 23.1 | 0.0 | 4.6 |
| Connecticutbd | 14,455 | 32.1 | 39.6 | 10.1 | 14.9 | 2.4 |
| South Carolinac | 8,678 | 27.9 | 39.6 | 20.5 | 0.0 | 12.1 |
| Rhode Islandbc | 3,659 | 29.6 | 38.6 | 27.6 | 2.9 | 1.3 |
| Texasc | 47,936 | 33.8 | 38.4 | 22.0 | 0.1 | 5.6 |
| Georgiabc | 20,535 | 33.8 | 37.1 | 17.2 | 3.1 | 5.6 |
| Coloradoc | 8,620 | 33.5 | 34.0 | 30.2 | 0.0 | 1.6 |
| Vermontbc | 2,052 | 28.8 | 30.2 | 15.3 | 14.4 | 0.0 |
| States with Largest MAS Group: Cash Receipt | ||||||
| Alaskac | 482 | 34.6 | 13.9 | 49.8 | 0.0 | 0.2 |
| North Carolinab | 19,484 | 16.6 | 0.0 | 41.7 | 9.0 | 32.7 |
| Californiab | 71,609 | 26.0 | 2.3 | 41.3 | 25.2 | 4.9 |
| Mississippic | 9,138 | 21.4 | 26.0 | 29.1 | 0.0 | 23.4 |
| Mainebc | 5,261 | 23.4 | 15.7 | 26.4 | 8.5 | 12.9 |
| States with Largest MAS Group: Poverty-Related | ||||||
| New Yorkb | 69,508 | 30.8 | 0.5 | 27.2 | 40.2 | 0.2 |
| Illinoisbd | 34,997 | 33.5 | 8.8 | 14.9 | 37.8 | 2.1 |
SOURCE: MAX, 2001-2002 for 46 states with representative FFS nursing home data (excludes data from Arizona, District of Columbia, Hawaii, Michigan, and Tennessee).
| ||||||
Transitions in eligibility status at the start of spells of nursing home care can further indicate the types of new enrollees that Medicaid served in nursing facilities. Among the 35.7 percent of people with new Medicaid-financed nursing home spells who were not enrolled in Medicaid in the months prior to the start of their spell, 58.3 percent qualified under the Other MAS group, 29.0 percent as medically needy, 6.3 percent in the cash assistance group, and 4.6 percent in the poverty MAS group at the start of their first spell (Figure III.1).
The remaining 64.3 percent of enrollees with new spells were already enrolled in Medicaid when their spell began: 22.5 percent had Other MAS codes, 21.9 percent qualified on the basis of their receipt of cash assistance, 12.1 were medically needy, and 6.7 had poverty-related MAS codes (Table III.4). As shown in Figure III.1, most of these individuals had no change in their MAS status upon beginning their nursing home spells. This diverse group includes people previously covered by Medicaid who: (a) had not previously been in a nursing home, (b) had been in a nursing home but Medicaid did not previously pay for their stay, or (c) had already received nursing home care covered by Medicaid but had left the nursing facility for a full calendar month (for example, to a hospital or to the community). We investigate the composition of enrollees with new spells in terms of their pre-spell Medicaid enrollment and nursing facility use further below.
| FIGURE III.1. Transitions in Maintenance Assistance Status at the Start of First Medicaid-Financed Nursing Home Spell Between July 2001 and December 2002 |
 |
| SOURCE: MAX, 2001-2002, for 46 states with representative FFS nursing home data (excludes data from Arizona, District of Columbia, Hawaii, Michigan, and Tennessee). |
Nursing home admission dates in MAX can be used to examine the percentage of enrollees who were already in a nursing facility when Medicaid payment began. Valid admission dates were available for most people in 28 states; those with valid dates represented 51.6 percent of the 743,011 enrollees with new Medicaid-financed nursing home spells. We estimate that over half of enrollees beginning new nursing home spells were already residing in the nursing home when their Medicaid financing began: 29.1 percent for 1-6 months, 5.0 percent for 7-12 months, 7.2 percent for 13-24 months, and 9.2 percent for over 2 years (Table III.5).
Notably, 14.3 percent of enrollees with new spells were already in the nursing home at spell start and were not enrolled in Medicaid during the six months prior to their spell. Most likely, these individuals were receiving coverage for their care from another source--for example, Medicare or under private insurance--and spent down their savings to become eligible for Medicaid. (They comprise 47.3 percent, or almost half, of all persons with no enrollment in the previous six months.) The remaining 36.2 percent of enrollees already in nursing homes at spell start include dual Medicare and Medicaid enrollees whose initial stays were covered by Medicare.
| TABLE III.5. Medicaid and Non-Medicaid Nursing Home Use Prior to Medicaid-Financed Nursing Home Spells Starting Between July 2001 and December 2002 Among People with Valid Admission Dates | |||||||
| Number of Enrollees | Percentage in Nursing Home Prior to Spell Start | Months in Nursing Facility Prior to First Spell Start | Percentage in Nursing Home Prior to Spell Start & No Medicaid Enrollment in Previous 6 Months | ||||
| 0 | 1-6 | 7-12 | 13-24 | 25+ | |||
| 383,516 | 50.5 | 49.5 | 29.1 | 5.0 | 7.2 | 9.2 | 14.3 |
| SOURCE: MAX, 2001-2002, for 46 states with representative FFS nursing home data and valid admission dates (excludes data from Arizona, District of Columbia, Hawaii, Michigan, and Tennessee and 48.4 percent of enrollees in the remaining states). | |||||||
State-level information about transitions in MAS group at the start of Medicaid-financed nursing home spells is provided in Appendix Table C.4 and Table C.5. States that differed notably from the national average included Maryland, New York, and North Dakota, in which a significant number of individuals in MAS groups Other and cash assistance-related transitioned to medically needy status at the beginning of their nursing home spell. (For state-level detail about Medicaid enrollment and nursing facility use prior to the start of spells, see Appendix Table C.6).
Number and Length of Medicaid-Financed Nursing Home Spells
To better understand how people use Medicaid-financed nursing home care, we examined the characteristics of spells for enrollees that began their first spell between July 2001 and December 2001 and observed patterns of use through the end of 2002. Table III.6 shows the percentage of the study population that had more than one spell, the distribution of number of spells, and duration of their first spell measured as a median and as a percentage of spells that lasted 1-3 months, 4-6 months, 7-9 months, 10-12 months, and over a year.
Almost 15 percent of enrollees in all our sample states had more than one spell and almost 2 percent had three or more spells during the observation period. There was significant variation across states. Massachusetts and Vermont had the highest percentage with two or more spells (21.1 percent and 20.4 percent, respectively) during the observation period. It should be noted, however, that number of spells observed in the censored study period depends on the length of peoples first stays. Shorter first spells result in a longer period in which subsequent spells can be observed. In both Massachusetts and Vermont, a larger than average percent utilizing services had stays of only 1-3 months. Vermont ranks 33rd in the country in the number of nursing home beds available per enrollee over age 64 (Houser, Fox-Grage, Gibson 2006) potentially contributing to the short average length of first stay and thus to the frequency of nursing home spells among enrollees in the state.
| TABLE III.6. Number and Length of Nursing Home Spells Among Aged or Disabled Medicaid Enrollees with New Medicaid-Financed Nursing Home Spells Between July 2001 and December 2001a | ||||||||||
| Number of Enrollees | Percentage with More than One Spell Between 7/2001 and 12/2002 | Censored Distribution of Number of Spells (Percent)a | Median Length of First Spell | Distribution of Length, in Months, of First Spell (Percent) | ||||||
| 2 Stays | 3 or More Stays | 1-3 | 4-6 | 7-9 | 10-12 | 13+ | ||||
| All 46 States | 251,333 | 14.6 | 12.7 | 1.9 | 8 | 32.6 | 13.1 | 7.5 | 5.3 | 41.6 |
| Alabama | 4,244 | 12.4 | 11.5 | 0.9 | 12a | 25.7 | 11.8 | 7.6 | 4.9 | 50.0 |
| Alaska | 173 | 11.6 | 9.8 | 1.7 | 5 | 38.2 | 15.0 | 10.4 | 3.5 | 32.9 |
| Arkansas | 2,935 | 10.2 | 9.4 | 0.8 | 13a | 24.9 | 12.2 | 7.1 | 5.5 | 50.4 |
| California | 24,378 | 15.6 | 13.6 | 2.0 | 4 | 44.1 | 13.2 | 6.5 | 4.5 | 31.7 |
| Colorado | 3,007 | 17.8 | 15.1 | 2.7 | 8 | 31.1 | 15.1 | 8.4 | 6.3 | 39.1 |
| Connecticut | 4,774 | 17.3 | 15.2 | 2.1 | 8 | 35.9 | 11.4 | 6.5 | 4.4 | 41.9 |
| Delaware | 532 | 18.8 | 17.5 | 1.3 | 10 | 21.2 | 15.8 | 12.6 | 6.2 | 44.2 |
| Florida | 15,857 | 12.9 | 11.2 | 1.7 | 6 | 39.0 | 13.7 | 7.0 | 4.7 | 35.7 |
| Georgia | 7,130 | 16.5 | 14.7 | 1.9 | 10 | 25.6 | 14.6 | 8.3 | 6.3 | 45.3 |
| Idaho | 1,031 | 17.2 | 14.6 | 2.5 | 6 | 37.7 | 15.0 | 9.1 | 5.4 | 32.7 |
| Illinois | 11,166 | 13.7 | 11.5 | 2.2 | 9 | 29.4 | 13.8 | 8.1 | 5.3 | 43.5 |
| Indiana | 7,405 | 18.9 | 16.4 | 2.6 | 8 | 31.7 | 13.0 | 7.7 | 5.6 | 42.0 |
| Iowa | 3,223 | 11.6 | 10.2 | 1.5 | 13a | 23.9 | 10.3 | 7.6 | 5.7 | 52.6 |
| Kansas | 2,809 | 16.0 | 13.8 | 2.2 | 10 | 27.7 | 12.7 | 8.5 | 6.6 | 44.5 |
| Kentucky | 4,605 | 14.0 | 12.2 | 1.7 | 8 | 30.5 | 14.5 | 7.7 | 6.1 | 41.2 |
| Louisiana | 5,404 | 16.1 | 14.4 | 1.7 | 11 | 24.7 | 13.3 | 9.5 | 5.9 | 46.6 |
| Maine | 1,787 | 14.5 | 12.4 | 2.1 | 5 | 42.5 | 12.6 | 6.3 | 4.1 | 34.5 |
| Maryland | 3,890 | 12.9 | 11.4 | 1.5 | 11 | 26.8 | 12.3 | 7.7 | 6.3 | 46.9 |
| Massachusetts | 10,649 | 21.1 | 17.5 | 3.6 | 6 | 39.2 | 12.5 | 6.4 | 5.2 | 36.7 |
| Minnesota | 6,169 | 15.2 | 12.7 | 2.5 | 8 | 33.9 | 13.0 | 6.9 | 5.0 | 41.2 |
| Mississippi | 3,042 | 12.5 | 11.3 | 1.2 | 12 | 27.6 | 11.5 | 7.1 | 5.1 | 48.6 |
| Missouri | 7,027 | 15.6 | 13.3 | 2.3 | 8 | 33.5 | 13.1 | 7.5 | 5.0 | 40.9 |
| Montana | 901 | 12.5 | 10.8 | 1.8 | 10 | 31.4 | 11.3 | 6.7 | 5.8 | 44.8 |
| Nebraska | 2,019 | 14.3 | 12.7 | 1.6 | 8 | 32.8 | 11.8 | 7.8 | 6.0 | 41.6 |
| Nevada | 1,011 | 14.4 | 11.9 | 2.6 | 6 | 38.6 | 13.1 | 6.7 | 5.0 | 36.6 |
| New Hampshire | 1,208 | 12.2 | 10.6 | 1.6 | 12 | 27.4 | 12.0 | 7.1 | 4.8 | 48.7 |
| New Jersey | 7,412 | 15.4 | 13.5 | 1.9 | 10 | 26.7 | 14.0 | 8.6 | 6.2 | 44.5 |
| New Mexico | 1,261 | 14.5 | 12.4 | 2.1 | 8 | 32.6 | 13.5 | 7.4 | 5.2 | 41.3 |
| New York | 22,261 | 12.4 | 10.9 | 1.5 | 9 | 29.6 | 13.4 | 7.1 | 5.1 | 44.8 |
| North Carolina | 6,920 | 14.5 | 13.1 | 1.4 | 6 | 40.4 | 11.7 | 7.0 | 4.3 | 36.6 |
| North Dakota | 896 | 11.7 | 10.6 | 1.1 | 12 | 27.6 | 9.0 | 8.3 | 5.4 | 49.8 |
| Ohio | 14,025 | 13.7 | 11.6 | 2.1 | 8 | 33.6 | 12.3 | 6.9 | 4.8 | 42.4 |
| Oklahoma | 4,710 | 17.4 | 14.6 | 2.8 | 7 | 36.8 | 12.6 | 7.4 | 6.1 | 37.2 |
| Oregon | 2,452 | 9.7 | 8.5 | 1.2 | 4 | 49.4 | 12.0 | 6.5 | 4.7 | 27.4 |
| Pennsylvania | 13,494 | 14.4 | 12.9 | 1.5 | 11 | 24.2 | 13.1 | 8.8 | 6.0 | 47.9 |
| Rhode Island | 1,263 | 13.9 | 12.2 | 1.7 | 9 | 30.5 | 13.6 | 7.3 | 4.1 | 44.5 |
| South Carolina | 2,843 | 13.0 | 11.7 | 1.3 | 7 | 36.1 | 11.9 | 7.0 | 5.0 | 39.9 |
| South Dakota | 897 | 12.3 | 10.5 | 1.8 | 11 | 30.1 | 10.7 | 6.9 | 4.0 | 48.3 |
| Texas | 16,187 | 12.2 | 11.1 | 1.1 | 12 | 24.5 | 13.0 | 8.1 | 5.8 | 48.5 |
| Utah | 1,081 | 15.9 | 14.5 | 1.4 | 7 | 35.2 | 14.6 | 8.8 | 6.4 | 35.1 |
| Vermont | 672 | 20.4 | 18.2 | 2.2 | 6 | 38.7 | 12.6 | 6.7 | 4.8 | 37.2 |
| Virginia | 5,048 | 16.7 | 15.1 | 1.6 | 9 | 28.2 | 14.9 | 8.8 | 5.8 | 42.3 |
| Washington | 4,922 | 13.9 | 12.4 | 1.5 | 5 | 41.6 | 14.4 | 7.7 | 5.2 | 31.1 |
| West Virginia | 2,018 | 16.2 | 14.2 | 2.0 | 10 | 27.0 | 13.4 | 8.1 | 7.2 | 44.4 |
| Wisconsin | 6,154 | 13.3 | 11.6 | 1.7 | 9 | 30.9 | 12.8 | 7.1 | 5.2 | 44.1 |
| Wyoming | 441 | 16.3 | 14.7 | 1.6 | 7 | 33.1 | 15.2 | 7.0 | 3.4 | 41.3 |
SOURCE: MAX, 2001-2002, for 46 states with representative FFS nursing home data and valid admission dates (excludes data from Arizona, District of Columbia, Hawaii, Michigan, and Tennessee and 48.4 percent of enrollees in the remaining states).
| ||||||||||
Nationally, the duration of spells shows a bimodal distribution reflective of the two different types of people who enter nursing homes--people needing nursing home care for acute conditions and those requiring longer term care. Of all persons starting spells between July and December 2001, 41.6 percent had first spells lasting over a year, 32.6 percent lasting only 1-3 months, and 13.1 percent and 7.5 percent lasting 4-6 months and 7-9 months, respectively. Connecticut was the only state with percentage with the shortest stays and longest stays both exceeding the national average. However, the age distribution of the study population in Connecticut mimicked this bimodal character, potentially explaining these results.
Short stays can indicate care for rehabilitative care for acute services or they can indicate entry into a nursing home near the end of life. We find that relative to people with longer stays, far fewer people with 1-3 month stays were known to have been discharged from a nursing facility due to death (24.1 percent of people with valid discharge status codes compared with 33.7 percent for people with 4-6 month long stays, 43.5 for 7-9 month stays, and 46.4 for stays of 10-12 months) (results not shown).13 Another 20 percent of each group were discharged or transferred to a hospital. This suggests that a majority of persons with short spells were short-term users of nursing homes rather than end of life entrants.
Many enrollees with short stays only need short-term nursing facility services or can utilize long-term care services provided in the home or community. About 45 percent of people with short (1-3 month) stays and valid discharge status codes were discharged to home or self care compared with only 27 percent of those with 4-6 month spells and less than 19 percent of those with longer spells (results not shown). Another 1.7 percent was discharged to home health agency care. Due to poor reporting of discharge status codes, these summary statistics are only suggestive but support the hypothesis that at least half of short acute stays result in release to the community. While some of these individuals may be using community-based long-term care services, others may be using no long-term care services after discharge.
Length of stay was associated with the age distribution of the study population as well as the provision of community-based long-term care services in a state. Arkansas, Alabama, North Dakota, and New Hampshire had the largest percentage with stays lasting over a year (50.4, 50.0, 49.8, and 48.7 percent, respectively). Each of these states had higher-than-average percent of enrollees with new spells among the oldest aged group (85 and older). Notably, Oregon had the smallest percentage of enrollees with spells lasting longer than a year. The study population in Oregon is younger than average, but also potentially significant, Oregon covers extensive community-based waiver services in its Medicaid program.
Although the MAX data measuring community-based long-term care services are incomplete for fourteen states in 2002, data for the remaining states can be used to examine the association between spell length and community-based service use more generally. Figure III.2 and Figure III.3 show the relationship between the percentage of people with new spells that have short (1-3 month) first spells and the percentage of long-term care expenditures and utilization that were for community-based services, respectively, in each of 36 states with reliable data. The figures suggest that a higher balance of community-based relative to institutional-based service expenditures and use is associated with shorter nursing home spells.
| FIGURE III.2. Association Between Percentage of Aged Long-Term Care Expenditures That Were for Community-Based Services in 2002 and Length of Spells |
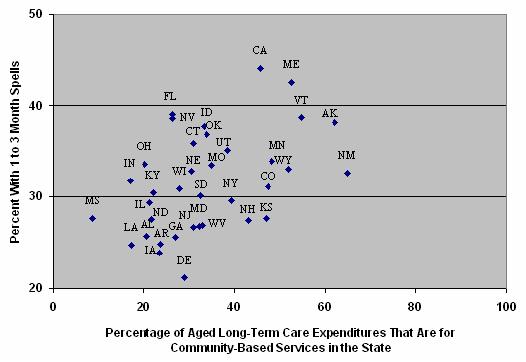 |
| SOURCE: MAX, 2001-2002, for 36 states with valid long-term care data. |
A similar pattern is evident across states between the availability of community-based long-term care services and fewer long spells. For example, California, Maine, Massachusetts, and Washington State have large community-based long-term care programs and also have lower-than-average percentage of nursing home users with stays lasting more than one year.
State-level data about community-based long-term care service use and expenditures can also be used to examine the extent to which nursing home residents used community-based long-term care services prior to entering a nursing home. Of those who remained in the nursing home at the end of the study period or who died during their stay, 20.2 percent used Medicaid community-based long-term care services prior to admission (data not shown). People with no prior community-based service use include people admitted due to precipitating events, such as a sudden illness or the loss of a family care giver, and new enrollees. Moreover, many states limit community-based waiver eligibility and service amounts, so that persons who qualify for nursing home services at a given time may not qualify for any Medicaid coverage while living in the community. States with significant community-based programs tended to have a higher percentage of people using community-based long-term care services prior to nursing home admission--for example, Maine (36.8 percent), New York (30.2 percent), and California (25.6 percent). States that spent little on home or community-based services in 2002 had much lower percentages using community-based care--for example, North Dakota (12.5 percent), Louisiana (9.6 percent), and Maryland (9.1 percent).
| FIGURE III.3. Association Between Percentage of Aged Long-Term Care Enrollees That Used Community-Based Services in 2002 and Length of Spells |
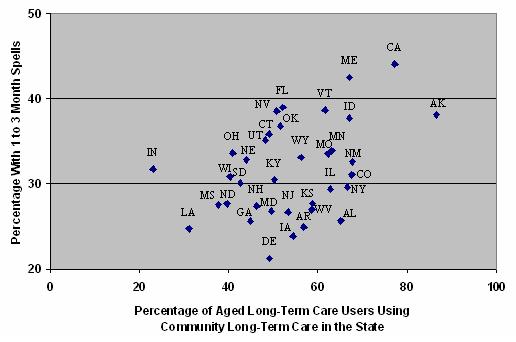 |
| SOURCE: MAX, 2001-2002, for 36 states with valid long-term care data. |
It should be noted, however, that the observed correlations may be due to the populations age distribution or other factors associated with both state policies and community-based service use or nursing home stay length. Causal relationships cannot be inferred from the observed associations. Nevertheless, further research examining the relationship between frequency and duration of nursing home use, use of community-based long-term care services, and state policies is warranted. Due to limitations of community-based long-term care data in MAX described in Wenzlow, Schmitz & Shepperson (2008), national estimates of community-based long-term care use reflecting all states are currently not feasible using these data.14
IV. SUMMARY AND DIRECTIONS FOR FUTURE RESEARCH
In this report we utilize MAX person summary files and nursing facility claims data to examine the characteristics and patterns of nursing home care of aged and disabled Medicaid enrollees newly utilizing Medicaid-covered nursing facility services between July 1, 2001 and December 31, 2002. This analysis provides the most detailed summary information currently available about patterns of Medicaid-covered nursing facility care in almost every state in the nation. In this chapter we briefly summarize the key findings of the study and what we view are particularly fruitful areas for future research.
Summary of Key Results and Their Policy Implications
Enrollees beginning nursing home spells with Medicaid financing reflect almost 46 percent of all nursing home users identified during our study period in 46 states. These people include long-time Medicaid enrollees newly entering nursing homes, repeat users, and new Medicaid enrollees. That almost half of the people utilizing any Medicaid-covered nursing facility services were observed at the beginning of a new spells during the study period suggests that there is considerable transition in and out of Medicaid-covered nursing home care. Such transitions may be due to death, hospitalization, Medicare-covered skilled nursing facility stays, limited need, or availability of community-based services.
People with new spells of Medicaid-financed nursing facility use during our study period tended to be among the oldest Medicaid enrollees: 32.9 percent were 75-84 years old and 32.3 percent were 85 or older compared with only 19.5 percent who were disabled enrollees under age 65 (average age was 76 years). Their demographic characteristics corresponded with those of people with long life expectancy--73.4 percent were non-Hispanic White and 66.4 percent were female. The demographic characteristics of people with new spells varied considerably across states, with average age at spell start ranging from 70 in Alaska to 80 in North Dakota.
The primary eligibility pathways for Medicaid-covered nursing home care nationwide were through the long-term care associated eligibility criteria grouped into the Other MAS group, which includes people qualifying under the 300 percent rule. During their first observed spell of service use, 47.7 percent qualified under the Other MAS group, 23.1 percent qualified through the traditional SSI receipt MAS group, 21.8 percent qualified under medically needy provisions, and 6.3 percent qualified under their states poverty criteria. The primary eligibility pathway for people within a state corresponded with program rules--for example, use of the 300 percent rule--implemented in the state.
New Medicaid enrollees made up 36 percent of all people beginning spells of Medicaid-covered nursing home service use during the 18-month observation period. Those newly enrolled in Medicaid typically qualified via the Other maintenance assistance group (58.3 percent) or as medically needy (29.0 percent). We also find that about 14 percent of enrollees with new spells were already in a nursing home at spell start and were new enrollees based on a more stringent six month look-back period. This suggests that at least 47 percent of new enrollees were already in a nursing home and presumably spent down their savings while institutionalized to become Medicaid eligibles.
People already enrolled in Medicaid prior to a given spell (64 percent) typically remained in the same eligibility group at the start of their spell. No change in eligibility may reflect true eligibility status but may also be due to infrequent updating of eligibility information on enrollee records over time. This limits the utility of examining transitions in MAS codes in MAX over a period of enrollment.
Frequency and duration of spells for these enrollees indicates the intensity and type of nursing home care that may be needed over a longer time period. Almost 15 percent of enrollees beginning nursing home spells had more than one spell and almost 2 percent had three or more spells during the observation period. The duration of spells was bimodal, indicating that two distinct types of people utilized Medicaid-covered nursing home care: those needing care for acute conditions and those requiring longer term care. Of people beginning spells, 32.6 percent had first spells lasting only one to three months whereas 41.6 percent had first spells lasting over a year. The distribution of first spell characteristics was associated with the age distribution of the population and varied considerably across states. The length of spells was negatively associated with availability of community-based services in a state. Oregon, a state with an extensive community-based waiver program, had the smallest percentage of enrollees with spells lasting longer than a year. While this suggests a strong relationship between community-based provisions in a state and short nursing home stays, many other factors--for example, the populations age distribution--may be driving this association and further investigation of the impact of long-term care policies and nursing home use is warranted.
Some caveats to our analyses should be kept in mind when interpreting our findings. The national estimates described above are based on data from 46 states. While we believe they are representative of the general population using Medicaid nursing home services in 2001 and 2002, people in Arizona, District of Columbia, Hawaii, Michigan, and Tennessee are not reflected. To the extent that they differ from the national average, our estimates are biased. We expect improvements in MSIS data reporting appearing in MAX 2003 (now available) to enable the inclusion of these states in future Medicaid-covered nursing home utilization analyses. Further improvements to MAX encounter data more generally will enable the analysis of nursing home services covered under managed care.
Also, as noted above, our analyses are descriptive and do not address the variety of factors that affect individuals nursing home use--including, for example, state and federal policies, population compositions, and available family and community resources. More detailed analyses that take these factors into account are required to better understand why states differ in how their Medicaid enrollees utilize nursing home services.
Directions for Future Research
MAX data provide a tool for gaining a far better understand of patterns of Medicaid-financed nursing home care than is currently available. These data can be used to examine how nursing home use is affected by state Medicaid policies, such as use of community-based waivers, and to project Medicaid nursing facility use over time. Nevertheless, some improvement in MAX in future years could greatly enhance its utility for understanding long-term care utilization:
-
Specificity in Eligibility Pathways. Further specification of the eligibility pathways within the Other MAS eligibility grouping would enable a better understanding of how people become eligible for Medicaid services and how enrollment take-up rates are associated with state programs. The Other eligibility group includes a wide-range of financial eligibility types but applies to most people using nursing homes. More specificity for the Other MAS group would be desirable and potentially possible with currently available state-specific eligibility codes in MAX.
-
Community Long-Term Care Reporting. Reporting of community-based long-term care services is still incomplete in MAX 2002 (see Wenzlow, Schmitz & Shepperson (2008)). Improvements in data reporting and enhancements to community-based service measures in MAX are needed before these data can reach their potential to be the gold standard for capturing the effects of long-term care rebalancing efforts across the nation.
While some improvements in MAX are warranted, the currently available MAX data enable extensive analyses of patterns of Medicaid-financed nursing home care. Several particularly interesting avenues for future research based on MAX data include:
-
More Detailed Characterization of Nursing Home Stays. The results presented in this report suggest that instead of being an end of life event, many nursing home stays are short, lasting only several months. A characterization of these stays, including an examination of length of time between two given spells among people with more than one spell, would enable a better understanding of people use Medicaid nursing home care.
-
Patterns of Medicaid Nursing Home Expenditures. While aggregate Medicaid nursing home expenditures are available from other data sources, MAX enables analyses of how Medicaid nursing home expenditures vary by subgroup--for example, how they differ between aged and disabled enrollees or between people with short stays and those with long stays--in each state. MAX could also be used to examine variation in the proportion of nursing facility charges that are paid by Medicaid across subgroups.
-
Tracking Medicaid Nursing Home Expenditures and Service Use Over Time. Recent research has suggested that nursing home expenditure growth has slowed. However, a variety of factors may contribute to this change over time, including changing rates of utilization, intensity of utilization, and cost of care. MAX data, now available for years 1999-2003, could be used to track not only Medicaid expenditures, but frequency and intensity of utilization over time.
-
Effect of Community-Based Long-Term Care Policies on Nursing Home Utilization and Expenditures. Our results are suggestive of a relationship between state provision of community-based services and utilization of Medicaid-financed nursing home care. Further research is needed to better understand what programs work to reduce demand for costly nursing home services. Variation in state policies combined with the breadth of data available in MAX over time make such studies feasible using MAX data.
These topic areas illustrate the wide-ranging potential utility of MAX data for furthering our understanding of Medicaid nursing home care.
REFERENCES
Centers for Medicare & Medicaid Services (CMS). Medicaid-at-a-Glance 2002: A Medicaid Information Source. Washington, DC: U.S. Department of Health and Human Services, CMS, Center for Medicaid and State Operations, Publication No. CMS-11024-02. Accessed June 2006a at [http://www.hhs.gov/od/documents/MA2002.pdf].
Centers for Medicare & Medicaid Services (CMS). National Health Expenditures by Type of Service and Source of Funds, CY 1960-2004. Washington, DC: U.S. Department of Health and Human Services, CMS, Office of the Actuary, National Health Statistics Group. Accessed August 2006b at [http://www.cms.hhs.gov/NationalHealthExpendData/downloads/tables.pdf].
Crowley, Jeffrey S. Medicaid Medically Needy Programs: An Important Source of Medicaid Coverage. Issue Paper no. 4096, Washington, DC: Kaiser Commission on Medicaid and the Uninsured, January 2003. Accessed July 23, 2007, at [http://www.kff.org/medicaid/4096-index.cfm].
Houser, Ari, Wendy Fox-Grage, and Mary Jo Gibson. Across the States: Profiles of Long-Term Care and Independent Living. AARP Public Policy Institute, 2006. Accessed July 2007 at [http://www.aarp.org/acrossthestates].
Kitchener, Martin, Terence Ng, and Charlene Harrington. Medicaid 1915(c) Home and Community-Based Service Programs: Data Update. Issue Paper no. 7575, Washington, DC: Kaiser Commission on Medicaid and the Uninsured, December 2006. Accessed May 2007 at [http://www.kff.org/medicaid/7575.cfm].
National PACE Association. ASAP Guidebook. Alexandria, VA: National PACE Association, March 2004. Accessed June 15, 2007, at [http://www.npaonline.org/website/article.asp?id=119].
OBrien Ellen. Long-Term Care: Understanding Medicaids Role for the Elderly and Disabled. Washington, DC: Kaiser Commission on Medicaid and the Uninsured, November 2005. Accessed June 12, 2007, at [http://www.kff.org/medicaid/7428.cfm].
Schneider, Andy, Risa Elias, Rachel Garfield, David Rousseau, and Victoria Wachino. The Medicaid Resource Book. Washington, DC: Kaiser Commission on Medicaid and the Uninsured, July 2002.
Saucier, Paul. Medicaid Managed Long-Term Care. AARP Public Policy Institute Issue Brief, Washington, DC: AARP Public Policy Institute, November 2005. Accessed June 14, 2007, at [http://assets.aarp.org/rgcenter/il/ib79_mmltc.pdf].
Wenzlow, Audra T., Dan Finkelstein, Ben Le Cook, Kathy Shepperson, Christine Yip, and David Baugh. The Medicaid Analytic eXtract Chartbook. Baltimore, MD: Centers for Medicare & Medicaid Services, 2007. Accessed June 15, 2007, at [http://www.cms.hhs.gov/MedicaidDataSourcesGenInfo/Downloads/MAX_Chartboo....
Wenzlow, Audra T., Robert Schmitz, Kathy Shepperson. A Profile of Medicaid Institutional and Community-Based Long-Term Care Service Use and Expenditures Among the Aged and Disabled Using MAX 2002: Final Report. Washington, DC: U.S. Department of Health and Human Services, Office of Disability, Aging and Long-Term Care Policy, 2008. Accessible at [http://aspe.hhs.gov/daltcp/reports/2008/profileMAX.htm]
APPENDIX A. GLOSSARY TO TERMS
This glossary summarizes the operational definitions of terms used in this report. For more general definitions of Medicaid terms, see Schneider et al. (2002).
1115 Demonstration Waiver (MAS Group) = a maintenance assistance status (MAS) group that consists of people eligible for Medicaid via a state 1115 waiver program that extends benefits to certain otherwise ineligible persons. Some states provide only pharmacy benefits or other limited services to 1115 enrollees, although a few states provide full Medicaid benefits to persons qualifying through 1115 provisions. Many 1115 waivers also have other provisions such as mandatory managed care coverage but the 1115 eligibility category only relates to eligibility extension. Aged or disabled persons in the 1115 group typically qualify under poverty-related expansions.
Admission = date at which an individual was reported to have been admitted to the nursing home for which a Medicaid claim has been paid. Admission may occur before the beginning of a Medicaid-financed nursing home spell if a person entered the nursing home with other insurance coverage--for example, Medicare or private insurance--before Medicaid began covering the nursing facility care.
Age = age is defined as of the date a person began their first Medicaid-covered nursing home spell between July 1, 2001 and December 31, 2002.
Adult (BOE Group) = a BOE group that includes pregnant women and caretaker relatives in families with dependent (minor) children. (Adults who are eligible for Medicaid due to disability are coded as disabled.)
Aged (BOE Group) = a BOE group that includes enrollees age 65 or older who qualified for Medicaid due to their age. Because some states code all people over 65 as aged, enrollees over age 65 but categorized in another BOE group in Medicaid Analytic eXtract (MAX) were recoded as aged for this study.
Basis of Eligibility (BOE) = eligibility grouping that traditionally has been used by Centers for Medicare & Medicaid Services (CMS) to classify enrollees as children, adults, aged, or disabled.
Cash Assistance-Related (MAS Group) = a MAS group that includes persons receiving Supplemental Security Income (SSI) benefits or mandatory state supplements and those who would have qualified under the pre-welfare reform Aid to Families with Dependent Children (AFDC) rule. Among aged and disabled enrollees, the cash assistance-related MAS group consists of people satisfying the first, SSI-related requirement.
Child (BOE Group) = a BOE group that includes persons under age 18 or under age 21 in states electing to cover older children. (Children who are eligible for Medicaid due to disability are coded as disabled.)
Community Long-Term Care (CLTC) = services covered under 1915(c) waivers and personal care, residential care, home health, adult day, and private duty nursing services that are mandatory or are provided at state option. Because unduplicated measures of community long-term care waiver use and service-specific use are not available in MAX PS files, CLTC is operationally defined as services covered under waivers for people receiving waiver services, and use of personal care, residential care, home health, adult day, and private duty nursing for all other enrollees. This operational definition results in an underestimate of CLTC use and costs in this study. (See Wenzlow, Schmitz & Shepperson (2008), Appendix A for further information about components of CLTC.)
Disabled (BOE Group) = a BOE group that includes persons of any age (including children) who are unable to engage in substantial gainful activity by reason of any medically determinable physical or mental impairment that can be expected to result in death or that has lasted or can be expected to last for a continuous period of not less than 12 months. Because disabled people over age 65 are often but not always categorized as aged, all disabled people over 65 were recoded as aged in this study.
Duals = persons dually enrolled in Medicare and Medicaid. In MAX, duals are identified as people in the Medicaid Statistical Information System (MSIS) with matching records in the Medicaid Enrollment Database (EDB) indicating enrollment in both Medicare and Medicaid in at least one month during the study period.
Fee-for-Service (FFS) = a payment mechanism in which payment is made for each utilized service. FFS services exclude services provided under capitated arrangements.
Maintenance Assistance Status (MAS) = eligibility grouping traditionally used by CMS to classify enrollees by the financial-related criteria by which they are eligible for Medicaid. MAS groups include cash assistance-related, medically needy, poverty-related, 1115 demonstration waiver, and other.
Managed Care (MC) = payment mechanism used to manage health care, including services provided by health maintenance organizations (HMOs) or Program of All-Inclusive Care for the Elderly (PACE), prepaid health plans (PHPs), and primary care case management plans (PCCMs). Services provided under managed care plans are not included in long-term care or other service-specific measures summarized in this report.
Medically Needy (MAS Group) = a MAS group that includes persons qualifying for Medicaid through the medically needy provision (a state option) that enables states to cover persons with higher incomes who may have significant medical expenses. Persons with income above the medically needy threshold can deduct incurred medical expenses from their income and/or assets--or spend down their income/assets--to determine financial eligibility.
Other (MAS Group) = a MAS group that consists of a mixture of mandatory and optional coverage groups not reported under the other MAS categories, including many institutionalized aged and disabled qualifying under the 300 percent rule that allows individuals with income up to 300 percent of SSI to qualify for Medicaid assistance for institutional care; those qualifying through home and community-based care waivers; individuals ineligible for SSI due only to their SSDI benefits, and those covered under more restrictive requirement than SSI standards in Section 209(b) states. This MAS group also includes many other groups--for example, children receiving Title IV-E foster care payments or adoption assistance and caretaker relatives.
Poverty-Related (MAS Group) = a MAS group that consists of persons qualifying through any poverty-related Medicaid expansions enacted from 1988 on. For example, states can elect to extend full Medicaid benefits to otherwise ineligible aged and disabled people up to 100 percent of the federal poverty level. In addition, this group includes people qualifying only as Qualified Medicare Beneficiaries, Specified Low Income Medicare Beneficiaries, or Qualified Individual dual eligibles. For details, see Schneider et al. (2002) or Wenzlow et al. (2007).
Program of All-Inclusive Care for the Elderly (PACE) = a managed care plan that coordinates both acute care and long-term care for eligible enrollees (those age 55 and older, living in a PACE area, and otherwise eligible for nursing home care). A capitated payment mechanism is used for PACE plan enrollees. As a result, service-specific information is not available for services provided under PACE or other managed plans.
Restricted-Benefit Enrollees = enrollees who receive limited Medicaid coverage, including unqualified aliens only eligible for emergency hospital benefits, duals receiving only Medicare cost-sharing benefits, and people eligible for only family-planning services. Some enrollees may be eligible for a restricted set of services but are coded as full-benefit enrollees--for example, those eligible for only prescription drug coverage and Medicare cost-sharing.
Section 209(b) State = a state that elected to use more restrictive eligibility requirements than those of the SSI program, but these requirements cannot be more restrictive than those in place in the states Medicaid plan as of January 1, 1972. Section 209(b) states include Connecticut, Hawaii, Illinois, Indiana, Minnesota, Missouri, New Hampshire, North Dakota, Ohio, Oklahoma, and Virginia.
Spell = a series of months during which a person received Medicaid-covered nursing home services for at least one day of each month and received no such services during the month preceding and following the series. Because MAX data were available only through December 31, 2002 at the time of this study, all spells are censored on that date.
APPENDIX B. STATE NURSING HOME DATA ANOMALIES
Table B.1 lists MAX 2001 and 2002 nursing home data anomalies by state. The table includes any known problems with MAX nursing home claims and other records that may affect our analyses and that have been identified in the MAX anomaly notes. A full listing of anomalous MAX data is available on the CMS MAX web site at [http://www.cms.hhs.gov/MedicaidDataSourcesGenInfo/07_MAXGeneralInformati.... Table B.1 also includes anomalies identified during the merging of 2001 and 2002 MAX data and the processing of claims for this study.
As a result of the listed anomalies, four states (Arizona, Hawaii, Michigan, and Tennessee) and the District of Columbia have been excluded from analyses presented in this report. Arizona provided most of its Medicaid long-term care services through managed care arrangements and because our analysis was limited to FFS long-term care, Arizona was excluded from our study. The District of Columbia was excluded because many individual records did not match between years 2001 and 2002, and the patterns of nursing home use in the state suggested that this was due to changes is record ID reporting rather than actual changes in service use. Hawaii was excluded due to a significant shift in reporting of nursing facility use between 2001 and 2002 that is believed to have resulted from reporting errors. In Michigan, many nursing facility claims were reported by the state as bundled service tracking claims and the state is excluded from analyses because individual claims reflect only a portion of nursing home use in the state. Finally, like Arizona, Tennessee reported many of its long-term care services as provided under managed care through mid-2002. As a result, the states FFS claims do not accurately reflect nursing facility use during our study period.
We expect that changes or improvements in reporting practices will enable data from District of Columbia, Hawaii, Michigan, and Tennessee to be included in analyses of MAX nursing facility data for calendar years 2003 and later. Because Arizona continues to provide most long-term care services through managed care arrangements, information about patterns of nursing facility use will not be available for the state unless encounter data (managed care utilization by service type information) are deemed valid and included in analyses. To date, encounter data in MAX have been thought to be of questionable quality but this should be reassessed periodically.
| TABLE B.1. Medicaid Analytic eXtract (MAX) Long-Term Care 2001 and 2002 Data Anomalies | ||
| State | Service Type | Anomaly |
| All States | Service Tracking Claims | Expenditures submitted by the states as service tracking claims (lump sum payments to providers for more than one person and multiple services) are not included in MAX as they cannot be linked to specific beneficiaries. States are not required to submit service tracking claims and there may be no submissions or partial submissions. For the most part, these expenditures are for bulk payments--for example, Disproportionate Share Hospital payments or drug rebates. However, some states submit some adjustments, payments for waiver services, and/or capitation claims as service tracking claims. |
| Duplicate SSNs | There are some person summary records with duplicate SSNs. In most states this is a very small number, but there are a few states where is it fairly large. This can occur in states like TN that change a person's Medicaid ID number when they change managed care plan or move to another county. To address cases in which more than one record was available for an individual or when Medicaid ID numbers changed between years, records with matching SSNs and birth dates were merged and represented as one record for the analyses presented in this report. | |
| AK | Nursing Facility, Waivers | AK has a low percentage of nursing facility claims in its long-term care claim files because it has a relatively low senior population and an active home and community-based waiver program. AK also has a state-operated Pioneers Home system, separate from Medicaid, that provides services to many people who might otherwise be served by Medicaid nursing facility institutions. |
| AL | All | AL does not include service code on adjustment claims making the adjustment process difficult and resulting in some improperly adjusted claims and thus potentially inaccurate expenditure measures. Whether this problem affects nursing facility utilization is unknown. |
| AR | All | The few debit claims in the source MSIS files appear to be service tracking claims rather than individual adjustments. As a result, some adjustments could not be made and some expenditure measures may be overestimated. |
| Dual Status | Dual enrolment may not be fully reliable in AR. AR reported 9,000 dual enrollees who were not matched to the Medicare Enrollment Data Base (EDB). | |
| AZa | All | Because most people in AZ were enrolled in capitated managed care plans, there are few or no FFS claims for most nursing facility services in MAX. As a result, AZ data are excluded from analyses presented in this report. |
| Admission Date | Admission date is missing on all nursing facility claims in AZ. | |
| CA | Nursing Facility | A small number of nursing facility claims have a begin date greater than end date (N=32). These claims were excluded from analyses presented in this report. |
| CO | Nursing Facility | One claim for 2.5 million in CO was revised to correspond with the claim service charge amount. |
| CT | Admission Date, Patient Discharge Status | Admission date is missing on all and patient discharge status on many nursing facility claims in CT. |
| DCa | All | A larger than expected number of 2001 and 2002 records did not match between years for individuals in DC. As a result, the number of nursing home spells is likely to be overestimated and DC data were excluded from results presented in this report. |
| Dual Status | Dual enrollees are probably undercounted in DC. | |
| DE | All | In DE, many drugs are covered under nursing facility charges. |
| FL | Admission Date, Patient Discharge Status | Admission date and patient discharge status are missing on most nursing facility claims in FL. |
| GA | All | GA did not correctly report adjustments in their 1999-2003 files making the adjustment process difficult and resulting in some improperly adjusted claims and thus potentially inaccurate expenditure and utilization measures. |
| Admission Date, Patient Discharge Status | GA reports almost no one with nursing facility patient discharge status of "died". Discharge status codes are unreliable in GA. Also, admission date is missing on most nursing facility claims in GA. | |
| HIa | All | The number of institutional long-term care users increased from 3,006 in MAX 2001 to 11,745 in MAX 2002 and decreased again in MAX 2003 (cause unknown). Because the 2002 long-term care data do not appear to be reliable, HI data are excluded from analyses presented in this report. |
| Admission Date | Admission date is missing on most nursing facility records in HI. | |
| IA | Admission Date, Patient Discharge Status | Admission date is missing on most nursing facility records in IA. IA reports almost no one with nursing facility patient discharge status of "died." Discharge status codes are unreliable in IA. |
| ID | Patient Discharge Status | Patient discharge status is missing on many nursing facility claims in ID. |
| IL | Patient Discharge Status | Patient discharge status is missing for all nursing facility claims in IL. |
| IN | There are no notes for IN. | |
| KS | Admission Date | Admission date is missing on most nursing facility claims in KS. |
| KY | Admission Date | Admission date is missing on most nursing facility claims in KY. |
| LA | Nursing Facility | Nursing facility expenditures were much lower in MAX ($568 million) than in Form 64 data ($1.327 billion). However, Form 64 reported nursing home expenditures were $515 million in federal fiscal year (FFY) 2000, $1.158 billion in FFY 2001, $1.328 billion in FFY 2002, and $597 million in FFY 2003. We believe FFY 2001 and 2002 Form 64 data are anomalies. |
| MA | There are no notes for MA. | |
| MD | Admission Date, Patient Discharge Status | Admission date is missing on most nursing facility claims in MD and MD reports no one with a nursing facility patient discharge status of "died." Discharge status codes are unreliable in MD. |
| ME | There are no notes for ME. | |
| MIa | Nursing Facility | MI pulled out part of the nursing facility bundled rate and paid them as service tracking claims. As a result, utilization of nursing facility services may be underestimated and MI data are not included in this report. Nursing facility expenditures totaled $1.1 billion in MAX compared with almost $1.8 million in Form 64. |
| MN | There are no notes for MN. | |
| MO | Admission Date, Patient Discharge Status | Admission date is missing on all and patient discharge status is missing on most nursing facility records in MO. |
| MS | There are no notes for MS. | |
| MT | Patient Discharge Status | Nursing facility patient discharge status codes are unreliable in MT. |
| NC | There are no notes for NC. | |
| ND | There are no notes for ND. | |
| NE | All | There are no nursing facility claims for February 2001 for NE. As a result, the nursing home spell study period begins mid-year in 2001. |
| NH | All | Many claims could not be properly adjusted because of how adjustment claims were submitted to MSIS. |
| Admission Date, Patient Discharge Status | Admission date is missing on most nursing facility claims because that information is not collected on the NH claim form. Patient discharge status is missing on some nursing facility claims in NH. | |
| NJ | There are no notes for NJ. | |
| NM | There are no notes for NM. | |
| NV | Admission Date | Admission date is missing on all nursing facility claims in NV. |
| NY | Nursing Facility | The bundled nursing facility (NF) rate includes maintenance drugs in NY. |
| Admission Date | Admission date is missing on all nursing facility claims in NY. | |
| OH | Admission Date, Patient Discharge Status | Admission date is missing on all nursing facility claims in OH. Nursing facility patient discharge status is missing on most claims. |
| OK | All | Some voided claims have a Medicaid Amount Paid of $0. As a result, expenditures and potentially utilization may be over-reported in OK. |
| Patient Discharge Status | Nursing facility patient discharge status codes are always missing in OK. | |
| OR | Admission Date | Admission date is missing on all nursing facility claims in OR. |
| PA | All | Patient discharge status is missing on most nursing facility claims because it is not available in the state system. |
| RI | There are no notes for RI. | |
| SC | All | No IP, OT, or RX adjustment claims were reported on SC's MSIS files through 2004, and only a very small number of long-term care claims were adjustment records. The absence of adjustment records implies that expenditures and potentially utilization may be overestimated. |
| Admission Date, Patient Discharge Status | Nursing facility admission date and patient discharge status are usually missing in SC. | |
| SD | Admission Date | Admission date is missing on all nursing facility claims in SC. |
| TNa | All | Long-term care services in TN were carved out of managed care and as a result, analysis of FFS records severely underestimates nursing facility service use in TN. TN data are excluded from results presented in this report. |
| All | Calendar year 2002 was a period of transition by TN from encounter to FFS reporting. TN files contain a mixture of encounter and FFS claims in MAX 2002. | |
| All | The state assigns new MSIS individual identifiers to enrollees who change their enrollment. This results in an over reporting of the number of enrollees and difficulties in merging records of individuals over years. | |
| TX | All | It was difficult to properly adjust some claims due to how they were submitted to MSIS. As a result, TX FFS expenditures and potentially utilization may be overestimated. |
| Admission Date, Patient Discharge Status | Admission date and patient discharge status are missing on most nursing facility claims in TX. | |
| UT | Admission Date, Patient Discharge Status | Admission date and patient discharge status are missing on most nursing facility claims because UT does not retain this information on their input records. |
| VA | There are no notes for SD. | |
| VT | Patient Discharge Status | Patient discharge status is missing on some nursing facility claims in VT. |
| WA | Patient Discharge Status | WA reports almost no one with nursing facility patient discharge status of "died." Discharge status codes are unreliable in WA. |
| WI | There are no notes for WI. | |
| WV | There are no notes for WV. | |
| WY | Admission Date | Admission date is always missing on nursing facility claims in WY. |
SOURCE: Data from MAX 2001-2002; Form 64 statistics reported in Burwell, Sredl, and Eiken (2003); and MAX data anomaly reports available at [http://www.cms.hhs.gov/MedicaidDataSourcesGenInfo/07_MAXGeneralInformati.... FFY = federal fiscal year; MAX = Medicaid Analytic eXtract; MSIS = Medicaid Statistical Information System.
| ||
APPENDIX C. TABLES
This appendix contains supplementary tables for this report. Table C.1 provides state-level information about the demographic characteristics of people with new Medicaid-financed nursing home spells between July 1, 2001 and December 31, 2002. Table C.2 summarizes their eligibility characteristics. Table C.3, Table C.4, and Table C.5 present the percentage enrolled in Medicaid prior to their Medicaid-financed nursing home care by the financial criteria by which they qualified (Table C.3), and how Medicaid status changed as they began their spell (Table C.4 and Table C.5). Table C.6 shows Medicaid enrollment and nursing home use prior to the start of Medicaid-financed nursing home spells.
| TABLE C.1. Demographic Characteristics of Aged or Disabled Medicaid Enrollees with New Medicaid-Financed Nursing Home Spells Between July 2001 and December 2002a | ||||||||||
| Number of Enrollees | Percentage White | Percentage Female | Age at Month of First New Medicaid-Financed Nursing Home Spell | Percentage Who Died During the Study Periodb | ||||||
| Average Age | Percentage | |||||||||
| 65 | 65-74 | 75-84 | 85+ | Non-Adjusted | Age Adjusted | |||||
| All 46 States | 743,011 | 73.4 | 66.4 | 76 | 19.5 | 15.8 | 32.4 | 32.3 | 24.4 | |
| Alabama | 12,122 | 70.9 | 72.1 | 78 | 14.0 | 16.6 | 34.4 | 35.0 | 24.5 | 23.9 |
| Alaska | 482 | 61.8 | 60.6 | 70 | 30.2 | 22.5 | 31.6 | 15.7 | 27.8 | 30.5 |
| Arkansas | 8,541 | 80.2 | 69.2 | 78 | 14.0 | 14.4 | 34.4 | 37.1 | 23.8 | 23.1 |
| California | 71,609 | 59.1 | 61.5 | 74 | 23.3 | 17.7 | 31.9 | 27.1 | 23.8 | 25.0 |
| Colorado | 8,620 | 76.8 | 66.2 | 77 | 18.3 | 15.0 | 31.9 | 34.7 | 23.2 | 22.8 |
| Connecticut | 14,455 | 82.7 | 67.6 | 76 | 20.0 | 14.0 | 30.8 | 35.1 | 22.3 | 22.2 |
| Delaware | 1,763 | 68.9 | 69.1 | 77 | 15.0 | 16.9 | 34.4 | 33.7 | 23.7 | 23.2 |
| Florida | 49,032 | 66.5 | 64.0 | 76 | 19.7 | 16.2 | 32.2 | 31.8 | 26.5 | 26.6 |
| Georgia | 20,535 | 65.7 | 69.5 | 78 | 14.5 | 16.6 | 35.8 | 33.1 | 26.0 | 25.5 |
| Idaho | 3,215 | 96.4 | 64.8 | 76 | 20.1 | 14.6 | 31.9 | 33.3 | 24.4 | 24.3 |
| Illinois | 34,997 | 72.4 | 61.1 | 71 | 31.3 | 14.4 | 27.4 | 26.9 | 22.9 | 24.6 |
| Indiana | 21,990 | 89.4 | 68.6 | 77 | 17.8 | 15.6 | 33.8 | 32.8 | 24.6 | 24.5 |
| Iowa | 9,469 | 62.9 | 68.2 | 79 | 14.1 | 13.5 | 33.0 | 39.4 | 21.9 | 21.3 |
| Kansas | 8,125 | 90.6 | 69.7 | 78 | 14.7 | 13.8 | 33.2 | 38.2 | 24.2 | 23.4 |
| Kentucky | 13,897 | 89.4 | 69.3 | 77 | 15.1 | 16.5 | 35.2 | 33.3 | 25.6 | 25.0 |
| Louisiana | 15,361 | 60.5 | 65.4 | 76 | 19.7 | 16.9 | 33.6 | 29.8 | 26.0 | 26.2 |
| Maine | 5,261 | 99.0 | 67.8 | 78 | 14.4 | 17.0 | 34.2 | 34.4 | 28.1 | 27.1 |
| Maryland | 11,729 | 55.6 | 65.8 | 75 | 20.2 | 17.0 | 33.2 | 29.5 | 24.6 | 24.8 |
| Massachusetts | 29,725 | 74.4 | 68.0 | 75 | 21.8 | 13.4 | 30.3 | 34.5 | 22.8 | 22.9 |
| Minnesota | 17,384 | 88.6 | 63.6 | 74 | 24.6 | 11.1 | 28.0 | 36.4 | 20.4 | 20.7 |
| Mississippi | 9,138 | 59.5 | 68.8 | 77 | 16.1 | 17.4 | 33.7 | 32.7 | 25.1 | 24.8 |
| Missouri | 20,492 | 83.2 | 67.4 | 76 | 19.5 | 15.8 | 32.1 | 32.6 | 25.6 | 25.6 |
| Montana | 2,720 | 91.8 | 64.7 | 77 | 19.3 | 15.2 | 31.3 | 34.2 | 22.8 | 22.7 |
| Nebraska | 5,854 | 91.5 | 68.4 | 77 | 18.4 | 14.4 | 30.5 | 36.6 | 23.7 | 23.5 |
| Nevada | 2,959 | 88.0 | 64.7 | 75 | 20.9 | 18.6 | 32.1 | 28.3 | 28.7 | 29.2 |
| New Hampshire | 3,599 | 98.8 | 71.2 | 79 | 12.5 | 14.2 | 35.3 | 38.0 | 23.8 | 23.2 |
| New Jersey | 22,295 | 74.7 | 68.8 | 78 | 15.1 | 13.6 | 32.8 | 38.4 | 27.1 | 26.5 |
| New Mexico | 3,597 | 57.2 | 62.7 | 77 | 16.5 | 17.1 | 31.7 | 34.8 | 25.5 | 25.1 |
| New York | 69,508 | 64.9 | 65.2 | 75 | 20.2 | 17.0 | 31.6 | 31.2 | 21.0 | 21.2 |
| North Carolina | 19,484 | 60.9 | 72.0 | 76 | 18.3 | 18.3 | 33.6 | 29.8 | 26.9 | 27.1 |
| North Dakota | 2,606 | 95.2 | 65.3 | 80 | 13.5 | 12.5 | 30.4 | 43.6 | 23.8 | 23.2 |
| Ohio | 41,519 | 81.3 | 66.7 | 74 | 25.1 | 16.3 | 30.8 | 27.7 | 22.4 | 23.4 |
| Oklahoma | 12,886 | 84.7 | 68.7 | 75 | 20.6 | 16.4 | 31.5 | 31.4 | 26.2 | 26.5 |
| Oregon | 7,143 | 92.6 | 63.1 | 75 | 21.5 | 17.5 | 32.4 | 28.6 | 32.9 | 33.4 |
| Pennsylvania | 39,603 | 85.8 | 70.2 | 79 | 11.9 | 13.4 | 36.6 | 38.1 | 27.3 | 26.5 |
| Rhode Island | 3,659 | 68.1 | 70.1 | 76 | 20.3 | 14.2 | 33.6 | 31.9 | 22.2 | 22.3 |
| South Carolina | 8,678 | 61.0 | 69.7 | 78 | 12.5 | 16.0 | 36.9 | 34.6 | 30.6 | 30.0 |
| South Dakota | 2,697 | 90.0 | 65.9 | 79 | 14.4 | 13.9 | 30.8 | 40.9 | 21.4 | 20.5 |
| Texas | 47,936 | 67.8 | 66.4 | 77 | 17.0 | 16.9 | 33.5 | 32.6 | 23.8 | 23.5 |
| Utah | 3,139 | 90.1 | 64.0 | 72 | 27.9 | 16.4 | 29.3 | 26.3 | 24.3 | 25.9 |
| Vermont | 2,052 | 73.7 | 70.1 | 79 | 11.4 | 15.3 | 35.4 | 37.9 | 25.2 | 24.3 |
| Virginia | 14,720 | 67.1 | 68.8 | 77 | 15.7 | 16.8 | 35.1 | 32.5 | 26.8 | 26.6 |
| Washington | 13,228 | 85.7 | 63.9 | 74 | 26.1 | 14.4 | 29.9 | 29.6 | 26.5 | 27.5 |
| West Virginia | 5,882 | 95.4 | 69.3 | 77 | 16.2 | 16.3 | 34.5 | 32.9 | 24.4 | 23.9 |
| Wisconsin | 18,019 | 76.8 | 66.1 | 79 | 14.0 | 13.1 | 33.7 | 39.2 | 24.8 | 24.1 |
| Wyoming | 1,286 | 91.6 | 67.7 | 76 | 20.6 | 17.5 | 28.3 | 33.5 | 23.8 | 23.9 |
SOURCE: MAX, 2001-2002, for 46 states with representative FFS nursing home data. NOTE: Nursing home data are unreliable in MAX 2001 or MAX 2002 for five states and are not included in this table: most nursing facility services in Arizona and Tennessee are not included in MAX because they are provided under managed care arrangements; spells are overestimated for District of Columbia; the number of nursing home users is overestimated in Hawaii; and nursing facility service use is underreported in Michigan. For details, see Appendix B.
| ||||||||||
| TABLE C.2. Eligibility Characteristics of Aged or Disabled Medicaid Enrollees with New Medicaid-Financed Nursing Home Spells Between July 2001 and December 2002a | |||||||||
| Number of Enrollees | Percentage Dually Enrolled in Medicare and Medicaidb | Percentage in Basis of Eligibility Groupc | Percentage in Maintenance Assistance Status Group at Start of First Spelld | ||||||
| Aged | Disabled | Other | Cash Receipt | Medically Needy | 1115 Demonstration Waiver | Unknown | |||
| All 46 States | 743,011 | 87.2 | 81.5 | 18.5 | 47.7 | 21.8 | 23.1 | 6.3 | 0.2 |
| Alabama | 12,122 | 91.8 | 86.8 | 13.2 | 68.0 | 21.1 | 0.0 | 5.9 | 0.0 |
| Alaska | 482 | 80.3 | 70.7 | 29.3 | 49.4 | 46.5 | 0.0 | 0.0 | 0.0 |
| Arkansas | 8,541 | 89.1 | 86.6 | 13.4 | 70.3 | 21.4 | 0.3 | 1.7 | 0.0 |
| California | 71,609 | 83.9 | 77.8 | 22.2 | 2.0 | 44.1 | 48.9 | 4.4 | 0.0 |
| Colorado | 8,620 | 89.1 | 82.6 | 17.4 | 58.4 | 40.3 | 0.0 | 0.3 | 0.0 |
| Connecticut | 14,455 | 87.8 | 80.7 | 19.3 | 76.5 | 6.9 | 15.8 | 0.5 | 0.0 |
| Delaware | 1,763 | 91.9 | 85.6 | 14.4 | 83.0 | 14.7 | 0.0 | 1.8 | 0.2 |
| Florida | 49,032 | 87.3 | 81.2 | 18.8 | 50.1 | 24.1 | 0.2 | 24.7 | 0.0 |
| Georgia | 20,535 | 90.6 | 86.4 | 13.6 | 71.1 | 14.4 | 6.1 | 4.4 | 0.0 |
| Idaho | 3,215 | 89.1 | 80.9 | 19.1 | 77.4 | 21.6 | 0.0 | 0.8 | 0.0 |
| Illinois | 34,997 | 76.7 | 70.0 | 30.0 | 14.3 | 16.1 | 65.3 | 2.7 | 1.1 |
| Indiana | 21,990 | 90.0 | 83.2 | 16.8 | 80.5 | 18.3 | 0.0 | 0.3 | 0.0 |
| Iowa | 9,469 | 92.7 | 86.5 | 13.5 | 87.5 | 9.8 | 1.7 | 0.2 | 0.0 |
| Kansas | 8,125 | 92.3 | 86.0 | 14.0 | 85.3 | 10.5 | 2.2 | 1.3 | 0.0 |
| Kentucky | 13,897 | 89.3 | 85.9 | 14.1 | 50.5 | 29.1 | 17.6 | 1.2 | 0.0 |
| Louisiana | 15,361 | 86.1 | 81.1 | 18.9 | 87.7 | 11.6 | 0.5 | 0.2 | 0.0 |
| Maine | 5,261 | 90.6 | 86.4 | 13.6 | 57.2 | 28.3 | 3.8 | 9.3 | 1.0 |
| Maryland | 11,729 | 84.8 | 80.7 | 19.3 | 0.3 | 11.5 | 87.5 | 0.4 | 0.1 |
| Massachusetts | 29,725 | 86.5 | 79.2 | 20.8 | 34.6 | 26.3 | 9.1 | 28.8 | 1.2 |
| Minnesota | 17,384 | 86.5 | 76.5 | 23.5 | 40.3 | 16.2 | 43.1 | 0.3 | 0.0 |
| Mississippi | 9,138 | 92.0 | 84.9 | 15.1 | 60.9 | 31.7 | 0.0 | 6.3 | 0.0 |
| Missouri | 20,492 | 88.5 | 81.5 | 18.5 | 83.5 | 14.0 | 0.0 | 1.2 | 0.0 |
| Montana | 2,720 | 88.9 | 81.6 | 18.4 | 14.3 | 14.0 | 70.2 | 0.0 | 0.0 |
| Nebraska | 5,854 | 90.5 | 82.3 | 17.7 | 0.1 | 15.5 | 70.8 | 13.3 | 0.0 |
| Nevada | 2,959 | 84.5 | 80.3 | 19.7 | 70.9 | 25.0 | 0.0 | 2.0 | 0.0 |
| New Hampshire | 3,599 | 92.5 | 88.4 | 11.6 | 44.7 | 4.5 | 47.0 | 0.6 | 0.0 |
| New Jersey | 22,295 | 85.4 | 85.6 | 14.4 | 70.3 | 11.9 | 12.2 | 5.4 | 0.0 |
| New Mexico | 3,597 | 89.6 | 84.0 | 16.0 | 77.8 | 20.7 | 0.0 | 0.7 | 0.0 |
| New York | 69,508 | 85.3 | 80.8 | 19.2 | 0.4 | 24.1 | 74.9 | 0.2 | 0.3 |
| North Carolina | 19,484 | 91.4 | 82.4 | 17.6 | 0.0 | 37.9 | 17.7 | 44.3 | 0.0 |
| North Dakota | 2,606 | 93.0 | 87.5 | 12.5 | 0.1 | 12.4 | 87.3 | 0.2 | 0.0 |
| Ohio | 41,519 | 83.3 | 76.0 | 24.0 | 77.1 | 17.6 | 0.0 | 1.3 | 0.0 |
| Oklahoma | 12,886 | 88.3 | 80.4 | 19.6 | 77.1 | 12.4 | 0.2 | 9.8 | 0.0 |
| Oregon | 7,143 | 87.9 | 80.0 | 20.0 | 80.0 | 17.6 | 0.2 | 0.2 | 1.9 |
| Pennsylvania | 39,603 | 92.2 | 88.7 | 11.3 | 48.9 | 8.4 | 34.8 | 7.7 | 0.0 |
| Rhode Island | 3,659 | 88.3 | 80.5 | 19.5 | 66.4 | 27.7 | 5.8 | 0.1 | 0.0 |
| South Carolina | 8,678 | 92.7 | 88.3 | 11.7 | 74.7 | 15.6 | 0.0 | 9.6 | 0.0 |
| South Dakota | 2,697 | 91.1 | 86.0 | 14.0 | 84.1 | 14.5 | 0.0 | 1.2 | 0.0 |
| Texas | 47,936 | 89.6 | 84.0 | 16.0 | 78.1 | 21.4 | 0.1 | 0.4 | 0.0 |
| Utah | 3,139 | 82.7 | 73.2 | 26.8 | 67.8 | 14.9 | 8.2 | 9.1 | 0.0 |
| Vermont | 2,052 | 94.9 | 89.4 | 10.6 | 73.2 | 13.8 | 10.3 | 0.0 | 0.9 |
| Virginia | 14,720 | 88.8 | 85.1 | 14.9 | 72.5 | 16.8 | 4.9 | 5.7 | 0.0 |
| Washington | 13,228 | 80.7 | 75.4 | 24.6 | 76.4 | 13.9 | 5.6 | 0.9 | 0.0 |
| West Virginia | 5,882 | 89.5 | 84.6 | 15.4 | 20.2 | 76.8 | 0.1 | 1.8 | 0.0 |
| Wisconsin | 18,019 | 92.3 | 86.7 | 13.3 | 70.9 | 16.0 | 12.7 | 0.2 | 0.1 |
| Wyoming | 1,286 | 88.5 | 81.0 | 19.0 | 87.6 | 9.1 | 0.0 | 0.8 | 0.0 |
SOURCE: MAX, 2001-2002, for 46 states with representative FFS nursing home data. NOTE: Nursing home data are unreliable in MAX 2001 or MAX 2002 for five states and are not included in this table: most nursing facility services in Arizona and Tennessee are not included in MAX because they are provided under managed care arrangements; spells are overestimated for District of Columbia; the number of nursing home users is overestimated in Hawaii; and nursing facility service use is underreported in Michigan. For details, see Appendix B.
| |||||||||
| TABLE C.3. Maintenance Assistance Status of Aged or Disabled Medicaid Enrollees Prior to New Medicaid-Financed Nursing Home Spells Between July 2001 and December 2002a | ||||||||
| Number of Enrollees | Percentage in Maintenance Assistance Status Group Prior to First Spell Startb | |||||||
| Not Eligible | Other | Cash Receipt | Medically Needy | Poverty-Related | 1115 Demonstration Waiver | Unknown | ||
| All 46 States | 743,011 | 35.7 | 22.5 | 21.9 | 12.1 | 6.7 | 0.4 | 0.7 |
| Alabama | 12,122 | 39.3 | 15.6 | 28.5 | 0.0 | 13.6 | 0.0 | 3.2 |
| Alaska | 482 | 34.6 | 13.9 | 49.8 | 0.0 | 0.2 | 0.0 | 1.5 |
| Arkansas | 8,541 | 43.1 | 25.4 | 22.7 | 0.4 | 3.9 | 0.0 | 4.6 |
| California | 71,609 | 26.0 | 2.3 | 41.3 | 25.2 | 4.9 | 0.0 | 0.3 |
| Colorado | 8,620 | 33.5 | 34.0 | 30.2 | 0.0 | 1.6 | 0.0 | 0.8 |
| Connecticut | 14,455 | 32.1 | 39.6 | 10.1 | 14.9 | 2.4 | 0.0 | 0.9 |
| Delaware | 1,763 | 40.6 | 34.4 | 14.4 | 0.0 | 9.8 | 0.7 | 0.2 |
| Florida | 49,032 | 43.3 | 17.5 | 21.4 | 1.3 | 16.5 | 0.0 | 0.0 |
| Georgia | 20,535 | 33.8 | 37.1 | 17.2 | 3.1 | 5.6 | 0.0 | 3.3 |
| Idaho | 3,215 | 39.0 | 42.1 | 17.4 | 0.0 | 1.5 | 0.0 | 0.0 |
| Illinois | 34,997 | 33.5 | 8.8 | 14.9 | 37.8 | 2.1 | 2.4 | 0.6 |
| Indiana | 21,990 | 37.7 | 42.3 | 15.8 | 0.0 | 4.2 | 0.0 | 0.0 |
| Iowa | 9,469 | 37.2 | 35.1 | 11.8 | 12.3 | 2.8 | 0.0 | 0.9 |
| Kansas | 8,125 | 41.6 | 38.7 | 10.5 | 5.3 | 3.9 | 0.0 | 0.0 |
| Kentucky | 13,897 | 35.0 | 26.0 | 28.0 | 6.5 | 4.0 | 0.0 | 0.5 |
| Louisiana | 15,361 | 39.6 | 32.5 | 19.5 | 1.2 | 7.2 | 0.0 | 0.0 |
| Maine | 5,261 | 23.4 | 15.7 | 26.4 | 8.5 | 12.9 | 12.1 | 1.0 |
| Maryland | 11,729 | 47.0 | 0.9 | 15.4 | 32.4 | 3.7 | 0.5 | 0.0 |
| Massachusetts | 29,725 | 32.0 | 16.2 | 24.3 | 5.1 | 21.1 | 1.4 | 0.0 |
| Minnesota | 17,384 | 37.1 | 23.0 | 15.5 | 22.1 | 2.1 | 0.0 | 0.0 |
| Mississippi | 9,138 | 21.4 | 26.0 | 29.1 | 0.0 | 23.4 | 0.0 | 0.1 |
| Missouri | 20,492 | 37.5 | 43.0 | 17.8 | 0.0 | 1.7 | 0.0 | 0.1 |
| Montana | 2,720 | 52.9 | 7.8 | 13.0 | 25.8 | 0.2 | 0.0 | 0.3 |
| Nebraska | 5,854 | 41.1 | 0.1 | 14.8 | 25.2 | 18.7 | 0.0 | 0.0 |
| Nevada | 2,959 | 27.8 | 39.6 | 23.1 | 0.0 | 4.6 | 0.0 | 4.8 |
| New Hampshire | 3,599 | 56.2 | 20.1 | 6.8 | 15.6 | 0.8 | 0.0 | 0.6 |
| New Jersey | 22,295 | 40.5 | 35.7 | 12.8 | 5.4 | 5.5 | 0.0 | 0.0 |
| New Mexico | 3,597 | 38.6 | 33.2 | 21.8 | 0.0 | 3.7 | 0.0 | 2.7 |
| New York | 69,508 | 30.8 | 0.5 | 27.2 | 40.2 | 0.2 | 1.1 | 0.0 |
| North Carolina | 19,484 | 16.6 | 0.0 | 41.7 | 9.0 | 32.7 | 0.0 | 0.0 |
| North Dakota | 2,606 | 48.2 | 0.1 | 14.3 | 35.5 | 1.8 | 0.0 | 0.0 |
| Ohio | 41,519 | 44.0 | 34.2 | 15.8 | 0.0 | 1.6 | 0.0 | 4.3 |
| Oklahoma | 12,886 | 39.1 | 38.7 | 13.5 | 0.9 | 7.8 | 0.0 | 0.0 |
| Oregon | 7,143 | 32.7 | 46.3 | 16.8 | 1.3 | 0.9 | 2.0 | 0.0 |
| Pennsylvania | 39,603 | 47.0 | 20.6 | 11.7 | 12.4 | 8.2 | 0.0 | 0.1 |
| Rhode Island | 3,659 | 29.6 | 38.6 | 27.6 | 2.9 | 1.3 | 0.0 | 0.0 |
| South Carolina | 8,678 | 27.9 | 39.6 | 20.5 | 0.0 | 12.1 | 0.0 | 0.0 |
| South Dakota | 2,697 | 46.4 | 30.3 | 17.7 | 0.0 | 5.5 | 0.0 | 0.1 |
| Texas | 47,936 | 33.8 | 38.4 | 22.0 | 0.1 | 5.6 | 0.0 | 0.0 |
| Utah | 3,139 | 46.5 | 23.3 | 13.6 | 4.7 | 11.8 | 0.1 | 0.0 |
| Vermont | 2,052 | 28.8 | 30.2 | 15.3 | 14.4 | 0.0 | 11.0 | 0.2 |
| Virginia | 14,720 | 28.2 | 41.9 | 19.7 | 3.4 | 6.8 | 0.0 | 0.0 |
| Washington | 13,228 | 33.6 | 45.1 | 13.5 | 3.1 | 1.3 | 0.0 | 3.4 |
| West Virginia | 5,882 | 42.7 | 9.4 | 41.6 | 0.6 | 4.2 | 0.0 | 1.5 |
| Wisconsin | 18,019 | 45.4 | 30.3 | 15.1 | 7.6 | 0.8 | 0.8 | 0.0 |
| Wyoming | 1,286 | 48.7 | 36.5 | 9.4 | 0.0 | 3.0 | 0.0 | 2.4 |
SOURCE: MAX, 2001-2002, for 46 states with representative FFS nursing home data. NOTE: Nursing home data are unreliable in MAX 2001 or MAX 2002 for five states and are not included in this table: most nursing facility services in Arizona and Tennessee are not included in MAX because they are provided under managed care arrangements; spells are overestimated for District of Columbia; the number of nursing home users is overestimated in Hawaii; and nursing facility service use is underreported in Michigan. For details, see Appendix B.
| ||||||||
| TABLE C.4. Transitions in Eligibility Status Among Aged or Disabled Medicaid Enrollees With New Medicaid-Financed Nursing Home Spells Between July 2001 and December 2002: Transitions from Non-Enrollment and Casha | ||||||||||||
| Persons Not Enrolled in Medicaid Before First Spell | Persons Enrolled in Medicaid on the Basis of Cash Receipt Before First Spell | |||||||||||
| Number of Enrollees | Percentage of Population | Maintenance Assistance Status After Spell Beginsa | Number of Enrollees | Percentage of Population | Maintenance Assistance Status After Spell Beginsa | |||||||
| Other | Cash Receipt | Medically Needy | Poverty-Related | Other | Cash Receipt | Medically Needy | Poverty-Related | |||||
| All 46 States | 265,211 | 35.7 | 58.3 | 6.3 | 29.0 | 4.6 | 162,995 | 21.9 | 8.2 | 86.7 | 3.8 | 1.2 |
| Alabama | 4,760 | 39.3 | 82.8 | 5.2 | 0.0 | 3.1 | 3,449 | 28.5 | 31.8 | 66.4 | 0.0 | 1.6 |
| Alaska | 167 | 34.6 | 74.3 | 18.0 | 0.0 | 0.0 | 240 | 49.8 | 18.8 | 80.8 | 0.0 | 0.0 |
| Arkansas | 3,681 | 43.1 | 84.2 | 4.8 | 0.2 | 0.4 | 1,937 | 22.7 | 15.0 | 84.8 | 0.0 | 0.0 |
| California | 18,595 | 26.0 | 0.6 | 12.2 | 82.9 | 2.2 | 29,607 | 41.3 | 0.0 | 97.7 | 2.2 | 0.1 |
| Colorado | 2,889 | 33.5 | 71.4 | 26.2 | 0.0 | 0.1 | 2,600 | 30.2 | 2.0 | 97.8 | 0.0 | 0.1 |
| Connecticut | 4,641 | 32.1 | 79.2 | 1.7 | 18.7 | 0.2 | 1,454 | 10.1 | 36.6 | 61.1 | 2.2 | 0.0 |
| Delaware | 715 | 40.6 | 95.1 | 3.4 | 0.0 | 0.8 | 253 | 14.4 | 9.5 | 90.5 | 0.0 | 0.0 |
| Florida | 21,219 | 43.3 | 66.9 | 6.3 | 0.1 | 24.7 | 10,494 | 21.4 | 0.6 | 98.2 | 0.0 | 1.1 |
| Georgia | 6,938 | 33.8 | 78.0 | 4.1 | 9.0 | 2.3 | 3,523 | 17.2 | 23.4 | 74.1 | 0.0 | 0.5 |
| Idaho | 1,254 | 39.0 | 88.6 | 11.0 | 0.0 | 0.2 | 559 | 17.4 | 2.9 | 96.1 | 0.0 | 1.1 |
| Illinois | 11,716 | 33.5 | 11.4 | 3.4 | 82.8 | 0.9 | 5,212 | 14.9 | 3.0 | 95.1 | 1.9 | 0.0 |
| Indiana | 8,297 | 37.7 | 91.4 | 6.2 | 0.0 | 0.2 | 3,470 | 15.8 | 0.1 | 99.8 | 0.0 | 0.0 |
| Iowa | 3,518 | 37.2 | 96.4 | 2.1 | 0.5 | 0.1 | 1,117 | 11.8 | 26.0 | 73.5 | 0.5 | 0.0 |
| Kansas | 3,380 | 41.6 | 93.4 | 3.3 | 1.2 | 1.0 | 853 | 10.5 | 13.6 | 85.1 | 0.6 | 0.0 |
| Kentucky | 4,864 | 35.0 | 60.3 | 7.4 | 28.4 | 0.2 | 3,894 | 28.0 | 3.2 | 93.8 | 2.7 | 0.1 |
| Louisiana | 6,086 | 39.6 | 95.4 | 3.7 | 0.6 | 0.0 | 2,998 | 19.5 | 51.8 | 48.1 | 0.0 | 0.0 |
| Maine | 1,230 | 23.4 | 74.8 | 16.8 | 4.2 | 2.4 | 1,387 | 26.4 | 29.5 | 68.5 | 0.7 | 1.3 |
| Maryland | 5,515 | 47.0 | 0.2 | 2.7 | 96.8 | 0.1 | 1,812 | 15.4 | 0.0 | 63.4 | 36.6 | 0.0 |
| Massachusetts | 9,500 | 32.0 | 54.9 | 5.8 | 12.3 | 26.7 | 7,210 | 24.3 | 0.2 | 98.8 | 0.3 | 0.6 |
| Minnesota | 6,458 | 37.1 | 46.5 | 5.2 | 48.1 | 0.1 | 2,703 | 15.5 | 8.9 | 88.4 | 2.5 | 0.1 |
| Mississippi | 1,957 | 21.4 | 79.1 | 14.2 | 0.0 | 2.2 | 2,663 | 29.1 | 3.0 | 96.8 | 0.0 | 0.1 |
| Missouri | 7,685 | 37.5 | 92.5 | 4.1 | 0.0 | 0.5 | 3,640 | 17.8 | 33.2 | 66.3 | 0.0 | 0.4 |
| Montana | 1,438 | 52.9 | 12.4 | 2.8 | 82.6 | 0.0 | 354 | 13.0 | 13.6 | 84.2 | 2.3 | 0.0 |
| Nebraska | 2,404 | 41.1 | 0.0 | 4.2 | 91.3 | 3.9 | 868 | 14.8 | 0.0 | 88.2 | 10.5 | 0.9 |
| Nevada | 824 | 27.8 | 90.0 | 9.1 | 0.0 | 0.7 | 684 | 23.1 | 8.0 | 90.9 | 0.0 | 0.1 |
| New Hampshire | 2,023 | 56.2 | 36.2 | 0.8 | 57.8 | 0.3 | 243 | 6.8 | 39.5 | 58.0 | 1.6 | 0.8 |
| New Jersey | 9,025 | 40.5 | 76.4 | 3.5 | 16.8 | 3.1 | 2,854 | 12.8 | 21.8 | 77.5 | 0.0 | 0.6 |
| New Mexico | 1,389 | 38.6 | 94.0 | 5.5 | 0.0 | 0.3 | 783 | 21.8 | 15.7 | 84.3 | 0.0 | 0.0 |
| New York | 21,389 | 30.8 | 0.2 | 5.5 | 94.1 | 0.0 | 18,937 | 27.2 | 0.1 | 80.0 | 19.9 | 0.0 |
| North Carolina | 3,227 | 16.6 | 0.0 | 17.0 | 30.8 | 52.0 | 8,123 | 41.7 | 0.0 | 81.7 | 5.6 | 12.7 |
| North Dakota | 1,257 | 48.2 | 0.0 | 2.1 | 97.8 | 0.1 | 373 | 14.3 | 0.0 | 78.3 | 21.7 | 0.0 |
| Ohio | 18,261 | 44.0 | 89.4 | 4.5 | 0.0 | 0.3 | 6,570 | 15.8 | 2.7 | 97.0 | 0.0 | 0.1 |
| Oklahoma | 5,044 | 39.1 | 91.0 | 3.0 | 0.2 | 4.8 | 1,736 | 13.5 | 13.4 | 80.6 | 0.2 | 5.8 |
| Oregon | 2,337 | 32.7 | 92.7 | 5.7 | 0.0 | 0.1 | 1,200 | 16.8 | 9.0 | 90.8 | 0.0 | 0.0 |
| Pennsylvania | 18,600 | 47.0 | 49.4 | 1.4 | 46.0 | 3.0 | 4,652 | 11.7 | 25.6 | 64.6 | 3.9 | 5.9 |
| Rhode Island | 1,083 | 29.6 | 83.4 | 7.0 | 9.5 | 0.1 | 1,010 | 27.6 | 8.0 | 92.0 | 0.0 | 0.0 |
| South Carolina | 2,418 | 27.9 | 89.7 | 4.9 | 0.0 | 5.1 | 1,775 | 20.5 | 30.6 | 67.5 | 0.0 | 1.7 |
| South Dakota | 1,251 | 46.4 | 95.6 | 3.8 | 0.0 | 0.5 | 478 | 17.7 | 29.9 | 70.1 | 0.0 | 0.0 |
| Texas | 16,222 | 33.8 | 93.4 | 6.3 | 0.0 | 0.2 | 10,568 | 22.0 | 13.0 | 86.9 | 0.0 | 0.1 |
| Utah | 1,459 | 46.5 | 80.5 | 3.7 | 10.5 | 5.3 | 428 | 13.6 | 8.6 | 89.7 | 0.0 | 1.6 |
| Vermont | 592 | 28.8 | 92.1 | 3.4 | 2.4 | 0.0 | 314 | 15.3 | 13.7 | 83.8 | 0.3 | 0.0 |
| Virginia | 4,154 | 28.2 | 82.7 | 5.1 | 7.5 | 4.6 | 2,895 | 19.7 | 19.5 | 76.3 | 0.1 | 4.0 |
| Washington | 4,442 | 33.6 | 77.8 | 8.0 | 8.7 | 0.5 | 1,780 | 13.5 | 22.5 | 75.6 | 0.3 | 0.4 |
| West Virginia | 2,509 | 42.7 | 21.2 | 76.6 | 0.2 | 0.6 | 2,448 | 41.6 | 8.3 | 91.2 | 0.0 | 0.4 |
| Wisconsin | 8,172 | 45.4 | 83.5 | 2.5 | 13.9 | 0.1 | 2,726 | 15.1 | 2.5 | 97.1 | 0.4 | 0.1 |
| Wyoming | 626 | 48.7 | 95.0 | 1.0 | 0.0 | 0.2 | 121 | 9.4 | 19.0 | 80.2 | 0.0 | 0.0 |
SOURCE: MAX, 2001-2002, for 46 states with representative FFS nursing home data. NOTE: Nursing home data are unreliable in MAX 2001 or MAX 2002 for five states and are not included in this table: most nursing facility services in Arizona and Tennessee are not included in MAX because they are provided under managed care arrangements; spells are overestimated for District of Columbia; the number of nursing home users is overestimated in Hawaii; and nursing facility service use is underreported in Michigan. For details, see Appendix B.
| ||||||||||||
| TABLE C.5. Transitions in Eligibility Status Among Aged or Disabled Medicaid Enrollees with New Medicaid-Financed Nursing Home Spells Between July 2001 and December 2002: Transitions from Medically Needy and Othera | ||||||||||||
| Persons Enrolled in Medicaid on the Basis of Medically Needy Before First Spell | Persons Enrolled in Medicaid on the Basis of Other Before First Spell | |||||||||||
| Number of Enrollees | Percentage of Population | Maintenance Assistance Status After Spell Beginsa | Number of Enrollees | Percentage of Population | Maintenance Assistance Status After Spell Beginsa | |||||||
| Other | Cash Receipt | Medically Needy | Poverty-Related | Other | Cash Receipt | Medically Needy | Poverty-Related | |||||
| All 46 States | 89,618 | 12.1 | 6.4 | 1.2 | 91.1 | 1.1 | 167,245 | 22.5 | 96.6 | 0.9 | 1.4 | 0.9 |
| Alabama | - | 0.0 | - | - | - | - | 1,885 | 15.6 | 98.3 | 0.5 | 0.0 | 0.8 |
| Alaska | - | 0.0 | - | - | - | - | 67 | 13.9 | 100.0 | 0.0 | 0.0 | 0.0 |
| Arkansas | 32 | 0.4 | 53.1 | 0.0 | 37.5 | 0.0 | 2,167 | 25.4 | 98.8 | 0.1 | 0.0 | 0.1 |
| California | 18,050 | 25.2 | 0.0 | 1.5 | 97.2 | 1.1 | 1,653 | 2.3 | 77.1 | 1.1 | 20.8 | 1.0 |
| Colorado | - | 0.0 | - | - | - | - | 2,928 | 34.0 | 97.1 | 2.9 | 0.0 | 0.0 |
| Connecticut | 2,156 | 14.9 | 39.5 | 0.4 | 59.7 | 0.3 | 5,720 | 39.6 | 98.4 | 0.2 | 1.2 | 0.2 |
| Delaware | - | 0.0 | - | - | - | - | 607 | 34.4 | 99.3 | 0.3 | 0.0 | 0.3 |
| Florida | 626 | 1.3 | 70.4 | 3.2 | 7.3 | 18.5 | 8,581 | 17.5 | 97.6 | 0.2 | 0.1 | 2.0 |
| Georgia | 634 | 3.1 | 9.9 | 0.0 | 88.8 | 0.5 | 7,611 | 37.1 | 97.4 | 0.5 | 0.1 | 0.8 |
| Idaho | - | 0.0 | - | - | - | - | 1,353 | 42.1 | 98.5 | 0.4 | 0.0 | 1.0 |
| Illinois | 13,238 | 37.8 | 5.6 | 1.6 | 90.0 | 1.8 | 3,071 | 8.8 | 81.5 | 1.9 | 10.7 | 3.9 |
| Indiana | - | 0.0 | - | - | - | - | 9,299 | 42.3 | 99.7 | 0.1 | 0.0 | 0.1 |
| Iowa | 1,164 | 12.3 | 87.6 | 0.8 | 11.3 | 0.3 | 3,320 | 35.1 | 98.9 | 0.8 | 0.2 | 0.0 |
| Kansas | 431 | 5.3 | 67.7 | 1.9 | 27.6 | 2.1 | 3,144 | 38.7 | 99.4 | 0.2 | 0.3 | 0.2 |
| Kentucky | 898 | 6.5 | 35.3 | 0.6 | 63.5 | 0.4 | 3,609 | 26.0 | 92.5 | 0.4 | 6.6 | 0.2 |
| Louisiana | 178 | 1.2 | 87.1 | 2.8 | 10.1 | 0.0 | 4,991 | 32.5 | 97.6 | 2.0 | 0.3 | 0.1 |
| Maine | 448 | 8.5 | 60.0 | 13.8 | 20.8 | 5.1 | 824 | 15.7 | 88.7 | 6.2 | 1.1 | 3.4 |
| Maryland | 3,804 | 32.4 | 0.1 | 1.3 | 98.3 | 0.2 | 111 | 0.9 | 25.2 | 0.0 | 74.8 | 0.0 |
| Massachusetts | 1,517 | 5.1 | 2.7 | 0.6 | 95.2 | 1.5 | 4,822 | 16.2 | 97.5 | 0.3 | 0.9 | 1.2 |
| Minnesota | 3,837 | 22.1 | 9.0 | 0.6 | 90.1 | 0.3 | 4,007 | 23.0 | 80.4 | 1.5 | 17.7 | 0.3 |
| Mississippi | - | 0.0 | - | - | - | - | 2,373 | 26.0 | 97.7 | 0.3 | 0.0 | 1.9 |
| Missouri | - | 0.0 | - | - | - | - | 8,804 | 43.0 | 97.5 | 1.6 | 0.0 | 0.8 |
| Montana | 701 | 25.8 | 1.1 | 0.0 | 98.3 | 0.0 | 212 | 7.8 | 73.1 | 19.3 | 7.1 | 0.0 |
| Nebraska | 1,478 | 25.2 | 0.0 | 0.7 | 98.2 | 0.8 | 7 | 0.1 | 71.4 | 14.3 | 0.0 | 14.3 |
| Nevada | 1 | 0.0 | 100.0 | 0.0 | 0.0 | 0.0 | 1,171 | 39.6 | 92.4 | 2.7 | 0.0 | 2.4 |
| New Hampshire | 561 | 15.6 | 13.9 | 0.0 | 84.5 | 0.9 | 722 | 20.1 | 94.5 | 0.4 | 4.0 | 0.8 |
| New Jersey | 1,209 | 5.4 | 0.0 | 0.0 | 99.8 | 0.0 | 7,962 | 35.7 | 97.9 | 1.6 | 0.0 | 0.5 |
| New Mexico | - | 0.0 | - | - | - | - | 1,195 | 33.2 | 99.2 | 0.4 | 0.0 | 0.3 |
| New York | 27,961 | 40.2 | 0.0 | 0.9 | 98.8 | 0.1 | 322 | 0.5 | 68.9 | 5.3 | 24.8 | 0.0 |
| North Carolina | 1,755 | 9.0 | 0.0 | 2.0 | 86.3 | 11.7 | 4 | 0.0 | 50.0 | 25.0 | 0.0 | 25.0 |
| North Dakota | 926 | 35.5 | 0.0 | 0.4 | 99.5 | 0.1 | 3 | 0.1 | 66.7 | 0.0 | 33.3 | 0.0 |
| Ohio | - | 0.0 | - | - | - | - | 14,217 | 34.2 | 97.3 | 0.5 | 0.0 | 1.7 |
| Oklahoma | 118 | 0.9 | 69.5 | 1.7 | 11.9 | 16.9 | 4,986 | 38.7 | 95.1 | 0.7 | 0.0 | 4.1 |
| Oregon | 90 | 1.3 | 87.8 | 2.2 | 10.0 | 0.0 | 3,306 | 46.3 | 99.1 | 0.6 | 0.1 | 0.2 |
| Pennsylvania | 4,902 | 12.4 | 3.8 | 0.2 | 95.7 | 0.4 | 8,158 | 20.6 | 97.3 | 0.5 | 1.5 | 0.7 |
| Rhode Island | 105 | 2.9 | 29.5 | 1.0 | 68.6 | 1.0 | 1,412 | 38.6 | 97.0 | 0.6 | 2.5 | 0.0 |
| South Carolina | - | 0.0 | - | - | - | - | 3,433 | 39.6 | 99.2 | 0.5 | 0.0 | 0.3 |
| South Dakota | - | 0.0 | - | - | - | - | 818 | 30.3 | 98.2 | 1.1 | 0.0 | 0.5 |
| Texas | 43 | 0.1 | 23.3 | 30.2 | 46.5 | 0.0 | 18,390 | 38.4 | 99.5 | 0.2 | 0.0 | 0.3 |
| Utah | 148 | 4.7 | 35.8 | 0.0 | 60.1 | 4.1 | 731 | 23.3 | 95.3 | 2.3 | 1.1 | 1.2 |
| Vermont | 296 | 14.4 | 33.1 | 0.0 | 63.9 | 0.0 | 619 | 30.2 | 97.7 | 0.2 | 0.8 | 0.0 |
| Virginia | 496 | 3.4 | 16.7 | 1.8 | 80.8 | 0.6 | 6,174 | 41.9 | 98.3 | 0.5 | 0.2 | 1.0 |
| Washington | 415 | 3.1 | 20.5 | 1.0 | 75.7 | 1.2 | 5,967 | 45.1 | 96.5 | 1.5 | 0.5 | 0.5 |
| West Virginia | 37 | 0.6 | 27.0 | 59.5 | 10.8 | 0.0 | 554 | 9.4 | 71.8 | 25.3 | 0.0 | 2.7 |
| Wisconsin | 1,363 | 7.6 | 25.9 | 0.4 | 73.4 | 0.2 | 5,466 | 30.3 | 97.3 | 0.5 | 2.1 | 0.1 |
| Wyoming | - | 0.0 | - | - | - | - | 469 | 36.5 | 96.2 | 3.0 | 0.0 | 0.6 |
SOURCE: MAX, 2001-2002 for 46 states with representative FFS nursing home data. NOTE: Nursing home data are unreliable in MAX 2001 or MAX 2002 for five states: most nursing facility services in Arizona and Tennessee are not included because they are provided under managed care arrangements; spells are overestimated for District of Columbia; the number of nursing home users is overestimated in Hawaii; and nursing facility service use is underreported in Michigan.
| ||||||||||||
| TABLE C.6. Medicaid Enrollment and Non-Medicaid Nursing Home Use Prior to Medicaid-Financed Nursing Home Spells Starting Between July 2001 and December 2002a | ||||||||||||||
| Number of Enrollees | Percentage Enrolled in Medicaid Within Six Months Prior to Spell Start | Months of Medicaid Enrollment in Six Months Prior to First Spell Start | Percentage With Valid Admission Data | Percentage in Nursing Home Prior to Spell Startb | Months In Nursing Home Prior to First Spell Startb | Percentage In Nursing Home Prior to Spell Start but With No Medicaid Enrollmentb | ||||||||
| 0 | 1-2 | 3-4 | 5+ | 0 | 1-6 | 7-12 | 13-24 | 25+ | ||||||
| All 46 States | 743,011 | 69.8 | 30.2 | 12.7 | 5.3 | 51.8 | 51.6 | 50.5 | 49.5 | 29.1 | 5.0 | 7.2 | 9.2 | 14.3 |
| Alabama | 12,122 | 65.5 | 34.5 | 4.5 | 2.2 | 58.8 | 100.0 | 46.5 | 53.5 | 32.0 | 3.9 | 5.4 | 5.2 | 15.1 |
| Alaska | 482 | 74.7 | 25.3 | 7.7 | 6.4 | 60.6 | 100.0 | 28.4 | 71.6 | 18.9 | 2.3 | 4.1 | 3.1 | 5.8 |
| Arkansas | 8,541 | 61.8 | 38.2 | 5.5 | 3.1 | 53.2 | 100.0 | 50.6 | 49.4 | 32.2 | 5.1 | 5.8 | 7.5 | 21.5 |
| California | 71,609 | 79.9 | 20.1 | 10.5 | 4.4 | 64.9 | 69.8 | 43.0 | 57.0 | 24.6 | 4.7 | 6.3 | 7.4 | 13.8 |
| Colorado | 8,620 | 72.1 | 27.9 | 14.0 | 4.7 | 53.4 | 99.5 | 45.3 | 54.7 | 23.6 | 5.2 | 7.0 | 9.5 | 8.8 |
| Connecticut | 14,455 | 73.4 | 26.6 | 12.6 | 4.6 | 56.1 | 0.0 | - | - | - | - | - | - | - |
| Delaware | 1,763 | 63.1 | 36.9 | 11.0 | 4.5 | 47.5 | 100.0 | 64.5 | 35.5 | 36.6 | 5.3 | 8.5 | 14.2 | 20.4 |
| Florida | 49,032 | 61.7 | 38.3 | 13.6 | 4.4 | 43.7 | 0.0 | - | - | - | - | - | - | - |
| Georgia | 20,535 | 71.8 | 28.2 | 12.8 | 6.6 | 52.3 | 0.0 | - | - | - | - | - | - | - |
| Idaho | 3,215 | 65.3 | 34.7 | 12.0 | 5.3 | 48.0 | 99.5 | 48.5 | 51.5 | 30.3 | 5.0 | 7.0 | 6.1 | 16.9 |
| Illinois | 34,997 | 71.2 | 28.8 | 17.2 | 9.1 | 44.9 | 98.8 | 28.0 | 72.0 | 13.2 | 3.1 | 5.2 | 6.5 | 1.4 |
| Indiana | 21,990 | 68.8 | 31.2 | 14.1 | 8.8 | 46.0 | 100.0 | 60.5 | 39.5 | 32.4 | 6.2 | 9.4 | 12.6 | 19.7 |
| Iowa | 9,469 | 68.8 | 31.2 | 15.8 | 6.5 | 46.4 | 0.0 | - | - | - | - | - | - | - |
| Kansas | 8,125 | 64.2 | 35.8 | 15.7 | 5.9 | 42.6 | 0.0 | - | - | - | - | - | - | - |
| Kentucky | 13,897 | 71.5 | 28.5 | 14.4 | 5.7 | 51.4 | 0.0 | - | - | - | - | - | - | - |
| Louisiana | 15,361 | 65.2 | 34.8 | 7.6 | 3.7 | 53.9 | 97.0 | 47.5 | 52.5 | 23.6 | 3.8 | 7.5 | 12.6 | 11.9 |
| Maine | 5,261 | 81.5 | 18.5 | 6.8 | 4.9 | 69.9 | 100.0 | 51.1 | 48.9 | 37.5 | 4.9 | 5.4 | 3.3 | 11.1 |
| Maryland | 11,729 | 58.3 | 41.7 | 13.8 | 4.0 | 40.6 | 0.0 | - | - | - | - | - | - | - |
| Massachusetts | 29,725 | 73.5 | 26.5 | 14.0 | 4.5 | 55.1 | 100.0 | 52.5 | 47.5 | 28.6 | 6.7 | 8.5 | 8.7 | 17.9 |
| Minnesota | 17,384 | 72.9 | 27.1 | 21.5 | 6.0 | 45.4 | 99.7 | 57.7 | 42.3 | 33.0 | 6.4 | 8.0 | 10.4 | 14.7 |
| Mississippi | 9,138 | 83.7 | 16.3 | 10.4 | 6.1 | 67.3 | 98.7 | 40.0 | 60.0 | 26.6 | 3.2 | 4.6 | 5.6 | 5 |
| Missouri | 20,492 | 68.1 | 31.9 | 11.5 | 5.0 | 51.5 | 0.0 | - | - | - | - | - | - | - |
| Montana | 2,720 | 53.9 | 46.1 | 11.7 | 4.9 | 37.2 | 100.0 | 56.1 | 43.9 | 34.1 | 6.6 | 7.4 | 8.0 | 29.1 |
| Nebraska | 5,854 | 64.8 | 35.2 | 12.5 | 5.5 | 46.9 | 100.0 | 55.4 | 44.6 | 27.5 | 6.5 | 9.4 | 12.0 | 24.6 |
| Nevada | 2,959 | 77.9 | 22.1 | 18.1 | 7.5 | 52.2 | 0.0 | - | - | - | - | - | - | - |
| New Hampshire | 3,599 | 48.7 | 51.3 | 9.8 | 3.9 | 35.1 | 0.0 | - | - | - | - | - | - | - |
| New Jersey | 22,295 | 65.2 | 34.8 | 13.6 | 6.3 | 45.4 | 100.0 | 50.8 | 49.2 | 25.1 | 5.2 | 7.9 | 12.6 | 13.1 |
| New Mexico | 3,597 | 66.2 | 33.8 | 15.2 | 3.8 | 47.1 | 90.9 | 48.9 | 51.1 | 30.1 | 3.6 | 5.8 | 9.4 | 14.1 |
| New York | 69,508 | 74.1 | 25.9 | 13.2 | 5.1 | 55.8 | 0.0 | - | - | - | - | - | - | - |
| North Carolina | 19,484 | 89.8 | 10.2 | 8.5 | 4.5 | 76.8 | 100.0 | 54.8 | 45.2 | 40.0 | 3.7 | 5.7 | 5.3 | 5.3 |
| North Dakota | 2,606 | 57.1 | 42.9 | 12.0 | 4.3 | 40.7 | 100.0 | 57.4 | 42.6 | 28.9 | 6.8 | 8.5 | 13.2 | 30.1 |
| Ohio | 41,519 | 60.6 | 39.4 | 13.4 | 3.7 | 43.4 | 0.0 | - | - | - | - | - | - | - |
| Oklahoma | 12,886 | 66.7 | 33.3 | 8.5 | 3.6 | 54.6 | 99.8 | 32.1 | 67.9 | 12.7 | 4.0 | 6.7 | 8.7 | 5.1 |
| Oregon | 7,143 | 72.3 | 27.7 | 10.2 | 4.1 | 58.0 | 0.0 | - | - | - | - | - | - | - |
| Pennsylvania | 39,603 | 57.7 | 42.3 | 15.0 | 5.5 | 37.3 | 99.9 | 73.9 | 26.1 | 46.7 | 6.5 | 8.3 | 12.4 | 25.9 |
| Rhode Island | 3,659 | 75.6 | 24.4 | 13.4 | 4.5 | 57.7 | 99.6 | 48.1 | 51.9 | 29.9 | 3.8 | 6.5 | 7.8 | 8.3 |
| South Carolina | 8,678 | 77.4 | 22.6 | 13.5 | 6.5 | 57.4 | 0.0 | - | - | - | - | - | - | - |
| South Dakota | 2,697 | 58.8 | 41.2 | 11.2 | 4.0 | 43.5 | 0.0 | - | - | - | - | - | - | - |
| Texas | 47,936 | 71.2 | 28.8 | 11.4 | 5.3 | 54.5 | 0.0 | - | - | - | - | - | - | - |
| Utah | 3,139 | 58.7 | 41.3 | 13.1 | 4.6 | 41.1 | 0.0 | - | - | - | - | - | - | - |
| Vermont | 2,052 | 78.1 | 21.9 | 7.2 | 4.5 | 66.5 | 99.7 | 54.4 | 45.6 | 32.8 | 5.4 | 7.9 | 8.4 | 12.1 |
| Virginia | 14,720 | 78.1 | 21.9 | 15.8 | 8.9 | 53.5 | 100.0 | 59.2 | 40.8 | 35.3 | 5.2 | 8.7 | 10.1 | 11.9 |
| Washington | 13,228 | 73.8 | 26.2 | 9.0 | 5.7 | 59.1 | 98.7 | 28.6 | 71.4 | 13.6 | 2.6 | 5.5 | 6.9 | 2.7 |
| West Virginia | 5,882 | 62.4 | 37.6 | 8.8 | 4.4 | 49.2 | 100.0 | 67.3 | 32.7 | 38.6 | 5.5 | 8.2 | 15.1 | 24.8 |
| Wisconsin | 18,019 | 59.2 | 40.8 | 14.7 | 4.6 | 39.9 | 100.0 | 60.5 | 39.5 | 36.2 | 6.6 | 8.3 | 9.4 | 25.8 |
| Wyoming | 1,286 | 55.9 | 44.1 | 12.2 | 3.1 | 40.6 | 0.0 | - | - | - | - | - | - | - |
SOURCE: MAX, 2001-2002, for 46 states with representative FFS nursing home data. NOTE: Nursing home data are unreliable in MAX 2001 or MAX 2002 for five states and are not included in this table: most nursing facility services in Arizona and Tennessee are not included in MAX because they are provided under managed care arrangements; spells are overestimated for District of Columbia; the number of nursing home users is overestimated in Hawaii; and nursing facility service use is underreported in Michigan. For details, see Appendix B.
| ||||||||||||||
NOTES
-
Data from Arizona and Tennessee were excluded because many long-term care services were provided through managed care arrangements in these states. Problems linking data across years for District of Columbia, potentially inaccurate reporting of long-term care service use in Hawaii, and bundled service reporting in Michigan resulted in the exclusion of these states from our analyses. See Appendix B for more detail.
-
Section 209(b) states are states that have elected to use more restrictive Medicaid eligibility requirements than those of the SSI program, but these requirements cannot be more restrictive than those in place in the states Medicaid plan as of January 1, 1972.
-
For further detail, see Wenzlow et al. 2007 or the CMS MAX website at [http://www.cms.hhs.gov/MedicaidDataSourcesGenInfo/07_MAXGeneralInformati....
-
In a study of the larger Medicaid population in 2002, we identified 5,876 child or adult enrollees who used nursing facility services at some point in 2002, reflecting about 0.4 percent of the 1,506,639 enrollees using Medicaid-financed fee-for-service (FFS) nursing facility services nationwide that year.
-
There is some ambiguity about the MAS group of people qualifying based on SSI-related criteria in Section 209(b) states. They may be reported in either the cash assistance-related or Other MAS groups.
-
Although MAX nursing facility claims files include a measure of copayment amounts made by Medicaid for Medicare-covered skilled nursing facility stays, reporting practices vary across Medicare carriers and intermediaries and as a result, these data are of unknown quality.
-
Additionally, MSIS and Social Security numbers could not be reconciled for less than 0.01 percent of records. These were cases in which two or more Social Security numbers were associated with the same MSIS ID within a state. Such records were excluded from our analyses.
-
Expenditures for any institutional or community-based long-term care services provided under managed care are subsumed into managed care premiums. Services covered under managed care (including any for long-term care) generally cannot be identified in MAX as they are reported in encounter records, which are known to be incomplete in MSIS and MAX. The use of MAX to examine long-term care expenditures in states with managed care programs like Arizonas is limited to overall expenditure analyses.
-
While admission dates, when available, provide some additional information about nursing facility services that may not be captured in MAX, only a limited set of states and facilities include admission dates on their claims records, and this information only reflects services used in the nursing facility in which the person resides at the time the claim is paid.
-
Full-benefit enrollees exclude people eligible for only family-planning services, unqualified aliens eligible for only emergency hospital services, and restricted-benefit duals receiving only coverage for Medicare premiums and cost sharing. Some enrollees may be eligible for a restricted set of services but are coded as full-benefit enrollees--for example, those eligible for only prescription drug coverage and Medicare cost sharing.
-
Based on results presented in Wenzlow, Schmitz & Shepperson (2008), we also estimate that aged enrollees represented a smaller share of the aged or disabled long-term care users in 2002 in Alaska (46.0 percent) than in any other state except Utah (44.7 percent). The national average was 59.5 percent. [http://aspe.hhs.gov/daltcp/reports/2008/profileMAX.htm]
-
About 30.2 percent of people with new Medicaid-financed nursing home spells had no Medicaid enrollment in the six months prior to entry (see Appendix Table C.6). Thus, at least 5.5 percent (35.7 - 30.2) were previously enrolled in Medicaid but not within two months prior to nursing home entry.
-
Only about 33 percent of people with new spells had valid patient discharge codes at the end of their first spell (codes that were missing or coded as still a patient). The representativeness of the reported results is unknown.
-
The quality of community-based long-term care service data in MAX for years 2001 and 2002 limits their use to obtain accurate national estimates. However, such analyses may be feasible for select states. See Wenzlow, Schmitz & Shepperson (2008) for further details regarding the quality of MAX community long-term care data by state. [http://aspe.hhs.gov/daltcp/reports/2008/profileMAX.htm]