
ASPE Research NotesINFORMATION FOR DECISION MAKERS |
| FOCUS ON: Family Issues | Issued May 1995 |
Trends in AFDC and Food Stamp Benefits: 1972-1994PDF Version: http://aspe.hhs.gov/daltcp/reports/1995/rn13.pdf (5 PDF pages) | |
The Social Security Act of 1935 established a program to provide financial assistance to dependent children; the program was later renamed Aid to Families with Dependent Children (AFDC). AFDC is a cash grant program to enable States to aid needy children without fathers. It provides cash welfare payments for needy children who have been deprived because their father or mother is absent from the home or for certain others in the household of the child. Federal funds pay 50-80% (55% on average) of benefits and half of the cost of State and local government administration. After a pilot program that began in 1961, the Food Stamp Act of 1964 established the Food Stamp program with 22 States participating. Legislation in 1971 established uniform national standards requiring family allotments large enough to purchase a nutritionally adequate diet and required automatic cost-of-living increases in allotments; in 1974 the Food Stamp Program became mandatory in all States. The program is 100% federally funded.
1972-1980: Real AFDC Benefits Shrink as Inflation Soars
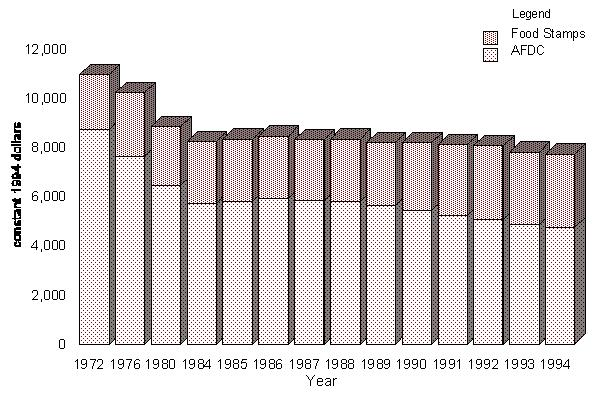
From 1972 to 1980 AFDC benefits increased in current dollars by 43%. However, the double digit inflation in the mid and late 1970s increased the Consumer Price Index (CPI) by 95% during the same period. By 1980, benefits were $6,424 (in constant 1994 dollars), less than three-quarters of their 1972 level.
From 1972 to 1976 Food Stamp benefits increased in current dollars by 57% (a 16% real increase). Program changes in the late 1970s slowed current dollar growth to less than the rate of inflation. This produced a decline from $2,556 to $2,407 (in constant 1994 dollars), 1 6% real decrease.
In 1972, AFDC benefits were 80% of the combined total of AFDC and Food Stamp benefits. By 1980, they were 73%.
Combined AFDC & Food Stamp benefits increase in current dollars by 26% from 1972 to 1976, 1 7% real decrease. From 1976 to 1980 they increased in current dollars by 25% (a 13% real decrease).
From 1972 through 1977 State governments' spending on AFDC benefits and administration experienced a 16% increase in real terms. State governments' real spending dropped by 14% from 1977 to 1980. As a proportion of their net revenues (revenues minus intergovernmental transfers), the States' AFDC spending declined from 3.8% in 1972 to 2.9% in 1980.
1981-1990: AFDC Benefits Fall, Rise, and Fall Further
From 1980 through 1984, AFDC benefits decreased an additional 11% from $6,424 to $5,717 (in constant 1994 dollars). In current-dollar terms, benefit levels increased by 14% but inflation pushed up prices by nearly 30%.
From 1984 to 1986 (for the first time since the late 1960s and early 1970s), current-dollar AFDC benefit levels increased faster (10%) than inflation (6.3%), resulting in a 3.6% real increase in AFDC benefits.
From 1986 to the end of the decade, the average annual current-dollar increase in the AFDC benefit level averaged less than 2%, while the rate of inflation for this period averaged 4.6% per year. The cumulative result was a 5.9% real decline from $5,922 to $5,426. By 1989, real AFDC benefits were less than 65% of their real 1972 level.
Over the decade, Food Stamp benefits increased in current-dollar terms by 62% in comparison to the 53% increase in the price level for a 6% real increase for the 1980s. This increase only partly offsets the AFDC decrease so that total benefits declined by 7.5% in real terms. The opposing trends in AFDC and Food Stamps reduced the AFDC benefit to 69% of the combined total by 1989.
During the eighties, State governments' spending on AFDC as a proportion of their net revenues continued to decline, reaching only 1.9% in 1989.
1991-Present: Current Dollar AFDC Cash Benefits Cut
In contrast to earlier periods, the sharp drop in real AFDC benefits in the 1990s was not due purely to inflation. Beginning in 1991, States began reducing current-dollar AFDC benefit levels. From 1991 to 1994 current dollar benefits were reduced in 9 States, 21 others provided no increase, and another 10 increased benefits by less than 1.2% per year; these cuts along with the effects of inflation produced a 7.1% real decrease in average benefits from 1991 to 1994. Of the $483 real decrease in AFDC benefits from 1991 to 1994. Food Stamp increases offset only 17% leaving a $402 net decrease (5.0%) in the combined total benefits. By 1994, the AFDC benefit had shrunk to a little under 62% of the combined benefit package.
In 1970, State governments were spending equal amounts on AFDC and Medicaid. By 1979, they were spending 70% more on Medicaid than on AFDC. By the end of the 1980s, State spending on Medicaid was 3 times spending on AFDC and the ratio rose to nearly 4.5 times by 1992. Increases in the early 1990s in Medicaid costs (averaging nearly 25% per year) pushed them in nearly 9% of States' net revenues by 1992.
1972-Present: Summary
From 1972 to the present, AFDC benefits declined in real constant-dollars terms almost without interruption, the exception being the two years from 1984 to 1986. Since Food Stamps are indexed for inflation, AFDC benefits became a significantly smaller share of the combined total. Total benefits declined sharply in the 1970s, remained stable during the 1980s, and in the 1990s began to decline again.
AUTHOR: Gilbert L. Crouse, Ph.D., Office of Human Services
Circulated periodically by the Office of the Assistant Secretary for Planning and Evaluation. This paper reflects only the views of its author(s) and does not necessarily represent the position of the Department of Health and Human Services. For further information on family issues, contact the Wendell Primus, Office of Human Services Policy at 202-690-7409.
| AFDC & Food Stamp Benefits for a Mother and Two Children with No Earnings | ||||
| Selected Years | AFDC | Food Stamps | Total | Percent Poverty |
| 1972 | 8,735 | 2,201 | 10,936 | 92.5 |
| 1976 | 7,641 | 2,556 | 10,198 | 86.3 |
| 1980 | 6,424 | 2,407 | 8,831 | 74.7 |
| 1984 | 5,717 | 2,486 | 8,202 | 69.4 |
| 1986 | 5,922 | 2,505 | 8,427 | 71.3 |
| 1988 | 5,767 | 2,556 | 8,324 | 70.4 |
| 1990 | 5,426 | 2,749 | 8,175 | 69.2 |
| 1992 | 5,046 | 3,028 | 8,074 | 68.3 |
| 1993 | 4,845 | 2,971 | 7,815 | 66.1 |
| 1994 | 4,738 | 2,963 | 7,702 | 65.2 |
| percent change | ||||
| 1972-94 | -45.8 | 34.6 | -29.6 | |
| 1972-76 | -12.5 | 16.1 | -6.8 | |
| 1976-80 | -11.0 | 3.3 | -7.1 | |
| 1980-84 | -11.0 | 3.3 | -7.1 | |
| 1984-88 | 0.9 | 2.8 | 1.5 | |
| 1988-92 | -12.5 | 18.4 | -3.0 | |
| 1992-94 | -6.1 | -2.1 | -4.6 | |
| NOTE: Weighted averages across States in constant 1994 dollars; dollars adjusted for inflation using CPI-U.SOURCE: ASPE & Ways and Means Committee staff based upon State AFDC benefit data compiled by Congressional Research Service. | ||||
| AFDC & Food Stamp Benefit Levels (Mother & Two Children without Earnings) |
 |
ASPE RESEARCH NOTES ARTICLES AVAILABLE
- Cost of Teenage Childbearing: Current Trends (August 1992)
- Full HTML Version http://aspe.hhs.gov/daltcp/reports/1992/rn03.htm
- Full PDF Version http://aspe.hhs.gov/daltcp/reports/1992/rn03.pdf
- Counting Persons in Poverty on the Current Population Survey (August 1998)
- Full HTML Version http://aspe.hhs.gov/daltcp/reports/1998/rn20.htm
- Full PDF Version http://aspe.hhs.gov/daltcp/reports/1998/rn20.pdf
- Disability Among Children (January 1995)
- Full HTML Version http://aspe.hhs.gov/daltcp/reports/1995/rn10.htm
- Full PDF Version http://aspe.hhs.gov/daltcp/reports/1995/rn10.pdf
- Eldercare: The Impact of Family Caregivers' Employment on Formal and Informal Helper Hours (August 1995)
- Full HTML Version http://aspe.hhs.gov/daltcp/reports/1995/rn14.htm
- Full PDF Version http://aspe.hhs.gov/daltcp/reports/1995/rn14.pdf
- Estimating Eligibility for Publicly-Financed Home Care: Not a Simple Task (April 1992)
- Full HTML Version http://aspe.hhs.gov/daltcp/reports/1992/rn01.htm
- Full PDF Version http://aspe.hhs.gov/daltcp/reports/1992/rn01.pdf
- Health Insurance in 1994 from the Current Population Survey: Measurement Difficulties (November 1996)
- Full HTML Version http://aspe.hhs.gov/daltcp/reports/1996/rn15.htm
- Full PDF Version http://aspe.hhs.gov/daltcp/reports/1996/rn15.pdf
- Informal Caregiver "Burnout": Predictors and Prevention (April 1993)
- Full HTML Version http://aspe.hhs.gov/daltcp/reports/1993/rn05.htm
- Full PDF Version http://aspe.hhs.gov/daltcp/reports/1993/rn05.pdf
- Licensed Board and Care Homes: Preliminary Findings from the 1991 National Health Provider Inventory (May 1993)
- Full HTML Version http://aspe.hhs.gov/daltcp/reports/1993/rn06.htm
- Full PDF Version http://aspe.hhs.gov/daltcp/reports/1993/rn06.pdf
- March 1992 Current Population Survey Shows Health Insurance Coverage Up in 1991: Number of Medicaid Recipients Also Rises (February 1993)
- Full HTML Version http://aspe.hhs.gov/daltcp/reports/1993/rn04.htm
- Full PDF Version http://aspe.hhs.gov/daltcp/reports/1993/rn04.pdf
- March 1993 Current Population Survey Re-Benchmarked on 1990 Census (March 1995)
- Full HTML Version http://aspe.hhs.gov/daltcp/reports/1995/rn12.htm
- Full PDF Version http://aspe.hhs.gov/daltcp/reports/1995/rn12.pdf
- Number of Medicaid Recipients Up: CPS Shows the Number of Uninsured Also Rises (April 1992)
- Full HTML Version http://aspe.hhs.gov/daltcp/reports/1992/rn02.htm
- Full PDF Version http://aspe.hhs.gov/daltcp/reports/1992/rn02.pdf
- Population Estimates of Disability and Long-Term Care (February 1995)
- Full HTML Version http://aspe.hhs.gov/daltcp/reports/1995/rn11.htm
- Full PDF Version http://aspe.hhs.gov/daltcp/reports/1995/rn11.pdf
- Research and Other Developments of Interest in Employer Group Long-Term Care Insurance ( )
- Full HTML Version http://aspe.hhs.gov/daltcp/reports/rn19.htm
- Full PDF Version http://aspe.hhs.gov/daltcp/reports/rn19.pdf
- The Elderly with Disabilities: At Risk for High Health Care Costs (February 1994)
- Full HTML Version http://aspe.hhs.gov/daltcp/reports/1994/rn08.htm
- Full PDF Version http://aspe.hhs.gov/daltcp/reports/1994/rn08.pdf
- The Medicaid Personal Care Services Option Part I: Cross-State Variations and Trends Over Time (November 1993)
- Full HTML Version http://aspe.hhs.gov/daltcp/reports/1993/rn07.htm
- Full PDF Version http://aspe.hhs.gov/daltcp/reports/1993/rn07.pdf
- The Medicaid Personal Care Services Option Part II: Consumer-Directed Models of Care (December 1994)
- Full HTML Version http://aspe.hhs.gov/daltcp/reports/1994/rn09.htm
- Full PDF Version http://aspe.hhs.gov/daltcp/reports/1994/rn09.pdf
- Trends in AFDC and Food Stamp Benfits: 1972-1994 (May 1995)
- Full HTML Version http://aspe.hhs.gov/daltcp/reports/1995/rn13.htm
- Full PDF Version http://aspe.hhs.gov/daltcp/reports/1995/rn13.pdf
- Understanding Estimates of Uninsured Children: Putting the Differences in Context (January 1999)
- Full HTML Version http://aspe.hhs.gov/daltcp/reports/1999/rn21.htm
- Full PDF Version http://aspe.hhs.gov/daltcp/reports/1999/rn21.pdf
To obtain a printed copy of this report, send the full report title and your mailing information to:
U.S. Department of Health and Human ServicesOffice of Disability, Aging and Long-Term Care PolicyRoom 424E, H.H. Humphrey Building200 Independence Avenue, S.W.Washington, D.C. 20201FAX: 202-401-7733Email: webmaster.DALTCP@hhs.gov
RETURN TO:
Office of Disability, Aging and Long-Term Care Policy (DALTCP) Home [http://aspe.hhs.gov/_/office_specific/daltcp.cfm]Assistant Secretary for Planning and Evaluation (ASPE) Home [http://aspe.hhs.gov]U.S. Department of Health and Human Services Home [http://www.hhs.gov]