
Simi Litval, Ph.D., and Jae Kennedy, M.A.
World Institute on Disability
Research and Training Center on Public Policy in Independent Living
December 1991
This report was prepared under contract #HHS-100-89-0025 between the U.S. Department of Health and Human Services (HHS), Office of Disability, Aging and Long-Term Care Policy (DALTCP) and the World Institute on Disability. For additional information about this subject, you can visit the DALTCP home page at http://aspe.hhs.gov/office_specific/daltcp.cfm or contact the ASPE Project Officer, Pamela Doty, at HHS/ASPE/DALTCP, Room 424E, H.H. Humphrey Building, 200 Independence Avenue, S.W., Washington, D.C. 20201. Her e-mail address is: Pamela.Doty@hhs.gov.
The opinions and views expressed in this report are those of the authors. They do not necessarily reflect the views of the Department of Health and Human Services, the contractor or any other funding organization.
TABLE OF CONTENTS
Purpose
Source of Information
Income Criteria
Age Groups Eligible and Served
Degree of Disability
Type of Disability
Other Eligibility Criteria
Size of the Program Relative to Potential Users
Personal Care Services
Household Maintenance Services
Communication Services
Transportation Services
Short-term Services
AVAILABILITY AND INTENSITY OF SERVICE DELIVERY
Hours and Days Available
Service Limits
Availability of Services 24 Hours/Day
Relationship between Provider Type and Hours of Service
Description of Goals
Degree to Which Goals are Met
Eligibility Limits to Access
Program Features Limiting Access
External Factors Limiting Access
Population Target Priorities
Benefits and Wages
Relationship between Provider Type, Payment Mechanism and Payment Rate
Who is the Employer
Nurse Practice Acts
State Level Oversight
Case Level Oversight
Attendant Screening and Training
Recipient Complaint Mechanisms
Household and Chore Tasks
Service Location
Exclusion of Service to Those in Institutions of More than Four Individuals
Family Providers
Physician Oversight
Nurse Supervision
ROLE OF PERSONAL CARE OPTION WITHIN THE STATE
Site Visit States
Who is Underserved or Unserved
Growth Rate of Participation
Growth Rate of Expenditures, Recipients and Other Indicators
Change in Service Availability and Service Limits
Comparison of Growth Rate Across Funding Sources
Shifting of Resources Among Different Funding Sources
The Changing Role of the Medicaid Personal Care Option
Current Limitations of PC-Option Programs
Conclusions
APPENDICES
APPENDIX A: Summary of Each Personal Care Program Based on 1984 and 1988 Questionnaires
APPENDIX B: The Effect of Government Funding Source on Personal Assistance Programs: A Summary of 1985 National Survey Data
APPENDIX C: Chartbook of Tables from 1988 National Survey Data
APPENDIX D: Chartbook of Program Comparisons by Funding Source on 1984 and 1988 National Survey Data
LIST OF FIGURES
FIGURE C-1: Programs Surveyed by Funding Source Group
FIGURE C-2: 1988 PAS Expenditure Level Per Program by Funding Source Group
FIGURE C-3: 1988 PAS Average Expenditures Per Program by Funding Source Group
FIGURE C-4: 1988 Caseload Level Per Program by Funding Source Group
FIGURE C-5: Average 1988 Program Caseload by Funding Source Group
FIGURE C-6: Annual Hours of Service Level by Funding Source Group
FIGURE C-7: Average Total Hours of Service Provided by Funding Source Group
FIGURE C-8: Average Annual Expenditures Per Recipient by Funding Source Group
FIGURE C-9: Average Hours of PAS Per Week Per Recipient by Funding Source Group
FIGURE C-10: Income Eligibility Requirements
FIGURE C-11: Age Groups Eligible
FIGURE C-12: Maximum Hours Allowed Per Week Per Recipient
FIGURE C-13: Maximum Expenditure Limit Per Month Per Recipient
FIGURE C-14: Total Number of Programs Using Each Provider Type
FIGURE C-15: Percentage of Programs Utilizing Provider Types by Funding Source
FIGURE C-16: Hourly Attendant Wage by Provider Type and Wage Level
FIGURE C-17: Number of Benefits Received by Provider Type
FIGURE D-1: Comparison of 1984 and 1988 Average Expenditures Per Program by Funding Source Group
FIGURE D-2: Magnitude of Growth in Program Expenditures Between 1984 and 1988 by Funding Source, In Total Dollars and Corrected for Inflation
FIGURE D-3: Comparison of 1984 and 1988 Average Program Caseloads by Funding Source Group
FIGURE D-4: Magnitude of Growth in Program Caseloads Between 1984 and 1988 by Funding Source Group
FIGURE D-5: Comparison of 1984 and 1988 Average Total Hours of PAS Provided Per Program by Funding Source Group
FIGURE D-6: Change in Total Program Hours Between 1984 and 1988 by Funding Source Group
FIGURE D-7: Comparison of 1984 and 1988 Average Annual Program Expenditures Per Client by Funding Source Group
FIGURE D-8: Change in Expenditures Per Recipient Between 1984 and 1988 by Funding Source Group
LIST OF TABLES
TABLE 1: Income Levels for Aged and Disabled Medicaid Recipients Living in the Community
TABLE 2: Percentage of People Served by Age Group in Site Visit PC-Option Programs
TABLE 3: Degree of Disability of Program Recipients
TABLE 4: Personal Care Option Recipients Per Aged and Disabled Medicaid Recipient by State
TABLE 5: Medically Related Tasks
TABLE 6: Percentage of PC-Option Programs with Various Levels of Service Maximums Expressed in Hours Per Week
TABLE 7: Percentage of PC-Option Programs with Various Service Maximums Expressed in Dollars Per Month
TABLE 8: Average Number of Hours Per Week Per Recipient by Provider Type 1984 and 1988 All Funding Sources
TABLE 9: Goals of the PC-Option Programs
TABLE 10: How Need for Service is Defined and Assessed
TABLE 11: Percentage of PC-Option Programs Using Different Provider Types by Year
TABLE 12: Provider Benefits and Wages
TABLE 13: Type of Provider, Payment Mechanisms and Basis of Pay
TABLE 14: Who is the Employer?
TABLE 15: Case Level Oversight
TABLE 16: Who is Responsible for Attendant Screening?
TABLE 17: Nature, Extent and Source of Attendant Training
TABLE 18: Recipient Complaint/Grievance Mechanisms
TABLE 19: Proportion of Household/Chore to Personal Care Tasks
TABLE 20: Site of Service Provision: Transportation, Driving, Escort
TABLE 21: Service to Institutionalized Recipients
TABLE 22: Family Members Who Cannot Be Paid for Providing PAS
TABLE 23: Frequency of Physician Review/Reauthorization
TABLE 24: Frequency and Character of R.N. Oversight
TABLE 25: Who Is Underserved or Unserved in Each State PAS System
TABLE 26: Growth Rate of Participation in the Personal Care Optional Benefit by State
TABLE 27: Aggregate and Average per PC-Option Program Growth Rate of Expenditures and Recipients Between 1984 and 1988 Recipients Expenditures
TABLE 28: Growth Rate of Expenditures and Recipients of PC-Option Programs by State in 1984 and 1988
TABLE 29: Total and Average Per Program Growth in Hours
TABLE 30: Growth Rate of Various Program Indicators by Funding Source between 1984 and 1988
TABLE B-1: Program Location and Funding Source
TABLE B-2: Average Total Expenditures, Client Load, Expenditures Per Client, Total Hours of Service, Cost Per Hour of Service and Average Hours of Service Per Client
TABLE B-3: Scope of Services Provided
TABLE B-4: Average Number of Total Services and Paramedical Services Provides
TABLE B-5: Medical Supervision Requirements
TABLE B-6: Frequency of Medical Supervision
TABLE B-7: Days and Times Service is Available
TABLE B-8: Service Limits
TABLE B-9: Income Eligibility Requirements
TABLE B-10: Asset Eligibility Requirements
TABLE B-11: Age Eligibility Requirements
TABLE B-12: Disability Group Eligibility
TABLE B-13: Other Eligibility Requirements
TABLE B-14: Provider Mode
TABLE B-15: Average Attendant Wages and Benefits
TABLE B-16: Independent Provider Regulation
TABLE B-17: Regulation on Family Members Providing Paid Attendant Services
TABLE B-18: Average Program Age
TABLE C-1: Programs Surveyed by Location and Funding Source Group
TABLE C-2: 1988 PAS Expenditure Level Per Program and Average Expenditures Per Program by Funding Source Group
TABLE C-3: 1988 Caseload Level and Average Caseloads Per Program by Funding Source Group
TABLE C-4: Average Total Hours of PAS Provided and Hour Level by Funding Source Group
TABLE C-5: Average Annual Expenditures Per Recipient by Funding Source Group
TABLE C-6: Average Hours of PAS Per Week Per Recipient by Funding Source Group
TABLE C-7: Income Eligibility Requirements by Funding Source Group
TABLE C-8: Age Groups Eligibility by Funding Source Group
TABLE C-9: Percentage of Programs Offering Assistance With Personal Assistance Tasks by Funding Source Group
TABLE C-10: Percentage of Programs Offering Assistance With Paramedical Tasks and Average Number of Paramedical Tasks Provided by Funding Source Group
TABLE C-11: Days and Times Service is Available by Funding Source Group
TABLE C-12: Maximum Hours Allowed Per Week Per Recipient and Maximum Expenditures Per Recipient by Funding Source Group
TABLE C-13: Percentage of Programs Which Require Medical Supervision and Changes in Medical Supervision Requirements by Funding Source Group
TABLE C-14: Average Hourly Attendant Wage by Funding Source Group
TABLE C-15: Average Number of Attendant Benefits by Funding Source
TABLE C-16: Degree of Consumer Control for Programs Which Utilize Independent Providers by Funding Source
TABLE D-1: Comparison of 1984 and 1988 Average Expenditures Per Program by Funding Source Group
TABLE D-2: Magnitude of Growth in Total Program Expenditures Between 1984 and 1988 by Funding Source Group, in Total Dollars and Corrected for Inflation
TABLE D-3: Comparison of 1984 and 1988 Average Program Caseloads by Funding Source Group
TABLE D-4: Magnitude of Growth in Program Caseloads Between 1984 and 1988 by Funding Source Group
TABLE D-5: Comparison of 1984 and 1988 Average Total Hours of PAS Provided Per Program by Funding Source Group
TABLE D-6: Magnitude of Change in Total Program Hours Between 1984 and 1988 by Funding Source Group
TABLE D-7: Comparison of 1984 and 1988 Average Annual Program Expenditures Per Client by Funding Source Group
TABLE D-8: Magnitude of Growth in Annual Program Expenditures Per Client Between 1984 and 1988 by Funding Source
TABLE D-9: Days and Times Service is Available by Funding Source Group
TABLE D-10: Comparison of 1984 and 1988 Maximum Hours Allowed Per Week Per Recipient by Funding Source
TABLE D-11: Change in Maximum Annual Expenditures Per Recipient Between 1984 and 1988 by Funding Source
TABLE D-12: Percentage of Programs Which Require Medical Supervision and Changes in Medical Supervision Requirements by Funding Source
TABLE D-13: Change in Number of Paramedical Services Provided between 1984 and 1988
TABLE D-14: Degree of Consumer Control for Programs Which Utilize Independent Providers by Funding Source
TABLE D-15: Program Changes Since 1984
ACKNOWLEDGEMENTS
This project was funded by the office of the Assistant Secretary of Planning and Evaluation (ASPE) US Department of Health and Human Services (HHS), contract #HHS-100-89-0025. Quantitative analyses were based on national surveys funded the Charles Stuart Mott Foundation and by the National Institute of Disability and Rehabilitation Research (NIDRR), grant #GO08720134.
The publication and distribution of this document is made possible through the Research and Training Center on Public Policy and Independent Living (NIDRR grant #H133B00006-91), a joint project with the World Institute on Disability, InfoUse, and The Western Consortium of Public Health, University of California. The authors would like to acknowledge the contributions of the HHS project officer, Pam Doty, the advice of Deborah Lewis-Idema, Marylin Falik, Marshall Kapp, Charles Sabatino, and Linda Toms-Barker, and the support of the entire staff at the World Institute on Disability. We would like to express our special thanks to the people who to time out their busy schedules to help us plan and conduct the site visits, who agreed to be interviewed, and who reviewed these program descriptions. Without these generous contributions of time and expertise, this research project would not have been possible. The content of these reports do not represent the policies of the funding agencies, and endorsement by the federal government should not be assumed.
EXECUTIVE SUMMARY
The Purpose of this Study
This study analyzes how states are using the Medicaid Personal Care Services Optional (PC-Option) benefit. Under the PC-Option, state may choose to include personal care services in their state Medicaid plans, but are not required to do so. The only Federal requirements for the PC-Option are that personal care services be: (1) provided in the home; (2) authorized by a physician in accordance with the recipient's treatment plan; (3) supervised by a registered nurse (RN); and (4) provided by a qualified individual who is not a member of the recipient's family. The first requirement has been modified by Federal legislation passed in 1990 which allows states to offer services outside the home by 1994. There is great variability among states on interpretation of the other requirements. The states determine how physician authorization is obtained and what constitutes a treatment plan. States also determine the nature and scheduling of RN supervision, set qualifications for providers, and determine what types of family members are excluded from becoming paid service providers.
In order to formulate long-term services policy, the Department of Health and Human Services contracted with the World Institute on Disability (WID) for this study to provide accurate "baseline" information to inform future policy decisions regarding the PC-Option. The data in this report (unless otherwise noted) is based on two national surveys of personal assistance service (PAS) programs conducted in 1985 and 1990 by WID, as well as site visits to six states which utilize the PC-Option.
Research Findings
The PC-Option programs fill different niches in the community-based PAS systems in every state. The programs range from those which are small and insignificant parts of the state's long-term services system to those in which the major or only source of PAS in the state is the PC-Option program. Even in states with a multiplicity of programs there are people who are unserved or under served: no state serves everyone who needs PAS.
The target population for Medicaid PC-Option programs is defined in each state by income, age, disability and other miscellaneous eligibility requirements. These populations may include children, working age adults and older people with physical, cognitive, and psychiatric disabilities. It seems that historical circumstances and the political clout of certain population groups have often determined which groups are served in a given state. The perceived needs of the target populations often influence the structure of the programs in terms of service mix, hours available, degree of oversight, etc. Determining who is actually being served by these programs is often difficult, due to the inconsistency of the management information systems that are designed to collect demographic data. As states attempt to serve diverse and growing populations needing PAS, they may opt to expand existing programs or develop new ones.
Most programs offer a basic core of activity of daily living and instrumental activity of daily living services but chore, repair and maintenance services are rarely offered. Transportation and escort services, if offered at all, are usually limited to medical appointments. Almost half the PC-Option programs limit services to less than 40 hours per week, regardless of level of disability.
The provision of paramedical services, particularly "invasive procedures" (e.g., assistance with medications, injections, catheters or ventilators) is particularly problematic for PC-Option programs. Such services are usually not readily available to consumers who need them, due in part to legal restrictions set by state Nurse Practice Acts which usually prohibit non-licensed individuals other than family members from doing invasive procedures. State administrators often cite these laws, and concern over liability for negligence, as reasons for not providing paramedical services through their programs.
Due to the lack of adequate paramedical, chore, transportation and escort services, the PC-Option programs in most states do not enable significantly disabled individuals to be full participants in their communities unless they have sufficient informal or voluntary assistance to fill in service gaps. This situation does not appear to be improving: between 1984 and 1988 there was a slight decrease in the number of programs providing paramedical services, as well as a decrease in the number of programs offering services at any time during the day or week.
There are several different ways in which personal assistance providers are employed. Independent or individual providers experience different conditions of employment depending upon the program and state. They may be considered self-employed or employed by the disabled recipient. Agency providers work for non-profit or for-profit agencies, and are generally considered the employees of the agency which hires them. Government agency providers fall into two different categories: civil service employees with the same wage scale and benefit packages as other government employees of similar skill and rank, and contract workers, employed by state and county governments on a primarily part-time basis with rates of pay, working conditions and benefits similar to those of independent providers.
On the average, agency providers and government workers receive the best wages, and government civil service workers receive the most benefits. Independent providers are the most poorly compensated providers. There is a strong relationship between the number of hours an individual is able to receive from a program and the type of provider utilized: generally programs that use independent providers provide more hours of service.
State administrators say that managerial concerns, such as liability, workers compensation, and tax withholding have shaped the structure of their programs in terms of provider type. Many states addressed these concerns by utilizing homecare agency providers, thereby shifting liability from the state to private agencies. Other states which utilize independent providers have developed different ways of dealing with withholding. Because there are advantages to using either type of provider, these issues become very complex. Both agency and individual providers have a role to play in a comprehensive system of PAS.
There are a number of ways in which states and the Federal government have tried to influence the quality of the PC-Option programs. These include: state-level oversight of overall program compliance standards, case level oversight, nurse supervision of attendants, attendant training and screening, and recipient complaint and grievance mechanisms. All states have some of these quality assurance mechanisms in place. Which mechanisms a state employs depends upon its philosophy or view of quality assurance. Some states emphasize quality assurance from "below", i.e., training the recipient to recognize quality and providing avenues for problems to be addressed; while others relied on quality assurance systems from "above", i.e., paper reviews and site visits. Still other limit their efforts to minimum compliance with regulatory requirements.
In 1988, the Health Care Financing Administration (HCFA) proposed new regulations for the program in an attempt to more concretely define "personal care", service location, "home", provider, and the nature of physician and nurse involvement. HCFA collected comments on the proposed regulations, but has not promulgated new regulations. The degree to which the states meet the proposed HCFA criteria varies. Some would have to radically change their program to meet the proposed regulations.
The PC-Option programs on the average experienced a high rate of growth. Seven states have added the PC-Option to their Medicaid plans since WID's first survey in 1984. Between 1984 and 1988, the number of recipients grew 65 percent and expenditures grew 144 percent. Average expenditures are growing at a faster rate than caseloads, possibly due to program changes such as provider wage increases, increases in administrative costs, more intensive case management, and an increase in more significantly disabled recipients requiring more hours of service. Though some programs tightened their per recipient service allowances and limited the times in which services were available, these restrictions usually failed to limit the overall growth in program expenditures.
The Changing Role of the PC-Option in Home and Community-Based Service Systems
The Medicaid PC-Option has been a major source of public funding for home and community-based long-term services, and is currently experiencing significant growth at both a national and state level. In an era of shrinking state revenues, many states view the PC-Option as one of the few vehicles left for leveraging Federal dollars to expand PAS. Medicaid Waivers, despite their proliferation, have failed to bring PAS to most of the people who need it, as the waivers tend to be relatively small and targeted to special populations (i.e., Federal figures indicate that two-thirds of waiver spending goes toward services for people with developmental disabilities). In many states the number of people served through purely state or Social Service Block Grant funded programs have declined because of new fiscal restraints. The PC-Option has therefore become the mainstay of many states' home and community-based services systems.
The same fiscal climate which has contributed to greater utilization of the PC-Option has created pressure to contain PAS program costs. Despite the Federal match, Medicaid services are increasingly viewed as "budget busters" because of their entitlement status, and are coming under legislative and executive scrutiny. States vary dramatically in the degree to which they limit access to services, but all programs are caught between the growing demand for services and the need to contain costs.
The growth in caseloads and expenditures can also be attributed to expanding and diverse populations seeking services, i.e., children and adults (under and over age 65) with a variety of physical, cognitive, and psychiatric disabilities. One of the major questions raised by this study is whether -- or to what extent and by what means -- it is possible to accommodate the sometimes disparate needs of different populations in a single program.
Traditionally, "long-term care", whether provided in nursing homes or in home and community-based settings, has been primarily associated with the needs of persons over 65 who develop age-related functional disabilities as the result of chronic medical conditions, including Alzheimer's disease and other dementias. The Medicaid PC-Option was originally modeled on an Oklahoma program that sought to augment the in-home services available to the disabled elderly by paying small stipends to individuals -- primarily friends and neighbors -- recruited by the care recipient or his or her family to supplement informal supports.
Although the Oklahoma prototype and most subsequent PC-Option programs serve older people with disabilities, many programs have evolved which serve a sizable number of younger people. Most programs limit service to people with physical disabilities, although this is changing as more people move from institutions into the community.
The growth in the number and types of people seeking home and community-based long-term services has been accompanied by growing political and economic scrutiny of existing service delivery systems. Disability rights advocates are increasingly demanding a service delivery system which facilitates independence and empowerment by maximizing consumer involvement in all aspects of PAS. They argue that consumers are the best qualified to assess how much service they need, what kinds of services they need, and when, where, and how these services should be delivered. They therefore prefer "independent providers" who are hired, supervised, and paid directly or indirectly by the consumer or his/her chosen surrogate. Until recently, advocates for seniors focused on expanding professional accountability and government regulations for Medicaid and Medicare services to ensure "quality" (which is largely defined as the lack of negative outcomes such as abuse and neglect), but recent research and advocacy efforts indicate that older people with disabilities are also concerned with autonomy issues.
The type of system promoted by disability rights advocates is seen as a challenge to the traditional "medical model" of service delivery. That model defines personal assistance as a medical or medically-related need and puts certain types of medical and social service professionals (physician, nurses, and/or medical social workers) in charge of allocating and monitoring a limited range of services, usually provided via private or non-profit homecare or home health agencies. Advocates for seniors have also voiced criticisms of the medical model, although on somewhat different grounds. Typically, they are concerned with the fragmentation of the financing and delivery system that results when coverage of "non-medical" services is prohibited under medical insurance programs such as Medicare or Medicaid.
Will the states be able to use the PC-Option to meet the needs of the diverse and increasingly vocal population demanding services, while trying to address their own managerial concerns? Does it make more sense to administer a multitude of programs with different administrations, eligibility requirements, and types of service delivery to serve the needs of different groups, or can a single program be developed which is flexible enough to respond to the needs and preferences of a heterogenous consumer population? The following problems and in the organization of PC-Option programs will need to be addressed in order to better serve all people who need personal assistance services.
Problems with the Existing Programs
The following problems are impeding states in their ability to serve the heterogeneous and expanding population which needs PAS.
-
The number of hours of service available may not meet the needs of the significantly disabled population.
-
The scope of services available may not meet the needs of the populations served. Particularly problematic for many consumers are the lack of supervision services, emergency services, and paramedical services.
-
Limits on the times services and locations in which services are provided often impede participation in the family, community, and workplace.
-
Income eligibility requirements limit service access, and discourage marriage and employment for consumers.
-
Family providers are not included in the repertoire of possible provider arrangements, despite the potential cost savings and desires of some consumers.
-
Utilization of independent providers is limited, despite the lower per unit cost and greater consumer control, because of liability concerns and withholding issues.
-
Consumers do not have a choice among provider modes.
-
Assessment of service quality is based on board administrative standards instead of consumer experience.
Increasing Access to Services
Across the United States there is extraordinary variability in the number of people receiving necessary services. Some states make a concerted effort to provide personal assistance services to many of those who need it, while others provide very little. Some sort of Federal action would probably be required in order to address these disparities.
The full report ends with a discussion of proposals for Federal action. These include making personal care a mandatory Medicaid service, shifting a percentage of the current Medicaid expenditures from institutional services to home and community-based services, expanding the 1915(D) home and community-based waiver, and consolidating all Federal PAS programs into a block grant program which is indexed and does not require state matching funds. All of these proposals have drawbacks, but some sort of resolution of the access issue is imperative. As political, economic, and demographic pressures build, Federal and state government will need to initiate a formal process of dialogue between administrators, legislators, providers, advocates and consumers. PAS is essential to a growing number of Americans, and a way must be found to provide these services.
INTRODUCTION
Purpose
The purpose of this study was to learn how states are using the Medicaid personal care services optional (PC-Option) benefit.1 Under the personal care benefit, states may provide personal assistance services to Medicaid-eligible recipients. The optional status of the benefit means that states may choose to include "personal care" services in their state Medicaid plans, but are not required to do so. If they elect to cover personal care, states are largely free to define these services as they see fit. The only federal restrictions specific to this benefit reiterate the statutory requirements that personal care “in the home” must be authorized by a physician in accordance with the recipient's treatment plan, supervised by a registered nurse, and provided by a qualified individual who is not a member of the recipient's family. States determine how physician authorization will be obtained and what constitutes a treatment plan. States also determine the nature and scheduling of R.N. supervision, set qualifications for providers and determine the degree of kinship which excludes a family member from becoming a paid care provider. Recently the in-home nature of the service was changed in the Omnibus Reconciliation Act of 1990. As a result by 1994 Medicaid Personal Care Optional Services will be available to people outside the home.
Although the personal care option has existed in Medicaid since the early days of the program, relatively few states elected to provide this coverage until the 1980s. As of FY 1979, only ten states provided personal care, spending a total of $196 million. In FY 1982, seventeen states offered the benefit and expenditures had increased to $395 million. By FY 1988, twenty-three states (including D.C.) reported offering such coverage. According to WID data, federal and state Medicaid expenditures for personal care services totaled about $1.6 billion in FY 1988. This is a 25% increase over 1987 expenditures.2
The Medicaid personal care services benefit has never been formally evaluated.3 Because there are so few regulations, there has, historically, been little federal oversight. Until recently, data on expenditures for personal care services were not routinely available because they were not reported separately from home health care expenditures.
In order to inform the long-term care policy debate, the Department of Health and Human Services (HHS) contracted with the World Institute on Disability for this study to provide accurate "baseline" information on services already being funded by public programs, particularly the Medicaid Personal Care Optional programs. Information about the use of the Medicaid personal care benefit was seen by the Assistant Secretary for Planning and Evaluation (ASPE) at HHS to be particularly relevant for two current policy purposes:
-
To provide information relevant to regulatory decision-making; in particular, whether or not the coverage regulations for personal care services should be revised and, if so, in what ways.
-
To inform the ongoing policy debate about expansion of public funding for long-term care services, particularly home and community-based care.
Source of Information
Statistical Analyses
This report is based primarily on two national surveys of PAS programs conducted in 1985 and in 1990 by the World Institute on Disability, as well as a series of six site visits conducted by WID between October, 1990, and February, 1991. (In the few places in the report where the WID information is supplemented by statistics from other sources, it is noted.)
In 1985, WID interviewed administrators of 157 out of the 175 programs identified as providing PAS. Twenty of these programs provided PAS through the Personal Care Option of Medicaid. Included were programs that provided personal care and household assistance to people with disabilities on a continuing, respite or emergency basis. Not included were programs for people with only cognitive or mental disabilities. The data collected were demographic and descriptive information about the program based on program management information system output, written documents and administrator judgement. (See Appendix B for a full discussion of methodology and a copy of the questionnaire and/or Litvak, Heumann and Zukas, 1987.)
In 1989, these same administrators were asked to complete a follow-up mail survey to determine the changes that had occurred since 1984. There was an 75% response rate for the programs interviewed in the first telephone survey. We also sent surveys to the 19 program administrators who refused to be interviewed in 1985, and four responded (21%). Finally, we sent questionnaires to 58 programs which had been created since 1984, or which we did not know about in 1984. The response for these new programs was 48% (26 returned). The overall return rate for all PAS programs contacted was 68%.
All 24 of the existing programs funded by PC-Option responded to the 1989 survey, due to intensive follow-up efforts made by the research team. Verification of which states actually utilized the PC-Option needed to be done because of discrepancies between the 1985 WID survey, the 1985 and 1987 lists prepared by the Health Care Finance Administration (HCFA, 1985, 1987), and the list of programs developed by Lewis-Idema et. al. (1990). After extensive communication with state administrators, it was found that four states had added the PC-Option to their Medicaid plan (WV,ME,NC,WA) since WID's 1985 survey, and seven states identified at some point by HCFA as using the PC-Option had in fact not included the PC-Option in their state Medicaid plans (IN,KS,CA,ID,TN,AL,HI).
The information gathered from these two surveys were analyzed in several ways. Key variables from both surveys were examined in the aggregate. Other analyses contrasted programs with different sources of government funding. The programs were divided into six groups: 1) those which received funding from the Medicaid Personal Care Option, 2) those which received funding from Medicaid home and community-based waivers, 3) those which received Social Security Block Grant (Title XX) funding, 4) those which received funding from the Older Americans Act (Title III), 5) those which received only state general funds or state rehabilitation funds (Title VII), and 6) those which received other sources of federal funding (i.e., Medicaid Home Health and other federal funds). It should be noted that all programs relied heavily on state revenues to augment the federal funds received. 1985 and 1989 surveys were also compared in order to identify program changes among these funding source groups.
Site Visits
Site visits were conducted to six states which had Personal Care Option funded programs under Medicaid. The six states were chosen to represent different systems of service delivery, different provider arrangements, different sized programs, and different geographical areas. These sites were: Montana, Oregon, Michigan, Massachusetts, Maryland and Texas. The research team interviewed state administrators, state level advisory groups, state wide advocacy groups, county administrators, and local consumers and providers in the state capitol city and a city in another county near the capitol. The interviews were open-ended based upon a preset format to cover in depth various aspects of the programs history and development. (See Kennedy and Litvak, 1991, for a fuller discussion of the site visit methodology.)
POPULATION SERVED
The target population for the Medicaid Personal Care Option programs is defined in each state by income, age, disability and other miscellaneous eligibility criteria. How these official regulations combine with program design and external factors to influence who is actually being served is difficult to document because program management information system (MIS) do not collect uniform demographic data. Responses to the 1985 survey regarding demographic data were so poor that these questions were not included in the 1989 survey. Therefore the following discussion relies mostly on eligibility criteria augmented by demographic data whenever possible from the site visit states.
In general, population targets, as expressed in eligibility criteria, are the result of both state economic concerns and the needs of disabled constituencies. For example, in Texas state administrators were responding to the need to control spending on nursing homes when they created the PC-Option program as an alternative for people in ICF-2 level homes.
In contrast, in other states historical circumstances and political clout of certain population groups are a reason for differences in population targets. For example, families of people with mental retardation were active in the formation of the Michigan program, while people with severe physical disabilities and their advocates lobbied for and designed the program in Massachusetts. Each state is currently attempting to respond to new or changing constituencies.
Income Criteria
Most PC-Option recipients are aged or disabled individuals who access the program by meeting the eligibility criteria for the SSI (Supplemental Security Income) Program. Individuals cannot be eligible for SSI if they have an income higher than a certain level which is the same in every state, i.e. $368 a month for individuals and $553 a month for a couple in 1989. (There is also an asset limit of $2000 for individuals and $3000 for couples). This income eligibility level is also the payment standard for SSI. Many states supplement this payment standard for individuals living in the community. As a result of this and several other provisions of Medicaid's convoluted income eligibility criteria, the actual income of individuals receiving the PC-Option varied considerably from state to state, from 51% of the federal poverty level to 111% for individuals, and from 49% of the poverty level for couples to 122% for couples (Table 1).4
| TABLE 1. Income Levels for Aged and Disabled Medicaid Recipients Living in the Community (Percent of Poverty)* | ||
|---|---|---|
| State | Individuals | Couples |
| Alaska | 111% | 122% |
| Arkansas + | 74% | 83% |
| Maine + | 76% | 85% |
| Maryland + | 74% | 83% |
| Massachusetts + | 102% | 115% |
| Michigan + | 81% | 90% |
| Minnesota + - | 77% | 85% |
| Missouri - | 74% | 83% |
| Montana + | 74% | 83% |
| Nebraska + - | 86% | 96% |
| Nevada | 82% | 95% |
| New Hampshire + - | 77% | 83% |
| New Jersey + | 100% | 100% |
| New York + | 90% | 98% |
| North Carolina + - | 51% | 49% |
| Oklahoma + - | 88% | 104% |
| Oregon + | 74% | 83% |
| South Dakota | 74% | 83% |
| Texas | 74% | 83% |
| Utah | 63% | 65% |
| Washington + | 80% | 86% |
| West Virginia + | 74% | 83% |
| District of Columbia + | 100% | 100% |
| SOURCE: Medicaid Eligibility for the Elderly in Need of Long-term Care. Edward Neuschler, Center for Policy Research, National Governor’s Association, September 1987. * These estimates are based on 1987 data. The poverty level for 1988 was $481/month for an individual and $644/month for a couple. | ||
The strict income requirements and the disparity between single and couple income criteria in some cases discouraged program recipients from working and from marrying. The income eligibility requirements have led to a de facto exclusion of working people, and served as a work disincentive for current program recipients. The number of people taking advantage of section 1619 of the Social Security Act, which allows people to work and still receive Medicaid benefits, appears to vary greatly from state to state.
Age Groups Eligible and Served
Most PC-Option programs (79%) claim they serve people of all ages, while some (21%) said they only serve people over the age of 18. The site visits suggest, however, that despite broad age eligibility criteria, some programs may emphasize service to one age group over another (Table 2). For example, the program in Massachusetts was designed specifically to serve young people with disabilities through the states's independent living programs, because this group was not being adequately served by the existing state programs (which were geared toward elderly people). Oregon has recently shifted its PC-Option program to target children with disabilities.
| TABLE 2. Percentage of People Served by Age Group in Site Visit PC-Option Programs | ||||
|---|---|---|---|---|
| State | Year | Age Group | ||
| 18 | 18-65 | >65 | ||
| Massachusetts | 1989 | 8% (21) | 85% (21-65) | 7% |
| Michigan | 1981 | 33% | 67% (>60) | |
| Maryland | 1984 | 2% | 33% | 65% |
| Oregon | 1988 | 27.8% (60) | 72.2% (>60) | |
| Montana* | 1989 | 35% | 60% | |
| Texas | 1990 | 6.5% | 23% | 70.5% |
| * Estimate by Westmond, Montana’s statewide private provider agency. | ||||
Degree of Disability
Programs developed individual functional assessments by ADLs, and/or number of hours and type of services needed. Minimum levels of functional limitation are set, and in some states these levels have been raised in order to contain program expenditures. These functional capacity guidelines are an indicator of the minimum level of severity of disability people must have to be accepted in a program. The Massachusetts program requires that people have the severest level of disability to enter the program (Table 3). Texas, Maryland, Oregon and Montana have tried to exclude those who only need assistance with IADLs or household maintenance functions. Unfortunately none of the site visit programs could give us data on the degree of disability of their recipients.
| TABLE 3. Degree of Disability of Program Recipients | |
|---|---|
| State | Degree of Disability |
| Massachusetts | Need 10 or more hours per week of ADLs or 14 or more hours of ADLs and IADLS |
| Michigan | Need for ADL, housekeeping or chore services |
| Maryland | Limitations in ability to perform ADLs |
| Oregon | Child in foster care or adult needing assistance with at least 1 ADL on a low or intermittent hour basis |
| Montana | Limitation in ability to perform at least 1 ADL requiring hands-on personal care |
| Texas | Score of 24 or more on ADL functional assessment test and need for at least 6 hours of PAS |
Type of Disability
Almost three-quarters of the programs reported that they serve people with all disabilities (physical, mental, cognitive and brain injury)(Appendix B). However, 22% of the programs do not serve people with mental disabilities and 27% do not serve people with cognitive disabilities.
During the site visits, these two populations were usually identified as those who "fell through the cracks" of community-based services, particularly if their primary PAS need was supervision. One of the reasons for exclusion of these groups was historical -- many states have separate departments for people with mental illness and mental retardation. Massachusetts is currently struggling to adapt their program to meet the needs of people with mental retardation and cognitive disabilities. Maryland was the only program visited which currently offers supervision for people with cognitive or psychiatric disabilities.
Other Eligibility Criteria
There are other eligibility criteria for the PC-Option programs as well, some of which are controversial. In 1984, half of the programs prioritized people who were at risk of institutionalization (Appendix B). Fourteen percent took into account whether family was available to provide services and would only take people whose families were unable or unwilling to provide service. A few programs said they targeted people in particular disability groups or those living alone. Twenty-three percent required that people be able to manage their own attendant. The latter became a major issue in Massachusetts, where DD advocates threatened to sue the state unless regulations were implemented in order to allow people with cognitive disabilities to use surrogates for management assistance.
Size of the Program Relative to Potential Users
The number of PC-Option recipients per 1000 aged and disabled Medicaid recipients in each state was calculated to arrive at a measure of the degree to which the PC-Option programs served the potential population of eligible Medicaid PAS users, i.e. participation rate. Table 4 indicates that in 1988 South Dakota, Arkansas, Michigan, Missouri, New York and Oklahoma had the highest participation rates while Maine, Massachusetts, New Hampshire and Oregon do not depend to any great extent upon their PC-Option program to serve the population needing PAS in their state.
| TABLE 4. Personal Care Option Recipients Per Aged and Disabled Medicaid Recipient by State (1988) | |||||
|---|---|---|---|---|---|
| State | PC-Option Recipients 1988 | Medicaid Recipients >65 yeas old** | Disabled Medicaid Recipients** | Aged and Disabled Medicaid Recipients | Participation Rate (per 1,000 Aged and Disabled Medicaid Recipients |
| AK | 94 | 2,554 | 3,105 | 5,659 | 17 |
| AR | 16,539 | 49,460 | 48,346 | 97,806 | 169 |
| ME | 241 | 19,380 | 19,596 | 38,976 | 6 |
| MD | 4,000 | 42,772 | 42,774 | 87,546 | 46 |
| MA | 1,518 | 102,223 | 88,148 | 190,371 | 8 |
| MI | 33,000 | 93,239 | 156,420 | 249,659 | 132 |
| MN | 1,787 | 46,161 | 29,980 | 76,141 | 24 |
| MO | 22,000 | 63,506 | 60,784 | 124,380 | 177 |
| MT | 736 | 6,217 | 8,203 | 14,420 | 51 |
| NB | 515 | 16,560 | 11,942 | 11,942 | 43 |
| NV | 300 | 6,195 | 6,077 | 12,272 | 24 |
| NH | 55 | 8,539 | 5,093 | 13,632 | 4 |
| NJ | na | 57,753 | 80,119 | 137,872 | na |
| NY*** | 89,395 | 343,608 | 323,003 | 666,611 | 125 |
| NC | 3,765 | 75,054 | 58,718 | 133,772 | 28 |
| OK | 14,028 | 54,665 | 33,596 | 88,261 | 159 |
| OR | 300 | 20,881 | 22,631 | 43,512 | 7 |
| SD | 3,282 | 8,107 | 7,155 | 15,262 | 215 |
| TX | 31,266 | 215,591 | 131,093 | 346,684 | 90 |
| UT | 200 | 7,096 | 8,703 | 15,826 | 13 |
| WA | 5,864 | 48,490 | 57,879 | 106,369 | 55 |
| WV | 7,500 | 24,854 | 33,147 | 58,001 | 129 |
| DC | na | 10,199 | 16,758 | 26,957 | na |
| * Combines Personal Care Services Program (79,198) and Long-term Care Project (10,197) ** SOURCE: Health Care Finance Administration *** New York has two different PC-Option funded programs | |||||
SERVICES PROVIDED
Most programs offer a basic core of ADL and IADL services, but only about half provide "paramedical services". Chore, repair and maintenance services are rarely offered. Transportation and escort is available mostly for medical trips. Between 1984 and 1988 there appears to be a decrease in programs allowing paramedical services and respite. The only growth has been in programs providing communication services. The PC-Option service mix is clearly not adequate to enable an individual to be fully self-sufficient, if necessary, living in the community.
Personal Care Services
The PC-Option Programs offered core personal care services, including feeding, bathing, dressing, ambulation, transfers, oral hygiene and grooming, and skin maintenance (Appendix C). Most offered menstrual assistance and bowel and bladder care. Fewer offered assistance with prosthetic devises, range of motion and foot care. Fifty-eight percent allowed assistance with medications, 38% offered assistance with respiration, 29% allowed assistance with catheter care, and 21% allowed assistance with injections. The likelihood of a program providing these paramedical services using unlicensed providers dropped slightly between 1984 and 1988, which may suggest a growing concern over liability in this area.
These findings were borne out by the site visits. Programs offered a basic core of personal care services, but there was wide variation on the provision of more invasive or "paramedical services". Montana has a very strict interpretation of medically related tasks, and only allows them to be provided by Home Health Aides who generally work for the same statewide homecare agency that provides PC-Option services (Table 5). In Texas, even though disability advocates successfully lobbied the State Board of Nurse Examiners to revise regulations in order to allow for delegation of paramedical tasks, the state and private agencies are unwilling to provide these services through the PC-Option. However one Texas agency said that they told attendants that they can do paramedical tasks on their own time without pay, if they so chose. Oregon, which also uses agency providers, developed the Nurse Delegation Act, which permits nurses to sign-off for non-certified attendants to do paramedical tasks.
Programs using independent providers are usually more liberal on this issue. Both Michigan and Maryland allow administration of medications which would ordinarily be self-administered if the individual were not disabled, but invasive procedures are not allowed. In Massachusetts, all paramedical procedures are theoretically allowed as negotiated between the assistant and the disabled individual.
| TABLE 5. Medically Related Tasks | |
|---|---|
| State | Regulation |
| Massachusetts | Allows respiration care, catheterization, injections, medication administration, ROM, footcare as negotiated with recipient. |
| Michigan | Allows assistance with drugs which are “normally self-administered” |
| Maryland | Allows assistance with medication if “ordinarily self-administered” |
| Oregon | With R.N. approval as per Nurse Delegation Act allows foot nail care, external cleaning of catheter and bag, changing of ostomy bags, maintenance of bowel care, administration of medication, ROM. |
| Montana | Does not allow medically related tasks to be provided by non-Home Health Aides (HHAs) |
| Texas | Allows assistance with medication if “ordinarily self-administered” The state has revised regulations to allow nurse delegation, but this has not impacted the PC-Option program. |
| HCFA proposed regulations | Personal Care Services are defined as “…those tasks directed at the recipient and or his or her immediate environment that are medically related…but would not include skilled services that may be performed only by a health professional.” |
Household Maintenance Services
There are a core of household services that most programs offered, including meal and menu preparation and clean-up, light cleaning, laundry and shopping (Appendix C). Errands, chores, heavy cleaning, and repairs were less likely to be provided. In some states these services were provided with state funds. Only one program, Massachusetts, allows personal assistants to assist individuals with their children or with paying bills and budgeting.
Communication Services
Roughly 30% of PC-Option programs reportedly allow providers to assist with paperwork or function as an agency liaison. A quarter allowed assistance with phone calls, interpreting or reading. Three programs allow assistance with handling money (Appendix C).
Transportation Services
In 1984, most programs allowed for transportation and escort (Appendix B), though several administrators noted that such services were limited to medical need. In 1988, when the question was phrased to make that distinction, fewer than 1/4 of the programs allowed for non-medical escort and transportation. Three-fourths allowed attendants to escort recipients to medical appointments but only 42% allowed attendants to drive the recipient to the appointment (Appendix C).
Short-term Services
In 1984, 47% of the programs said they provided respite services (Appendix B). By 1988, this had declined slightly to 42%. In 1988 only 38% offered emergency services (Appendix C).
AVAILABILITY AND INTENSITY OF SERVICE DELIVERY
Intensity of service delivery is a function of several factors, including the times of day, days of the week services are available, and the total amount of service hours allocated per program recipient. Of particular concern in recent years is the availability of services 24 hours a day for people with high services needs such as high level quadriplegics or children who are technology dependent.
Hours and Days Available
In 1984, 82% of the programs reported that services could theoretically be arranged at any time (Appendix B). By 1988, fewer programs (46%) said that attendants were in fact available 24 hours/7 days a week (Appendix C).5 Four of the programs which provided this data in both 1984 and 1988 had stopped offering services at any time. This means that people who have to be turned or auctioned at night, as well as people who simply want to get up or go to bed when they want, may not get the services at the time that they need them.
Service Limits
Hours
In 1984, over 70% of the PC-Option programs had specified service limits expressed either in dollars or hours or both. There appears to be an increase in PC-Option programs allowing for more than 40 hours per week (Table 6). Service limits do not necessarily translate directly into the actual number of hours an individual receives from a program, however. The average number of hours of PAS per week per recipient in the PC-Option programs (FY 1988) was only 11 hours.
| TABLE 6. Percentage of PC-Option Programs with Various Levels of Service Maximums Expressed in Hours Per Week | ||
|---|---|---|
| Hours/Week Limit | 1984 (n=9) | 1988 (n=17) |
| 0-20 | 33% | 24% |
| 21-30 | 22% | 29% |
| 31-40 | 22% | 12% |
| >40 | 22% | 36% |
Dollars
In addition to hour limits, programs also set dollar limits on what they allowed to be spent for any one individual's PAS. Among the programs which set dollar limits, there appears to have been a decline between 1984 and 1988 in the percentage of programs with per recipient expenditure limits in the higher ranges (Table 7).
| TABLE 7. Percentage of PC-Option Programs with Various Service Maximums Expressed in Dollars Per Month | ||
|---|---|---|
| Dollars Per Month | 1984 (n=6) | 1988 (n=11) |
| 0-$500 | 50% | 27% |
| $500-1000 | 0% | 64% |
| $1000-2000 | 50% | 0% |
| >$2000 | 0% | 9% |
Availability of Services 24 Hours/Day
Of special concern in the last few years has been availability of services for people who are significantly disabled. Interestingly, twenty-nine percent of the PC-Option programs in 1984 and 18% in 1988 stated no hourly or dollar limit. One could conclude that these programs allow for services 24 hours/per day. The site visits bolster this assumption. In Massachusetts there is a night rate for people who sleep in the disabled individual's home and act as a night attendant. There is even a distinction in the night rate based on the number of actual hours of hands on service the attendant performs. In Michigan there are 1800 "exceptions" to state hour allowances, and some of these people are quadriplegic using ventilators who receive $2000/month from the PC-Option program. Maryland has experimented with a group living situation in a Baltimore public housing unit in which people pool their PAS allotments in order to pay a night attendant for the group.
Relationship between Provider Type and Hours of Service
There is a strong relationship between the number of hours an individual is able to receive from a program and the type of provider, when one looks at all the PAS programs (Table 8). Programs which use independent providers provide the most hours of service per recipient.
Montana gives us a window on this issue because of its change from independent providers to a single agency provider. From 1987, when this change took place, to 1990, there was a reduction in the maximum hours allowed per client per week from over 100 hours to 40 hours. This took place in response to the provider agency's need for administrative and withholding costs to be covered by their reimbursement rate. It may be that actual cost of the program to the state had been near the agency figures, but the administrative costs of the program were embedded in the larger government administrative structure. This is often the case with other programs as well, whether they are Medicaid funded or not.
| TABLE 8. Average Number of Hours Per Week Per Recipient by Provider Type 1984 and 1988 All Funding Sources | ||||
|---|---|---|---|---|
| Programs | Uncombined Provider Programs* | Combined and Uncombined Provider | ||
| Delivery Mode | 1984 | 1988 | 1984 | 1988 |
| Independent | 25 hours (n=17) | 22 hours (n=14) | 21 hours (n=31) | 20 hours (n=28) |
| Agency | 16 hours (n=22) | 15 hours (n=17) | 13 hours (n=41) | 15 hours (n=34) |
| Government | 3 hours (n=4) | 2 hours (n=1) | 10 hours (n=30) | 6 hours (n=14) |
| * The combined provider programs are ones in which two or three different providers are available through the program. The uncombined are ones in which only one type of provider is utilized by a program. | ||||
In conclusion, there has been a slight increase in the number of programs that say they will allow more than 40 hours of PAS for recipients who need that level of service. However, among programs which set per person expenditure limits, there has been a slight decline in the maximum monthly expenditures. It appears that less than 20% of the PC-Option programs allow recipients to receive services 24-hours-day. There is a strong relationship between the number of hours an individual is able to receive from a program and the type of provider. In general, programs that use independent providers provide more hours of service.
PROGRAM GOALS
Description of Goals
The answers we received in our survey questionnaires regarding program goals were not illuminating. In general, administrators said the programs goals were preventing institutionalization and keeping people in the community. No PC-Option program had the goal of enabling an individual to work. However, with the passage of Section 1619 of the Social Security Act, which allows SSI recipients to work and still maintain their Medicaid benefits if their income and assets do not exceed a certain amount, PC-Option programs can now enable individuals to go to work.
Differences between the personal care option programs became much clearer from the site visit experience. In fact, the personal care option programs have different objectives from state to state. Table 5 reflects the goals stated by the site visit programs. These goals are a key to understanding why states have designed the program service package and other aspects of the programs the way they have. In each case, pressure has been brought to bear on the program either from within the state system or from advocates to expand the mission of the program in order to serve a broader population of people who need PAS. These program goals are not static, and as the constituencies are evolving and changing, so are the goals.
| TABLE 9. Goals of the PC-Option Programs | |
|---|---|
| State | Program Goal |
| Massachusetts | To enable people with permanent or chronic disabilities to live in the community who might otherwise be institutionalized |
| Michigan | To keep people at home, encourage self-determination, authorize services “only to the extent necessitated by the individual’s functional limitations,” and maintain informal supports |
| Maryland | To support informal caregivers, and prevent or delay institutionalization |
| Oregon | To maintain the PC-Option as a stop-gap in case the state loses its waivers, and to serve disabled children in foster care settings |
| Montana | To help people stay in their own homes as long as they can rather than go into nursing homes |
| Texas | To provide “care to those who could not access custodial placement” when ICF-2 level programs were closed down and to maintain the Federal match for these people |
Degree to Which Goals are Met
Massachusetts
The Massachusetts program has succeeded admirably in designing a program to help people with severe physical disabilities, who have the capacity for self-direction and can make the transition into community living. The program funds transitional living arrangements while people are learning to manage their own services, and training in how to manage an attendant and how to recognize and deal with changes in their medical status. The program allows up to 24 hours of service per day through the use of a night time wage. It allows attendants to provide paramedical services based on an arrangement between the provider and the recipient. Recipients generally seemed very satisfied with the program. Main difficulties appeared to be with the withholding arrangements. The program has been pressured to add the goal of assisting community living transitions for people with mental retardation as well. This is a new development, and it is too soon to know how well the program will meet this objective.
Michigan
Michigan has been successful at serving people who have family or other informal/volunteer supports available. However, those who have high hour needs and little support cannot get enough reliable assistance. According to county caseworkers, the program has succeeded in keeping people out of nursing homes. Michigan offers a very wide range of personal care services and some paramedical services, if they are directed by the recipient. It also allows attendants to provide a broad range of household and chore services, though it doesn't allow for non-medical escort and driving. The program does not provide emergency backup services. The service limit, $333 per month, is relatively low, but exceptions are allowed. Though more and more people with more severe disabilities are being maintained on the program, the average hours per week is only 17. Until recently when case management became more available, recipients were generally on their own in managing services.
Maryland
The original goal of this program was to support informal caregiving systems and was based on the Oklahoma model. Very early in the program's history, it became clear that the majority of people acting as providers under the PC-Option program had no personal connection to the recipient prior to employment. So the goal of using the program to support informal caregivers has never been met. The success in meeting the goal of prevention or delay of nursing home placement is difficult to assess. Maryland does have a low nursing home rate, but it seems unlikely that the PC-Option program was the cause of this. It appears that the real result has been that consumers are forced to make do with fewer hours of service than they need and/or find ways to supplement attendant wages.
Oregon
In Oregon the PC-Option program was housed in the Senior and Disabled Services (SDS) Division until 1990. SDS saw the PC-Option as incompatible with their goals of reducing the nursing home population, because it has an income eligibility limit far lower than that for Medicaid nursing home eligibility. They feel this has created a nursing home bias. Consequently the division relies more heavily on two waivers which have the same income eligibility as nursing homes. It moved the PC-Option program to the Office of Medical Assistance, where it is being used to serve children with disabilities. It is too soon to assess the success of meeting this new objective. In the meantime, SDS continues to use the PC-Option program to provide personal care services for a limited number of people on an intermittent basis.
Montana
Montana sees the PC-Option as helping people to stay out of nursing homes, and they point to the lack of increase in nursing home beds in Montana as a sign that they have succeeded. It may be that the existence of the waiver program has also contributed to this outcome. Advocates in the state are very anxious to push the personal care option program toward the goal of meeting the needs of people with severe disabilities who are capable of self direction. This would require a change in the degree of control consumers are allowed over hiring, training, supervising and firing their attendants, an increase in hours, and permission to receive personal assistance outside the home.
Texas
The Texas program was aimed at bringing Federal matching funds to the state in order to provide "care for those who could not access custodial placement" because the state closed the ICF-2 level nursing homes. In this, the program succeeded admirably. Over the years the program has raised its functional assessment criteria to weed out those who do not need personal care services of some kind. It offers most personal care services and household/chore services. The service limit is 30 hours per week, but advocates are pushing the state to raise these limits to better serve people who are more significantly disabled. Beside the low limits on hours per week, it has no requirements that the homecare agencies provide emergency backup services, although changes are currently being made in this area.
In general, one may conclude that the goals the states set for these programs have framed the development of the programs. As noted earlier, however, as times change and new populations come forward demanding services, programs have evolved and will continue to evolve to address the need in some fashion.
ACCESS CONTROL MECHANISMS
Access to programs is controlled in a variety of ways. Some of them are spelled out in program eligibility criteria covering such things as income and age eligibility and numbers of ADL deficits. Others are a result of the existence or lack of certain program features such as recipient outreach programs, service limits (defined in terms of hours or money), times when services are available, or types of services allowed (such as paramedical, emergency back-up or supervision). Others involve deliberate prioritization of people. Still others involve external factors such as unavailability of providers in rural areas or in wealthy areas. Finally, program managers may deliberately set population target priorities to control access.
Eligibility Limits to Access
The formal eligibility criteria regarding assessment for service need varied among the PC-Option programs visited (Table 10). The assessment of need process ranges from very formal needs assessments with cut-off points (Texas) to very informal assessments based on professional judgement (Maryland). In Oregon the assessment was more comprehensive, but it used professional judgement as to which programs could fill which needs for service.
| TABLE 10. How Need for Service is Defined and Assessed | |
|---|---|
| State | Definition and Method of Assessment |
| Massachusetts | Need 10 or more hours per week of ADLs or 14 or more hours of assistance with ADLs and IADLs based on Occupational Therapist (OTR)/Registered Nurse (RN) team in-home assessment of functional limitations |
| Michigan | Need for personal care services based on functional assessment by DSS adult services worker |
| Maryland | Limitations in ability to perform ADLs based on professional judgement by Nurse case monitor in recipient’s home |
| Oregon | Child in foster care needing ADL support based on RN assessment of total care needs or adult needing assistance with at least 1 ADL with need for low or intermittent hours of skilled Personal care as assessed through comprehensive assessment of person’s total needs using the CAPS assessment tool by Area Agency on Aging (AAA) or Disability Service Office caseworkers. |
| Montana | Limitation in ability to perform at least 1 ADL and need for hands-on personal care (not just supervision), based on functional assessment by agency RN. |
| Texas | Score of 24 or more on ADL functional assessment test, need for at least 6 hours of PAS and state case manager/state nurse supervisor judgment |
Program Features Limiting Access
Service limits, service availability, income eligibility criteria, and limited outreach function to limit access to the programs (Table 10). Income eligibility was mostly based on people being SSI recipients or at that income level.
If there is a ceiling on the number of hours provided or the amount of money allowed per recipient, people with high needs and no other source of support either cannot be on the program or are forced to make do with far fewer hours than they need (i.e. Montana, Maryland and Texas). If there is a lower limit to service, e.g. 6 hours per week in Texas, 10 hours per week of ADLs or 14 hours/week of ADLs and IADLs as in Massachusetts, this eliminates the people who need very few hours a week.
If certain services are not offered, some people may not be able to use the program. For example Texas and Michigan do not provide emergency back-up services, so people who are significantly disabled and not able to go even one day without service cannot safely be on the program. People who need high hours of service, or at least someone on call 24 hours a day, find that the Maryland, Oregon, Montana and Texas programs are not adequate and may remain in nursing homes or hospitals. Until recently, the Massachusetts program limited access to only those who were able to manage their own attendant.
A major limiting program feature can be the absence of outreach programs to potential recipients. Universally it appears that outreach processes are informal and depend on word of mouth and the knowledge of professionals who come in contact with disabled people. In some cases programs made some effort to contact discharge planners, service providers and disability groups to inform them of the program's existence. In only one state, Montana, was there a formal outreach campaign carried out and that was done for the new waiver program. The results of this were that as people learned about the waiver for older people they also learned that the Medicaid department had another program for people who are not eligible for the waiver. As a result the number of people on the PC-Option program increased dramatically. If one can generalize from this case, it appears that a major way programs limit access is through not informing the general public of the existence of programs.
Referrals between state administrative units (e.g. departments, divisions) appear to be uncommon. For example, after Oregon reorganized the state bureaucracy and combined income support and PAS eligibility determination functions into the same division, there was an increase in the number of people accessing PAS services, as new cases suddenly were identified.
External Factors Limiting Access
External factors also work to limit the program's population, and these differ from state to state as well. For example, until recently the only way to access the PC-Option program in Massachusetts was through one of six centers for Independent Living (ILCs). This meant that if one did not live near a center, one had to travel to get services. In addition, some people may not know about or may not feel comfortable accessing services through ILCs. The lack of a large population of people willing to work for low wages has drastically limited access to the program in certain areas of Maryland. In many states, there are disparities between rural and urban access to PAS. It appears that programs that use agency providers in rural areas (e.g. Texas and Montana), or which have involved case managers which train recipients to be good managers (e.g. Maryland), may do a better job of helping rural recipients recruit providers.
Population Target Priorities
Some of the programs have deliberately set out to limit access in order to reduce expenditures. In the face of the current budget crisis (1991), Michigan has dropped from the program people who receive purely chore services because they are solely state funded. Maryland has proposed dropping all level I (those needing only 1 visit per day) recipients though there has been a large backlash to this proposal. Texas increased the limitation requirements in order to meet budget constraints but still insure that people who need personal care services would be included.
The ability of states to use all these gatekeeping and access control mechanisms in order to control the number of people in their programs is circumscribed by political factors. In some states, disability advocates effectively counter efforts to limit access to what tend to be very popular programs(despite their limitations).
DELIVERY MODE
There are several different ways in which providers are employed. These are commonly referred to as delivery modes. Agency providers work for non-profit or for-profit agencies and are generally considered the employees of the agency which hires them. Independent or individual providers have different conditions of employment depending upon the program and state. They can be considered self-employed, employed by the disabled recipient or employed by the state for purposes of some types of income withholding and not for others. Government agency providers fall into two different categories. Some civil service employees experience the same wage scale and benefit packages as other employees of similar skill and rank. More recently governments have begun employing PAS providers on a contract basis. These are generally part time workers who are not part of the civil service personnel pool. Their rates of pay, working conditions and benefits are similar to those of independent providers. PC-Option programs tended to use either independent providers or agency providers (Table 11). The number of programs using government civil service employees as providers dropped considerably.6
| TABLE 11. Percentage of PC-Option Programs Using Different Provider Types by Year | |||
|---|---|---|---|
| Year | Independent Providers | Agency Providers | Government Providers |
| 1984 | 60% (n=12) | 45% (n=9) | 40% (n=8) |
| 1988 | 46% (n=11) | 63% (n=15) | 19% (n=4) |
Benefits and Wages
The delivery mode impacts the wages and benefits offered to attendants. Agency providers and government workers receive the best wages and government workers clearly receive the most benefits (Table 12). Independent providers continue to be the most poorly compensated providers.
| TABLE 12. Provider Benefits and Wages | ||||||
|---|---|---|---|---|---|---|
| Provider Type | ||||||
| Independent Providers | Agency Providers | Government Workers | ||||
| 1984 | 1988 | 1984 | 1988 | 1984 | 1988 | |
| Average hourly wage | $3.89 | $4.59 | $5.12 | $6.02 | $3.93 | $8.00 |
| Low | $0.42 | $1.70 | $3.40 | $3.35 | $3.85 | $4.66 |
| High | $8.25 | $8.30 | $9.00 | $11.00 | $4.00 | $8.00 |
| Average number of benefits | 0.8 | 0.9 | 3.0 | 2.7 | 5.0 | 4.0 |
| Low | 0 | 0 | 0 | 0 | 1 | 0 |
| High | 3 | 3 | 7 | 8 | 7 | 8 |
Relationship between Provider Type, Payment Mechanism and Payment Rate
The three examples encountered on the site visits illustrate only some of the variations of arrangements possible for independent providers (Table 13). Massachusetts has different rates for night and day attendants and compensates workers at a higher rate than all the other programs. It also pays additional amounts for work on holidays. Michigan has a straight hourly minimum wage rate which includes the employer and employee share of FICA. Maryland pays by the level rather than having an hourly rate, although there is a tendency for nurse supervisors, who do much of the recruiting, to translate the levels into about $5 per hour. No state or federal tax withholding is done by any of these states.
There are other state programs, such as California's Title XX funded In-Home Supportive Services Program, which do withholding for independent providers. These states are vulnerable to suits regarding who is the employer (this issue is discussed below).
| TABLE 13. Type of Provider, Payment Mechanisms and Basis of Pay | ||||
|---|---|---|---|---|
| State | Provider Type | Payment Mechanism | Basis of Pay | Payment Rate and Benefits |
| MA | Independent | Intermediary agency cuts the check, attendant paid by disabled individual | Hourly rate which varies for day, night and night hands-on service | $7.50/hour day rate, $15.00 per night, additional pay for hands-on PAS at night, No benefits |
| MI | Independent | State cuts dual party check requiring attendant and disabled individual signature | Hourly rate | $3.35/hour, FICA withheld if arranged between attendant and recipient |
| MD | Independent | State Medicaid agency pays provider directly | Four levels of pay based on number of visits and type of disability | $10/one visit, $20/two visits, $25/day, No Benefits |
| OR | Agency | Participating agency pays provider | Hourly rate | $3.65-$10/hour, FICA, worker’s compensation, unemployment, transportation costs |
| MT | Agency | Contract agency pays provider | Hourly rate | $4.65/hour, FICA, worker’s compensation, unemployment, vacation, sick leave, health insurance, transportation costs |
| TX | Agency | Participating agency pays provider | Hourly rate | $3.35-$4.41/hour, FICA, unemployment, some agencies provider workers compensation and transportation costs |
Being an agency-employed provider does not necessarily guarantee attendants better working conditions. As one can see in Table 9, there are major differences in pay and benefits for agency providers. Texas agencies which operate on a state defined rate provide the bare minimum in wages and benefits, while Montana's single agency contractor pays somewhat better wages and benefits.
LIABILITY
Many state administrators suggest that concerns over liability have shaped the direction of their programs. There are two types of liability that seem to be of importance: 1) Liability or responsibility for withholding federal (i.e. FICA, federal unemployment) and state (i.e. worker's compensation and disability) taxes, and 2) Tort Liability or legal responsibility for attendant negligence. Utilizing homecare agency providers is the major way to shift liability away from the state. States which utilize independent providers have different ways of defining who is the employer.
Concerns over tort liability have impacted the provision of "paramedical" services in many states, along with state nurse practice act regulations. These regulations describe what tasks come under the supervision of registered nurses and which do not. Any program that does not follow nurse practice acts is vulnerable to fine and possibly litigation from the state.
Who is the Employer?
Each state must address these liability issues by determining who can be considered the legal employer of the attendant. States have answered this question in different ways (Table 14).
| TABLE 14. Who is the Employer? | |
|---|---|
| State | Regulation |
| Massachusetts | Attendant is an independent contractor in the employ of the Medicaid recipient |
| Michigan | Recipients are the employers for purposes of withholding. Assistants are either self employed or domestic workers in the employ of the recipient. |
| Maryland | Attendants are self employed |
| Oregon | Attendants are employees of homecare agencies |
| Montana | Attendants are employees of home care agency |
| Texas | Attendants are employees of homecare agencies |
In the case of programs like the ones in Oregon, Montana and Texas, the homecare agency is the employer and, presumably, is liable for state and federal withholding. However, the degree of withholding appears to vary. In Texas, for example, the homecare agencies are not required to pay worker's compensation, although some agencies do so voluntarily. In general, one of the major reasons some states decide to utilize homecare agency providers is to shift liability away from the state. One of the site visit states, Montana, was so concerned that the state might be deemed the employer (and therefore be required to provide government worker benefits to attendants) that it switched from an independent provider mode to a statewide homecare agency model of service provision (see Kennedy and Litvak, 1991 for details). In general, the issues of liability and who is the employer is clear in the case of agency employees. The agency carries liability insurance and does all the withholding.
States which utilize independent providers have different ways of defining who the employer is. None of the three site visit states which use independent providers have been sued for attendant negligence, and the state administrators do not seem overly concerned with this issue. However, the economic and administrative responsibility for tax withholding is a major concern. In Michigan, the recipient is the employer and the attendant is an independent contractor. The recipient receives a two party check from which s/he is to withhold the employer's share of FICA and from which the employee is to set aside his/her share. Theoretically, the recipient files a Federal 1099 form every three months with the employer share of social security. In practice, this rarely happens. The development of the two party check system appears to be a way for the state to avoid responsibility for federal income tax withholding. The state sets a per person expenditure cap to avoid being required to reimburse for federal unemployment insurance. The Department would like to automate the reimbursement system and do payroll deductions, but the start up cost and policy ramifications are seen as prohibitive. (See Kennedy and Litvak, 1991, for fuller discussion of the Michigan program).
Massachusetts PC-Option attendants are also independent contractors in the employ of the Medicaid recipient. Like Michigan, the system is coming under scrutiny by the IRS. The Massachusetts Centers for Independent Living (CILs) function as flow-through agencies for attendant wages. The recipient receives the check and pays the attendant. The IRS is asking the CILs to send in 1099s on all the attendants, but only some ClLs are currently complying. Without the 1099s, the IRS would not know who is employed as an attendant under the program. Neither Michigan nor Massachusetts withholds workers compensation or disability.
In contrast to both Massachusetts and Michigan, the state of Maryland does send in 1099s for all the attendants it has registered under the program. The attendant is seen as self-employed. The state has been very careful to maintain the "level of care" payment system in order to avoid the appearance of being the attendant employer. The state has held onto the system which pays $10 a day for one visit, $20 for two visits, and $25 a day for anyone needing a 24 hour/day live-in. They have maintained this "level of care" system, even though the state agrees that it has led to extreme shortages of qualified providers and cannot accommodate recipients who are significantly disabled unless they live together in congregate housing and share attendants. The state of Maryland has been sued over worker's compensation, and it was deemed not liable because the state does not set wages and hours.
There is no easy solution to this issue, because there are advantages and disadvantages to using agency and independent providers. On the plus side independent providers generally cost less because there is no agency overhead rate to be paid. Critics like Sabatino (1990, p. 24) maintain, however, that if the independent providers were flanked by the necessary management and training supports to maintain quality, the independent provider mode would not be cheaper. Disability advocates claim that the advantage of independent providers is that they are less professionalized and more amenable to training and supervision by the disabled user of their services.
Conversely, agency providers are more costly per hour because of agency overhead rates which may amount to as much as 100% for every hour provided. According to consumers, agency providers tend to be more responsive to professional goals and agency supervision than to recipients' wishes.
It seems most likely that both types of providers have a role to play in a comprehensive system of PAS. New solutions for withholding and liability protection need to be explored for independent providers. One possibility, for example, is the formation of a state-wide association of independent providers which would purchase group liability and health insurance for its members. States can also reimburse recipients for what they expend on purchasing individual workers compensation insurance.
Nurse Practice Acts
As noted above, also involved in the liability issue is the question of nurse practice acts. Presumably they serve to protect providers against liability claims and are meant to insure quality. However, disability advocates and administrators have observed that these regulations increase the cost of PAS by unnecessarily "medicalizing" tasks that family members are routinely taught to do and require recipients to have a multiplicity of providers coming into their home. Moreover, relying on medical professionals may impede the independence of consumers.
In Montana, the Nurse Practice Act is scrupulously observed by the statewide homecare provider agency. In Oregon they have passed a Nurse Delegation Act to allow the nurse to sign off for non-certified attendants to do paramedical tasks. Even though in Texas changes were made in the regulations promulgated by the state board of nurses to allow physicians to delegate paramedical tasks to paid attendants, the state does not allow physician delegation under the PC-Option program.
Some of the independent provider model programs are more liberal on this issue. Both Michigan and Maryland allow administration of medications which would ordinarily be self administered if the individual were not disabled. However, invasive procedures are not allowed. In Massachusetts all paramedical procedures are allowed as negotiated between the assistant and the disabled individual.
QUALITY ASSURANCE MECHANISMS
There are a number of ways in which states and the federal government have tried to influence the quality of the PC-Option programs. These include: state level oversight of overall program compliance standards, case level oversight, nurse supervision of the attendant, attendant training and screening, and recipient complaint and grievance mechanisms. All states have some of these quality assurance mechanisms in place.
Which mechanisms a state employs depends upon their philosophy or view of quality assurance. States vary greatly in their approaches to quality assurance. Some states emphasized quality assurance from “below”, i.e. training the recipient to recognize quality and providing avenues for problems to be addressed. Others have relied heavily on quality assurance systems from "above", i.e. paper reviews and site visits. Some states limit effort to minimum compliance with regulatory requirements.
In Massachusetts, quality assurance rests on: 1) extensive training of the disabled user in attendant management techniques, the elements of quality service, and health condition self-monitoring and, 2) attendant wages which appear to be high enough to attract a pool of workers. Quality assurance in the Michigan program appears to rest more on the fact that families are the main providers of services and are considered to be responsible for service quality monitoring. The Maryland system rests on the independent nurse case monitors. Texas and Montana have designed systems in which Medicare licensed homecare agency nurses are the main guarantors of quality, in conjunction with very close agency oversight by the state.
State Level Oversight
All but one of the site visit states which have provider agencies performs some sort of oversight of these agencies. Texas has an intensive top-down compliance monitoring system to evaluate provider agencies. In addition, state-funded prior approval nurses determine medical need and monitor consistency of reporting between physician referral, state case managers service plan and agency R.N. assessment. There is no system like this within the Massachusetts Department of Public Welfare (DPW). Instead, DPW relies on the Department of Rehabilitation for this function as part of its review of Independent Living Center activities (most of the provider agencies are ILCs). In Montana, the state does a compliance review of administration and providers in its single, state-wide provider agency. The state monitors turnover, training, billing and orders.
Case Level Oversight
States vary in the method and frequency of case level monitoring (Table 15). At one end of the continuum is Massachusetts, which uses R.N.s contracted to Centers for Independent Living and other "provider" agencies to do home visits once a year, but considers the trained recipient to be the mainstay of case level quality assurance. Michigan uses state employed R.N.s for paper reviews, and assumes that most recipients, even though they receive no training, are capable of monitoring their own services. For those who are new to the program or are more significantly disabled, Michigan uses case managers who do home visits. At the other end of the continuum are Montana, Oregon and Maryland and Texas. Texas uses state employed R.N.s for paper reviews, but in addition requires provider agency R.N.s to conduct unscheduled visits to recipient homes every two months. Similarly Montana, Oregon and Maryland depend heavily on agency or self-employed R.N.s to do frequent home visits.
| TABLE 15. Case Level Oversight | |
|---|---|
| State | Nature of Case Level Oversight |
| Massachusetts | Intensive peer training on attendant management and monitoring health care for new recipients; Annual scheduled home visit by R.N. from Center for Independent Living (CIL) or other provider agency |
| Michigan | Case management for those with multiple providers, high service needs, poor informal networks, potential for abuse or neglect, and new cases; Annual state R.N. paper review |
| Maryland | Home visit by self-employed nurse case monitor or county health nurse every 2 months |
| Oregon | Agency R.N. home visit every 3 months for foster children and every 6 months for adults |
| Montana | Homecare agency nurse supervisor unscheduled visit every 2 months |
| Texas | Agency RN home visit every 60 days, social worker home visit every six months, random on-site inspections to monitor agency compliance by state nurses |
Attendant Screening and Training
Determining provider qualifications is done primarily through screening attendants before they are employed (Table 16) and/or training them afterward (Table 17). Again, the method used depends primarily on the program's philosophy. Those which see the consumer as being the judge of quality, i.e. Massachusetts, leave these matters mostly to the recipient. Maryland screens independent providers by checking people's social security numbers against a list it maintains of people fired from nursing home jobs; the state also checks references and requires a physical exam. Even with all these checks the quality of attendants appears to be very poor in Maryland, based on consumer, advocates and nurse case manager statements. We heard no such complaints in Massachusetts. In the other states that use agency providers, the agencies do the reference checks. Texas does a criminal check as well.
| TABLE 16. Who is Responsible for Attendant Screening? | |
|---|---|
| State | Responsible Party |
| Massachusetts | Recipient screens attendants |
| Michigan | Recipient screens attendants |
| Maryland | State screens for past history of being fired from nursing home jobs, checks references, requires physical examination |
| Oregon | Agency screens |
| Montana | Agency screens |
| Texas | Agency calls employer and personal references. State runs a criminal check to screen for felony convictions |
Massachusetts and Maryland are different in their approaches to training as well (Table 17). Given their commitment to consumer control, they see the training of the attendant as the prerogative of the recipient. The Maryland program, which is not based on a consumer control ideology, requires the nurse case monitor to train the attendant on the job. Texas, which relies on agency providers, also allows for on-the-job training by the agency nurse, who must certify the aide as competent before services are initiated. Oregon and Montana specify hours of training required and, to some extent, dictate content.
| TABLE 17. Nature, Extent and Source of Attendant Training | |
|---|---|
| State | Description of Training |
| Massachusetts | Recipients responsible for training |
| Michigan | Recipients responsible for training |
| Maryland | Attendant trained on the job by Nurse Case Monitor |
| Oregon | State provides 120 hour Certified Nurse Assistant Training for agency providers |
| Montana | 8 hours of initial classroom training, plus 8 hours in-service every year plus on-the-job training by homecare agency R.N. |
| Texas | Attendant trained on the job if necessary by agency R.N. |
Recipient Complaint Mechanisms
Complaint procedures and appeal and grievance mechanisms are the most formal way that recipients have to address problems regarding service denial, assessments of need and problems with service delivery. States' complaint and grievance mechanisms which bring quality problems to the attention of program officials vary, as do the degree to which they prepare and inform recipients to be able to exercise these rights.
| TABLE 18. Recipient Complaint/Grievance Mechanisms | |
|---|---|
| State | Mechanism |
| Massachusetts | Recipient responsible for monitoring own service. Can appeal for review by another Independent Living Center. Recipients extensively trained in attendant management and self monitoring for health changes. |
| Michigan | Recipients responsible for monitoring own service and speaking up. Can complain to service workers who authorize service. |
| Maryland | Recipients can complain to the Nurse Case Monitors or to the state for a formal review. |
| Oregon | Recipients may complain to State case workers and agency RNs. The state considers the case workers to be consumer advocates. The Oregon Disabilities Commission runs a toll free hotline for consumer complaints and independent living centers also provider consumer advocacy. State does a consumer satisfaction survey. |
| Montana | Quarterly recipient satisfaction survey. Recipient complaints received by nurse supervisor. The state has a formal appeals process if recipient cannot resolve issue with homecare agency staff. |
| Texas | Client may seek formal resolution of conflicts through a meeting of recipient, attendant, caseworker, agency R.N. supervisor, and state prior approval nurse. |
PROGRAM DESIGN DISCRETION
Section 42 CFR 440.170(f) of the Medicaid regulations authorizes States to provide personal care services as an optional state plan service. This section states that "personal care services in a recipient's home ... [be] prescribed by a physician in accordance with the recipient's plan of treatment and provided by an individual who is -- (1) Qualified to provide the services; (2) Supervised by a registered nurse; and (3) Not a member of the recipient's family.
There are no other regulations, just "Guidelines", which states have more or less been willing to follow (HCFA, 1979). As a result, states have exercised a great deal of discretion and flexibility in designing Medicaid personal care services benefits under the existing Medicaid statue and regulations.
In 1988, HCFA proposed new regulations for the program in an attempt to more concretely define "personal care", service location, "home", "provider", and the nature of physician and nurse involvement (HCFA, 1988). HCFA collected comments on the proposed regulations, but has not promulgated them in final form. The interview protocol used during the site visits asked interviewees what the impact of these regulations would be on the state program. What follows are several tables and discussion regarding how freely the states have interpreted the original PC-Option regulations and a comparison to the proposed regulation standard.
Household and Chore Tasks
HCFA proposed that household and chore services can only be provided as directly related to personal care needs, and cannot constitute more than one third of the total time expended per visit (Table 19). Documentation of adherence to this formula was seen as untenable by several state administrators, regardless of the degree to which their programs offered household and chore services.
Enforcement of this regulation would change some programs more than others. Michigan and Maryland appear to allow household tasks to people without hands-on personal care needs. This may be because these programs were originally social services which provided housekeepers for a small number of hours per week. Michigan's program until recently allowed homemaker services and even guide dog maintenance to people without daily ADL needs. The Maryland program allows for supervision for people who need cognitive assistance rather than hands on personal care.
Administrators at the other sites felt that HCFA regulations, although they might be difficult to enforce, posed no threat to their current system of service delivery. Montana, for example, has developed very strict regulations which do not allow housekeeping tasks unless they are accompanied by at least one personal care task. Massachusetts administrators said that their current caseload receives such high levels of personal care that holding the attendants to providing personal care during 2/3 of each visit would probably not make any difference in the program. Given that the Oregon Program is only used for short-term personal care, the proposed regulations would have no impact. Texas provides no chore services and only allows housekeeping services for people who use personal care.
| TABLE 19. Proportion of Household/Chore to Personal Care Tasks | |
|---|---|
| State | Regulation |
| Massachusetts | Program serves only people with severe disabilities who need extensive personal care as well as homemaker/chore services. |
| Michigan | Allowed chore and homemaker services, guide dog maintenance for people without daily PAS needs. |
| Maryland | Allows supervision if related to ability to perform ADLs. |
| Oregon | Does not use PC-Option to provide household/chore services. |
| Montana | Only provides homemaking if in conjunction with at least one personal care task. Does not allow supervision as a personal care task. |
| Texas | Only people with personal care needs (including meal preparation) get homemaker services. |
| HCFA Proposed Regulations | Household and chore services can only be provided as directly related to personal care needs, and are not to constitute more than one third of the total time expended per visit. |
Service Location
HCFA proposed that services only be provided in the home or in connection with brief services outside the home for medical exam or treatment or shopping to meet health care or nutritional needs. In general it appears that states have interpreted this even more narrowly than HCFA proposed. Massachusetts allows for escort and driving for medically related travel, a term it defines more broadly than HCFA proposed. In the past, Montana allowed attendants to accompany recipients outside the home, but when administrators heard of several rulings in other states which held against this, they changed the Montana regulations to not allow recipients to be accompanied by attendants outside the home at all.
It is interesting that several of the site visit states did not even allow for trips to the doctor. In Maryland medical escort is allowed but apparently attendants refuse to escort recipients on medically related trips because there is no mileage reimbursement and no hourly pay to compensate them for having to wait long hours in the clinics and doctor's offices where Medicaid is accepted. It should be pointed out that several of the site visit states allow attendants to accompany recipients outside the home under their waiver programs, e.g. Texas, Montana, Oregon. Significantly disabled people need such services to avoid being institutionalized in their own homes. Changes in this area are certain to occur in 1994 when states will be allowed to provide services outside the home as a result of the 1990 Omnibus Reconciliation Act.
| TABLE 20. Site of Service Provision: Transportation, Driving, Escort | |
|---|---|
| State | Regulation |
| Massachusetts | Allows escort and driving for medically related travel, including laundry, food and shopping. |
| Michigan | Does not allow medical transportation. Assistance with shopping is allowed. |
| Maryland | Only escort to medical appointments allowed, but program does not reimburse mileage. |
| Oregon | No transportation/driving/escort allowed. |
| Montana | Does not allow attendant to accompany recipient outside the home. |
| Texas | Allows medical escort. |
| HCFA Proposed Regulations | Services can only be provided in the home or in connection with brief services outside the home for medical exam or treatment or shopping to meet health care or nutritional needs. |
Exclusion of Service to Those in Institutions of More Than Four Individuals
HCFA proposed the exclusion of services for people living in institutions serving more than four people (e.g. Board and Care Homes, group homes). Instituting this ruling would have major impact in several states which use personal care option funds to supplement payments to adult foster care, i.e. Massachusetts, Michigan, Montana and Oregon (Table 9). Oregon has foster care arrangements that are larger than 4 people, and the PC-Option is used there. Maryland, Michigan and Montana use personal care monies to supplement board and care arrangements, though Maryland only allows the PC-Option to provide for those in homes of no more than 4 people. Oregon and Montana use their personal care option provider agencies to provide PAS in assisted living situations. Massachusetts is considering this also for people living in what Massachusetts calls rest homes. Montana uses their PC-Option providers in group homes as well. In contrast, Texas does not use personal care option funds for any people residing in congregate housing.
| TABLE 21. Service to Institutionalized Recipients | |
|---|---|
| State | Regulations |
| Massachusetts | Allows adult foster care payment for personal care as a supplement to the regular allotment. State considering use in congregate housing for people with AIDS and in “Rest Homes” (Level III Nursing Homes). |
| Michigan | Allows in licensed residential care facilities, adult foster care (Board and Care of 6-12 beds) and homes for the Aged of 100 beds. |
| Maryland | Allows for high need recipients in small Board and Care homes or other congregate arrangements of 5 people. |
| Oregon | Uses PC-Option in foster care homes which are larger then 4 people and in “assisted living arrangements” (single apartment congregate meal arrangements) |
| Montana | Allows in apartment complexes for older people, Board and Care and in Foster and Group Homes |
| Texas | Does not allow in congregate living settings |
| HCFA proposed regulations | Exclusion of services for institutions serving more than four clients (e.g. Board and Care Homes). |
Family Providers
The HCFA definition of family in the proposed regulations was long and exhaustive. As can be seen in Table 10, only one state, Montana, uses the definition of family that was contained in the HCFA proposed regulations. Maryland adds aunts, uncle and cousins. Michigan has the narrowest definition of family. All the states exclude spouses from being paid providers. Even though this seems to be universally accepted, many advocates for people with disabilities feel it is a poor regulation. In addition, in many of these states if one has a spouse able to provide PAS the state will not pay a non-family member to be a provider. This, combined with strict eligibility requirements, has resulted in people not getting married or even getting divorced in order to receive some paid attendant services.
| TABLE 22. Family Members Who Cannot Be Paid for Providing PAS | |
|---|---|
| State | Regulation |
| Massachusetts | Child, spouse, parent, son-in-law, daughter-in-law |
| Michigan | Spouse, parent of child 18 years old |
| Maryland | Spouse, sibling, parent, child, in-laws, step parents, step children, cousins, nieces, aunts, uncles |
| Oregon | Spouse, Parent of child 18 years old |
| Montana | Uses Proposed HCFA definition of family |
| Texas | Spouse, legal guardian |
| Proposed Regulations | Exclusion of family providers, defined as: husband, wife, parent, sibling, adoptive child, adoptive parent, stepparent, stepchild, stepbrother, stepsister, father-in-law, mother-in-law, son-in-law, daughter-in-law, sister-in-law, brother-in-law, grandparent, grandchild |
Physician Oversight
HCFA defined the nature of physician involvement to review and reauthorize of the plan of treatment at least every six months. Only one state, Texas, required physician review every six months, as proposed by HCFA. Instituting this regulation would appear to create the most difficulty for Michigan, which had physicians review their orders on an as needed basis.
| TABLE 23. Frequency of Physician Review/Reauthorization | |
|---|---|
| State | Regulations |
| Massachusetts | Yearly reauthorization |
| Michigan | Physician review as needed |
| Maryland | Annual physician review |
| Oregon | Annual physician review or as needed |
| Montana | Annual physician review |
| Texas | Physician review every six months |
| HCFA Proposed Regulations | Physician must review and reauthorize plan of treatment at least every six months. |
Nurse Supervision
HCFA's proposed regulations specified a visit by a registered nurse or "licensed practitioner of the healing arts" to the consumer every three months to assess health status, need for PC services, quality of services, and to review plan of treatment. Michigan again had the most liberal interpretation of this part of the original regulations, only requiring an annual paper review by the nurse. Massachusetts requires an annual visit. The other site visit programs require frequent nurse visits. In two states, Maryland and Texas, even more frequent visits are required.
| TABLE 24. Frequency and Character of R.N. Oversight | |
|---|---|
| State | Regulations |
| Massachusetts | R.N. visit annually |
| Michigan | R.N. paper review annually |
| Maryland | R.N. case monitor visit every 2 months. Annual eligibility review by state R.N. |
| Oregon | R.N. visit every 6 months for adults, every 2 months for children |
| Montana | R.N. visit every 3 months |
| Texas | R.N. visit every 60 days |
| HCFA Proposed Regulations | A registered nurse or “licensed practitioner of the healing arts” visit the consumer every three months to assess health status, need for PC services, quality of services and to review plan of treatment |
In summation, it appears that the proposed HCFA regulations would change some programs more than others. Massachusetts and Michigan, for example, would have to radically change their programs to meet the proposed regulations. Montana's program already adheres to many of the proposed regulations. However, even the states which comply with some or most of the proposed regulations would have difficulty documenting that compliance for a federal monitoring agency, and several state administrators expressed serious reservations about the value of imposing new federal requirements on their programs.
ROLE OF PERSONAL CARE OPTION WITHIN THE STATE
Site Visit States
The PC-Option programs fill different niches in the spectrum of community-based PAS in every state. The program in Oregon is a small and insignificant part of the state Long-term Services spectrum. In Massachusetts it is also small and serves the niche of significantly disabled people who are capable of self-direction, but it is being expanded to people with cognitive disabilities as well. In Maryland the PC-Option is large but it functions alongside another large program for older people that is more generous in services provided. In Texas the very large PC-Option is also flanked by a program for older people and a clutch of small gap filling programs. In Montana and Michigan the PC-Option is the major program in the state with few other programs to serve other groups.
Oregon
In Oregon, the PC-Option is an extremely small part of the PAS system. It provides very few hours of service a week to working age and older adults needing intermittent personal care using agency providers. In addition, disabled children in foster homes are just beginning to be served.
The PC-Option is a relatively insignificant part of Oregon's overall thrust to keep people out of nursing homes and serve them either in the community or in congregate living which allows for more consumer control. The PC-Option program was moved out of the Senior and Disabled Services (SDS) Division into the Medical Assistance program in 1990. SDS Division oversees two large waivers, a 1915D waiver for older people and a 1915C waiver for younger people. SDS Division staff prefer waivers because they do not have an institutional income eligibility bias. (Oregon has opted to make the waivers have an income limit that is 300% of SSI, equal to that of the nursing home income limit, rather than the regular Medicaid income level of 100% of SSI.)
Montana
There are several programs providing PAS services in Montana. The Title III program is the largest in the state (between 3000-4000 people in FY1989) but it provides very few hours of PAS per recipient. The Personal Care Option Program served 1333 people in FY 1989. While it is not the largest program it provides significantly more hours of service. There is a waiver (617 people in FY 88-89) which mostly serves older people but has seven slots reserved for younger people who are significantly disabled. It provides more hours of services and a wider variety of services than the PC-Option and includes case management. There are long waiting lists to get in the waiver.
Michigan
In Michigan the PC-Option is the largest program in the state (27,558 people in FY1990). Michigan Department of Mental Health also uses the personal care option to serve people in adult foster care, group homes, and board and care facilities. In addition, there is a Title III program that serves older people with incomes higher than the Medicaid eligibility level. It provides homemaker, chore and home health aide service but for only a few hours a week per person. There are two waivers targeted at children: one for medically fragile children and one to deinstitutionalize children eligible for Intermediate Care Facilities for people with Mental Retardation (ICF-MRs). The Michigan Rehabilitation Commission runs a small project which enables working age people with high PAS needs to work and still receive financial subsidies for PAS from the state. This program has not grown in years. Michigan is committed to removing all people under 65 from nursing homes, and the PC-Option program is a key part of that effort.
Massachusetts
Massachusetts PC-Option program is very small (1175 people in FY 1990) and was originally started to serve a particular niche, i.e. significantly physically disabled people with low incomes who can learn to be totally self-managing. Administered by six Independent Living Centers, the program also provides services to those who work through two programs, the Massachusetts Rehabilitation Commission Program (approximately 160 people in FY 1989) and the Common Health Extra Program (100 consumers in FY 1990). Under Common Health Extra, a state funded Medicaid Buy-In plan implemented in 1989, the working individual pays a low monthly premium, and the state provides all the services the individual would ordinarily receive under Medicaid if the individual were still income eligible for Medicaid, including PAS. The size of the premium also varies according to the number of benefits the individual requires. For example, people who have health insurance connected with their job which does not cover PAS or durable medical equipment or medical rehabilitation services can pay a smaller premium than those who need all these benefits plus regular medical and hospitalization coverage. The Massachusetts Rehabilitation Commission program, which charges on a sliding fee basis for PAS, has admitted no new people since the Common Health Extra Medicaid Buy-In was instituted.
People with mental retardation and physical disabilities are beginning to be served under the PC-Option through other administering agencies as well as the ILCs, so the size of the PC-Option should change as the cognitively disabled population gets incorporated into this program through a surrogacy model. Older people in Massachusetts are served by the Area Agencies on Aging with a waiver for people needing personal care but with incomes above the Medicaid eligibility level for Massachusetts. Advocates maintain that there are still significant numbers of people with mental retardation in extremely costly institutions, and many older people in nursing homes because there are not enough community-based services.
Maryland
In Maryland there is a large program (3407 people in FY1989) that delivers primarily chore services through the state, on a sliding scale basis, to older people. This program provides more hours than the PC-Option program at a higher hourly attendant wage rate. It has a large waiting list because it is not an entitlement. As it targets more significantly disabled people, less significantly disabled people are being removed from the program. This program also has a higher income ceiling than the PC-Option. The PC-Option serves more people (5254 in FY 1989) who are more significantly disabled and poorer, and provides a narrower range of services with a very low rate of pay. The Department of Vocational Rehabilitation provides PAS for 37 people who are employed or employable. There are three small Medicaid waivers for older people, technology dependent children and cognitively disabled people leaving institutions (ICF-MRs).
Texas
Texas has a number of programs, though the PC-Option serves the most people. There are five state agencies that are involved in administering 20 PAS programs in the state. The PC-Option served 32,500 primarily older people in FY 1990. The Family Care Program, funded by state monies, serves those with a higher income level with fewer medical restrictions though at recipients are at a similar level of disability to the PC-Option population (23,000 people in FY 1989). There is a small state-funded voucher program providing recipients $300 per month for disability related expenses including PAS. There is a small client-managed attendant services program in five cities. There are 3 shared attendant sites funded by Title XX (TXX) and the state. The Texas Rehabilitation Commission administers a state-funded PAS program for employed people in some cities. The Department on Aging provides Title III funded homemaker services. Finally, Texas has three small waivers for people with developmental disabilities, for people with mental retardation, and for children using medical technology.
Who Is Underserved or Unserved
Given the multiplicity of programs, the question arises as to who falls through the cracks of this complex web of programs in each state. Site visit respondents had varying answers from state to state, but there were commonalities as well (Table 25). No state serves everyone who needs PAS. Massachusetts is the only state that has no disincentives to employment. Maryland is the only state allowing supervision as a PC-Option service for people with mental retardation or mental disabilities. And no state serves older people with incomes above poverty very well. They receive intermittent services through Title III programs if they exist at all.
| TABLE 25. Who Is Underserved or Unserved in Each State PAS System | |
|---|---|
| State | Who Are Unserved or Underserved |
| Massachusetts |
|
| Michigan |
|
| Maryland |
|
| Oregon |
|
| Montana |
|
| Texas |
|
TRENDS IN STATE UTILIZATION
As of 1988 there were 23 states that used the PC-Option to deliver services through 24 programs. New York has two different PC-Option funded programs. Between 1984 and 1988, one program (which served only people with vision disabilities) in Massachusetts ceased operating and five new programs were started, i.e. Alaska, Maine, North Carolina, Washington and West Virginia. This represents a net increase of four programs since 1984.
Other trends in state utilization can be described by the growth in the rate of participation, expenditures, recipients, and other service indicators between 1984 and 1988. Changes in the PC-Option programs can also be looked at in relation to the changes in programs funded by other funding streams and in the shifting of state PAS resources from funding stream to funding stream.
Growth Rate of Participation
The PC-Option programs varied in the growth of rate of participation, i.e. the rate of increase in the proportion of aged and disabled Medicaid recipients receiving PAS through the Medicaid PC-Option (Table 26). The states with a decrease in the number of PC-Option recipients per 1000 aged and disabled Medicaid recipients were Minnesota and South Dakota. All other states had a growth in participation. Nebraska, Missouri and Arkansas all had huge jumps in the number of Medicaid aged and disabled recipients being served by the PC-Option programs. As none of these states was included in our site-visit group, we are unable to explain why these changes occurred.
| TABLE 26. Growth Rate of Participation in the Personal Care Optional Benefit by State | |||
|---|---|---|---|
| State | Rate of Participation 1984 (per 1000) | Rate of Participation 1988 (per 1000) | Growth Rate of Participation |
| Alaska | na | 17 | na |
| Arkansas | 54 | 169 | 213.0% |
| Maine | na | 6 | na |
| Maryland | 20 | 46 | 130.0% |
| Massachusetts | 7 | 8 | 14.3% |
| Michigan | 104 | 132 | 26.9% |
| Minnesota | 137 | 24 | -82.5% |
| Missouri | 39 | 177 | 353.9% |
| Montana | na | 51 | na |
| Nebraska | 7 | 43 | 514.3% |
| Nevada | 23 | 24 | 4.3% |
| New Hampshire | 2 | 4 | 100.0% |
| New Jersey | na | na | na |
| New York | 85 | 125 | 47.1% |
| North Carolina | na | 28 | na |
| Oklahoma | 92 | 159 | 72.8% |
| Oregon** | na | 7 | na |
| South Dakota | 304 | 215 | -29.3% |
| Texas | 62 | 90 | 45.2% |
| Utah | 10 | 13 | 30% |
| Washington | na | 55 | na |
| West Virginia | na | 129 | na |
| District of Columbia | 65 | na | na |
| MEAN | 103% | ||
| SOURCE: of Medicaid recipient data: Health Care Financing Administration | |||
Growth Rate of Expenditures, Recipients and Other Indicators
In the aggregate, between 1984 and 1988, there was a 65% increase in numbers of recipients and a 144% increase in the expenditures for the PC-Option program (Table 27 below). The average number of recipients in each program grew by 37.5% during that period, and each program's expenditures grew by 102% on average. During this period there was a 47% increase in the average annual expenditures per recipient. Given that there was only a 14% increase in the Consumer Price Index between 1984 and 1988, the growth in expenditures per recipient must be explained by other factors. A part of the answer is that during the period of 1984-1988 there was an increase in provider wages in all categories (Table 12 above). Other reasons for the growth in expenditures may be increases in administrative costs, more intensive case management, and an increase in more significantly disabled recipients requiring more hours of service.
| TABLE 27. Aggregate and Average per PC-Option Program Growth Rate of Expenditures and Recipients Between 1984 and 1988 Recipients Expenditures | ||||||
|---|---|---|---|---|---|---|
| Year | Recipients | Expenditures | ||||
| Number of Programs | Estimated Total (1000) | Average per Program (1000) | Estimated Total (mils.) | Average per Program (mils.) | Average Annual per Recipient | |
| 1984 | 20 | 160 | 8 | $714 | $35.72 | $4,463 |
| 1988 | 24 | 264 | 11 | $1,740 | $72.51 | $6,591 |
| Growth Rate | 20% | 65% | 37.5% | 144% | 103% | 48% |
| SOURCE: Average per program data from Appendix D, Table D-1, Table D-3, and Table D-7. Data in this table are based on average per program means multiplied times the number of programs in each year. | ||||||
The growth rate in recipients per program varied, from a decrease of 85% in Minnesota to an increase of 232% in Nebraska (Table 28). Expenditure growth rates varied from -81% in Utah to an increase of 491% in Montana and 397% in New Jersey. One suspects that the growth in the latter two programs was accompanied by a large increase in recipients, but that data was unavailable. Not all caseloads and expenditures varied in the same direction. In seven states (Arkansas, Maryland, Massachusetts, Michigan, Nebraska, Oklahoma, and Utah) the rate of growth of recipients outstripped the growth in expenditures. In some cases the difference was quite large, i.e. Oklahoma, Utah and Nebraska.
| TABLE 28. Growth Rate of Expenditures and Recipients of PC-Option Programs by State in 1984 and 1988 | ||||||
|---|---|---|---|---|---|---|
| State | Recipients | Expenditures (Total) | ||||
| 1984 ($1000) | 1988 ($1000) | Growth Rate | 1984 ($1000) | 1988 ($1000) | Growth Rate | |
| AKa | na | 94 | na | na | 250 | na |
| ARb | 5,205 | 16,539 | 218% | 10,201 | 24,552 | 141% |
| MEa | na | 241 | na | na | 396 | na |
| MD | 1,468 | 4,000 | 172% | 4,000 | 7,600 | 90% |
| MA | 500 | defunct | na | na | ||
| MA | 584 | 1,518 | 74% | 5,655 | 12,850 | 127% |
| MI | 22,000 | 33,000 | 50% | 63,000 | 81,000 | 29% |
| MN | 11,951 | 1,787 | -85% | 5,292 | 8,904 | 68% |
| MOb,c | 4,448 | 22,000 | 167% | 9,191 | 26,114 | 184% |
| MT | na | 736 | na | 400 | 2,362 | 491% |
| NE | 155 | 515 | 232% | 750 | 1,428 | 90% |
| NV | 243 | 300 | 23% | 510 | 1,020 | 100% |
| NH | 33 | 55 | 67% | 304 | 891 | 193% |
| NJ | na | na | na | 1,502 | 7,460 | 397% |
| NYb | 4,283 | 10,197 | 138% | 24,904 | 94,000 | 277% |
| NY | 52,400 | 79,198 | 51% | 458,200 | 1,179,830 | 157% |
| NCa | na | 3,765 | na | na | 12,905 | na |
| OK | 7,643 | 14,028 | 84% | 34,400 | 35,000 | 2% |
| ORb,d | na | 300 | na | na | 18,976 | na |
| SD | 4,000 | 3,282 | -18% | 1,834 | 2,690 | 47% |
| TX | 14,399 | 31,266 | 117% | 46,424 | 108,983 | 135% |
| UTb,e | 141 | 200 | 42% | 939 | 183 | -81% |
| WAa | na | 5,864 | na | na | 34,000 | na |
| WVa | na | 7,500 | na | na | 4,000 | na |
| DC | 900 | na | na | 3,600 | na | na |
| TOTAL | 130,353 | 211,321 | 80 | 671,106 | 1,665,394 | 144% |
| ||||||
There was a large growth rate in total hours of PAS delivered by the PC-Option programs, and a large increase in average hours of service delivered per program (Table 29). These increases are greater than the growth rate in recipients, suggesting that more significantly disabled people are receiving services.
| TABLE 29. Total and Average Per Program Growth in Hours | |||
|---|---|---|---|
| Year | Number of Programs | Estimated Total (millions)** | Average per Program (millions)* |
| 1984 | 20 | 142.4 | 7.12 |
| 1988 | 24 | 337.7 | 14.07 |
| Growth Rate | 20% | 137% | 107% |
| * SOURCE: Appendix D, Table D-5. ** Computed by multiplying number of programs by the average per program hours because data were not available for all programs. | |||
Change in Service Availability and Service Limits
Eighteen percent of the PC-Option programs have stopped making services available whenever they are needed during the day or the week (Appendix D, Table D-11). There has been an average decrease of one hour per week per recipient in the maximum hours programs allow. And there has been an average decrease of $300 per year in the maximum allowance per recipient. All of these figures indicate a general trend toward limiting service to recipients over the period from 1984 to 1988, a period of fiscal crisis in the states. Yet even with these restrictions, there has still been an overall increase in hours of service delivered and program expenditures per recipient, as noted above.
Comparison of Growth Rate Across Funding Sources
Between 1984 and 1988, programs with different sources of funding grew at different rates. Programs funded by Medicaid waivers on the average exhibited more growth in the period between 1984 to 1988 than any other funding source (Table 30). The PC-Option programs showed high average growth in expenditures but less average growth in numbers of recipients. Title XX/Social Service Block Grant (SSBG) Programs had high average growth in numbers of recipients, expenditures and expenditures per recipient, but experienced only a small average growth in hours delivered per program. Programs funded solely by state revenues declined on the average in terms of recipients, hours and expenditures, suggesting that states are cutting programs that have mostly state funds. Title III programs also showed a decline.
| TABLE 30. Growth Rate of Various Program Indicators by Funding Source between 1984 and 1988 | |||||
|---|---|---|---|---|---|
| Indicator | Funding Source | ||||
| TXIX PC-Option | TXIX Waiver | SSBG | TIII | STATE | |
| Average Annual PAS Program Expenditures | 102% | 312% | 96% | -14% | -45% |
| Average PAS Caseloads | 39% | 202% | 302% | -14% | -56% |
| Average Total Hours of PAS Provided | 107% | 379% | 8% | 1% | -14% |
| Average Program Expenditures Per Recipient | 1% | 50% | 81% | -52% | 19% |
| Mean Change in Maximum Hours/ Recipient/Week Allowed | -1.0 hours | -0.7 hours | 0 | ||
| Mean Change in Maximum Expenditures/Year/Recipient Allowed | $300 | $1,900 | $200 | $1,000 | |
Shifting of Resources Among Different Funding Sources
Between 1984 and 1988 eleven programs appeared to have shifted funding sources. Two of these had actually consolidated with other programs which had different funding sources. Two state funded programs began to use Medicaid waiver funds, and another had begun to use the PC-Option. The remaining five programs shifted between the Title XX, Title III, State and Other groups. Because data was collected covering only two points in time, it is difficult to describe overall trends in shifting among the funding sources. But more specific information gathered during the site visits illuminates this issue.
Until the recent downturn in Massachusetts' economy, the state did not pursue Federal matching monies to any great extent. That is changing, however, as advocates realize the potential of accessing Medicaid PC-Option money for serving people with physical disabilities and mental retardation and as the aging constituency presses for more use of the Medicaid waiver.
In Oregon the state provided some in-home services through the Area Agencies on Aging, but this was inadequate to meet the need. It pursued Medicaid funding, first in the form of the PC-Option and later in the form of Waivers, as a way of reducing its Medicaid expenditures on nursing homes. Currently it is using the PC-Option to augment state expenditures on foster care for disabled children, again as an alternative to institutionalization.
Four site visit programs grew out of Title XX programs at the time that Congress capped the program and turned it into a block grant. Montana deliberately switched the program to Medicaid in 1977 when Title XX was capped, in order to access Federal matching funds for the personal care that it was already providing. The switch was not effective in leveraging federal dollars until Montana contracted with a statewide provider agency to deliver services. Montana has also developed a Medicaid waiver to further leverage federal dollars serving people who are more significantly disabled.
The Maryland PC-Option program grew out of a Title XX program targeted at people who were the least disabled and who had friends and neighbors who could be paid a small amount to look in on them. There has been much pressure on the program to create higher levels of pay in order to serve more significantly disabled individuals. Rather than expand the PC-Option, the state prefers to use the waivers to target very specific populations, e.g. technology dependent children, institutionalized people with mental retardation.
Texas also shifted its Title XX program into Medicaid when Title XX funds ceased to expand, in order to gain the Federal match. In the future, the state administration is looking to the waivers and to section 1929 of the SSA to fill in gaps. They see this as a way to target populations without having to create entitlement programs which cannot limit the populations served. Michigan's program also started as a Title XX program which was switched to Medicaid in 1980.
In summation, it appears that many states have decided that the only way to leverage Federal funds for PAS service growth is through Medicaid. States see the Medicaid as a way to expand service for small groups and the PC-Option as a major federal funding source for larger programs.
DISCUSSION
The Changing Role of the Medicaid Personal Care Option
The Medicaid personal care (PC) option has been a major source of public funding for home and community-based long-term services. Moreover, it is currently experiencing significant growth at both a national and state level. Since WID's first survey of personal assistance service (PAS) programs in 1984, at least seven new states added the PC-Option to their Medicaid plans, and other state administrators and legislators throughout the country are closely examining this funding source. Between 1984 and 1988 the number of recipients grew 65% and expenditures grew 144%. This growth is due in part to the pervasive fiscal shortfalls in many states.
In an era of shrinking state revenues, many states view the PC-Option as one of the few vehicles left for leveraging federal dollars to expand PAS. Medicaid Waivers, despite their proliferation, have failed to bring PAS to most of the people who need it, as the waivers tend to be relatively small and targeted to special populations (i.e. federal figures indicate that two-thirds of waiver spending goes toward services for people with developmental disabilities). In many states the number of people served through purely state or Social Service Block Grant funded programs have declined because of new fiscal restraints. The Personal Care Option has therefore become the mainstay of many states' home and community-based services systems.
The same fiscal climate which has contributed to greater utilization of the Personal Care Option has created pressure to contain PAS program costs. Despite the federal match, Medicaid services are increasingly viewed as "budget busters" because of their entitlement status, and are coming under legislative and executive scrutiny. States vary dramatically in the degree to which they limit access to services, but all programs are caught between the growing demand for services and the need to contain costs.
The growth in caseloads and expenditures can also be attributed to expanding and diverse populations seeking services, i.e. children and adults (under and over age 65) with a variety of physical, cognitive, and psychiatric disabilities. One of the major questions raised by this study is whether -- or to what extent and by what means -- it is possible to accommodate the sometimes disparate needs of different populations in a single program.
Traditionally, "long-term care", whether provided in nursing homes or in home and community-based settings, has been primarily associated with the needs of persons over 65 who develop age-related functional disabilities as the result of chronic medical conditions, including Alzheimer's disease and other dementias. The Medicaid personal care option was originally modeled on an Oklahoma program that sought to augment the in-home services available to the disabled elderly by paying small stipends to individuals -- primarily friends and neighbors -- recruited by the care recipient or his or her family to supplement informal supports.
Although the Oklahoma prototype and most subsequent PC-Option programs serve older people with disabilities, programs have evolved in many states which serve a sizable number of younger people. Massachusetts in particular serves predominantly a working-age population. Oregon's PC-Option is unique in targeting only disabled children. Michigan, Montana and Maryland serve people with cognitive disabilities, and Maryland also serves some people with psychiatric disabilities. Most programs limit service to people with physical disabilities, although this is changing as more people move from institutions into the community.
The growth in the number and types of people seeking home and community-based long-term services has been accompanied by growing political and economic scrutiny of existing service delivery systems. Disability rights advocates are increasingly demanding a service delivery system which facilitates independence and empowerment by maximizing consumer involvement in all aspects of PAS. They argue that consumers are the best qualified to assess how much service they need, what kinds of services they need, and when, where, and how these services should be delivered. They therefore prefer independent providers who are hired, supervised, and paid directly or indirectly by the consumer or his/her chosen surrogate. Until recently, advocates for seniors focused on expanding professional accountability and government regulations for Medicaid and Medicare services to ensure "quality" (which is largely defined as a lack of negative outcomes such as abuse and neglect), but recent research and advocacy efforts indicate that older people with disabilities are also concerned with autonomy issues.
The type of system promoted by disability rights advocates is seen as a challenge to the traditional "medical model" of service delivery. This model defines personal assistance as a medical or medically-related need and puts medical and social service professionals (physician, nurses, and/or medical social workers) in charge of allocating and monitoring a limited range of services, usually provided via private or non-profit homecare or home heath agencies. Advocates for seniors have also voiced criticisms of the medical model, although on somewhat different grounds. Typically, they are concerned by the fragmentation of the financing and delivery system that results when coverage of "non-medical" services is prohibited under medical insurance programs such as Medicare or Medicaid.
For example, in the early 1980's HCFA sought to take disallowances against New York's PC-Option program for providing homemaker/chore assistance to some elderly persons determined to need help because they lived alone but who did not require "hands on" personal care. An administrative law judge ruled, however, that the regulatory definition of “personal care” was sufficiently ambiguous to support New York's interpretation.
Proposed HCFA regulations published in 1987 would have prohibited such coverage, on the grounds that such individuals' need for home attendant services is purely "social" rather than "medical". The same regulations would also have strictly limited (to one-third of the total time) the level of amount of time that personal care attendants under the PC-Option could be put into performance of homemaker/chore services. The proposed regulations elicited considerable negative commentary from state agencies as well as advocacy groups, and were never promulgated.
Compared with other Medicaid services, the PC-Option is relatively unconstrained by federal regulatory requirements or prohibitions and, therefore, open to definition by each state that elects to include coverage of personal care in its state plan. In this study, the data analyses suggest and the site visits confirm the extraordinary variability among states which use the PC-Option. Federal regulations specify only that personal care services in the home must be 1) prescribed by a physician, 2) supervised by a registered nurse, and 3) provided by a "qualified" individuals who are not members of the recipient's family. States have tended to interpret these requirements according to their own predilections.
Moreover, states that consider themselves hamstrung by federal regulations may appeal to Congress to enact legislative relief. Minnesota did so successfully in 1990. When the phrase “in the home” was interpreted by HCFA as meaning limited to the home, state officials asked a Senator to get Medicaid law rewritten to permit the provision of services outside the recipient's home. In establishing a statutory basis for the personal care optional benefit, OBRA 1990 specified that Minnesota could immediately begin covering personal care provided outside the home and that all states would be permitted to do so as of 1994.
Will the states be able to use the PC-Option to meet the needs of the diverse and increasingly vocal population demanding services, while trying address their own managerial concerns such as liability, income tax withholding, and worker's compensation? Does it make more sense to administer a multitude of programs with different administrations, eligibility requirements, and types of service delivery to serve the needs of different groups, or can a single program be developed which is flexible enough to respond to the needs and preferences of a heterogenous consumer population? The following sections outline some of the problems in the organization of PC-Option programs that need to be addressed in order to better serve people who need personal assistance services.
Current Limitations of PC-Option Programs
1. The number of hours of service available may not meet the needs of the significantly disabled population.
A variety of service limits restrict program utilization for people with more significant functional limitations or specific service needs. Limits in the type and amount of services may preclude potential consumers from seeking program services, even if they are technically eligible. If existing PAS programs do not meet their needs, such individuals may have to be served in costly and restrictive institutions. The most common reason cited for service caps is cost containment. However, institutional placement or development of separate programs for people with high service needs is unlikely to save state revenues. While acknowledging the need for management of program expenditures, states should consider allowing the relatively small number of people who require up to 24 hours of PAS per day to receive this level of service. Unless service allocations reflect the actual need of the consumers, programs may be "penny wise but pound foolish".
2. The scope of services available may not meet the needs of the populations served. Particularly problematic for many consumers is the lack of supervision, emergency services, and paramedical services.
PC-Option programs tend to offer a core of basic personal and household tasks (e.g. feeding, bathing, dressing, ambulation, transfers, oral hygiene and grooming, skin maintenance, light housekeeping, laundry, meal preparation and cleanup). Other tasks (e.g. emergency services, supervision, paramedical services, non-medical escort and transportation, assistance with childcare, heavy cleaning and maintenance) are often not considered appropriate personal assistance services, even though people may need such services to live independently.
a. Emergency services
Many programs do not offer emergency services, due in large part to the logistical staffing problems involved. Some programs which contract with provider agencies are able to offer such services, because agencies can designate one or more employees as emergency attendants. Programs which utilize independent contractors have more difficulty effectively providing emergency services, but may allow for emergency hiring of contract agency providers or maintain lists of available independent providers. The efficacy of different systems of emergency service provision merits further examination.
b. Supervision services
Support services for people with cognitive and psychiatric disabilities are rarely provided. However, states should consider expanding the definition of personal care to include people who need supervision (rather than hands-on assistance) in order to perform personal care and household tasks. Currently PAS is provided to people with psychiatric disabilities under the PC-Option in Maryland, and this appears to be an effective way to reduce costly hospitalization.
c. Paramedical services
The provision of paramedical services or "invasive procedures" (e.g. assistance with medications, injections, catheters or ventilators) is particularly problematic for PAS programs in general. There has been a slight decline in programs offering paramedical services, because nurses' aides and home health aides are too expensive to provide paramedical services on a daily basis, and attendants are not allowed to provide these services due to legal restrictions set by state Nurse Practice Acts (Sabatino, 1990).
Nurse Practice Acts usually prohibit non-licensed individuals other than family members from doing invasive procedures. State administrators often cite these laws, and concern over liability for negligence, as reasons for not providing paramedical services through their PAS programs, but people who need such service on a daily basis may not be able to live in the community because of such restrictions.
A few states have worked directly with state nursing boards, consumers, advocates, providers, and state officials to modify the Nurse Practice Act or related regulations. In Oregon, for example, regulations were promulgated which allow nurses to delegate paramedical tasks to attendants after specific training for those tasks. Massachusetts explicitly allows the consumer to train an attendant to provide paramedical services.
Several programs tacitly acknowledge that program recipients may receive services technically excluded by state statute, but these programs do not attempt to enforce such service restrictions. Administrators of these programs say that the actual risk of successful negligence lawsuits is relatively low, and the state has simply decided to assume the liability risk. However, a more systematic resolution of this issue is required for all states to address the paramedical needs of consumers. Collaboration with state and nursing boards and national professional groups is clearly the first step in such a resolution.
3. Limits on the times services are provided and the locations in which services are provided often impede participation in the family, community, and workplace.
Restrictions on the times and locations in which services are provided limit the independence of consumers. Provision of personal assistance services is usually restricted to the home. Transportation and escort services, if available at all, are usually limited to medically related trips. People without other informal supports may become essentially confined to their homes because of such restrictions. Recent changes made in the Omnibus Budget Reconciliation Act of 1990 will allow service provision outside the home, but states should be encouraged to adopt these changes immediately.
4. Income eligibility requirements limit service access, and discourage marriage and employment for consumers.
Although Medicaid by definition is directed to low-income Americans, eligibility requirements can be modified to help a greater number of people with disabilities to access essential services, and allow people who are receiving these services to become employed and establish long-term relationships.
Some states have developed programs with state funds to overcome income restrictions inherent in Medicaid funding, but fiscal shortfalls are prompting many of these programs to be capped or cut, and efforts are being made to move people receiving services onto state Medicaid rolls. To facilitate this, all states should be encouraged to institute "spend-down" programs to Medicaid income eligibility, and allow disability related expenses (including PAS) to be included in the spend-down formula.
Federal legislation could also be considered which would allow states to use the Medicaid waiver and nursing home standard of up to 300% of SSI to determine eligibility. Income eligibility for PC-Option services would then be comparable to that of Medicaid subsidized institutional placement.
Many programs assess spousal income when determining eligibility, which may cause recipients who marry to become ineligible for benefits. In some programs, non-disabled spouses are required to provide unpaid PAS. In a few programs, consumers living with nondisabled spouses or family are deemed ineligible for any services. These types of regulations place an extraordinary burden on family systems, and constitute a form of discrimination against PAS consumers. Eligibility requirements should be modified to assess only individual income, and consumers should be allowed to live with non-disabled family members while receiving services.
Income restrictions often act as de facto work disincentives for PAS recipients. Because they would lose benefits and be forced to purchase PAS privately, many consumers simply cannot afford to become employed. The implementation of section 1619 of the Social Security Act has allowed SSI recipients who start working to maintain publicly funded benefits (including PAS) until their earnings exceed the value of these benefits, but at this point awareness and utilization of section 1619 is quite limited. Rehabilitation agency personnel and other service professionals will need training and support to see that this regulation is effectively utilized, and modifications will need to be made to the regulations themselves, notably increasing asset limits. Additional expenditures for provision of PAS to people who work will probably be offset by the tax revenues generated by these individuals.
5. Family providers are not included in the repertoire of possible provider arrangements, despite the potential cost savings and desires of some consumers.
The PC-Option precludes family providers, but there is much variability in how "family" has been defined. Although this regulation was intended to contain program costs by avoiding payment of volunteer providers, there are some situations in which paid family providers are cost-effective and preferable to the consumer. In some geographical areas, there may be no one else available and willing to provide needed services. In other cases, language may be a barrier and family members may be the only people available and capable of providing the type of service required.
Some consumers will choose to have their PAS provided by a family member. However, in many cases, because reimbursement is not available or attendant reimbursement rates are too low, consumers are forced to rely on family members. Family providers should not be a cost control mechanism, but should be an available option.
6. Utilization of independent providers is limited, despite the lower per unit cost and greater consumer control, because of liability concerns and withholding issues.
Independent providers (lPs) are an essential part of any PAS delivery system. Because IPs are hired and managed primarily or exclusively by the consumer, they are generally more responsive and accountable to the consumer. They tend to have a lower per unit cost than agency or government providers, although some analysts have argued that the cost savings are achieved in part by elimination of administrative support, and transfer of management responsibilities to the unpaid and usually untrained consumers. The lower cost and the potential for greater consumer control make IPs particularly suitable for people with high service needs.
Despite cost savings and the preferences of many consumers, some states have stopped using independent providers. Others are face considerable difficulties in maintaining their commitment to using them. The main problem for the states which use IPs involves responsibility for employee benefits and withholding of federal and state taxes. Independent providers may be considered self-employed, employed by the disabled recipient or employed by the state for purposes of some types of tax and benefit withholding.
Convoluted strategies are being used to avoid dealing with withholding in order to avoid being deemed the employer of IPs. Income and social security tax is often not paid on attendant earnings, and there is often no clear designation of responsibilities regarding unemployment and worker's compensation. The IRS and state labor boards are questioning the validity of these employer relationships, and some states have responded by shifting to agency providers to avoid the risk of being designated as legally responsible for benefits and withholding.
Another commonly cited impediment to use of IPs is concern over liability for attendant negligence. Even though few states have actually experienced any litigation, many state administrators say that liability concerns have impacted the design of their systems.
Because of the clear advantages of the IP mode, organizational and legal solutions to the problems in employing IPs need to be developed. A dialogue with the IRS should be established to explore ways to address tax withholding. The American Bar Association or state affiliate could be contacted to assess the actual frequency of liability cases and recommend ways in which states can resolve the liability issues. Perhaps attendant associations could be established to provide group attendant liability insurance. Such an association could also be the basis for other group benefits. Service recipients could also apply for individual worker's compensation, and the cost of the insurance could be included in the recipients' financial allotment. It is also important to look at ways consumers can be assisted to use the IP mode, i.e. support services, emergency services, and consumer training in attendant management.
7. Consumers do not have a choice among provider modes.
Researchers, administrators and advocates agree that a single provider type will not be able to meet the needs of all people who need PAS. However, most programs use only one type of provider, and those which use more than one usually base the decision on administrative factors (county and state regulations, geographic location of consumer, cost guidelines) rather than consumer choice.
There are advantages and disadvantages associated with each provider mode. The lower cost and the potential for greater consumer control make IPs an attractive choice for many consumers, but effective use of this provider mode requires management skills on the part of the consumer, as well as emergency and support services (attendant registries, assistance with screening, hiring and firing of attendants). Family providers may also be a cost effective choice for consumers with informal support systems. Agency providers may be useful in situations where individuals need fewer hours of assistance, because agencies can coordinate a relatively small number of staff to provide this level of service to a large number of people. For people who cannot or choose not to hire and manage their attendants, agency providers may be preferable. Government providers may offer a more stable workforce.
The administrative challenge is to design a program with sufficient flexibility that most or all of these provider modes are options available to the consumer. While acknowledging that the administration of such programs would be complicated and possibly costly, many states might reduce overall costs by bringing a multiplicity of different programs for different populations under a single administrative structure.
8. Assessment of service quality is based on broad administrative standards instead of consumer experience
There is an ongoing debate among policy makers and program administrators on how to define and assess service quality. In the absence of any standards of quality, many states have developed minimum compliance standards assessed by state evaluation teams, often composed of medical professionals. Such standards are usually developed without consumer input, and therefore reflect administrative concerns rather than the actual experience of service recipients. Quality in such programs is defined as low incidence of negative outcomes (e.g. reported cases of negligence), and compliance with regulations. Such measures may bear little or no relation to actual experiences of consumers.
Some states have tried to address this problem by involving consumers in the process of quality monitoring. A few provide training to the recipient or his/her family in order to recognize quality services. Peer training in Massachusetts appears to increase both service quality and consumer satisfaction. Others provide ombudsmen, consumer hotlines, conflict resolution, and appeal procedures.
Several states have established advisory boards which include consumers, but these boards often have little power to impact program policy, and board members are not compensated or reimbursed for transportation, PAS, or disability related expenses. A genuine commitment to the participation of consumers, advocates, family members, and providers will need to include administrative and financial recognition of the contributions of program advisors.
In all states, a primary impediment to quality is the lack of an adequate pool of available attendants. Low pay and benefits lead to constant turnover among attendants. Many consumers must endure a poor quality of service because the alternative is no service at all. A recognition of the value of PAS as an alternative to isolation, dependence, and institutionalization will necessarily require financial recognition of the demanding job performed by the PAS provider. If a responsive, high quality system of home and community-based services is established, the savings in terms of reduced institutional placements, lower utilization of medical professionals, and increased productivity among consumers should offset the cost of maintaining an adequately paid attendant workforce.
If policy makers are going to make informed decisions about expanding services, improving quality, and containing costs, they will require good information about PAS programs. Without such information, programs are often developed and modified in response to short-term political pressures rather than long-term needs of the consumers. This current research project was also complicated by inconsistencies and inadequacies in the data reported by each of the states. Programs should be required to document basic fiscal and demographic data in a uniform manner.
Conclusions
Across the U.S. there is extraordinary variability in the number of people receiving necessary services. Some states make a concerted effort to provide personal assistance services to many of those who need it, while others provide very little. Some sort of federal action would probably be required in order to address these disparities.
A number of different proposals for federal action are currently being discussed. One strategy is to make personal care a mandatory Medicaid service. This is in fact on the verge of occurring, but in a way that has given rise to many ambiguities. In OBRA 1990, statutory language (apparently intended to accommodate Minnesota's desire to provide personal care outside the home) refers to personal care (including the regulatory requirements, now revised to explicitly permit provision of services outside the home) as a part of the definition of "home health services". This took effect immediately for Minnesota, and will be implemented nationally in 1994. Because home health is a required service, insofar as all states must make home health coverage available to Medicaid eligibles who qualify for nursing facility care, this statute appears to make personal care mandatory. It is unlikely that this was the intent of the legislators who drafted the legislation.
How the OBRA 1990 legislation is interpreted could have a profound impact on states currently utilizing the PC-Option, as well as those that do not. Some state administrators of PC-Option programs are concerned that the linkage between personal care and home health could mean that PAS providers must be certified home health agencies. However Minnesota, which is currently bound by the OBRA 1990 statute, has not established any linkage between its home health and personal care programs (in terms of eligibility, services provided, service limits, etc.) and continues to use independent providers.
A different approach to increasing Medicaid recipients' access to PAS is to shift a percentage of the current Medicaid expenditures from institutional services to home and community-based services. According to Reilly et. al. (1990) 40.7% of all Medicaid payments were for services to long-term care facilities (including ICF-MRs as well as nursing homes) in 1989. The national advocacy group ADAPT (American Disabled for Attendant Programs Today) is probably the most vocal proponent of this strategy, demanding that 25% of current federal nursing home expenditures be redirected to PAS.
States can now reallocate long-term service expenditures through the 1915(D) home and community-based waiver. This gives states the option to interchange funding for nursing home and home and community-based services for aged and disabled Medicaid recipients in return for states' acceptance of capped federal matching funds for all such care provided. The 1915(D) waiver provision provides for annual increases in the funding cap to be indexed according to inflation and elderly population growth. To date, only Oregon (which was responsible for getting the 1915(D) waiver authority enacted into law) has elected this option.
Another alternative which would require new legislation is to consolidate all Federal PAS programs (i.e. Waiver, PC-Option, Title III PAS, and currently expended Social Service Block Grant monies) into a block grant program to states which is indexed to some measure of annual growth and does not require state matching funds. This grant would need to be accompanied by additional federal funding, based on estimates of the gap between what is needed to serve the target population (defined by ADL deficits and income) and what is currently being spent. It could help eliminate the differences in administration and eligibility determination among state programs, without creating a new open-ended federal entitlement with unpredictable costs. However, although the states would initially benefit from this infusion of funds and lack of federal requirements for matching state revenues, they could find that meeting growing demand for services will require greater and greater infusions of state monies if indexing failed to provide enough funding to keep pace with demand.
All of these proposals have drawbacks, but some sort of resolution of the access issue is imperative. As political, economic, and demographic pressures build, federal and state government will need to initiate a formal process of dialogue between administrators, legislators, providers, advocates and consumers. PAS is essential to a growing number of Americans, and a way must be found to provide these services.
REFERENCES
Health Care Financing Administration (April 4, 1979). Medical assistance manual, HCFA-AT-79-33, 5-14-00, 1-11. Washington DC: HCFA.
HCFA (June 27, 1988). Proposed rules. Federal Register, 53 (123), 24103-24106.
HCFA, Office of Intergovernmental Affairs (1983-1987). Medicaid services state by state, 02155-83 to 87. Washington, DC: HCFA.
Justice, D., Etheredge, L., Luehrs, J. and Burwell, B. (1988) State Long-term Care Reform: Development of community systems in six states. Washington, D.C.: National Governor’s Association. [http://aspe.hhs.gov/daltcp/reports/strfrm.htm]
Kapp, M.B., Improving the choices regarding home care services: Legal impediments and empowerments. Dayton, OH: Wright state university school of medicine, unpublished manuscript.
Kennedy, J. & Litvak, S. (1991). Case studies of six state personal assistance service programs funded by the Medicaid personal care option. Oakland, CA: The World Institute on Disability. [http://aspe.hhs.gov/daltcp/reports/casestud.htm]
Lewis-Idema, D., Ginsburg, S. and Falik, M. (1990). Descriptive study of Medicaid Personal Care Programs. Laurel, MD: Author.
Litvak, S., Heumann, J. & Zukas, H. (1987) Attending to America: Personal Assistance for Independent Living. Berkeley: World Institute on Disability.
Neuschler, E., Center for Policy Research (September, 1987). Medicaid eligibility for the elderly in need of long-term care. Washington, DC: National Governor’s Association.
Palley, H.A. (1989, October) Personal care services under Medicaid: A survey of the U.S. experience. Paper presented at the International Congress on Gerontology, Acapulco, Mexico.
Reilly, T.W., Clauser, S.B. and Baugh, D.K. (1990) Trends in Medicaid payments and utilization, 1975-89. In Health Care Financing Review/ 1990 Annual Supplement. Baltimore, MD: Health Care Financing Administration.
Sabatino, C. (1990). Lessons for enhancing consumer-directed approaches in home care. Washington, D.C.: American Bar Association.
State Medicaid Information Center (1989). Medicaid eligibility: Selected program characteristics. Washington, D.C.: National Governor’s Association.
APPENDIX A: SUMMARY OF EACH PERSONAL CARE PROGRAM BASED ON 1984 AND 1988 QUESTIONNAIRES
Personal Care Program
Division of Medical Assistance
4433 Business Park Boulevard, Building M
Anchorage, AK 99503
(907) 561-2171
Program Implemented: 1986
| Fiscal or Calendar Year 1988 Data | |
|---|---|
| Interviewee | Barbara Crane, Personal Care Coordinator |
| Total Expenditures | $250,000 |
| Medicaid Expenditures | $125,000 (50%) |
| Other Expenditures | State $125,000 (50%) |
| Total Number of Clients Served | 94 |
| Total Hours of Service Provided | na |
| Cost Per Hour of Service | na |
| Provider Mode | Individual providers only |
| Entitlement Program | Yes |
| Program Eligibility Requirements | |
| Maximum Client Income | na |
| Age Groups Eligible | All |
| Disability Groups Eligible | None specified |
| Other Eligible Requirements | None |
| Attendant Profile | |
| Independent Providers | |
| Hourly Wage | $8.30 |
| Benefits | na |
| Consumer Can Hire/Fire Attendant | Yes |
| Consumer Can Pay Attendant | No |
| Consumer Can Train Attendant | No |
| Program Services Available | |
| Personal Services | Bowel and bladder care, feeding, bathing/showering, dressing, menstrual care, ambulation, moving in and out of bed, oral hygiene and grooming, skin care, care and assistance with prosthesis, range of motion, foot care. |
| Household Services | Light cleaning, laundry, meal preparation and clean-up, meal planning. |
| Communication Services | None |
| Transportation Services | Medical escort only. |
| Short-Term Services | None |
| Medical Supervision Required for Some Services | Yes |
| Recipients Participate in Decisions r.e. Service Allocation | No |
| Services Available 7 days per week, 24 hours a day | No |
| Service Limits | None |
| Average Weekly Hours Provided Per Consumer | 6 |
| Italic Type = 1985 Survey Data. Plain Type = 1988 Survey Data. | |
Personal Care Program
Department of Human Services
P.O. Box 1437
Little Rock, AR 72201
(501) 682-8360
Program Implemented: 1978
| Fiscal or Calendar Year 1984 and/or 1988 Data | |
|---|---|
| Interviewee | Judy Kerr, Administrator, Program Planning and Development Richard Petty, Management Project Analyst Joyce Jones, Supervisor of Program Operators |
| Total Expenditures | $24,552,136 $10,201,000 |
| Medicaid Expenditures | $18,310,983 (75%) $6,840,000 (67%) |
| Other Expenditures | State $6,241,153 (25%) State $2,758,000 (27%) Title V OAO $440,000 (4%) Title XX $162,750 (2%) |
| Total Number of Clients Served | 16,539 5,205 |
| Total Hours of Service Provided | 2,822,661 494,398 personal care visits of 2-5 hours |
| Cost Per Hour of Service | $8.70 |
| Provider Mode | Private agencies only |
| Entitlement Program | Yes |
| Independent Living Rating | Low |
| Program Goals | To enable people to stay in their own home and community, to prevent institutionalization, to contain costs associated with long-term care. |
| Program Eligibility Requirements | |
| Maximum Client Assets | na |
| Maximum Client Income | $5,083 $3,816 for Title XIX funding $9,267 for Title XX and Title V (limited) |
| Type of Disabilities Eligible | All disabilities |
| Age Groups Eligible | All ages Over 60 |
| Other Requirements | At risk of institutionalization, physician's orders, self sufficiency, prevention of abuse or neglect, previous unnecessary institutionalization. |
| Number of Applicants Considered Ineligible | na |
| Attendant Profile | |
| Private Agencies | |
| Hourly Wage | na $3.40 |
| Reimbursement to Agencies | na $6.00 |
| Benefits | na Social security, worker's compensation, unemployment compensation. |
| Attendant Requirements | Graduate of agency training program. |
| Who Hires/Fires Attendant | Agency |
| Who Pays Attendant | Agency |
| Administrative Profile | |
| Administrative Agency | Department of Human Services |
| Types and Quantity of Services Assessed By | Case-management team |
| Factors for Assessment | Physician's recommendation, functional abilities (ADLs), accessibility of environment, services needed. |
| Administrative Activities | Eligibility determination, needs assessment, provider supervision. |
| Consumer Profile | |
| Age Ratio | na |
| Sex Ratio | na |
| Ethnicity Ratio | na |
| Disabilities Served | All |
| Average Income | na |
| Income Source | na |
| Number Who Left Institutions Because of the Program | na |
| Number Who Could Leave Institutions If Program Were Expanded | na |
| Program Services Available | |
| Personal Services | Bowel and bladder care, feeding, bathing/showering, dressing, ambulation, moving in and out of bed, oral hygiene and grooming, skin care, range of motion, foot care, menstrual care, care and assistance with prosthesis. |
| Household Services | Light cleaning, heavy cleaning, laundry, grocery shopping, meal preparation, planning and cleanup, chore services. |
| Communication Services | None |
| Transportation Services | Escort and driving, medical trips only. |
| Short-Term Services | None |
| Medical Supervision Required for Some Services | Yes Every two months for personal care. |
| Recipients Participate in Decisions r.e. Service Allocation | Yes |
| Services Available 7 days per week, 24 hours a day | Varies |
| Service Limits | 72 hours per month 18 hours per week, $432 per month. |
| Average Weekly Hours Provided Per Consumer | 3.3 12 |
| Administrator Comments | |
| Program's Strong Points | "With little care, people are able to maintain independence longer. Case management is excellent, ties folks with other services." |
| Program's Weak Points | "Not enough services available: not enough funds, not enough hours, cost limits, for every client who qualifies for Medicaid, there are two potential clients that don't." |
| Program Changes Being Contemplated | "Statewide screening of nursing home admissions to divert to community services. Planning to apply for Medicaid Waiver." |
| Changes Since 1984 | |
| Developed functional assessment tool. Created minimum disability level. Instituted statewide uniform assessment process. Improved management information system. | |
| Italic Type = 1985 Survey Data. Plain Type = 1988 Survey Data. | |
Medicaid PC-Option
Department of Human Services, Bureau of Medical Services
249 Western Avenue, State House Station 11
Augusta, ME 04333
(207) 289-3957
Program Implemented: 1986
| Fiscal or Calendar Year 1988 Data | |
|---|---|
| Interviewee | Diane Jones, Comprehensive Health Planner |
| Total Expenditures | $395,629 |
| Medicaid Expenditures | $263,568 (67%) |
| Other Expenditures | State $132,061 (33%) |
| Total Number of Clients Served | 241 |
| Total Hours of Service Provided | na |
| Cost Per Hour of Service | na |
| Provider Mode | Private agencies only |
| Entitlement Program | na |
| Program Eligibility Requirements | |
| Maximum Client Income | na |
| Age Groups Eligible | All |
| Disability Groups Eligible | Physical disability, brain injury or trauma. |
| Other Eligible Requirements | ICF or SNF level of care, Medicaid recipient or eligible, physician's orders. |
| Attendant Profile | |
| Private Agencies | |
| Hourly Wage | na |
| Reimbursement to Agencies | $5.78 |
| Benefits | na |
| Program Services Available | |
| Personal Services | Bowel and bladder care, feeding, bathing/showering, dressing, menstrual care, respiration, ambulation, moving in and out of bed, oral hygiene and grooming, skin care, care and assistance with prosthesis, catheterization, injections, medications, range of motion, foot care. |
| Household Services | Light cleaning. |
| Communication Services | Getting assistance from agencies in the community, handling paperwork for paid helpers. |
| Transportation Services | None (services offered in separate Medicaid reimbursement program) |
| Short-Term Services | None |
| Medical Supervision Required for Some Services | Yes |
| Recipients Participate in Decisions r.e. Service Allocation | Yes |
| Services Available 7 days per week, 24 hours a day | Yes |
| Service Limits | Costs cannot exceed nursing home costs (ICF cap = $20,699, SNF cap = $26,904. |
| Average Weekly Hours Provided Per Consumer | na |
| Administrative Activities | Eligibility determination, case management, recipient outreach and training, provider referral and training. |
| Italic Type = 1985 Survey Data. Plain Type = 1988 Survey Data. | |
Personal Care Program
Department of Health and Mental Hygiene
300 West Preston, Room 206
Baltimore, MD 21201
(301) 225-1451
Program Implemented: 1981
| Fiscal or Calendar Year 1984 and/or 1988 Data | |
|---|---|
| Interviewee | Vicki Lessans, Chief, Personal Care Services Mark Leeds, Section Head, DHMH |
| Total Expenditures | $7,600,000 $4,000,000 |
| Medicaid Expenditures | $3,800,000 (50%) $1,964,000 (49%) |
| Other Expenditures | State $3,800,000 (50%) State $2,036,000 (51%) |
| Total Number of Clients Served | 4,000 1,468 |
| Total Hours of Service Provided | na |
| Cost Per Hour of Service | na |
| Provider Mode | Independent providers and private agency workers, independent providers only. |
| Entitlement Program | Yes |
| Independent Living Rating | Medium |
| Program Goals | To enable people to stay in their own home and community, to prevent institutionalization, to contain costs associated with long-term care. |
| Program Eligibility Requirements | |
| Maximum Client Assets | $2,500, excluding home, personal items in the home, care, burial insurance, life insurance. |
| Maximum Client Income | $4,300 $3,600, excluding impairment-related employment expenses, medical expenses, health insurance payments. |
| Type of Disabilities Eligible | All disabilities. |
| Age Groups Eligible | All |
| Other Requirements | Medicaid eligible, physician's order. |
| Number of Applicants Considered Ineligible | na |
| Attendant Profile | |
| Independent Providers | |
| Wage | $10, $20 or $25 per day $10 per day |
| Benefits | None |
| Attendant Requirements | Trained by RN, physically capable of doing the work. |
| Family Regulations | No relatives |
| Consumer Can Hire/Fire Attendant | Yes |
| Consumer Can Pay Attendant | No |
| Consumer Can Train Attendant | No |
| Private Agencies | |
| Wage | na |
| Benefits | na |
| Administrative Profile | |
| Administrative Agency | Department of Health and Mental Hygiene |
| Types and Quantity of Services Assessed By | Case manager (RN) |
| Factors for Assessment | Physician's recommendation, functional ability (ADLs), services needed. |
| Administrative Activities | Provider training. |
| Consumer Profile | |
| Age Ratio | 2% under 18, 33.4% 18-64, 21.3% 65-74, 43.3% 75 or over. |
| Sex Ratio | na |
| Ethnicity Ratio | na |
| Disabilities Served | All |
| Average Income | na |
| Income Source | na |
| Number Who Left Institutions Because of the Program | 30 |
| Number Who Could Leave Institutions If Program Were Expanded | 50 |
| Program Services Available | |
| Personal Services | Bowel and bladder care, feeding, bathing/showering, dressing, menstrual care, moving in and out of bed, oral hygiene and grooming, skin care, care and assistance with prosthesis, medication, range of motion, foot care. |
| Household Services | Light cleaning, laundry, shopping, meal preparation and clean up, meal planning. |
| Communication Services | None |
| Transportation Services | Medical escort only. |
| Short-Term Services | None |
| Medical Supervision Required for Some Services | Yes Every two months for all services. |
| Recipients Participate in Decisions r.e. Service Allocation | Yes |
| Services Available 7 days per week, 24 hours a day | Yes |
| Service Limits | None |
| Average Weekly Hours Provided Per Consumer | na 13 |
| Administrator Comments | |
| Program's Strong Points | "Maintains people in the community." |
| Program's Weak Points | "Lump sum payment system doesn't encourage optimum service delivery." |
| Program Changes Being Contemplated | "Make payment tied to hours of service delivery." |
| Changes Since 1984 | |
| Increased maximum income eligibility. Promulgated regulations to permit provider agencies as well as independent providers. Developed Surveillance and Utilization Review System (SURS). Improved management information system. | |
| Italic Type = 1985 Survey Data. Plain Type = 1988 Survey Data. | |
Independent Living Personal Care Program
Medicaid -- Department of Public Welfare
600 Washington Street, Room 740
Boston, MA 02111
(617) 348-5617
Program Implemented: 1977
| Fiscal or Calendar Year 1984 and/or 1988 Data | |
|---|---|
| Interviewee | Renee Cochin, Ambulatory Program Specialist Betsy Cohen, Senior Program Specialist Debby Pultman |
| Total Expenditures | $12,850,281 $5,655,354 |
| Medicaid Expenditures | $6,425,140 (50%) $2,827,677 (50%) |
| Other Expenditures | State $6,425,140 (50%) State $2,827,677 (50%) |
| Total Number of Clients Served | 1,518 584 |
| Total Hours of Service Provided | na 1,275,456 |
| Cost Per Hour of Service | na $4.43 |
| Provider Mode | Independent providers only |
| Entitlement Program | Yes |
| Independent Living Rating | High |
| Program Goals | To enable people to stay in their own home and community, to prevent institutionalization. "To provide severely physically disabled persons with medically necessary personal care services which will enable them to live independently in a noninstitutional community setting." |
| Program Eligibility Requirements | |
| Maximum Client Assets | na |
| Maximum Client Income | $10,668 na |
| Type of Disabilities Eligible | Physically disabled, DD. |
| Age Groups Eligible | All Over 18 |
| Other Requirements | Medicaid eligible, wheelchair user, able to manage own attendant, physician's orders, inability to use two or more limbs, "severely physically disabled". |
| Number of Applicants Considered Ineligible | na |
| Number of Applicants on Waiting List | na |
| Attendant Profile | |
| Independent Providers | |
| Hourly Wage | $2.00-$7.50 $5.30 |
| Benefits | None |
| Attendant Requirements | Trained by client/consumer |
| Family Regulations | No relatives |
| Consumer Can Hire/Fire Attendant | Yes |
| Consumer Can Pay Attendant | Yes |
| Consumer Can Train Attendant | Yes |
| Administrative Profile | |
| Administrative Agency | Massachusetts Department of Public Welfare |
| Types and Quantity of Services Assessed By | Independent Living Program |
| Factors for Assessment | Services needed. |
| Consumer Profile | |
| Age Ratio | na |
| Sex Ratio | na |
| Ethnicity Ratio | na |
| Disabilities Served | Physically disabled, DD. |
| Average Income | na |
| Income Source | na |
| Number Who Left Institutions Because of the Program | na |
| Number Who Could Leave Institutions If Program Were Expanded | na |
| Program Services Available | |
| Personal Services | Bowel and bladder care, feeding, bathing/showering, dressing, menstrual care, ambulation, moving in and out of bed, oral hygiene and grooming, skin care, respiration, care and assistance with prosthesis, catheterization, injections, medication, range of motion, foot care. |
| Household Services | Light cleaning, heavy cleaning, laundry, grocery shopping, other shopping, meal preparation and cleanup, chore services, taking care of children, paying bills, budgeting, planning meals. |
| Communication Services | Making telephone calls, writing letters, handling money or checks, getting assistance from agencies in the community, handling paperwork for paid helpers, interpreting, reading. |
| Transportation Services | Escort and driving for medical and nonmedical trips. |
| Short-Term Services | Emergency services. |
| Medical Supervision Required for Some Services | Yes For medical services. |
| Recipients Participate in Decisions r.e. Service Allocation | Yes |
| Services Available 7 days per week, 24 hours a day | Yes |
| Service Limits | None |
| Average Weekly Hours Provided Per Consumer | na 42 |
| Administrator Comments | |
| Program's Strong Points | "Offers disabled people the opportunity to live in the community." |
| Program's Weak Points | "Lack of regulations and standards by which providers (ILPs) could delivery services." |
| Program Changes Being Contemplated | "Developing regulations limiting maximum to 56 hours per week, developing regulations requiring prior authorization for medical skills training over 20 sessions, developing regulations so ILPs could be paid to train people in the transitional living program." |
| Changes Since 1984 | |
| Liberalized eligibility. | |
| Italic Type = 1985 Survey Data. Plain Type = 1988 Survey Data. | |
Medical Assistant Program
Massachusetts Commission for the Blind
110 Tremont Street
Boston, MA 02108
(617) 727-5550
Program Implemented: 1968
| Fiscal or Calendar Year 1984 Data This program became part of the Independent Living Personal Care Program soon after the 1985 Survey. | |
|---|---|
| Interviewee | Bob Takacs, Director of Medicaid, Massachusetts Commission for the Blind |
| Total Expenditures | Not available |
| Medicaid Expenditures | 80% of total budget |
| Other Expenditures | State 2% Title XX 10% Title VIIB 8% |
| Total Number of Clients Served | Approximately 500 |
| Total Hours of Service Provided | Not available |
| Cost Per Hour of Service | Not available |
| Provider Mode | Private agencies only |
| Independent Living Rating | Medium |
| Program Goals | To enable people to stay in their own home and community, to prevent institutionalization, to contain costs associated with long-term care, to allow people to work and still receive financial aid for attendant services. |
| Program Eligibility Requirements | |
| Maximum Client Assets | $2,000 Medicaid eligibility. |
| Maximum Client Income | Not available |
| Type of Disabilities Eligible | All disabilities |
| Age Groups Eligible | All |
| Other Requirements | At risk of institutionalization, able to manage own attendant, living alone, severely disabled, blind, physician's orders. |
| Number of Applicants Considered Ineligible | na |
| Number of Applicants on Waiting List | None |
| Attendant Profile | |
| Private Agencies | |
| Hourly Wage | $4.25-6.00 |
| Reimbursement to Agencies | $5.40-11.00 |
| Benefits | Vacation, sick leave, health insurance, worker's compensation, social security, unemployment compensation. |
| Attendant Requirements | Trained by client/consumer, home health aide, graduate of agency training program. |
| Who Hires/Fires Attendant | Consumer or agency. |
| Who Pays Attendant | Agency |
| Administrative Profile | |
| Administrative Agency | Massachusetts Commission for the Blind |
| Medical Supervision Required | Quarterly for Medicaid recipients. |
| Types and Quantity of Services Assessed By | Independent Living Program |
| Factors for Assessment | Physician's recommendation, functional abilities (ADLs), plan of care less costly than institutionalization, ICF eligible, services needed. |
| Consumer Profile | |
| Age Ratio | 5% under 18, 10% 18-64, 20% 65-74, 65% 75 or over |
| Sex Ratio | 30% male, 70% female |
| Ethnicity Ratio | 15% black, 5% Hispanic, 5% asian, 75% white. |
| Disabilities Served | All |
| Average Income | na |
| Income Source | 70% SSDI |
| Number Who Left Institutions Because of the Program | na |
| Number Who Could Leave Institutions If Program Were Expanded | na |
| Program Services Available | |
| Personal Services | Respiration, bowel and bladder care, feeding, bathing/showering, dressing, menstrual care, ambulation, moving in and out of bed, oral hygiene and grooming, skin care, care and assistance with prosthesis, catheterization, injections, medication, range of motion. |
| Household Services | Light cleaning, meal preparation. |
| Communication Services | Transportation, protective supervision, teaching and demonstration, telephone reassurance, readers, interpreters, for the deaf, home delivered meals, case management. |
| Short-Term Services | Available |
| Services Available 7 days per week, 24 hours a day | Yes |
| Service Limits | 35 hours per week |
| Average Weekly Hours Provided Per Consumer | 25 |
| Administrator Comments | |
| Program's Strong Points | "Individualized program, monitored closely in terms of payment, able to meet needs well." |
| Program's Weak Points | "Not able to compile data. Doesn't serve people non-medicaid eligibles." |
| Program Changes Being Contemplated | "Broadening definition of personal care attendant services under Medicaid, eg. domestic and communication services. Will apply for waiver." |
| Italic Type = 1985 Survey Data. Plain Type = 1988 Survey Data. | |
Home Health Program
Michigan Department of Social Services
Suite 710, Commerce Building
300 South Capitol
Lansing, MI 48909
(517) 373-8534
Program Implemented: 1971
| Fiscal or Calendar Year 1984 and/or 1988 Data | |
|---|---|
| Interviewee | Paula Clarke, Coordinator of Handicapped Services Ralph Young, Program Manager |
| Total Expenditures | $81,000,000 $63,000,000 |
| Medicaid Expenditures | $33,000,000 (41%) $27,720,000 (44%) |
| Other Expenditures | State $31,000,000 (38%) Title XX $14, 000,000 (17%) State $30,000,000 (39%) Title XX $13,000,000 (17%) |
| Total Number of Clients Served | 33,000 22,000 |
| Total Hours of Service Provided | na |
| Cost Per Hour of Service | na |
| Provider Mode | Independent providers only |
| Entitlement Program | "Officially it is not an entitlement program, but we tend to operate like one. We have never closed intake." |
| Independent Living Rating | High |
| Program Goals | To enable people to stay in their own home and community, to prevent institutionalization, to contain costs associated with long-term care, enhance independence. |
| Program Eligibility Requirements | |
| Maximum Client Assets | $1,500, excluding home, personal items in the home, car, burial insurance. |
| Maximum Client Income | $9,048 $8,280, excluding taxes, FICA, employment expenses. |
| Type of Disabilities Eligible | All |
| Age Groups Eligible | All |
| Other Requirements | Physician's orders, at risk of institutionalization. |
| Number of Applicants Considered Ineligible | na |
| Attendant Profile | |
| Independent Providers | |
| Hourly Wage | $3.35 |
| Benefits | Social security, "negotiated with client". |
| Attendant Requirements | Consumer requests an individual provider, consumer capable of supervising attendant, attendant must be 18 or older. |
| Family Regulations | No legally responsible relatives; unless they are prevented from working outside the home because no one else is available and capable. |
| Consumer Can Hire/Fire Attendant | Yes |
| Consumer Can Pay Attendant | Yes |
| Consumer Can Train Attendant | Yes |
| Administrative Profile | |
| Administrative Agency | Michigan Department of Social Services |
| Types and Quantity of Services Assessed By | Agency social worker. |
| Factors for Assessment | Physician's recommendation, functional abilities (ADLs), accessibility of environment, plan of care less costly than institutionalization, services needed. |
| Administrative Activities | Eligibility determination, needs assessment, provider recruitment, referral, training and supervision, recipient outreach, case management. |
| Consumer Profile | |
| Age Ratio | 27% under 18, 28% 18-64, 22% 65-74, 23% 75 or over |
| Sex Ratio | 28% male, 72% female |
| Ethnicity Ratio | na |
| Disabilities Served | All |
| Average Income | $3,948 |
| Income Source | 68% SSI, 32% other |
| Program Services Available | |
| Personal Services | Bowel and bladder care, feeding, bathing/showering, dressing, menstrual care, ambulation, moving in and out of bed, oral hygiene and grooming, skin care, care and assistance with prosthesis, "catheterization if directed by client", range of motion. "Other services are covered in some situations or by Home Health Services complimenting our services". |
| Household Services | Light cleaning, heavy cleaning, laundry, shopping, meal preparation and cleanup, chore services, minor repairs, "taking care of children is part of chore services", "scheduling household tasks and deciding who will do them is the role of client", "paying bills, budgeting, planning meals, making grocery and other shopping lists, are done only if under the direction of the client", maintenance, renovation, yard work, snow removal, guide dog maintenance. |
| Communication Services | "Interpreting for people who are deaf is a separate service outside of adult home help and paid from administrative funds". |
| Transportation Services | Non-medical escort and driving. |
| Short-Term Services | "Not a separate service yet." |
| Medical Supervision Required for Some Services | "Paper review by RN of service plan, and RN certification of need of service". |
| Recipients Participate in Decisions r.e. Service Allocation | Yes |
| Services Available 7 days per week, 24 hours a day | "If providers are willing to do it (usually very rare)". |
| Service Limits | $333 per month $305 |
| Average Weekly Hours Provided Per Consumer | 17 na |
| Administrator Comments | |
| Program's Strong Points | "Client-directed. Cost effective. Only statewide available resource for independent living. Delays institutionalization. Available to anyone -- DD, MR, etc. Serves children of disabled parents." |
| Program's Weak Points | "Only provides personal care, not equipment which could alleviate dependency on human energy. Maximum allowance is too small. No strong framework for entire program. Caseworkers being cut; need more supportive services. Self employed must submit FICA." |
| Program Changes Being Contemplated | "Increase capability to serve more clients." |
| Changes Since 1984 | |
| Increased maximum income eligibility figure. Added an exception procedure at the local level that allows payments over the maximum if need is documented. Make greater use of centers for independent living to train clients how to hire and supervise aides (the state pays CILs for this service). Independent case management. Piloting some pre-admission screening projects with office of Service to the Aging. "We have developed some new management reports we hope to have ready in a few years." | |
| Italic Type = 1985 Survey Data. Plain Type = 1988 Survey Data. | |
Medical Assistance and Personal Care Assistance Program
Department of Human Services, Long-Term Care Management Division
Space Center, 444 Lafayette Road
St. Paul, MN 55155-3844
(612) 296-1551
Program Implemented: 1977
| Fiscal or Calendar Year 1984 and/or 1987 Data | |
|---|---|
| Interviewee | Lynda Adams, Personal Care Policy Coordinator Rosemary Wilder, Administrative Assistant Ron Hook, Administrator |
| Total Expenditures | $8,904,074 $5,292,000 |
| Medicaid Expenditures | $4,755,666 (53%) $2,688,336 (51%) |
| Other Expenditures | State $3,672,930 (41%) County $47,548 (5%) State $2,344,356 (44%) County $259,308 (5%) |
| Total Number of Clients Served | 1,787 11,951 |
| Total Hours of Service Provided | 3,188,008 na |
| Cost Per Hour of Service | $2.79 na |
| Provider Mode | Independent providers only |
| Entitlement Program | Yes |
| Independent Living Rating | Medium |
| Program Goals | To enable people to stay in their own home and community, to contain costs associated with long-term care. |
| Program Eligibility Requirements | |
| Maximum Client Assets | $3,000, excluding home, personal items in the home, car. |
| Maximum Client Income | $4,824 $4,128 excluding taxes, FICA, employment expenses, day care costs, medical expenses, health insurance payments. |
| Type of Disabilities Eligible | All |
| Age Groups Eligible | Over 18 All |
| Other Requirements | Medicaid or AFDC eligible, able to manage own attendant, physician's orders. |
| Number of Applicants Considered Ineligible | na |
| Attendant Profile | |
| Independent Providers | |
| Hourly Wage | $6.34 $5.67 |
| Benefits | Worker's compensation, unemployment compensation. |
| Attendant Requirements | Consumer requests an individual provider, attendant must be 18 or older, trained by consumer, graduate of agency training program. |
| Family Regulations | No relatives. |
| Consumer Can Hire/Fire Attendant | Yes |
| Consumer Can Pay Attendant | No |
| Consumer Can Train Attendant | Yes |
| Administrative Profile | |
| Administrative Agency | Department of Human Services |
| Types and Quantity of Services Assessed By | Program director |
| Factors for Assessment | Physician's recommendation, functional abilities (ADLs), plan of care less costly than institutionalization, services needed. |
| Administrative Activities | Eligibility determination. |
| Consumer Profile | |
| Age Ratio | 43% under 18, 27.5% 18-64, 14.75% 65-74, 14.75% 75 or over |
| Sex Ratio | 31% male, 69% female |
| Ethnicity Ratio | 6% black, 1% Hispanic, 3% native American, 12% asian, 62% white |
| Disabilities Served | Physical disability, brain injury. |
| Average Income | na |
| Income Source | na |
| Number Who Left Institutions Because of the Program | na |
| Number Who Could Leave Institutions If Program Were Expanded | na |
| Program Services Available | |
| Personal Services | Respiration, bowel and bladder care, feeding, bathing/showering, dressing, menstrual care, ambulation, moving in and out of bed, oral hygiene and grooming, skin care, care and assistance with prosthesis, catheterization, medication, range of motion, foot care, home dialysis. |
| Household Services | Light cleaning, meal preparation and clean-up, chore services. |
| Communication Services | None |
| Transportation Services | Escort and driving, medical trips only. |
| Short-Term Services | None |
| Medical Supervision Required for Some Services | Yes |
| Recipients Participate in Decisions r.e. Service Allocation | Yes |
| Services Available 7 days per week, 24 hours a day | Yes |
| Service Limits | 46 hours per week, $1,268 per month 50 hours per week, $1,134 per month |
| Average Weekly Hours Provided Per Consumer | 34 na |
| Administrator Comments | |
| None | |
| Changes Since 1984 | |
| Increased maximum income eligibility figure. | |
| Italic Type = 1985 Survey Data. Plain Type = 1988 Survey Data. | |
In-Home Service Program
Department of Social Services, Division of Aging
2701 West Main
Jefferson City, MO 65102
(314) 751-3082
Program Implemented: 1982
| Fiscal or Calendar Year 1984 and/or 1988 Data The 1989 survey data includes two other programs, a Title XX and a Title III program, which were reported separately in 1985. | |
|---|---|
| Interviewee | Elaine Reiter, Alternative Services Administrator Fordyce Mitchell, Assistant Medicaid Administrator |
| Total Expenditures | $26,114,000 $9,190,631 |
| Medicaid Expenditures | $6,660,000 (26%) $5,514,397 (60%) |
| Other Expenditures | State $12,320,000 (47%) Title XIX $2,599,000 (10%) Title XX $3,535,000 (14%) Title III $1,000,000 (4%) State $3,676,253 (40%) |
| Total Number of Clients Served | 22,000 8,240 |
| Total Hours of Service Provided | 3,550,000 total -- 1,900,000 (personal services) 1,650,000 (household services) 756,780 |
| Cost Per Hour of Service | $7.36 $12.14 |
| Provider Mode | Private agencies only |
| Entitlement Program | No (5,000 people on waiting list) |
| Independent Living Rating | Low |
| Program Goals | To enable people to stay in their own home and community, to prevent institutionalization, to contain costs associated with long-term care. |
| Program Eligibility Requirements | |
| Maximum Client Assets | na |
| Maximum Client Income | na |
| Type of Disabilities Eligible | All disabilities |
| Age Groups Eligible | All |
| Other Requirements | Medicaid eligible, physician's orders, at risk of institutionalization. |
| Number of Applicants Considered Ineligible | na |
| Attendant Profile | |
| Private Agencies | |
| Hourly Wage | $3.35-$5.50 |
| Reimbursement to Agencies | $6.90 |
| Benefits | na |
| Attendant Requirements | Home health aide, graduate of training program. |
| Administrative Profile | |
| Administrative Agency | Department of Social Services |
| Types and Quantity of Services Assessed By | Nurse consultants |
| Factors for Assessment | Functional abilities (ADLs), services needed, plan of treatment less costly than institutionalization. |
| Administrative Activities | Eligibility determination, needs assessment, recipient outreach, case management. |
| Consumer Profile | |
| Age Ratio | na |
| Sex Ratio | 20% male, 80% female |
| Ethnicity Ratio | 23% black, 77% white |
| Disabilities Served | All |
| Average Income | na |
| Income Source | 62% SSI |
| Number Who Left Institutions Because of the Program | na |
| Number Who Could Leave Institutions If Program Were Expanded | na |
| Program Services Available | |
| Personal Services | Bowel and bladder care, feeding, bathing/showering, dressing menstrual care, moving in and out of bed, oral hygiene and grooming, skin care, insulin injections, medication, foot care (non-diabetic). |
| Household Services | Light and heavy cleaning, laundry, grocery and other shopping, chore services, meal planning, preparation and clean-up. |
| Communication Services | Writing letters. |
| Transportation Services | None |
| Short-Term Services | Emergency and relief services. |
| Medical Supervision Required for Some Services | Yes |
| Recipients Participate in Decisions r.e. Service Allocation | Yes |
| Services Available 7 days per week, 24 hours a day | No |
| Service Limits | 28 hours per week or $985 per month 19 hours per week |
| Average Weekly Hours Provided Per Consumer | 5-8 3.7 |
| Administrator Comments | |
| Program's Strong Points | "We're serving a lot of people after only three years of operation; so it is a popular and presumably needed service. We have cleaned up policy manuals, billing procedures, assessment process, and automated authorization and payment system, so we can handle rudimentary functions to most people. We also have good case management and problem resolution capacity". |
| Program's Weak Points | "Targeting 'the truly needy' population and avoiding becoming an alternative funding source for SSBG funding shortfalls. Much more physician awareness is needed. We need to broaden our scope of services and remove the gaps into which folks are always falling". |
| Program Changes Being Contemplated | "Enhanced automated tracking system. Improved assessment tool. Increase nurse and physician input. Coordinated home health and other alterative programs. Increase scope of target populations to include MR/DD and possibly MI". |
| Changes Since 1984 | |
| Created minimum disability level. Added assessment tool to uniform assessment process. Formalized client grievance mechanisms. Improved management information system. | |
| Italic Type = 1985 Survey Data. Plain Type = 1988 Survey Data. | |
Medicaid Personal Care Services Program
Department of Social and Rehabilitation Services
P.O. Box 4210
Helena, MT 59604
(406) 444-4540
Program Implemented: 1977
| Fiscal or Calendar Year 1984 and/or 1988 Data | |
|---|---|
| Interviewee | Nancy Ellery, Administrative Officer Joyce DeCunzo, Program Officer II |
| Total Expenditures | $2,361,982 $400,000 |
| Medicaid Expenditures | $1,017,714 (43%) $260,000 (65%) |
| Other Expenditures | State $775,202 (33%) Medicaid Waiver $569,066 (24%) State $140,000 (35%) |
| Total Number of Clients Served | 736 na |
| Total Hours of Service Provided | 450,283 103,893 |
| Cost Per Hour of Service | $5.25 $3.85 |
| Provider Mode | Statewide agency, private agencies and independent providers. |
| Entitlement Program | Yes |
| Independent Living Rating | Medium |
| Program Goals | To prevent institutionalization, to enable people to stay in their own home and community, to contain costs associated with long-term care. |
| Program Eligibility Requirements | |
| Maximum Client Assets | na |
| Maximum Client Income | SSI Income Limit unless medically needy, $4,416 $3,900 |
| Type of Disabilities Eligible | All |
| Age Groups Eligible | All |
| Other Requirements | Medicaid, SSI or SSDI eligible, physician's orders. |
| Number of Applicants Considered Ineligible | na |
| Attendant Profile | |
| Independent Providers | |
| Hourly Wage | $3.85 |
| Benefits | Worker's compensation, unemployment compensation. |
| Attendant Requirements | Attendant must be 18 or older, graduate of state agency program. |
| Family Regulations | No relatives allowed who are closer than nephew, niece or cousin. |
| Private Agencies | |
| Hourly Wage | $4.65 |
| Reimbursement to Agencies | na |
| Benefits | Optional health insurance, worker's compensation, social security, unemployment compensation, transportation costs, vacation pay, sick leave, health insurance. |
| Administrative Profile | |
| Administrative Agency | Department of Social and Rehabilitation Services |
| Types and Quantity of Services Assessed By | RN and attending physician. |
| Factors for Assessment | Physician's recommendation, functional abilities (ADLs), accessibility of environment, plan of care less costly than institutionalization, services needed. |
| Administrative Activities | (23% of budget) eligibility determination, needs assessment, provider recruitment, supervision, training and referral, recipient outreach, training and supervision, case management. |
| Consumer Profile | |
| Age Ratio | na |
| Sex Ratio | na |
| Ethnicity Ratio | 98% white, 2% native American |
| Disabilities Served | All |
| Average Income | $3,900 |
| Income Source | na |
| Number Who Left Institutions Because of the Program | na |
| Number Who Could Leave Institutions If Program Were Expanded | na |
| Program Services Available | |
| Personal Services | Feeding, bathing/showering, dressing, menstrual care, ambulation, moving in and out of bed, oral hygiene and grooming, skin care, self-administered medication, range of motion, care and assistance with prosthesis, menstrual care. |
| Household Services | Light cleaning, laundry, grocery shopping, meal preparation and cleanup, meal planning, making grocery or other shopping lists, paying bills, budgeting. |
| Communication Services | None |
| Transportation Services | Medically related transportation and escort (non-medical escort and driving for Waiver recipients only). |
| Short-Term Services | None |
| Medical Supervision Required for Some Services | Yes |
| Recipients Participate in Decisions r.e. Service Allocation | Yes |
| Services Available 7 days per week, 24 hours a day | Yes |
| Service Limits | 40 hours per week (prior authorization from state is required for exceptions to this limit). 67 hours per week, $13,416 per year (80% of nursing home cost). |
| Average Weekly Hours Provided Per Consumer | 12 na |
| Administrator Comments | |
| Program's Strong Points | "Many people would be in a nursing home without these services -- it provides choice for client." |
| Program's Weak Points | "Payment base is too low to be competitive, people aren't committed. Quality of care is low. To improve quality, we must increase wages, but that will decrease quantity." |
| Program Changes Being Contemplated | "Change from self-employed to contract." |
| Changes Since 1984 | |
| Developed functional ability assessment tool. Increased maximum income eligibility figure. Instituted statewide uniform assessment process. Changed from individual providers to agency providers. Established consumer board. Formalized grievance mechanisms. Annual program and financial audits of contract agency. On site review of provider performance based on service standards. One statewide agency, regional coordinators. Competitive agency provider selection based on quality (not lowest bid). Improved management information system. | |
| Italic Type = 1985 Survey Data. Plain Type = 1988 Survey Data. | |
Title XIX Personal Care Aide
Department of Social Services
P.O. Box 95026
Lincoln, NE 68509
(402) 471-9360
Program Implemented: 1965
| Fiscal or Calendar Year 1984 and/or 1988 Data | |
|---|---|
| Interviewee | Nancy Olson, Unit Manager |
| Total Expenditures | $1,427,497 $750,000 |
| Medicaid Expenditures | $885,048 (62%) $427,400 (57%) |
| Other Expenditures | State $542,449 (38%) State $322,600 (43%) |
| Total Number of Clients Served | 515 155 |
| Total Hours of Service Provided | na 234,549 |
| Cost Per Hour of Service | $3.35-3.70 $3.20 |
| Provider Mode | Independent providers, private agencies and independent providers. |
| Entitlement Program | Yes |
| Independent Living Rating | Medium |
| Program Goals | To enable people to stay in their own home and community, to prevent institutionalization, to contain costs associated with long-term care. |
| Program Eligibility Requirements | |
| Maximum Client Assets | na |
| Maximum Client Income | $5,100 |
| Type of Disabilities Eligible | All |
| Age Groups Eligible | All |
| Other Requirements | Medicaid eligible, physician's orders. |
| Attendant Profile | |
| Independent Providers | |
| Hourly Wage | $3.35-3.70 $3.35 |
| Benefits | Social security, none. |
| Attendant Requirements | Attendant must be 18 or older, certified by local officer, services must be provided in the home, trained by client/consumer. |
| Family Regulations | No relatives allowed. |
| Consumer Can Hire/Fire Attendant | Yes |
| Consumer Can Pay Attendant | No |
| Consumer Can Train Attendant | Yes |
| Private Agencies | |
| Hourly Wage | na |
| Reimbursement to Agencies | $6.50 |
| Benefits | na |
| Attendant Requirements | Home health aide |
| Who Hires/Fires Attendant | Consumer or agency |
| Who Pays Attendant | Agency |
| Administrative Profile | |
| Administrative Agency | Department of Social Services |
| Types and Quantity of Services Assessed By | Local office workers |
| Factors for Assessment | Physician's recommendation, functional abilities (ADLs), services needed. |
| Administrative Activities | Eligibility determination, needs assessment, provider recruitment, referral, training and supervision, case management. |
| Consumer Profile | |
| Age Ratio | na |
| Sex Ratio | na |
| Ethnicity Ratio | na |
| Disabilities Served | All |
| Average Income | na |
| Income Source | na |
| Number Who Left Institutions Because of the Program | na |
| Number Who Could Leave Institutions If Program Were Expanded | na |
| Program Services Available | |
| Personal Services | Bowel and bladder care (limited), feeding, bathing/showering, dressing, menstrual care, ambulation, moving in and out of bed, oral hygiene and grooming, skin care, range of motion, non-diabetic foot care, care and assistance with prosthesis. |
| Household Services | Very limited, may include light cleaning, laundry, grocery shopping, running errands and other shopping, meal preparation and clean-up, meal planning, making grocery and other shopping lists. |
| Communication Services | Very limited, may include: making telephone calls, interpreting, reading. |
| Transportation Services | Escort and driving, medical trips only. |
| Short-Term Services | Emergency and respite. None |
| Medical Supervision Required for Some Services | Yes None required |
| Recipients Participate in Decisions r.e. Service Allocation | Yes |
| Services Available 7 days per week, 24 hours a day | Yes |
| Service Limits | 40 hours per week |
| Average Weekly Hours Provided Per Consumer | na 31 hours |
| Administrator Comments | |
| Program's Strong Points | "Enabling people to remain at home and avoid institutional care." |
| Program's Weak Points | "Lack of quality care." |
| Program Changes Being Contemplated | "Contracting services to improve care. New legislation requires agencies to be licensed." |
| Changes Since 1984 | |
| None listed. | |
| Italic Type = 1985 Survey Data. Plain Type = 1988 Survey Data. | |
Nevada Medicaid
Department of Welfare
2527 North Carson Street
Carson City, NV 89710
(702) 885-4694
Program Implemented: 1967
| Fiscal or Calendar Year 1984 and/or 1988 Data | |
|---|---|
| Interviewee | Karen Allen, Medical Service Specialist Diane Hooley, Medical Service Specialist |
| Total Expenditures | $1,020,000 $509,713 |
| Medicaid Expenditures | $510,000 (50%) $254,857 (50%) |
| Other Expenditures | State $510,000 (50%) State $254,857 (50%) |
| Total Number of Clients Served | 300 243 |
| Total Hours of Service Provided | na |
| Cost Per Hour of Service | na |
| Provider Mode | Independent providers |
| Entitlement Program | Yes |
| Independent Living Rating | Low |
| Program Goals | To enable people to stay in their own home and community, to prevent institutionalization, to contain costs associated with long-term care. |
| Program Eligibility Requirements | |
| Maximum Client Assets | $1,600, excluding home, personal items in the home, care (up to $4,500), burial insurance ($1,500), life insurance ($1,500). |
| Maximum Client Income | na |
| Type of Disabilities Eligible | All |
| Age Groups Eligible | All |
| Other Requirements | Medicaid eligibility, physician's orders, ADLs. |
| Number of Applicants Considered Ineligible | na |
| Attendant Profile | |
| Independent Providers | |
| Hourly Wage | $5.50-7.50 $5.10-6.60 |
| Benefits | None |
| Attendant Requirements | Attendant must be 18 or older, "experience and/or training of some sort required". |
| Family Regulations | No relatives allowed. |
| Consumer Can Hire/Fire Attendant | No |
| Consumer Can Pay Attendant | No |
| Consumer Can Train Attendant | No |
| Administrative Profile | |
| Administrative Agency | Department of Human Resources |
| Types and Quantity of Services Assessed By | RNs (in urban areas), social workers (in rural areas). |
| Factors for Assessment | Physician's recommendation, functional abilities (ADLs), accessibility of environment, plan of care less costly than institutionalization, services needed. |
| Administrative Activities | Eligibility determination, needs assessment, case management, provider recruitment, referral and training. |
| Consumer Profile | |
| Age Ratio | 5% under 18, 15% 18-64, 20% 65-74, 60% 75 and older. |
| Sex Ratio | 30% male, 70% female. |
| Ethnicity Ratio | 10% black, 7% hispanic, 1% native-american, 1% asian, 81% white. |
| Disabilities Served | All |
| Average Income | na |
| Income Source | na |
| Number Who Left Institutions Because of the Program | 146 |
| Number Who Could Leave Institutions If Program Were Expanded | 30% of nursing home population. |
| Program Services Available | |
| Personal Services | Bowel and bladder care (limited), feeding, bathing, dressing, menstrual care, ambulation, moving in and out of bed, oral hygiene and grooming, skin care, care and assistance with prosthesis (limited), range of motion (limited), foot care (limited), catheterization, injections, medication. |
| Household Services | Meal preparation and clean-up, meal planning, making grocery and other shopping lists, light cleaning, laundry. |
| Communication Services | Handling paperwork for paid helpers, handling money or checks (limited). |
| Transportation Services | Escort, medical trips only. |
| Short-Term Services | None |
| Medical Supervision Required for Some Services | yes Quarterly for all services. |
| Recipients Participate in Decisions r.e. Service Allocation | Yes |
| Services Available 7 days per week, 24 hours a day | No |
| Service Limits | ICF or SNF costs $1700 per month |
| Average Weekly Hours Provided Per Consumer | na 10 |
| Administrator Comments | |
| Program's Strong Points | "Enabling people to remain at home, cost effective, higher quality of life." |
| Program's Weak Points | "Not extensive enough to meet needs (i.e. clients requiring night time care), lack of coordination with other community support services." |
| Program Changes Being Contemplated | "Expanding hours, centralizing case management." |
| Changes Since 1984 | |
| None listed. | |
| Italic Type = 1985 Survey Data. Plain Type = 1988 Survey Data. | |
Personal Care Attendant Service
Division of Human Services
Office of Medical Services, Hagen Drive
Concord, NH 03301-6521
(603) 271-4365
Program Implemented: 1979
| Fiscal or Calendar Year 1984 and/or 1988 Data | |
|---|---|
| Interviewee | Diane Kemp, Program Specialist |
| Total Expenditures | $890,613 $303,662 |
| Medicaid Expenditures | $445,306 $179,161 (59%) |
| Other Expenditures | State $445,306 State $124,501 (41%) |
| Total Number of Clients Served | 55 33 |
| Total Hours of Service Provided (83-84) | na 40,770 |
| Cost Per Hour of Service | na $7.59 |
| Provider Mode | Independent providers |
| Entitlement Program | Yes |
| Independent Living Rating | Low |
| Program Goals | To enable people to stay in their own home and community, to prevent institutionalization. |
| Program Eligibility Requirements | |
| Maximum Client Assets | $2500, excluding home, personal items in the home, care, burial insurance, life insurance. "Please be advised that this is a small portion of determining resource eligibility." |
| Maximum Client Income | na $4068 |
| Type of Disabilities Eligible | Physical disability, brain injury. |
| Age Groups Eligible | Over 18 All |
| Other Requirements | Medicaid eligible, physician's orders, wheelchair user. |
| Number of Applicants Considered Ineligible | na |
| Attendant Profile | |
| Independent Providers | |
| Hourly Wage | $6.25-7.25 (a flat rate of $10.50 is paid to the Granite State Living Foundation who in turn pays the individual providres $8.25 |
| Benefits | Worker's compensation, social security, unemployment compensation. |
| Attendant Requirements | na |
| Family Regulations | No relatives |
| Consumer Can Hire/Fire Attendant | Yes |
| Consumer Can Pay Attendant | No |
| Consumer Can Train Attendant | Yes |
| Administrative Profile | |
| Administrative Agency | Division of Human Services |
| Types and Quantity of Services Assessed By | Private agency |
| Factors for Assessment | Physician's recommendation. |
| Administrative Activities | Eligibility determination, needs assessment, recipient outreach and training, provider supervision, case management. |
| Consumer Profile | |
| Age Ratio | na |
| Sex Ratio | na |
| Ethnicity Ratio | na |
| Disabilities Served | Physically disabled, brain injury. |
| Average Income | na |
| Income Source | na |
| Number Who Left Institutions Because of the Program | na |
| Number Who Could Leave Institutions If Program Were Expanded | na |
| Program Services Available | |
| Personal Services | Bowel and bladder care, feeding, bathing, dressing, ambulation, moving in and out of bed, grooming and oral hygiene, menstrual care, care and assistance with prosthesis, range of motion, foot care, skin, medication, catheterization. |
| Household Services | Light cleaning, laundry, shopping, meal preparation and cleanup. |
| Communication Services | None |
| Transportation Services | None |
| Short-Term Services | None |
| Medical Supervision Required for Some Services | No Required for all services. |
| Recipients Participate in Decisions r.e. Service Allocation | Yes |
| Services Available 7 days per week, 24 hours a day | Yes |
| Service Limits | "No cap as yet." |
| Average Weekly Hours Provided Per Consumer | na |
| Administrator Comments | |
| Program's Strong Points | "Reduces dependency and allows people to live in the community." |
| Changes Since 1984 | |
| Increased maximum income eligibility figure. Increased rate of reimbursement for PCAs. | |
| Italic Type = 1985 Survey Data. Plain Type = 1988 Survey Data. | |
Personal Care Assistant Program
New Jersey Division of Medical Assistance and Health Services
CN 712
Trenton, NJ 08625
(609) 588-2620
Program Implemented: 1984
| Fiscal or Calendar Year 1984 and/or 1988 Data | |
|---|---|
| Interviewee | Katie Hammer, Assistant Administrator Carol Kurland, Administrator, Office of Homecare Programs |
| Total Expenditures | $7,460,378 $1,502,192 |
| Medicaid Expenditures | $3,730,189 (50%) $751,095 (50%) |
| Other Expenditures | State $3,730,189 (50%) State $751,095 (50%) |
| Total Number of Clients Served | na |
| Total Hours of Service Provided | na |
| Cost Per Hour of Service | na |
| Provider Mode | Private agencies only. |
| Entitlement Program | Yes |
| Independent Living Rating | Low |
| Program Goals | To prevent institutionalization, to enable people to stay in their own home and community, to contain costs associated with long-term care. |
| Program Eligibility Requirements | |
| Maximum Client Assets | $1600 |
| Maximum Client Income | $13,248 na |
| Type of Disabilities Eligible | na |
| Age Groups Eligible | All |
| Other Requirements | Medicaid or SSI eligible, physician's orders, family unable or unwilling to do attendant care. |
| Number of Applicants Considered Ineligible | na |
| Attendant Profile | |
| Private Agencies | |
| Hourly Wage | $11.00-14.00 $8.30 |
| Reimbursement to Agencies | na |
| Benefits | Varies depending on agency. |
| Attendant Requirements | Home health aide, graduate of training program. |
| Who Hires/Fires Attendant | Agency |
| Who Pays Attendant | Agency |
| Administrative Profile | |
| Administrative Agency | Division of Medical Assistance and Health Services |
| Types and Quantity of Services Assessed By | State Medicaid/mental health staff |
| Factors for Assessment | Physician's recommendation, functional abilities (ADLs), accessibility of environment, plan of care less costly than institutionalization, services needed. |
| Administrative Activities | Eligibility determination, provider recruitment, referral and training, quality assurance monitoring. |
| Consumer Profile | |
| Age Ratio | na |
| Sex Ratio | na |
| Ethnicity Ratio | na |
| Disabilities Served | na |
| Average Income | na |
| Income Source | na |
| Number Who Left Institutions Because of the Program | na |
| Number Who Could Leave Institutions If Program Were Expanded | na |
| Program Services Available | |
| Personal Services | Bowel and bladder care, feeding, bathing/showering, dressing, ambulation, moving in and out of bed, oral hygiene and grooming, skin care, menstrual care, respiration, medications, range of motion, foot care, care and assistance with prosthesis. |
| Household Services | Light cleaning, laundry, grocery shopping, meal preparation, planning and cleanup, paying bills, budgeting. |
| Communication Services | Making telephone calls, writing letters, interpreting, reading. |
| Transportation Services | Escort, medical trips only, and driving. |
| Short-Term Services | Respite services. |
| Medical Supervision Required for Some Services | Yes Every two months for all services. |
| Recipients Participate in Decisions r.e. Service Allocation | Yes |
| Services Available 7 days per week, 24 hours a day | Varies Depends on provider. |
| Service Limits | 25 hours per week. |
| Average Weekly Hours Provided Per Consumer | na |
| Administrator Comments | |
| Program Changes Being Contemplated | "Changes have been made in the last year to increase coverage, raise maximum weekly hours from 20 to 25, raise per hour rate by 3.9%, allow for a nursing reassessment visit, require accreditation for all participating home care agencies." |
| Changes Since 1984 | |
| Increased income eligibility figure. Increased hours from 20 to 25. External quality assurance accreditation system. | |
| Italic Type = 1985 Survey Data. Plain Type = 1988 Survey Data. | |
Personal Care Services
Department of Social Services
40 North Pearl
Albany, NY 12243
(518) 474-9451
Program Implemented: 1973
| Fiscal or Calendar Year 1984 and/or 1988 Data | |
|---|---|
| Interviewee | Ann Hallock, Director of Home Care |
| Total Expenditures | $1,179,830,000 $458,199,577 |
| Medicaid Expenditures | $589,915,000 (50%) $229,099,789 (50%) |
| Other Expenditures | State $471,932,000 (40%) District or Borough $117,983,000 (10%) State $160,369,852 (35%) District or Borough $68,729,937 (15%) |
| Total Number of Clients Served | 79,198 52,400 |
| Total Hours of Service Provided | 130,000,000 71,394,566 |
| Cost Per Hour of Service | $9.08 $6.42 |
| Provider Mode | Private agencies (over 98% of providers), less than 1% government workers and independent providers. |
| Entitlement Program | Yes |
| Independent Living Rating | Medium |
| Program Goals | To enable people to stay in their own home and community, to prevent institutionalization, to contain costs associated with long-term care, to maximize independence. |
| Program Eligibility Requirements | |
| Maximum Client Assets | $2850, excluding home, personal items in the home, car, burial insurance, life insurance. |
| Maximum Client Income | $5700 $4700, excluding taxes, FICA, employment expenses, day care costs, medical expenses, health insurance payments, any other impairment-related expenses. |
| Type of Disabilities Eligible | All |
| Age Groups Eligible | All |
| Other Requirements | Medicaid eligible, physician's orders. |
| Number of Applicants Considered Ineligible | na |
| Attendant Profile | |
| Independent Providers | |
| Hourly Wage | $3.35 |
| Benefits | Worker's compensation, social security, unemployment compensation. |
| Attendant Requirements | Consumer requests an individual provider, consumer capable to supervise attendant, consumer trains attendant, attendant must be 18 or older, attendant must pass skills and competency test, attendant must receive some kind of training. |
| Family Regulations | No spouse, parent, child or in-law, but other relatives OK if not residing in the same home (unless in-home care is required). |
| Consumer Can Pay Attendant | In NYC - 10% direct pay cases (district issues two-party checks). |
| Private Agencies | |
| Hourly Wage | $4.77-5.24 $3.35-435 |
| Reimbursement to Agencies | $6.50-7.50 |
| Benefits | Varies depending on agency. |
| Attendant Requirements | Certificate of skill and competency, graduate of training program. |
| Who Hires/Fires Attendant | Consumer or agency. |
| Who Pays Attendant | Agency |
| Government Agency | |
| Hourly Wage | na |
| Benefits | Vacation pay, sick leave, health insurance, worker's compensation, social security, unemployment compensation, transportation costs, retirement/ personal leave. |
| Attendant Requirements | Graduate of training program. |
| Who Hires/Fires Attendant | Government agency |
| Who Pays Attendant | Government agency |
| Administrative Profile | |
| Administrative Agency | Department of Social Services |
| Types and Quantity of Services Assessed By | Local social service district or local medical director. |
| Factors for Assessment | Physician's recommendation, functional abilities (ADLs), accessibility of environment, services needed, assessment protocol. |
| Consumer Profile | |
| Age Ratio | In NYC - 1% under 18, 20% 18-64, 22% 65-74, 57% 75 or over. In Upstate NY - 2% under 18, 21% 18-64, 17% 65-74, 60% 75 or over. |
| Sex Ratio | In NYC - 19% male, 81% female. In Upstate NY - 16% male, 84% female. |
| Ethnicity Ratio | na |
| Disabilities Served | All |
| Average Income | na |
| Income Source | na |
| Number Who Left Institutions Because of the Program | na |
| Number Who Could Leave Institutions If Program Were Expanded | na |
| Program Services Available | |
| Personal Services | Respiration (no suctioning), bowel and bladder care (no irrigation), feeding, bathing/showering, dressing, ambulation, menstrual care, moving in and out of bed, oral hygiene and grooming, skin care, care and assistance with prosthesis, range of motion, medication. |
| Household Services | Light cleaning, heavy cleaning, laundry, grocery and other shopping, meal preparation, planning and cleanup, chore services, paying bills, budgeting. |
| Communication Services | Making telephone calls, writing letters, interpreting, reading. |
| Transportation Services | Medical and non-medical escort. |
| Short-Term Services | Emergency and respite services available. |
| Medical Supervision Required for Some Services | Yes Quarterly or yearly assessment for all services. |
| Recipients Participate in Decisions r.e. Service Allocation | Yes |
| Services Available 7 days per week, 24 hours a day | Yes |
| Service Limits | No maximum. |
| Average Weekly Hours Provided Per Consumer | na In NYC - 53 In Upstate NY - 36 |
| Administrator Comments | |
| Program's Strong Points | "Flexibility in terms of putting together a package which meets individual clients' needs. Cost effective. Humane; tried to insure that client is involved in plan of care. Family receives written notice of services. There is a fair hearing process." |
| Program's Weak Points | "Local social service departments can make some independent decisions -- impacts ability to plan. People who aren't on Medicaid can't get service. Problems with discharge planning -- home care isn't always the first option and people are institutionalized who don't need to be. Local districts sometimes are too tough on clients." |
| Program Changes Being Contemplated | "Going to an automated payment system; vendors will bill system by code so data will be available. Improved assessment tools (not so medically oriented)." |
| Changes Since 1984 | |
| Increased maximum income eligibility figure. Improved management information system. Developed personal emergency response for Medicaid clients (voice and breath activated system). | |
| Italic Type = 1985 Survey Data. Plain Type = 1988 Survey Data. | |
Long Term Care Project
Division of Medical Assistance
40 North Pearl Street
Albany, NY 12243
(518) 473-5507
Program Implemented: 1977
| Fiscal or Calendar Year 1984 and/or 1988 Data | |
|---|---|
| Interviewee | Chris Rush, Director of Long Term Care, Bureau of Program Review |
| Total Expenditures | $94,000,000 $24,903,784 |
| Medicaid Expenditures | $42,000,000 (45%) $11,684,819 (47%) |
| Other Expenditures | State $37,600,000 (40%) Medicaid Waiver $5,000,000 (5%) County/Municipal Funds $9,400,000 State $12,078,335 (48%) Medicaid Waiver $293,516 (3%) Medicare $474,114 (3%) |
| Total Number of Clients Served | 10,197 4,283 |
| Total Hours of Service Provided | na 1,359,175 |
| Cost Per Hour of Service | na |
| Provider Mode | Private agencies only. |
| Entitlement Program | Yes |
| Independent Living Rating | Low |
| Program Goals | To enable people to stay in their own home and community, to prevent institutionalization, to contain costs associated with long term care. |
| Program Eligibility Requirements | |
| Maximum Client Assets | $2850, excluding home, personal items in the home, car, burial insurance, life insurance. |
| Maximum Client Income | $5700 $4700, excluding taxes, FICA, employment expenses, day care costs, medical expenses, health insurance payments, any other impairment expenses. |
| Type of Disabilities Eligible | All |
| Age Groups Eligible | All |
| Other Requirements | At risk of institutionalization. |
| Number of Applicants Considered Ineligible | na |
| Attendant Profile | |
| Private Agencies | |
| Hourly Wage | $4.50-7.00 $3.75-4.25 |
| Reimbursement to Agencies | $6.10-12.31 |
| Benefits | Varies depending on agency. |
| Attendant Requirements | Home health aide; 60 classroom hours of HHA PCA approved training program. |
| Who Hires/Fires Attendant | Agency |
| Who Pays Attendant | Agency |
| Administrative Profile | |
| Administrative Agency | Division of Medical Assistance |
| Types and Quantity of Services Assessed By | Provident case manager in social service district. |
| Factors for Assessment | Functional abilities (ADLs), services needed, plan less costly than institutionalization. |
| Administrative Activities | Eligibility determination, needs assessment, case management, recipient outreach and training, provider recruitment, referral, training and supervision. |
| Consumer Profile | |
| Age Ratio | 21% 65-74, 60% 75 or over. |
| Sex Ratio | 21% male, 79% female. |
| Ethnicity Ratio | 82% white. |
| Disabilities Served | All except MR. |
| Average Income | na |
| Income Source | na |
| Number Who Left Institutions Because of the Program | 2121 |
| Number Who Could Leave Institutions If Program Were Expanded | na |
| Program Services Available | |
| Personal Services | Respiration, bowel and bladder care, feeding, bathing/showering, dressing, menstrual care, ambulation, moving in and out of bed, oral hygiene and grooming, skin care, care and assistance with prosthesis, catheterization, medication, injections, range of motion, foot care. |
| Household Services | Light cleaning, heavy cleaning, laundry, grocery and other shopping, meal preparation, cleanup and planning, chore services, repairs, maintenance, renovation, architectural barrier removal. |
| Communication Services | Getting assistance from agencies in the community. |
| Transportation Services | Escort and driving, medical trips only. |
| Short-Term Services | Emergency and respite services available. |
| Medical Supervision Required for Some Services | Yes |
| Recipients Participate in Decisions r.e. Service Allocation | Yes |
| Services Available 7 days per week, 24 hours a day | Yes |
| Service Limits | Cannot exceed ¾ of nursing home costs $2053 per month |
| Average Weekly Hours Provided Per Consumer | na 22 |
| Administrator Comments | |
| Program's Strong Points | "Managed care, relationship of budget relative to institutional cost, local social service district involved in assessment and budgeting." |
| Program's Weak Points | "Budget cap is counterproductive; this program is most effective for those with the highest level of need, but these people are occasionally not admitted because the cost might exceed the cap. Admission criteria related to nursing home care but not differentiated from other homecare programs." |
| Program Changes Being Contemplated | "Seeking legislation to make caps more flexible. Developing classification system for patients. Training program to improve local social service personnel's ability to work with providers. Make program available to those in adult homes (board and care)." |
| Changes Since 1984 | |
| Increased program audits, on sight review of provider performance. | |
| Italic Type = 1985 Survey Data. Plain Type = 1988 Survey Data. | |
Medicaid PC-Option
Division of Medical Assistance, Department of Human Resources
1985 Umstead Drive
Raleigh, NC 27603
(919) 733-6964
Program Implemented: 1986
| Fiscal or Calendar Year 1988 Data | |
|---|---|
| Interviewee | Daphne Lyon |
| Total Expenditures | $12,904,962 |
| Medicaid Expenditures | $8,794,910 (68%) |
| Other Expenditures | State $3,493,322 (27%) County $616,730 (5%) |
| Total Number of Clients Served | 3,765 |
| Total Hours of Service Provided | 1,294,330 |
| Cost Per Hour of Service | $9.97 |
| Provider Mode | Agency providers only. |
| Entitlement Program | Yes |
| Program Eligibility Requirements | |
| Maximum Client Income | $2,900 |
| Age Groups Eligible | All |
| Disability Groups Eligible | All |
| Other Eligible Requirements | Medicaid recipient or eligible, family unable/unwilling to provide services, physician's orders. |
| Attendant Profile | |
| Private Agencies | |
| Hourly Wage | $8.00 |
| Benefits | Health insurance, social security, transportation costs. |
| Program Services Available | |
| Personal Services | Bowel and bladder care, feeding, bathing/showering, dressing, menstrual care, ambulation, moving in and out of bed, oral hygiene and grooming, skin care, menstrual care, self administered medication. |
| Household Services | Light cleaning, laundry, grocery shopping, meal preparation and cleanup, meal planning. |
| Communication Services | None |
| Transportation Services | Medical escort only. |
| Short-Term Services | None |
| Medical Supervision Required for Some Services | Yes |
| Recipients Participate in Decisions r.e. Service Allocation | Yes |
| Services Available 7 days per week, 24 hours a day | Varies by county or region. |
| Service Limits | 20 hours per week or $640 per month. |
| Average Weekly Hours Provided Per Consumer | 6.6 |
| Italic Type = 1985 Survey Data. Plain Type = 1988 Survey Data. | |
Non-Technical Medical Care
Department of Human Services
312 Northeast 28th Street
Oklahoma City, OK 73125
(405) 521-4165
Program Implemented: 1970
| Fiscal or Calendar Year 1984 and/or 1988 Data | |
|---|---|
| Interviewee | Wilma Ray, RN, Administrative Officer Norma L. Groff, RN, Program Administrator |
| Total Expenditures | $35,000,000 $34,400,000 |
| Medicaid Expenditures | $26,250,000 (75%) $32,000,000 (93%) |
| Other Expenditures | State $8,750,000 (35%) State $2,400,000 (7%) |
| Total Number of Clients Served | 14,028 7,643 |
| Total Hours of Service Provided | 210,420 409,482 |
| Cost Per Hour of Service | na |
| Provider Mode | Independent providers only. |
| Entitlement Program | Yes |
| Independent Living Rating | Medium |
| Program Goals | To prevent institutionalization, to enable people to stay in their home and community. |
| Program Eligibility Requirements | |
| Maximum Client Assets | $1500, excluding home, personal items and burial insurance. |
| Maximum Client Income | $5,184 $4,080, excluding medical expenses, health insurance payments. |
| Type of Disabilities Eligible | All |
| Age Groups Eligible | All |
| Other Requirements | Medicaid eligible, at risk of institutionalization, family unable or unwilling to do attendant care, physician's orders, need for assistance with ADLs. |
| Number of Applicants Considered Ineligible | na |
| Attendant Profile | |
| Independent Providers | |
| Hourly Wage | $13.99 per day for a minimum of three hours of service. |
| Benefits | Social Security |
| Attendant Requirements | Graduate from agency training program, consumer requests an individual provider. |
| Family Regulations | "If a client lives in a remote area or speaks an unfamiliar language and no other person is available, a relative will be paid using state funds (not Title XIX funds)." |
| Consumer Can Hire/Fire Attendant | Yes |
| Consumer Can Pay Attendant | Yes |
| Consumer Can Train Attendant | No |
| Administrative Profile | |
| Administrative Agency | Oklahoma Department of Social Services |
| Types and Quantity of Services Assessed By | An RN acts as the trainer, consultant, manager and resource person for the client and provider. |
| Factors for Assessment | Physician's recommendation, functional ability (ADLs), accessibility of environment, plan of care less costly than institutionalization, services needed. |
| Administrative Activities | Needs assessment, provider training, provider supervision. |
| Consumer Profile | |
| Age Ratio | na |
| Sex Ratio | na |
| Ethnicity Ratio | na |
| Disabilities Served | All |
| Average Income | $3,600 |
| Income Source | na |
| Number Who Left Institutions Because of the Program | na |
| Number Who Could Leave Institutions If Program Were Expanded | Very few. |
| Program Services Available | |
| Personal Services | Bowel and bladder care, feeding, bathing/showering, dressing, menstrual care, ambulation, moving in and out of bed, oral hygiene and grooming, skin care, care and assistance with prosthesis, medication ("the only medications given are those the client would normally administer to themselves"), range of motion, foot care. |
| Household Services | Light cleaning, laundry, grocery shopping, meal preparation, cleanup and planning. |
| Communication Services | Making telephone calls, writing letters, getting assistance from agencies in the community, handling paperwork for paid helpers, reading. |
| Transportation Services | Medical escort only. |
| Short-Term Services | Respite None |
| Medical Supervision Required for Some Services | Yes Once every two months for all services. |
| Recipients Participate in Decisions r.e. Service Allocation | Yes |
| Services Available 7 days per week, 24 hours a day | No |
| Service Limits | $432.00 per month $425.53 per month |
| Average Weekly Hours Provided Per Consumer | 15 hours 30 hours |
| Administrator Comments | |
| Program's Strong Points | "Training program for providers of care. Clients are able to remain at home. Clients are able to maintain some independence. Program is cost effective." |
| Program's Weak Points | "Lack of control in provider selection." |
| Program Changes Being Contemplated | "Possible change from daily rate of pay to hourly." |
| Changes Since 1984 | |
| Developed functional ability assessment tool. Increased maximum income eligibility figure. District Supervisors perform periodic audits or assessments. | |
| Italic Type = 1985 Survey Data. Plain Type = 1988 Survey Data. | |
In Home Services and Project Independence
Senior Services Division
313 Public Services Building
Salem, OR 97310
(503) 378-3751
Program Implemented: 1970
| Fiscal or Calendar Year 1984 and/or 1988 Data | |
|---|---|
| Interviewee | Loren Simonds, Disability Services Program Coordinator Robert Zeigen, Asst. Administrator, Program Assistance Section Susan Dietsche Jane Dixon |
| Total Expenditures | $20,112,325 $12,500,000 |
| Medicaid Expenditures | $675,429 (3%) $912,468 (7%) |
| Other Expenditures | State $9,238,468 (46%) Title XIX Waiver $7,186,146 (36%) Title XX none Title III $1,487,705 (8%) County $1,239,122 (6%) Client Share $305,511 (2%) State $7,684,588 (62%) Title XIX Waiver $2,478,610 (20%) Title XX $713,659 (6%) Title III none County $610,648 (5%) Client Share $100,000 (1%) |
| Total Number of Clients Served | 2,594 9,170 (8,352 Household Services, 818 personal care services) |
| Total Hours of Service Provided | 166,500 (personal), 6,300,000 (household) |
| Cost Per Hour of Service | na |
| Provider Mode | Private agencies and independent providers. |
| Entitlement Program | na |
| Independent Living Rating | High |
| Program Goals | To enable people to stay in their own home and community, to contain costs associated with long-term care, to prevent institutionalization. |
| Program Eligibility Requirements | |
| Maximum Client Assets | na |
| Maximum Client Income | $2,928-$12,744 |
| Type of Disabilities Eligible | Physical disability, brain injury. |
| Age Groups Eligible | Over 18 All |
| Other Requirements | Functionally impaired by state criterion, at risk of institutionalization, able to manage own attendant. |
| Number of Applicants Considered Ineligible | na |
| Attendant Profile | |
| Independent Providers | |
| Hourly Wage | $1.70-$13.46 $3.45-$3.65 |
| Benefits | Social security, unemployment compensation, transportation costs. |
| Attendant Requirements | Consumer requests an individual provider, consumer capable of supervising attendant, trained by consumer, attendant must be 18 or older. |
| Family Regulations | Relatives can be paid for attendant care services if not residing in the same home, not legally responsible, or if relative is prevented from working outside the home because no attendant is capable or available. |
| Consumer Can Hire/Fire Attendant | Yes |
| Consumer Can Pay Attendant | No |
| Consumer Can Train Attendant | No |
| Private Agencies | |
| Hourly Wage | $3.65-10.00 na |
| Reimbursement to Agencies | $7.43 plus mileage (maximum for home care), $10.49 plus mileage (maximum for personal care). |
| Benefits | Worker's compensation, social security, unemployment compensation, transportation costs. |
| Attendant Requirements | Home health aide (personal care) or training by agency (home care). |
| Who Hires/Fires Attendant | Agency |
| Who Pays Attendant | Agency |
| Administrative Profile | |
| Administrative Agency | Senior Service Division |
| Types and Quantity of Services Assessed By | Agency assessment team. |
| Factors for Assessment | Physician's recommendation, functional abilities (ADLs), accessibility of environment, plan of care less costly than institutionalization, ICF eligible, services needed. |
| Administrative Activities | Provider recruitment (RFP process). |
| Consumer Profile | |
| Age Ratio | 26% 18-64, 29% 65-74, 45% 75 or over. |
| Sex Ratio | 26% male, 74% female. |
| Ethnicity Ratio | na |
| Disabilities Served | Physical disability, brain injury. |
| Average Income | na |
| Income Source | na |
| Number Who Left Institutions Because of the Program | 1800 |
| Number Who Could Leave Institutions If Program Were Expanded | 500 |
| Program Services Available | |
| Personal Services | Respiration, bowel and bladder care, feeding, bathing/showering, dressing, menstrual care, ambulation, moving in and out of bed, oral hygiene and grooming, skin care, care and assistance with prosthesis, catheterization, injections, medication, range of motion, foot care. |
| Household Services | Light cleaning, heavy cleaning, laundry, grocery and other shopping, meal preparation, planning and cleanup, repair, maintenance and renovation, chore services. |
| Communication Services | Getting assistance from agencies and the community, handling paperwork for paid helpers. |
| Transportation Services | Medical and non-medical trips. |
| Short-Term Services | Respite and emergency services available. |
| Medical Supervision Required for Some Services | Yes Every two months for personal care, home health. |
| Recipients Participate in Decisions r.e. Service Allocation | Yes |
| Services Available 7 days per week, 24 hours a day | Yes |
| Service Limits | $874.00-977.00 per months, 57 hours per week. $2,359 or comparable care in an institution (some exceptions on a case by case basis for over $2,359 -- mostly severely disabled children). |
| Average Weekly Hours Provided Per Consumer | na |
| Administrator Comments | |
| Program's Strong Points | "Comprehensive, fairly balanced, risk intervention workers who look for other ways to provide service than state funds." |
| Program's Weak Points | "Haven't gotten into daycare." |
| Program Changes Being Contemplated | "Comparable payment based on in-home and foster care. More sophisticated assessment based on degree of impairment. Developing step-by-step scale to prioritize cases." |
| Changes Since 1984 | |
| None listed. | |
| Italic Type = 1985 Survey Data. Plain Type = 1988 Survey Data. | |
Homemaker/HHA
Department of Social Services, Adult Services and Aging
700 Governors Drive
Pierre, SD 57501
(605) 773-3656
Program Implemented: 1978
| Fiscal or Calendar Year 1984 and/or 1988 Data | |
|---|---|
| Interviewee | Jacki Casanova, Program Specialist Ray Rickard, Program Specialist |
| Total Expenditures | $2,690,000 $1,834,000 |
| Medicaid Expenditures | $492,000 (25%) $309,000 (17%) |
| Other Expenditures | State $614,000 (18%) Title III $503,000 (19%) Title XX $1,004,000 (37%) Client Share of Cost $77,000 (3%) State $465,000 (25%) Title III $375,000 (20%) Title XX $685,000 (37%) |
| Total Number of Clients Served | 3282 4000 |
| Total Hours of Service Provided | 341,328 246,329 |
| Cost Per Hour of Service | Approx. $7.88 $7.54 |
| Provider Mode | Private agencies and government workers. |
| Entitlement Program | No (41 people on waiting list). |
| Independent Living Rating | Low |
| Program Goals | To enable people to stay in their own home and community, to prevent institutionalization, to contain costs associated with long-term care. |
| Program Eligibility Requirements | |
| Maximum Client Assets | na |
| Maximum Client Income | "Income means testing is not utilized." |
| Type of Disabilities Eligible | All |
| Age Groups Eligible | All Over 18. |
| Other Requirements | At risk of institutionalization, family members unable or unwilling to do attendant care, Medicaid eligible, physician's orders. |
| Attendant Profile | |
| Private Agencies | |
| Hourly Wage | $4.00-5.50 na |
| Reimbursement to Agencies | $7.00 |
| Benefits | Worker's compensation, social security, unemployment compensation. |
| Attendant Requirements | Graduate of agency training program. |
| Government Agency | |
| Hourly Wage | $4.66-6.98 $3.85-4.67 |
| Benefits | Vacation pay, sick leave, health insurance, worker's compensation, social security, unemployment compensation, transportation costs, retirement or pension plan. |
| Attendant Requirements | Home health aide, graduate of in-service training program. |
| Who Hires/Fires Attendant | Government agency |
| Who Pays Attendant | Government agency |
| Administrative Profile | |
| Administrative Agency | Adult Services and Aging |
| Types and Quantity of Services Assessed By | Social worker with RN. |
| Factors for Assessment | Physician's recommendation, functional abilities (ADLs), accessibility of environment, plan of care less costly than institutionalization, services needed. |
| Administrative Activities | Needs assessment, case management. |
| Consumer Profile | |
| Age Ratio | na |
| Sex Ratio | na |
| Ethnicity Ratio | na |
| Disabilities Served | All |
| Average Income | $3600 |
| Income Source | na |
| Number Who Left Institutions Because of the Program | na |
| Number Who Could Leave Institutions If Program Were Expanded | na |
| Program Services Available | |
| Personal Services | Bathing/showering, dressing, oral hygiene and grooming, skin care, menstrual care, feeding, ambulation, moving in and out of bed, bowel and bladder care and assistance with prosthesis, self-administered medication, range of motion. |
| Household Services | Light cleaning, laundry, grocery shopping, meal preparation and cleanup. |
| Communication Services | None |
| Transportation Services | Driving, medical trips only. |
| Short-Term Services | None |
| Medical Supervision Required for Some Services | No Supervision monthly for Title 19 services. |
| Recipients Participate in Decisions r.e. Service Allocation | Yes |
| Services Available 7 days per week, 24 hours a day | No |
| Service Limits | 4 hours per week. |
| Average Weekly Hours Provided Per Consumer | 2 |
| Administrator Comments | |
| None. | |
| Changes Since 1984 | |
| Program monitoring. On site review of provider performance based on service standards. | |
| Italic Type = 1985 Survey Data. Plain Type = 1988 Survey Data. | |
Primary Home Care Program
Department of Human Services
Mail Code 543-W, P.O. Box 2960
Austin, TX 78769
Program Implemented: 1979
| Fiscal or Calendar Year 1984 and/or 1988 Data | |
|---|---|
| Interviewee | Maria Montoya, Program Specialist Ernest McKenney, Director of In-Home Services |
| Total Expenditures | $108,982,470 $46,423,890 |
| Medicaid Expenditures | $62,021,924 (57%) $25,240,669 (54%) |
| Other Expenditures | State $46,960,546 (43%) State $21,183,221 (46%) |
| Total Number of Clients Served | 31,266 14,399 |
| Total Hours of Service Provided | 20,133,268 8,555,066 |
| Cost Per Hour of Service | $5.41 $5.43 |
| Provider Mode | Private agencies only. |
| Entitlement Program | Yes |
| Independent Living Rating | Low |
| Program Goals | To prevent institutionalization, to enable people to stay in their own home and community, to contain costs associated with long-term care. |
| Program Eligibility Requirements | |
| Maximum Client Assets | $1500 |
| Maximum Client Income | $8820 $4140 |
| Type of Disabilities Eligible | All |
| Age Groups Eligible | All |
| Other Requirements | Medicaid eligible, physician's orders, functional assessment. |
| Number of Applicants Considered Ineligible | 12,000 |
| Attendant Profile | |
| Private Agencies | |
| Hourly Wage | $3.35-$4.41 (FY 1987) $3.48 |
| Reimbursement to Agencies | $5.47 |
| Benefits | Transportation costs (varies), worker's compensation, social security, unemployment compensation. |
| Attendant Requirements | Certified by agency contract. |
| Who Hires/Fires Attendant | Agency |
| Who Pays Attendant | Agency |
| Administrative Profile | |
| Administrative Agency | Department of Human Services |
| Types and Quantity of Services Assessed By | Case worker |
| Factors for Assessment | Physician's recommendation, functional abilities (ADLs), accessibility of environment, plan of care less costly than institutionalization, services needed. |
| Administrative Activities | Eligibility determination, needs assessment, case management, prior approval. |
| Consumer Profile | |
| Age Ratio | 18% under 64, 82% 65 or over. |
| Sex Ratio | 23% male, 77% female. |
| Ethnicity Ratio | 22% Black, 25% Hispanic, 53% White. |
| Disabilities Served | All |
| Average Income | $3960 |
| Income Source | 10% social security retirement, 89% SSI. |
| Number Who Left Institutions Because of the Program | na |
| Number Who Could Leave Institutions If Program Were Expanded | na |
| Program Services Available | |
| Personal Services | Feeding, bathing/showering, dressing, menstrual care, ambulation, moving in and out of bed, oral hygiene and grooming, skin care, respiration, care and assistance with prosthesis, bowel and bladder care, medication, range of motion. |
| Household Services | Light and heavy cleaning, laundry, grocery and other shopping, meal preparation and cleanup, chore services. |
| Communication Services | None |
| Transportation Services | Medical and non-medical escort. |
| Short-Term Services | Emergency and relief available. |
| Medical Supervision Required for Some Services | Yes Every two months for all services. |
| Recipients Participate in Decisions r.e. Service Allocation | Yes |
| Services Available 7 days per week, 24 hours a day | No Yes |
| Service Limits | 30 years per week. |
| Average Weekly Hours Provided Per Consumer | 12.3 11.7 |
| Administrator Comments | |
| Program's Strong Points | "Available statewide without any discrimination on the basis of age or disability. Allows people to remain in their own homes. Cost effective alternative to institutionalization. Administration strong in fiscal monitoring." |
| Program's Weak Points | "Need more stringent standards for breaks in service, replacing no-show attendants. Initial eligibility assessment can be time-consuming. High turnover in attendants because of low wages, no benefits." |
| Program Changes Being Contemplated | "Changes around service breaks. Procurement for competitive bidding for private agencies." |
| Changes Since 1984 | |
| On site review of provider performance based on service standards. The PHC provider manual has been rewritten to ensure statewide conformity. Improved management information system. | |
| Italic Type = 1985 Survey Data. Plain Type = 1988 Survey Data. | |
Homemaker-Personal Care Program
Utah Department of Health
288 North, 1460 West
Salt Lake City, UT 84116
(801) 538-6636
Program Implemented: 1983
| Fiscal or Calendar Year 1984 and/or 1988 Data This program was split between the time of the two surveys; personal services are now provided through the Division of Health Care Financing rather than Aging and Adult Services, and homemaker services are provided through the Department of Social Services (currently being phased out). | |
|---|---|
| Interviewee | RueDell Sudweeks, Health Program Specialist Cosette Mills, Program Specialist |
| Total Expenditures | $182,577 $938,765 |
| Medicaid Expenditures | $136,002 (74%) $35,000 (3.7%) |
| Other Expenditures | State $46,575 (26%) State $610,197 (65%) Title XX $279,568 (29.8%) |
| Total Number of Clients Served | 200 500 (141 for personal care, 359 for household services). |
| Total Hours of Service Provided | 19,778 84,500 |
| Cost Per Hour of Service | $9.23 $11.11 |
| Provider Mode | Private agencies, state and local government staff. |
| Entitlement Program | Yes |
| Independent Living Rating | Low |
| Program Goals | To prevent institutionalization, to enable people to stay in their own home and community, to contain costs associated with long-term care. |
| Program Eligibility Requirements | |
| Maximum Client Assets | $4,000 excluding home, personal items in the home, care, burial insurance. |
| Maximum Client Income | $3,636 $5,256, excluding excessive medical costs, health insurance payments, housing costs which exceed 30% of income, funeral costs for family members. |
| Type of Disabilities Eligible | na |
| Age Groups Eligible | All ages. Over 18. |
| Other Requirements | SSI, Medicaid or SSDI eligible, at risk of institutionalization, RN assessment. |
| Number of Applicants Considered Ineligible | na |
| Attendant Profile | |
| Private Agencies | |
| Hourly Wage | $4.25 |
| Reimbursement to Agencies | $7.00 |
| Benefits | Varies depending on agency. |
| Attendant Requirements | Graduate of agency program. |
| Who Hires/Fires Attendant | Agency |
| Who Pays Attendant | Agency |
| Government Agency | |
| Hourly Wage | $4.00 |
| Benefits | Social security. |
| Attendant Requirements | Graduate of state agency training program. |
| Who Hires/Fires Attendant | Government agency. |
| Who Pays Attendant | Government agency. |
| Administrative Profile | |
| Administrative Agency | Division of Aging and Adult Services |
| Types and Quantity of Services Assessed By | Case management agency assessment team, program director. |
| Factors for Assessment | Functional abilities (ADLs), accessibility of environment, services needed, budget limitations of program. |
| Consumer Profile | |
| Age Ratio | 28% 18-64, 26% 65-74, 45% over 75. |
| Sex Ratio | 14% male, 85% female. |
| Ethnicity Ratio | 6% black, 4% hispanic, 1% native american, 89% white. |
| Disabilities Served | na |
| Average Income | na |
| Income Source | na |
| Number Who Left Institutions Because of the Program | na |
| Number Who Could Leave Institutions If Program Were Expanded | na |
| Program Services Available | |
| Personal Services | Bowel and bladder care, feeding, bathing/showering, dressing, menstrual care, ambulation, oral hygiene and grooming, skin care, foot care, range of motion. |
| Household Services | Light cleaning, laundry, shopping, meal preparation, meal cleanup and menus, coal and ash cleanup. |
| Communication Services | None |
| Transportation Services | None |
| Short-Term Services | Emergency services available. |
| Medical Supervision Required for Some Services | Yes Supervision required every six months for personal care services. |
| Recipients Participate in Decisions r.e. Service Allocation | No |
| Services Available 7 days per week, 24 hours a day | No |
| Service Limits | 15 hours per week, $570 per month. |
| Average Weekly Hours Provided Per Consumer | 6 |
| Administrator Comments | |
| Program's Strong Points | "Available in all areas of the state, including rural areas. Cost kept down. People who need minimum services can get care without Homehealth Aide." |
| Program's Weak Points | "Complex system of administration, difficult to coordinate. Varies all over state. Poor reporting process." |
| Program Changes Being Contemplated | "Bringing up eligibility criteria to 150% of poverty level and using a sliding fee schedule. Establishing a uniform method of service delivery. Improving reporting method." |
| Changes Since 1984 | |
| Developed functional assessment tool. Annual review of Health Care Financing. | |
| Italic Type = 1985 Survey Data. Plain Type = 1988 Survey Data. | |
Medicaid Personal Care
Aging and Adult Services Administration
623 8th Avenue SE
Olympia, WA 98504-0095
(206) 586-4746
Program Implemented: 1989
| Fiscal or Calendar Year 1989 Data and Projections | |
|---|---|
| Interviewee | Rick Bacon, Community Services Program Managed |
| Total Expenditures | $34,000,000 |
| Medicaid Expenditures | $18,020,000 (53%) |
| Other Expenditures | State $15,980,000 (47%) |
| Total Number of Clients Served | 5,864 (projected) |
| Total Hours of Service Provided | na |
| Cost Per Hour of Service | na |
| Provider Mode | Individual providers and agency providers. |
| Entitlement Program | Yes |
| Program Eligibility Requirements | |
| Maximum Client Income | $4,992 per year |
| Age Groups Eligible | All |
| Disability Groups Eligible | Physical disability, brain injury or trauma. |
| Other Eligible Requirements | Medicaid recipient or eligible, SSI recipient or eligible, family unable/unwilling to provide services, physician's orders. |
| Attendant Profile | |
| Independent Providers | |
| Hourly Wage | $5.36 |
| Benefits | na |
| Consumer Can Hire/Fire Attendant | Yes |
| Consumer Can Pay Attendant | No |
| Consumer Can Train Attendant | No |
| Private Agencies | |
| Hourly Wage | $5.15-5.36 |
| Benefits | Vary by individual agencies. |
| Program Services Available | |
| Personal Services | Bowl and bladder care, feeding, bathing/showering, dressing, menstrual care, ambulation, moving in and out of bed, oral hygiene and grooming, skin care, respiration, care and assistance with prosthesis, catheterization, medication, foot care. |
| Household Services | Light cleaning, heavy cleaning, laundry, meal preparation and cleanup, meal planning, grocery and other shopping. |
| Communication Services | None. |
| Transportation Services | Medical escort and driving only. |
| Short-Term Services | Emergency services available. |
| Medical Supervision Required for Some Services | Yes |
| Recipients Participate in Decisions r.e. Service Allocation | Yes |
| Services Available 7 days per week, 24 hours a day | Yes |
| Service Limits | $772.10 per month |
| Average Weekly Hours Provided Per Consumer | na |
| Italic Type = 1985 Survey Data. Plain Type = 1988 Survey Data. | |
Personal Care Aide Services Program
Home Care Services Bureau
Department of Human Services
19th & Massachusetts Avenue SE
Building 16, DC General Hospital
Washington, DC 20003
(202) 727-0268
Program Implemented: 1984
| Fiscal or Calendar Year 1984 and/or 1988 Data | |
|---|---|
| Interviewee | Inez Atwell, Chief of Home Care Services Bureau Louise Earlbeck, Director |
| Total Expenditures | na $3,600,000 |
| Medicaid Expenditures | na $1,700,000 (48%) |
| Other Expenditures | District na District $1,900,000 (52%) |
| Total Number of Clients Served | na 900 |
| Total Hours of Service Provided | na 1,016,409 |
| Cost Per Hour of Service | na $3.54 |
| Provider Mode | Agency providers and independent providers. |
| Entitlement Program | No (74 people on waiting list) |
| Independent Living Rating | Medium |
| Program Goals | Prevent institutionalization, to enable people to stay in their own home and community, to contain costs associated with long-term care. |
| Program Eligibility Requirements | |
| Maximum Client Assets | na |
| Maximum Client Income | $4596 $4200 excluding medical expenses. |
| Type of Disabilities Eligible | Physical disability, brain injury, mental illness. |
| Age Groups Eligible | All Over 18 |
| Other Requirements | Medicaid eligible, physician's orders, living in own home or apartment or with family. |
| Number of Applicants Considered Ineligible | 15-20 |
| Attendant Profile | |
| Independent Providers | |
| Hourly Wage | $4.00 |
| Benefits | None |
| Attendant Requirements | Attendant must be 18 or older, able to read and write, complete training program. |
| Family Regulations | No parent, in-law, child or any relatives residing in the same home. |
| Consumer Can Hire/Fire Attendant | na |
| Consumer Can Pay Attendant | na |
| Consumer Can Train Attendant | na |
| Private Agencies | |
| Hourly Wage | $7.00 |
| Benefits | None |
| Administrative Profile | |
| Administrative Agency | Home Care Services Bureau |
| Types and Quantity of Services Assessed By | RN with physician's approval. |
| Factors for Assessment | Physician's recommendation, functional abilities (ADLs), services needed. |
| Consumer Profile | |
| Age Ratio | na |
| Sex Ratio | 15% male, 85% female. |
| Ethnicity Ratio | 92% black, 2% hispanic, 3% white. |
| Disabilities Served | Physical disability, brain injury, mental illness. |
| Average Income | na |
| Income Source | na |
| Number Who Left Institutions Because of the Program | na |
| Number Who Could Leave Institutions If Program Were Expanded | na |
| Program Services Available | |
| Personal Services | Bowel and bladder care, feeding, bathing/showering, dressing, ambulation, moving in and out of bed, oral hygiene and grooming, skin care, care and assistance with prosthesis, range of motion, foot care, catheterization, injections, medication, menstrual care. |
| Household Services | Light cleaning, laundry, grocery and health-related shopping, meal preparation, cleanup and planning. |
| Communication Services | Making telephone calls, getting assistance from agencies in the community, interpreting, reading. |
| Transportation Services | Medical escort only. |
| Short-Term Services | None |
| Medical Supervision Required for Some Services | RN supervision every month for all services. |
| Recipients Participate in Decisions r.e. Service Allocation | Yes |
| Services Available 7 days per week, 24 hours a day | No |
| Service Limits | None |
| Average Weekly Hours Provided Per Consumer | 30-35 20 |
| Administrator Comments | |
| Program's Strong Points | "Maintaining people at home, many of whom would otherwise be in a nursing home." |
| Program's Weak Points | "Aides are underpaid -- could get better quality aides with better pay and benefits." |
| Changes Since 1985 | |
| Monthly telephone monitoring, biannual nurse visits Professional advisory committee. | |
| Italic Type = 1985 Survey Data. Plain Type = 1988 Survey Data. | |
Personal Care Option
Department of Health and Human Resources
Medical Services Bureau
Building 6, Capitol Complex
Charleston, WV 25305
(304) 348-8990
Program Implemented: 1987
| Fiscal or Calendar Year 1988 Data | |
|---|---|
| Interviewee | Auburn Cooper, Assistant Director |
| Total Expenditures | $4,000,000 |
| Medicaid Expenditures | $3,040,000 (76%) |
| Other Expenditures | State $960,000 (24%) |
| Total Number of Clients Served | 7,500 |
| Total Hours of Service Provided | na |
| Cost Per Hour of Service | na |
| Provider Mode | Individual providers only. |
| Entitlement Program | Yes |
| Program Eligibility Requirements | |
| Maximum Client Income | $16,200 |
| Age Groups Eligible | Over 18 |
| Disability Groups Eligible | Physical disability, brain injury or trauma. |
| Other Eligible Requirements | Medicaid recipient or eligible, physician's orders. |
| Attendant Profile | |
| Independent Providers | |
| Hourly Wage | $5.00 |
| Benefits | None |
| Consumer Can Hire/Fire Attendant | Yes |
| Consumer Can Pay Attendant | No |
| Consumer Can Train Attendant | No |
| Program Services Available | |
| Personal Services | Feeding, bathing/showering, dressing, menstrual care, ambulation, moving in and out of bed, oral hygiene and grooming. |
| Household Services | Light and heavy cleaning, laundry, meal planning preparation and cleanup, grocery and other shopping, chore services, repairs, maintenance, renovation, taking care of children, scheduling household tasks and deciding who will do them, paying bills, budgeting. |
| Communication Services | Making telephone calls, writing letters, handling money or checks, getting assistance from agencies in the community, handling paperwork for paid helpers, interpreting, reading. |
| Transportation Services | Medical driving and escort only. |
| Short-Term Services | Emergency and respite services available. |
| Medical Supervision Required for Some Services | Yes |
| Recipients Participate in Decisions r.e. Service Allocation | Yes |
| Services Available 7 days per week, 24 hours a day | Varies |
| Service Limits | $110 per month. |
| Average Weekly Hours Provided Per Consumer | na |
| Administrative Activities | Eligibility determination, needs assessment, provider recruitment, referral, training and supervision. |
| Italic Type = 1985 Survey Data. Plain Type = 1988 Survey Data. | |
APPENDIX B: THE EFFECT OF GOVERNMENT FUNDING SOURCE ON PERSONAL ASSISTANCE PROGRAMS: A SUMMARY OF 1985 NATIONAL SURVEY DATA
Introduction
Data from a nationwide 1985 survey of 157 attendant service programs, originally presented in Attending to America: Personal Assistance for Independent Living,7 is reanalyzed to examine the impact of primary government funding source on various program features, including; program expenditures, number of clients, hours of service provided, scope of services, medical supervision requirements, service availability, service limits, eligibility requirements, provider mode, attendant wages and benefits, program philosophy, and program age. Summary statistics are presented, and a brief discussion of the implications of these findings suggests specific case studies of select programs in order to examine key variables in greater detail.
In 1985, the World Institute on Disability conducted the first nationwide survey of government-funded programs for people of all ages with disabilities which offer personal maintenance and/or household/domestic service on a long-term basis or short-term (respite) basis. The resulting monograph, Attending to America: Personal Assistance for Independent Living (Litvak, Heumann and Zukas, 1987), provided an overview of personal assistance programs throughout the United States. It also highlighted the lack of a comprehensive federal policy and integrated funding for personal assistance services (PAS), which led to a basic research question: how do the various funding sources (and their concomitant regulation) affect the design of these programs? The present research will address this question by examining the impact of disparate funding sources on personal assistance programs. The following is a list of primary government funding source categories, and the distribution of these funding sources among the 157 programs surveyed.
Funding Source
A total of 157 programs from 49 states and the District of Columbia were included in the present study (Table B-1). These programs are divided into one of the following eleven groups on the basis of federal funding source, although all programs were supplemented with state funds (see Litvak et. al., 1987, for a full discussion of funding sources):
1a. TXIX Only -- Title XIX (Medicaid) PC-Option funding only (n=13).
1b. TXIX Mixed -- Title XIX (Medicaid) PC-Option funding combined with other federal funding (n=7).
2. TXIX Waiver -- Title XIX (Medicaid) Waiver funding (n=39).
3. SSBG -- Title XX (Social Services Block Grant) funding only (n=34).
4. TIII -- Title III (Older Americans Act) funding only (n=21).
5a. StateOnly -- State funding only (n=23).
5b. State Spplt -- State Supplement to Social Security Insurance (n=4).
5c. TVII -- Title VII A or B funding only (n=3).
6a. Other -- Mix of federal funding other than Medicaid (n=5).
6b. TXIX-HHA Only -- Title XX (Medicaid) funded home health agencies (n=4).
6c. TXIX-HHA Mixed -- Title XIX (Medicaid) funding combined with other funding (n=4).
Group 1a consists of programs funded by the Title XIX PC-Option. The Medicaid PC-Option is a part of the original Medicaid legislation introduced in 1965. The PC-Option legislation mandates a physician's prescription for services and the supervision of non-family providers by a registered nurse. Otherwise there is no regulation and programs vary in their degree of medical emphasis. Group 1b programs are funded primarily by the Title XIX PC-Option, but have other sources of federal funding as well. Statistical tests indicated that there were no significant differences between these two groups, so they were combined into a single "Title XIX PC-Option" group for all analyses presented in this report.
Group 2 is composed of programs funded by Title XIX waivers. These programs, begun in 1979 on a demonstration basis, are the result of a legislative concern about burgeoning nursing home costs. Programs are required to demonstrate that the services they offer are less costly than nursing home or hospital care. Many states apparently utilize this new source of federal money to create programs for populations not being adequately served by other programs (e.g. people with AIDS, children with disabilities).
Group 3 consists of programs funded by Title XX of the Social Security Act or the Social Services Block Grant (SSBG). Many states provide some sort of home services with Title XX funds, but few have developed comprehensive attendant services including both personal "care" and household services. Notable exceptions are California's In-Home Supportive Services program (IHSS) and Pennsylvania's Attendant Care Program.
Group 4 programs are funded by Title III of the Older Americans Act, which is directed to people over the age of 60. These programs do not have income eligibility rules, though federal regulations encourage local Area Agencies on Aging to target poorer people.
Group 5a programs are funded exclusively by state resources, and state agencies are in charge of all aspects of these programs. Group 5b consisted of programs which provide state supplements for PAS directly to Social Security Insurance (SSI) recipients, generally with little monitoring of how recipients use the supplement. Group 5c programs are funded by state resources, with some Title VII funds. These three groups have been combined into a single "State Funding" group for all analyses.
| TABLE B-1. Program Location and Funding Source | ||||||||||||
|---|---|---|---|---|---|---|---|---|---|---|---|---|
| State | TXIX | SSBG | State | TIII | TVII | Other | TXIX-HHA | Total | ||||
| Only | Mixed | Waiver | Only | Spplt. | Only | Mixed | ||||||
| AL | 1 | 1 | 1 | 3 | ||||||||
| AK | 1 | 1 | 1 | 3 | ||||||||
| AZ | 1 | 1 | ||||||||||
| AR | 1 | 1 | 2 | |||||||||
| CA | 2 | 1 | 1 | 4 | ||||||||
| CO | 1 | 1 | 1 | 1 | 4 | |||||||
| CT | 2 | 1 | 1 | 1 | 5 | |||||||
| DE | 1 | 1 | 2 | |||||||||
| FL | 2 | 1 | 1 | 1 | 5 | |||||||
| GA | 1 | 1 | 2 | |||||||||
| HI | 1 | 1 | 1 | 3 | ||||||||
| ID | 2 | 1 | 3 | |||||||||
| IL | 1 | 1 | 2 | |||||||||
| IN | 1 | 1 | 1 | 1 | 4 | |||||||
| IA | 1 | 1 | 2 | |||||||||
| KS | 1 | 1 | 1 | 1 | 4 | |||||||
| KY | 1 | 1 | 1 | 3 | ||||||||
| LA | 0 | |||||||||||
| ME | 1 | 1 | 3 | 5 | ||||||||
| MD | 1 | 1 | 1 | 3 | ||||||||
| MA | 1 | 1 | 1 | 2 | 1 | 6 | ||||||
| MI | 1 | 1 | 1 | 3 | ||||||||
| MN | 1 | 1 | 2 | |||||||||
| MS | 1 | 1 | 2 | |||||||||
| MO | 1 | 2 | 1 | 1 | 1 | 6 | ||||||
| MT | 1 | 1 | 1 | 1 | 4 | |||||||
| NE | 1 | 2 | 3 | |||||||||
| NV | 1 | 1 | 1 | 1 | 4 | |||||||
| NH | 1 | 1 | 1 | 1 | 4 | |||||||
| NJ | 1 | 2 | 3 | |||||||||
| NM | 2 | 2 | 1 | 5 | ||||||||
| NY | 1 | 1 | 2 | 1 | 1 | 6 | ||||||
| NC | 1 | 1 | 2 | |||||||||
| ND | 1 | 1 | ||||||||||
| OH | 2 | 2 | 1 | 1 | 6 | |||||||
| OK | 1 | 1 | 2 | |||||||||
| OR | 1 | 1 | ||||||||||
| PA | 1 | 1 | 1 | 3 | ||||||||
| RI | 1 | 1 | 1 | 1 | 4 | |||||||
| SC | 1 | 1 | 2 | |||||||||
| SD | 1 | 1 | 1 | 3 | ||||||||
| TN | 1 | 1 | ||||||||||
| TX | 1 | 1 | 1 | 1 | 4 | |||||||
| UT | 1 | 1 | 1 | 3 | ||||||||
| VT | 1 | 1 | 2 | |||||||||
| VA | 1 | 1 | 2 | |||||||||
| WA | 1 | 1 | 2 | |||||||||
| WV | 1 | 1 | 2 | |||||||||
| WI | 1 | 1 | 4 | 6 | ||||||||
| WY | 1 | 1 | ||||||||||
| DC | 1 | 1 | 2 | |||||||||
| TOTALS | 13 | 7 | 39 | 34 | 23 | 4 | 21 | 3 | 6 | 4 | 3 | 157 |
Group 6a consists of programs funded by more than one source of non-Medicaid federal funding, primarily Title III and SSBG. Group 6b programs are funded by Title XIX home health funds; Group 6c programs are funded by Title XIX home health funds and other federal funds. Group 6b and 6c programs are included in this report because, although are not specifically intended for personal assistance but rather for home health services, in several states they have in fact become de facto personal assistance programs, providing long-term PAS to people with disabilities. Because the number of programs in each of these subgroups was very small, the three groups are combined into a single "Other Funding" group for these analyses.
Hypotheses
It is hypothesized that these funding groups will differ significantly on a number of key variables, including; program expenditures, number of clients, hours of service provided, scope of services, medical supervision requirements, service availability, service limits, eligibility requirements, provider mode, attendant wages and benefits, program philosophy, and program age.
Methodology
Subjects
One hundred and seventy-five programs were contacted. Nineteen of these were not included in this study because of inadequate statewide data, or because the administrator refused to be interviewed.
Several types of programs were not included in this survey. Protective service programs (those aimed at preventing abuse or neglect of adults and children) were only included if these programs served people on a long-term basis. Programs targeted exclusively for people with mental illness or mental retardation were not included. Temporary services for people who are acutely ill or for those in transition from the hospital, nursing home or institution to the community were also not included. In addition, shared attendant programs in congregate living arrangements were not included. Finally, purely household/domestic service programs were not included if there was no program providing personal services in the state with which the domestic program could be paired to provide a full range of attendant services.
Materials
An 18-page questionnaire was developed by reviewing current reports on attendant service programs and the limited research literature. A copy is provided at the end of this report.
Procedure
Data was gathered through two methods: telephone and mail surveys. In general, the state administrator of the specific program or the head of the administering public agency was contacted. In a few cases, the state agency delegated full responsibility for administration and data collection to a Center for Independent Living, so the administrator of that program was contacted.
Telephone interviews of 118 program administrators were conducted from February to September, 1985. A copy of the questionnaire was mailed at least two weeks before the scheduled interview, so the administrator could gather the necessary data. In the interest of time, a mail survey was conducted from September,1985 to January,1986, to gather data on the remaining 39 programs. All questionnaires were examined by the principal investigator for internal consistency, and respondents were called to clear up any discrepancies.
Reliability and Validity
The survey is intended to gather specific information based primarily on objective, written data from program regulations and annual budgets and reports. However, management information systems (MIS) were not in place for some of the programs surveyed. Among programs which did have management information systems, the data available was often incomplete or not comparable to data from other programs. Demographic breakdowns of client populations and specific budgetary breakdowns, for example, were generally unavailable.
The low response rate on some questions may also indicate that some administrators were unable to convert their information into the stated categories. For example, there was a high percentage of missing data on consumer income and asset limits. This may be due to the variety of income and asset deduction allowances in a given program which made a single figure difficult to derive.
Overall, despite the objective nature of the data requested, the reliance on the knowledge of a single administrator may also limit reliability. In some cases, the administrator was new to the program or position, or he/she had little to do with particular aspects of the program (e.g. assessments). When there appeared to be a major gap in the administrator's knowledge of a particular program aspect, an attempt was made to contact other program representatives. For the most part, however, the data administrators provided was simply recorded as it was presented.
The expenditure and caseload data has notable limitations. Whenever possible, this data was recorded for fiscal or calendar year 1984, but in two cases the programs could only provide figures from 1983 data, twenty-eight programs could only provide information for FY 1985, and three programs had only budget estimates and caseload goals for FY 1986. No attempt was made to convert these figures to 1984 levels using the consumer price index or other means. This particular data may also be skewed by the inability of some administrators to break out PAS recipients and program costs from total program caseloads and expenditures. For example, some Title III programs include a wide array of services unrelated to PAS. When the figures stated obviously included such services, they were dropped from the analyses. However, Title III programs on the average appear to have inflated caseloads despite this precaution.
The key validity issue is whether the concepts and definitions used in this study are sufficiently clear and precise. Ile definition of what constitutes a PAS program, and how this determination is made, is of primary importance. Identifying PAS programs and contacting administrators proved to be a difficult and time-consuming task. It is unlikely that all PAS programs in the U.S. which meet the stated criteria were contacted. Independent Living Programs (ILP's), Medicaid programs and social services departments were contacted in each state, and asked for a complete list of personal assistance programs and program administrators in that state. Each of these administrators was then contacted to determine if the program was a short-term (respite) program, or a long-term personal management/hygiene, household maintenance or attendant program. It is possible that some of the programs surveyed may in fact not meet either of these criteria. For example, distinguishing Medicaid HHA programs which target people who are chronically ill and in need of significant amounts of medical services on an intermittent basis from those programs which offer PAS on a long-term basis was difficult. The identification and inclusion of such programs were often based on the administrator's judgement as to whether his/her program actually fit the stated criteria. The opposite problem occurred with some program administrators who had a very narrow concept of attendant services, e.g. programs for disabled working age people who are employed or employable. In such cases the administrator had to be convinced that if, for example, the program only served older people for a few hours a week on a regular basis, that it was in fact an attendant service program.
It should also be noted that in some cases, the respondents indicated that there was a difference between what the program was supposed to do, according to regulations, and what the program actually did. For example, some programs which utilized independent providers did in fact offer paramedical services, despite regulation to the contrary. In order to avoid the discrepancy, the respondent was asked to report what was in the rules and regulations, but this may not have always occurred.
Results
Size of Program, Total Expenditures, Client Load, Expenditures PerClient, Total Hours of Service, Cost Per Hour of Service and Hours of Service Per Client
Size of program, total program expenditures, number of clients served, expenditures per client, total hours of service provided, cost per hour of service provided, and hours of service provided per client, were compared by funding source, utilizing analyses of variance (ANOVAs). Some significant relationships emerged, although there was often high variance within the six funding groups.
The average total number of clients per program differed significantly between groups; F (5,125) = 14.11, p .001. Title III programs had the highest average number of people (78,890,000) and Waiver programs had the lowest average number (1,920). The average expenditures per person per program varied significantly between groups; F (5,125) = 2.77, p .05. Medicaid Waiver programs had the highest mean expenditures per person ($4,810), while Title III programs had the lowest ($250). The average hours of service per person per week also varied significantly by funding source; F (5,68) = 4.77, p .001. State programs had the highest average weekly hours of service (26.4 hours per person), and Title III programs had the lowest (2.3 hours per person).
The total expenditures, total hours of assistance provided to all clients, and the cost per hour of assistance did not significantly vary between funding groups. Overall, PC-Option programs had the highest average total program expenditures, $35.72 million per program, and Medicaid Waiver programs had the lowest, $3.25 million. PC-Option programs also had the highest average cost per hour of service ($13.48/hour), while State programs had the lowest ($7.08/hour). Title XX programs provided the greatest average total hours of PAS (13,450,000) and State programs provided the lowest average total hours (210,000).
| TABLE B-2. Average Total Expenditures, Client Load, Expenditures Per Client, Total Hours of Service, Cost Per Hour of Service and Average Hours of Service Per Client | ||||||||
|---|---|---|---|---|---|---|---|---|
| Funding Source | TXIX- PC | TXIX- Waiver | SSBG | TIII | State | Other | Total | F |
| Average Annual Expenditures | ||||||||
| in $ millions | 35.72 | 3.25 | 14.24 | 7.11 | 4.91 | 12.14 | 11.86 | |
| Number of Responses | 19 | 28 | 31 | 17 | 30 | 13 | 138 | 1.36 |
| Average Total Clients | ||||||||
| in thousands | 7.77 | 1.92 | 9.10 | 78.89 | 3.25 | 3.93 | 13.54 | |
| Number of Responses | 18 | 35 | 32 | 16 | 27 | 12 | 140 | 14.13** |
| Average Annual Expenditures Per Client | ||||||||
| in $ thousands | 3.82 | 4.67 | 1.49 | 0.25 | 4.23 | 1.40 | 2.87 | |
| Number of Responses | 17 | 25 | 30 | 15 | 27 | 12 | 126 | 2.68* |
| Average Total Hours of Attendant Care | ||||||||
| in millions | 7.12 | 0.29 | 13.45 | 2.40 | 0.21 | 0.30 | 5.35 | |
| Number of Responses | 12 | 7 | 15 | 7 | 11 | 6 | 58 | 0.90 |
| Cost Per Hour of Service | ||||||||
| in dollars/hour | 13.48 | 8.01 | 7.36 | 12.41 | 7.08 | 8.47 | 9.38 | |
| Number of Responses | 12 | 6 | 14 | 6 | 11 | 6 | 55 | 0.43 |
| Average Hours Per Client Per Week | ||||||||
| in hours/week | 19.7 | 18.7 | 8.4 | 2.3 | 26.4 | 5.4 | 15.6 | |
| Number of Responses | 14 | 12 | 19 | 3 | 14 | 7 | 69 | 4.87** |
| * p 0.05; ** p 0.01. | ||||||||
Scope of Services Provided
The majority of all programs surveyed provided a core of basic services such as dressing, bathing, oral hygiene and grooming, feeding, transfers, ambulation, skin maintenance, bowl and bladder assistance, prosthesis/range of motion, medications, menstrual assistance, meal preparation, clean up and menus, light cleaning, laundry, shopping, chores, case management and escort (Table B-3).
| TABLE B-3. Scope of Services Provided | |||||||
|---|---|---|---|---|---|---|---|
| Funding Source | TXIX- PC | TXIX- Waiver | TXX | TIII | State | Other | Total |
| Personal Maintenance/Hygiene | |||||||
| Number of Responses | 20 | 37 | 32 | 18 | 29 | 11 | 147 |
| Percentage of Responses | |||||||
| Dressing | 100 | 100 | 94 | 94 | 100 | 100 | 98 |
| Bathing | 100 | 100 | 91 | 94 | 97 | 100 | 97 |
| Oral Hygiene and Grooming | 100 | 100 | 88 | 89 | 97 | 100 | 95 |
| Feeding | 100 | 100 | 94 | 78 | 100 | 100 | 94 |
| Transfers | 90 | 100 | 91 | 89 | 97 | 91 | 92 |
| Ambulation | 95 | 100 | 75 | 83 | 93 | 91 | 90 |
| Skin Maintenance | 95 | 97 | 72 | 67 | 90 | 91 | 86 |
| Bowl and Bladder Assistance | 95 | 92 | 50 | 72 | 86 | 82 | 79 |
| Prosthesis Assistance/Range Motion | 85 | 78 | 50 | 56 | 72 | 82 | 69 |
| Menstrual Assistance | 85 | 65 | 38 | 86 | 73 | 59 | |
| Medications | 70 | 68 | 41 | 61 | 66 | 82 | 62 |
| Respiration | 30 | 46 | 31 | 33 | 62 | 73 | 44 |
| Catheter Assistance | 35 | 49 | 28 | 39 | 52 | 73 | 44 |
| Injections | 25 | 49 | 22 | 39 | 41 | 73 | 39 |
| Household Assistance | |||||||
| Number of Responses | 17 | 38 | 37 | 20 | 29 | 8 | 145 |
| Percentage of Responses | |||||||
| Meal Preparation | 100 | 95 | 100 | 90 | 93 | 100 | 96 |
| Light Cleaning | 100 | 97 | 97 | 95 | 97 | 88 | 97 |
| Meal Clean-up/Menus | 100 | 95 | 100 | 90 | 93 | 100 | 96 |
| Laundry | 100 | 95 | 97 | 90 | 93 | 88 | 95 |
| Shopping | 88 | 87 | 97 | 100 | 90 | 88 | 92 |
| Chores | 35 | 58 | 73 | 95 | 76 | 75 | 68 |
| Heavy Cleaning | 41 | 47 | 49 | 60 | 62 | 63 | 52 |
| Repairs/Maintenance | 23 | 29 | 36 | 60 | 55 | 63 | 41 |
| Related Services | |||||||
| Number of Responses | 15 | 38 | 34 | 20 | 27 | 10 | 144 |
| Percentage of Responses | |||||||
| Transportation | 80 | 68 | 79 | 95 | 67 | 70 | 76 |
| Case Management | 73 | 87 | 59 | 75 | 67 | 60 | 72 |
| Escort | 80 | 55 | 65 | 50 | 48 | 40 | 59 |
| Telephone Counseling | 26 | 8 | 29 | 95 | 22 | 20 | 30 |
| Readers | 7 | 11 | 27 | 50 | 15 | 20 | 21 |
| Interpreters | 13 | 8 | 18 | 20 | 15 | 10 | 14 |
| Respite | 47 | 76 | 53 | 70 | 52 | 70 | 62 |
Services considered crucial to independent living were not provided by many of the programs surveyed. Roughly half of the PC-Option, Title XX and State programs did not provide respite assistance, while three quarters of Waiver programs offered respite. Important paramedical services such as respiration, catheter assistance and injections were not provided by most programs. A sum of all services provided in each program (maximum = 29), as well as a sum of specifically paramedical services (maximum = 4), were calculated as rough measures of comprehensiveness, and average scores for each funding group were compared (Table B-4). There were no statistically significant differences between funding groups on either of these measures, although the "Other" category, which included seven Medicaid HHA programs, had the greatest average scope of paramedical services, while state and Medicaid Waiver programs had the greatest average scope of total services.
| TABLE B-4. Average Number of Total Services and Paramedical Services Provided | |||||||
|---|---|---|---|---|---|---|---|
| Funding Source | TXIX- PC | TXIX- Waiver | SSBG | TIII | State | Other | Total |
| Number of Responses | 20 | 39 | 34 | 21 | 30 | 13 | 157 |
| Average Sum of Services | 19.7 | 20.6 | 18.8 | 19.6 | 21.0 | 17.4 | 19.8 |
| Average Sum of Paramedical Services | 1.6 | 2.0 | 1.1 | 1.5 | 2.1 | 2.5 | 1.8 |
Medical Supervision Requirements
The majority of Title XX programs did not require any medical supervision (Table B-5). Title XIX Personal Care-Option programs were most likely to require medical supervision for all services. Of the programs which specified frequency of medical supervision, most required a visit with a medical professional every one or two months (Table B-6).
| TABLE B-5. Medical Supervision Requirements | |||||||
|---|---|---|---|---|---|---|---|
| Funding Source | TXIX- PC | TXIX- Waiver | SSBG | TIII | State | Other | Total |
| Amount of Medical Supervision Required | |||||||
| Number of Responses | 20 | 37 | 32 | 19 | 30 | 12 | 150 |
| Percentage of Responses | |||||||
| None | 10 | 5 | 75 | 47 | 67 | 33 | 41 |
| For Some Services | 35 | 49 | 25 | 53 | 13 | 25 | 33 |
| For All Services | 55 | 46 | 20 | 42 | 26 | ||
| TABLE B-6. Frequency of Medical Supervision | |||||||
|---|---|---|---|---|---|---|---|
| Funding Source | TXIX- PC | TXIX- Waiver | SSBG | TIII | State | Other | Total |
| Frequency of Supervision | |||||||
| Number of Responses | 16 | 31 | 4 | 4 | 10 | 6 | 71 |
| Percentage of Responses | |||||||
| 1 mo. | 25 | 58 | 50 | 75 | 40 | 50 | 48 |
| 2 mo. | 38 | 23 | 25 | 17 | 21 | ||
| 3 mo. | 19 | 7 | 25 | 25 | 33 | 13 | |
| 6 mo. | 13 | 7 | 30 | 10 | |||
| 12 mo. | 6 | 7 | 30 | 9 | |||
Availability of Program Services
Most programs surveyed (71%) did not limit the times that services could be provided (table B-7). State programs were the least likely to limit availability (4%), while approximately 80% of Title III programs offered services less than 7 days a week and less than 24 hours a day.
| TABLE B-7. Days and Times Service is Available | |||||||
|---|---|---|---|---|---|---|---|
| Funding Source | TXIX- PC | TXIX- Waiver | SSBG | TIII | State | Other | Total |
| Days and Hours Services are Available | |||||||
| Number of Responses | 17 | 38 | 31 | 19 | 28 | 9 | 142 |
| Percentage of Responses | |||||||
| 24 hrs./day; 7 days/week | 82 | 90 | 58 | 11 | 96 | 67 | 71 |
| 24 hrs./day; 7 days/week | 6 | 3 | 3 | 11 | 4 | 11 | 5 |
| 24 hrs./day; 7 days/week | 12 | 8 | 39 | 79 | 22 | 24 | |
Service Limits
Although the majority of programs did not limit the days or times services were available, this did not mean that a person could receive around the clock assistance. About 23% of all programs limited the total number of hours of service per week, and another 30% limited expenditures per person.
These service limits were converted to a single measure: expenditure limits were converted to hour limits by dividing the weekly expenditure limit by the average attendant hourly wage ($4.02/hour). Seventy-one percent of PC-Option programs had some degree of service limit (Table B-8), usually limiting hours to less than 40 per week. The Medicaid Waiver programs had the most generous limits: 68% of the programs allowed over 40 hours per week. Title III programs generally did not limits hours of service, although these programs actually provided the lowest average number of hours per person. This apparently indicates that programs with "no limits" may not explicitly state a per person limit, but probably limit service by overall program budget allocation or some other means.
In general, there was no significant correlation between the stated service limits and the actual average hours of service provided per client. However, on a case by case basis, the higher service limit should allow for a greater amount of service to people who need it. Higher service limits were correlated with greater scope of paramedical services (r = .25, p .05) and total services (r = .25, p .05).
| TABLE B-8. Service Limits | |||||||
|---|---|---|---|---|---|---|---|
| Funding Source | TXIX- PC | TXIX- Waiver | SSBG | TIII | State | Other | Total |
| Hours/Week Limit | |||||||
| Number of Responses | 20 | 35 | 32 | 15 | 27 | 7 | 136 |
| Percentage of Responses | |||||||
| 20 | 20 | 8 | 25 | 19 | 29 | 17 | |
| 21 - 30 | 15 | 8 | 9 | 19 | 14 | 11 | |
| 31 - 40 | 10 | 3 | 13 | 33 | 14 | 13 | |
| Over 40 | 25 | 62 | 3 | 26 | 27 | ||
| No Limits | 30 | 21 | 50 | 100 | 4 | 43 | 32 |
Eligibility Requirements: Maximum Income and Assets
Income eligibility requirements (Table B-9) were generally most strict for PC-Option programs. Ninety percent of these programs required that the income of recipients be at or below the 1984 poverty level ($5,200/year for a single person in the continental US). State and Waiver programs tended to have less restrictive income limits. No Title Ill programs limited income or assets. Title XX and State programs had the least strict asset requirements (Table B-10), although the regulation of asset deductions varied greatly among individual programs (i.e. some programs considered only cash assets for eligibility, while other programs included a wide array of non-cash assets such as homes, cars, and insurance policies).
| TABLE B-9. Income Eligibility Requirements | |||||||
|---|---|---|---|---|---|---|---|
| Funding Source | TXIX- PC | TXIX- Waiver | SSBG | TIII | State | Other | Total |
| Maximum Income by Provider Levela | |||||||
| Number of Responses | 10 | 26 | 22 | 21 | 15 | 6 | 100 |
| Percentage of Responses | |||||||
| = or PL | 90 | 39 | 32 | 13 | 50 | 31 | |
| = or 200% PL | 10 | 19 | 50 | 40 | 50 | 26 | |
| over 200% PL | 42 | 18 | 47 | 23 | |||
| No limit | 100 | 21 | |||||
| |||||||
| TABLE B-10. Asset Eligibility Requirements | |||||||
|---|---|---|---|---|---|---|---|
| Funding Source | TXIX- PC | TXIX- Waiver | SSBG | TIII | State | Other | Total |
| Assetsa | |||||||
| Number of Responses | 11 | 28 | 4 | 21 | 7 | 5 | 75 |
| Percentage of Responses | |||||||
| = or $1,500 | 27 | 46 | 25 | 57 | 60 | 32 | |
| $2,000 | 18 | 46 | 25 | 20 | 22 | ||
| $4,500 | 55 | 4 | 9 | ||||
| $10,000 | 4 | 50 | 43 | 20 | 9 | ||
| No limit | 100 | 28 | |||||
| |||||||
Eligibility Requirements: Age
All Title III programs targeted older people (Table B-11). State programs and Title XX programs were more likely to target working-age adults. Four of the six programs directed exclusively at children were Waiver programs. Most PC-Option programs were open to people of all ages.
| TABLE B-11. Age Eligibility Requirements | |||||||
|---|---|---|---|---|---|---|---|
| Funding Source | TXIX- PC | TXIX- Waiver | SSBG | TIII | State | Other | Total |
| Age Groups Eligible | |||||||
| Number of Responses | 20 | 39 | 34 | 20 | 29 | 12 | 154 |
| Percentage of Responses | |||||||
| All Ages | 75 | 46 | 41 | 28 | 67 | 41 | |
| 65 | 9 | 28 | 7 | ||||
| 18 | 10 | 3 | 8 | 4 | |||
| > 18 | 20 | 28 | 38 | 30 | 8 | 25 | |
| > 60 or 65 | 5 | 15 | 9 | 100 | 14 | 17 | 23 |
Eligibility Requirements: Disability Group
Most PC-Option, Title XX, and Other programs considered all disability groups eligible (Table B-12). In contrast, only 34% of Waiver programs were open to all disability groups. Overall, 42% of all programs excluded people with mental retardation or other cognitive disabilities.
| TABLE B-12. Disability Group Eligibility | |||||||
|---|---|---|---|---|---|---|---|
| Funding Source | TXIX- PC | TXIX- Waiver | SSBG | TIII | State | Other | Total |
| Disability Groups Eligible | |||||||
| Number of Responses | 19 | 32 | 32 | 18 | 28 | 9 | 138 |
| Percentage of Responses | |||||||
| All Disabilities | 78 | 33 | 72 | 56 | 54 | 78 | 58 |
| Physical Disability Only | 6 | 12 | 16 | 18 | 11 | ||
| PD, Brain Injury Only | 11 | 42 | 9 | 39 | 25 | 22 | 25 |
| PD, BI, Cognitive Only | 6 | 12 | 3 | 6 | 4 | 6 | |
Other Eligibility Requirements
A number of other eligibility requirements were also stated (Table B-13). Most PC-Option programs required a physician's order for services. The most common requirement was that people be at risk of institutionalization: almost all Medicaid Waiver programs required this. Another common requirement was that the family of the consumer be unwilling or unable to provide assistance (half the Title XX programs required this). Some programs mandated that the recipient have a severe degree of disability (SSI definition), particularly the Medicaid Waiver programs. Residence in a specific area was considered a criterion for some programs. Other programs specify that the consumer be able to manage his/her own attendant (State programs seem particularly concerned with this). Less common criteria included requiring that a person be unable to use a specific number of limbs, or be a wheelchair user.
| TABLE B-13. Other Eligibility Requirements | |||||||
|---|---|---|---|---|---|---|---|
| Funding Source | TXIX- PC | TXIX- Waiver | SSBG | TIII | State | Other | Total |
| Other Eligibility Requirements | |||||||
| Number of Responses | 20 | 39 | 24 | 13 | 29 | 12 | 137 |
| Percentage of Responses | |||||||
| Risk of Institutionalization | 45 | 92 | 63 | 46 | 66 | 36 | 66 |
| Physician's Orders | 80 | 67 | 25 | 23 | 38 | 27 | 48 |
| Family Unable/Unwilling | 15 | 18 | 50 | 23 | 28 | 9 | 25 |
| Severe Disability | 5 | 36 | 13 | 17 | 18 | 19 | |
| Specific Geographic Area | 28 | 8 | 31 | 17 | 27 | 19 | |
| Able to Manage Own Attendant | 25 | 3 | 8 | 45 | 15 | ||
| Inability to Use Limbs | 5 | 4 | 31 | 0 | 8 | ||
| Wheelchair User | 10 | 4 | 7 | 4 | |||
| Specific Disability Group | 5 | 10 | 9 | 4 | |||
| Living Alone | 5 | 4 | 23 | 4 | |||
Provider Mode
Programs utilized one or more types of providers: independent providers (EPs), private agency workers, or local government workers (Table B-14). The numbers and percentages cited for each group include some duplication, because 42% of the programs utilized more than one provider mode. Overall, private agency workers were the most common provider type (62%), followed by independent providers (49%), and local government workers (44%). State programs were most likely to use independent providers (87%), followed by PC-Option programs. Most Waiver programs and all other programs utilized private agency workers, and these programs, along with Title XX programs, were also most likely to utilize local government workers.
| TABLE B-14. Provider Mode | |||||||
|---|---|---|---|---|---|---|---|
| Funding Source | TXIX- PC | TXIX- Waiver | SSBG | TIII | State | Other | Total |
| Provider Typea | |||||||
| Number of Responses | 20 | 39 | 34 | 21 | 30 | 12 | 156 |
| Percentage of Responses | |||||||
| Independent Providers | 60 | 41 | 47 | 47 | 87 | 33 | 49 |
| Private Agency Workers | 45 | 77 | 56 | 56 | 23 | 100 | 62 |
| Local Government Workers | 40 | 59 | 53 | 21 | 20 | 50 | 44 |
| |||||||
Attendant Wages and Benefits
When asked about attendant pay and benefits, some administrators could not provide specific data, particularly for private agency workers and local government workers who were compensated via a third party (ie. private agency or local government). When the administrator gave a wage or benefit range, the lower figure was used.
Generally, pay was low for most IPs (Table B-15); averaging only slightly more than minimum wage ($3.35/hour in 1985). Benefits for EPs (social security, unemployment compensation, transportation costs, sick leave, health insurance, vacation pay) were either low or nonexistent. Overall, an EP received roughly 80% of the wages and one third of the benefits that an average agency worker received, and only 78% of the wages and 15% of the benefits an average government worker received. The average wage of EPs ranged from $2.25 to $4.61 per hour, and the average number of benefits ranged from 0 to 1.2. There were no statistically significant differences between funding groups.
Agency workers received an average of $4.70/hour, with a range of $4.09 to $5.83 per hour, and received a number of benefits ranging from 0 to 7. There were no significant differences between funding soups.
Government workers received an average of $4.91/hour, with a range of $3.93 to $5.25 per hour, and received a number of benefits ranging from 0 to 7. There were no significant differences between funding soups.
| TABLE B-15. Average Attendant Wages and Benefits | ||||||||
|---|---|---|---|---|---|---|---|---|
| Funding Source | TXIX- PC | TXIX- Waiver | SSBG | TIII | State | Other | Total | F |
| Average Hourly Wage | ||||||||
| Independent Providers (n=64) | $3.89 | $4.61 | $3.26 | $3.50 | $3.80 | $2.25 | $3.82 | 1.16 |
| Agency Workers (n=62) | $5.12 | $4.60 | $4.12 | $5.51 | $4.77 | $4.20 | $4.70 | 1.12 |
| Government Workers (n=32) | $3.93 | $5.25 | $4.93 | $4.38 | $5.00 | $4.82 | $4.91 | 0.30 |
| Average # of Benefits | ||||||||
| Independent Providers (n=70) | 0.8 | 0.4 | 1.1 | 0.0 | 1.0 | 0.0 | 0.8 | 1.46 |
| Agency Workers (n=89) | 3.0 | 2.5 | 3.0 | 2.2 | 0.9 | 1.7 | 2.4 | 0.86 |
| Government Workers (n=41) | 5.0 | 5.4 | 5.2 | 5.2 | 7.0 | 4.2 | 5.2 | 0.43 |
Regulation of Independent Providers
Forty-one of the 77 programs which utilized IPs had some specific regulation on hiring (Table B-16). Title XIX PC-Option programs were most likely to regulate OPs. Overall, the regulation was minimal; the most common requirement was that the attendant be over 18.
| TABLE B-16. Independent Provider Regulation | |||||||
|---|---|---|---|---|---|---|---|
| Funding Source | TXIX- PC | TXIX- Waiver | SSBG | TIII | State | Other | Total |
| Independent Provider Regulation | |||||||
| Number of Responses | 9 | 9 | 9 | 2 | 12 | 0 | 41 |
| Percentage of Responses | |||||||
| Attendant Over 18 | 89 | 44 | 78 | 50 | 58 | 66 | |
| Attendant Has Training | 33 | 56 | 67 | 100 | 42 | 51 | |
| Client Capable of Supervising | 44 | 44 | 56 | 67 | 51 | ||
| Consumer Requests IP | 67 | 56 | 44 | 50 | 51 | ||
Circumstances Under Which Family Members May Become Paid Attendants
Forty-one of the programs surveyed allowed family members to become providers in some limited circumstances (Table B-17). Six PC-Option programs allowed family members to become paid attendants in some circumstances, despite the exclusion of family providers in Medicaid regulation.
| TABLE B-17. Regulation on Family Members Providing Paid Attendant Services | |||||||
|---|---|---|---|---|---|---|---|
| Funding Source | TXIX- PC | TXIX- Waiver | SSBG | TIII | State | Other | Total |
| Under What Conditions Can a Family Member Become a Paid Provider? | |||||||
| Number of Programs Which Allow Family Members to Become Paid Providers | 6 | 9 | 12 | 0 | 13 | 1 | 41 |
| Percentage of Responses | |||||||
| If Not at Same Residence | 17 | 11 | 25 | 15 | 100 | 19 | |
| If Not Legal Guardian | 33 | 44 | 33 | 15 | 26 | ||
| If No One Else is Available | 33 | 22 | 33 | 15 | 23 | ||
| If No One Else is Capable | 33 | 44 | 33 | 15 | 28 | ||
| Other Circumstances | 67 | 67 | 67 | 85 | 74 | ||
The Impact of Provider Mode on Consumer Control and Average Hours of Service Provided
Independent providers (IPs) are considered the preferred provider mode from an independent living perspective, in that consumers have a far greater level of control with IPs. In a previous analysis with this data set, programs which utilized IPs were found to be far more likely to allow the consumers to train, hire, fire and/or pay their attendants (Litvak, Zukas and Heumann, 1987). This pattern was also evident among each of the funding groups in the present analysis. Overall, there was a significant relationship found between provider type and average hours of service; F (5, 68) = 3.87, p .0 1. IPs provided the highest average hours of service (25 hours/week), and government workers provided the lowest (3 hours/week).
Program Age
The average age of programs (Table B-19) differed significantly between funding groups; F (5,144) = 10.59, p .001. PC-Option programs were an average of 8.4 years old. Title III programs were the oldest (12.1 years) and Medicaid Waiver Programs were the newest (2.2 years). Overall, almost half of the programs surveyed were less than five years old.
| TABLE B-18. Average Program Age | ||||||||
|---|---|---|---|---|---|---|---|---|
| Funding Source | TXIX- PC | TXIX- Waiver | SSBG | TIII | State | Other | Total | F |
| Average Number of Years Program Has Existed | ||||||||
| Number of Responses | 19 | 36 | 30 | 20 | 30 | 10 | 145 | |
| Percentage of Responses | ||||||||
| 8.4 | 2.2 | 10.2 | 12.1 | 5.8 | 10.0 | 7.3 | 11.39** | |
| ** p 0.001. | ||||||||
In general, the scope of total services was inversely correlated with program age, i.e. older programs offered fewer services; r = -.2 1, p .05. Service limits were also inversely correlated with program age, i.e. older programs had lower limits; r =-.24, p .05. Provider mode varied with program age; F (5,144) = 3.52, p .01. Older programs were more likely to utilize private agency and government workers, newer programs were more likely to utilize independent providers.
Discussion
The present study reveals some basic patterns among personal assistance programs, but it also highlights the need for more specific and detailed research. Funding source was found to impact a wide range of variables, i.e. number of clients, expenditures per client, average weekly hours of service provided, medical supervision requirements, service availability, service limits, eligibility requirements, and attendant training requirements. With other variables, the high degree of within group variance overwhelmed the influence of funding source, i.e. program expenditures, and total hours of service. In other words, individual programs within a given funding stream tended to differ from each other as much as they differed with programs from other funding streams on some variables. It is therefore difficult to create a profile of the "average" program within a funding source. A few general observations, however, can be made.
PC-Option programs were among the largest programs surveyed. They had average annual expenditures of $32,460,000 per program and served an average of 7,090 people. The average cost per hour of assistance was relatively high. They offered a basic core of services, but, in some cases, there were important limitations on the types of services provided. Many programs failed to offer paramedical services such as catheterization, even though attendants could be trained for these services in other programs. Only 35% offered respite services. Most programs limited services to less than 40 hours per week. They required medical supervision more frequently and more intensively than other funding groups. These programs are clearly intended for poor people with disabilities, and as such were the least likely to encourage employment. Of the programs reporting financial limits, 83% required income to be below the 1985 poverty level. They were likely to include people of all ages and all disabilities. They used independent providers and private agency workers with equal frequency.
Medicaid Waiver programs generally served the smallest number of people, had the smallest total budgets, and offered the largest variety of services. They are the newest PAS programs, an average of 2.2 years old. These programs were most likely to offer respite services, and tended to utilize contract agency providers and/or local government workers. They targeted people with the severest disabilities, often targeted specific disabilities, and spent the most per person. This is in keeping with the Medicaid Waiver mandate to serve those most at risk of institutionalization. They were also more likely to target specific age groups. A subset of these programs, the "Katie Beckett" waivers, targeted children with severe disabilities who would otherwise be institutionalized. Most Waiver programs specified risk of institutionalization as a primary eligibility requirement, and these programs usually required medical supervision.
Title XX programs were the least likely to require medical supervision. These programs had comparatively high average caseloads; and expenditures, and relatively low expenditures per client. They provided the greatest total hours of service, but were the least likely to provide paramedical services. These were among the oldest programs contacted, an average of 10.2 years old.
Title III programs were the oldest programs (an average of 12.1 years). They served the most people and had the highest average cost per hour of service, but spent the least per person and provided the least amount service per person, suggesting that their function is to supplement existing informal support systems (i.e. family and friends). For many Title III programs, personal assistance services constitute a small part of total program expenditures, and administrators had difficulty separating PAS expenditures and caseloads from other program services. In keeping with provisions of the Older Americans Act, all services were directed to people over 65 without income restrictions. These programs were most likely to limit the times services were available.
State programs provided the greatest average number of hours of service per person and had the lowest average cost per hour of service. These programs had relatively small caseloads and budgets. They usually did not require medical supervision, and were most likely to utilize independent providers. State programs were the most likely to encourage employment of recipients. These were among the newer programs surveyed (an average of 5.8 years old), and often were developed to fill gaps between federal programs.
The "Other" programs, consisting largely of home health aide programs, provided the highest level of paramedical services. They all used private agency workers, and half also used local government workers. They also had relatively strict income and asset requirements, but were usually open to people of all ages and disabilities.
Across all funding streams, service providers received low wages and few benefits. In relative terms, agency workers received slightly higher wages and substantially more benefits than independent providers, and government workers were generally the best paid and received the most benefits. It would, therefore, seem logical to conclude that independent providers would be the most cost-effective provider mode. Surprisingly, this was not the case: no significant relationship was found between provider mode and cost per hour of service. These findings must be regarded as tentative, since the cost per hour of service figures used were very general (i.e. total hours of service divided by total program expenditures), and could only be calculated for a third of the programs surveyed. Perhaps the administrative costs of maintaining and coordinating a pool of independent providers may, in fact, negate much of the apparent cost reduction. Although the present research is unable to provide explicit data on the relationship of provider mode and cost-effectiveness, this clearly is an important policy area which merits closer investigation on a program by program basis.
Preliminary analyses suggest that the different provider types perform essentially the same range of services, despite presumed differences in the skill level of providers. This is consistent with the position of the independent living movement that the majority of skills necessary for attendant services are relatively basic, and can be learned on the job with a sufficiently trained consumer. Average weekly hours of service did vary significantly by provider type, i.e. independent providers provided the highest average hours of service and government workers provided the lowest. Overall, consumers are much more likely to hire, fire, train and pay independent providers than other types of providers. These findings suggest that there are good reasons to utilize independent providers from a consumer perspective, regardless of the cost-effectiveness issue.
Almost 50% of the programs surveyed in 1984 were less than 5 years old, a fact which suggests that both the need for PAS and the political awareness of that need had grown dramatically in the early 80's. Much of this growth may also be related to the rise in long-term care costs; PAS is a cost-effective alternative to nursing homes for many individuals. Most programs explicitly state this rationale by requiring that eligible individuals be at risk of institutionalization. The other reason for this growth in PAS programs may be the increasing influence of the disability movement. It was hypothesized that newer programs would be more influenced by the independent living movement and advocacy groups, and that this would translate into more responsive and comprehensive programs. A general pattern of findings did emerge from the analysis of program age, apart from the obvious relationship between funding source and program age (i.e. older funding sources have older programs). Newer programs were more likely to use IPs, provide a greater range of services, and have higher service limits. All of these factors could be considered positive indications that new programs are responding to some of the concerns voiced by the independent living movement.
The present research indicates that funding source has an impact on programs, particularly if the legislation authorizing this funding contains explicit guidelines on eligibility or other key program features. However, many crucial policy decisions (about how the program will be structured, what services will be provided, when they will be provided, and who will receive them) are probably made in response to the political context of the individual state. Variables such as the state tax base, the strength and position of state political groups (e.g. the nursing home lobby, the independent living movement and other disability and advocacy groups, etc.), state demographics (e.g. rural and metropolitan populations, the number of disabled and elderly persons, ethnic composition, etc.), are probably more important than funding source in shaping individual program features. An explicit analysis of the historical and political context of individual programs is probably the most effective way to understand these programs. This would require a different methodology in which more open-ended questions could be asked of a number of informants.
Clearly the next step in this research area is identification and in-depth study of individual programs of particular theoretical interest.8 To move beyond the general outlines provided here, a greater volume of information from a variety of perspectives is needed. Site visits should be conducted to collect all available regulatory data, caseload information and financial summaries (although lack of accurate and detailed management information systems may present the same methodological problems as in the present study). Future research will also need to be more comprehensive in terms of people interviewed. In this survey, reliance on a single administrator and a single measurement was an economically necessary procedure. However, it failed to address key program factors (e.g. availability, eligibility, scope and frequency of services) from the perspective of consumers, advocates, and providers. Representatives of each of the involved groups will need to be identified and contacted in future research projects. Finally, the measures will need to be more open-ended, so that unique features of individual programs can be identified.
This study does not single out programs which merit intensive study, but it does provide a starting point by identifying important variables. The influence of provider mode on consumer control and cost-effectiveness is clearly an important policy issue, and programs which utilize different provider modes should be compared. The age of the population served also appears to be a key variable. Programs targeting working adults, elderly people, and people of all ages could be contrasted in future research. The independent living score may also be a good way to select programs which apparently respond to consumer needs, but the actual impact of these programs on the independence of consumers will need to be examined on a case by case basis. More specific indices such as average hours of service provided per person or expenditures per person may also be appropriate in selecting programs for further study.
The expanding elderly population, the rising costs of institutional care, and the growing demand for services which maximize independence, all assure a growing interest in personal assistance services. The identification and analysis of programs which adequately address the needs of consumers in a cost-effective manner is a necessary evolution of this research.
APPENDIX C: CHARTBOOK OF PROGRAM COMPARISONS BY FUNDING SOURCE ON 1988 NATIONAL SURVEY DATA
Introduction
The following data is derived from the World Institute on Disability's (WID) second nationwide survey of government-funded programs for people of all ages with disabilities which offer personal maintenance and/or household/domestic service on a long-term basis or short-term (respite) basis. The survey was mailed in the spring of 1989, and state administrators of Personal Assistance Service (PAS) Programs were asked to provide information for calendar or fiscal year 1988. This document is intended as a summary text of major 1988 program features of PAS programs as a whole and by primary funding source. It provides brief descriptions of major findings in key program areas, followed by detailed tables and figures.
Hypotheses
WID's first 1984 survey and resulting monograph, Attending to America: Personal Assistance for Independent Living (Litvak, Heumann and Zukas, 1987), provided an overview of personal assistance programs throughout the United States. It also highlighted the lack of a comprehensive federal policy and integrated funding for personal assistance services (PAS), which led to a basic research issue: how do the various funding sources (and their concomitant regulation) affect the design of these programs? The present study addresses this issue by grouping the 132 programs surveyed into six groups, based on their primary source of federal funding (although all programs supplement the federal funds with state revenues). These groups are then compared on the critical program variables, in order to answer the following research questions:
-
How does funding source impact the size of the PAS program, in terms of program expenditures, caseloads, and hours of service provided?
-
Does funding source effect the allocation of services? Is there a difference in hours of service or dollars expended per consumer?
-
Do eligibility requirements vary by funding source?
-
Do different funding sources offer different types of services?
-
Are the days and times services are available impacted by funding source?
-
Are some funding source groups more likely than others to limit the amount of service a consumer may receive? Is there a difference in how much the programs limit service?
-
What is the relation of funding source and medical supervision requirements?
-
Does funding source influence the type of providers used, or the pay and benefits providers receive?
-
Does funding source relate to the amount of consumer control built into program regulations?
Methodology
Questionnaire Design
A mail survey questionnaire was developed which was similar, but not identical, to that used in WID's nationwide 1985 survey of PAS programs (see end of report for copies of each questionnaire). Questionnaires in both 1985 and 1988 focused primarily on basic descriptive data, i.e. number of recipients served, program expenditures, hours of service provided, type of service provided, program regulations. There were slight differences in the content of the two surveys. Some of the items used in 1985 were qualified to make finer distinctions, e.g., provider types were were more specifically categorized, additional services were listed, hours of service were broken down by type. Other items which had very low response rates were dropped from the survey entirely, e.g., consumer control options for agency or government providers, demographic breakdowns for populations served. A somewhat longer questionnaire was developed in 1989 for programs not previously surveyed, in order to obtain additional data from these programs. All program administrators were also asked if there, had been any substantial change with regard to various program features since 1985. Questionnaire items were pre-tested with the 16 programs included in the case studies done by Litvak et. al.(1990). The pre-test of the questionnaire was completed in December of 1988, and the final draft of the questionnaire was ready by January of 1989.
Survey Procedure
The mailing of the questionnaire was completed in February of 1989. In order to maximize the return rate, additional copies of the questionnaires and follow-up letters were mailed, and reminder phone calls were made throughout the remainder of 1989 and into 1990. An effort was made to get surveys from each program funded by the Medicaid Personal Care Option. Several types of programs were not included in this (or the 1984) survey. Protective service programs (those aimed at preventing abuse or neglect of adults and children) were only included if these programs served people on a long-term basis. Programs targeted exclusively for people with mental illness or mental retardation were not included. Temporary services for people who are acutely ill or for those in transition from the hospital, nursing home or institution to the community were also not included. In addition, shared attendant programs in congregate living arrangements were not included. The PAS programs which were contacted came from three different sources:
-
The 157 programs which were surveyed by WID in 1985.
-
19 programs contacted by WID in 1985 which were either unwilling or unable to respond at that time.
-
A list of 58 Medicaid Waiver programs for children, disabled, and elderly received from the National Association of Developmental Disability Councils.
Response Rate
After two mailings and six months of follow-up phone calls, 132 questionnaires were received (see end of Appendix D for a complete list of 1984 and 1988 questionnaires). Of these, 26 (20%) were from programs not previously contacted, and 106 (80%) were from programs WID had interviewed in 1985. Several of the questionnaires received represented 2 or more programs interviewed separately in 1985, so a total of 117 programs interviewed in 1985 were accounted for in the 1989 survey. This constitutes a 75% return rate for the PAS programs contacted in 1984.
Despite the extensive follow-up procedures used, there is no definitive account as to why 25% of the programs responding in 1985 failed to respond in 1989. However, the reasons identified for some of these programs are probably representative. During the follow-up phone calls, one program administrator interviewed in 1985 simply refused to complete the 1989 survey, and it is likely that some other administrators also decided not to invest the time required to complete our questionnaire. Twelve other programs were found to be completely defunct or to no longer offer PAS.
Reliability
The survey is intended to gather specific information based primarily on objective, written data from program regulations and annual budgets and reports. However, state management information systems (MIS) varied tremendously in level of sophistication, methods of collecting and categorizing data, and the types of data collected. Many Title III programs, for example, include a wide array of services unrelated to PAS (e.g. home-delivered meals and adult day care), but keep records only on total units of service provided in each county. The caseloads for these programs were therefore generally inflated, and many cases had to be dropped from the analyses.
The low response rate on particular items suggests that the data requested is not easily placed into the stated categories. For example, there was a high percentage of missing data on consumer income eligibility requirements. This may be due to the variety of income and asset deduction allowances in the programs which made a single figure difficult to derive.
Despite the objective nature of the data requested, the reliance on the knowledge of a single administrator may also limit reliability. In some cases, the administrator was new to the program or position, or he/she had little to do with particular aspects of the program (e.g. assessments). When there appeared to be major gaps in questionnaire responses, researchers attempted to contact other program representatives to supplement or verify the data provided. For the most part, however, the data administrators provided was simply recorded as it was presented.
The expenditure, hour, and caseload data has specific limitations. Whenever possible, this data was recorded for fiscal or calendar year 1988, but in some cases the programs could only provide figures from fiscal or calendar 1987 or 1989 data. No attempt was made to convert these figures to 1988 levels using the consumer price index or other means.
Validity
The key validity issue is whether the concepts and definitions used in this study are sufficiently clear and precise. The definition of what constitutes a PAS program, and how this determination is made, is of central importance. For example, distinguishing Medicaid home health programs which target people who are, acutely ill and in need of significant amounts of medical services on an intermittent basis from those programs which offer PAS on a long-term basis was quite difficult (at least one program surveyed in 1984 and analyzed with that data set was discovered to be a short-term home health program when contacted again in 1988). The identification and inclusion of such programs were often based on the administrator's judgement as to whether his/her program actually fit the stated criteria. The opposite problem occurred with some program administrators who had a very narrow concept of attendant services (i.e. programs for disabled working age people who are employed or employable). In these cases, the administrator had to be convinced that if, for example, the program only served older people for a few hours a week on a regular basis, it was in fact an attendant service program.
The validity of the funding source groups is not certain. Programs were originally grouped by primary federal funding source into twelve categories, but in order to have groups large enough for meaningful statistical analysis, these were collapsed into six categories. The "Other" category in particular became a catch-all for programs that could not be placed into the other five categories. Analyses of Variance (ANOVAs) on most variables consistently showed enormous within group variance, which indicates that program funding source in general was much less important than the individual political, economic and administrative context within the states (a premise borne out by the subsequent site visits conducted by WID).
These categories appeared even more tenuous when 1984 and 1988 surveys were compared. For example, nine programs had apparently switched funding source between 1984 and 1988, and these programs could not be included in the 1984 to 1988 comparisons by funding source group. In three of these cases, the administrators no longer reported Title XX funding as distinct from state funds, in another case TXX funds were not distinguished in 1984. It is possible that other programsin this data set may be incorrectly categorized, or that the categories themselves are not sufficiently defined.
Eight questionnaires were received which seemed to indicate that the state had consolidated a number of programs which had been interviewed separately in 1984. When WID visited one of these states, the researchers found that although the state continued to have two distinct programs, only one questionnaire had been filled out because the same department administered both of the programs. Other questionnaires counted in these analyses as a single program may also be aggregate reports of several programs.
Given these data limitations, the following analyses must be viewed primarily as summaries of general trends. The study strongly suggests that funding source category by itself is not a valid predictor of specific program features.
I. Programs Surveyed: Location and Funding Source
One hundred and thirty two programs from 49 states responded to the survey in 1988 (Table C-1). These programs were grouped into six major categories: 1) TXIX-PC: programs funded exclusively by the Medicaid Personal Care Option, or those funded primarily by the Title XIX PC-Option, but have other sources of federal funding as well (n=24). 2) Waiver: programs funded by Title XIX waivers (n=31). 3) SSBG; programs funded by Title XX of the Social Security Act or the Social Services Block Grant (n=24). 4) TIII: programs funded by Title III of the Older Americans Act (n=13). 5) State: programs funded exclusively by state resources; programs which provide state supplements for PAS directly to Social Security Insurance (SSI) recipients; or programs that are funded by state resources, with some Title VII funds (n=27). 6) Other: programs funded by more than one source of non-Medicaid federal funding (primarily Title III and SSBG), programs funded by Title XIX home health funds, or programs are funded by Title XIX home health funds and other federal funds (n=13). The number of programs in each funding group are shown in Figure C-1.
| TABLE C-1. Programs Surveyed by Location and Funding Source Group | |||||||
|---|---|---|---|---|---|---|---|
| State | TXIX- PC | TXIX- Waiver | SSBG | TIII | State | Other | Total |
| AK | 1 | 1 | |||||
| AL | 1 | 2 | 3 | ||||
| AR | 1 | 1 | 2 | ||||
| AZ | 1 | 1 | 2 | ||||
| CA | 2 | 1 | 1 | 4 | |||
| CO | 1 | 1 | 1 | 1 | 4 | ||
| CT | 1 | 2 | 2 | 5 | |||
| DE | 0 | ||||||
| FL | 1 | 1 | 2 | 1 | 5 | ||
| GA | 1 | 1 | |||||
| HI | 1 | 1 | 1 | 3 | |||
| ID | 1 | 1 | 2 | ||||
| IL | 2 | 2 | |||||
| IN | 1 | 2 | 3 | ||||
| IA | 1 | 1 | 1 | 3 | |||
| KS | 1 | 1 | 2 | ||||
| KY | 2 | 1 | 3 | ||||
| LA | 0 | ||||||
| ME | 1 | 1 | 2 | ||||
| MD | 1 | 1 | 1 | 1 | 4 | ||
| MA | 1 | 1 | 1 | 3 | |||
| MI | 1 | 1 | 2 | ||||
| MN | 1 | 1 | 1 | 1 | 4 | ||
| MS | 1 | 1 | |||||
| MO | 1 | 1 | 2 | ||||
| MT | 1 | 1 | |||||
| NE | 1 | 1 | 1 | 3 | |||
| NV | 1 | 2 | 1 | 4 | |||
| NH | 1 | 1 | 2 | ||||
| NJ | 1 | 2 | 3 | ||||
| NM | 2 | 1 | 3 | ||||
| NY | 2 | 2 | |||||
| NC | 1 | 1 | 1 | 3 | |||
| ND | 1 | 1 | |||||
| OH | 1 | 1 | 1 | 3 | |||
| OK | 1 | 1 | 1 | 3 | |||
| OR | 1 | 1 | |||||
| PA | 2 | 1 | 1 | 4 | |||
| RI | 1 | 1 | 1 | 3 | |||
| SC | 1 | 1 | 2 | ||||
| SD | 1 | 2 | 3 | ||||
| TN | 1 | 1 | |||||
| TX | 1 | 1 | 2 | 1 | 1 | 6 | |
| UT | 1 | 2 | 1 | 4 | |||
| VT | 1 | 3 | 4 | ||||
| VA | 1 | 1 | |||||
| WA | 1 | 1 | 1 | 3 | |||
| WV | 1 | 1 | 2 | ||||
| WI | 2 | 2 | |||||
| WY | 1 | 1 | 2 | ||||
| DC | 1 | 1 | 1 | 3 | |||
| Totals | 24 | 31 | 24 | 13 | 27 | 13 | 132 |
| FIGURE C-1. Programs Surveyed by Funding Source Group |
|---|
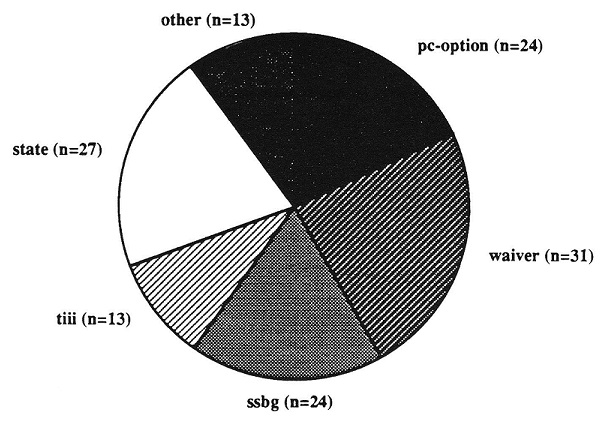 |
II. Program Expenditures
Annual program expenditures for PAS in 1988 averaged about $24 million (Table C-2 and Figure C-3), but varied markedly between and within funding sources (Figure C-2). TXIX-PC programs tended to have the highest service expenditures per program, with almost half of the programs spending over $10,000,000 in 1988. Two TXIX-PC (New York, Texas), one SSBG and one Waiver program spent over $100,000,000 on PAS in 1988. The SSBG programs on the average had relatively high service expenditures, while the State programs had the lowest average expenditures.
| TABLE C-2. 1988 PAS Expenditure Level Per Program and Average Expenditures Per Program by Funding Source Group | |||||||
|---|---|---|---|---|---|---|---|
| Funding Source | TXIX- PC | TXIX- Waiver | SSBG | TIII | State | Other | Total |
| Number of Programs | 23 | 29 | 22 | 10 | 26 | 10 | 120 |
| Percentage of Programs | |||||||
| 1988 PAS Expenditure Level per Program | |||||||
| $100,000 | 10 | 5 | 12 | 6 | |||
| $100,000 - $500,000 | 13 | 14 | 5 | 10 | 27 | 10 | 14 |
| $500,001 - $1,000,000 | 4 | 3 | 5 | 10 | 8 | 5 | |
| $1,000,001 - $5,000,000 | 17 | 24 | 36 | 40 | 35 | 40 | 30 |
| $5,000,001 - $10,000,000 | 17 | 14 | 27 | 30 | 8 | 20 | 18 |
| $10,000,001 - $100,000,000 | 39 | 31 | 18 | 10 | 12 | 30 | 24 |
| > $100,000,000 | 9 | 3 | 5 | 3 | |||
| Average 1988 Expenditures Per Program (in $ million) | 72.51 | 13.39 | 27.87 | 6.13 | 2.68 | 7.99 | 24.00 |
| FIGURE C-2. 1988 PAS Expenditure Level Per Program by Funding Source Group |
|---|
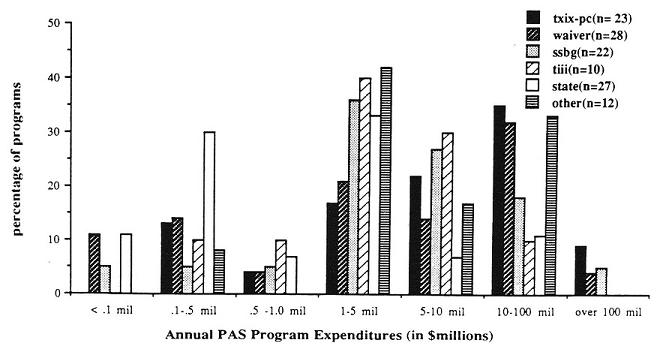 |
| FIGURE C-3. 1988 PAS Average Expenditures Per Program by Funding Source Group |
|---|
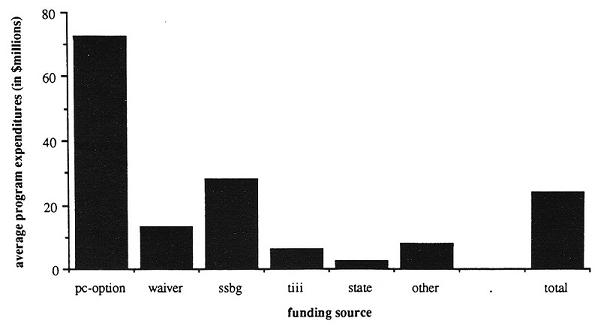 |
III. Program Caseloads
The PAS programs surveyed in 1988 served an average of almost 15,000 people per program (Table C-3 and Figure C-5), but this varied among and between funding sources (Figure C-4). TIII and SSBG programs served the most people on the average. The TIII caseloads may be inflated by clients receiving services other than PAS. State and Waiver programs served the least people on average (although one Waiver program served over 50,000 clients in 1988).
| TABLE C-3. 1988 Caseload Level and Average Caseloads Per Program by Funding Source Group | |||||||
|---|---|---|---|---|---|---|---|
| Funding Source | TXIX- PC | TXIX- Waiver | SSBG | TIII | State | Other | Total |
| Number of Programs | 23 | 30 | 23 | 6 | 24 | 11 | 116 |
| Percentage of Programs | |||||||
| Size of Program Caseload | |||||||
| 0 - 200 | 9 | 37 | 9 | 58 | 25 | ||
| 201 - 1,000 | 23 | 10 | 17 | 17 | 13 | 18 | 16 |
| 1,001 - 5,000 | 27 | 37 | 39 | 17 | 45 | 30 | |
| 5,000 - 10,000 | 9 | 7 | 17 | 8 | 9 | ||
| 10,001 - 50,000 | 27 | 7 | 9 | 67 | 4 | 36 | 16 |
| Over 50,000 | 5 | 3 | 9 | 17 | 4 | ||
| Average 1988 Caseloads Per Program (in thousands) | 10.77 | 5.80 | 36.58 | 53.94 | 1.43 | 11.00 | 14.92 |
| FIGURE C-4. 1988 Caseload Level Per Program by Funding Source Group |
|---|
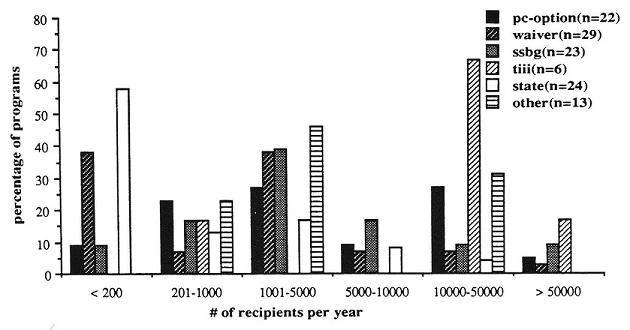 |
| FIGURE C-5. Average 1988 Program Caseload by Funding Source Group |
|---|
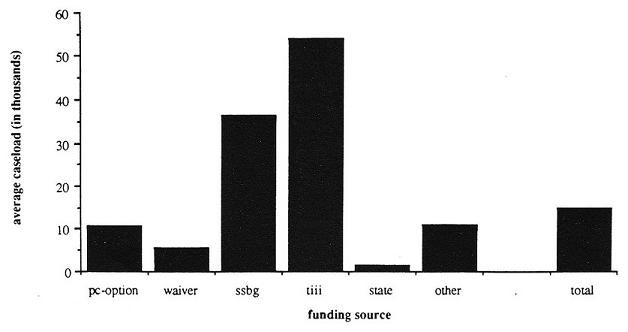 |
IV. Total Hours of Service Provided
The TXIX-PC and SSBG programs on the average provided over 14 million hours of PAS in 1988, while the State programs provided the least (Table C-4 and Figure C-6 and Figure C-7). The response rate was fairly low on this item, suggesting that states vary in the degree to which they track individual units of service.
| TABLE C-4. Average Total Hours of PAS Provided and Hour Level by Funding Source Group | |||||||
|---|---|---|---|---|---|---|---|
| Funding Source | TXIX- PC | TXIX- Waiver | SSBG | TIII | State | Other | Total |
| Number of Programs | 11 | 12 | 9 | 4 | 14 | 7 | 57 |
| Percentage of Programs | |||||||
| Total Hours of PAS Provided | |||||||
| 0 - 20,000 | 27 | 25 | 11 | 14 | 16 | ||
| 20,001 - 100,000 | 9 | 33 | 25 | 29 | 14 | 19 | |
| 100,001 - 500,000 | 27 | 8 | 22 | 0 | 50 | 43 | 28 |
| 501,000 - 1,000,000 | 17 | 33 | 25 | 7 | 12 | ||
| 1,000,001 - 5,000,000 | 18 | 8 | 11 | 25 | 43 | 14 | |
| Over 5,000,000 | 18 | 8 | 22 | 25 | 11 | ||
| Average Total Hours of PAS (in millions) | 14.71 | 1.39 | 14.46 | 2.43 | 0.18 | 0.97 | 5.75 |
| FIGURE C-6. Annual Hours of Service Level of Funding Source Group |
|---|
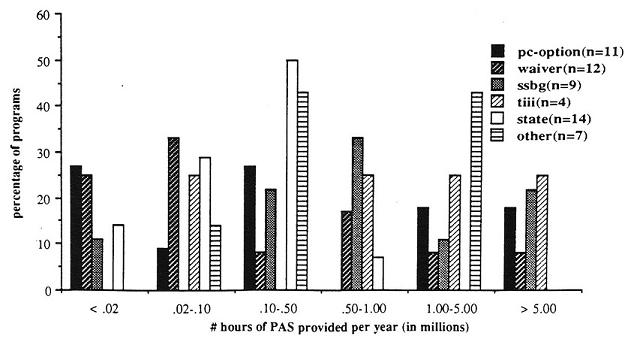 |
| FIGURE C-7. Average Total Hours of Service Provided by Funding Source Group |
|---|
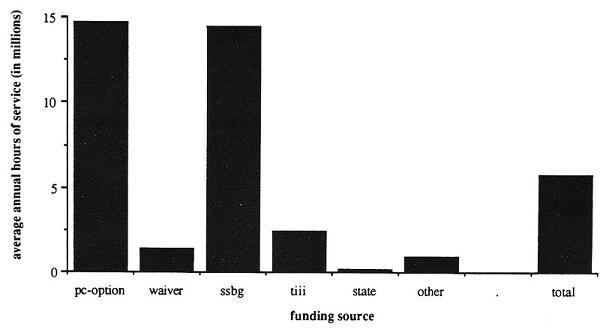 |
V. Average Expenditures PerRecipient
The Waiver and State programs on the average spent the most per recipient (Table C-5 and Figure C-8). THI programs spent the least per client, but this must be interpreted in light of the potentially inflated caseloads for this group.
| TABLE C-5. Average Annual Expenditures Per Recipient by Funding Source Group | |||||||
|---|---|---|---|---|---|---|---|
| Funding Source | TXIX- PC | TXIX- Waiver | SSBG | TIII | State | Other | Total |
| Number of Programs | 22 | 29 | 21 | 5 | 22 | 9 | 108 |
| Percentage of Programs | |||||||
| Average Annual Expenditures Per Recipient (in $ thousands) | 3.86 | 7.02 | 2.70 | 0.12 | 5.02 | 1.63 | 4.36 |
| FIGURE C-8. Average Annual Expenditures Per Recipient by Funding Source Group |
|---|
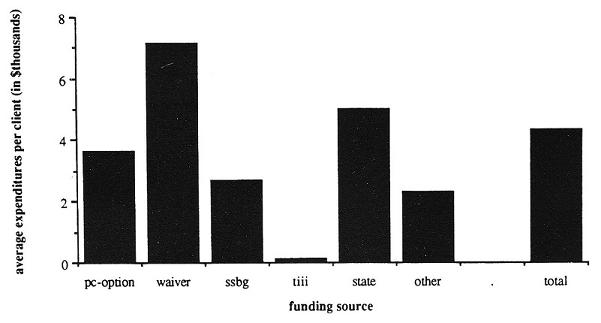 |
VI. Average Hours of PAS Per Recipient
The Waiver and State programs on the average provided the most hours per recipient (Table C-6 and Figure C-9). TXIX-PC, SSBG and Other programs provided less hours per client, and TIII programs provided the least hours per client (this latter figure must again be viewed in light of potentially inflated caseloads for TIII programs).
| TABLE C-6. Average Hours of PAS Per Week Per Recipient by Funding Source Group | |||||||
|---|---|---|---|---|---|---|---|
| Funding Source | TXIX- PC | TXIX- Waiver | SSBG | TIII | State | Other | Total |
| Number of Programs | 10 | 10 | 12 | 4 | 14 | 8 | 57 |
| Percentage of Programs | |||||||
| Average Hours Per Recipient Per Week (in hours/week) | 14.4 | 27.4 | 9.3 | 1.6 | 26.0 | 5.1 | 16.4 |
| FIGURE C-9. Average Hours of PAS Per Week Per Recipient by Funding Source Group |
|---|
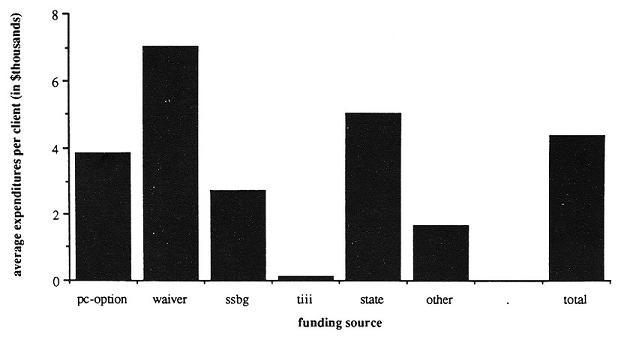 |
VII. Income Eligibility Requirements
Twenty one percent of all programs limited eligibility to people whose income fell below the 1987 poverty level (Figure C-10). Most TXIX-PC programs were eligible only to people below the poverty level or very close to it. State, SSBG and Waiver programs tended to set somewhat more generous income eligibility limits, and the Title III programs had no income eligibility restrictions (Table C-7).
| TABLE C-7. Income Eligibility Requirements by Funding Source Group | |||||||
|---|---|---|---|---|---|---|---|
| Funding Source | TXIX- PC | TXIX- Waiver | SSBG | TIII | State | Other | Total |
| Number of Programs | 21 | 27 | 23 | 10 | 22 | 10 | 113 |
| Percentage of Programs | |||||||
| Maximum Income by Poverty Levela | |||||||
| 100% PL | 48 | 19 | 4 | 18 | 40 | 21 | |
| 100% - 150% PL | 14 | 15 | 13 | 5 | 10 | ||
| 150% - 200% PL | 10 | 7 | 22 | 5 | 9 | ||
| 200% - 250% PL | 5 | 19 | 9 | 23 | 10 | 12 | |
| Over 250% PL | 5 | 33 | 22 | 32 | 0 | 19 | |
| No Limit | 10 | 7 | 13 | 100 | 14 | 20 | 19 |
| Varies by Funding Source | 10 | 9 | 10 | 4 | |||
| Sliding Scale | 8 | 5 | 10 | 2 | |||
| |||||||
| FIGURE C-10. Income Eligibility Requirements |
|---|
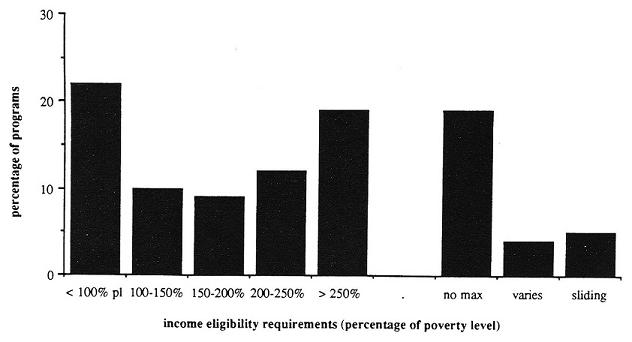 |
VIII. Age Eligibility Requirements
People over 60 are most likely to be eligible for publicly funded PAS. Eighty-eight percent of all programs were eligible to people in this age group. In contrast, only 44% of the programs were open to people under 18 (Figure C-11). All TII programs limited eligibility to people over 60, and most TXIX-PC programs were open to people of all ages (Table C-8).
| TABLE C-8. Age Groups Eligible by Funding Source Group | |||||||
|---|---|---|---|---|---|---|---|
| Funding Source | TXIX- PC | TXIX- Waiver | SSBG | TIII | State | Other | Total |
| Number of Programs | 24 | 31 | 24 | 13 | 27 | 13 | 132 |
| Percentage of Programs | |||||||
| Age Groups Eligible | |||||||
| Children 18 | 79 | 56 | 33 | 32 | 40 | 44 | |
| Working age 19-65 | 100 | 63 | 92 | 86 | 80 | 76 | |
| Elderly over 60 | 100 | 83 | 88 | 100 | 71 | 100 | 88 |
| FIGURE C-11. Age Groups Eligible |
|---|
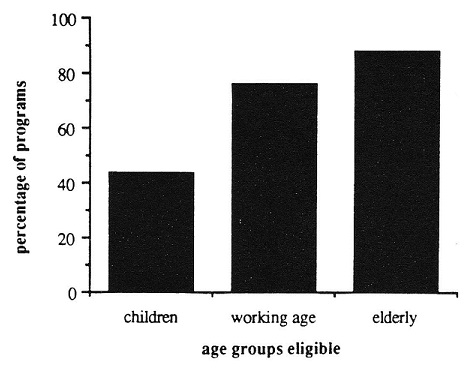 |
IX. Services Offered
Most programs in 1988 offered a basic core of personal and household services such as dressing, bathing, grooming, ambulation, transfers, feeding, meal preparation, light cleaning, laundry and grocery shopping (Table C-9). Communication and transportation services were less frequently provided. Respite was offered by slightly over half of the programs, but emergency services were available for only 36% of the programs. Essential paramedical services (medication, injections, catheterization, and respiration) were often not provided. The Other programs, which consisted primarily of Home Health programs, were most likely to provide paramedical services (Table C-10).
| TABLE C-9. Percentage of Programs Offering Assistance With Personal Assistance Tasks by Funding Source Group | |||||||
|---|---|---|---|---|---|---|---|
| Funding Source | TXIX- PC | TXIX- Waiver | SSBG | TIII | State | Other | Total |
| Number of Programs | 24 | 31 | 24 | 13 | 27 | 12 | 131 |
| Percentage of Programs | |||||||
| Personal Maintenance/Hygiene | |||||||
| Feeding | 96 | 97 | 83 | 77 | 93 | 83 | 90 |
| Bathing | 100 | 94 | 88 | 100 | 100 | 100 | 96 |
| Dressing | 100 | 94 | 92 | 100 | 100 | 92 | 96 |
| Ambulation | 96 | 94 | 83 | 92 | 93 | 92 | 92 |
| Transfers | 96 | 90 | 79 | 85 | 100 | 92 | 91 |
| Oral Hygiene and Grooming | 100 | 94 | 88 | 100 | 100 | 92 | 95 |
| Skin Maintenance | 96 | 84 | 63 | 85 | 93 | 92 | 85 |
| Menstrual Assistance | 88 | 65 | 38 | 23 | 78 | 67 | 63 |
| Bowl and Bladder Assistance | 75 | 84 | 38 | 69 | 85 | 92 | 73 |
| Prosthesis Assistance | 67 | 84 | 29 | 38 | 81 | 92 | 66 |
| Range of Motion | 67 | 61 | 29 | 85 | 81 | 92 | 66 |
| Foot Care | 71 | 68 | 42 | 54 | 67 | 83 | 63 |
| Household Assistance | |||||||
| Light Cleaning | 96 | 90 | 100 | 100 | 89 | 92 | 94 |
| Heavy Cleaning | 38 | 35 | 50 | 85 | 56 | 50 | 49 |
| Laundry | 88 | 90 | 100 | 100 | 81 | 83 | 90 |
| Grocery Shopping | 83 | 81 | 100 | 92 | 74 | 83 | 85 |
| Run Errands | 58 | 68 | 96 | 92 | 67 | 75 | 74 |
| Meal preparation/Cleanup | 96 | 90 | 100 | 92 | 92 | 92 | 94 |
| Chore Service | 42 | 55 | 83 | 85 | 59 | 58 | 62 |
| Repairs/Maintenance | 13 | 32 | 25 | 77 | 30 | 50 | 33 |
| Child Care | 4 | 3 | 29 | 15 | 30 | 33 | 18 |
| Scheduling/Assigning | 4 | 19 | 29 | 38 | 37 | 58 | 27 |
| Pay Bills/Budget | 21 | 52 | 79 | 54 | 56 | 42 | 51 |
| Plan Meals | 75 | 74 | 75 | 62 | 63 | 58 | 69 |
| Short-Term Services | |||||||
| Emergency | 38 | 35 | 38 | 38 | 26 | 50 | 36 |
| Respite | 42 | 74 | 25 | 85 | 48 | 58 | 53 |
| Communication Tasks | |||||||
| Phone Calls | 25 | 61 | 50 | 77 | 78 | 58 | 57 |
| Write Letters | 21 | 61 | 50 | 69 | 70 | 67 | 55 |
| Handle Money | 13 | 29 | 54 | 62 | 59 | 42 | 41 |
| Agency Liaison | 29 | 52 | 29 | 77 | 56 | 83 | 50 |
| PAS Paperwork | 29 | 32 | 25 | 38 | 56 | 42 | 37 |
| Interpreters (deaf) | 25 | 29 | 17 | 23 | 33 | 25 | 26 |
| Reading | 25 | 45 | 33 | 54 | 44 | 50 | 40 |
| Transportation Tasks | |||||||
| Medical Escort | 75 | 65 | 50 | 69 | 81 | 67 | 68 |
| Non-Medical Escort | 29 | 35 | 50 | 69 | 70 | 33 | 47 |
| Driving (med) | 42 | 39 | 38 | 62 | 67 | 50 | 48 |
| Driving (non-med) | 25 | 26 | 38 | 69 | 63 | 42 | 41 |
| TABLE C-10. Percentage of Programs Offering Assistance With Paramedical Tasks and Average Number of Paramedical Tasks Provided by Funding Source Group | |||||||
|---|---|---|---|---|---|---|---|
| Funding Source | TXIX- PC | TXIX- Waiver | SSBG | TIII | State | Other | Total |
| Number of Programs | 24 | 30 | 25 | 12 | 27 | 15 | 133 |
| Percentage of Programs | |||||||
| Paramedical Tasks | |||||||
| Medications | 58 | 52 | 42 | 69 | 63 | 75 | 57 |
| Respiration | 38 | 58 | 25 | 38 | 63 | 67 | 48 |
| Catheterization | 29 | 42 | 29 | 23 | 52 | 50 | 38 |
| Injections | 21 | 39 | 17 | 38 | 41 | 50 | 33 |
| Average Sum of Paramedical Tasks | 1.5 | 1.9 | 1.1 | 1.7 | 2.2 | 2.2 | 1.8 |
X. Service Availability
Forty-three percent of all programs did not limit the days or times services were available (Table C-11). State programs, which tended to serve younger people with physical disabilities, were most likely to allow attendants to work at any time as needed. Twenty percent of all programs allowed service at any time only in limited circumstances (e.g. special eligibility requirements, separate application process, consumer lives in limited geographic area, etc.), and 37% limited availability in all cases. The TIII programs, which rely heavily on agency providers and offer very few hours per week, were the most likely to limit availability.
| TABLE C-11. Days and Times Service is Available by Funding Source Group | |||||||
|---|---|---|---|---|---|---|---|
| Funding Source | TXIX- PC | TXIX- Waiver | SSBG | TIII | State | Other | Total |
| Number of Programs | 24 | 29 | 24 | 13 | 27 | 12 | 129 |
| Percentage of Programs | |||||||
| Services are Available 24 hrs./day, 7 days/wk. | |||||||
| Yes | 46 | 48 | 29 | 74 | 25 | 43 | |
| No | 38 | 21 | 58 | 69 | 22 | 33 | 37 |
| Varies | 17 | 31 | 13 | 31 | 4 | 42 | 20 |
XI. Service Limits
In addition to the eligibility requirements and limitations on the types and times services are available, programs controlled costs by limiting the amount of services available. The total amount of PAS provided per person was usually limited in terms of hours per week and/or expenditures per month (Table C-12). Services could also be limited by programmatic budgetary constraints instead of per person service caps, so it is impossible to tell which programs have no service limits at all from this survey data.
Seventy-five percent of the programs which responded to the question stated some sort of hour limit. Fourteen percent of these programs limited hours of PAS to less than 20 per week (Figure C-12). A small number of programs (8%) which had limits below 20 hours per week in 1984 (Appendix D) had raised the limit to over 20 hours by 1988. SSBG, Waiver and Other programs were most likely to have high hour limits (i.e. more than 60 hours per week) or no limits on hours.
A similar pattern emerged from the per person expenditure limits. Over seventy-five percent of the programs responding limited expenditures per client per month, most at between $500 and $ 1,000 (Figure C-13). The Other programs also tended to have fairly high monthly expenditure limits or no expenditure limits at all. Waiver programs also had high limits.
| TABLE C-12. Maximum Hours Allowed Per Week Per Recipient and Maximum Expenditures Per Recipient by Funding Source Group | |||||||
|---|---|---|---|---|---|---|---|
| Funding Source | TXIX- PC | TXIX- Waiver | SSBG | TIII | State | Other | Total |
| Percentage of Programs | |||||||
| Hours/Week Limit | |||||||
| 0 - 20/wk | 18 | 19 | 11 | 14 | 9 | 14 | 14 |
| 21 - 30/wk | 23 | 6 | 17 | 22 | 16 | ||
| 31 - 40/wk | 9 | 13 | 6 | 22 | 11 | ||
| 41 - 50/wk | 5 | 9 | 3 | ||||
| 51 - 60/wk | 9 | 6 | 4 | 29 | 6 | ||
| Over 60/wk | 14 | 25 | 22 | 13 | 14 | 16 | |
| No Max. Set | 18 | 25 | 39 | 43 | 17 | 14 | 25 |
| Other* | 5 | 7 | 6 | 42 | 4 | 14 | 9 |
| Number of Programs | 22 | 16 | 18 | 8 | 23 | 7 | 93 |
| Cost/Month Limit | |||||||
| $0 - $500/mo. | 18 | 17 | 25 | 30 | 14 | ||
| $501 - $1,000/mo. | 41 | 44 | 44 | 50 | 14 | 41 | |
| $1,000 - $2,000/mo. | 12 | 29 | 5 | ||||
| Over $2,000/mo. | 6 | 20 | 5 | 14 | 9 | ||
| NH Level** | 6 | 20 | 5 | 8 | |||
| No Max. Set | 29 | 4 | 39 | 75 | 10 | 43 | 23 |
| Number of Programs | 17 | 25 | 18 | 4 | 20 | 7 | 91 |
| * Other = varies by county, NH limits, limited by available funds. ** NH Level = State Average Medicaid Nursing Home Reimbursement | |||||||
| FIGURE C-12. Maximum Hours Allowed Per Week Per Recipient |
|---|
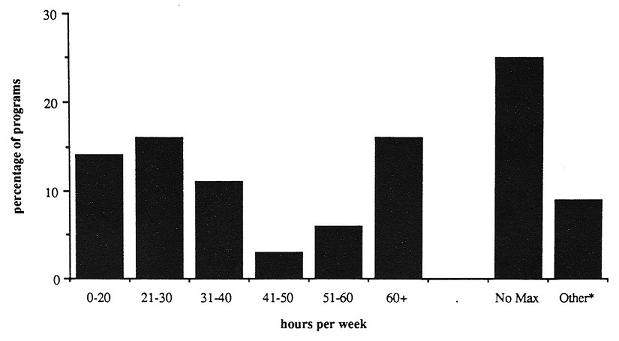 |
| * Other = varies by county, NH limits, limited by available funds. |
| FIGURE C-13. Maximum Expenditure Limit Per Month Per Recipient |
|---|
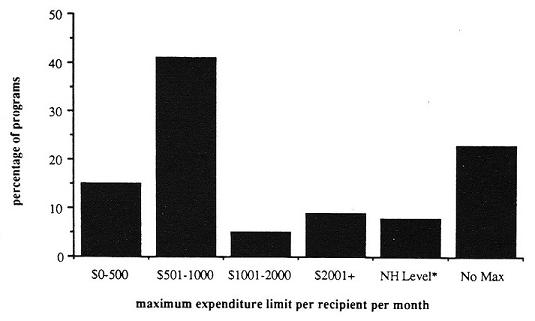 |
| * NH Level = Medicaid Nursing Home Reimbursement. |
XII. Medical Supervision Requirements
Sixty-two percent of all programs required some level of ongoing medical supervision, for some or all PAS tasks (Table C-13). Almost all TXIX-PC programs required ongoing medical supervision, whereas State and SSBG programs were the least likely to require medical supervision.
| TABLE C-13. Percentage of Programs Which Require Medical Supervision and Changes in Medical Supervision Requirements by Funding Source Group | |||||||
|---|---|---|---|---|---|---|---|
| Funding Source | TXIX- PC | TXIX- Waiver | SSBG | TIII | State | Other | Total |
| Number of Programs | 24 | 29 | 24 | 12 | 24 | 12 | 125 |
| Percentage of Programs | |||||||
| Medical Supervision Required? | |||||||
| Yes | 88 | 76 | 29 | 83 | 21 | 92 | 61 |
| No | 13 | 24 | 71 | 17 | 79 | 8 | 39 |
XIII. Provider Types Utilized
Agency providers (including employees of Home care or Home health agencies) were the most common provider type used, followed by independent providers (Figure C-14). Over 40% of the programs used two or more types of providers. Only 25 programs responding used government providers (including both civil service and non-civil service employees). State programs were most likely to utilize independent providers, while Waiver and Other programs were most likely to use agency providers (Figure C-15). The SSBG and TXIX-PC used a mix of providers.
| FIGURE C-14. Total Number of Programs Using Each Provider Type |
|---|
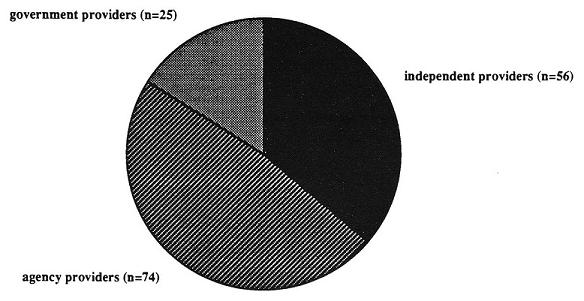 |
| FIGURE C-15. Percentage of Programs Utilizing Provider Types by Funding Source |
|---|
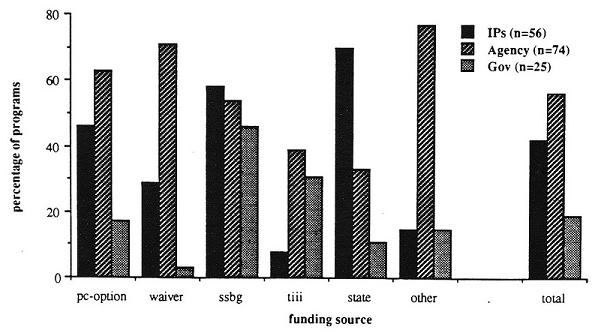 |
XIV. Provider Pay and Benefits
Attendant wages varied by provider type and funding source (Table C-14). Overall, family providers and independent providers received the lowest hourly wage, and home health and home care agency workers received the highest wage (Figure C-16). Agency providers also had the highest average number of benefits across funding source groups (Table C-15). In general, the number of benefits for attendants was very low: the mode was zero benefits for program attendants (Figure C-17).
| TABLE C-14. Average Hourly Attendant Wage by Funding Source Group | |||||||
|---|---|---|---|---|---|---|---|
| Provider Type | TXIX- PC | TXIX- Waiver | SSBG | TIII | State | Other | Total |
| Average $ Hourly Wage | |||||||
| Independent Providers | |||||||
| IPs | 4.59 | 6.54 | 4.18 | 4.00 | 4.67 | 4.84 | 4.85 |
| n | 9 | 9 | 13 | 1 | 18 | 2 | 52 |
| Family Members | 2.62 | 4.38 | 4.67 | 3.50 | 4.05 | ||
| n | 1 | 5 | 6 | 7 | 19 | ||
| Private Agency Workers | |||||||
| Home Care Agencies | 6.17 | 8.67 | 5.56 | 5.77 | 5.87 | 4.47 | 6.62 |
| n | 10 | 17 | 7 | 4 | 6 | 7 | 51 |
| Home Health Agencies | 5.72 | 8.67 | 3.43 | 6.15 | 5.67 | 4.67 | 6.95 |
| n | 5 | 12 | 1 | 2 | 2 | 3 | 25 |
| Government Workers | |||||||
| Civil Service | 8.00 | 6.73 | 5.42 | 4.42 | 6.18 | ||
| n | 2 | 4 | 3 | 2 | 11 | ||
| Non-Civil Service | 6.05 | 3.35 | 5.13 | 4.69 | 4.75 | 5.07 | |
| n | 3 | 1 | 2 | 1 | 3 | 10 | |
| FIGURE C-16. Hourly Attendant Wage by Provider Type and Wage Level |
|---|
 |
| TABLE C-15. Average Number of Attendant Benefits* by Funding Source | |||||||
|---|---|---|---|---|---|---|---|
| Provider Type | TXIX- PC | TXIX- Waiver | SSBG | TIII | State | Other | Total |
| Average # of Benefits | |||||||
| Independent Providers | 0.9 | 0.3 | 1.4 | 6.0 | 1.3 | 0.0 | 1.1 |
| n | 11 | 9 | 14 | 1 | 19 | 2 | 56 |
| Private Agency Workers | 2.7 | 3.2 | 2.5 | 4.6 | 2.8 | 4.7 | 3.2 |
| n | 15 | 22 | 13 | 5 | 9 | 10 | 74 |
| Government Workers | 4.0 | 0.0 | 2.6 | 1.3 | 5.0 | 3.5 | 2.9 |
| n | 4 | 1 | 11 | 4 | 3 | 2 | 25 |
| * Benefits = social security, unemployment, worker’s compensation, health insurance, sick leave, vacation, transportation, retirement. | |||||||
| FIGURE C-17. Number of Benefits by Provider Type |
|---|
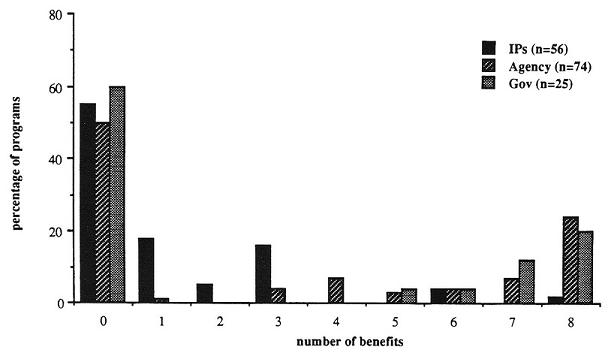 |
XV. Consumer Control Issues
Among the programs which used independent providers, over 80% allowed the recipient to hire or fire the attendant, and over half allowed the consumer to train the attendant (Table C-16). Less than half of the programs allowed the recipient to pay the attendant. State programs are the most likely to encourage all three types of consumer control, followed by SSBG and TXIX-PC programs.
| TABLE C-16. Degree of Consumer Control for Programs Which Utilize Independent Providers by Funding Source | |||||||
|---|---|---|---|---|---|---|---|
| Funding Source | TXIX- PC | TXIX- Waiver | SSBG | TIII | State | Other | Total |
| Number of Programs | 12 | 14 | 16 | 4 | 25 | 4 | 75 |
| Percentage of Programs | |||||||
| Consumer Can Hire/Fire Attendants | 83 | 79 | 88 | 0 | 96 | 50 | 81 |
| Consumer Can Pay Attendants | 25 | 7 | 56 | 0 | 76 | 25 | 44 |
| Consumer Can Train Attendants | 50 | 29 | 44 | 0 | 84 | 25 | 52 |
XVI. Summary of Funding Sources
MEDICAID PERSONAL CARE OPTION
(n=24, 18% of total programs surveyed)
Among the largest funding groups:
Avg. annual expenditures = $72,512,000/per program
Avg. recipients/program = 10,770
Avg. total hours per year = 14,706,000
Offers basic core of services:
Unlikely to offer paramedical services
42% programs offer respite
Service allowance: 60% offer 40 hours/week
Avg. exp/person/year = $3,860
Avg. hrs/recipient/wk = 14
High medical supervision requirements
Targets poor people (72% require incomes of 200% of poverty level)
Targets all ages, all disabilities
Likely to use individual or agency providers
More likely to be available any day, any time (48%)
MEDICAID WAIVER PROGRAMS
(n=31, 23% of total programs surveyed)
Smaller programs
Avg. annual expenditures = $13,393,000
Avg. recipients/program = 5,800
Avg. total hours = 1,394,000
Largest variety of services:
higherlevel of paramedical services
74% offer respite
Most generous service allowance: 56% offer >40 hrs/week
Highest avg. exp/person/year = $7,020
Avg. hrs/recipient/wk = 27
High medical supervision
Income eligibility varies
Target particular disabilities and age groups
Use agency and individual providers
More likely to be available any day, any time
TITLE III PROGRAMS
(n=13, 10% of total programs surveyed)
Large caseloads and low expenditures
Avg. annual expenditures = $6,131,000
Avg.recipients/program = 53,940
Avg. total hours = 2,426,000
Offers basic core of services:
Unlikely to offer paramedical services
85% offer respite (high)
Service allowance:
Lowest hours/week/person = 2
Lowest avg. exp/person/year = $120
No service limits stated 83% require medical supervision
No income requirement
Target those over 60 years old
Use agency and government providers
Least likely to be available any day, any time
TITLE XX SSBG PROGRAMS
(n=24, 18% of total programs surveyed)
Second largest programs
Avg. annual expenditures = $27,869,000
Avg. recipients/program = 36,580
Avg. total hours = 14,460,000
Offers basic core of services:
Least likely to offer paramedical
25% offer respite (low)
Service allowance:
34% offer 40 hours/week
Low avg. exp/person/year = $2,700
Avg. hrs/recipient/wk = 9
Least likely to require medical supervision
Target poor people, 39% require income 200% poverty level
Target adults, all disabilities
Use all types of providers
Only 29% have providers available any day, any time
STATE PROGRAMS
(n=27, 20% of total programs surveyed)
Smallest programs
Avg. annual expenditures = $2,684,000
Avg. recipients/program = 1,430
Avg. total hours = 183,000
Offers basic core of services:
Most likely to offer paramedical
48% offer respite
Service allowance:
Only 43% offer >40 hours/week
High avg. exp/person/year = $5,020
Highest avg/hrs/recipient/wk = 26
Lowest medical supervision requirements
High income requirements (only 38% 200% of poverty level)
Variation in age group and disability targets (gap filler)
Most likely to use EPs
Available any day, any time
APPENDIX D: CHARTBOOK OF PROGRAM COMPARISONS BY FUNDING SOURCE ON 1984 AND 1988 NATIONAL SURVEY DATA
Introduction
The following data is derived from the World Institute on Disability's (WID) two nationwide surveys of government-funded programs for people of all ages with disabilities which offer personal maintenance and/or household/domestic service on a long-term basis or short-term (respite) basis. These surveys were conducted in 1985 and 1989, and represent data from fiscal or calendar years 1984 and 1988. This document is intended as a summary text of major changes among PAS programs as a whole and by primary funding source. It provides brief descriptions of major findings in key program areas, followed by detailed tables and figures.
WID's first 1985 survey and resulting monograph, Attending to America: Personal Assistance for Independent Living (Litvak, Heurnann and Zukas, 1987), provided an overview of personal assistance programs throughout the United States. It also highlighted the lack of a comprehensive federal policy and integrated funding for personal assistance services (PAS), which led to a basic research issue: how do the various funding sources (and their concomitant regulation) affect the design of these programs? The resulting research project involved re-analyzing the original 1984 survey data as well as conducting another survey in 1989. The PAS programs surveyed were placed into six groups, based on their primary source of federal funding. For each survey, these groups were compared on the critical program variables, both among each other, and between funding sources.
The two surveys were also compared with each other, in order to answer the general question, "what changes have occurred among these programs between 1984 and 1988?", and also to answer the more specific question, "are the changes which have occurred between 1984 and 1988 related to program funding source?" The changes which have occurred between the two survey years are the subject of this report.
Methodology
Questionnaire Design
Questionnaires in both 1985 and 1988 focused primarily on basic descriptive data, i.e. number of recipients served, program expenditures, hours of service provided, type of service provided, program regulations. There were slight differences in the content of the two surveys. Some of the items used in 1985 were qualified to make finer distinctions, e.g., provider types were were more specifically categorized, additional services were listed, hours of service were broken down by type. Other items which had very low response rates were dropped from the survey entirely, e.g., consumer control options for agency or government providers, demographic breakdowns for populations served. A somewhat longer questionnaire was developed in 1989 for programs not previously surveyed, in order to obtain additional data from these programs. All program administrators were also asked if there had been any substantial change with regard to various program features since 1985.
Survey Procedure
Several types of programs were not included in either survey. Protective service programs (those aimed at preventing abuse or neglect of adults and children) were only included if these programs served people on a long-term basis. Programs targeted exclusively for people with mental illness or mental retardation were not included. Temporary services for people who are acutely ill or for those in transition from the hospital, nursing home or institution to the community were also not included. In addition, shared attendant programs in congregate living arrangements were not included.
The major methodological difference between the two surveys was the procedure for gathering the data: in 1985 the surveys were completed by the WID research team primarily through phone interviews with program administrators, whereas in 1989, surveys were simply mailed to the program administrators. The latter method, though less time-consuming for the research team, led to more incomplete and inconsistent data on some programs. Follow-up mailings and phone calls were conducted to encourage administrators to respond and to clarify specific responses. Special effort was made to ensure that all the programs funded by the Medicaid Personal Care Option responded.
Response Rates
One hundred and seventy-five programs were contacted in 1985. Nineteen of these were not included in this study because of inadequate state wide data, or because the administrator refused to be interviewed. A total of 157 questionnaires were included in the analysis.
After two mailings and six months of follow-up phone calls, 132 questionnaires were received in 1989. Of these, 26 (20%) were from programs not previously contacted, and 106 (80%) were from programs WM had interviewed in 1985. Several of the questionnaires received represented 2 or more programs interviewed separately in 1985, so a total of 117 programs interviewed in 1985 were accounted for in the 1989 survey. This constitutes a 75% return rate for the PAS programs contacted in 1984. A list of both the 1984 and 1988 questionnaires is included in Section XI of this report.
Despite the extensive follow-up procedures used, there is no definitive account as to why 25% of the programs responding in 1984 failed to respond in 1988. However, the reasons identified for some of these programs are probably representative. During the follow-up phone calls, one program administrator interviewed in 1985 simply refused to complete the 1989 survey, and it is likely that some other administrators also decided not to invest the time required to complete our questionnaire. Twelve other programs contacted in 1984 were found to be completely defunct or to no longer offer PAS.
Analysis Procedure
In order to get an accurate measure of growth, the eight questionnaires which represent a total of 19 programs surveyed in 1984 had to be wieghted. Because of the varied response rates and the addition of new programs, the comparison between 1984 and 1988 data was done in two different ways:
-
Comparisons of overall group means -- Programs were assigned to one of six funding groups in both 1984 and 1988, and these group means were compared. These calculations included new programs added in 1988 to the data set, as well as programs which responded in 1984, but failed to respond in 1988.
-
Within-program measures of magnitude of change -- Only programs which responded in both 1984 and 1988 were analyzed for individual program changes. Programs which failed to provide data on a given item in either survey year were dropped from that analysis.
For the examination of within-program changes by funding source, programs which had changed or consolidated funding could not be included, so the total n for these analyses are greater than the sum of the funding source group ns. The number of responses used to calculate group means tended to be fairly low because of these limitations, which decrease reliability.
Reliability
The survey is intended to gather specific information based primarily on objective, written data from program regulations and annual budgets and reports. However, state management information systems (MIS) varied tremendously in level of sophistication, methods of collecting and categorizing data, and the types of dam collected. Many Title III programs, for example, include a wide array of services unrelated to PAS (e.g. home-delivered meals and adult day care) but keep records only on total units of service provided in each county. The caseloads for these programs were therefore generally inflated, and in many cases had to be dropped from the longitudinal analyses.
The low response rate on particular items suggests that the data requested is not easily placed into the stated categories. For example, there was a high percentage of missing data on consumer income eligibility requirements. This may be due to the variety of income and asset deduction allowances in the programs, which made a single figure difficult to derive.
Because this report is based on data from both survey years, the problem of missing data is compounded. Only a subset of programs had reliable data from both survey years, and the low ns therefore limit the representativeness of these comparisons.
Despite the objective nature of the data requested, the reliance on the knowledge of a single administrator may also limit reliability. In some cases, the administrator was new to the program or position, or he/she had little to do with particular aspects of the program (e.g. assessments). When there appeared to bemajor gaps in questionnaire responses, researchers attempted to contact other program representatives to supplement or verify the data provided. For the most part, however, the data administrators provided was simply recorded as it was presented.
The expenditure, hour, and caseload data has specific limitations. Whenever possible, this data was recorded for fiscal or calendar years 1984 and 1988, but in some cases the programs could only provide figures from fiscal or calendar 1983 or 1985 and 1987 or 1989 data. No attempt was made to convert these figures to 1984 and 1988 levels using the consumer price index or other means.
Validity
The key validity issue is whether the concepts and definitions used in this study are sufficiently clear and precise. The definition of what constitutes a PAS program, and how this determination is made, is of central importance. For example, distinguishing Medicaid home health programs which target people who are acutely in and in need of significant amounts of medical services on an intermittent basis from those programs which offer PAS on a long-term basis was quite difficult (at least one program surveyed in 1984 and analyzed with that data set was discovered to be a short-term home health program when contacted again in 1988). The identification and inclusion of such programs were often based on the administrator's judgement as to whether his/her program actually fit the stated criteria. The opposite problem occurred with some program administrators who had a very narrow concept of attendant services (i.e. programs for disabled working age people who are employed or employable). In these cases, the administrator had to be convinced that if, for example, the program only served older people for a few hours a week on a regular basis, it was in fact an attendant service program.
The validity of the funding source groups is not certain. Programs were originally grouped by primary federal funding source into twelve categories, but in order to have groups large enough for meaningful statistical analysis, these were collapsed into six groups. The "Other" category in particular became a catch-all for programs that could not be placed into the other five categories. Analyses of Variance (ANOVAs) on most variables consistently showed enormous within group variance, which indicates that program funding source in general was much less important than the individual political, economic and administrative context within the states (a premise born out by the subsequent site visits conducted by WID).
These categories appeared even more tenuous when 1984 and 1988 surveys were compared. For example, nine programs had apparently switched funding source between 1984 and 1988, so these programs could not be included in the 1984 to 1988 comparisons by funding source group. In three of these cases, the administrators no longer reported Title XX funding as distinct from state funds, in another case TXX funds were not distinguished in 1984. It is possible that other programs may be incorrectly categorized, or that the categories themselves are not sufficiently defined.
Eight questionnaires were received which seemed to indicate that the state had consolidated a number of programs which had been interviewed separately in 1984. When WID visited one of these states, the researchers found that although the state continued to have two distinct programs, only one questionnaire had been filled out because the same department administered both of the programs. Other questionnaires counted in these analyses as a single program may also be aggregate reports of several programs.
Given these data limitations, the following analyses must be viewed as summaries of general trends. The study strongly suggests that funding source category by itself is not a valid predictor of specific program features.
I. Program Expenditures Changes
The two Medicaid funding sources experienced the highest growth in average program expenditures between 1984 and 1988 (Table D-1 and Figure D-1). The Waiver programs (which had been relatively small in 1984) grew by an average of over 300%, which indicates that these programs are becoming a more entrenched part of many states' service delivery systems. PC Option and SSBG programs had the largest expenditures in 1984, and this trend was accentuated by 1988 as average expenditures doubled. On an individual program basis, the PC-Option option programs grew by an average of $60 million (Table D-2 and Figure D-2).
On a program by program basis, State and Other program expenditures grew slightly. Small new programs added by 1988 account for the decline in average expenditures in the group comparisons between 1984 and 1988. Both the decline in expenditures in the State funding group and the dramatic increases among the PC-Option and Waiver groups indicate a growing tendency of states to move to federal matching funds for their PAS.
| TABLE D-1. Comparison of 1984 and 1988 Average Expenditures Per Program by Funding Source Group | |||||||
|---|---|---|---|---|---|---|---|
| Funding Source | TXIX- PC | TXIX- Waiver | SSBG | TIII | State | Other | Total |
| Average Annual Expenditures Per Program (in $ millions) | |||||||
| Year | |||||||
| 1984 | 35.72 | 3.25 | 14.24 | 7.11 | 4.91 | 12.14 | 11.86 |
| Number of Responses | 19 | 28 | 31 | 17 | 30 | 13 | 138 |
| 1988 | 72.51 | 13.39 | 27.87 | 6.13 | 2.68 | 7.99 | 24.00 |
| Number of Responses | 23 | 29 | 22 | 10 | 26 | 10 | 120 |
| Average Percentage Change | 103% | 312% | 96% | -14% | -45% | -34% | 102% |
| FIGURE D-1. Comparison of 1984 and 1988 Average Expenditures Per Program by Funding Source Group |
|---|
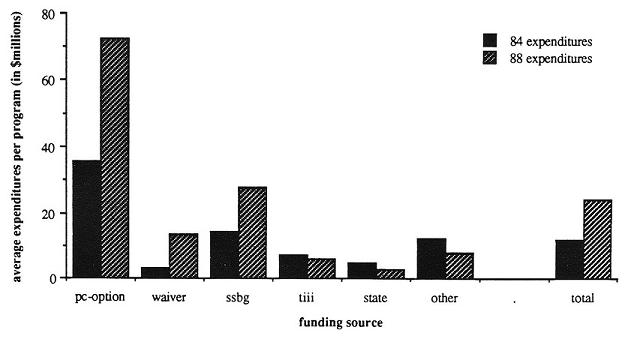 |
| TABLE D-2. Magnitude of Growth in Total Program Expenditures Between 1984 and 1988 by Funding Source Group, in Total Dollars and Corrected for Inflation | |||||||
|---|---|---|---|---|---|---|---|
| Funding Source | TXIX- PC | TXIX- Waiver | SSBG | TIII | State | Other | Total |
| Number of Programs | 15 | 17 | 15 | 7 | 18 | 7 | 88 |
| Number missing | 2 | 4 | 3 | 2 | 1 | 1 | 18 |
| Program Expenditure Change (in $ millions) | |||||||
| Mean | 60.7 | 8.3 | 12.5 | 0.9 | 0.8 | 3.1 | 13.6 |
| Standard deviation | 184.2 | 11.2 | 42.8 | 9.8 | 2.2 | 4.5 | 80.1 |
| High | 721.6 | 45.7 | 166.5 | 16.4 | 5.5 | 9.7 | 721.6 |
| Low | -0.7 | -1.0 | -6.5 | -16.0 | -4.5 | -0.5 | -106.5 |
| Program Expenditure Change--Corrected for Inflation* (in $ millions) | |||||||
| Mean | 54.4 | 7.7 | 9.0 | -0.1 | 0.4 | 2.6 | 11.4 |
| Standard deviation | 168.1 | 10.4 | 33.0 | 10.0 | 2.3 | 4.4 | 73.0 |
| High | 657.5 | 41.9 | 127.1 | 14.4 | 4.8 | 9.0 | 657.5 |
| Low | -4.2 | -1.1 | -12.8 | -18.5 | -6.6 | -0.7 | -121.5 |
| * There was a 14% increase in the Consumer Price Index between 1984 and 1988, so corrected figures are in 1984 dollars | |||||||
| FIGURE D-2. Magnitude of Growth in Program Expenditures Between 1984 and 1988 by Funding Source, in Total Dollars and Corrected for Inflation |
|---|
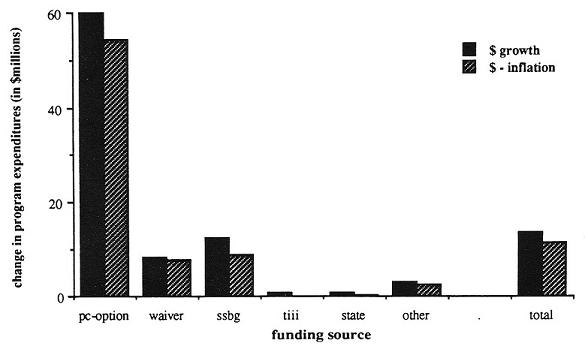 |
II. Program Caseload Changes
SSBG programs on the average had the largest program caseloads in 1984 and 1988 (Table D-3 and Figure D-3), over 300%. The Waiver programs grew on the average by over 200%, and the PC-Option programs grew an average of 70%. State caseloads declined by 56%. The growth in Medicaid program caseloads and the decline in state caseloads offer general confirmation of the pattern shown in expenditure data, i.e. that the states in this period are attempting to maximize federal dollars.
As a group, Title III programs declined in caseload size, although one program caseload apparently grew by over 160,000. This outlier, combined with the low N, accounts for the high average caseload growth among individual Title III programs in Table D-4 and Figure D-4. In general, there was a problem among Title III administrators in identifying PAS recipients apart from other service recipients for related programs such as adult day care or home-delivered meals, so these figures may not be accurate.
| TABLE D-3. Comparison of 1984 and 1988 Average Program Caseloads by Funding Source Group | |||||||
|---|---|---|---|---|---|---|---|
| Funding Source | TXIX- PC | TXIX- Waiver | SSBG | TIII | State | Other | Total |
| Average Program Caseloads (in thousands) | |||||||
| Year | |||||||
| 1984 | 7.77 | 1.92 | 9.10 | 78.89 | 3.25 | 3.93 | 13.54 |
| Number of Responses | 18 | 35 | 32 | 16 | 27 | 12 | 140 |
| 1988 | 10.77 | 5.80 | 36.58 | 53.94 | 1.43 | 11.00 | 14.92 |
| Number of Responses | 22 | 30 | 23 | 6 | 24 | 11 | 116 |
| Average Percentage Change | 39% | 202% | 302% | -14% | -56% | 143% | 10% |
| FIGURE D-3. Comparison of 1984 and 1988 Average Program Caseloads by Funding Source Group |
|---|
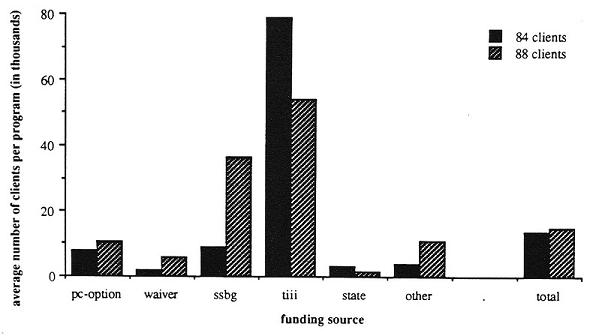 |
| TABLE D-4. Magnitude of Growth in Program Caseloads Between 1984 and 1988 by Funding Source Group | |||||||
|---|---|---|---|---|---|---|---|
| Funding Source | TXIX- PC | TXIX- Waiver | SSBG | TIII | State | Other | Total |
| Number of Programs | 15 | 18 | 17 | 4 | 15 | 7 | 85 |
| Number missing | 2 | 3 | 1 | 5 | 4 | 1 | 21 |
| Program Caseload Change (in thousands) | |||||||
| Mean | 4.3 | 2.0 | 2.6 | 45.4 | 0.7 | 6.2 | 1.4 |
| Standard deviation | 9.3 | 4.3 | 8.1 | 78.6 | 1.7 | 13.1 | 21.2 |
| High | 26.8 | 18.7 | 32.9 | 163.1 | 4.8 | 34.8 | 34.8 |
| Low | -10.2 | -0.4 | -3.0 | 0.0 | -1.0 | -1.3 | -86.1 |
| FIGURE D-4. Magnitude of Growth in Program Caseloads Between 1984 and 1988 by Funding Source Group |
|---|
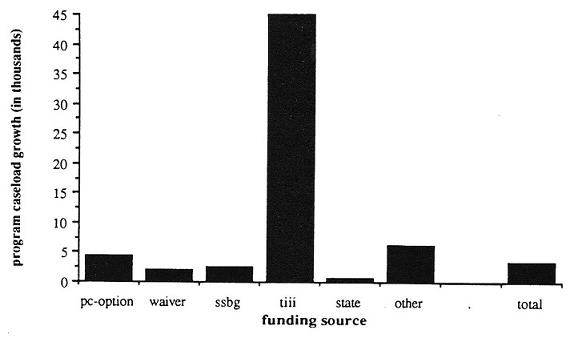 |
III. Program Hours Changes
Total hours of PAS provided in 1988 averaged 5,670,000 per program, compared with 5,350,000 hours in 1984. The TXIX-PC and SSBG programs on the average provided the most total hours of PAS per program, (Table D-5 and Figure D-5) but while the PC-Option programs provided on the average twice as many hours in 1988 as they did in 1984, the SSBG programs’ hours grew only slightly. Other programs and Waiver programs grew by over 200%, while State program hours dropped (which is consistent with the overall pattern of down-sizing within this funding source). On a case by case basis, the PC-Option and SSBG programs grew the most in total hours of PAS provided per program (Table D-6 and Figure D-6), whereas hours provided per program stayed static or dropped slightly with the Waiver, Other, State, and Title III programs. The number of programs per group able to provide data on hours was relatively low, so these findings may not be representative.
| TABLE D-5. Comparison of 1984 and 1988 Average Total Hours of PAS Provided Per Program by Funding Source Group | |||||||
|---|---|---|---|---|---|---|---|
| Funding Source | TXIX- PC | TXIX- Waiver | SSBG | TIII | State | Other | Total |
| Average Total Hours of PAS (in millions) | |||||||
| Year | |||||||
| 1984 | 7.12 | 0.29 | 13.45 | 2.40 | 0.21 | 0.30 | 5.35 |
| Number of Responses | 12 | 7 | 15 | 7 | 11 | 6 | 58 |
| 1988 | 14.71 | 1.39 | 14.46 | 2.43 | 0.18 | 0.97 | 5.75 |
| Number of Responses | 11 | 12 | 9 | 4 | 14 | 7 | 57 |
| Average Percentage Change | 107% | 379% | 8% | 1% | -14% | 223% | 7% |
| FIGURE D-5. Comparison of 1984 and 1988 Average Total Hours of PAS Provided Per Program by Funding Source Group |
|---|
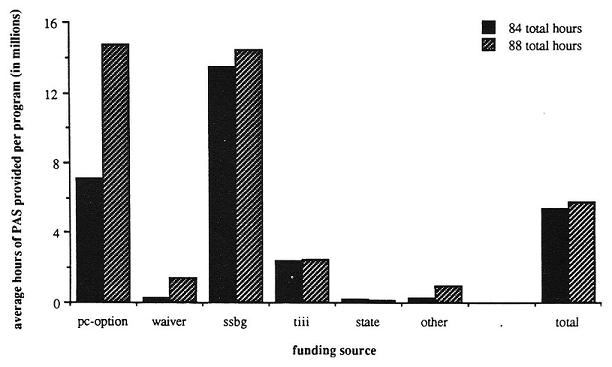 |
| TABLE D-6. Magnitude of Change in Total Program Hours Between 1984 and 1988 by Funding Source Group | |||||||
|---|---|---|---|---|---|---|---|
| Funding Source | TXIX- PC | TXIX- Waiver | SSBG | TIII | State | Other | Total |
| Number of Programs | 6 | 2 | 6 | 2 | 6 | 3 | 25 |
| Number missing | 11 | 19 | 12 | 7 | 13 | 5 | 81 |
| Change in Total Program Hours (in millions) | |||||||
| Mean | 11.6 | 0.1 | 7.2 | -1.6 | 0.0 | 0.0 | 4.4 |
| Standard deviation | 23.5 | 0.4 | 18.1 | 3.0 | 0.0 | 0.0 | 14.5 |
| High | 58.6 | 0.4 | 44.1 | 0.5 | 0.1 | 0.1 | 58.6 |
| Low | -0.2 | -0.1 | -1.4 | -3.8 | 0.0 | 0.0 | -3.8 |
| FIGURE D-6. Change in Total Program Hours Between 1984 and 1988 by Funding Source Group |
|---|
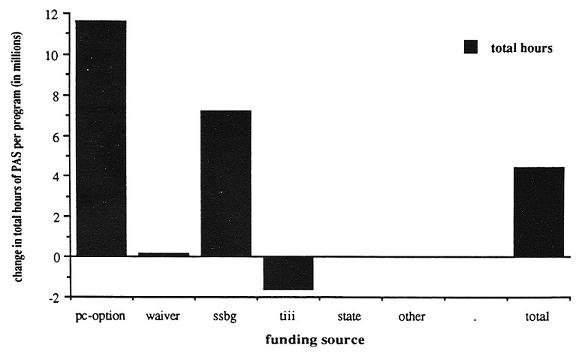 |
IV. Changes in Service Allocation: Expenditures Per Recipient
Average expenditures per client rose from $3,220 per person in 1984 to $4,520 per person in 1988, but this varied both among and between funding sources (Table D-7 and Table D-8 and Figure D-7 and Figure D-8). Because of data limitations, Title III programs were not included in these analyses. State and Waiver programs had by far the highest expenditures per client in 1984 and 1988, and they also experienced the greatest growth in expenditures per client. This reinforces the conclusion that these programs appear to be serving people with the most severe disabilities. All funding source groups except the PC-Option experienced some growth in average expenditures per client, most markedly the SSBG, Waiver and Other programs.
On a case by case basis with individual programs which have data from both survey years, these gains appear more modest. The PC-Option programs dropped expenditures per client slightly as a group, but the individual programs on a case-by case basis spent an average of $500 more per client in 1988 than in 1984.
Hours per client were derived differently in 1985 and 1989. In 1985, total hours were divided by total clients, whereas in 1989 administrators were asked to actually estimate average hours per client. A comparison between the two surveys is therefore inappropriate.
| TABLE D-7. Comparison of 1984 and 1988 Average Annual Program Expenditures Per Client by Funding Source Group | |||||||
|---|---|---|---|---|---|---|---|
| Funding Source | TXIX- PC | TXIX- Waiver | SSBG | TIII | State | Other | Total |
| Average Annual Expenditures Per Client (in $ thousands) | |||||||
| Year | |||||||
| 1984 | 3.82 | 4.67 | 1.49 | 0.25 | 4.23 | 1.40 | 2.87 |
| Number of Responses | 17 | 25 | 30 | 15 | 27 | 12 | 126 |
| 1988 | 3.86 | 7.02 | 2.70 | 0.12 | 5.02 | 1.63 | 4.36 |
| Number of Responses | 22 | 29 | 21 | 5 | 22 | 9 | 108 |
| Average Percentage Change | 1% | 50% | 81% | -52% | 19% | 16% | 52% |
| FIGURE D-7. Comparison of 1984 and 1988 Average Annual Program Expenditures Per Client by Funding Source Group |
|---|
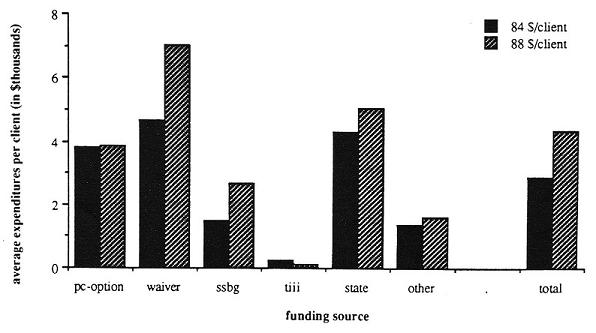 |
| TABLE D-8. Magnitude of Growth in Annual Program Expenditures Per Client Between 1984 and 1988 by Funding Source | |||||||
|---|---|---|---|---|---|---|---|
| Funding Source | TXIX- PC | TXIX- Waiver | SSBG | TIII | State | Other | Total |
| Number of Programs | 14 | 16 | 14 | 3 | 13 | 6 | 69 |
| Number missing | 3 | 5 | 4 | 6 | 6 | 2 | 28 |
| Average Expenditures Per Client Change (in $ thousands) | |||||||
| Mean | 0.5 | 2.8 | 0.1 | 0.0 | 1.8 | 0.3 | 1.2 |
| Standard deviation | 3.7 | 3.8 | 1.0 | 0.1 | 3.4 | 1.4 | 3.0 |
| High | 6.2 | 14.1 | 1.6 | 0.0 | 9.8 | 3.0 | 14.1 |
| Low | -7.8 | -0.5 | -3.2 | -0.2 | -1.2 | -0.9 | -7.8 |
| FIGURE D-8. Change in Expenditures Per Recipient Between 1984 and 1988 by Funding Source Group |
|---|
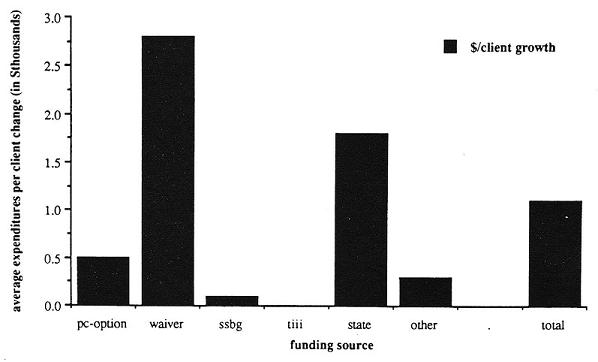 |
V. Changes in Service Availability: Days and Times PAS Can Be Provided
Contrasting 1984 and 1988 responses, 22% of the programs which had offered services at any time in 1984 had limited the times available by 1988 (Table D-9). Except for the Title III programs, this decline occurred in all funding groups. These findings may indicate a growing tendency among programs to limit services in order to curtail expenditure growth, although slight differences in the way the question was asked in 1985 and 1989 may account for this shift.
| TABLE D-9. Days and Time Service is Available by Funding Source Group | |||||||
|---|---|---|---|---|---|---|---|
| Funding Source | TXIX- PC | TXIX- Waiver | SSBG | TIII | State | Other | Total |
| Number of Programs | 24 | 29 | 24 | 13 | 27 | 12 | 129 |
| Services are Available 24 hrs./day, 7 days/wk. | |||||||
| No in 84 and 88 | 12 | 5 | 39 | 100 | 0 | 25 | 23 |
| Yes in 84 and No in 88 | 24 | 33 | 28 | 0 | 16 | 13 | 22 |
| No in 84 and Yes in 88 | 6 | 0 | 0 | 0 | 5 | 0 | 2 |
| Yes in 84 and 88 | 41 | 52 | 33 | 0 | 68 | 25 | 41 |
| Missing Data | 18 | 10 | 0 | 0 | 11 | 38 | 13 |
VI. Changes in Service Limits PerConsumer
There were small increases in total per client service limits; in terms of both hours per week, and expenditures per year (Table D-10 and Table D-11), but the low response rates, particularly with the hour per week limits, make interpretation questionable. For example, the Other programs appear to have increased per client hour allotments dramatically, but this is due only to a jump of 15 hours in one of the two programs responding.
On the average, the PC-Option programs increased service limits by $300 per year. The largest increases in annual expenditures per client occurred among the Waiver, State, and Other programs.
| TABLE D-10. Comparison of 1984 and 1988 Maximum Hours Allowed Per Week Per Recipient by Funding Source | |||||||
|---|---|---|---|---|---|---|---|
| Funding Source | TXIX- PC | TXIX- Waiver | SSBG | TIII | State | Other | Total |
| Number of programs | 6 | 0 | 3 | 0 | 8 | 2 | 20 |
| Number missing | 11 | 21 | 15 | 9 | 11 | 6 | 86 |
| Change in Maximum Hours Per Client Per Week | |||||||
| Mean | -1.0 | -0.7 | 0.0 | 7.5 | 0.8 | ||
| Standard deviation | 1.6 | 11.0 | 0.0 | 10.6 | 5.5 | ||
| High | 0.0 | 10.0 | 0.0 | 15.0 | 15.0 | ||
| Low | -4.0 | -12.0 | 0.0 | 0.0 | -12.0 | ||
| TABLE D-11. Change in Maximum Annual Expenditures Per Recipient Between 1984 and 1988 by Funding Source | |||||||
|---|---|---|---|---|---|---|---|
| Funding Source | TXIX- PC | TXIX- Waiver | SSBG | TIII | State | Other | Total |
| Number of programs | 7 | 14 | 8 | 0 | 13 | 4 | 52 |
| Number missing | 10 | 7 | 10 | 9 | 6 | 4 | 54 |
| Change in Maximum Expenditures Per Client (in $ thousands) | |||||||
| Mean | 0.3 | 1.9 | 0.2 | 1.0 | 4.1 | 1.2 | |
| Standard deviation | 0.4 | 3.9 | 0.1 | 2.2 | 5.3 | 2.8 | |
| High | 1.0 | 15.2 | 0.4 | 8.1 | 12.0 | 15.2 | |
| Low | 0.0 | -0.3 | -0.1 | 0.0 | 1.0 | -0.3 | |
VII. Changes in Medical Supervision Requirements
There was no real change in the number of programs requiring an RN or MD to supervise some or all PAS tasks. A few programs dropped medical supervision requirements between 1984 and 1988, and roughly an equal number added them (Table D-12). Persistent differences remain between the funding groups on this issue. SSBG and State programs rarely require medical supervision, while most TXIX-PC, Waiver, TIII and Other programs require medical supervision.
| TABLE D-12. Percentage of Programs Which Require Medical Supervision and Changes in Medical Supervision Requirements by Funding Source | |||||||
|---|---|---|---|---|---|---|---|
| Funding Source | TXIX- PC | TXIX- Waiver | SSBG | TIII | State | Other | Total |
| Number of Programs | 17 | 21 | 18 | 9 | 19 | 8 | 106 |
| Percentage of Programs | |||||||
| Changes Between 1984 and 1988 | |||||||
| No in 84 and 88 | 0 | 0 | 67 | 0 | 63 | 0 | 27 |
| Yes in 84 and No in 88 | 12 | 14 | 6 | 11 | 11 | 13 | 10 |
| No in 84 and Yes in 88 | 12 | 0 | 11 | 22 | 11 | 0 | 9 |
| Yes in 84 and 88 | 76 | 71 | 6 | 56 | 5 | 75 | 41 |
| Missing Data | 0 | 14 | 11 | 11 | 11 | 12 | 12 |
VIII. Changes in Amount of Paramedical Services Provided
There was no real change in the amount of paramedical services (i.e., medication, injections, catheterization, and respiration) an attendant could provide, although there was a slight decline in some funding groups, notably the TXIX-PC programs (Table D-13), which may indicate a reaction to liability concerns.
| TABLE D-13. Change in Number of Paramedical Services Provided between 1984 and 1988 | |||||||
|---|---|---|---|---|---|---|---|
| Funding Source | TXIX- PC | TXIX- Waiver | SSBG | TIII | State | Other | Total |
| Number of programs | 17 | 21 | 18 | 9 | 19 | 8 | 106 |
| Number missing | 0 | 0 | 0 | 0 | 0 | 0 | 0 |
| Change in Number of Paramedical Services* Provided | |||||||
| Mean | -0.3 | -0.2 | -0.2 | 0.2 | -0.2 | 0.4 | -0.1 |
| Standard deviation | 1.4 | 1.4 | 1.3 | 2.0 | 1.7 | 0.7 | 1.5 |
| High | 2.0 | 4.0 | 2.0 | 3.0 | 4.0 | 2.0 | 4.0 |
| Low | -4.0 | -3.0 | -4.0 | -4.0 | -3.0 | 0.0 | -4.0 |
| * Medication, injections, catheterization, and respiration | |||||||
IX. Consumer Control Changes
In the 1985 survey, almost none of the programs which used agency or government providers allowed the recipient to hire, fire, pay or train the attendant. The decision was therefore made to ask these questions only of programs which used independent providers in 1989. Among the programs which used independent providers, there was little discernable change in degree of consumer control (Table D-14). The consumers in these programs were as likely to be able to hire, fire, pay and train their attendants in 1984 as they were in 1988, and this did not vary among funding sources.
| TABLE D-14. Degree of Consumer Control for Programs Which Utilize Independent Providers by Funding Source | |||||||
|---|---|---|---|---|---|---|---|
| Funding Source | TXIX- PC | TXIX- Waiver | SSBG | TIII | State | Other | Total |
| Number of Programs | 17 | 21 | 18 | 9 | 19 | 8 | 106 |
| Percentage of Programs | |||||||
| Consumer Can Hire/Fire Attendants | |||||||
| No in 84 and 88 | 0 | 0 | 6 | 0 | 0 | 0 | 1 |
| Yes in 84 and No in 88 | 0 | 5 | 6 | 11 | 0 | 13 | 4 |
| No in 84 and Yes in 88 | 0 | 5 | 11 | 0 | 0 | 0 | 4 |
| Yes in 84 and 88 | 41 | 19 | 50 | 0 | 89 | 0 | 41 |
| Missing Data | 59 | 71 | 28 | 89 | 11 | 88 | 51 |
| Consumer Can Pay Attendants | |||||||
| No in 84 and 88 | 29 | 24 | 33 | 11 | 5 | 0 | 20 |
| Yes in 84 and No in 88 | 0 | 5 | 6 | 0 | 5 | 13 | 4 |
| No in 84 and Yes in 88 | 6 | 0 | 11 | 0 | 11 | 0 | 7 |
| Yes in 84 and 88 | 6 | 0 | 22 | 0 | 63 | 0 | 17 |
| Missing Data | 59 | 71 | 28 | 89 | 16 | 88 | 53 |
| Consumer Can Train Attendants | |||||||
| No in 84 and 88 | 2 | 14 | 33 | 0 | 5 | 0 | 11 |
| Yes in 84 and No in 88 | 6 | 10 | 6 | 11 | 5 | 13 | 8 |
| No in 84 and Yes in 88 | 0 | 0 | 11 | 0 | 5 | 0 | 6 |
| Yes in 84 and 88 | 18 | 5 | 22 | 0 | 68 | 0 | 23 |
| Missing Data | 65 | 71 | 28 | 89 | 16 | 88 | 53 |
X. General Program Policy Changes Since 1984
Programs reported a number of changes since 1984 (Table D-15). 'Me most common change in eligibility was an increase in income eligibility (40 programs), followed by some other form of liberalized eligibility (27 programs). Twenty-two programs developed some sort of functional assessment tool. In terms of consumer control, 13 programs formalized grievance procedures, 7 established consumer boards, and 6 established consumer training programs. The most common change reported in terms of quality control was establishing on-site review of providers (35 programs) and competitive bidding for provider agency contracts (10 programs). Twelve programs switched or added provider types.
| TABLE D-15. Program Changes Since 1984 | ||
|---|---|---|
| Number of Programs Implementing Change | Percentage of Total Programs Responding | |
| Eligibility Changes | ||
| Increased Maximum Allowable Income Level | 40 | 34% |
| Liberalized Eligibility Requirement | 27 | 23% |
| Developed Functional Ability Assessment | 22 | 19% |
| Established Uniform Assessment Process | 14 | 12% |
| Established Minimum Disability Level | 8 | 7% |
| Larger Part of the State Can Receive Service | 4 | 3% |
| Increased Number of Clients Allowed | 1 | 1% |
| Focus on Severe Disability | 1 | 1% |
| Lowered Age Eligibility | 1 | 1% |
| Improved Assessment | 1 | 1% |
| Recipient Control Changes | ||
| Formalized Grievance Procedures | 13 | 11% |
| Established Consumer Board | 7 | 6% |
| Established Consumer Training Program | 6 | 5% |
| Adopted Pennsylvania (Choice) Model | 3 | 3% |
| Quality Assurance Changes | ||
| Established On-Site Review of Providers | 35 | 31% |
| Established Independent Case Management | 11 | 10% |
| Competitive Provider Agency Selection | 10 | 9% |
| Established External Quality Assurance Committee | 8 | 7% |
| Independent Program Evaluation | 8 | 7% |
| Management Information System Changes | ||
| Developed Pilot MIS | 2 | 2% |
| Purchased Software | 1 | 1% |
| Developed Client Database | 1 | 1% |
| Provider Changes | ||
| Changed from IP to Agency Provider | 7 | 6% |
| Changed from Agency Provider to IP | 4 | 4% |
| Limited or Disallowed Family Providers | 2 | 2% |
| Increased Provider Reimbursement Rate | 2 | 2% |
| Added Agency Providers | 1 | 1% |
| Other Program Changes | ||
| Created or Modified Cost-Sharing Formula | 6 | 5% |
| Increased Maximum Expenditures Per Client | 5 | 4% |
| Narrowed Scope of Services Offered | 2 | 2% |
XI. Programs Contacted in 1984 and/or 1988
| ID | State | 88 Funding Source | 84 Funding Source |
|---|---|---|---|
| 1 | WI | NA | Other |
| - county based program in 1988, no statewide data | |||
| 2** * | MA | Waiver | State |
| - combined with 1984 program #94 | |||
| 3** | MA | TXIX-PC | TXIX-PC |
| - combined with 1984 program #93 | |||
| 4 | MA | State | State |
| 5 | HI | TXX | TXX |
| 6* | CT | TXX | State |
| 7 | CT | TXX | TXX TXIX-W in some analyses |
| 8 | CT | NA | TXIX-W |
| - defunct | |||
| 9 | CO | TXIX-W | TXIX-W |
| 10** | MO | NA | TXX |
| 11 | MO | NA | TXIX-W |
| - no longer offers PAS | |||
| 12 | IL | TXIX-W | TXIX-W |
| 13* | IL | TXIX-W | State |
| 14 | MA | NA | TIII |
| 16 | ID | NA | TXIX-W |
| - defunct | |||
| 17 | ID | TXIX-W | TXIX-W |
| 18** | ME | NA | State |
| 19** | ME | NA | State |
| 20 | ME | NA | TXX |
| 21 | KS | TXX | TXX |
| 22 | KS | TXIX-W | TXIX-W |
| 24 | KS | NA | State |
| - only residential services now available | |||
| 25 | AR | State | State |
| 26 | WI | NA | Other |
| - defunct | |||
| 27 | NY | TXIX-PC | TXIX-PC |
| 28 | ID | Other | Other |
| 29 | AL | TXIX-W | TXIX-W |
| 31 | WA | TXX | TXX |
| 32* | WI | State | Other |
| 33 | WI | State | State |
| 34** | ME | State | State |
| - combined with 1984 programs #18 and #19 | |||
| 35 | AL | State | State |
| 36 | IA | State | State |
| 37 | AR | TXIX-PC | TXIX-PC |
| 38 | DE | NA | TXX |
| 39 | WA | TXIX-W | TXIX-W |
| 40 | PA | TXX | TXX |
| 41 | ME | NA | TXIX-W |
| 42 | AL | State | State |
| 43 | NY | NA | TXX |
| 45 | NE | TXIX-PC | TXIX-PC |
| 46* | NE | State | TXX |
| 47 | FL | TXIX-W | TXIX-W |
| 48 | DE | NA | Other |
| 49 | MI | NA | TXIX-W |
| 50** * | NH | Other | TXX |
| - combined with 1984 program #102 | |||
| 51 | NV | NA | TXX |
| 52 | PA | TIII | TIII |
| 53 | PA | State | State |
| 54** | MO | NA | TIII |
| 55 | AZ | Other | Other |
| 56 | HI | TXIX-W | TXIX-W |
| 57 | CA | TXIX-W | TXIX-W |
| 59 | NV | TXIX-PC | TXIX-PC |
| 60 | MN | TXIX-PC | TXIX-PC |
| 61 | MT | NA | TXX |
| - now only offer protective services | |||
| 62 | WI | NA | TXIX-W |
| 63 | NV | NA | TIII |
| 64 | NV | State | State |
| 65 | MS | NA | State |
| 67 | AK | NA | TII |
| - defunct | |||
| 68 | AK | NA | TXX |
| 69 | AK | NA | State |
| 70 | CA | TIII | TIII |
| 71 | CA | TXIX-W | TXIX-W |
| 72 | CA | TXX | TXX |
| 73 | CO | TIII | TIII |
| 74 | CO | State | State |
| 75 | CT | Other | Other |
| 76 | CT | Other | Other |
| 77** | FL | NA | TXIX-W |
| 78 | FL | TIII | TIII |
| 79* | FL | State | TXX |
| 80 | FL | State | State |
| 81 | GA | TXX | TXX |
| 82 | HI | TIII | TIII |
| 83 | IN | Other | Other |
| 84 | IN | TXIX-W | TXIX-W |
| 85 | IA | Other | Other |
| 86 | KS | NA | TIII |
| 87 | KY | TXIX-W | TXIX-W |
| 88 | KY | State | State |
| 89 | KY | NA | TXX |
| 90 | MD | TXIX-PC | TXIX-PC |
| 91 | MD | TXX | TXX |
| 92 | MD | State | State |
| 93** | MA | NA | TXIX-PC |
| 94** | MA | NA | TXIX-W |
| 95 | MI | TIII | TIII |
| 96 | MN | TIII | TIII |
| 97** | MO | TXIX-PC | TXIX-PC |
| - combined with 1984 programs #10, #54 and #98 | |||
| 98** | MO | NA | TXIX-W |
| 99 | MO | State | State |
| 100 | MT | NA | TIII |
| 101 | NE | TXX | TXX |
| 102** | NH | NA | TIII |
| 103 | NH | TXIX-PC | TXIX-PC |
| 104 | NH | NA | TXIX-W |
| 105 | NM | TXIX-W | TXIX-W |
| 106 | NM | TXX | TXX |
| 107 | NM | NA | TXX |
| 108 | NM | TXIX-W | TXIX-W |
| 109 | NY | NA | TXX |
| 110 | NY | NA | State |
| - defunct | |||
| 111 | NY | TXIX-PC | TXIX-PC |
| 112 | NY | NA | TIII |
| 113 | NC | TXX | TXX |
| 114 | ND | TXIX-W | TXIX-W |
| 115* | OH | Other | TIII |
| 116 | OH | NA | TXIX-W |
| 117 | OH | NA | TXIX-W |
| 118 | OH | State | State |
| 119 | OH | NA | TXX |
| 120 | OH | TXX | TXX |
| 121 | OK | TXIX-PC | TXIX-PC |
| 122 | OX | TXX | TXX |
| 123 | OR | TXIX-PC | TXIX-PC |
| 124 | RI | NA | State |
| 125 | RI | State | State |
| 126 | SC | TXIX-W | TXIX-W |
| 127 | SD | State | State |
| 128 | SD | State | State |
| 129 | TX | TXIX-W | TXIX-W |
| 130 | TX | TXX | TXX |
| 131 | TX | TXIX-PC | TXIX-PC |
| 132 | TX | TIII | TIII |
| 133 | UT | NA | TXIX-W |
| - defunct | |||
| 134 | UT | NA | State |
| 135 | VT | State | State |
| 136* | VT | State | TXX |
| 137 | VA | TXX | TXX |
| 138 | DC | TXIX-PC | TXIX-PC |
| 139 | DC | TXX | TXX |
| 140 | WI | NA | Other |
| 141* | WY | Other | TIII |
| 142 | VA | NA | TXIX-W |
| 143 | SD | TXIX-PC | TXIX-PC |
| 144** | IN | Other | TXX |
| - combined with 1984 program 145 | |||
| 145** | IN | NA | TIII |
| 146 | TN | TIII | TIII |
| 147** | MT | TXIX-PC | TXIX-PC |
| - combined with 1984 program #149 | |||
| 148 | SC | TXX | TXX |
| 149** | MT | NA | TXIX-W |
| 150 | NM | NA | TIII |
| 151 | RI | Other | Other |
| 152* | WV | TXIX-PC | TXX |
| 153 | NJ | TXIX-W | TXIX-W |
| 154 | NJ | TXIX-PC | TXIX-PC |
| 155 | NJ | TXIX-W | TXIX-W |
| 156 | UT | TXIX-PC | TXIX-PC |
| 157 | MI | TXIX-PC | TXIX-PC |
| 158 | MS | TXX | TXX |
| 159 | RI | TXIX-W | TXIX-W |
| 160 | NC | NA | TXIX-W |
| - consumers shifted to 1988 program #229 | |||
| 161 | CO | Other | Other |
| 162 | GA | NA | TXIX-W |
| 163 | WV | TXIX-W | TXIX-W |
| * This Program Switched Funding Source Group Between 1984 and 1988 ** This Program Combined With Other Programs Contacted Separately in 1984 | |||
| NEW PROGRAMS CONTACTED ONLY IN 1988 | ||
|---|---|---|
| ID | State | 88 Funding Source |
| 201 | NC | TIII |
| 202 | OK | TIII |
| 204 | WY | State |
| 206 | DC | TIII |
| 207 | VT | TXIX-W |
| 208 | VT | State |
| 209 | AK | TXIX-PC |
| 210 | AZ | State |
| 211 | NV | TXIX-W |
| 212 | MN | TSIS-W |
| 217 | MN | TXX |
| 218 | IA | TXIX-W |
| 220 | WA | TXIX-PC |
| 221 | FL | Other |
| 222 | MD | TXIX-W |
| 223 | CT | TXIX-W |
| 224 | PA | TXX |
| 225 | KY | TXIX-W |
| 226 | ME | TXIX-PC |
| 229 | NC | TXIX-PC |
| 231 | UT | TXX |
| 232 | TX | TXX |
| 233 | TX | State |
| 234 | UT | TXX |
| 235 | UT | TIII |
| 236 | NV | TXIX-W |
| QUESTIONNAIRES RECEIVED BY FUNDING SOURCE GROUP | ||
|---|---|---|
| Funding Source | 84 Questionnaires | 88 Questionnaires* |
| TXIX-PC | 20 | 24 |
| TXIX-W | 38 | 31 |
| TXX | 35 | 24 |
| TIII | 21 | 13 |
| State | 30 | 27 |
| Other | 13 | 13 |
| TOTAL | 157 | 132 |
| * Includes 9 questionnaires from programs which appear to have switched funding source group between 1984 and 1988. 5 questionnaires which each represent two or more programs contacted separately in 1984, and 2 questionnaires which appear to have switched funding source group and which each represent 2 programs contacted separately in 1984. Because of these questionnaires, it is difficult to derive a response rate for each funding source group. Approximately three-quarters of the programs contacted in 1984 are represented in the 1988 data set. | ||
| PROGRAMS REPRESENTED BY 1988 QUESTIONNAIRES | |||
|---|---|---|---|
| Funding Source | Number of Questionnaires from Programs Surveyed in 1984 | 1984 Programs Represented by the Questionnaires Recieved* | New Programs Questionnaires: Recieved in 1988 Only |
| TXIX-PC | 20 | 21 | 4 |
| TXIX-W | 23 | 28 | 8 |
| TXX | 19 | 20 | 5 |
| TIII | 9 | 11 | 4 |
| State | 23 | 25 | 4 |
| Other | 12 | 12 | 1 |
| TOTAL | 106 | 117 | 26 |
| * Includes programs contacted separately in 1984 which are represented in one 1988 questionnaire. | |||
NOTES
-
This study was conducted as a result of a contract from the U.S. Department of Health and Human Services by the World Institute on Disability (WID) and supported with data from WID’s National Institute on Disability and Rehabilitation Research (NIDRR) Grant #G008720314, an earlier Mott Foundation grant, and on-going research on PAS under the auspices of the Research and Training Center on Public Policy in Independent Living.
-
According to Health Care Financing Administration claims data, federal and state Medicaid expenditures for personal care services totaled about $1.2 billion in FY 1987.
-
Palley and Oktay (1989) completed their seminal research on the PC-Option when this study began. Three other studies commissioned by the Commonwealth Fund informed much of the work in this project. Lewis-Idema et.al. (1990) did a phone survey of all the PC-Option programs. Charles Sabatino (1990) did site visits to programs using independent providers. Marshal Kapp (1990) looked at liability issues in relation to independent provider models of service delivery. One other study, done by Diane Justice et.al (1988) for the National Governor’s Association, was also very useful.
-
Some of the PC-Option states allow people to meet a “Medically Needy” income standard that differs from the SSI income standard (Table 1). In most medically needy states the medically needy standard is somewhat higher than the SSI standard, but not in all of them. Medically-needy individuals must either meet the income and resource criteria for a state’s medically needy program or …”have sufficient medical expenses to reduce their countable income to medically-needy income levels” (State Medicaid Information Center, p.5). In addition, there are several states, called 209(b) states (after the section of the legislation covering this option) which have more restrictive income, resource or disability requirements than SSI for Medicaid eligibility. The 209(b)states with more restrictive income standards than SSI must allow for a spend-down to this standard even if the state does not have a spend-down provision. Hence PC-Option recipients in North Carolina and Utah have incomes that are below 74% of poverty, the SSI income standard.
-
The large drop in programs allowing services at times of the day or week when the individual may need them may be due to a difference in the way the question was worded in the two survey years. In 1988 administrators may have thought we were asking if they provide 24-hour-a-day-services.
-
This drop in use of government civil servants may be spurious because the 1985 survey did not distinguish between civil service and non-civil service employees.
-
Litvak, S., J. Heumann, & H. Zukas (1987). Attending to America: Personal Assistance for Independent Living, Berkeley, CA:: World Institute on Disability.
-
The World Institute on Disability has, in fact, been funded by the National Institute on Disability Rehabilitation Research (NIDR) to conduct case studies on representative programs from each funding source, and by the Department of Health and Human Services to conduct site visits to select Medicaid PC-Option programs.
SURVEY OF MEDICAID PERSONAL CARE PROGRAMS -- REPORTS AVAILABLE
Case Studies of Six State Personal Assistance Service Programs Funded by the Medicaid Personal Care Option
HTML http://aspe.hhs.gov/daltcp/reports/1991/casestud.htm
PDF http://aspe.hhs.gov/daltcp/reports/1991/casestud.pdf
Policy Issues Affecting the Medicaid Personal Care Services Optional Benefit
Executive Summary http://aspe.hhs.gov/daltcp/reports/1991/optnales.htm
HTML http://aspe.hhs.gov/daltcp/reports/1991/optnal.htm
PDF http://aspe.hhs.gov/daltcp/reports/1991/optnal.pdf
To obtain a printed copy of this report, send the full report title and your mailing information to:
U.S. Department of Health and Human Services
Office of Disability, Aging and Long-Term Care Policy
Room 424E, H.H. Humphrey Building
200 Independence Avenue, S.W.
Washington, D.C. 20201
FAX: 202-401-7733
Email: webmaster.DALTCP@hhs.gov