
U.S. Department of Health and Human Services
Analysis of Channeling Project Costs
Craig Thornton, Joanna Will and Mark Davies
Mathematica Policy Research, Inc.
March 1985, Revised May 1986
PDF Version: http://aspe.hhs.gov/daltcp/reports/1986/projcost.pdf (107 PDF pages)
The paper was written as part of contract #HHS-100-80-0157 between the U.S. Department of Health and Human Services, Office of the Assistant Secretary for Planning and Evaluation, Office of Social Services Policy (now the Office of Disability, Aging and Long-Term Care Policy(DALTCP)) and Mathematica Policy Research, Inc., and contract #HHS-100-80-0133 between DALTCP and Temple University. Additional funding was provided by the HHS Administration on Aging and HHS Health Care Financing Administration (now the Centers for Medicare and Medicaid Services). For additional information about this subject, you can visit the DALTCP home page at http://aspe.hhs.gov/_/office_specific/daltcp.cfm or contact the office at HHS/ASPE/DALTCP, Room 424E, H.H. Humphrey Building, 200 Independence Avenue, S.W., Washington, D.C. 20201. The e-mail address is: webmaster.DALTCP@hhs.gov. The Project Officer was Robert Clark.
This report was prepared for the Department of Health and Human Services under Contract Number HHS-100-80-0157. The DHHS project officer is Robert Clark, Office of the Secretary, Department of Health and Human Services, Room 447F, Hubert H. Humphrey Building, Washington, D.C. 20201. The opinions and views expressed in this report are those of the authors. They do not necessarily reflect the views of the Department of Health and Human Services, the contractor or any other funding organization
TABLE OF CONTENTS
- I. OBJECTIVES OF THE REPORT, ANALYTIC FRAMEWORK, AND DATA SOURCES
- A. Objectives
- B. Guide to the Report
- C. Overview and Framework of the Analysis
- D. Data Sources
- II. THE DEMONSTRATION: OPERATIONS AND EVALUATION
- A. Objectives of the Demonstration
- B. Project Structure and Administration
- C. Analytical Phases of the Demonstration
- D. Evaluation Design Overview
- III. OVERALL DEMONSTRATION COSTS
- A. Total Demonstration Costs -- September 1980 through June 1984
- B. Total Costs of Core Channeling and Administration Functions and Caseload Measures by Site During Steady State Phase
- C. Direct Service Expenditures
- D. Special Demonstration Costs
- IV. CASE MANAGEMENT FUNCTION COSTS DURING STEADY STATE PHASE
- A. Methodology
- B. Estimated Average Costs of the Core Functions
- V. COMPARISON OF THE ESTIMATED CASE MANAGEMENT COSTS OF CHANNELING WITH OTHER CASE MANAGEMENT PROGRAMS
- VI. IMPLICATIONS FOR COSTS OF FUTURE CASE MANAGEMENT PROGRAMS
- A. Special Features of Demonstrations
- B. Estimating the Average Per Client Cost of a Case Management Program
- C. Summary
- APPENDICES
- APPENDIX A: Supplementary Tables
- APPENDIX B: Data Handling Procedures
- APPENDIX C: Glossary
- LIST OF EXHIBITS
- EXHIBIT 1. Schedule A: Statement of Funds Applied for Quarter
- EXHIBIT 2. Schedule B: Statement of Project Expenses for Month
- EXHIBIT 3. Schedule C: Public Voucher for Purchases and Services Other Than Personal
- EXHIBIT 4. Schedule D: Statement of Research Activity for Month
- EXHIBIT 5. Long-Term Care Channeling Demonstration Time Sheet
- EXHIBIT 6. Site Monthly Caseload Report
- EXHIBIT 7. DHHS Monthly Statistical Monitoring Report
- LIST OF FIGURES
- FIGURE II.1: Organization of the Demonstration Projects
- FIGURE II.2: Analytical Phases of the Demonstration
- LIST OF TABLES
- TABLE III.1: Costs of the Demonstration Through June 1984
- TABLE III.2: Caseload Measures in the Demonstration
- TABLE III.3: Total Project- and State-Level Costs for the Steady State Phase, October 1983 - June 1984
- TABLE III.4: Caseload Measures for the Steady State Phase
- TABLE III.5: Percent Distribution of Direct Service Expenditures for the Steady State Phase by Source, by Project
- TABLE III.6: Direct Services Expenditures Per Ongoing Case Month for the Steady Phase, by Service and by Project
- TABLE IV.1: Estimated Distribution of Salary Expenditures by Function, Steady State Period
- TABLE IV.2: Estimated Total Costs of Core Functions by Project, Steady State Phase
- TABLE IV.3: Estimated Average Costs of Initial Functions Per Client and Ongoing Functions Per Ongoing Case Month for Steady State Phase
- TABLE IV.4: Comparisons of Costs with Factors Affecting Cost for Steady State Phase
- TABLE V.1: Comparison of Average Case Management Costs of Channeling with Other Demonstrations
- TABLE VI.1: Average Initial Functions Cost Per Client, Number of Persons Screened Per Eligible, and Dropout Rates for Steady State Phase
- TABLE VI.2: Estimated Unit Costs of Initial Functions for Steady State Phase
- TABLE VI.3: Calculating Average Fixed Cost Estimates Under Alternative Assumptions of Eligibility and Dropout Rates
- TABLE VI.4: Factors for Estimating Average Financial Commitment Per Client
- TABLE VI.5: Average Financial Commitment Per Client Under Alternative Assumptions of Average Length of Stay
- TABLE A.1: Federally Reimbursed Planning Phase Expenditures: Basic Case Management Model
- TABLE A.2: Federally Reimbursed Planning Phase Expenditures: Financial Control Model
- TABLE A.3: Total Project- and State-Level Costs
- TABLE A.4: Percentage of Project Employee Salary Expenditures by Function
- TABLE A.5: Caseload Measures in Randomization Period of Buildup Phase
- TABLE A.6: Total Costs of Core Functions Randomization Period of Buildup Phase
- TABLE A.7: Average Costs of Initial Functions Per Client and Ongoing Functions Per Ongoing Case Month
- TABLE A.8: Direct Services Expenditures Per Ongoing Case Month, by Service and by Project for Randomization Period of Buildup Phase
- TABLE A.9: Percent Distribution of Direct Service Expenditures by Source, by Project for Randomization Period of Buildup Phase
- TABLE A.10: Summary of Host Agency Fringe Benefits and Overhead Rates for Randomization Period of Buildup Phase
- TABLE A.11: Percentage of Core Channeling and Administration Costs by Accounting Category and by Project: Steady State Phase
- TABLE A.12: Total Project- and State-Level Costs Through June 1984
- TABLE A.13: Average Wages of Project Staff and Wage Indexes of Workers in Site Areas by Site
- TABLE A.14: Caseload and Staffing for Steady State Phase
- TABLE A.15: Estimated Screening Costs for Controls, by Project
ACKNOWLEDGMENTS
This report is the culmination of research into the costs of providing the channeling case management services central to the National Long Term Care Demonstration. As this work proceeded from its initial design five years ago to data collection and finally to analysis, many individuals contributed to its successful progress. Most importantly, Sharon Davis provided an essential consistency to the research. She helped implement the cost analysis design and managed the entire data collection effort. Also, her analysis of costs incurred during the early phases of the demonstration was instrumental in shaping the final analysis presented here. Tom Grannemann, Judith Wooldridge, Robert Coburn, and Frances Parkman developed the initial cost analysis design. Robert Applebaum, Raymond Baxter, George Carcagno, Peter Kemper, David Long, Barbara Phillips, and Felicity Skidmore provided advice, comments, and encouragement during the course of the research. Finally, Marjorie Mitchell coordinated the production of the report along with Marilyn Gourovitch, Susan Klett, Annette Protonentis, Michele McNulty, Linda Pineda, and Monica Capizzi.
We also acknowledge the efforts of the DHHS demonstration staff and the staff in the ten demonstration states and projects who implemented the channeling intervention. These persons, particularly the site directors and project and state financial officers, provided the data that underlie our analysis. We greatly appreciate their efforts in providing these data and answering our frequent questions about costs and operations. These efforts are all the more impressive given the pace and demands of demonstration operations.
Craig ThorntonJoanna WillMark Davies
EXECUTIVE SUMMARY
The U.S. Department ofHealth and Human Services established the National Long Term Care Demonstration to test two channeling models for organizing community care for the elderly. Both models offered individuals who were at risk of institutionalization a systematic assessment of their needs and ongoing case management to arrange and monitor the provision of services. The models differed with respect to how community services were provided to clients. One model, the basic case management model, managed services that were available to clients in the community and added a modest amount of funding for purchasing services that were unavailable through other sources. The second model, the financial control model, expanded the range and availability of publicly financed services but, at the same time, instituted cost control features that placed a cap on average and per-client expenditures. The overall evaluation was designed to determine the impact of the two models on the utilization of services and informal caregivers and on client well-being, as well as to assess the feasibility of implementing future channeling-type programs and the cost effectiveness of the channeling concept.
In this report we examine a small but key aspect of channeling: the costs of operating the demonstration. We estimate the total and average costs incurred by the 10 demonstration projects that implemented the channeling intervention, as well as the total costs of the state agencies that oversaw the projects and the technical assistance contractor. This cost information provides quantitative information about the magnitude and allocation of the resources used to implement channeling. It thus provides important background for understanding the nature of this intervention and for budgeting any future efforts in this area. The analysis covers costs incurred from the beginning of active demonstration planning (September 1980) up through a period of sustained full-scale operation (June 1984). The demonstration's closeout period (July 1984 to March 1985) is excluded. While all costs are reported, the report focuses on the costs during the steady state phase between October 1983 and June 1984. During this time, the demonstration most closely resembled an ongoing nondemonstration program, since the phase emphasized providing ongoing service to clients rather than building caseloads.
We disaggregated case management costs into two general types--initial costs and ongoing costs, which were quite similar under the two channeling models. The initial costs include the one-time-only functions associated with identifying and enrolling a client. Specifically, these were the costs for case finding, screening, baseline assessment, initial care planning, and their related administrative, provider relations, and clerical support. The basic case management model projects spent $330 per client for these initial functions, while financial control model projects spent an average of $346. Ongoing costs were incurred to provide ongoing case management services plus the associated administrative, provider relations, and clerical support. The basic model projects spent an average of $92 per casemonth for these ongoing services, and the financial control model projects spent an average of $86 per casemonth.
Of course, while average case management costs were similar underthe two models, the ten demonstration projects exhibited considerable cost variation. While it is difficult to identify all the causes for this variation, project scale, staff wage levels, general organization and management practices, client attrition rates, local environment, and the geographic dispersion of clients all seemed to be an influence.
The administrative, provider relations, and clerical costs were a major component of project case management costs. We estimate that they accounted for approximately 40 percent of the initial costs under both models. Furthermore, we estimate that they accounted for 45 percent of the ongoing costs under the basic model and 59 percent of ongoing costs under the financial control model. The higher administrative costs for the financial control model appear to reflect the operational costs of its data system to monitor expenditures for direct services.
While the projects were similar in terms of their average expenditures for case management services, their expenditures for direct services differed substantially. The basic model projects spent approximately $38 per casemonth for direct services, while the financial control model projects spent $471 per casemonth. This difference reflects the pooling of funds from Medicare, Medicaid, and other public sources under the financial control model, as well as the relatively limited funds available to the basic model projects to fill service gaps. Of course, these expenditures represent only part of the total spent on services for clients and should be considered along with the expenditures and savings for all funding sources and for all services. (This comprehensive view is presented in an associated benefit-cost report.)
Our analysis of case management costs also revealed the following findings about the overall costs through June 1984:
-
The ten demonstration projects incurred costs of $23 million as they prepared for and subsequently provided case management and long term care services to clients between September 1980 and June 1984.
-
In addition to the project costs, the states spent $2.8 million and the technical assistance contractor spent $1.6 million between September 1980 and June 1984.
-
During the period studied, the basic case management projects enrolled 3,300 clients; the financial control projects enrolled 3,900 clients. Altogether, over 51,000 ongoing casemonths of service were provided by the 10 projects.
-
The five basic case management projects spent $4.6 million and the five financial control projects spent $5.1 million to perform the core channeling and administration functions (case finding, screening, initial needs assessment, initial core planning, and ongoing case management) through June 1984.
-
In addition,through June 1984, the 'five financial control projects spent $12 million to purchase direct services, while the five basic case management projects spent only $800,000 for direct services. The projects spent most of this money for homemaker/personal care, skilled nursing, and home health aide services.
The cost estimates presented here correspond to the demonstration as it was fielded. They therefore reflect the small scale, extra administration, and research activities that are part of a demonstration. The research costs were estimated to be about one percent of total project-level costs. The net effect of the other demonstration-specific features is unknown. Resources were also used by the federal government in its oversight role. These costs are excluded from our analysis because accurate data about their magnitude are unavailable.
Other literature about channeling-type projects indicates that estimated average costs for channeling are comparable with those of other demonstrations. This comparability suggests that these cost estimates should provide a good foundation for budgeting future channeling programs, although the substantial cross-project variation in costs observed in the channeling demonstration suggests that program size, specific management policies, and local environments play a strong role in determining actual costs.
The cost analysis of different case management functions, the key analytical element in our evaluation, is presented in Chapter IV. The comparison with case management costs in other community care demonstrations is presented in Chapter V. We also present essential background information on the projects--our data, total costs, and the number of clients served--in the first three chapters. Other relevant information is presented in a process analysis report (Carcagno et al., 1986) and a benefit-cost analysis report (Thornton and Dunstan, 1986).
I. OBJECTIVES OF THE REPORT, ANALYTIC FRAMEWORK, AND DATA SOURCES
This report examines a small, but key, aspect of the National Long Term Care Demonstration: the costs of providing the case management functions central to the channeling intervention. Channeling is expected to affect a wide range of other costs--for example, the costs incurred by channeling clients for hospital and nursing home services--that are examined in separate reports. Here we focus on the operations costs from the perspective of the channeling projects. Specifically, we examine how much these projects spent to provide case management services to clients.
This analysis of operations costs is part of a larger evaluation of the demonstration. The U.S. Department of Health and Human Services (DHHS) funded this effort to assess whether implementing a case management program through which functionally limited elderly clients are channeled to appropriate community-based services would result in cost savings to the overall long term care system while improving the well-being of clients. Clearly, the costs of providing the intervention are a key component in determining whether the intervention generated the desired net savings.
A. OBJECTIVES
This report serves three purposes. First, it presents quantitative information about the magnitude and allocation of resources used to operate the demonstration projects and thereby presents an additional perspective on the implementation of channeling. This information supplements the qualitative research of the accompanying process analysis (Carcagno, et al. 1985) that documents the implementation and operations of the demonstration.
Second, it provides information helpful to persons interested in planning and budgeting case management programs like channeling. This report provides information about the average costs of conducting the individual functions necessary for operating a case management program of this type and demonstrates how this data may be used to estimate the total average per client financial commitment in similar case management programs. It also discusses how the special features of a demonstration and various organizational, and environmental factors may affect these cost estimates with respect to budgeting ongoing, nondemonstration programs.
Third, it estimates the costs of the case management functions of channeling as an essential component of an assessment of whether channeling represents an efficient use of resources. This issue is addressed in the benefit-cost analysis, which is to be presented in a separate report. That report will provide a means for comparing the resources used to provide the case management functions of channeling with the impacts of channeling on client well-being and service use. In the benefit-cost analysis the estimated costs of the case management system of channeling that correspond to the observed impacts will be based on the operations cost estimates presented here.
B. GUIDE TO THE REPORT
The following section of this chapter presents the cost analysisframework and defines the relevant cost concepts used in the analysis. A glossary that provides a listing of the various concepts and terms is presented in Appendix C. The final section of this chapter describes the data sourcesused to estimate the costs ofthe demonstration and the case management system of channeling.
Chapter II provides an overview of the objectives and the structural components of the channeling demonstration that have influenced our analytic framework and are central to understanding the operational costs of channeling and for comparing the costs of channeling with those of other long term care programs.
Chapter III and Chapter IV present estimates of the costs incurred during the demonstration. Chapter III presents the costs incurred at the various organizational levels involved in the demonstration from September 1980, when state lead agencies first signed demonstration contracts, through June 1984. Chapter III also presents data on the caseloads served in this period. Chapter IV focuses on the costs of the case management functions performed by the demonstration projects. The emphasis of Chapter IV is on those costs incurred during what is referred to as the steady state phase, from October 1983 through June 1984; this is the phase of the demonstration most resembling an ongoing program. Chapter V compares the estimated costs of the case management system of channeling with the costs observed for previous case management programs. And finally, Chapter VI demonstrates how the demonstration case management cost estimates can be used to estimate the magnitude of the average financial commitment per client in similar case management programs.
C. OVERVIEW AND FRAMEWORK OF THE ANALYSIS
As the first step in the analysis, this section reviews the framework used for analyzing the costs of providing the channeling case management functions,identifies the costs analyzedin this report, and clarifies theconcepts used. (Theseconcepts are summarizedin the Glossary provided in Appendix C.)
1. Resource Costs
This report estimates the resource costs of channeling operations, i.e., the value of the resources used to perform the case management functions of channeling. This focus is consistent with that of the benefit-cost analysis, which provides the framework for evaluating whether channeling represents a desirable allocation of society's resources. As measured in this analysis, total resource costs include actual expenditures and the value of in-kind or donated services or supplies. Thus, the resulting estimates indicate the total value of resources needed to provide case management services.
2. The Costs of Channeling: Major Focus on Costs of Case Management Functions
Channeling provides a managed system of community-based services to the elderly in need of long term care. For analytical purposes, we separated the costs of the case management functions, the focus of this report, from the costs of the long term care services purchased directly for clients by the channeling projects. (These services, referred to as direct services, included homemaker/personal care, skilled nursing, home health aides, home delivered meals, and other community-based services.) The case management functions included identifying and recruiting the population of functionally limited elderly most appropriate for community care, collecting information about individual needs and appropriate services, arranging for and coordinating community-based services that most appropriately and efficiently meet those needs, and monitoring and reassessing client's conditions, needs, and service receipt. For the purposes of the report we aggregated the case management functions into five categories: (1) casefinding/outreach, (2) screening, (3) baseline needs assessment, (4) initial care planning, and (5) ongoing case management. These functions are referred to as the core channeling functions.1 The total costs of the case management functions also include the costs associated with the administrative, provider relations, and clerical functions necessary to perform the core functions.
We examine both costs of the case management functions and direct service expenditures. However, the major focus is on the costs of case management (including all administrative, provider relations, and clerical functions). The direct service expenditures are presented only from the perspective of the demonstration projects; that is, we report only the funds spent by projects for the purchase of direct services. Individuals and other agencies also purchased community-based long term care services for clients; therefore, this project perspective provides an incomplete view of service use by clients. A more complete view will be provided in the impact analyses, which will adopt a more comprehensive perspective.
3. Emphasis on Steady State Phase
As explained more fully in Chapter II, the demonstration underwent various phases including an early planning phase, a subsequent initial operational phase in which the emphasis was on building caseloads, and a period in which caseloads had stabilized and the focus of projects had shifted to ongoing case management.2 This latter period is referred to as the steady state phase. Data on the costs of performing the case management functions were collected throughout these three phases of the demonstration. The costs incurred during each are presented and discussed in Chapter III. However, emphasis is on the costs of the case management functions incurred during the steady state phase.
We focus primarily on the case management functions costs incurred during the steady state phase for several reasons. First, this was the period in which the greatest emphasis was placed on ongoing case management activities, as would be the case in an ongoing program. During the initial operational phase the major objective was building caseloads, and channeling staff focused on recruiting and assessing new applicants. Second, we expect that costs of the earlier operational phase reflected the usual sorts of startup problems as new procedures were tried and implemented. Finally, costs of the earlier period reflected greater resource use attributable to the research (e.g., recruiting and screening eligible applicants who were subsequently assigned to the control group) and other aspects related to the fact that channeling was a demonstration. As discussed in Chapter III, projects were still required to perform various research-related activities during the steady state phase (e.g., sending cost and client tracking data collection forms to the .evaluation contractor), yet the costs incurred due to the research requirements and other aspects of the demonstration were substantially lower during this later phase.
4. Organizational Levels in the Demonstration
The case management functions were implemented through 10 local projects housed in host agencies that were under contract to state agencies. These state agencies, in turn, were under contract to the federal government, and were responsible for supporting and overseeing implementation of the local channeling projects as well as for coordinating state long term care planning activities. The federal government played an active role during the demonstration planning phase and during subsequent operational phases as it monitored caseload buildup, outreach, and casefinding activities in addition to performing its traditional management functions such as monitoring, budget review, and contract compliance.
Most of the discussion in this report is on the costs incurred at the project level (which includes projects' subcontractors), since it is at this level that clients were recruited, screened, and provided all other case management services. The costs incurred at the state level are presented in Chapter III. Data on the costs incurred at the federal level by government staff managing the projects are unavailable.
The federal government also funded both a technical assistance contractor, The Temple University Institute on Aging, to help projects train staff and develop clinical instruments and record-keeping procedures, and an evaluation contractor, Mathematica Policy Research, Inc. The costs incurred by the technical assistance contractor and the evaluation contractor are included in the presentation of the overall demonstration costs in Chapter III.
5. Special Demonstration Costs
As suggested earlier, the projects incurred a number of costs that are attributable to the demonstration aspects of channeling. That is, certain observed costs would not have occurred in an ongoing, nondemonstration program. These costs include the value of the time and resources expended to meet the research requirements and other aspects related to the unique nature of the demonstration (e.g., demonstrationwide meetings with supervisors and any extra costs associated with the small scale of local projects).
As discussed in more detail in Chapter III, some of these costs are difficult to distinguish and estimate. We do, however, attempt to estimate the costs incurred because of the research requirements of the demonstration. During the steady state phase of the demonstration these costs were much smaller than those incurred during the earlier operational phase since, as described further on in the report, the major portion of the project-level research activities were concluded by the beginning of the steady state phase.
D. DATA SOURCES
Four major data sources were used in the analysis: (1) the channeling project cost records completed periodically by states, projects, and project subcontractors, (2) timesheet data submitted by project and subcontractor staff, (3) records on client participation collected through the client tracking system, and (4) interviews with project, host agency, and federal staff.
1. Channeling Project Cost Records
The state channeling agency, the local projects, and their subcontractors completed several forms that reported funds sources, expenditures, the value of in-kind resources used, and estimates of staff time devoted to research tasks. Samples of the various schedules are included in Appendix B.
The Statement of Funds Applied (Schedule A) was completed quarterly by the state and project agencies. This schedule reported the sources of funds that were spent during the quarter, including donated goods and services.
The first part of the Statement of Project Expenses (Schedule B, page 1) was completed monthly by states and projects (including their subcontractors). This schedule reported expenditures for all purposes, other than direct service purchases, in 19 accounting categories (e.g., salaries, fringe benefits, transportation, and supplies). The schedule included total expenditures, federally reimbursable expenditures, and the estimated value of in-kind resources.3
The second part of the Statement of Project Expenses (Schedule B, page 2) reported expenditures for purchasing direct services. This form was completed monthly only by the channeling project agency. For the financial control projects this form recorded expenditures from the funds pool by service type. For the basic case management projects the form recorded gap-filling expenditures by type of service.4
The Statement of Research Activity (Schedule D) was submitted monthly by channeling projects. On this schedule projects estimated the amount of staff time spent on various research tasks, such as photocopying baseline assessments and other forms that had to be sent to the evaluation contractor, or interviews, discussions, and correspondence with the evaluation contractor. Schedule D excluded the amount of staff time spent working with applicants later assigned to the research control group. These research-related costs were estimated separately.
2. Timesheets
Timesheets were completed by local project staff, including projects and their subcontractors, on a semi-monthly basis. Timesheets reported the estimated number of hours each staff member spent in six functional areas: (1) casefinding/outreach, (2) screening, (3) baseline assessment, (4) initial care planning, (5) ongoing case management/reassessment, and (6) administration/provider relations/clerical. Timesheets for the buildup phase were collected from the month in which clients first enrolled at each project through March 1983; timesheets for the steady state phase were collected from October 1983 through March 1984.4
3. Client Tracking System
The client tracking system was a system of forms, completed by projects, on each client. These forms indicated the date that each of the core functions was completed for each client. Therefore, they indicated the elapsed time all clients spent in each functional area, as well as terminations and reactivations. This was the evaluation's main source information on participation and was used to estimate the number of participating clients and the number of ongoing case months provided by projects.
4. Process Analysis Field Interviews
Two rounds of interviews with state and local channeling project staff, the federal project management team, the national technical assistance contractor, service providers (including providers of other case management services), referral sources, and local long term care officials were conducted. These interviews helped to relate events to phases, to understand fiscal procedures, and to describe the extent of in-kind resources.
II. THE DEMONSTRATION: OPERTAIONS AND EVALUATION
This chapter provides an overview of the objectives, structure and administration, and analytical phases of the demonstration, as well as its design and purpose. The chapter emphasizes those aspects of the demonstration that are key to understanding the operational costs of channeling and for comparing the costs of channeling with the costs of other long term care programs.
A. OBJECTIVES OF THE DEMONSTRATION
The demonstration was designed to coordinate long term care services to the frail elderly in the most effective manner. It stressed community-based alternatives to institutionalization in nursing homes or hospitals, and its primary objective was to coordinate community-based services in an effort to minimize overall system costs while maintaining or improving the well-being of clients.
1. Target Population
Through a standardized screening process, the channeling demonstration attempted to identify functionally limited elderly persons at risk of institutionalization. Although final data on rates of institutionalization are not yet available, baseline characteristics showed that the demonstration clients were extremely frail. Over 72 percent were disabled in their ability to perform two or more basic activities of daily living (eating, transfer, toileting, dressing, and bathing), and virtually all were impaired in their ability to conduct key instrumental activities of daily living (particularly meal preparation, housekeeping, shopping, and transportation). The clients generally suffered from some impairment in their mental functioning, and a substantial proportion exhibited poor health conditions due to arthritis, heart trouble, or high blood pressure. Finally, 86 percent had experienced a stressful life event (that is, the death of a spouse or close friend, the onset of a major illness or the worsening of a health condition, or change in marital status) in the six months prior to their enrollment.5
2. Core Functions
Channeling was designed to affect client well-being, service use, and the cost of care primarily by coordinating the long term care service needs of clients with the services available in the community, including informal care by family and friends. In developing the demonstration, seven core channeling functions were identified as the minimum set of functions deemed necessary to achieve this objective:
-
Casefinding/outreach, to identify and attract the target population. The projects worked with hospitals, discharge planners, and other agencies that referred potential clients to channeling. The channeling projects also engaged in various community education activities to provide information on channeling to the frail elderly who were not being served by the current system.
-
Screening, to determine whether an applicant was part of the target population. Ineligible applicants were referred back to the referral agency or, if they applied themselves or were referred by a family member, to an information and referral agency.
-
Comprehensive needs assessment, to determine individual problems, resources, and service needs. Using a structured assessment instrument, channeling staff collected information on the physical and mental functioning ability of the clients, their service needs, financial resources, eligibility for services, family situation, living arrangement, etc., which served as the basis for the care plan developed by the case manager.
-
Care planning, to specify the types and amount of care to be provided to meet the identified needs of individuals. The care plan included both formal care and care provided by family and friends (informal care).
-
Service arrangement, to implement the care plan through both formal and informal providers.
-
Monitoring, to ensure that services were provided as called for in the care plan or were modified as necessary.
-
Reassessment, to adjust care plans to changing needs. Reassessment was undertaken three months after program entry and every six months thereafter (or earlier if a client's status changed).
As noted earlier, we have aggregated these functions into five categories: (1) casefinding/outreach, (2) screening, (3) baseline assessment, (4) initial care planning, and (5) ongoing case management, which includes service arrangement, monitoring, and reassessment. We refer to these functions collectively as the five core functions.
3. Intervention Models
The channeling demonstration tested two variants of a managed system of long term care: the basic case management model and the financial control model. The basic case management model tested the premise that the major problems in the current long term care system pertain to insufficient information, access, and coordination and that these problems can be largely solved by client-centered case management. The financial control model, alternatively, represented a more fundamental change in the current long term care system by broadening the range of community-based services for which public funds were available and relaxing certain eligibility requirements while at the same time imposing several mechanisms intended to control costs.
The Basic Case Management Model. The basic case management model relied primarily on the five core functions to coordinate the existing system of service providers and government programs. In addition to these core functions, the basic case management model included a limited amount of funding (referred to as gap-filling dollars) to be used for the direct purchase of supplemental services to overcome gaps in existing services or funding sources that inhibited delivery of appropriate services to a client. However, because this funning was limited, case managers relied primarily on the existing system of long term care services, working with home service providers and the complex set of existing requirements. Although client cost sharing was not mandated as part of the basic case management model, relatively informal cost sharing mechanisms were adopted in the basic model, and clients who exceeded income eligibility guidelines were required to pay for part of their care.6
The Financial Control Model. The financial control model added to the five core functions certain elements designed to address two limitations of the long term care system that the basic case management model accepted as given. The first limitation is the restriction on the types of community services for which public funds are available. In general, Medicare and Medicaid home care focuses on short-term acute care, including intermittent skilled nursing, home health aide, and therapy. In the financial control projects, case managers had the option of paying for a wider range of community-based services, specifically:7
| Day health and rehabilitative care | Physical therapy |
| Day maintenance care | Speech therapy |
| Home health aide services | Occupational therapy |
| Homemaker/personal care services | Mental health services |
| Housekeeping services | Transportation services |
| Chore services | Housing assistance |
| Companion service | Adult foster care |
| Home delivered meals | Nonroutine consumable medical supplies |
| Respite care | Adaptive and assistive equipment |
| Skilled nursing |
The second limitation addressed by the financial control model is the current systems varied and overlapping funding sources and eligibility requirements for community services. The financial control projects paid for services using a pool of service dollars, the funds pool. It was financed by Medicare, Medicaid, and other government programs, and was more than fifteen times greater than the gap-filling dollars available under the basic case management model. Thus, in arranging for services the channeling case manager did not have to depend on a client's eligibility for particular categorical programs (although all financial control clients had to be Medicare eligible).
Case managers under the financial control model generally had the power to authorize the amount, duration, and scope of services paid from the funds pool, within a maximum cap placed on average service expenditures per client for the entire caseload of each channeling project. Average per client expenditures for the caseload were not permitted to exceed 60 percent of the average of the state's Medicaid reimbursement rates for intermediate care facilities (ICF) and skilled nursing facilities (SNF) in the project site. A computerized financial control system (FCS) was used to monitor the average per client service expenditures for the entire caseload. Within the 60 percent average cap, the costs of individual care plans were allowed to vary, although a limit was also placed on annual expenditures for each individual. This limit, which could be exceeded with specific state approval, was set at 85 percent of the state's average Medicaid reimbursement rates for ICF and SNF care.
Individuals whose incomes were above a specified level were required to share in the cost of their services. Sixty percent of the receipts from such cost sharing were returned to the DHHS Office of Direct Reimbursement (ODR), and the remainder could be used by the local project.
B. PROJECT STRUCTURE AND ADMINISTRATION
1. Federal Role
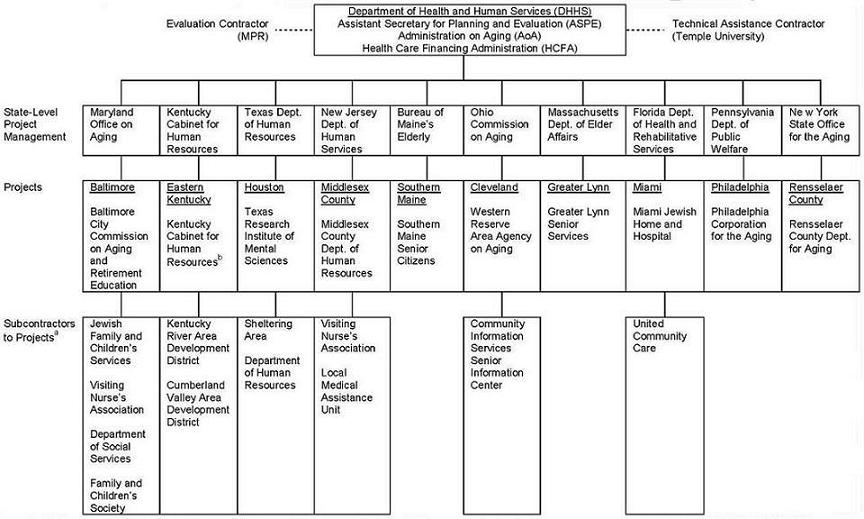
Within DHHS, the Office of the Assistant Secretary for Planning and Evaluation (ASPE), the Administration on Aging (AoA), and the Health Care Financing Administration (HCFA) jointly administered the demonstration. An intradepartmental steering committee consisting of the executive leadership of ASPE, AoA, and HCFA oversaw the policy aspects of the demonstration. The steering committee designated a program management team, directed by the ASPE program manager, to oversee the implementation and operation of the channeling research and demonstration activities. Government project officers from HCFA and AoA oversaw and provided technical direction to the channeling states and projects; the federal contracts office in the Office of the Secretary was responsible for contract administration.
The federal project management team and government project officers played active roles in the design, development, and ongoing monitoring of the channeling projects. Particularly during demonstration planning, they devoted time to help projects meet the overall demonstration design and research requirements. As operations began, monitoring efforts focused particularly on caseload buildup, outreach, and casefinding activities.
| FIGURE II.1. Organization of the Demonstration Projects |
 |
|
In addition to traditional federal management activities, such as budget review and contract compliance monitoring, the government initiated a number of special monitoring and accountability mechanisms. Each month, the states and projects completed progress reports designed specifically for the demonstration. The federal management team organized biweekly conference calls with the project directors (both individually and collectively), periodic national meetings with project directors8 and with technical assistance contractor, and site monitoring visits. It also issued written technical guidelines to clarify the various operational issues.
Part of the financial control project funds pool received federal funding under Section 222 Medicare waivers. Because these funds were processed by the Office of Direct Reimbursement (ODR) in HCFA, ODR also helped monitor the financial control projects. ODR verified that clients in the financial control projects were Medicare eligible, and performed quarterly reviews of actual expenditures for services under the funds pool.
2. State and Project Structure
The overall project structure is summarized in Figure II.1. In turn contracted with local agencies (which were selected by DHHS) to host the projects in 10 communities. Some projects subcontracted one or more of the core functions (screening, assessment, initial care planning, and ongoing case management).
State lead agencies were responsible for coordinating state long term care planning activities and for contributing to and overseeing the implementation of the local channeling projects. At the state level responsibility for channeling was assigned to an existing unit, most commonly to a unit responsible for planning, policy analysis, or demonstrations. Some states donated staff time and provided in-kind services and supplies to projects.
Each of the states that were selected to implement a channeling project originally proposed two or three local host agencies. DHHS then selected one host agency from each state to operate the demonstration, based on its leadership in the field of aging or experience with coordinating long term care services, its history of organizational stability and effectiveness, and its role among providers in the community.9 Host agencies were responsible for housing the local demonstration project. They hired initial local demonstration staff, prepared the site operational plan, interacted with state lead agencies, and assisted in the details of operations and in the relationships with referral sources and providers. Host agencies typically treated the demonstration projects as component programs of their overall operations; although channeling project directors were allowed considerable administrative discretion, they were to adhere to the regular policy and administrative oversight of the host agency. In addition to their role in monitoring the channeling project, many host agencies also provided central administrative and fiscal support.
The local channeling projects developed a variety of approaches to organizing the core channeling functions of screening, needs assessment, care planning, service arrangement, and ongoing case management. The major variants involved decisions to subcontract all or parts of the core functions to one or more other agencies, to decentralize functions to other locations and to use separate staff to perform the assessment function and the care planning and service arrangement functions. Because of an evaluation requirement that the screening function be an administratively separate activity, it was the function that was most frequently subcontracted to a separate agency.10 The case management function was also subcontracted at some projects.
C. ANALYTICAL PHASES OF THE DEMONSTRATION
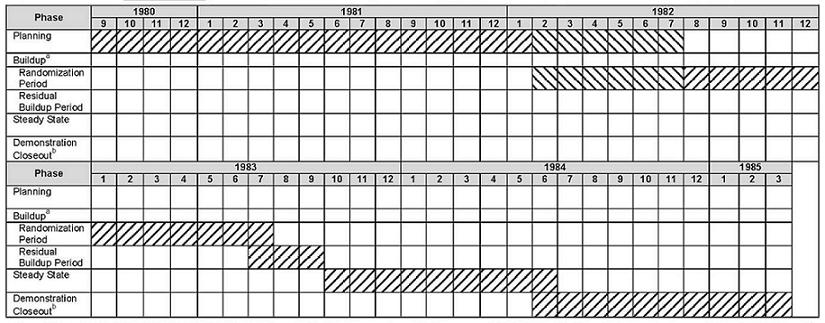
For analytical purposes, demonstration activities were divided into four time periods that correspond to the major operational phases of the demonstration. The four analytical phases (illustrated in Figure II.2) are planning, buildup, steady state, and demonstration closeout.
Planning Phase. The planning phase began the first month in which states incurred costs under the demonstration contracts (generally September 1980) and concluded at the end of the month prior to client enrollment. The first basic case management projects began accepting clients in February 1982. The first financial control model projects began in May 1982. All projects were operational by June 1982. During this phase, the states prepared detailed project proposals that served as the basis for DHHS selection of sites and host agencies. In September, 1981 DHHS designated the five financial control and five basic case management sites and the projects began preparing detailed operational plans that were completed in December, 1981. Local host agencies and projects prepared internal management and operations procedures, hired and trained staff, negotiated referral agreements and service contracts, and conducted other activities essential to operating the demonstration.
| FIGURE II.2. Analytical Phases of the Demonstration |
 |
|
Buildup Phase. The demonstration's buildup phase contained two parts. The first was the randomization period which extended from the month when client enrollments began through the month in which research sample size targets were attained, generally through June 1983.11 This period represents approximately the first full year of project operations. During this period, projects hired and trained staff; implemented procedures for the core functions, administration, and reporting; expanded and developed relationships with providers; and began working with clients. Outreach activities designed to find eligible elderly applicants were also very important during this period. In May 1983, randomization was complete in the first site, and by June 1983, randomization was complete in all sites. The second part of the buildup phase, the building phase, the residual buildup period, is defined as the quarter from July 1983 through September 1983. During this quarter, projects continued building caseloads, attempting to reach a level predetermined by DHHS, and submitted detailed operational plans for steady state operations.
Steady state. The steady state phase, which is the major focus of this report, is defined as beginning in October 1983 and extending through June 1984. This nine month phase was when caseloads stabilized, a much greater proportion of staff time was spent on ongoing case management than in the earlier phases, special demonstration costs were substantially lower, and no new major procedures were developed or tested. Consequently, the steady state phase is the phase that most closely approximates an established, ongoing program. Costs incurred during this phase will be used for the benefit-cost analysis. This phase also provides the most useful cost data for estimating the costs of case management programs like channeling.
Demonstration Closeout. Closeout of demonstration-funded activities began in July 1984 and ended in March 1985 with expiration of the federal contracts. No cost data were collected for this phase.
D. EVALUATION DESIGN OVERVIEW
The primary objective of the evaluation was to determine the impacts of the demonstration on service use, public and private costs, and clients and caregivers. The various impact analyses and the benefit-cost analysis, all of which were components of the evaluation, were intended to help policy makers judge whether channeling is an effective intervention.
A randomized experimental design was used to estimate the effects of channeling, that is, to compare what occurred under the demonstration with what would have occurred in its absence. Applicants for the demonstration were screened to determine their eligibility based on a set of standard criteria including functional limitations and unmet needs. Those who passed the screen were assigned randomly to either a treatment or control group. Channeling's effects are determined by comparing the outcomes for persons assigned to the channeling treatment group with the outcomes of those in the control group who received services through the conventional delivery system. In other reports these impacts are estimated for each of the two channeling models and for selected subgroups of the target population. In addition, the more qualitative process analysis (Carcagno, et al. 1985) documents channeling's implementation, its relation to the existing long term care service delivery system, its costs and the characteristics of its clients. Together, the impact and process analyses will aid in determining the best way to organize and deliver channeling services should it be found to be an effective intervention, for some or all of the subgroups of the target population.
III. OVERALL DEMONSTRATION COSTS
The four sections of this chapter document the overall costs of the demonstration for the period from October 1980 through June 1984. The first section discusses costs and caseload measures during three phases of the demonstration: the planning phase, the buildup phase, and the steady state phase. The second section presents project- and state-level steady state phase costs by project. The third section discusses steady state phase direct service expenditures. The fourth section concludes the chapter with a discussion of the special demonstration costs incurred by the projects.
A. TOTAL DEMONSTRATION COSTS -- SEPTEMBER 1980 THROUGH JUNE 1984
The demonstration represented the largest effort yet undertaken to assess the efficacy of community-based long term care. This is reflected in total costs (as of June 1984) of over $37 million and over 51,000 client months of case management delivered. This section presents estimates of total costs and caseload measures, and examines how they varied across the demonstration phases.
1. Costs by Phase
As shown in Table III.1, local projects, state agencies, the evaluation contractor, and the technical assistance contractor together spent $37.3 million during the almost four years covered in this report. Costs also were incurred at the federal level by government staff that planned and managed the demonstration. These federal-level costs are unavailable, therefore, the costs presented in Table III.1 understate the total costs of conducting the demonstration through June 1984.12
The costs of the planning phase shown in Table III.1 were incurred in preparation for projects becoming operational. State-level costs totalling over $1 million were primarily for preparing detailed project proposals and conducting statewide long term care planning initiatives. Once site selection was made by DHHS (January, 1981), project-level activities began. These activities cost slightly less than $1 million during the planning phase and included preparing internal management and operations procedures, hiring and training staff, negotiating referral agreements and service contracts, and other activities necessary to begin project operations. The technical assistance contractor spent approximately $400,000 during this phase testing the screening, assessment, and client tracking instruments and procedures, and helping design the casefinding and care planning processes. The evaluation contractor spent $2 million during this phase primarily developing the research design and the data collection instruments--including the screening and baseline assessment procedures and instruments, the follow-up survey design, client tracking and status change forms, channeling project time sheets, and financial reporting schedules. During this phase, the evaluation contractor also participated in developing criteria for site selection and designation of sites to test the financial control model and in the design of channeling functions and processes.
| TABLE III.1. Costs of the Demonstration Through June 1984(dollars) | |||||
| PlanningPhase 9/80 - Early 82a | Buildup Phase | Steady State Phase10/83 - 6/84 | Total Through 6/84 | ||
| Randomization PeriodEarly 82a - 6/83 | Residual Building 7/83 - 9/83 | ||||
| Basic Case Management Model | |||||
| Project-Level Costs | |||||
| Case management and Administrative Costsb | 379,100 | 2,371,683 | 490,063 | 1,365,003 | 4,605,849 |
| Direct service expendituresc | NA | 200,203 | 154,176 | 457,227 | 811,606 |
| Total | 379,100 | 2,571,886 | 644,239 | 1,822,230 | 5,417,455 |
| State-Level Administrative Costs | 548,300 | 483,806 | 86,926 | 246,515 | 1,365,547 |
| Total | 927,400 | 3,055,692 | 731,165 | 2,068,745 | 6,783,002 |
| Financial Control Model | |||||
| Project-Level Costs | |||||
| Case management and Administrative Costsb | 600,400 | 2,289,471 | 609,172 | 1,664,182 | 5,163,225 |
| Direct service expendituresc | NA | 3,336,536 | 1,839,267 | 7,373,829 | 12,549,632 |
| Total | 600,400 | 5,626,007 | 2,448,439 | 9,038,011 | 17,712,857 |
| State-Level Administrative Costs | 559,200 | 471,655 | 124,150 | 325,661 | 1,480,666 |
| Total | 1,159,600 | 6,097,662 | 2,572,589 | 9,363,672 | 19,193,523 |
| Technical Assistance Contractor | 437,548 | 858,074 | 87,536 | 241,730 | 1,624,888 |
| Evaluation Contractor | 2,133,419 | 4,178,063 | 723,408 | 2,622,177 | 9,657,067 |
| Total | 4,657,967 | 14,189,491 | 4,114,698 | 14,296,324 | 37,258,480 |
SOURCE: Cost schedules B pp.1 and 2 and contractor invoices. NOTE: Data on the costs incurred at the federal level by government staff managing the demonstration are unavailable. Costs include reported expenditures plus the value of in-kind or donated services and supplies during the buildup and stead state phases. During the planning phase only reported expenditures are available. For the later two phases total in-kind costs at the state and project level were approximately 3.5 percent of total case management and administrative costs incurred at these two levels.
|
|||||
The buildup phase costs reflect primarily the process of building caseloads during this period. During this phase relatively more effort at the project level was placed on identifying and enrolling clients than in the subsequent steady state phase. The 10 demonstration projects spent approximately $11 million during the buildup phase. In total, the five basic case management model projects and the five financial control projects spent almost equivalent amounts, approximately $2.9 million, on case management and administrative functions. In addition, direct service expenditures made by the basic case management projects from available gap-filling dollars were $350,000 during this phase; direct service expenditures of the financial control model projects totalled over $5 million.
Costs for technical assistance were highest during the buildup phase. After the beginning of operations in each site, the technical assistance staff conducted a series of quality assurance visits at the sites and provided refresher training as appropriate. The technical assistance contractor also provided sample guidelines, formats, and training for the service audit and program review functions that were implemented by most of the channeling states.
The distribution of steady state costs, as also shown in Table III.1, was very different from that of the planning and buildup phases. Activities during this period shifted more toward providing ongoing case management services, which is reflected in the increase in the level and relative share of direct service costs. Expenditures for direct services that were generally provided once a person had been enrolled and agreed to a formal care plan increased as a percentage of total project costs.13 During the randomization period of the buildup phase, direct service expenditures accounted for only 8 percent of basic case management project costs.14 Later, in the steady state phase, direct service expenditures accounted for 25 percent of basic case management project costs. Similarly, at financial control projects, direct service expenditures grew from 59 percent to 82 percent' of total project costs. The projects incurred total costs (direct service expenditures plus case management and administrative function costs) of almost $10.9 million during the nine months of the steady state phase while they incurred only slightly more than this ($11.3 million) during the sixteen months of the buildup phase.15
Projects, states, and contractors continued to spend money after June 1984. As noted, estimates for the demonstration closeout phase, which ended in March 1985, are excluded from Table III.1. Such costs, if available, would reflect the activities of projects that were either closing out their activities or continuing their work after the demonstration under different auspices; overall, they would not be representative, therefore, of the costs of an ongoing program. As mentioned in Chapter II, since projects during the steady state phase most resembled ongoing channeling programs, steady state for the remainder of this report.
| TABLE III.2. Caseload Measures in the Demonstration | ||||
| Measures of Scale | Buildup Phase | Steady State Phase 10/83 - 6/84 | Total Through 6/84 | |
| RandomizationPeriod Early 82a - 6/83 | ResidualBuilding 7/83 - 9/83 | |||
| Completed Screens | ||||
| Basic | 4,751 | 449 | 1,029 | 6,229 |
| Financial Control | 4,430 | 531 | 995 | 5,956 |
| Total | 9,181 | 980 | 2,024 | 12,185 |
| Persons Eligible | ||||
| Basic | 3,503 | 376 | 777 | 4,656 |
| Financial Control | 3,819 | 503 | 912 | 5,234 |
| Total | 7,322 | 879 | 1,689 | 9,890 |
| New Clients | ||||
| Basic | 2,108 | 376 | 776 | 3,260 |
| Financial Control | 2,498 | 500 | 911 | 3,909 |
| Total | 4,606 | 876 | 1,687 | 7,169 |
| Completed Baseline Assessments | ||||
| Basic | 1,875 | 338 | 610 | 2,823 |
| Financial Control | 2,319 | 436 | 780 | 3,535 |
| Total | 4,194 | 774 | 1,390 | 6,358 |
| Completed Initial Care Plans | ||||
| Basic | 1,713 | 307 | 481 | 2,501 |
| Financial Control | 2,113 | 382 | 670 | 3,165 |
| Total | 3,826 | 689 | 1,151 | 5,666 |
| Ongoing Case Months | ||||
| Basic | 7,428 | 3,810 | 11,989 | 23,227 |
| Financial Control | 7,722 | 4,773 | 15,651 | 28,146 |
| Total | 15,150 | 8,583 | 27,640 | 51,373 |
SOURCE: Client tracking system, project monthly enrollment reports, and DHHS monthly statistical report. NOTE: See text for definition of terms.
|
||||
2. Caseload Measures by Phase
Table III.2 shows the sizes of the projects' caseloads. The table presents six measures of project scale:
- "Completed screens": the number of applicants who completed the eligibility determination process
- "Eligibles": the number of persons who completed the screening process and. were determined to be eligible for channeling
- "New Clients": the number of eligibles not assigned to the research control group
- "Completed baseline assessments": the number of clients who actually received a completed baseline needs assessment
- "Completed initial care plans": the number of clients who received a completed initial care plan
- "Ongoing case months": the number of months of ongoing case management services delivered to all clients once they signed their initial care plan.16 This is a measure of caseload activity after the initial care planning stage; that is, it excludes the time spent during the initial, one-time-only functions of screening, baseline assessment, and initial care planning.
The table shows that the projects had screened over 12,000 people by June 1984. Over 7,000 of the almost 10,000 people found to be eligible were accepted into the channeling program. (The 3,000 people who were determined to be eligible by that time but not accepted into the channeling program were assigned to the control group). A baseline assessment was completed for approximately 89 percent (or 6,400) of these clients, and initial care plans were completed for almost 5,700 persons. On average, clients for whom an initial care plan was completed received nine months of ongoing case management services following the sign-off of the initial care plan.
B. TOTAL COSTS OF CORE CHANNELING AND ADMINISTRATION FUNCTIONS AND CASELOAD MEASURES BY SITE DURING STEADY STATE PHASE
As shown previously on Table III.1, during the nine months of the steady state phase the 10 demonstration projects and state lead agencies spent approximately $11.4 million. Table III.3 disaggregates this amount for the projects and states in the steady state phase. Total project- and state-level costs combined ranged from less than $250,000 in Southern Maine to over $2 million in Cleveland, Miami, and Philadelphia. The table shows that financial control projects spent eight times more money than the basic case management projects. This difference reflects differences in direct service expenditures: the financial control projects spent over $7 million for these services while the basic projects spent less than $500,000 during the steady state phase.
| TABLE III.3. Total Project- and State-Level Costs for the Steady State Phase, October 1983 - June 1984(dollars) | |||||||||||||
| Basic Case Management | Financial Control | All Projects | |||||||||||
| Baltimore | Eastern Kentucky | Houston | Middlesex County | Southern Maine | Total | Cleveland | Greater Lynn | Miami | Philadelphia | Rensselaer County | Total | ||
| Project Level | |||||||||||||
| Core Channeling and Administration Functionsa | |||||||||||||
| Expenditures | 230,359 | 269,484 | 330,201 | 340,097 | 184,775 | 1,354,916 | 318,708 | 275,917 | 371,819 | 426,928 | 204,744 | 1,598,116 | 2,953,032 |
| In-kind Costsb | 9,165 | 0 | 0 | 922 | 0 | 10,087 | 62,992 | 0 | 0 | 0 | 3,074 | 66,066 | 76,153 |
| Subtotal | 239,524 | 269,484 | 330,201 | 341,019 | 184,775 | 1,365,003 | 381,700 | 275,917 | 371,819 | 426,928 | 207,818 | 1,664,182 | 3,029,185 |
| Direct Servicesc | 110,544 | 128,701 | 55,827 | 129,977 | 32,178 | 457,227 | 1,690,987 | 1,378,839 | 1,747,333 | 1,742,966 | 813,704 | 7,373,829 | 7,831,056 |
| Total | 350,068 | 398,185 | 386,028 | 470,996 | 216,953 | 1,822,230 | 2,072,687 | 1,654,756 | 2,119,152 | 2,169,894 | 1,021,522 | 9,038,011 | 10,860,241 |
| State Level | |||||||||||||
| Expenditures | 69,748 | 26,690 | 84,770 | 7,148 | 30,068 | 218,424 | 48,304 | 77,843 | 48,515 | 49,691 | 82,079 | 306,432 | 524,856 |
| In-kind Costs | 0 | 0 | 16,063 | 10,476 | 1,552 | 28,091 | 0 | 0 | 7,191 | 0 | 12,038 | 19,229 | 47,320 |
| Total | 69,748 | 26,690 | 100,833 | 17,624 | 31,620 | 246,515 | 48,304 | 77,843 | 55,706 | 49,691 | 94,117 | 325,661 | 572,176 |
| Total Costs | 419,816 | 424,875 | 486,861 | 488,620 | 248,573 | 2,068,745 | 2,120,991 | 1,732,599 | 2,174,858 | 2,219,585 | 1,115,639 | 9,363,672 | 11,432,417 |
SOURCE: Cost schedules (Schedule B, pp. 1 and 2)
|
|||||||||||||
Table III.3 also indicates the importance of in-kind costs--the costs for resources donated to the demonstration. Overall, reported project- and state-level in-kind costs were small--less than 3 percent of the over $11 million total project and state costs during the steady state phase, although these costs are probably underestimated.17 States received in-kind resources primarily from other agencies and departments within the states for office space, postage, telephone, supplies, etc. Projects typically received in-kind resources from the local host agencies. Salaries and fringe benefits for host agency staffs that donated time to the projects were the most frequently reported in-kind costs. Other project level in-kind resources were donated personnel from the state human resource departments, travel expenses for donated staff, supplies, telephone charges, and photocopying.
Although reported in-kind costs were relatively small overall, they were substantial for some projects. In particular, the Cleveland project reported large in-kind costs in the steady state phase. Overhead costs for this project were donated on an in-kind basis from its host agency at the rate of almost 30 percent of salary and wage costs. This contribution constituted the bulk of the $63,000 in-kind costs that Cleveland reported and over 15 percent of the costs of its core channeling and administration functions in the steady state phase.
Table III.4 presents data on caseload sizes during the steady state phase for each of the 10 projects. These data reflect the focus on ongoing case management that characterized the steady state phase. Approximately 1,700 new clients entered the channeling projects (i.e., passed the eligibility determination screen) and on average, 3,100 persons were receiving ongoing case management during each of the nine months of the steady state phase.18 Total ongoing case months for the nine-month period ranged from less than 2,000 in the Rensselaer County and Southern Maine projects to over 4,000 in Philadelphia. Not suprisingly, these measures of project scale are directly correlated with the total costs of the core channeling and administration functions incurred in the individual projects. As shown on Table III.3, the two smallest projects, Rensselaer County and Southern Maine, incurred the lowest total core channeling and administrative function costs of the 10 projects ($208,000 and $185,000, respectively). The Philadelphia project incurred the highest total costs of $427,000.
C. DIRECT SERVICE EXPENDITURES
As mentioned in Chapter II the basic case management and financial control models received different amounts of money to purchase direct services. Each of the basic case management projects was awarded $250,000 as part of their channeling contract. These funds were used for gap-filling services for the duration of the demonstration.19 The financial control projects received money for the purchase of direct services from funds pool of Medicare, Medicaid, and other public program sources that reached over $1 million for each project.
| TABLE III.4. Caseload Measures for the Steady State Phase | |||||
| Project | Completed Screens | New Clients | CompletedBaseline Assessments | Completed Initial Care Plans | Ongoing CaseMonths |
| Basic Case Management | |||||
| Baltimore | 319 | 187 | 115 | 70 | 2,446 |
| Eastern Kentucky | 97 | 86 | 75 | 68 | 2,163 |
| Houston | 158 | 126 | 101 | 90 | 2,699 |
| Middlesex County | 325 | 288 | 238 | 179 | 2,779 |
| Southern Maine | 130 | 89 | 81 | 74 | 1,902 |
| Total | 1,029 | 776 | 610 | 481 | 11,989 |
| Financial Control | |||||
| Cleveland | 202 | 197 | 188 | 175 | 3,605 |
| Greater Lynn | 157 | 153 | 134 | 106 | 2,253 |
| Miami | 317 | 257 | 194 | 154 | 3,704 |
| Philadelphia | 202 | 200 | 174 | 149 | 4,384 |
| Rensselaer County | 117 | 104 | 90 | 86 | 1,705 |
| Total | 995 | 911 | 780 | 670 | 15,651 |
| All Projects | 2,024 | 1,687 | 1,390 | 1,151 | 27,640 |
| SOURCE: Client tracking system, project monthly enrollment reports, and DHHS monthly statistical reports.NOTE: See text for definition of terms. | |||||
Table III.5 indicates the sources of direct service funds. The demonstration contracts provided 85 percent of the direct service funds for the basic case management projects in the steady state phase. Most of the remaining 15 percent of the funds were provided by other government sources in Baltimore and Eastern Kentucky.20 In addition to the direct service expenditures funded through the channeling contract, Baltimore spent $47,000 provided by its state's Gateway II program and Eastern Kentucky spent $18,000 that was provided by the state of Kentucky.
| TABLE III.5. Percent Distribution of Direct Service Expenditures for the Steady State Phase by Source, by Project | ||||||||||||
| Basic Case Management | Financial Control | |||||||||||
| Baltimore | Eastern Kentucky | Houston | Middlesex County | Southern Maine | Modelas a Whole | Cleveland | Greater Lynn | Miami | Philadelphia | Rensselaer County | Modelas a Whole | |
| Medicare | NA | NA | NA | NA | NA | NA | 60 | 60 | 60 | 60 | 60 | 60 |
| Medicaid | NA | NA | NA | NA | NA | NA | 30 | 25 | 40 | 35 | 40 | 34 |
| Channeling Contract | 57 | 86 | 98 | 100 | 100 | 85 | NA | NA | NA | NA | NA | NA |
| Other Government Sources | 43 | 14 | 0 | 0 | 0 | 15 | 10 | 15 | 0 | 0 | 0 | 5 |
| Private Contribution | 0 | 0 | 2 | 0 | 0 | a | 0 | 0 | a | 5 | 0 | 1 |
| Client Payment | 0 | 0 | 0 | 0 | 0 | 0 | 0 | 0 | a | a | a | A |
| 100 | 100 | 100 | 100 | 100 | 100 | 100 | 100 | 100 | 100 | 100 | 100 | |
SOURCE: Cost reports to the evaluation contractor (Schedules A and B) and cost reports to DHHS.NOTE: This table only exhibits direct service funds spent by projects, funds received by the projects but not spent are not including in this table.NA = not applicable
|
||||||||||||
The major funds sources for the financial control projects' direct services were Medicare and Medicaid. Overall, Medicare provided 60 percent and Medicaid provided 34 percent of the funds for direct services. Cleveland and Greater Lynn also received contributions from other government sources which constituted around 10-15 percent of their funds for direct services. Private contributions and client payments constituted less than two percent of the funds used by financial control projects for direct service expenditures.21
Table III.6 shows the average amount of direct services purchased per ongoing case month for various community-based services. In total, direct service expenditures averaged $38 per ongoing case month in the basic case management projects and ranged between $400 and $600 per ongoing case month in the financial control projects. Although financial control projects spent over 10 times as much for direct services as basic case management projects, both models tended to concentrate most of their money on the same types of services. The basic case management projects made most of their expenditures for home health aide and homemaker/personal care services, at an average of about $13 per ongoing case month. The financial control projects also spent most of their direct service budgets for homemaker/personal care services, but at a much higher average of $281 per ongoing case month. They spent a large portion of the remainder on home health aide and skilled nursing services.22
D. SPECIAL DEMONSTRATION COSTS
The cost estimates presented in this chapter and in Chapter IV include a number of special demonstration costs--costs that would not have normally occurred in an ongoing, nondemonstration program. The largest of these costs was incurred because the experimental design of the demonstration required that both the treatment and control group members go through the screening process. About 8 percent of the costs of the core channeling and administration functions of the randomization period of the buildup phase can be attributed to screening control group members.23
| TABLE III.6. Direct Services Expenditures Per Ongoing Case Month for the Steady State Phase, by Service and by Project(dollars) | ||||||||||||
| Service Type | Basic Case Management | Financial Control | ||||||||||
| Baltimore | Eastern Kentucky | Houston | Middlesex County | Southern Maine | Modelas a Whole | Cleveland | Greater Lynn | Miami | Philadelphia | Rensselaer County | Modelas a Whole | |
| Homemaker/ Personal Care | 20.2 | 39.7 | 2.3 | 1.8 | 4.5 | 12.8 | 283.1 | 353.6 | 295.0 | 239.4 | 256.6 | 280.9 |
| Skilled Nursing | 0.0 | 0.0 | 0.0 | 0.0 | 0.4 | 0.1 | 17.1 | 53.2 | 55.5 | 69.1 | 66.3 | 51.3 |
| Home Health Aide | 10.9 | 0.0 | 0.8 | 42.8 | 6.8 | 13.4 | 121.8 | 45.0 | 4.1 | 12.9 | 72.4 | 47.0 |
| Home Delivered Meals | 0.0 | 8.8 | 0.5 | 0.0 | 0.0 | 1.7 | 18.3 | 14.2 | 53.5 | 17.0 | 13.2 | 25.1 |
| Therapies | 0.0 | 0.0 | 0.1 | 0.0 | 0.0 | 0.0 | 5.2 | 18.9 | 19.2 | 27.7 | 8.4 | 17.1 |
| Companion | 0.0 | 0.0 | 12.1 | 0.4 | 0.8 | 2.9 | 0.1 | 56.8 | 4.3 | 0.0 | 10.1 | 10.3 |
| Transportation | 3.0 | 3.9 | 1.0 | 0.1 | 0.5 | 1.7 | 0.6 | 25.3 | 13.2 | 4.7 | 9.9 | 9.3 |
| Housekeeping | 0.0 | 2.3 | 0.0 | 0.0 | 0.0 | 0.4 | 2.6 | 0.3 | 7.0 | 5.7 | 13.7 | 5.4 |
| Day Health | 0.4 | 0.0 | 0.0 | 0.0 | 0.8 | 0.2 | 0.0 | 34.0 | 1.4 | 0.0 | 5.7 | 5.9 |
| Nonroutine Consumable Medical | 2.4 | 0.0 | 0.4 | 0.0 | 0.3 | 0.6 | 10.0 | 2.3 | 6.3 | 9.5 | 2.6 | 7.1 |
| Chore | 0.0 | 0.1 | 0.0 | 1.3 | 0.1 | 0.3 | 6.5 | 1.1 | 5.1 | 2.7 | 0.1 | 3.6 |
| Mental Health | 0.0 | 0.0 | 0.0 | 0.0 | 0.0 | 0.0 | 1.8 | 6.1 | 2.1 | 0.0 | 3.9 | 2.2 |
| Adoptive and Assistive Equipment | 0.4 | 1.4 | 1.7 | 0.1 | 1.8 | 1.1 | 2.0 | 1.2 | 0.6 | 0.5 | 0.6 | 1.0 |
| Respite Care | 6.1 | 0.2 | 0.4 | 0.0 | 0.1 | 1.4 | 0.0 | 0.0 | 1.7 | 1.8 | 1.3 | 1.0 |
| Day Maintenance | 0.0 | 0.0 | 0.0 | 0.0 | 0.0 | 0.0 | 0.0 | 0.0 | 2.0 | 6.6 | 12.5 | 3.7 |
| Other (Non-Care) | 0.0 | 2.3 | 1.3 | 0.3 | 0.6 | 0.9 | 0.0 | 0.0 | 0.6 | 0.0 | 0.0 | 0.1 |
| Adult Foster Care | 1.6 | 0.0 | 0.1 | 0.0 | 0.0 | 0.4 | 0.0 | 0.0 | 0.0 | 0.0 | 0.0 | 0.0 |
| Housing Assistance | 0.2 | 0.7 | 0.0 | 0.0 | 0.1 | 0.2 | 0.0 | 0.0 | 0.1 | 0.0 | 0.0 | 0.1 |
| Emergency Assistance | 0.0 | 0.1 | 0.0 | 0.0 | 0.1 | 0.0 | 0.0 | 0.0 | 0.0 | 0.0 | 0.0 | 0.0 |
| Total | 45.2 | 59.5 | 20.7 | 46.8 | 16.9 | 38.1 | 469.1 | 612.0 | 471.7 | 397.6 | 477.3 | 471.1 |
| SOURCE: Client tracking system and Schedule B, page 2. NOTE: Each cell of this table presents the average amount of money spent per ongoing case month for a particular service in a particular site. Ongoing case months are the number of months of ongoing case management services delivered to all clients once they have signed their initial care plan. This measures caseload activity after the initial care planning stage; that is, it excludes the time spent during the initial, one-time-only functions of screening, baseline assessment, and initial care planning. | ||||||||||||
In order to assess the magnitude of other research-related costs, project directors reported estimates of the number of hours that they, their professional staff, and their clerical staff spent each month in the following activities: (1) meetings with the evaluation contractor, (2) interviews, discussions, or correspondence with the evaluation contractor, (3) contact with providers and communities to explain research data needs and procedures, (4) time spent reproducing, shipping, and maintaining document control for forms sent to the evaluation contractor (e.g., client tracking data) and (5) other-research related activities.
Based on these reported time estimates, staff wage rates, and the average ratio of salary costs to total project costs, we estimated that project-level research costs during the, randomization period of the buildup phase were roughly $65,000 and during the steady state phase were slightly more than $30,000 for all projects. This research related cost in the steady state phase is less than one percent of the costs of the core channeling and administration functions during this period. Since there were no controls to screen in the steady state phase and since there were fewer meetings and photocopying requirements for the projects, the estimated research costs in the steady state were only 10 percent of those in the earlier phases of the demonstration.
There were other costs attributable to the special demonstration nature of the program, which we have not estimated because of the difficulty of distinguishing them. These costs included, for example, the special coordination activities such as demonstrationwide supervisor meetings and biweekly conference calls with federal management team and project directors, the increased level of attention paid by management staff at all levels, the process of informed consent for all applicants, and the costs associated with the lost efficiencies due to the small scale of demonstration projects.
We expect special demonstration costs to have been at their lowest level during the steady state phase. Nonetheless, their undoubted presence implies that the figures presented here must be used carefully in planning or budgeting any nondemonstration replication efforts. In particular, the possibility that larger scale and regular operation could reduce average costs below the levels observed for the demonstration should be recognized explicitly.
IV. CASE MANAGEMENT FUNCTION COSTS DURING STEADY STATE PHASE
This chapter examines the project-level costs of the case management functions of channeling. As described in Chapter II, the case management activities of the demonstration projects include the five core functions of (1) casefinding/outreach (2) screening, (3) baseline needs assessment, (4) initial care planning, and (5) ongoing case management, plus the supporting administration, provider relations, and clerical functions. In this chapter we present estimates of the average costs associated with each of these functions.
This chapter has several purposes. First, the information presented here supplements the process research on the implementation of channeling and highlights the differences between models and projects. Second, the data and cost estimates will be the basis for the estimates of the operational costs of channeling used in the benefit-cost analysis. Finally, data presented--in particular the disaggregation of average per client costs by individual core functions-should be useful for the purposes of budgeting future case management programs like channeling.
The data cover costs incurred during the nine-month steady state phase of the demonstration, the period from October 1983 to June 1984. As described in Chapter II, the steady state phase was the period in which caseload sizes became more stable. A greater proportion of staff time was spent on ongoing case management and reassessment activities as in an established program, rather than on enrollment, initial assessment and care planning activities as in the earlier buildup phase. In addition, we expect that costs of the earlier period may have also reflected the usual sort of startup problems as projects tried and implemented new procedures. Finally, as explained in Chapter III, costs of the earlier phase also reflect greater resource use attributable to the research and the fact that channeling was a demonstration.
During the steady state phase, costs that are attributable to the research requirements and other aspects related to the special nature of a demonstration were still incurred. It is important to reiterate that the estimates of the average core function costs presented in this chapter include these special costs. As discussed in Chapter III, we estimate that the costs of the research requirements were approximately one percent of the total costs of performing the case management functions. We have no estimates of the other special costs incurred that are attributable solely to the fact that channeling was a demonstration (e.g., costs stemming from demonstration wide meetings of supervisors or the generally small scale of demonstration projects). However, we expect these costs to have been at their lowest level during this phase.
A. METHODOLOGY
Disaggregating total case management and administrative function costs by specific core functions requires certain critical assumptions about the allocation of staff time and other costs. Although each of these assumptions is inherently subject to some uncertainty, we believe that the individual core function cost estimates presented here represent reasonable approximations and are informative enough to be useful from the perspective of one interested in understanding what actually went on in this demonstration and for budgeting future case management programs like channeling.
A three step method was used for estimating the costs of the core case management and administrative functions. First, we estimated for each project the percent of total wages devoted to each of the six functional areas reported on timesheets. (As described in Chapter I, these six functional areas include the five core functions and administrative/provider relations/clerical functions.) Second, we used this estimated percent distribution of salary expenditures to apportion total expenditures plus in-kind costs reported by projects (exclusive of direct service expenditures) into each of these six functional areas. And third, we then allocated the total estimated administrative/provider relations/clerical costs among the five core functions. We describe each of these steps in more detail below.
The estimated distribution of salary expenditures for each project was based on individual staff hourly wage rates and the amount of time each individual reported spending in the six functional areas recorded on the timesheets.24 For each staff member of a project, the number of hours spent in each of the six functional areas was multiplied by the employee's hourly wage rate to estimate the individual's total wages attributable to each functional area. Subsequently, individual employees' total wages attributable to each functional area were summed over all project staff to estimate the allocation of salary expenditures across the six functional areas for the project as a whole.
This procedure assumes that the timesheet data serve as reasonable estimates of how project staff spent their time among the various interrelated case management and administrative functions. We believe this is a valid assumption, although we note that there is probably some imprecision in the timesheet data. The underlying cause of the imprecision in this data is the inherent difficulty in allocating labor time between closely related functions (e.g., outreach and provider relations, or baseline assessment and initial care planning) and in keeping precise accounts of when the work associated with one task merges into another functional area. Therefore, some staff may have inadvertently reported time in incorrect functional categories. Furthermore, we expect that because the research-specific tasks, such as completing timesheets, were an additional burden for project staff whose primary concern was providing case management to clients, precise records of staff time allocation may not have been maintained at all times at all projects
Despite this imprecision, the timesheet data should provide a reasonable approximation of the distribution of salary expenditures across the individual functions for each of the projects. First, the time recorded for specific individuals was consistent from one reporting period to another for each phase.25 Second, the timesheet data followed expected trends over the phases of the demonstration. That is, during the heavy enrollment period of the buildup phase the timesheet data showed that projects devoted a large proportion of time to the initial recruiting and enrollment functions; and in the steady state phase, when caseloads stabilized, the timesheet data indicated that a greater proportion of project activities had shifted to ongoing case management functions. Third, the distributions shown by the timesheets correspond with information that was collected in site visit interviews with project staff.
Table IV.1 presents the estimated percent distribution of salary on timesheets during the steady state phase. Among the 10 projects, between 84 and 94 percent of salary expenditures in the steady state phase were devoted to ongoing case management and administration/provider relations/clerical functions.26 The five basic case management projects spent from 43 to 50 percent of salary expenditures on ongoing case management and from 37 to 47 percent on related administration and support staff activities. In contrast, the five financial control projects spent from 26 to 37 percent of salary expenditures on ongoing case management and from 49 to 62 percent on administration. This evidence that proportionally more salary costs were allocated to administration/provider relations/clerical, functions in the financial control projects is consistent with expectations. The financial control projects performed more administrative and provider relations activities due to their increased responsibilities for purchasing community-based services directly for clients.
In the second step of the methodology we estimated the total costs associated with each of the six functional areas. We did this by apportioning the total amount of expenditures plus in-kind costs of the core channeling and administrative functions (see Table III.3) according to the estimated percent distribution of project salary expenditures shown in Table IV.1. The resulting estimates of the costs of the individual core functions and the administrative function are presented on Table IV.2.
| TABLE IV.1. Estimated Distribution of Salary Expenditures by Function, Steady State Period(percents) | ||||||||||
| Functional Areas on Timesheets | Basic Case Management | Financial Control | ||||||||
| Baltimore | Eastern Kentucky | Houston | Middlesex County | Southern Maine | Cleveland | Greater Lynn | Miami | Philadelphia | Rensselaer County | |
| Casefinding/ Outreach | 0.4 | 0.6 | 1.1 | 0.0 | 0.0 | 0.4 | 0.0 | 1.9 | 0.0 | 0.4 |
| Screening | 2.5 | 5.3 | 1.8 | 2.7 | 2.4 | 4.4 | 2.7 | 2.4 | 1.8 | 0.9 |
| Baseline Assessment | 8.2 | 2.1 | 3.0 | 4.1 | 2.0 | 2.5 | 2.7 | 5.1 | 1.8 | 1.9 |
| Initial Care Plan | 4.5 | 2.6 | 4.4 | 7.0 | 2.1 | 7.7 | 7.0 | 5.9 | 2.9 | 2.6 |
| Ongoing Case Management | 47.7 | 43.8 | 43.0 | 44.0 | 49.6 | 29.9 | 26.1 | 35.7 | 35.4 | 36.9 |
| Administration/ Provider Relations/ Clerical | 36.7 | 45.6 | 46.7 | 42.2 | 43.9 | 55.1 | 61.5 | 49.0 | 58.1 | 57.3 |
| Total | 100.0 | 100.0 | 100.0 | 100.0 | 100.0 | 100.0 | 100.0 | 100.0 | 100.0 | 100.0 |
| SOURCE: Monthly timesheet data submitted by projects and their subcontractors during October 1983 - March 1984 and hourly wage rates of project and subcontractor staff. | ||||||||||
| TABLE IV.2. Estimated Total Costs of Core Functions by Project, Stead State Phase(dollars) | |||||||||||||
| Functions | Basic Case Management | Financial Control | All Projects | ||||||||||
| Baltimore | Eastern Kentucky | Houston | Middlesex County | Southern Maine | Total | Cleveland | Greater Lynn | Miami | Philadelphia | Rensselaer County | Total | ||
| Initial Functions | |||||||||||||
| Casefinding/ Outreach | 958 | 1,617 | 3,632 | 0 | 0 | 6,207 | 1,527 | 0 | 7,065 | 0 | 831 | 9,423 | 15,630 |
| Screening | 5,988 | 14,283 | 5,944 | 9,207 | 4,435 | 39,857 | 16,795 | 7,450 | 8,924 | 7,685 | 1,870 | 42,724 | 82,581 |
| Baseline Assessment | 19,641 | 5,659 | 9,906 | 13,982 | 3,696 | 52,884 | 9,543 | 7,450 | 18,963 | 7,685 | 3,949 | 47,590 | 100,474 |
| Initial Care Plan | 10,779 | 7,007 | 14,529 | 23,871 | 3,880 | 60,066 | 29,391 | 19,314 | 21,937 | 12,381 | 5,403 | 88,426 | 148,492 |
| Subtotal | 37,366 | 28,566 | 34,011 | 47,060 | 12,011 | 159,014 | 57,256 | 34,214 | 56,889 | 27,751 | 12,053 | 188,163 | 347,777 |
| Ongoing Case Management | 114,253 | 118,034 | 141,986 | 150,048 | 91,648 | 615,969 | 114,128 | 72,014 | 132,739 | 151,133 | 76,684 | 546,698 | 1,162,667 |
| Administrative/ Provider Relations/ Clerical | 87,905 | 122,884 | 154,204 | 143,911 | 81,116 | 590,020 | 210,316 | 169,689 | 182,191 | 248,044 | 119,081 | 929,321 | 1,519,341 |
| All Functions | 239,524 | 269,484 | 330,201 | 341,019 | 184,775 | 1,365,003 | 381,700 | 275,917 | 371,819 | 426,928 | 207,818 | 1,664,182 | 3,029,185 |
| SOURCE: Total expenditures plus in-kind costs reported by projects on Schedule B, page 1 allocated to the core functions based on the distribution of salary expenditures to core phase management and administrative functions (Table IV.1). | |||||||||||||
As displayed in this table, we have identified separately the four initial case management functions of casefinding/outreach, screening, baseline assessment, and initial care planning from the ongoing case management function. The four initial functions represent the set of activities conducted once for each client; the ongoing case management function represents service arranging, monitoring, reassessment, and care plan revision activities conducted periodically for each client after the initial care plan was formulated and signed. The purpose of distinguishing the initial and ongoing functions is to identify the fixed, upfront costs of enrollment from those that will be continuously incurred depending upon how long clients remain in the program.
Table IV.2 also presents the costs of the supporting administrative, provider relations, and clerical activities. As shown in the table, total administrative costs during the steady state phase were substantial--ranging from roughly $81,000 to $248,000 among the 10 projects and comprising between 37 to 62 percent of total case management costs. Since these administrative, provider relations, and clerical activities supported all the core case management functions,27 it is necessary that these administrative costs be taken into account when estimating the average costs of the individual core functions. However, determining the appropriate amount of administrative cost that should be allocated to each core function is difficult because we have no information about the specific tasks individuals were performing when they charged their time to the broad functional area of administration/provider relations/clerical. To estimate the appropriate allocation of administrative costs--the third step in estimating the total costs of the core case management functions--we first developed two plausible allocation procedures and then compared these results with our own observations of project operations.
Under the first allocation procedure we assumed that the distribution of the administrative costs among the five core functions reflected the estimated distribution of salary expenditures directly attributed to the five core functions. For example, Table IV.1 indicates that the Baltimore project devoted 75.4 percent of core function salary expenditures to ongoing case management.28 Consequently, under the first method, 75.4 percent of the Baltimore project total administrative costs were apportioned to ongoing functions and the remaining 24.6 percent apportioned to the initial functions. Under this methodology, approximately 80 percent of total administrative, provider relations, and clerical costs were allocated to the ongoing functions and 20 percent to the initial functions for the basic case management model as a whole. For the financial control projects, on average, approximately 75 percent of total administrative costs were allocated to the ongoing functions and 25 percent to the initial functions.
Under the second allocation procedure we assumed that administrative costs should be apportioned according to the distribution of total dollars spent by projects, including direct service expenditures, and that the purchase of direct services be considered as a part of ongoing case management. Specifically, we assumed that the proportion of administrative costs associated with the initial functions equaled the ratio of total initial function costs (as estimated based on the proportion of salary expenditures devoted directly to these functions) to the sum of all core case management costs plus direct service expenditures. The proportion of administrative costs associated with ongoing case management activities, in turn, was assumed to equal the ratio of ongoing case management plus direct service expenditures to total core function costs plus direct services.29
Under the second allocation procedure, more administrative costs are allocated to ongoing functions. The financial control model projects had a much greater proportion of direct service expenditures than the basic model projects; therefore, the proportion of administrative costs allocated to the ongoing functions for the financial control projects was on average much greater than that for the basic management projects. For the financial control projects, on average, almost 98 percent of total administrative costs were allocated to ongoing functions under this procedure; for the basic case management projects, on average, 87 percent of total administrative costs were allocated to ongoing functions.
Because we lack information on the specific tasks individuals were performing when they charged their time to the broad functional area of administration/provider relations/clerical, the choice of a procedure for allocating administrative costs to the individual core functions is inherently somewhat arbitrary. We believe that it is reasonable and customary to allocate administrative costs in proportion to the dollars spent in the various activities. However, in doing this the question arose concerning how much administrative activity (and, consequently, costs) was associated with the purchase of direct services for clients. Under the first allocation procedure we are, in effect, assuming that the administrative activity associated with 'purchasing direct services is, in conjunction with all other ongoing case management administration, reflected in and proportional to the amount of time (and, hence, salary costs) directly charged to the ongoing case management core function. Under the second allocation procedure, we assume, alternatively, that the administrative activity of purchasing direct services is directly proportionally to the amount of direct service expenditures and is only partially reflected in the proportion of costs directly attributed to the ongoing case management function. The amount of administrative costs associated with paying for direct services, and hence total administrative costs associated with the ongoing case management function, estimated under these two different assumptions, represent lower and upper bounds. Consequently, we used the average of the allocated administrative costs developed under the two methods as the best estimate. This estimate is consistent with our observations about actual program operations, and is the estimate we used for developing the average cost of the individual case management and administrative functions discussed in the next section.
B. ESTIMATED AVERAGE COSTS OF THE CORE FUNCTIONS
As shown earlier in Table IV.2, total estimated case management and administrative costs ranged from $185,000 in Southern Maine, a project with one of the smallest caseloads, to $427,000 in Philadelphia, the project with the largest caseload. On average, the financial control projects incurred greater total costs for the initial and ongoing functions than did the basic case management projects. However, a large part of this difference reflects differences in caseloads across projects.
We used two of the caseload measures that were presented in Chapter III--new clients and ongoing case months--to standardize for the differences among projects in caseload size and to estimate the average costs of each core function.30 The average costs of the four initial functions are measured on a per new client basis. New clients during the steady state phase refer to persons found eligible after the screening process. As shown on Table III.4, not all new clients actually completed a baseline assessment and initial care plan since many dropped out of the demonstration for various reasons.31 Consequently, these average cost estimates represent the average costs of bringing one eligible applicant (including those who dropped out during the initial function process) up to the point of initiating ongoing case management services. The average costs of the ongoing case management function are measured per ongoing case month; they represent the average monthly cost of providing ongoing case management to established clients, i.e. clients who completed the initial care planning process.
1. Costs Prior to Allocation of Administration and Clerical Costs
Because of the imprecision in the estimated allocation administrative/provider relations/clerical costs and because these costs, if incorporated directly into the estimates of the individual core functions, tend to obscure the observed variations across projects, we have presented on Table IV.3 the average costs of the individual core functions separately from the associated administrative/provider relations/clerical costs. However, each core function has an important administrative and clerical component that should not be overlooked when evaluating costs.
| TABLE IV.3. Estimated Average Costs of Initial Functions Per Client and Ongoing Functions Per Ongoing Case Month for Steady State Phase(dollars) | |||||||||||||
| Functions | Basic Case Management | Financial Control | Demonstration as a Whole | ||||||||||
| Baltimore | Eastern Kentucky | Houston | Middlesex County | Southern Maine | Modelas a Whole | Cleveland | Greater Lynn | Miami | Philadelphia | Rensselaer County | Modelas a Whole | ||
| Initial Costs Per Client | |||||||||||||
| Casefinding/ Outreach | 5 | 19 | 29 | 0 | 0 | 8 | 8 | 0 | 27 | 0 | 8 | 10 | 9 |
| Screening | 32 | 166 | 47 | 32 | 50 | 51 | 85 | 49 | 35 | 38 | 18 | 47 | 49 |
| Baseline Assessment | 105 | 66 | 79 | 49 | 42 | 68 | 48 | 49 | 74 | 38 | 38 | 52 | 60 |
| Initial Care Planning | 58 | 81 | 115 | 83 | 44 | 77 | 150 | 126 | 85 | 62 | 52 | 97 | 88 |
| Subtotal | 200 | 332 | 270 | 164 | 136 | 204 | 291 | 224 | 221 | 138 | 116 | 206 | 206 |
| Administration/ Provider Relations/ Clerical | 91 | 214 | 206 | 96 | 92 | 126 | 197 | 193 | 117 | 106 | 87 | 140 | 134 |
| Total Initial Functions | 291 | 546 | 476 | 260 | 228 | 330 | 488 | 417 | 338 | 244 | 203 | 346 | 340 |
| Ongoing Costs Per Ongoing Case Month | |||||||||||||
| Ongoing Case Management | 47 | 55 | 53 | 54 | 48 | 51 | 32 | 32 | 36 | 34 | 45 | 35 | 42 |
| Administration/ Provider Relations/ Clerical | 29 | 48 | 48 | 42 | 38 | 41 | 48 | 62 | 41 | 52 | 65 | 51 | 47 |
| Total Ongoing Functions | 76 | 103 | 101 | 96 | 86 | 92 | 80 | 94 | 80 | 86 | 110 | 86 | 89 |
| SOURCE: Total expenditures plus in-kind costs reported by projects on Schedule B, page 1 were allocated to core functions based on the distribution of salary expenditures to the core functions and administrative functions (Table IV.1 and Table IV.2); the Client Tracking System is the source for ongoing case months and clients enrolled (Table III.4). See text for allocation of administrative costs. | |||||||||||||
Outreach. As shown on Table IV.3, the cost of the casefinding/outreach activities, exclusive of allocated administration, averaged $9 per client.32 It ranged from $0 to $29 among the ten projects. Since most projects had waiting lists in the steady state phase, these costs represent a substantial reductions from those incurred during the earlier buildup phase.
Screening. Screening costs during the steady state phase averaged $49 per client excluding allocated administration, for the demonstration as a whole. There was considerable variation in average screening costs among the 10 projects--ranging from $18 to $166 per client. The highest value was for the Eastern Kentucky project, which contracted out the screening function to two subcontractors at two different locations.
Baseline Assessment and Initial Care Planning. Estimated average costs of these two initial functions combined33 were about equal for the two models; these two functions cost approximately $148 per client.34 The average costs of these two functions, exclusive of the allocated administration, ranged from roughly $90 at the Southern Maine and Rensselaer County projects to almost $200 in Cleveland and Houston.
Ongoing Case Management. Overall it is estimated that it cost $42 each month to provide a client with ongoing case management, not accounting for the supporting administrative, provider relations, and clerical activities. The estimates suggest that costs charged directly to the ongoing case management function--that is, excluding the allocated administration--were higher in the basic case management projects. The average ongoing case management function cost for the five basic model projects were $51 per ongoing case month. The average cost of the ongoing case management function in the financial control model was case month.
2. Costs After Allocation of Administrative and Clerical Costs
Inclusive of the allocated administration, it is estimated that for the demonstration as a whole, it cost, on average, $340 to bring one eligible applicant through the initial enrollment and care planning process and around $89 a month after that to provide ongoing case management (including monitoring and reassessment). Total average initial function costs and total average ongoing functions costs estimated for the two models as a whole were not substantially different: $330 per client for the basic case management model as a whole and $346 for the financial control model. The total average ongoing functions costs were $92 per ongoing case month in the basic model and $86 in the financial control model.
In spite of the similarity of these point estimates, there is substantial variation within models in estimated average costs among the projects. Among the basic case management model projects, estimated average initial function costs ranged from $228 (Southern Maine) to $546 (Eastern Kentucky) per client and among the financial control projects from $203 (Rensselaer County) to $488 (Cleveland) per client. Estimated average ongoing functions costs ranged from $76 (Baltimore) to $103 (Eastern Kentucky) per ongoing case month among the basic projects and from $80 (Cleveland and Miami) to $110 (Rensselaer County) among the financial control projects.
3. Cost Variation Across Projects
Given the substantial variation in the estimates of average cost for the individual projects within models, it would appear that the small differences in point estimates for the two models as a whole do not reflect any true model differences. However, because there are myriad organizational and environmental factors that influence the level of average costs, we considered the possibility that an actual model difference may have been obscured due to the factors affecting costs. For example, if average costs declined as caseload size increased, the financial control model projects (which had greater numbers of new clients and ongoing case months then the basic model) may have been able to achieve economies of scale not attained in the basic model. In such a case, a model difference in average costs might be observed if the effects of project scale could be controlled for across projects. To determine whether there was this type of systematic variation of factors affecting average costs among the projects, we examined a set of factors which we felt could be important determinants of cost.
Table IV.4 summarizes some of the factors that may have influenced average costs. The factors include project scale (measured by the number of new clients determined eligible and the number of ongoing case months); average wage levels at the projects; caseload size relative to the number of case managers (measured by the number of clients per case manager, including assessors in split function projects); whether or not the project used outside subcontractors to perform one or more initial functions; whether or not projects used separate staff to conduct baseline assessment and initial care planning (referred to as the split function approach); and the geographic dispersion of clients or potential clients (measured by the density of the elderly population in the counties served by the project). We expected to observe higher average costs for projects with (1) smaller caseloads (based on assumptions of economies of scale),35 (2) higher average wages, (3) smaller caseloads per case manager, and (4) wide dispersion of the potential client population. We also expected that holding all other factors constant, higher average initial functions costs would be incurred in projects that used the split function approach (under the assumption that efficiencies gained from specialization would be more than offset by increased coordination costs and the costs of care planning staff who had to review assessments completed by other staff before conducting the initial care plan). In general, we expected the effect of using subcontractors to depend upon the particular subcontractor arrangements. For example, during the steady state phase of the demonstration, only one project, Eastern Kentucky, employed subcontractors to perform one of the initial function, screening. Two subcontractors in separate dispersed locations were used. This use of out-stationed subcontractors, whose staff could not necessarily be transferred to other project functions as the focus of project operations shifted, may have contributed to higher than average initial function costs.
After examining these factors, as displayed on Table IV.4, we found that there were some interesting correlations between the factors and average costs. However, there was so much variation in costs and influencing factors within each model that we still did not find evidence that suggests that there were important cost differences between the models. The financial control model projects tended to have larger caseloads, lower wage levels, and service areas with higher concentrations of elderly persons, factors that could lead to lower costs. However, there are exceptions in every case and estimated costs do not appear to be affected strongly by any individual factor. Thus, the available evidence is consistent with a hypothesis that the slightly lower average ongoing costs estimated -for the financial control projects are due to factors other than model, although the level of imprecision in the data make any conclusion tenuous.
In part, the inability to sort out the influences of the factors reflects the inability of our measures to capture the underlying structural phenomenon. Clearly, there are confounding effects among the factors affecting costs. Also, the factors identified above represent only a subset of factors influencing costs. Other relevant factors include the level of staff training, the functional limitations of clients, dropout rates, the local service environment, the number of in-home visits required to complete functions and the time elapsed between functions, the quality of the case management functions performed, the nature of the relationships established with service providers and referral agencies, and other aspects related to the internal management and organizational structure of projects. A sample of only 10 projects provides insufficient data to estimate the specific effects of each of the many factors affecting costs and to determine whether, after controlling for all such factors, true model differences exist in the estimated average costs incurred.
| TABLE IV.4. Comparisons of Costs with Factors Affecting Cost for Steady State Phase | |||||||||
| Average Initial Cost Per Clienta | Average Ongoing Costs Per Ongoing Case Montha | Factors Affecting Costsa | |||||||
| Project Scaleb | Hourly Project Wagec | Average Client to Case-Manager Ratiod | Subcontractor for Initial Functions | Use of Split Function | Density of Potential Client Populatione | ||||
| New Clients | Ongoing Case Months | ||||||||
| Basic Case Management Model | |||||||||
| Baltimore | 0.93 | 0.84 | 1.10 | 0.95 | 1.01 | 0.74 | No | Yes | 8.44 |
| Eastern Kentucky | 1.74 | 1.14 | 0.51 | 0.84 | 1.01 | 0.85 | Yes | No | 0.05 |
| Houston | 1.51 | 1.12 | 0.74 | 1.05 | 1.13 | 1.11 | No | No | 0.57 |
| Middlesex County | 0.83 | 1.07 | 1.69 | 1.08 | 1.13 | .1.01 | No | No | 1.12 |
| Maine | 0.73 | 0.96 | 0.52 | 0.74 | 0.79 | 0.89 | No | No | 0.16 |
| Financial Control Model | |||||||||
| Cleveland | 1.55 | 0.89 | 1.16 | 1.40 | 0.87 | 0.99 | No | No | 2.81 |
| Greater Lynn | 1.33 | 1.04 | 0.90 | 0.88 | 0.99 | 1.03 | No | No | 3.31 |
| Miami | 1.07 | 0.89 | 1.51 | 1.44 | 0.85 | 0.95 | No | Yes | 0.88 |
| Philadelphia | 0.78 | 0.96 | 1.18 | 1.70 | 1.05 | 1.07 | No | No | 11.71 |
| Rensselaer County | 0.65 | 1.22 | 0.61 | 0.66 | 0.90 | 1.01 | No | No | 0.19 |
| Median | $314.5 | $90 | 170 | 2,573 | $8.84 | 48.5 | --- | --- | 149 |
|
|||||||||
While we found no evidence of major differences between the models in total average costs, we did find important differences in the composition of costs. Specifically, the financial control model projects spent more for administration, provider relations, and clerical activities than the basic model projects. As Table IV.2 showed, total estimated administrative costs in the financial control model were 58 percent greater than that in the basic case management model ($929,000 compared with $590,000). Correspondingly, the financial control model projects also charged fewer expenditures directly to ongoing case management. This pattern is consistent with expectations that under the financial control model greater administrative costs were incurred in conjunction with processing service orders and invoices and monitoring provider contracts and expenditures. In addition, average direct ongoing case management costs which include service arranging costs, may have been lower in the financial control model because, under this model, projects had fewer constraints on their ability to provide direct services to clients.
Also, the factors presented on Table IV.4 help explain some of the variation in average costs across projects even though they do not indicate important model differences. For example, the data on Table IV.4 show that the Eastern Kentucky project had below average levels of project scale, a comparatively low average client: case-manager ratio, and slightly higher than average wages. As explained above, this project also used out-stationed subcontractors to conduct the screening functions and potential clients were widely dispersed within a relatively large geographic area. All these factors would be expected to contribute to higher than average cost, which the Eastern Kentucky project did, indeed, experience.
It is also evident however, that the factors identified in Table IV.4 work simultaneously and have confounding effects and that those factors do not account for all the reasons that individual projects had different levels of average costs. The Southern Maine project had very low average initial and ongoing costs; it also had below average caseload size, a comparatively low client: case-manager ratio and low density of potential clients--all of which would be expected to cause higher, not lower, average costs. Instead, we observed low average costs for this project. This discrepancy may have partially resulted from the comparatively low wages of full-time staff at this project. It is also likely that the Southern Maine project attained some efficiencies through other means not directly measured on Table IV.4. For example, during the steady phase, the Southern Maine project had reduced its administrative and supervisory staff.36
Clearly, the factors we have mentioned are only a subset of those expected to affect costs among the different projects. However, we do expect that the scale of projects, wage levels, geographic dispersion, caseloads per staff member and the use of subcontractors to conduct the initial functions, are important determinants of costs. Chapter VI discusses how the average cost estimates presented in this chapter may be used for budgeting case management programs like channeling. In that analysis, average cost estimates for the two models as a whole are used for explanatory purposes. Budgeters of similar case management programs will have to consider how the level of average costs in other programs can be expected to differ from those estimated for channeling due to the kinds of factors identified here.
V. COMPARISON OF THE ESTIMATED CASE MANAGEMENT COSTS OF CHANNELING WITH OTHER CASE MANAGEMENT PROGRAMS
One question of policy interest concerns how the case management costs of channeling compare with the costs of other case management programs. A comprehensive evaluation of why case management costs differ among various programs, however, is somewhat complex and requires a detailed understanding of the objectives and operations of each of the individual programs. Costs will differ among programs for a number of reasons--including differences in the target populations served, program goals, case management models adopted, internal management and organization of functions, levels of efficiencies achieved (e.g., economies of scale), relationships with referral agencies and service providers, and dropout rates.
There has been little previous study of the costs of a case management system like channeling. However, one recent study conducted by Berkeley Planning Associates (1984) did examine the average cost of providing case management programs in five different community-oriented long term care demonstrations. Although there are methodological differences and differences in the specific interventions examined, the findings of the Berkeley Planning Associates (BPA) report are comparable to the results presented in this report on-the costs of the case management system of channeling.
The BPA study examined five demonstration projects in which case management was the central strategy for coordinating resources and monitoring long term care for elderly clients. Although the case management process differed among the five demonstration projects, the basic definition used by BPA of a case management system included the core functions that constitute the case management system of channeling. As defined by BPA, a case management and coordination system included outreach, intake, certification of eligibility and appropriateness for the program services, assessment of client needs, care planning, monitoring of service delivery, reassessment of client needs, and other client-related services such as paperwork necessary for maintaining client services, contact with clients and informal caregivers, and routine reporting to funding agencies.
BPA attempted to measure replication-relevant costs, that is, all costs of the demonstration projects except the costs of medical and long term care services purchased for or provided to clients directly and costs that would not be incurred in an ongoing, nondemonstration program (e.g., research-related and demonstration administration costs). For each project, BPA determined the cost categories and staff activities (including support activities) to be included in replication-relevant costs based on staff time allocation studies, interviews with accounting managers, program administrators and case workers, and financial data maintained by the projects.
For each project BPA also defined the specific operational period for which the cost data were to be collected and analyzed. Based on specific criteria, BPA determined for each demonstration project a time period in which the project was operating at peak efficiency with its full complement of staff. The five demonstrations examined by BPA and the time periods selected for the cost analysis were:
- New York City Home Care Project--August 1981 through December 198237
- San Diego Long Term Care Project--November 1981 through June 1982
- Project OPEN--June 1981 through May 1982
- South Carolina Community Long Term Care Project--August 1982 through January 1983
- On Lok--July 1982 through December 1982
In order to compare costs across the five demonstration projects, BPA developed average cost estimates based upon the number of client enrollment months in each demonstration during the relevant time period. Specifically, estimated average monthly total case management costs were divided by the average number of active clients enrolled at the end of each month of the time period.
To develop estimates of the average monthly cost of the case management system of channeling, we divided total case management and related administration costs reported by demonstration projects during the nine months of the steady state phase by the total number of case months in the steady state phase. Case months are the total number of client enrollment months after the eligibility determination screen (i.e. they include all ongoing service months plus the time spent by new clients in the initial functions).
As stated previously, SPA estimated case management costs incurred in the five demonstrations during various periods ranging from June 1981 through January 1983. In comparison, the costs of the case management system of channeling were estimated for the period October 1983 through June 1984. For comparison purposes we inflated the BPA cost estimates to correspond to the time frame for which the channeling costs were estimated. The rates used to increase the BPA cost estimates were based on the change in the GNP implicit price deflator observed between the midpoint of the time periods selected for analysis by BPA and the first quarter of 1984 (the midpoint of the steady state phase.38
There are two other differences between the BPA cost estimates and the estimated costs of channeling. First, the total costs reported by the channeling projects include the estimated value of in-kind or donated services and supplies. Costs presented in the BPA analysis do not.39 Second, the total costs reported by channeling projects also include research-related and other special costs incurred because channeling was a demonstration. BPA, on the other hand, attempted to exclude all demonstration-related costs.40 We have not adjusted either set of cost estimates to account for these two differences. Consequently, the estimated average costs of case management in the channeling demonstration are still slightly high for direct comparison purposes with the BPA estimates.
As shown in Table V.1, the estimated average monthly cost of providing case management services ranged from $49 to $145 per client (after adjusting for inflation) among the five demonstrations examined by BPA. The estimate of the average per client monthly cost of the case management system of channeling (including in-kind costs and demonstration-related costs) was $102 for the demonstration as a whole. It ranged from $88 to $120 among the ten channeling projects. As can be seen, these estimates are within the range of the comparable BPA cost estimates.
BPA suggested that the largest source of variation in the costs of case management among the five programs it examined was differences in. the amount of staff time spent with each client that reflected differences in the particular intervention approach or case management model adopted.41 As described by BPA, the objective of the South Carolina Community Long Term Care Project, for which BPA estimated the lowest average case management cost, was to control access to and use of institutional long term care services through preadmission nursing home screening and assessment combined with service planning and management.42 The On Lok demonstration, which also had relatively low costs, consolidated case management and direct long term care services within an HMO type setting. Unlike the other demonstrations in the BPA analysis (and channeling), On Lok case management activities were directly integrated into the direct service delivery process; the service provider team, instead of a designated case manager, performed case management functions and provided direct services. Arrangement and monitoring of services, therefore, were expected to be less difficult and time consuming at the On Lok project. The intervention approach of the three remaining higher cost demonstrations examined by BPA focused on improving and monitoring the home care service package available to clients through a comprehensive case management program. These three demonstration projects were expected to incur higher average costs than South Carolina and On Lok due to the greater complexity in the case management services provided. According to BPA, client interaction was high in these three demonstrations, and clients received numerous home visits for assessment and reassessment.
A comprehensive analysis of the reasons for the variation in costs among the case management programs would require a much greater knowledge of individual program operations and management and the local service and economic envirnoments than is available. However, based upon our limited comparison, it appears that the costs of the case management system of channeling--whose overall objective was to bring about more effective and efficient provision of community care services by mitigating the problems of lack of information, uncoordinated services, and distorting financial incentives in the long term care system--are comparable with those of other case management demonstrations serving an elderly impaired population.
| TABLE V.1. Comparison of Average Case Management Costs of Channeling with Other Demonstrations(Basis is approximately first quarter 1984) | |
| Project | Estimated Average Case Management Cost per Client per Month |
| BPA Analysis of Five Demonstrations: | |
| South Carolina Community Long Term Care | $49 |
| On Lok Senior Health Services | 85 |
| New York City Home Care (average) | 104 |
| Project OPEN | 128 |
| San Diego Long Term Care Project | 145 |
| Channeling Demonstration: | |
| Basic Case Management | |
| Baltimore | 88 |
| Eastern Kentucky | 120 |
| Houston | 118 |
| Middlesex County | 107 |
| Southern Maine | 93 |
| Total | 106 |
| Financial Control | |
| Cleveland | 99 |
| Greater Lynn | 105 |
| Miami | 94 |
| Philadelphia | 94 |
| Rensselaer County | 118 |
| Total | 99 |
| All Channeling Projects | 102 |
| SOURCE: BPA cost estimates presented in BPA (1984), Table 12 were inflated to correspond to the time frame for which channeling project costs were estimated (see text). Cost data for channeling demonstration projects obtained from monthly cost records submitted by projects, Schedule B, page 1 during the steady state phase. Total costs reported were divided by total case months during the steady state phase.NOTE: Channeling cost estimates included reported in-kind costs and demonstration-related costs. | |
VI. IMPLICATIONS FOR COSTS OF FUTURE CASE MANAGEMENT PROGRAMS
When considering or planning case management programs like channeling, a key issue will be their cost. The cost data collected and analyzed during the channeling demonstration provide an important source of information regarding the likely magnitude of those costs. While such programs can be expected to differ from channeling as implemented in the demonstration, there may be essential similarities that enable demonstration cost data to be useful in budgeting.
In this chapter we examine how the demonstration cost data presented in this report can be used for this purpose. In particular, we examine some special features of the demonstration that are unlikely to be replicated in a nondemonstration setting. We then discuss how the cost estimates presented in Chapter IV could be used to construct estimates of the underlying per client cost of a case management program resembling channeling.
A. SPECIAL FEATURES OF DEMONSTRATIONS
Because channeling was a demonstration, there are a number of features of the channeling case management program affecting costs that would either not be replicated at all or not in the same manner in an ongoing nondemonstration program. Prior to budgeting nondemonstration case management programs based on the costs observed in demonstrations such as channeling, each of these factors and the magnitude of the effect they may have on the costs observed should be evaluated. Some of the more important demonstration features affecting costs include the scale of the demonstration in comparison to the planned intervention and the evaluation and research requirements that would not be conducted in an ongoing nondemonstration program.
With respect to scale, the channeling demonstration, although one of the largest of its kind, was implemented in 10 dispersed sites, each on a relatively small scale in comparison to an ongoing program, which could be implemented, for example, statewide. An ongoing program, if implemented on a wider basis, might attain some economies of scale not observed in this demonstration. If so, expected average costs of an ongoing program, holding all other factors constant, would probably be lower than those estimated for channeling. We cannot determine how much average costs would decline, primarily because there are no data available on the costs of comparable interventions of substantially different sizes. We, therefore, cannot determine the marginal rate at which costs decline as size increases.
With respect to research requirements, demonstration projects such as channeling require various research-related activities that would not be conducted in ongoing programs. In Chapter III it was estimated that the cost of staff time devoted to research activities (e.g., correspondence and meeting with the evaluation contactor, compiling and producing data collection forms) during the steady state phase of channeling represented, on average, one percent of case management costs incurred by the demonstration projects.
Less obvious and more difficult to evaluate is the net effect of the extra attention given projects because they were in the demonstration. The demonstrationwide meetings, interactions with the technical assistance contractor, and relatively frequent visits by federal and research staff undoubtedly increased costs. At the same time, this attention may have enabled projects to better control costs or to deliver services and supplies to the demonstration projects; these donations may not continue in an ongoing program.43
B. ESTIMATING THE AVERAGE PER CLIENT COST OF A CASE MANAGEMENT PROGRAM
In this section, we demonstrate how the data presented in this report may be used to estimate the per client cost of a case management program like channeling. We present examples showing how the average costs estimated for channeling may be used to develop estimates of the magnitude of costs in similar programs under alternative assumptions of eligibility and dropout rates, different combinations of case management functions, and different assumptions about average length of stay in the program.
In this presentation, we use the estimates of average costs incurred at the model level. These cast estimates, developed in Chapter IV, are based on project operations during the steady state phase when caseload sizes were relatively stable, startup activities had been terminated, and procedures and instruments had been already tested and tried. Analysts and planners using these estimates should recall that there was substantial variation in projects costs within each model. Thus, the model averages used here should be interpreted as guides rather than precise predictions.
The total per client financial commitment of a case management program includes two components: (1) the initial functions cost associated with enrolling one client in the program and (2) the cost of providing ongoing case management for the length of time the client remains in the program.44 We refer to the initial functions cost as the fixed cost of enrolling one client, i.e., the one time average cost that is incurred as an eligible client is enrolled in the program. As estimated in this analysis, this initial function (i.e., fixed) cost per client is the average estimated cost associated with the four initial core functions of channeling: casefinding/outreach, screening, baseline needs assessment and initial care planning. The second, component, the cost of providing ongoing case management, is a variable cost depending upon how long the client remains in the program and receives ongoing case management services. In this analysis, the cost of providing ongoing case management is estimated based on the average per client monthly cost of ongoing case management and the expected length of stay in the program following the initial care plan sign-off.
1. Initial Functions Cost Per Client
In Chapter IV we presented estimates of the average initial costs per client for the demonstration's steady state phase. As shown on Table VI.1, which reproduces these estimates, the fixed cost associated with enrolling a client was $330 for the basic model and $346 for the financial control model.
The denominator used to compute average per client initial functions costs, as described in Chapter IV, was the number of new clients entering channeling, i.e., the number of persons who had been determined eligible for channeling after the screening process.45 The numerator used in this calculation was the total estimated costs of the Initial functions activities actually conducted. That is, the numerator reflects total costs incurred while finding and screening all applicants (including those subsequently found to be ineligible) and conducting baseline assessments and initial care plans for those eligible clients who remained in the demonstration long enough to complete a baseline assessment or initial care plan. Therefore, the average initial functions cost per client incorporates the effects of 1) the proportion of applicants determined eligible and 2) the rate at which eligible clients dropped out of the program before completing a baseline assessment or initial care plan. Consequently, if it is expected that eligibility and dropout rates in a similar case management program are different from those observed in the channeling demonstration, the average fixed cost per client will also be different from those estimated for channeling.
The number of persons screened per eligible client and the percent of clients who actually completed a baseline assessment and initial care plan in the channeling demonstration during the nine months of the steady state phase are shown on Table VI.1. As shown on this table, for the basic case management model as a whole, a baseline assessment was completed for 78.6 percent, and an initial care plan was completed for 62.0 percent, of the new clients entering channeling, i.e., those persons determined eligible for channeling during the steady state phase. For every one person found eligible after the screening process 1.33 screens were completed (or approximately 75 percent of those screened were found eligible). For the financial control model during the steady state phase fewer screens were completed for every person found eligible (approximately 1.09) and the percent of persons determined eligible who actually completed a baseline assessment or an initial care plan was higher (85.6 and 73.5 percent, respectively).
| TABLE VI.1. Average Initial Functions Cost Per Client, Number of Persons Screened Per Eligible, and Dropout Rates for Steady State Phase | ||
| Basic Case Management | Financial Control | |
| Average Initial Functions (i.e. Fixed) Cost Per Clienta | $330 | $346 |
| Number of Persons Screened Per Clientb | 1.33 | 1.09 |
| Percent of Clients Who Completed a Baseline Assessmentb | 78.6% | 85.6% |
| Percent of Clients Who Completed an Initial Care Planb | 62.0% | 73.5% |
|
||
To estimate the average per client fixed cost under alternate assumptions of dropout and eligibility rates it is necessary to use data on the unit costs of the core initial functions. The unit costs represent, for example, the average cost of completing a screen per person who actually completed a screen, or the average cost of a baseline assessment per person for whom a baseline assessment was actually completed. Multiplying estimated unit costs by the appropriate eligibility or dropout ratio will produce estimates of the average cost per client. We demonstrate this by reestimating the average fixed cost per client for channeling using data observed in the demonstration on the number of completed screens per eligible client and the proportions of clients who completed a baseline assessment and who completed an initial care plan (Table VI.1) and unit cost estimates. The estimated unit costs of completing a screen, a baseline assessment, and an initial care plan during the channeling demonstration are shown on Table VI.2.46
For the basic model the estimated unit cost of a screen was $63; for every one client determined eligible 1.33 screens were completed. Consequently, the average cost of screening per client was $63 x 1.33 = $84.47 The estimated unit cost of a baseline assessment was $139 in the basic model, and approximately 78.6 percent of those determined eligible for channeling completed a baseline assessment. Therefore, the average cost per client of a baseline assessment under the basic case management model was $109 (.786 x $139). Finally, the unit cost of an initial care plan in the basic case management model was $201 and roughly 62 percent of the clients completed an initial care plan completed. Consequently, the average cost per client of initial care planning in this model was $125. Combined, the average per client cost of screening, baseline assessment, and initial care planning for the basic case management model was $318. The $12 difference between this estimate and the average cost estimate of $330 per client for the four initial case management functions (presented in Table VI.1 and in Chapter IV), is the average cost associated with the outreach function including allocated administration.
| TABLE VI.2. Estimated Unit Costs of Initial Functions for Steady State Phase | ||
| Basic Case Management | Financial Control | |
| Unit Cost of a Screen | $63 | $73 |
| Unit Cost of a Baseline Assessment | $139 | $102 |
| Unit Cost of a Initial Care Plan | $201 | $223 |
| SOURCE: The unit cost estimates are the result of dividing the total core function plus allocated administration cost estimated for the steady state phase by the relevant measures of caseload (i.e., screens completed, baseline assessments completed, initial care plans completed) shown in Table III.4. Estimated administrative costs (including management, provider relations activities, and clerical and support staff activities) are included in the numerators. The proportion of total administrative costs allocated to each core function is based on the allocation procedure described in Chapter IV.NOTE: The numerators include costs incurred by clients for whom a function was begun but not completed. For example, the data available on the total cost of initial care planning includes the costs incurred for clients for whom an initial care plan may have been started but for various reasons was not completed. We expect that this did not occur very often; however, this suggests that the unit costs presented may slightly overestimate the actual unit cost of completing each function. | ||
The average cost of screening, baseline assessment, and initial care planning in the financial control model is reestimated using the same methodology and the data in Table VI.1 and Table VI.2. The calculation is shown in Example B of Table VI.3. The estimated average cost per client of the three initial functions is $331. This result, in comparison to the average fixed cost estimate of $346 per client presented earlier (Table VI.1), suggests that the average cost of the outreach function (including allocated administration) was $15 per client in the financial control model.
If, alternatively, it was expected that in a similar case management program a greater number of persons than that observed for channeling would have to be screened for every eligible client, average per client screening costs would increase. Example C of Table VI.3 assumes that the eligibility rate is 50 percent, that is for every one eligible client two persons must be screened. Using the estimated unit cost of screening for the basic model, the average per client cost of screening under these assumptions would be $126. This increase may be offset, however, if it was also expected that the proportions of clients who actually completed a baseline assessment and initial care plan were lower than that in channeling. For example, if it was also assumed that the proportion of clients who actually completed a baseline assessment was 50 percent and the proportion who completed an initial care plan was 25 percent, then the average per client costs of these two initial functions would be lower than that estimated for channeling. Using the applicable unit costs estimated .for the basic model, under these assumptions of greater client dropout rates, as shown in Example C of Table VI.3, the average per client cost of baseline assessment and initial care planning would be $70 and $50, respectively. Overall, under these alternative eligibility and dropout assumptions and given the unit function costs estimated for the basic model, the average initial fixed cost per client, before accounting for outreach, would be $246. Example D of Table VI.3 shows that substituting the unit costs estimated for the financial control model, the estimated average initial fixed cost, before accounting for outreach, is quite similar, $253 per client, under the same eligibility and dropout assumptions.
The fixed cost estimates presented above assume that the initial enrollment process in a future case management program includes the four initial core functions of channeling, i.e., outreach, screening, baseline needs assessment, and initial care planning. If, alternatively, screening were conducted outside of the channeling program, by a hospital discharge planner or nursing home preadmission unit, for example, average initial fixed costs per client incurred by the project itself would clearly be less. For the basic case management model under the dropout rates observed in channeling, the per client fixed cost would be $234 (plus some relatively small amount for outreach, if still conducted under this scenario) as shown in Example E of Table VI.3; for the financial control model, the average fixed cost per client would be $251 (plus some small amount for outreach, if necessary) if screening had not been a responsibility of the case management program.
Other calculations may be performed using alternative estimates of the unit cost of initial functions. In Chapter IV of this report, we presented average cost estimates for each of the 10 demonstration projects; the variation observed in estimated costs among these projects was substantial. Budgeters might want to adjust unit cost estimates to account for some of the factors identified in Chapter IV that are likely to affect the unit costs of a future program.
2. Total Financial Commitment Per Client
As stated the total financial commitment per client comprises two components: the fixed cost of enrolling one eligible client and the cost of providing ongoing case management to a client for the duration of the client's participation in the program. Above we described how budgeters might use data presented in this report to estimated the fixed cost of enrolling one client. The ongoing cost component in this analysis is estimated as the average monthly per client cost of providing ongoing case management (after the initial care plan has been formulated and signed) multiplied by the average length of stay in the program, measured in months after initial care plan sign-off.
For the channeling demonstration the estimated monthly per client cost of ongoing case management and the average length of stay during the 18 months of the demonstration observation period are shown on Table VI.4 for the two models. Based on these data and the estimated fixed cost of enrolling one client, we estimate the total per client cost under the basic model during the 18-month observation period as $1,142, the sum of the fixed cost per client ($330) and the ongoing cost per client ($92 x 8.83). Under the financial control model, the total per client cost during the 18-month observation period is estimated to be $1,160.
| TABLE VI.3. Calculating Average Fixed Cost Estimates Under Alternative Assumptions of Eligibility and Dropout Rates | ||||||||||
| Number Screened Per Client | Percent of Clients who CompletedBaselineAssessment | Percent of Clients who CompletedInitial Care Plan | Average per Client Cost of Screening | Average per Client Cost of BaselineAssessment | Average per Client Cost of InitialCare Planning | Average Fixed Cost per Client (Less AverageCost ofOutreach) | ||||
| Example A: Basic Case Management | 1.33 | 78.6 | 62.0 | ($63 x 1.33)$84 | ++ | ($139 x 0.786)$109 | ++ | ($201 x 0.62)$125 | == | $318 |
| Example B: Financial Control | 1.09 | 85.6 | 73.6 | ($73 x 1.09)$80 | ++ | ($102 x 0.856)$87 | ++ | ($223 x 0.735)$164 | == | $331 |
| Example C: (Using Estimated Unit Costs of Basic Case Management) | 2.0 | 50.0 | 25.0 | ($63 x 0.50)$70 | ++ | ($139 x 0.50)$70 | ++ | ($201 x 0.25)$50 | == | $246 |
| Example D: (Using Estimated Unit Costs of Financial Control) | 2.0 | 50.0 | 25.0 | ($102 x 0.50)$51 | ++ | ($102 x 0.50)$51 | ++ | ($223 x 0.25)$56 | == | $253 |
| Example E: No Internal Screening Function (Using Estimated Unit Costs, Eligibility and Dropout Rates of Basic Case Management) | 1.33 | 78.6 | 62.0 | ($139 x 0.786)$109 | ($139 x 0.786)$109 | ++ | ($201 x 0.62)$125 | == | $234 | |
The average length of stay estimates used above underestimate the average amount of time clients actually spent in the channeling program because they reflect only the average length of stay observed up to the end of the 18-month observation period. The actual average duration of program participation is expected to have been longer and, consequently, the total average per client cost is expected to be higher. Table VI.5 shows the total estimated financial commitment per client given alternative assumptions about length of stay (measured after initial care plan sign-off).
| TABLE VI.4. Factors for Estimating Average Financial Commitment Per Client | ||
| Basic Case Management | Financial Control | |
| Per Client Fixed Cost | $330 | $346 |
| Per Client per Month Cost of Ongoing Case Management | $92 | $86 |
| Average Length of Stay (Mos.) During 18-Month Observation Period (after initial care plan sign-off) | 8.83 | 9.47 |
| SOURCE: Table IV.3 and client tracking system. | ||
These estimates indicate that under a program like channeling, if average length of stay following initial care plan sign-off is one year, the average cost of enrolling and providing ongoing case management to one client is approximately $1,400. If in a case management program modelled similarly to channeling average length of stay were four years, the average per client financial commitment would be around $4,600.
C. SUMMARY
As previously noted, the cost estimates presented above have not been adjusted to account for the costs incurred due to the fact that channeling was a demonstration. In Section A of this chapter we identified the special features of a demonstration that affect costs. One consideration of major importance is that if a case management program like channeling is implemented on a larger scale than this demonstration, we would expect that, holding all other factors constant, average costs per client would be lower than that observed in the demonstration. We cannot identify how much lower, primarily because there is no information on comparable programs of substantially different scale.
| TABLE VI.5. Average Financial Commitment Per Client Under Alternative Assumptions of Average Length of Stay(dollars) | ||
| Average Length of Stay After Initial Care Plan Sign-Off | Basic Case Management | Financial Control |
| 12 months | 1,434 | 1,378 |
| 18 months | 1,986 | 1,894 |
| 24 months | 2,538 | 2,410 |
| 48 months | 4,746 | 4,474 |
Budgeters of future programs should also expect that during program startup average costs will be higher. The costs estimates presented in this chapter were based on costs reported by projects during a later operational phase of the demonstration, at least a year and a half after project operations began. Consequently, the estimates represent estimated costs of a more mature operational program, in which procedures and practices have been fairly well established.
This analysis of the implications for average costs of a other case management programs used estimates representing average costs for the two models tested under the demonstration. In Chapter IV we presented data on the estimated costs incurred by the individual local demonstration projects. The variation in the cost estimates among the 10 projects was substantial and, as discussed in that chapter, myriad factors could affect costs in any one project. Some of the factors affecting costs identified in that chapter include scale, wages and regional price differences, the internal organization and management of projects, the number of clients served per case manager, the local service environment, and geographic dispersion of clients. If the data presented in this report are used estimating the costs of a future program, these types of factors, interpreted in the context of information on how the case management functions of channeling were actually performed and organized within projects,48 must be evaluated in terms of their affect on costs in any future program.
Finally, if should be noted that the cost estimates presented here pertain only to the direct case management (and related administrative, provider relations, and clerical) activities administered at the local level. In this report we have not discussed the additional costs of central administration that in this demonstration were incurred by overseeing state and federal agencies. Central administration includes program planning, monitoring and oversight, and other activities such as disbursement of funds to be used for direct service expenditures. In Chapter III we presented data on the reported costs incurred by state agencies; however, their demonstration responsibilities included a range of long term care planning activities. Therefore, not all the state-level costs are directly attributable to the case management activities of channeling. In future case management programs, central administration may be organized quite differently from its organization under channeling.49 However, additional monitoring and oversight costs will necessary be incurred.
The purpose of this chapter was to demonstrate how the data presented in this report on the case management functions of channeling could be used to help budget case management programs like channeling. We do not intend the cost figures presented here to represent precise estimates of the costs of any future case management program, but they should provide an indication of the order of magnitude of the cost involved in enrolling and providing ongoing case management to one client. Precise estimates of the costs of a future case management program will require an examination of the differences in the approach and objectives of the future intervention with that of channeling; it will also require evaluation of the special features of a demonstration that would not be replicated in an ongoing program and the organizational and environmental factors described in Chapter IV that affect costs.
In this report we have focused on the operational costs of channeling. However, operational cost is only one element of program effectiveness. The critical question is whether program outcomes justify these costs. To evaluate the demonstration in terms of this question readers must look to the channeling impact and benefit-cost analyses.
REFERENCES
Berkeley Planning Associates. Production Costs of Case Management and Coordination Systems. Prepared for Health Care Financing Administration, United States Department of Health and Human Services, Contract No. 500-80-0073, Berkeley, CA: Berkeley Planning Associates, August 1984.
Carcagno, George C. et al. The Planning and Operational Experiences of the Channeling Projects, Princeton, NJ: Mathematica Policy Research, March 1985. [http://aspe.hhs.gov/daltcp/reports/proceses.htm]
Channeling Demonstration Project Instructions Manual For Reporting Financial Status. Mathematica Policy Research, Incorporated Data Collection Instrument #82-13, Princeton, NJ: Mathematica Policy Research, 1982.
APPENDIX A. SUPPLEMENTAL TABLES
This appendix provides four sets of tables that supplement the information in the text. The first two sets, Table A.1 through Table A.2 and Table A.3 through Table A.10, present costs incurred at the project-and state-levels during the planning phase and the randomization period of the buildup phase. The cost breakdowns for 'the planning and buildup phases are similar to the breakdowns of steady state costs in the body of the report. The third set of tables, Table A.11 through Table A.14, provides additional breakdowns of steady state cost estimates and project and state-level cost estimates through June 1984 that are discussed in the report. For all these sets, variable definitions are given in the text and in the glossary in Appendix C.
The fourth set, Table A.15, supplements Chapter III's special demonstration cost discussion. Table A.15 shows the cost estimates (including administration costs) for screening eligible applicants who were randomly assigned-to the control group during the randomization period. We used the fraction of all eligible applicants who were controls during the randomization period as the fraction of costs spent to screen controls.50 The projects spent over $300,000, or 37 percent of their randomization period screening costs to screen the controls.
| TABLE A.1. Federally Reimbursed Planning Phase Expenditures: Basic Case Management Model | |||||||||
| Initial Planningb | Operational Planningc | Total | |||||||
| Number of ProjectMonths | Total Expenditures | AverageMonthly Expenditures | Number of ProjectMonths | Total Expenditures | AverageMonthly Expenditures | Number of ProjectMonths | Total Expenditures | AverageMonthly Expenditures | |
| Baltimore, Maryland | |||||||||
| State | 11 | 62,600 | 5,691 | 5 | 44,500 | 8,900 | 16 | 107,100 | 6,694 |
| Site | 3 | 4,800 | 1,600 | 5 | 16,500 | 3,300 | 8 | 21,300 | 2,663 |
| Total | --- | 67,400 | --- | --- | 61,000 | --- | --- | 128,400 | --- |
| Eastern Kentuckya | |||||||||
| State | 10 | 96,200 | 9,620 | 9 | 79,500 | 8,833 | 19 | 175,700 | 9,247 |
| Site | 7 | 19,900 | 2,843 | 9 | 44,400 | 4,933 | 16 | 64,300 | 4,019 |
| Total | --- | 116,100 | --- | --- | 123,900 | --- | --- | 240,000 | --- |
| Houston, Texas | |||||||||
| State | 11 | 95,300 | 8,664 | 5 | 34,100 | 6,820 | 16 | 129,400 | 8,087 |
| Site | 6 | 35,200 | 5,867 | 5 | 75,000 | 15,000 | 11 | 110,200 | 10,018 |
| Total | --- | 130,500 | --- | --- | 109,100 | --- | --- | 230,600 | --- |
| Middlesex County, New Jersey | |||||||||
| State | 9 | 48,100 | 5,344 | 6 | 25,600 | 4,267 | 15 | 7,370 | 4,913 |
| Site | 6 | 42,700 | 7,117 | 6 | 98,400 | 16,400 | 12 | 141,100 | 11,758 |
| Total | --- | 90,800 | --- | --- | 124,000 | --- | --- | 214,800 | --- |
| Southern Maine | |||||||||
| State | 11 | 37,000 | 3,364 | 5 | 25,400 | 5,080 | 16 | 62,400 | 3,900 |
| Site | 7 | 9,000 | 1,286 | 5 | 33,200 | 6,640 | 12 | 42,200 | 3,517 |
| Total | --- | 46,000 | --- | --- | 58,600 | --- | --- | 104,600 | --- |
| All Projects | |||||||||
| State | 52 | 339,200 | 6,523 | 30 | 209,100 | 6,970 | 82 | 548,300 | 6,687 |
| Site | 29 | 111,600 | 3,848 | 30 | 267,500 | 8,917 | 59 | 379,100 | 6,425 |
| Total | --- | 450,800 | --- | --- | 476,600 | --- | --- | 927,400 | --- |
SOURCE: DHHS expense invoices.
|
|||||||||
| TABLE A.2. Federally Reimbursed Planning Phase Expenditures: Financial Control Model | |||||||||
| Initial Planninga | Operational Planningb | Total | |||||||
| Number of ProjectMonths | Total Expenditures | AverageMonthly Expenditures | Number of ProjectMonths | Total Expenditures | AverageMonthly Expenditures | Number of ProjectMonths | Total Expenditures | AverageMonthly Expenditures | |
| Cleveland, Ohio | |||||||||
| State | 9 | 33,300 | 3,700 | 9 | 62,800 | 6,978 | 18 | 96,100 | 5,339 |
| Site | 3 | 27,900 | 9,300 | 9 | 117,110 | 13,011 | 12 | 145,000 | 12,083 |
| Total | --- | 61,200 | --- | --- | 179,900 | --- | --- | 241,000 | --- |
| Greater Lynn, Massachusetts | |||||||||
| State | 10 | 70,900 | 7,090 | 8 | 67,100 | 8,387 | 18 | 138,000 | 7,667 |
| Site | 2 | 3,300 | 1,650 | 8 | 65,700 | 8,213 | 10 | 69,000 | 6,900 |
| Total | --- | 74,200 | --- | --- | 132,800 | --- | --- | 207,000 | --- |
| Miami, Florida | |||||||||
| State | 12 | 40,900 | 3,408 | 8 | 46,500 | 5,813 | 20 | 87,400 | 4,370 |
| Site | 8 | 37,000 | 4,625 | 8 | 97,900 | 12,237 | 16 | 134,900 | 8,431 |
| Total | --- | 77,900 | --- | --- | 144,400 | --- | --- | 222,300 | --- |
| Philadelphia, Pennsylvania | |||||||||
| State | 7 | 45,200 | 6,457 | 8 | 66,300 | 8,287 | 15 | 111,500 | 7,433 |
| Site | 6 | 19,600 | 3,267 | 8 | 105,000 | 13,125 | 14 | 124,600 | 8,900 |
| Total | --- | 64,800 | --- | --- | 171,300 | --- | --- | 236,100 | --- |
| Rensselaer County, New York | |||||||||
| State | 12 | 52,200 | 4,350 | 9 | 74,000 | 8,222 | 21 | 126,200 | 6,010 |
| Site | 4 | 16,400 | 4,100 | 9 | 110,500 | 12,278 | 13 | 126,900 | 9,762 |
| Total | --- | 68,600 | --- | --- | 184,500 | --- | --- | 253,100 | --- |
| All Projects | |||||||||
| State | 50 | 242,500 | 4,850 | 42 | 316,700 | 7,540 | 92 | 559,200 | 6,078 |
| Site | 23 | 104,200 | 4,530 | 42 | 496,200 | 11,814 | 65 | 600,400 | 9,237 |
| Total | --- | 346,700 | --- | --- | 812,900 | --- | --- | 1,159,600 | --- |
SOURCE: DHHS expense invoices.
|
|||||||||
| TABLE A.3. Total Project and State-Level CostsRandomization Period of Buildup Phase(Dollars) | ||||||||
| Projects | States | |||||||
| Core Channeling andAdministrationaExpenditures | In-Kind Costsb | Direct Service Expendituresc | Total Project Costs | Expenditures | In-Kind Costsa | Total State Costs | Total Costs | |
| Basic Case Management | ||||||||
| Baltimore | 414,345 | 26,359 | 28,865 | 469,569 | 134,981 | 0 | 134,981 | 604,550 |
| Eastern Kentucky | 328,566 | 0 | 20,207 | 348,773 | 51,378 | 0 | 51,378 | 400,151 |
| Houston | 589,053 | 25,404 | 9,520 | 623,977 | 124,777 | 43,396 | 168,173 | 792,150 |
| Middlesex County | 644,801 | 1,708 | 41,205 | 687,714 | 43,197 | 17,573 | 60,770 | 748,484 |
| Southern Maine | 341,447 | 0 | 100,406 | 441,853 | 65,571 | 2,933 | 68,504 | 510,357 |
| Total | 2,318,212 | 53,471 | 200,203 | 2,571,886 | 419,904 | 63,902 | 483,806 | 3,055,692 |
| Financial Control | ||||||||
| Cleveland | 453,608 | 55,385 | 537,722 | 1,046,715 | 81,314 | 0 | 81,314 | 1,128,029 |
| Greater Lynn | 394,288 | 0 | 661,864 | 1,056,152 | 97,712 | 0 | 97,712 | 1,153,864 |
| Miami | 494,430 | 122 | 764,222 | 1,258,774 | 87,650 | 6,074 | 93,724 | 1,352,498 |
| Philadelphia | 554,677 | 0 | 1,027,642 | 1,582,319 | 78,517 | 0 | 78,517 | 1,660,836 |
| Rensselaer County | 327,354 | 9,607 | 345,086 | 682,047 | 105,565 | 14,823 | 120,388 | 802,435 |
| Total | 2,224,357 | 65,114 | 3,336,536 | 5,626,007 | 450,758 | 20,897 | 471,655 | 6,097,662 |
| All Projects | 4,542,569 | 118,585 | 3,536,739 | 8,197,893 | 870,662 | 84,799 | 955,461 | 9,153,354 |
SOURCES: Cost schedules (Schedule B, pp.1 and 2).NOTE: See Table A.3 for definition of randomization period.
|
||||||||
| TABLE A.4. Percentage of Project Employee Salary Expenditures by Function(First Enrollment Through March 1983) | ||||||||||
| Timesheet Functions | Basic Case Management | Financial Control | ||||||||
| Baltimore | Eastern Kentucky | Houston | Middlesex County | Southern Maine | Cleveland | Greater Lynn | Miami | Philadelphia | Rensselaer County | |
| Case Finding/ Outreach | 1.6 | 7.0 | 9.3 | 2.1 | 5.4 | 1.9 | 0.8 | 2.4 | 0.3 | 2.5 |
| Screening | 12.2 | 18.9 | 6.4 | 9.1 | 9.0 | 16.6 | 7.8 | 9.9 | 8.0 | 8.5 |
| Baseline Assessment | 11.2 | 6.9 | 7.6 | 8.3 | 4.7 | 5.4 | 6.2 | 8.1 | 5.8 | 6.6 |
| Initial Care Plan | 10.0 | 7.8 | 9.2 | 10.5 | 6.9 | 12.7 | 12.1 | 9.6 | 9.2 | 6.9 |
| Ongoing Case Mgt. | 23.4 | 16.5 | 13.0 | 23.3 | 26.9 | 11.0 | 18.3 | 17.5 | 17.6 | 20.4 |
| Administration/ Provider Relations/ Clerical | 41.6 | 42.9 | 54.5 | 46.7 | 47.1 | 52.4 | 54.8 | 52.5 | 59.1 | 55.1 |
| Total | 100.0 | 100.0 | 100.0 | 100.0 | 100.0 | 100.0 | 100.0 | 100.0 | 100.0 | 100.0 |
| SOURCE: Timesheet data submitted by projects and their subcontractors and hourly wage rates of project and subcontractor staff.NOTE: Excludes donated and volunteer salary costs. | ||||||||||
| TABLE A.5. Caseload Measures in Randomization Period of Buildup Phase | |||||||||||||
| Basic Case Management | Financial Control | Project Total | |||||||||||
| Baltimore | Eastern Kentucky | Houston | Middlesex County | Southern Maine | Total | Cleveland | Greater Lynn | Miami | Philadelphia | Rensselaer County | Total | ||
| Complete Screens | 915 | 722 | 1,023 | 1,181 | 910 | 4,751 | 785 | 748 | 1,185 | 1,146 | 566 | 4,430 | 9,181 |
| Number of Persons Eligible | 767 | 549 | 752 | 836 | 599 | 3,503 | 711 | 704 | 909 | 1,067 | 428 | 3,819 | 7,322 |
| New Clients | 484 | 294 | 472 | 528 | 330 | 2,108 | 506 | 391 | 597 | 774 | 230 | 2,498 | 4,606 |
| Completed Baseline Assessments | 409 | 272 | 429 | 474 | 291 | 1,875 | 480 | 363 | 544 | 711 | 221 | 2,319 | 4,194 |
| Completed Inital Care Plans | 361 | 254 | 298 | 426 | 274 | 1,613 | 446 | 315 | 491 | 652 | 209 | 2,113 | 3,726 |
| Ongoing Case Months | 1,682 | 937 | 1,934 | 1,753 | 1,439 | 7,745 | 1,407 | 1,130 | 1,840 | 2,683 | 792 | 7,852 | 15,597 |
| Case Months | 2,176 | 1,171 | 2,267 | 2,192 | 1,629 | 9,435 | 1,772 | 1,598 | 2,280 | 3,174 | 865 | 9,689 | 19,124 |
| SOURCE: Client Tracking File and DHHS statistical reports.NOTE: See Chapter III for definition of terms. The randomization period of the buildup phase began in the month in which clients were first enrolled at projects (some projects began in February 1982) and ended in June 1983. | |||||||||||||
| TABLE A.6. Total Costs of Core Functions Randomization Period of Buildup Phase(dollars) | |||||||||||||
| Basic Case Management | Financial Control | Demonstration Total | |||||||||||
| Baltimore | Eastern Kentucky | Houston | Middlesex County | Southern Maine | Total | Cleveland | Greater Lynn | Miami | Philadelphia | Rensselaer County | Total | ||
| Inital Functions | |||||||||||||
| Casefinding | 7,051 | 23,000 | 57,145 | 13,577 | 18,438 | 119,211 | 9,671 | 3,154 | 11,869 | 1,664 | 8,424 | 34,782 | 153,993 |
| Screening | 53,766 | 62,099 | 39,325 | 58,832 | 30,730 | 244,752 | 84,493 | 30,754 | 48,961 | 44,374 | 28,642 | 237,224 | 481,976 |
| Baseline Assessment | 49,359 | 22,671 | 46,699 | 53,660 | 16,048 | 188,437 | 27,486 | 24,446 | 40,059 | 32,171 | 22,239 | 146,401 | 334,838 |
| Initial Care Planning | 44,070 | 25,628 | 56,530 | 67,883 | 23,560 | 217,671 | 64,642 | 47,709 | 47,477 | 51,030 | 23,250 | 234,138 | 451,809 |
| Subtotal | 154,246 | 133,398 | 199,699 | 193,952 | 88,776 | 770,071 | 186,292 | 106,063 | 148,366 | 129,269 | 82,555 | 652,545 | 1,422,616 |
| Ongoing Case Management Costs Per Ongoing Casemonth | 103,125 | 54,213 | 79,879 | 150,637 | 91,849 | 479,703 | 55,989 | 72,155 | 86,547 | 97,623 | 68,740 | 381,054 | 860,757 |
| Administration/ Provider Relations/ Clerical | 103,333 | 140,955 | 334,879 | 301,920 | 160,822 | 1,121,909 | 266,712 | 216,070 | 259,639 | 327,785 | 185,666 | 125,5872 | 2,377,781 |
| All Functions | 440,704 | 328,566 | 614,457 | 646,509 | 341,447 | 2,371,683 | 508,993 | 394,288 | 494,552 | 554,677 | 336,961 | 2,289,471 | 4,661,154 |
| SOURCE: Total reported expenditures place in-kind costs reported by projects on Schedule B pg. 1 allocated to core function based on distribution of salary costs to core functions and administrative functions. See Chapter IV for explanation of allocation of administrative costs.NOTE: See Table A.3 for definition of randomization period. | |||||||||||||
| TABLE A.7. Average Costs of Initial Functions Per Client and Ongoing Functions Per Ongoing Case Month(Randomization Period of Buildup Phase)(dollars) | |||||||||||||
| Basic Case Management | Financial Control | Projects as aWhole | |||||||||||
| Baltimore | Eastern Kentucky | Houston | Middlesex County | Southern Maine | Modelas a Whole | Cleveland | Greater Lynn | Miami | Philadelphia | Rensselaer County | Modelas a Whole | ||
| Initial Functions Per Client | |||||||||||||
| Case finding | 15 | 78 | 121 | 26 | 56 | 57 | 19 | 8 | 20 | 2 | 37 | 14 | 33 |
| Screening | 111 | 212 | 83 | 110 | 93 | 116 | 167 | 79 | 82 | 57 | 124 | 95 | 105 |
| Baseline Assessment | 102 | 77 | 99 | 102 | 49 | 89 | 54 | 63 | 67 | 42 | 97 | 59 | 73 |
| Initial Care Planning | 91 | 87 | 120 | 129 | 71 | 103 | 128 | 121 | 80 | 66 | 101 | 94 | 98 |
| Subtotal | 319 | 454 | 423 | 367 | 269 | 365 | 368 | 271 | 249 | 167 | 359 | 262 | 309 |
| Administration/ Provider Relations | 215 | 324 | 466 | 344 | 196 | 316 | 265 | 199 | 170 | 143 | 288 | 196 | 251 |
| Total Initial Functions | 534 | 778 | 889 | 711 | 465 | 681 | 633 | 470 | 419 | 310 | 647 | 458 | 560 |
| Ongoing Costs Per Ongoing Casemonth | |||||||||||||
| Ongoing Case Management | 61 | 58 | 41 | 86 | 64 | 62 | 40 | 64 | 47 | 36 | 87 | 49 | 55 |
| Administration/ Provider Relations | 47 | 49 | 59 | 69 | 67 | 59 | 94 | 122 | 86 | 81 | 151 | 97 | 78 |
| Total Ongoing Functions | 108 | 107 | 100 | 155 | 131 | 121 | 134 | 186 | 133 | 117 | 238 | 146 | 133 |
| SOURCE: Costs reported on Schedule B pg. 1. Allocation of csots to core function is based on distribution of salary expenditures to core function and administrative functions. Data on clients and ongoing case months reported on client tracking system.NOTE: See Table A.3 for definition of randomization period. | |||||||||||||
| TABLE A.8. Direct Services Expenditures Per Ongoing Case Month, by Service and by Project for Randomization Period of Buildup Phase(dollars) | ||||||||||||
| Basic Case Management | Financial Control | |||||||||||
| Baltimore | Eastern Kentucky | Houston | Middlesex County | Southern Maine | Modelas a Whole | Cleveland | Greater Lynn | Miami | Philadelphia | Rensselaer County | Modelas a Whole | |
| Homemaker/ Personal Care | 6.9 | 11.3 | 0.4 | 1.0 | 26.2 | 8.0 | 238.3 | 377.6 | 262.1 | 225.1 | 227.7 | 257.9 |
| Skilled Nursing | 0.2 | 0.0 | 0.0 | 0.0 | 0.3 | 0.1 | 17.3 | 35.3 | 53.8 | 61.9 | 67.7 | 48.7 |
| Home Health Aide | 4.2 | 0.0 | 0.0 | 20.7 | 29.3 | 11.0 | 85.7 | 36.5 | 5.6 | 12.0 | 105.8 | 36.5 |
| Home Delivered Meals | 0.0 | 1.0 | 0.3 | 0.1 | 0.0 | 1.2 | 21.1 | 16.9 | 41.2 | 17.0 | 14.1 | 23.1 |
| Therapies | 0.0 | 0.0 | 0.0 | 0.0 | 0.2 | 0.0 | 7.6 | 10.6 | 17.4 | 42.5 | 12.6 | 22.8 |
| Companion | 0.0 | 0.0 | 0.5 | 0.0 | 9.2 | 0.9 | 0.3 | 63.7 | 3.0 | 0.0 | 0.3 | 9.9 |
| Transportation | 1.7 | 0.7 | 0.0 | 0.7 | 0.3 | 0.7 | 0.6 | 15.9 | 8.3 | 4.5 | 7.6 | 6.6 |
| Housekeeping | 0.1 | 0.2 | 0.0 | 0.1 | 0.2 | 0.1 | 0.8 | 0.0 | 8.5 | 8.8 | 5.0 | 5.7 |
| Day Health | 0.0 | 0.0 | 0.0 | 0.0 | 0.8 | 0.1 | 0.0 | 32.0 | 0.9 | 0.0 | 6.6 | 5.4 |
| Nonroutine Consumable Medical | 1.0 | 0.0 | 0.0 | 0.0 | 0.1 | 0.2 | 4.1 | 0.6 | 2.0 | 8.1 | 2.2 | 4.3 |
| Chore | 0.0 | 0.1 | 0.1 | 0.3 | 0.6 | 0.2 | 6.5 | 0.8 | 6.2 | 2.8 | 1.5 | 3.8 |
| Mental Health | 0.0 | 0.0 | 0.0 | 0.0 | 0.5 | 0.1 | 3.1 | 5.4 | 5.0 | 0.0 | 2.5 | 2.8 |
| Adaptive and Assistive Equipment | 0.5 | 3.2 | 0.7 | 0.1 | 2.3 | 1.4 | 0.6 | 1.4 | 1.5 | 1.1 | 0.9 | 1.1 |
| Respite Care | 1.2 | 0.0 | 0.6 | 0.1 | 0.2 | 0.5 | 0.0 | 0.6 | 5.9 | 0.0 | 0.0 | 1.5 |
| Day Maintenance | 0.0 | 0.0 | 0.0 | 0.4 | 0.0 | 0.1 | 0.8 | 0.0 | 2.8 | 1.7 | 0.6 | 1.4 |
| Other (Non-Core) | 0.0 | 2.1 | 0.8 | 0.7 | 1.9 | 1.0 | 0.0 | 0.0 | 1.3 | 0.0 | 0.0 | 0.3 |
| Adult Foster Care | 1.8 | 0.0 | 0.6 | 0.0 | 0.0 | 0.5 | 0.0 | 1.2 | 0.0 | 0.0 | 0.0 | 0.2 |
| Housing Assistance | 0.5 | 3.2 | 0.0 | 0.0 | 0.6 | 0.6 | 0.0 | 0.4 | 0.1 | 0.0 | 0.0 | 0.1 |
| Emergency Assistance (Non-Core) | 0.0 | 0.4 | 0.1 | 0.0 | 0.8 | 0.4 | 0.0 | 0.0 | 0.0 | 0.0 | 0.0 | 0.0 |
| Total | 18.1 | 22.2 | 5.1 | 24.2 | 73.5 | 27.1 | 386.8 | 598.9 | 425.6 | 385.5 | 455.1 | 432.1 |
| SOURCE: Costs based on Schedule B p.2. Ongoing case months based in client tracking system.NOTE: Each cell of table presents average amount of money spent per ongoing case month for a particular service in a particular site. Ongoing case months are the number of months of ongoing case management services delivered to all clients once they have signed their initial care plan. This measures caseload activity after the initial care planning stage; that is, it excludes the time spent during the initial, one-time-only functions of screening, baseline assessment, and initial care planning. See Table A.3 for definition of randomization period. | ||||||||||||
| TABLE A.9. Percent Distribution of Direct Service Expenditures by Source, by Project for Randomization Period of Buildup Phase | |||||||||||||
| Basic Case Management | Financial Control | Projects as aWhole | |||||||||||
| Baltimore | Eastern Kentucky | Houston | Middlesex County | Southern Maine | Modelas a Whole | Cleveland | Greater Lynn | Miami | Philadelphia | Rensselaer County | Modelas a Whole | ||
| Medicare | NA | NA | NA | NA | NA | NA | 60 | 60 | 59 | 60 | 61a | 60 | 57 |
| Medicaid | NA | NA | NA | NA | NA | NA | 30 | 30 | 34 | 37 | 37 | 33 | 31 |
| Channeling Contract | 100c | 50 | 100 | 16 | 100 | 78 | NA | NA | NA | NA | NA | NA | 4 |
| Other Government Source | 0 | 50d | 0 | 84d | 0 | 22 | 10 | 15 | 6 | 0 | 1 | 6 | 7 |
| Private Contribution | 0 | 0 | 0 | 0 | 0 | 0 | 0 | 0 | b | 3 | 0 | 1 | 1 |
| Client Payment | 0 | 0 | 0 | 0 | 0 | 0 | 0 | 0 | b | b | 1 | b | b |
| 100 | 100 | 100 | 100 | 100 | 100 | 100 | 100 | 100 | 100 | 100 | 100 | 100 | |
SOURCE: Cost reports to MPR (Schedules A and B) and cost reports to HHS. See Table A.3 for definition of buildup phase.NOTE: All funds for federal activities, the evaluation contractor, and the technical assistance contractor came from the federal government. This table only exhibits direct service funds spent by projects. Funds received by the projects but not spent are not included in this table.
|
|||||||||||||
| TABLE A.10. Summary of Host Agency Fringe Benefits and Overhead Rates for Randomization Period of Buildup Phase | ||||||||||
| Basic Case Management | Financial Control | |||||||||
| Baltimore | Eastern Kentucky | Houston | Middlesex County | Southern Maine | Cleveland | Greater Lynn | Miami | Philadelphia | Rensselaer County | |
| I. Total Fringe Benefit Ratea (percent) | 18.7 | 17.3 | 23.6 | 21.5 | 14.3 | 22.5 | 21.1 | 10.7 | 25.2 | 24.4 |
| II. Overhead Rate (percent) | None | 29.0b | 27.6c | None | 8.9 | In-kind | None | 18.2e | None | 8.8f |
| III. Items Included in Overhead (rate) | ||||||||||
| Administrative staff salaries | X | X | X | X | ||||||
| Financial staff salaries | X | X | X | X | ||||||
| Clerical staff salaries | X | X | ||||||||
| Fringe benefits for overhead staff | X | |||||||||
| Supplies | X | X | X | |||||||
| Telephone | X | X | ||||||||
| Postage | X | X | X | |||||||
| Building and equipment changes (occupancy) | X | X | X | |||||||
| Travel | X | X | ||||||||
| Other items | X | X | X | X | ||||||
NOTE: The host agency is the lead organization in a demonstration project. Fringe and overhead rates for states and subcontractors will differ. See Table A.3 for definition of buildup phase.
|
||||||||||
| TABLE A.11. Percentage of Core Channeling and Administration Costs by Accounting Category and by Project: Stead State Phase | |||||||||||||
| Line Itema | Basic Case Management | Financial Control | Projects as aWhole | ||||||||||
| Baltimore | Eastern Kentucky | Houston | Middlesex County | Southern Maine | Modelas a Whole | Cleveland | Greater Lynn | Miami | Philadelphia | Rensselaer County | Modelas a Whole | ||
| Salaries | 69.1 | 56.9 | 62.2 | 58.8 | 59.1 | 61.0 | 68.0 | 73.1 | 64.0 | 66.4 | 60.7 | 66.7 | 64.0 |
| Fringe Benefits | 14.0 | 10.4 | 14.9 | 13.8 | 9.7 | 12.9 | 16.9 | 14.0 | 7.1 | 19.2 | 14.7 | 14.4 | 13.7 |
| Travel | 1.9 | 4.4 | 3.2 | 3.2 | 5.4 | 3.5 | 2.7 | 1.1 | 2.2 | 1.8 | 2.3 | 2.0 | 2.7 |
| Rent | 4.8 | 1.5 | 4.0 | 5.8 | 5.3 | 4.3 | 2.7 | 3.1 | 4.2 | 4.3 | 5.8 | 3.9 | 4.1 |
| Consultant | 0.0 | 0.1 | 0.5 | 0.5 | 0.0 | 0.3 | 0.0 | 0.5 | 0.0 | 0.0 | 0.0 | 0.1 | 0.2 |
| Overhead | 0.0 | 19.5 | 11.2 | 14.6 | 9.6 | 11.6 | 0.0c | 0.0 | 17.3 | 0.0 | 8.1 | 5.1 | 8.1 |
| Equipment | 0.2 | 0.0 | 0.9 | 0.4 | 0.4 | 0.4 | 0.1 | 1.4 | 0.0 | 0.6 | 0.0 | 0.4 | 0.4 |
| Otherb | 10.0 | 7.2 | 3.1 | 2.9 | 10.5 | 6.0 | 9.6 | 6.8 | 5.2 | 7.7 | 8.4 | 7.4 | 6.8 |
| Total | 100.0 | 100.0 | 100.0 | 100.0 | 100.0 | 100.0 | 100.0 | 100.0 | 100.0 | 100.0 | 100.0 | 100.0 | 100.0 |
SOURCE: Project expenditure schedules.NOTE: Steady state phase was from October, 1983 through June, 1984.
|
|||||||||||||
| TABLE A.12. Total Project and State-Level Costs Through June 1984(dollars) | |||||||||||||
| Basic Case Management | Financial Control | Project Total | |||||||||||
| Baltimore | Eastern Kentucky | Houston | Middlesex County | Southern Maine | Total | Cleveland | Greater Lynn | Miami | Philadelphia | Rensselaer County | Total | ||
| Project | |||||||||||||
| Core Channelinga and Administration Functions | |||||||||||||
| Expenditures | 753,344 | 752,297 | 1,139,255 | 1,250,058 | 642,363 | 4,537,317 | 1,031,497 | 831,589 | 1,150,371 | 1,271,539 | 726,215 | 5,011,211 | 9,548,528 |
| In-kind Costs | 39,322 | 0 | 26,271 | 2,939 | 0 | 68,532 | 138,017 | 0 | 122 | 0 | 13,875 | 152,014 | 220,546 |
| Total | 792,666 | 752,297 | 1,165,526 | 1,252,997 | 642,363 | 4,605,849 | 1,169,514 | 831,589 | 1,150,493 | 1,271,539 | 740,090 | 5,163,225 | 9,769,074 |
| Direct Service Expenditures | 162,343 | 183,630 | 72,098 | 228,350 | 165,185 | 811,606 | 2,462,981 | 2,418,481 | 2,958,902 | 3,335,166 | 1,374,102 | 12,549,632 | 13,361,238 |
| Total | 955,009 | 935,927 | 1,237,624 | 1,481,347 | 807,548 | 5,417,455 | 3,632,495 | 3,250,070 | 4,109,395 | 4,606,705 | 2,114,192 | 17,712,857 | 23,130,312 |
| State Level | |||||||||||||
| Expenditures | 333,282 | 265,476 | 363,310 | 130,177 | 171,192 | 1,263,437 | 243,769 | 341,303 | 242,027 | 258,575 | 348,971 | 1,434,645 | 2,698,082 |
| In-kind Costs | 0 | 0 | 65,567 | 31,541 | 5,002 | 102,110 | 0 | 0 | 15,134 | 0 | 30,887 | 46,021 | 148,131 |
| Total | 333,282 | 265,476 | 428,877 | 161,718 | 176,194 | 1,365,547 | 243,769 | 341,303 | 257,161 | 258,575 | 379,858 | 1,480,666 | 2,846,213 |
| Total Project and State Costs | 1,288,291 | 1,201,403 | 1,666,501 | 1,643,065 | 983,742 | 6,783,002 | 3,876,264 | 3,591,373 | 4,366,556 | 4,865,280 | 2,494,050 | 19,193,523 | 25,976,525 |
SOURCE: Schedule B pp. 1 and 2 and DHHS expense invoices.
|
|||||||||||||
| TABLE A.13. Average Wages of Project Staff and Wage Indexes of Workers in Site Areas by Site | ||||||||||
| Basic Case Management | Financial Control | |||||||||
| Baltimoreb | Eastern Kentucky | Houston | Middlesex County | Southern Maine | Cleveland | Greater Lynn | Miami | Philadelphia | Rensselaer County | |
| Wage Indexes | ||||||||||
| Secretariesa | 0.97 | 0.98 | 1.13 | 1.01 | 0.85 | 1.02 | 1.02 | 0.97 | 0.98 | 1.05 |
| Health Servicesb | 1.03 | 0.92 | 0.98 | 1.06 | 0.80 | 1.04 | 0.95 | 1.11 | 1.01 | 1.10 |
| Average Long Term Care Project Wagesc Per Hour | 8.94 | 8.96 | 9.97 | 9.98 | 6.98 | 7.73 | 8.73 | 7.52 | 9.24 | 7.94 |
NOTE: The bases, 1.00, of the indexes are the mean wages reported for the ten sites in the Area Wage Surveys and the Employment and Wages, Annual Average, 1980.
|
||||||||||
| TABLE A.14. Caseload and Staffing for Steady State Phase | ||||||||||
| Basic Case Management | Financial Control | |||||||||
| Baltimore | Eastern Kentucky | Houston | Middlesex County | Southern Maine | Cleveland | Greater Lynn | Miami | Philadelphia | Rensselaer County | |
| Average Caseload Per Montha | 314 | 254 | 324 | 370 | 222 | 432 | 297 | 458 | 523 | 200 |
| Average Number of Case Managers per Montha | 5.7 | 6.0 | 6.0 | 7.6 | 5.2 | 9.0 | 6.0 | 8.0 | 10.0 | 4.1 |
| Average Number of Assessors Per Montha | 3.0 | NA | NA | NA | NA | NA | NA | 2.0 | NA | NA |
| Average Number of Cases Per Assessment and Case Management Staff | 36 | 42 | 54 | 49 | 43 | 48 | 50 | 46 | 52 | 49 |
SOURCE: Client Tracking System and timesheet data, submitted by projects and their subcontractors.NA: Not applicable.
|
||||||||||
| TABLE A.15. Estimated Screening Costs for Controls, by Project(dollars) | ||
| Percent Controls | Estimated Costs for Screening Controls | |
| Basic Case Management | ||
| Baltimore | 36.9 | $33,186 |
| Eastern Kentucky | 46.4 | 49,410 |
| Houston | 37.2 | 31,902 |
| Middlesex County | 36.8 | 39,520 |
| Southern Maine | 44.9 | 23,878 |
| Model as a Whole | 39.8 | 176,214 |
| Financial Control | ||
| Cleveland | 28.8 | 41,907 |
| Greater Lynn | 44.5 | 23,780 |
| Miami | 34.3 | 28,305 |
| Philadelphia | 27.55 | 22,650 |
| Rensselaer County | 46.5 | 23,803 |
| Model as a Whole | 34.6 | 143,495 |
| All Projects | 37.1 | 318,112 |
| SOURCE: Costs reported on Schedule B, page 1. Allocation of costs to screening based on distribution of salary expenditures to core functions and administration function.NOTE: Costs include expenditures plus reported in-kind costs for randomization period--first enrollment, June 1983. | ||
APPENDIX B. DATA HANDLING PROCEDURES
This appendix describes out procedures for processing the data (primarily the cost schedules), resolving problems, and adjusting for irregularities. The purpose of these procedures was to make the data as accurate as possible. Copies of data collection forms follow the description of procedures.
Cost information from Schedules B, pages 1 and 2 were entered into a computer data base. A computer program was then used to do a series of consistency checks. Specifically, it checked the column and row marginals to determine whether the number had been entered correctly and whether the schedules were arithmetically accurate. Monthly totals were checked to make sure they cumulated correctly from one month to the next. Data entry errors and obvious typographical errors were corrected on the data base.
Inconsistencies in the preparation of the schedules themselves were handled by contacting the projects fiscal officers and attempting to resolve differences. Corrections to these inconsistencies were documented, along with the reason for the correction, and were entered in a special adjustment column.
Special adjustments were also recorded in the data base to handle fiscal year-end closeout adjustments reported by the projects. Since these closeout adjustment reports rarely provided enough information to properly assign expenditures to the months in which they were incurred, the assumption was made that the majority of these adjustments belonged to the final quarter of the fiscal year. Thus, if other information was unavailable, fiscal year-end adjustments were made to the year-ending quarter.
A few schedules were not available for the first month or two of project operations. These were coded by hand from Schedule C pages 1 and 2 for the same project and month, and from other backup expenditure information.
Once core channeling and administration function costa data (Schedule B, page 1) were cleaned and adjusted, they were aggregated to major accounting categories for the analysis (salaries, fringe benefits, travel, rent, consultant, overhead, equipment, and other). For each of these eight major accounting categories, total expenditures were computed by taking the sums of the reported actual current month and reported actual adjustments for each project, plus any special adjustments.
Direct service expenditures for financial control projects were calculated from reported cumulative totals rather than monthly expenditures, because for projects which completed the direct services report (Schedule B, page 2) from Financial Control System (FCS) data, current month figures excluded adjustments from prior months. Basic case management service expansion expenditures were calculated by adding current month and adjustment figures, as described for core channeling and administration expenditures.
In-kind costs were based on reported monthly costs contained in Schedule B, page 1. We discussed in-kind costs with the project staff as part of the general process analysis data collection interview.
Timesheet data were also entered. Manual quality control checks were completed prior to key entry, and further cleaning checks were performed by computer. Unpaid time was subtracted from timesheets, since it did not represent a cost to the project (e.g., leave without pay). Paid compensatory time was treated on the same basis as regular paid time. Hours reported in each functional area were multiplied by the hourly rate of the employee to produce salary costs. The proportion of salary costs devoted to each functional area was then computed.
Copies of all the channeling project cost analysis data forms follow.
| EXHIBIT 1. Schedule A: Statement of Funds Applied for Quarter | ||||
| SCHEDULE ASTATEMENT OF FUNDS APPLIED FOR QUARTER ENDING _________________________ | ||||
| Check One | _____ State_____ Channeling Project | Project Name _________________________ State _________________________ | ||
| Specify Year Beginning For:Site Operations Funds /___/___/___/Direct Service Funds /___/___/___/ | ||||
| Fund Sources | Type of Use | |||
| Site of State Operations* | Direct Services* | |||
| Funds This Quarter | Year to Date | Funds This Quarter | Year to Date | |
| A. Medicare: ODR (Complex Sites Only) | / / / / / / / / / / / / / / / / / / / / / / / / / | / / / / / / / / / / / / / / / / / / / / / / / / / | ||
| B. Cash and Accruals (Non Federal) | ||||
| State and Local Government (specify) | ||||
| 1. | ||||
| 2. | ||||
| 3. | ||||
| Private Contributions (specify) | ||||
| 1. | ||||
| 2. | ||||
| Client Payments (Complex Sites Only) | --- | --- | ||
| Other (specify) | ||||
| 1. | ||||
| 2. | ||||
| C. Total Cash and Accruals and Medicare Funds | ||||
| D. In-Kind Contributions | / / / / / / / / / / / / / / / / / / / / / / / / / | / / / / / / / / / / / / / / / / / / / / / / / / / | ||
| State and Local Government (specify) | / / / / / / / / / / / / / / / / / / / / / / / / / | / / / / / / / / / / / / / / / / / / / / / / / / / | ||
| 1. | / / / / / / / / / / / / / / / / / / / / / / / / / | / / / / / / / / / / / / / / / / / / / / / / / / / | ||
| 2. | / / / / / / / / / / / / / / / / / / / / / / / / / | / / / / / / / / / / / / / / / / / / / / / / / / / | ||
| Private Contributions | / / / / / / / / / / / / / / / / / / / / / / / / / | / / / / / / / / / / / / / / / / / / / / / / / / / | ||
| Other | / / / / / / / / / / / / / / / / / / / / / / / / / | / / / / / / / / / / / / / / / / / / / / / / / / / | ||
| E. Total In-kind Contributions | / / / / / / / / / / / / / / / / / / / / / / / / / | / / / / / / / / / / / / / / / / / / / / / / / / / | ||
| * Specify limitations on an attachment. | ||||
| EXHIBIT 2. Schedule B: Statement of Project Expenses for Month | |||||||||||
| SCHEDULE BSTATEMENT OF PROJECT EXPENSESFOR MONTH ENDING _________________________ | |||||||||||
| CHECK ONE:_____ STATE OFFICE_____ CHANNELING PROJECT _____ SUBCONTRACT | NAME OF PROJECT: _________________________ SUBCONTRACTOR: _________________________ FUNCTION: _________________________ STATE: _________________________ | ||||||||||
| EXPENSE CATEGORY | FEDERALBUDGETAMOUNT(1) | ACTUAL EXPENDITURES | FEDERAL REIMBURSABLE EXPENDITURES | FEDERALBUDGETREMAINING(10) | NON-CASH COSTS(IN-KIND) | ||||||
| CURRENTMONTH(2) | ADJUSTMENT(3) | YEAR-TO-DATE(4) | AM.PREV.CLAIMED(5) | CURRENTMONTH(6) | ADJUSTMENT(7) | YEAR-TO-DATE(8) | CURRENTMONTH(10) | YEAR-TO-DATE(11) | |||
| 1. SALARIES & WAGES | |||||||||||
| 2. EMPLOYEE BENEFITS | |||||||||||
| 3. RENT | |||||||||||
| 4. PRINTING/ COPYING | |||||||||||
| 5. OFFICE SUPPLIES | |||||||||||
| 6. POSTAGE/ COURIER | |||||||||||
| 7. TELEPHONE | |||||||||||
| 8. TRAVEL | |||||||||||
| 9. EDUCATION/ TRAINING | |||||||||||
| 10. MEDICAL ASSESSMENT | |||||||||||
| 11. EQUIPMENT RENTAL | |||||||||||
| 12. EQUIPMENT ACQUISITION | |||||||||||
| 13. CONSULTANTS | |||||||||||
| 14. STATE ONLY SUBCONTRACTOR | |||||||||||
| 15. OVERHEAD | |||||||||||
| 16. OTHER DIRECT COSTS | |||||||||||
| 17. SUBTOTAL | |||||||||||
| 18. SUBCONTRACTS | |||||||||||
| 19. TOTAL | |||||||||||
| REMARKS: | |||||||||||
| TYPED NAME OF REPORT PREPARER: _________________________ DATE: _________________________ SIGNATURE: _________________________ TELEPHONE: _________________________ | |||||||||||
| Basic Site Schedule B: Statement of Project Expenses for Month | |||||||||
| BASIC SITESCHEDULE BSTATEMENT OF PROJECT EXPENSESFOR MONTH ENDING _________________________ | |||||||||
| NAME OF PROJECT: _________________________ STATE: _________________________ | |||||||||
| EXPENSE CATEGORY | FEDERALBUDGETAMOUNT(1) | ACTUAL EXPENDITURES | FEDERAL REIMBURSABLE EXPENDITURES | FEDERALBUDGETREMAINING(9) | |||||
| CURRENTMONTH(2) | ADJUSTMENT(3) | YEAR-TO-DATE(4) | AM.PREV.CLAIMED(5) | CURRENTMONTH(6) | ADJUSTMENT(7) | YEAR-TO-DATE(8) | |||
| 1. DAY HEALTH | --- | ||||||||
| 2. DAY MAINTENANCE | --- | ||||||||
| 3. HOME HEALTH AIDE | --- | ||||||||
| 4. HOMEMAKER/ PERS. CARE | --- | ||||||||
| 5. HOUSEKEEPING | --- | ||||||||
| 6. CHORE | --- | ||||||||
| 7. COMPANION | --- | ||||||||
| 8. HOME DEL. MEALS | --- | ||||||||
| 9. RESPITE CARE | --- | ||||||||
| 10. SKILLED NURSING | --- | ||||||||
| 11. THERAPIES | --- | ||||||||
| 12. MENTAL HEALTH | --- | ||||||||
| 13. TRANSPORTATION | --- | ||||||||
| 14. HOUSING ASSISTANCE | --- | ||||||||
| 15. ADULT FOSTER CARE | --- | ||||||||
| 16. NONROUTINE CONSUMABLE MEDICAL SUPPLIES | --- | ||||||||
| 17. ADAPTIVE AND ASSISTIVE EQUIPMENT | --- | ||||||||
| 18. EMERGENCY ASSISTANCE (NON-CORE) | --- | ||||||||
| 19. OTHER (NON-CORE) | --- | ||||||||
| 20. TOTAL | |||||||||
| Complex Site Schedule B: Statement of Project Expenses for Month | |||||
| COMPLEX SITESCHEDULE BSTATEMENT OF PROJECT EXPENSESFOR MONTH ENDING _________________________ | |||||
| NAME OF PROJECT: _________________________ STATE: _________________________ | |||||
| EXPENSE CATEGORY | "POOL"BUDGETAMOUNT(1) | ACTUAL EXPENDITURES | BUDGETREMAINING(5) | ||
| CURRENTMONTH(2) | ADJUSTMENT(3) | YEAR-TO-DATE(4) | |||
| 1. DAY HEALTH | |||||
| 2. DAY MAINTENANCE | |||||
| 3. HOME HEALTH AIDE | |||||
| 4. HOMEMAKER/ PERS. CARE | |||||
| 5. HOUSEKEEPING | |||||
| 6. CHORE | |||||
| 7. COMPANION | |||||
| 8. HOME DEL. MEALS | |||||
| 9. RESPITE CARE | |||||
| 10. SKILLED NURSING | |||||
| 11. THERAPIES | |||||
| 12. MENTAL HEALTH | |||||
| 13. TRANSPORTATION | |||||
| 14. HOUSING ASSISTANCE | |||||
| 15. ADULT FOSTER CARE | |||||
| 16. NONROUTINE CONSUMABLE MEDICAL SUPPLIES | |||||
| 17. ADAPTIVE AND ASSISTIVE EQUIPMENT | |||||
| 18. SUBTOTAL OF POOL AMOUNT | |||||
| 19. EMERGENCY ASSISTANCE (NON-CORE) | |||||
| 20. OTHER (NON-CORE) | |||||
| 21. TOTAL | |||||
| EXHIBIT 3. Schedule C: Public Voucher for Purchases and Services Other Than Personal | ||||||
| SCHEDULE C | ||||||
| Standard Form 1034 7 GAO 50001034-114 | PUBLIC VOUCHER FOR PURCHASES AND SERVICES OTHER THAN PERSONAL | VOUCHER NO. | ||||
| U.S. DEPARTMENT, BUREAU, OR ESTABLISHMENT AND LOCATION | DATE VOUCHER PREPARED | SCHEUDULE NO. | ||||
| CONTRACT NUMBER AND DATE | PAID BY | |||||
| REQUISITION NUMBER AND DATE | ||||||
| PAYEE'S NAME AND ADDRESS | ||||||
| DATE INVOICE RECEIVED | ||||||
| DISCOUNT TERMS | ||||||
| PAYEE'S ACCOUNT NUMBER | ||||||
| SHIPPED FROM | TO | WEIGHT | GOVERNMENT 8/L NUMBER | |||
| NUMBER AND DATE OR ORDER | DATE OFDELIVERY OR SERVICE | ARTICLES OR SERVICES(Enter description, item number of coutract or Federal supply schedule, and other information deemed necessary) | QUAN- TITY | UNIT PRICE | AMOUNT | |
| COST | PER | (1) | ||||
| (Use continuation sheet(s) if necessary) (Payee must NOT use the space below) TOTAL | ||||||
| PAYMENT:_____ COMPLETE _____ PARTIAL _____ FINAL _____ PROGRESS _____ ADVANCE | APPROVED FOR = $ | EXCHANGE RATE = $1.00 | DIFFERENCES | |||
| BY: | ||||||
| TITLE | Amount verified: correct for | |||||
| (Signature or initials) | ||||||
| Pursuant to authority vested in me, I certify that this voucher is correct and proper for payment. (Date) _________________________ (Authorized Certifying Officer)2 _________________________ (Title) _________________________ | ||||||
| ACCOUNTING CLASSIFICATION | ||||||
| PAID BY: | ||||||
| CHECK NUMBER | ON TREASURER OF THE UNITED STATES | CHECK NUMBER | ON (Name of bank) | |||
| CASH $ | DATE | PAYEE3 | ||||
| 1. When stated in foreign currency, insert name of currency.2. If the ability to certify and authority to approve are combined in one person, one signature only is necessary; otherwise the approving officer will sign in the space provided, over his official title.3. When a voucher is receipted in the name of a company or corporation, the name of person writing the company or corporate name, as well as the capacity in which he signs, must appear. For example, "John Doe Company, per John Smith, Secretary", or "Treasurer", as the case may be. | PER | |||||
| TITLE | ||||||
| Schedule C Continuation Sheet | ||||||
| Standard Form 1034 7 GAO 50001034-114 | PUBLIC VOUCHER FOR PURCHASES AND SERVICES OTHER THAN PERSONAL CONTINUATION SHEET | VOUCHER NO. | ||||
| SCHEUDULE NO. | ||||||
| SHEET NO. | ||||||
| U.S. DEPARTMENT, BUREAU, OR ESTABLISHMENT AND LOCATION | ||||||
| NUMBER AND DATE OR ORDER | DATE OFDELIVERY OR SERVICE | ARTICLES OR SERVICES(Enter description, item number of coutract or Federal supply schedule, and other information deemed necessary) | QUAN- TITY | UNIT PRICE | AMOUNT | |
| COST | PER | |||||
| EXHIBIT 4. Schedule D: Statement of Research Activity for Month | |||
| SCHEDULE DSTATEMENT OF RESEARCH ACTIVITY FOR MONTHENDING _________________________ NAME OF ORGANIZATION _________________________ STATE _________________________ | |||
| RESEARCH ACTIVITIES | ESTIMATED STAFF HOURS THIS MONTH | ||
| SITE DIRECTOR | PROFESSIONAL STAFF (CASEMGRS. etc.) | CLERICALPARA-PRO- FESSIONAL & OTHER | |
| 1. Advisory or resource group meeting with MPR | |||
| 2. Interview, discussions, or correspondence with MPR including QC and liaison contacts (phone or in-person) | |||
| 3. Contact with providers and community to explain research data needs (Does not include normal provider and community relations activity). | |||
| 4. Time spent reproducing, shipping and document control for forms sent to MPR (eg. screens, baseline assessments, and client tracking) | |||
| 5. Other | |||
| NOTE: Do not include estimates of (1) Time spent on outreach and screening for the control group (2) Time for research-only questions in assessment instrument (3) Time spent in randomization calls (4) Time spent on informed consent proceduresSeparate estimates of thse costs will be made by MPR using data from other sources such as time sheets. | |||
| EXHIBIT 5. Long-Term Care Channeling Demonstration Time Sheet | |||||||||||||||||||
| LONG TERM CARE CHANNELING DEMONSTRATIONTIME SHEET | |||||||||||||||||||
| EMPLOYEE ID# | [_____]_____] [_____]_____]_____]_____] | ||||||||||||||||||
| [_____] | FULL-TIME CHANNELING WORKER | ||||||||||||||||||
| [_____] | PART-TIME CHANNELING WORKER | ||||||||||||||||||
| [_____] | VOLUNTEER WORKER | ||||||||||||||||||
| [_____] | DONATED STAFF TIME FROM OUTSIDE CHANNELING PROJECT | ||||||||||||||||||
| NAME: | _________________________ | POSITION: | _________________________ | ||||||||||||||||
| PERIOD ENDED: | _________________________ | CHANNELING AGENCY: | _________________________ | ||||||||||||||||
| APPROVED FUNCTIONS: | TOTAL | HOURS | APPROVAL | ||||||||||||||||
| 1 16 | 2 17 | 3 18 | 4 19 | 5 20 | 6 21 | 7 22 | 8 23 | 9 24 | 10 25 | 11 26 | 12 27 | 13 28 | 14 29 | 15 30 | 31 | ||||
| 01 | Case Findings/ Outreach | ||||||||||||||||||
| 02 | Screening | ||||||||||||||||||
| 03 | Baseline Assessment | ||||||||||||||||||
| 04 | Initial Care Planning | ||||||||||||||||||
| 05 | Ongoing Case Management/ Reassessment | ||||||||||||||||||
| 06 | Provider Relations/ Administration/ Other | ||||||||||||||||||
| TOTAL CHANNELING HOURS | |||||||||||||||||||
| BENEFITS: | |||||||||||||||||||
| 95 | Paid Lunch | ||||||||||||||||||
| 96 | Sick | ||||||||||||||||||
| 97 | Vacation | ||||||||||||||||||
| 98 Holiday | |||||||||||||||||||
| 99 | Excused Leave (Explain): | ||||||||||||||||||
| TOTAL BENEFIT HOURS | |||||||||||||||||||
| TOTAL REGULAR HOURS | REGULAR RATE: | ||||||||||||||||||
| OVERTIME HOURS | OVERTIME RATE: | ||||||||||||||||||
| EXHIBIT 6. Site Monthly Caseload Report | |||||||||||
| SITE MONTHLY CASELOAD REPORT | |||||||||||
| MONTH | (1) | (2) | (3) | (4) | (5) | (6) | (7) | (8) | (9) | (10) | (11) |
| NUMBER OFAPPROPRIATES COMMUNICATED TO MPR | NUMBER OFINDVDULSREJECTEDBECAUSE PREVIOUSLY ASSIGNED | NUMBER RANDOMIZED THIS MONTH(1)-(2) | NUMBER ASSIGNED TO TREATMENT GROUPS | # ASSGND TO CNTRL GROUPS | |||||||
| TOTAL | RSRCH SAMPLE | NON FOLLOW-UP | TOTAL | RSRCH SAMPLE | H-HOLD ASSGNMNT | ||||||
| RANDOM ASSGNMNT | H-HOLD ASSGNMENT | PRE/POST RANDOMIZATION | |||||||||
| FEB82 | |||||||||||
| MAR82 | |||||||||||
| APR82 | |||||||||||
| MAY82 | |||||||||||
| JUN82 | |||||||||||
| JUL82 | |||||||||||
| AUG82 | |||||||||||
| SEP82 | |||||||||||
| OCT82 | |||||||||||
| NOV82 | |||||||||||
| DEC82 | |||||||||||
| JAN83 | |||||||||||
| FEB83 | |||||||||||
| MAR83 | |||||||||||
| APR83 | |||||||||||
| MAY83 | |||||||||||
| JUN83 | |||||||||||
| CUM. | |||||||||||
| Site Monthly Caseload Report | ||||||||||||
| SITE MONTHLY CASELOAD REPORT | ||||||||||||
| MONTH _________________________ SITE _________________________ | ||||||||||||
| MONTH | (1) | (2) | (3) | (4) | (5) | (6) | (7) | (8) | (9) | (10) | (11) | (12) |
| NUMBER INACTIVATEDTHIS MONTH | NUMBER REACTIVATEDTHIS MONTH | NUMBER TERMINATEDTHIS MONTH | ||||||||||
| ACTIVE ATEND OF LAST MONTH | SIGNEDCARE PLAN BEFORE END OF LASTMONTH | NEWLY ACTIVE THIS MONTH | SIGNED CAREPLANTHISMONTH | PRIOR TO CARE PLAN SIGN OFF | AFTER CARE PLAN SIGN OFF | PRIOR TO CARE PLAN SIGN OFF | AFTER CARE PLAN SIGN OFF | PRIOR TO CARE PLAN SIGN OFF | AFTER CARE PLAN SIGN OFF | CUMULATIVE NUMBERACTIVE ATEND OFMONTH | CUMULATIVE NUMBER ACTIVE AND SIGNEDCARE PLAN ATEND OF MONTH | |
| JUN82 | ||||||||||||
| JUL82 | ||||||||||||
| AUG82 | ||||||||||||
| SEP82 | ||||||||||||
| OCT82 | ||||||||||||
| NOV82 | ||||||||||||
| DEC82 | ||||||||||||
| JAN83 | ||||||||||||
| FEB83 | ||||||||||||
| MAR83 | ||||||||||||
| APR83 | ||||||||||||
| MAY83 | ||||||||||||
| JUN83 | ||||||||||||
| JUL83 | ||||||||||||
| AUG83 | ||||||||||||
| SEP83 | ||||||||||||
| OCT83 | ||||||||||||
| NOV83 | ||||||||||||
| DEC83 | ||||||||||||
| EXHIBIT 7. DHHS Monthly Statistical Monitoring Report | ||||
| REVISED--7/29/82 | ||||
| DHHS MONTHLY STATISTICAL MONITORING REPORT | ||||
| Site: _________________________ For Month Of: _________________________ Date Completed: _________________________ | ||||
| I. CLIENT DATA REPORT FROM COMPLETED SCREENS | ||||
| CURRENT MONTH | CUMULATIVE TOTAL | |||
| $ | % | $ | % | |
| 1. Number of Completed Screens | ||||
|
||||
|
||||
| TOTAL | ||||
| 2. Number of Inappropriates by Reason | ||||
|
||||
|
||||
|
||||
|
||||
|
||||
| (100%) | (100%) | |||
| 3. Number of Appropriates Randomized into Project: TOTAL | ||||
| BY: | ||||
| A. Age | ||||
|
||||
|
||||
|
||||
| (100%) | (100%) | |||
| B. Sex | ||||
|
||||
|
||||
| (100%) | (100%) | |||
| C. Referral Source | ||||
|
||||
|
||||
|
||||
|
||||
| (100%) | (100%) | |||
| D. Nursing Home Waiting List | ||||
|
||||
APPENDIX C. GLOSSARY
| Term | Definition | Data Source |
| Casemonths | Sum of ongoing case months and number of months spent for initial functions for clients | Client Tracking System |
| Completed Baseline Assessments | Number of clients who received a completed baseline needs assessment. | Client Tracking System |
| Completed initial care plans | Number of clients who received a completed initial care plan. | Client Tracking System |
| Completed screens | Number of applicants who completed the eligibility determination process. | DHHS monthly statistical report |
| Costs | The monetary value of resources used. Includes both expenditures and in-kind costs. | Monthly cost schedules submitted by state and project entities (including subcontractors) against demonstration contracts. |
| Costs of core channeling and administration functions | Project costs associated with the core functions (outreach, screening, baseline assessment, initial care planning, and ongoing case management/reassessment functions), plus the associated administration/provider relations/other costs. Excludes expenditures for direct services. | Monthly cost schedules submitted by the project entities against demonstration contracts. |
| Direct service expenditures | Project expenditures for purchasing services for demonstration clients. | Monthly cost schedules submitted by the project entities against demonstration contracts. |
| Eligibles | Number of persons who completed the screening process and were determined to be eligible for channeling. | Client Tracking System |
| Expenditures | Dollars spent. Includes both federally reimbursable expenditures and funds from other sources. Excludes resources provided to the demonstration without charge. | Monthly cost schedules submitted by state and project entities (including subcontractors) against demonstration contracts. |
| In-Kind Costs | The monetary value of resources provided to the demonstration without charge. Donated resources. | Monthly cost schedules submitted by state project entities (including subcontractors) against demonstration contracts. |
| Initial Costs | Those project costs of core channeling functions attributed to the one-time-only functions of outreach, screening, baseline assessment, and initial care planning. | Estimated using the percentage of project salary costs devoted to each functional area, as reported on bimonthly timesheets submitted by project staff. |
| New Clients | The number of eligibles except those assigned to the research control group. | Client Tracking System |
| Ongoing case management costs | Those project cost of core channeling and administration functions attributed to the ongoing case management/reassessment function. | Same as for initial expenditures. |
| Ongoing case months | Number of months of ongoing case management services delivered to all clients once they had signed their initial case plan. The measure excludes the time spent during the initial, one-time-only functions of screening, baseline assessment, and initial care plan planning. (For some individuals with immediate needs, some direct services began before their initial care plan was completed and formally signed. For these persons ongoing case months were calculated from the date of first service inititation | Client Tracking System |
| Special Demonstration Costs | Costs of complying with research requirements (which would not be requirements in a non-demonstration program) and other special costs related to the demonstration. | Costs of screening controls, estimated from expenditures and the number of controls screened. Other costs associated with the research, based on estimates of staff time spent on research requirements submitted monthly by projects. Other described but not estimated. |
NOTES
-
In developing the demonstration, seven core functions were identified. Here, as discussed further in Chapter II, we have aggregated these seven functions into five by combining the three core functions of service arranging, monitoring, and reassessment into ongoing case management.
-
There was also a demonstration closeout phase, but that period is excluded from the analysis presented here.
-
This schedule was designed to be completed on an accrual basis. In other words, expenditures were to be reported in the month in which they were incurred, rather than the month in which the bill was received or the payment made. Because of the burden this placed on some accounting systems, many of the reports were actually completed on a cash basis (i.e., as dollars were spent). This process has little effect on our cost estimates because they pertain to time periods that are sufficiently long to minimize the difference between cash and accrual accounting systems. (Appendix B discusses our cost data collection and cleaning procedures.)
-
An additional form, Schedule C, included invoices for payment from the demonstration contracts. These were completed monthly by all channeling entities, even by levels which did not receive reimbursement for expenditures directly from the federal demonstration contract. The invoices provide detailed backup material on all expenditures.
-
It should also be noted that demonstration clients were very old (averaging approximately 80 years) and had low incomes (over half having incomes below $500 a month).
-
Most basic case management projects required that cost-sharing clients pay service providers directly, rather than pay the project.
-
Detailed service definitions are provided in the Channeling Demonstration Project Instructions Manual For Reporting Final Status (1982) which is available from MPR (Data Collection Instrument #82-13).
-
In the steady state phase, conference calls were made monthly for the financial control projects and as needed for the basic case management projects.
-
In Kentucky, the state lead agency also functioned as the host agency at the local level.
-
This separation was required because the randomized treatment/control group design (see further below) required minimizing contact between channeling project staff and potential control group members. After research sample buildup was complete, the separation was relaxed in almost all sites.
-
The first four projects to begin operations accepted clients for one to two weeks before randomization began to ensure that operating procedures were sound.
-
Total costs are further understated because we have excluded costs incurred after June 1984. Demonstration operations were in the process of closing down between the end of June 1984 and March 1985, but data are unavailable for this demonstration closeout phase.
-
In some cases of high and immediate need clients, some direct services were delivered prior to the signing of the care plan.
-
Gap-filling dollars became available to the basic projects from 2 to 11 months after implementation began.
-
Because the projects started at different times the buildup phase was, in fact, even longer than sixteen months for some projects.
-
For those individuals whose direct services receipt began before their initial care plan was completed and formally signed, ongoing case months were calculated from the date of first service initiation.
-
It is difficult to estimate in-kind costs precisely because projects were not required to implement an accounting system for maintaining accurate records of in-kind resources. The in-kind costs in Table III.3 only represent the costs reported on Schedule B by projects and states. Projects may have received additional in-kind resources that were not recognized or were not reported. During field interviews, some project staff noted that donated central administration time was not reported because of the burden of recording hours spent for the tasks. Donated central administration appears to have occurred primarily in projects which were unable to charge central administrative costs to overhead because of governmental restrictions. Field interviews also suggested that donated photocopying costs may also have been frequently underrepresented.
-
Total ongoing case months for all 10 projects as shown on Table III.4 were 27,640 during the nine months of the steady state phase. Dividing by nine suggests that on average, 3,100 persons were provided ongoing case management each month.
-
In addition, Baltimore was allotted $100,000 from Marylands Gateway II program for the steady state phase; Eastern Kentucky was allotted $46,000 from Kentucky; and Middlesex County was allotted $50,000 from New Jersey, and was allowed to transfer $18,000 from its operations budget to its direct service budget for the demonstration.
-
Private contributions and client payments were also funds sources for direct service expenditures. In Houston, the two percent of direct services expenditures that was not from the channeling contract was provided by private contributions. In the basic case management projects, some clients paid part of the costs for direct services, although these payments were typically made directly to providers. Unfortunately, there was not a uniform reporting format for these payments, because the projects generally did not record the amounts that were collected.
-
Only 40 percent of client payment receipts are represented in Table III.5 since this was the fraction kept by the projects. The other 60 percent of the cost sharing receipts was given to the Office of Direct Reimbursement.
-
The financial control projects made direct service expenditures in categories according to the definitions in the Channeling Demonstration Project Instructions Manual For Reporting Financial Status (1982) which is from the evaluation contractor (Data Collection Instrument #82-13). The basic case management projects reported expenditures for these same categories but their definitions for the categories may have been slightly different than the ones in the manual.
-
See Appendix A for explanation of calculation of costs of screening controls.
-
This estimation procedure was based on timesheets submitted from October 1983 through March 1984, the first six months of the steady state phase.
-
As expected, this distribution of the percent of salary expenditures during the steady state phase was quite different from that of the buildup phase. For all projects the percent of salary expenditures devoted to the four initial care planning functions in the randomization period of the buildup phase was almost three times as great as that in the steady state phase. Table IV.1 suggests that, on average, projects devoted approximately 11 percent of total salary expenditures to the four initial core functions during the steady state phase. During the randomization period of the earlier buildup period projects devoted approximately 30 percent of total salary expenditures to the four initial functions (see Appendix A, Table A.4).
-
For example, senior managers who allocated their time to administration function were involved in overseeing the core functions. Screeners, assessors, and case managers often reported that they spent time performing administrative tasks; and clerical staff, who worked on all core functions, generally charged all their time to the administration function.
-
Table IV.1 indicates that at the Baltimore project 63.3 percent of total salary expenditure was devoted directly to the five core functions (i.e., 100 percent less 36.7 percent, the proportion spent on administration, provider relations, and clerical activities). Ongoing case management represented 47.7 percent of total salary expenditures or 75.4 percent (47.7 divided by 63.3) of total salary expenditures devoted directly to the five case management functions.
-
For example, for the Baltimore project during the steady state phase total core function costs (i.e., initial plus ongoing case management costs estimated based on the proportion of salary expenditures devoted to the core functions) prior t the allocation of associated administrative costs equaled $151,619 (see Table IV.2). Total direct service expenditures of this project during this phase were $110,544 (Table III.3). Therefore, total core function costs plus direct service expenditures equaled $262,163. The amount spent on the four initial core functions during the steady state phase was $37,666 (Table IV.2). This amount represents 14.4 percent of the total core function costs plus direct service expenditures. Therefore, 14.4 percent of total administrative/provider relations/clerical costs ($87,905) or $12,658 was allocated to the initial functions. The remainder of total administrative costs was allocated to the ongoing functions.
-
Table III.4 presents the measures of project scale used to estimate average costs in the steady state phase.
-
Carcagno et al. 1985 describes reasons for client termination.
-
In computing the incurred average outreach and screening costs, the numerators (i.e., total casefinding or total screening costs from Table IV.2) include costs incurred while casefinding or screening persons who were subsequently found to be ineligible for channeling.
-
Some projects indicated that when completing timesheets it was difficult to distinguish or separate time spent on baseline assessment from that of initial care planning.
-
As noted previously, average cost estimates were based on the number of new clients, i.e., persons found eligible to enter channeling during the steady state phase. The number of persons for whom a baseline assessment and initial care plan were actually completed (and, hence, for whom costs were actually incurred) were less. Consequently, these average cost estimates of the baseline assessment and initial care plan do not represent the average cost of these functions for every person who actually completed an assessment or care plan. Chapter VI presents estimates of the unit costs of these two functions, i.e., the average costs of a baseline assessment and of an initial care plan for every person who completed one.
-
Economies of scale should in particular affect allocated administrative costs.
-
Unlike most other projects, Southern Maine did not have a specific case manager supervisor. Instead, the team of case managers shared these responsibilities by rotating through a case manager team leader position.
-
The New York City Home Care Project was operated through four sites. The time periods selected for analysis by BPA varied for each site. The earliest time period selected was August 1981 through July 1982; for a second site the time period selected was May 1982 through December 1982; and for the remaining two sites the time period selected was January 1982 through December 1982.
-
BPA cost estimates for the South Carolina Community Long Term Care project and the On Lok project ($47 and $81, respectively) were increased by 4.9 percent, the percent change in the GNP implicit price deflator between the fourth quarter of 1982 and the first quarter of 1984. PA estimates for the New York City Home Care Project and the San Diego Long Term Care Project ($96 and $134, respectively) were inflated by 8.1 percent, the percent change in the GNP implicit price deflator between the first quarter of 1982 and the first quarter of 1984. And, finally, the BPA estimate of $117 for the Project OPEN demonstration was increased by 9.4 percent, the percent change in the GNP implicit price deflator observed between the fourth quarter of 1981 and the first quarter of 1984. Data on the GNP implicit price deflator was obtained from the Survey of Current Business (July 1984).
-
In-kind costs reported by channeling projects equaled, on average, 2.5 percent of the total case management and related administrative costs reported by projects.
-
As explained in Chapter III, we estimated that during the steady state phase projects incurred, on average, research-related costs equal to one percent of total case management costs reported. We did not estimate the value of other special demonstration costs.
-
In addition to the intervention approach, BPA suggested that the differences in the average cost estimates of the five demonstration projects were largely due to differences in the level of professionalization (i.e., the level of education and training of staff), the degree of specialization of functions (i.e., more specialized projects used different persons or teams to perform different functions; less specialized projects used one staff member to provide all or a number of case management services per client), and differences in the local environment (including access to service providers, the number and type of direct services available and to be monitored by case managers, the size of the catchment area, and regional price differences).
-
The average case management cost of $47 for the South Carolina demonstration project was estimated based on the number of noninstitutionalized cases. Clients institutionalized subsequent to the screen received substantially reduced ongoing case management services than those remaining in the community.
-
Reported in-kind costs, representing approximately 2.5 percent of total reported case management costs, are included in the cost estimates used below. However, there is evidence that actual in-kind donations exceeded this estimated level.
-
In this chapter, all function costs include the associated costs of administration, provider relations, and clerical support.
-
During the steady state phase, the period for which channeling costs were estimated, two persons determined eligible were assigned to the control group (since they lived in households with control group members) and thus they did not enter channeling.
-
There is no unit cost of outreach since it is not possible to define outreach in terms of specific units.
-
Due to rounding the estimates of the average cost per function may not exactly equal those presented on Table IV.3 after one allocates administration.
-
See Carcagno et al. (1985).
-
See Chapter II in this report and the process analysis, Carcagno et al. 1985 for a description of how state and federal administrative responsibilities were allocated.
-
For example, since the estimated cost of the screening function and its related administration for Baltimore was $89,935 and 36.9 percent of the applicants screened were controls, 36.9 percent of the cost of screening and its administration ($33,186) is estimated as the cost for screening controls.
NATIONAL LONG-TERM CARE CHANNELING DEMONSTRATION REPORTS AVAILABLE
- A Guide to Memorandum of Understanding Negotiation and Development
- HTML http://aspe.hhs.gov/daltcp/reports/mouguide.htm
- PDF http://aspe.hhs.gov/daltcp/reports/mouguide.pdf
- An Analysis of Site-Specific Results
- Executive Summary http://aspe.hhs.gov/daltcp/reports/sitees.htm
- HTML http://aspe.hhs.gov/daltcp/reports/1986/sitees.htm
- PDF http://aspe.hhs.gov/daltcp/reports/1986/sitees.pdf
- Analysis of Channeling Project Costs
- Executive Summary http://aspe.hhs.gov/daltcp/reports/1986/projcost.htm
- HTML http://aspe.hhs.gov/daltcp/reports/1986/projcost.htm
- PDF http://aspe.hhs.gov/daltcp/reports/1986/projcost.pdf
- Analysis of the Benefits and Costs of Channeling
- Executive Summary http://aspe.hhs.gov/daltcp/reports/1986/costes.htm
- HTML http://aspe.hhs.gov/daltcp/reports/1986/cost.htm
- PDF http://aspe.hhs.gov/daltcp/reports/1986/cost.pdf
- Applicant Screen Set
- HTML http://aspe.hhs.gov/daltcp/reports/1982/appscset.htm
- PDF http://aspe.hhs.gov/daltcp/reports/1982/appscset.pdf
- Assessment and Care Planning for the Frail Elderly: A Problem Specific Approach
- HTML http://aspe.hhs.gov/daltcp/reports/1986/asmtcare.htm
- PDF http://aspe.hhs.gov/daltcp/reports/1986/asmtcare.pdf
- Assessment Training for Case Managers: A Trainer's Guide
- HTML http://aspe.hhs.gov/daltcp/reports/1985/asmttran.htm
- PDF http://aspe.hhs.gov/daltcp/reports/1985/asmttran.pdf
- Case Management Forms Set
- HTML http://aspe.hhs.gov/daltcp/reports/1985/cmforms.htm
- PDF http://aspe.hhs.gov/daltcp/reports/1985/cmforms.pdf
- Case Management Training for Case Managers: A Trainer's Guide
- HTML http://aspe.hhs.gov/daltcp/reports/1985/cmtrain.htm
- PDF http://aspe.hhs.gov/daltcp/reports/1985/cmtrain.pdf
- Channeling Effects for an Early Sample at 6-Month Follow-up
- Executive Summary http://aspe.hhs.gov/daltcp/reports/6monthes.htm
- HTML http://aspe.hhs.gov/daltcp/reports/1985/6monthes.htm
- PDF http://aspe.hhs.gov/daltcp/reports/1985/6monthes.pdf
- Channeling Effects on Formal Community-Based Services and Housing
- Executive Summary http://aspe.hhs.gov/daltcp/reports/commtyes.htm
- HTML http://aspe.hhs.gov/daltcp/reports/1986/commty.htm
- PDF http://aspe.hhs.gov/daltcp/reports/1986/commty.pdf
- Channeling Effects on Hospital, Nursing Home and Other Medical Services
- Executive Summary http://aspe.hhs.gov/daltcp/reports/hospites.htm
- HTML http://aspe.hhs.gov/daltcp/reports/1986/hospites.htm
- PDF http://aspe.hhs.gov/daltcp/reports/1986/hospites.pdf
- Channeling Effects on Informal Care
- Executive Summary http://aspe.hhs.gov/daltcp/reports/informes.htm
- HTML http://aspe.hhs.gov/daltcp/reports/1986/informes.htm
- PDF http://aspe.hhs.gov/daltcp/reports/1986/informes.pdf
- Channeling Effects on the Quality of Clients' Lives
- Executive Summary http://aspe.hhs.gov/daltcp/reports/qualtyes.htm
- HTML http://aspe.hhs.gov/daltcp/reports/1986/qualtyes.htm
- PDF http://aspe.hhs.gov/daltcp/reports/1986/qualtyes.pdf
- Clinical Baseline Assessment Instrument Set
- HTML http://aspe.hhs.gov/daltcp/reports/cbainstr.htm
- PDF http://aspe.hhs.gov/daltcp/reports/cbainstr.pdf
- Community Services and Long-Term Care: Issues of Negligence and Liability
- HTML http://aspe.hhs.gov/daltcp/reports/negliab.htm
- PDF http://aspe.hhs.gov/daltcp/reports/negliab.pdf
- Differential Impacts Among Subgroups of Channeling Enrollees
- Executive Summary http://aspe.hhs.gov/daltcp/reports/enrolles.htm
- HTML http://aspe.hhs.gov/daltcp/reports/1986/enrolles.htm
- PDF http://aspe.hhs.gov/daltcp/reports/1986/enrolles.pdf
- Differential Impacts Among Subgroups of Channeling Enrollees Six Months After Randomization
- Executive Summary http://aspe.hhs.gov/daltcp/reports/difimpes.htm
- HTML http://aspe.hhs.gov/daltcp/reports/1984/difimpes.htm
- PDF http://aspe.hhs.gov/daltcp/reports/1984/difimpes.pdf
- Examination of the Equivalence of Treatment and Control Groups and the Comparability of Baseline Data
- Executive Summary http://aspe.hhs.gov/daltcp/reports/baslines.htm
- HTML http://aspe.hhs.gov/daltcp/reports/1984/baslines.htm
- PDF http://aspe.hhs.gov/daltcp/reports/1984/baslines.pdf
- Final Report on the Effects of Sample Attrition on Estimates of Channeling's Impacts
- Executive Summary http://aspe.hhs.gov/daltcp/reports/1986/atritnes.htm
- HTML http://aspe.hhs.gov/daltcp/reports/1986/atritn.htm
- PDF http://aspe.hhs.gov/daltcp/reports/1986/atritn.pdf
- Informal Care to the Impaired Elderly: Report of the National Long-Term Care Demonstration Survey of Informal Caregivers
- Executive Summary http://aspe.hhs.gov/daltcp/reports/impaires.htm
- HTML http://aspe.hhs.gov/daltcp/reports/1984/impaires.htm
- PDF http://aspe.hhs.gov/daltcp/reports/1984/impaires.pdf
- Informal Services and Supports
- HTML http://aspe.hhs.gov/daltcp/reports/1985/infserv.htm
- PDF http://aspe.hhs.gov/daltcp/reports/1985/infserv.pdf
- Initial Research Design of the National Long-Term Care Demonstration
- HTML http://aspe.hhs.gov/daltcp/reports/designes.htm
- PDF http://aspe.hhs.gov/daltcp/reports/designes.pdf
- Issues in Developing the Client Assessment Instrument for the National Long-Term Care Channeling Demonstration
- HTML http://aspe.hhs.gov/daltcp/reports/1981/instrues.htm
- PDF http://aspe.hhs.gov/daltcp/reports/1981/instrues.pdf
- Methodological Issues in the Evaluation of the National Long-Term Care Demonstration
- HTML http://aspe.hhs.gov/daltcp/reports/1986/methodes.htm
- PDF http://aspe.hhs.gov/daltcp/reports/1986/methodes.pdf
- National Long-Term Care Channeling Demonstration: Summary of Demonstration and Reports
- HTML http://aspe.hhs.gov/daltcp/reports/1991/chansum.htm
- PDF http://aspe.hhs.gov/daltcp/reports/1991/chansum.pdf
- Screening Training for Screeners: A Trainer's Guide
- HTML http://aspe.hhs.gov/daltcp/reports/1985/scretrai.htm
- PDF http://aspe.hhs.gov/daltcp/reports/1985/scretrai.pdf
- Survey Data Collection Design and Procedures
- Executive Summary http://aspe.hhs.gov/daltcp/reports/sydataes.htm
- HTML http://aspe.hhs.gov/daltcp/reports/1986/sydataes.htm
- PDF http://aspe.hhs.gov/daltcp/reports/1986/sydataes.pdf
- Tables Comparing Channeling to Other Community Care Demonstrations
- HTML http://aspe.hhs.gov/daltcp/reports/1986/tablees.htm
- PDF http://aspe.hhs.gov/daltcp/reports/1986/tablees.pdf
- The Channeling Case Management Manual
- HTML http://aspe.hhs.gov/daltcp/reports/1986/cmmanual.htm
- PDF http://aspe.hhs.gov/daltcp/reports/1986/cmmanual.pdf
- The Channeling Financial Control System
- HTML http://aspe.hhs.gov/daltcp/reports/1985/chanfcs.htm
- PDF http://aspe.hhs.gov/daltcp/reports/1985/chanfcs.pdf
- The Comparability of Treatment and Control Groups at Randomization
- HTML http://aspe.hhs.gov/daltcp/reports/compares.htm
- PDF http://aspe.hhs.gov/daltcp/reports/compares.pdf
- The Effects of Case Management and Community Services on the Impaired Elderly
- Executive Summary http://aspe.hhs.gov/daltcp/reports/casmanes.htm
- HTML http://aspe.hhs.gov/daltcp/reports/1986/casmanes.htm
- PDF http://aspe.hhs.gov/daltcp/reports/1986/casmanes.pdf
- The Effects of Sample Attrition on Estimates of Channeling's Impacts for an Early Sample
- HTML http://aspe.hhs.gov/daltcp/reports/1984/earlyes.htm
- PDF http://aspe.hhs.gov/daltcp/reports/1984/earlyes.pdf
- The Evaluation of the National Long-Term Care Demonstration: Final Report
- Executive Summary http://aspe.hhs.gov/daltcp/reports/chanes.htm
- HTML http://aspe.hhs.gov/daltcp/reports/1986/chanfr.htm
- PDF http://aspe.hhs.gov/daltcp/reports/1986/chanfr.pdf
- The Evaluation of the National Long-Term Care Demonstration
- Executive Summary http://aspe.hhs.gov/daltcp/reports/hsres.htm
- HTML http://aspe.hhs.gov/daltcp/reports/1988/hsre.htm
- PDF http://aspe.hhs.gov/daltcp/reports/1988/hsre.pdf
- The Planning and Implementation of Channeling: Early Experiences of the National Long-Term Care Demonstration
- Executive Summary http://aspe.hhs.gov/daltcp/reports/implees.htm
- HTML http://aspe.hhs.gov/daltcp/reports/1983/imple.htm
- PDF http://aspe.hhs.gov/daltcp/reports/1983/imple.pdf
- The Planning and Operational Experience of the Channeling Projects
- Executive Summary http://aspe.hhs.gov/daltcp/reports/proceses.htm
- HTML http://aspe.hhs.gov/daltcp/reports/1986/proceses.htm
- PDF http://aspe.hhs.gov/daltcp/reports/1986/proceses.pdf
INSTRUMENTS AVAILABLE
- Applicant Screen
- HTML http://aspe.hhs.gov/daltcp/instruments/1981/AppSc.htm
- PDF http://aspe.hhs.gov/daltcp/instruments/1981/AppSc.pdf
- Client Contact Log
- HTML http://aspe.hhs.gov/daltcp/instruments/ClConLog.htm
- PDF http://aspe.hhs.gov/daltcp/instruments/ClConLog.pdf
- Client Tracking/Status Change Form
- HTML http://aspe.hhs.gov/daltcp/instruments/1982/ClTracFm.htm
- PDF http://aspe.hhs.gov/daltcp/instruments/1982/ClTracFm.pdf
- Clinical Assessment and Research Baseline Instrument: Community Version
- HTML http://aspe.hhs.gov/daltcp/instruments/1982/carbicv.htm
- PDF http://aspe.hhs.gov/daltcp/instruments/1982/carbicv.pdf
- Clinical Baseline Assessment Instrument: Community Version
- HTML http://aspe.hhs.gov/daltcp/instruments/1983/cbaicv.htm
- PDF http://aspe.hhs.gov/daltcp/instruments/1983/cbaicv.pdf
- Clinical Baseline Assessment Instrument: Institutional Version
- HTML http://aspe.hhs.gov/daltcp/instruments/1983/cbaiiv.htm
- PDF http://aspe.hhs.gov/daltcp/instruments/1983/cbaiiv.pdf
- Eighteen Month Followup Instrument
- HTML http://aspe.hhs.gov/daltcp/instruments/18mfi.htm
- PDF http://aspe.hhs.gov/daltcp/instruments/18mfi.pdf
- Followup Instrument
- HTML http://aspe.hhs.gov/daltcp/instruments/FolInst.htm
- PDF http://aspe.hhs.gov/daltcp/instruments/FolInst.pdf
- Informal Caregiver Followup Instrument
- HTML http://aspe.hhs.gov/daltcp/instruments/ICFolIns.htm
- PDF http://aspe.hhs.gov/daltcp/instruments/ICFolIns.pdf
- Informal Caregiver Survey Baseline
- HTML http://aspe.hhs.gov/daltcp/instruments/ICSurvey.htm
- PDF http://aspe.hhs.gov/daltcp/instruments/ICSurvey.pdf
- Screening Identification Sheet
- HTML http://aspe.hhs.gov/daltcp/instruments/1982/ScrIDSh.htm
- PDF http://aspe.hhs.gov/daltcp/instruments/1982/ScrIDSh.pdf
- Time Sheet
- HTML http://aspe.hhs.gov/daltcp/instruments/TimeSh.htm
- PDF http://aspe.hhs.gov/daltcp/instruments/TimeSh.pdf
- Twelve Month Followup Instrument
- HTML http://aspe.hhs.gov/daltcp/instruments/12mfi.htm
- PDF http://aspe.hhs.gov/daltcp/instruments/12mfi.pdf
To obtain a printed copy of this report, send the full report title and your mailing information to:
U.S. Department of Health and Human ServicesOffice of Disability, Aging and Long-Term Care PolicyRoom 424E, H.H. Humphrey Building200 Independence Avenue, S.W.Washington, D.C. 20201FAX: 202-401-7733Email: webmaster.DALTCP@hhs.gov
RETURN TO:
Office of Disability, Aging and Long-Term Care Policy (DALTCP) Home [http://aspe.hhs.gov/_/office_specific/daltcp.cfm]Assistant Secretary for Planning and Evaluation (ASPE) Home [http://aspe.hhs.gov]U.S. Department of Health and Human Services (HHS) Home [http://www.hhs.gov]
Last Updated: 06/13/2012