
| FDA Report: "A Review of FDA's Approach to Medical Product Shortages"
|
|---|
| Drug shortages have been having significant impacts on patients and healthcare providers. In order to understand what is causing drug shortages and to enable evaluation of potential solutions, ASPE conducted an analysis of the underlying factors that lead to periods of shortage in the prescription drug market. This report complements the FDA’s report on the current drug shortage problem, which focuses on the FDA’s role in monitoring and responding to shortages. The Issue Brief was written by Kevin Haninger, Amber Jessup, and Kathleen Koehler of ASPE’s Office of Science and Data Policy. Sherry Glied, PhD Laina Bush |
Summary
The prescription drug and vaccine markets are characterized by sporadic shortages of individual drugs and occasional periods during which several in a class are in shortage. Currently, class-wide shortages are affecting the sterile injectables segment of the industry, particularly sterile injectable oncology products. While the existence of shortages is an unusual feature of this market, it is important to note that most drugs do not experience shortages. Even within the sterile injectable oncology segment of the market, where shortages today are most severe, only about 10% of the Medicare Part B volume of injectable oncology services in 2008 consisted of drugs that experienced any shortage at some point over the subsequent 4 years.
Sporadic and class-wide shortages of sterile injectable drugs occur because neither the quantity of these products needed by consumers nor the quantity of these products produced by manufacturers is very responsive to short term changes in price. This means that product disruptions, however caused, translate into shortages rather than simply higher prices.
The current class-wide shortages in the industry appears to be a consequence of a substantial expansion in the scope and volume of products produced by the industry that has occurred over a short period of time, without a corresponding expansion in manufacturing capacity. While several manufacturers are currently expanding capacity, most of this capacity will not become available for several years. The expansion in product scope and quantity, in turn, stems from both an increase in the overall volume of chemotherapy drugs used and an unusually high rate of patent expirations in this sector that began in 2008 and has continued through 2010. While the generic industry is highly competitive in the long run, the supply of products is constrained in the short-run, because it takes several years for new firms to enter or for existing firms to add capacity. In the short run, existing firms make strategic decisions about how to deploy production capacity among products, based on their conjectures about what choices their competitors will make.
The rapid increase in volume and scope has led to a high rate of capacity utilization in the industry. At these high levels of utilization, it may be difficult to maintain manufacturing quality levels and any disruptions to supply — through, for example, quality problems or delays in receiving an active pharmaceutical ingredient (API) — can lead to cascading and persistent shortages.
The current shortages will likely be resolved when new supply sources come on line as the manufacturing industry increases its capacity. In addition to addressing the current situation, responses to the problem of shortages should focus on increasing the extent of supply responsiveness in the market.
Background
The prescription drug and vaccine market is characterized by sporadic shortages of individual drugs and occasional periods during which many drugs in a class are in shortage. In the early 2000s, for example, influenza vaccine was in short supply for an extended period. In recent months, the issue of drug shortages in the U.S. has once again received increasing prominence. The Food and Drug Administration (FDA) reports that, in 2010, there were 178 drug shortages recorded at the Agency. Currently, shortages are concentrated in the area of sterile injectable drugs, 132 of which are now in shortage[1]. In 2011, FDA has continued to see an increasing number of shortages, especially those involving older sterile injectable drugs, including cancer drugs, anesthetics for surgery, drugs for emergency medicine, and electrolytes for intravenous feeding.
Drug shortages have been having significant impacts on healthcare providers and patients. In June, 2011, drug shortage surveys were released by American Society of Health-System Pharmacists (ASHP) and the American Hospital Association (AHA). ASHP surveyed 353 directors of pharmacy in U.S. hospitals and estimated that annual labor costs to manage shortages are approximately $216 million nationwide. AHA found that almost 100 percent of 820 hospitals surveyed had experienced at least one drug shortage in the past six months and nearly half experienced 21 or more shortages in this period[2]. In November, 2010, the Institute for Safe Medication Practices (ISMP) presented results of a July-September 2010 survey of 1,800 healthcare practitioners (68 percent pharmacists). A majority reported problems with drug shortages, including the use of less desirable, often more expensive alternatives and the potential for medication errors and poor patient outcomes[3]. FDA works closely with industry, health care providers, and patients to prevent and mitigate shortages of “medically necessary” medicines — the Drug Shortage Program (DSP) at FDA considers to be used to treat or prevent a serious disease or medical condition for which there is no alternative medicine available in adequate supply.
This report examines the underlying factors that lead to periods of shortage in the prescription drug market, and particularly the underlying market factors that have contributed to the current shortages in the area of sterile injectable oncology drugs. It complements the accompanying FDA report, “A Review of FDA’s Approach to Medical Product Shortages”, which focuses on the FDA’s role in monitoring and responding to shortages. [http://www.fda.gov/AboutFDA/ReportsManualsForms/Reports/ucm275051.htm]
Magnitude and Timing of the Problem
A very small minority of all drugs used in the United States (typically about 1/2 of 1%) experience a shortage in any given year. However, the number of drug shortages recognized by the FDA has been increasing each year since 2006. Figure 1 shows trends in the total number of drug shortages and the number of shortages of sterile injectable drugs. Appendix A provides comparable information using data from the University of Utah’s drug shortage program.
Figure 1:
Drug shortages followed by FDA, by year[4]
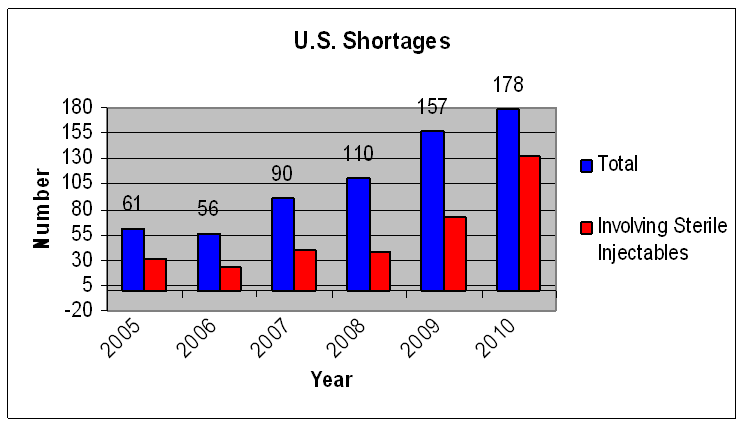
Although sterile injectable drugs are a small percentage of the overall prescription drug market, they make up a disproportionate share of drugs in shortage and include critical drugs, such as oncology drugs, succinylcholine, naloxone, furosemide, and emergency syringes. In 2010, 74% of shortages involved sterile injectable drugs. In 2011, FDA is continuing to see new sterile injectable drug shortages. While sporadic shortages occur at roughly equal rates in both the branded and generic markets, the current shortage of sterile injectable drugs is concentrated in the generics industry.
While shortages of sterile injectable drugs have captured attention recently, problems in this area have been increasing since 2007. Many of the sterile injectable oncology drugs that have experienced shortages in 2010 and 2011 had also experienced shortages in 2008 or 2009.
Why are Shortages a Feature of the Prescription Drug Market?
In most markets, shortages (and surpluses) are rare. Instead, prices change to keep the quantity of products supplied and the quantity demanded balanced. For example, when, because of a supply disruption, the market supply of a product declines, prices rise and consumer demand adjusts. In general, the number and severity of shortages in any sector depend on the extent to which the demand for a product and the supply of a product respond to price (the price elasticities of demand and supply). Very low price responsiveness on both the demand and supply sides for many medically necessary prescription drugs means that shortages of prescription drugs (or of upstream Active Pharmaceutical Ingredients — API) are not an unexpected phenomenon in this sector in the presence of supply or demand changes that are not fully anticipated by manufacturers.
The degree of price responsiveness for medically necessary prescription drugs is low, both in the short run and in the long run, for two reasons. First, these drugs are, by definition, medically necessary, implying that they have few substitutes and consumption cannot generally be shifted over time (for this reason, shortages of drugs for the treatment of chronic conditions are much less likely to occur). Second, consumers in the prescription drug market generally purchase services through health insurance contracts that pay providers using pre-established payment rates and guarantee to provide consumers necessary services. Final consumers’ demand for services is largely unaffected by changes in price. Although hospitals and physician offices may face increases in price, their demand for the prescription medications used to treat their patients is also not very responsive to the price paid to manufacturers for the drug[5].
This lack of price elasticity on the demand side is mirrored on the supply side, particularly in the short run. Costly, specialized equipment is required to produce prescription medications, production processes are complex, especially for sterile injectable products, and firms are required to adhere to Current Good Manufacturing Processes (CGMPs). Substitutions of products within a class can often be (and usually are) achieved on the same supply line, but a specific class of drugs usually requires equipment and regulatory approvals that are limited to that class. Drugs have a limited shelf life and holding excess inventory is costly meaning that drug manufacturers try to keep inventories as low as possible. Raw materials for production are frequently difficult to source, must be validated by manufacturers, and require regulatory approvals. It will generally take a long time — years — for the industry to increase capacity in response to an increase in prices. If the increase in prices is expected to be temporary (as would be expected in the case of a shortage due to a production line disruption), investments in increased capacity are unlikely to occur. In the longer run — over a period of 2-3 years, for example — supply will be much more price responsive.
This framework suggests that the development of shortages will be a function of the short run elasticity of demand and supply for a particular drug, and of unanticipated demand and supply changes that occur in that market.
It is expensive to hold capacity ready to make a drug and yet earn no sales from that capacity the vast majority of the time. In our current system this cost would fall on the generic drug firm that chose to build excess capacity or dual source; it would have high costs relative to its competitors. Clearly, in a competitive market, which the generic drug industry is, no firm will choose this route unless it receives a higher price in the market or other compensation.
Sterile Injectable Oncology Drugs Market - Demand and Supply
Demand
The potential for sterile injectable oncology drugs to treat cancer was first discovered in the 1940s when scientists discovered that some drugs when injected would shrink tumors. Today, sterile injectable oncology drugs are typically administered intravenously and act by killing cells that multiply rapidly, which is characteristic of most cancer cells. These drugs are highly effective against some cancers, like testicular, lymphoma, and cervical cancers and less effective against others, like prostate and pancreatic cancers.
In most cases, sterile injectable oncology drugs are not purchased directly by consumers or reimbursed directly by insurance. Rather, these drugs are purchased by health care providers (generally hospitals and, in some cases, physicians). Providers are paid for the delivery of the service that includes the drug; they are also directly paid by public and private insurers for the cost of the drugs. Under the Medicare program, reimbursement for these drugs is under Medicare Part B.
Most hospitals do not purchase sterile injectable oncology drugs directly. Rather, these drugs are purchased through group purchasing organizations (GPOs), which negotiate prices with generic manufacturers on behalf of their clients. GPOs typically do not take physical possession of the drugs. Instead, a wholesaler takes possession of the drug at the wholesale acquisition price and then sells the drugs to the GPO clients at the GPO negotiated price. Once the transaction has taken place, the manufacturer will issue the wholesaler a “chargeback” if the wholesale acquisition price is higher than the GPO negotiated price.
The GPO market is relatively concentrated with five GPOs commanding 85-90 percent of the market[6]. This concentration figure may be misleading, however. While GPOs negotiate the lowest prices they can with manufacturers, based on anticipated volume of sales, their members are not compelled to purchase drugs from a contracted manufacturer, so the GPO contracts do not necessarily contain minimum quantity guarantees. Some respondents reported that hospitals not infrequently source their drugs outside the GPO structure.
GPO contracts are generally in place for years and typically include price adjustment clauses. If a GPO is offered a lower price by a competing manufacturer, the original contracted manufacturer has a right of first refusal to match the new price. GPO contracts also typically include “failure to supply” clauses. These clauses generally require the manufacturer to reimburse the GPO for the price difference between the negotiated price and purchased price. These failure to supply clauses, however, provide no reimbursement if there are no alternative sources for the drug, do not reimburse for resources expended looking for other sources, and are of limited duration[7]. Respondents reported that the duration of compensation required under these clauses has diminished over time. Failure to supply clauses are generally limited to 60 days and are becoming narrower over time — on average, GPOs recover just 10% of losses due to failure to supply[8]. Section 615 of the Uniform Commercial Code suggests that failure to provide contracted products is not a breach of contract if the product is not available in the market. The erosion of failure to supply clauses in GPO contracts is consistent with the evidence from the FDA and University of Utah data that, until the recent crisis in injectable products, the level of drug shortages was relatively stable and low.
Most sterile injectable drugs are purchased through GPOs and obtained through authorized wholesalers. There is, however, a secondary or “gray” market, that purchases drugs from end users (infusion companies, home care companies, hospitals) and sells them to other end users. When drugs are in shortage, there are frequently reports of gray market or secondary distributors offering limited quantities of the drugs for sale to health care providers at large markups. Health care providers are reluctant to purchase from these distributors due to the large price markups and because of concerns about the integrity of the supply chain, including the potential for poor handling practices and counterfeits. These gray market distributions appear to be a result of a drug shortage, not a cause, but the potential for hoarding and strategic behavior in the gray market is a concern with respect to future policy actions.
Supply
Sterile injectable oncology drugs include both generic and branded drugs. Approximately half the market is generic and the proportion of the market that is generic is rising. Virtually all manufacturing of sterile injectable drugs used in the United States takes place in the United States. Drugs manufactured in the United States are also sold in Canada (which has also been experiencing drug shortages). While some overseas countries in the Organization for Econcomic Co-operation and Development have been experiencing shortages of sterile injectable oncology drugs; others have not.
Manufacture of generic, sterile injectable drugs is a somewhat concentrated market with 7 manufacturers making up a large percentage of the market[9]. Most of the production of a given drug is by three or fewer manufacturers. Analysis of a sample of 33 generic sterile injectable oncology drugs shows that of 33 drugs, for 28 at least 90 percent of total unit sales in 2010 was by 3 or fewer manufacturers.[10] These manufacturers each operate a small number of facilities (1- 10) at which injectable drugs can be produced. These facilities, in turn, each contain several manufacturing lines. A particular drug can be produced on one or more of these lines, in runs that may last hours to weeks. The same line may be used for multiple different drugs (produced in separate batches), however certain drugs (including cytotoxic drugs) may only be produced on certain types of lines and in certain types of facilities, so the extent of substitution is limited. Moreover, there are costs in shifting from one drug to another on a specific line.
There is little evidence of recent increases in consolidation activity among sterile injectable manufacturers at the corporate level[11]. Moreover, consolidation at the corporate level need not have any effect on manufacturing capacity. Consolidation at the corporate level would be a significant contributor to drug shortages only if the consolidations have resulted in closures of manufacturing facilities that reduced production capacity. Conversations with leading generic drug manufacturers, and data from the FDA, indicate that the consolidations have not resulted in decreased production capacity or in the closure of manufacturing facilities[12].
One major manufacturer of sterile injectable drugs estimated that it usually holds 3-4 months of inventory and that, in addition, wholesalers carry 30 days worth of reserve inventory[13]. However, other manufacturers have notified FDA of shortages when their remaining supplies were one month or less, indicating that the available stock varies widely at manufacturers.
It is important to note that the low price responsiveness of demand for sterile oncology drugs also has implications for inventories and capacity decision. If there is an excess supply of a particular oncology drug, there may be no market for it, even at a low price. The combination of limited ability to compel supply (through failure-to-supply clauses or contractual breach provisions) and low price elasticity means that manufacturers face an asymmetry of incentives: there is little cost (except reputational) of producing too little of one drug (rather than another), but a potentially high cost of producing too much of that drug.
Sterile Injectable Oncology Drugs Market - Prices and Volumes
The market for oncology sterile injectable drugs is robust and growing. FDA analysis of IMS data shows that the number of eaches[14] (e.g., vials) of sterile injectable oncology drugs shipped increased by 14% between 2006 and 2010[15]. ASPE analyzed Medicare Part B data of sterile injectable oncology drugs to examine volumes of sales within Medicare (see Appendix B for methods and sample). Over the 2006-2011 period, the Part B volume of sterile injectable oncology drugs shipped increased by about 20% (Figure 2). The reasons for this increase in volume of services used are not clear. The Part B data suggest that the increase occurred in 2006 to mid 2009, which is somewhat after the Medicare Part B-related payment changes identified by Jacobson et al. (2010).
Using the Part B data, we were able to compare the volume of sales prior to shortages for drugs that did and did not experience a drug shortage. About 10% of the Medicare Part B volume of injectable oncology services in the period before drug shortages began consisted of drugs that experienced any shortage at some point over the subsequent 4 years.
Figure 2:
Medicare Part B Volume of Services of Oncology Sterile Injectable Drugs
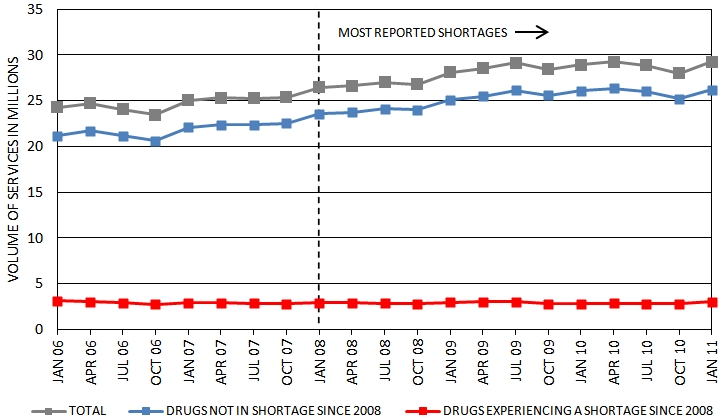
Note: The graph is restricted to the J9000-J9999 series of HCPCS codes with greater than 100 services in Q1 2006 and an average of more than 1,000 services annually.
Table 1 reports the average annual change in Medicare Part B volume of services of oncology sterile injectable drugs in the period 2006-2008, before the recent period of drug shortages began, and in the period 2008-2011 after shortages began. The table is divided into the group of 44 drugs that experience a shortage by 2011 and the group of 28 drugs that never experience a shortage from 2006 to 2011. On average, drugs that subsequently experienced a shortage are those in which the volume of sales was declining in the 2006-2008 period prior to the shortages. Drugs that have not experienced a shortage since 2008 had an average 11% increase in volumes of services over this period, and a similar increase in the 2008-2011 period that followed.
| Period | Drugs Experiencing a Shortage since 2008 (n = 44) |
Drugs not in Shortage since 2008 (n = 28) |
||||||
|---|---|---|---|---|---|---|---|---|
| Number of Drugs | Change in Volume of Services over Period |
Number of Drugs | Change in Volume of Services over Period |
|||||
| Mean | Median | Std. Dev. | Mean | Median | Std. Dev. | |||
| Q1 2006 to Q1 2008 | 44 | -6.9% | -5.6% | 29.6 | 28 | 11.2% | 4.8% | 40.5 |
| Q1 2008 to Q1 2011 | 44 | -2.0% | -7.6% | 200.5 | 28 | 10.5% | -2.3% | 59.1 |
| Q1 2006 to Q1 2011 | 44 | -3.0% | -16.2% | 184.3 | 28 | 23.8% | -5.4% | 61.7 |
| Note: The table is restricted to the J9000-J9999 series of HCPCS codes with greater than 100 services in Q1 2006 and an average of more than 1,000 services annually. Mean and median changes are weighted by volume of services in Q1 2006. |
||||||||
As noted above, sterile injectable drugs are generally purchased by hospitals and physicians, not by consumers. Medicare reimburses sterile injectable drugs at 6 percent above average sales price (ASP) under Medicare Part B. Data on prices paid by Medicare Part B, thus, provide a sense of average prices in this market. Table 2 reports the average annual change in prices of oncology sterile injectable drugs in the years prior to a reported shortage, adjusted to 2011 dollars using the CPI. Among the group of drugs that eventually experience a shortage, average prices decreased in every year leading up to a shortage. In contrast, the average prices of drugs that never experienced a shortage over this period did not change substantially either in the earlier or later period.
| Period | Drugs Experiencing a Shortage since 2008 (n = 44) |
Drugs not in Shortage since 2008 (n = 28) |
||||||
|---|---|---|---|---|---|---|---|---|
| Number of Drugs | Change in Price over Period | Number of Drugs | Change in Price over Period | |||||
| Mean | Median | Std. Dev. | Mean | Median | Std. Dev. | |||
| Q1 2006 to Q1 2008 | 44 | -26.5% | -21.4% | 19.1 | 28 | 0.6% | 2.5% | 10.9 |
| Q1 2008 to Q1 2011 | 44 | -6.3% | -19.4% | 113.7 | 28 | 2.6% | 0.5% | 32.0 |
| Q1 2006 to Q1 2011 | 44 | -27.4% | -49.1% | 94.4 | 28 | 3.2% | 0.3% | 24.4 |
| Note: The table is restricted to the J9000-J9999 series of HCPCS codes with greater than 100 services in Q1 2006 and an average of more than 1,000 services annually. Mean and median changes are weighted by volume of services in Q1 2006. Changes in price are based on prices in 2011 dollars. |
||||||||
Sterile Injectable Drugs - Changes in Market Structure
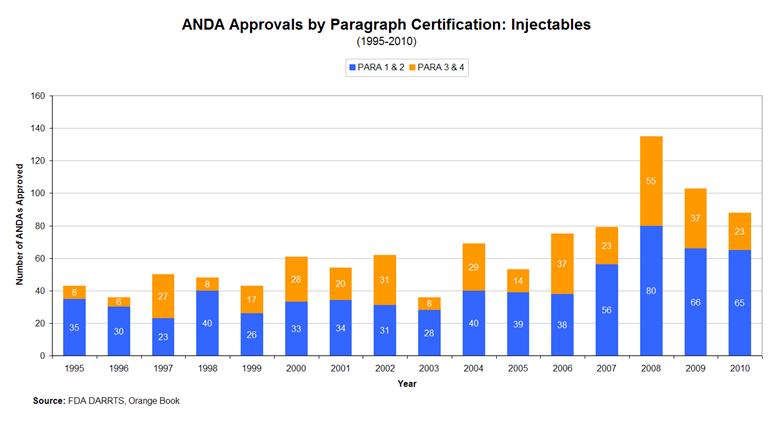
Generic manufacturers can increase their portfolio of generic sterile injectable drugs they can manufacture by filing an abbreviated new drug application (ANDA) with the FDA, which must be approved before the manufacturer can market the generic drug. An ANDA does not require that the applicant conduct preclinical or clinical trials to demonstrate safety or efficacy, instead the generic drug must be shown to be bioequivalent to the innovator drug. More ANDA approvals mean that manufacturers have more drugs to choose to manufacture on their existing capacity and therefore, that manufacturers may substitute newer drugs for other drugs. Alternatively, they may increase the rate at which they make use of their existing manufacturing capacity, though this would further reduce the elasticity of supply.
Figure 3 below shows the number of ANDA approvals for sterile injectable drugs from 1995 to 2010. As the table indicates, there was a substantial increase in the number of new injectable ANDA approvals beginning in 2008. A substantial number of these approvals were for products that during the approval process were still under patent protection (so called Paragraph 3 and Paragraph 4). These products tend to have higher margins than those where competition is already well established (Paragraph 1 and 2).
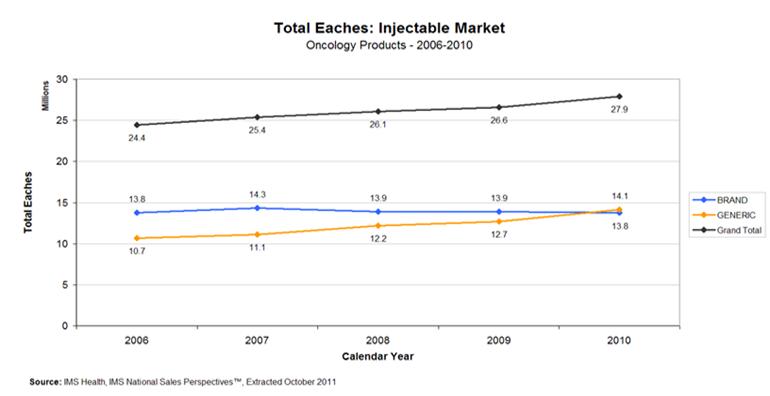
Between 2006-2010, while the overall market for sterile injectable oncology drugs increased by 14%, the number of eaches sold by generic drug manufacturers increased by nearly 30% (Figure 4). Over this period, the overall generic injectables market (including both oncology and other products) expanded by 52%. Some of this expansion was offset by reductions in brand manufacturers’ production of these drugs.
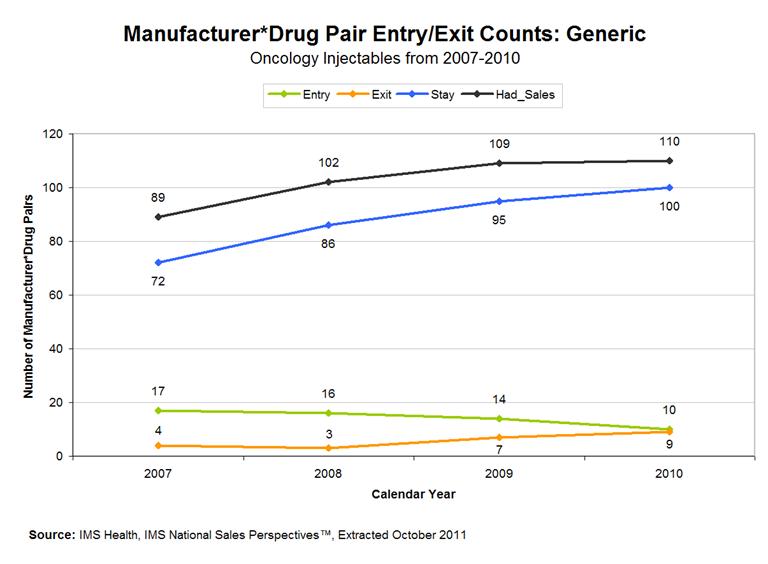
To get a better sense of how this shift in production in the market took place, we worked with the FDA to examine how the match between manufacturers and drugs evolved over this period. Figures 5 (brand) and 6 (generic) decompose the changes in manufacturer-drug pairs in the branded and generic markets over the 2006-2010 period. A manufacturer-drug pair consists of a specific manufacturer making a specific drug in a given year. For example, if Manufacturer A produced drugs a and b in 2010 and Manufacturer B produced drugs a and c in 2010, there would be 4 manufacturer-drug pairs (Aa, Ab, Ba, Bc) in 2010.
In 2006, there were 57 manufacturer-drug pairs in the branded sterile injectable oncology drug market in the US. As Figure 5 shows, between 2006-2007, 52 of those pairs continued to be supplied in the market, one new pair was introduced, and 5 pairs exited. The branded market overall is quite stable. In each year between 2006-2010, the number of changers (entrances or exits) in the market was below 11.5% of the previous year’s market. At the end of the period, the number of manufacturer-drug pairs in the market was 5% below the 2006 level.
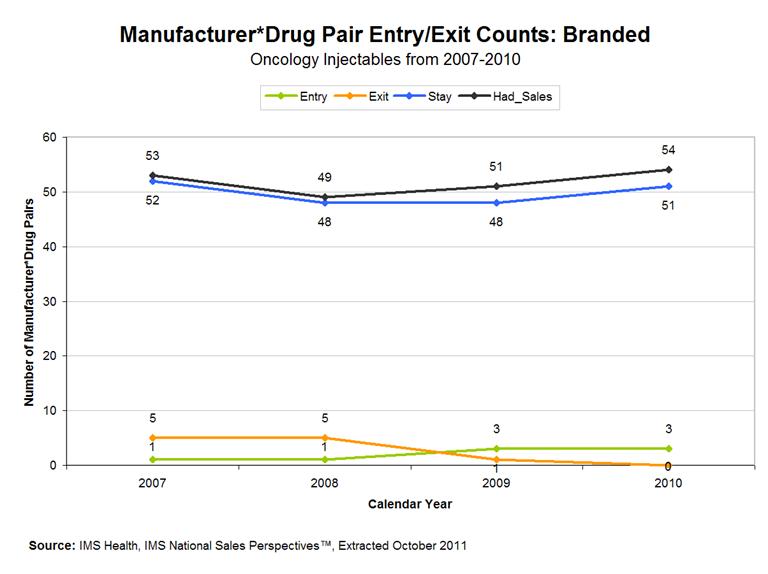
Figure 6 shows the same decomposition for the generic industry. This sector is much more dynamic. Between 2006-2010, the number of generic manufacturer-drug combinations in the sterile oncology market increased by 45%. In every year, including 2010 (at the height of the drug shortage), the number of new combinations in the market (a manufacturer producing a drug that it had not previously produced) exceeded the number of exits. In 2007, the number of changers in the industry was 27% of the number of manufacturer-drug combinations in the prior year.
Expansion of the scope of production is also evident in the decisions of leading manufacturers to increase future manufacturing capacity. Several leading manufacturers of generic sterile injectable drugs indicated that they are upgrading existing facilities or building new facilities to serve this market[16]. According to news reports and discussions with manufacturers, Hospira is investing $65 million in capital improvements in sterile injectable drug manufacturing sites, Teva is opening a new manufacturing site, and Ben Venue is opening a new, expanded facility to replace an older manufacturing facility[17]. These investments will increase capacity in both older and newer generic sterile injectable drugs.
Unfortunately, this new capacity is unlikely to come on line for at least another 18 months. Meanwhile, when there is little excess manufacturing capacity, producing a new drug will often require manufacturers to reduce or stop production of another drug or to operate at a much higher than normal level of capacity utilization.
The data above suggest that the overall quantity and the range of drugs produced by generic sterile oncology manufacturers over the past 5 years has increased substantially, while the capacity of sterile injectable oncology manufacturing facilities has remained stable. In consequence, capacity utilization is likely to have increased significantly over the past 5 years. Shortages have been concentrated in drugs where the volume of sales and drug prices were declining in the years preceding the shortage, suggesting that manufacturers are diverting capacity from shrinking lines of business to growing ones.
Market Behavior
Our analysis suggests that this change in capacity utilization stems from a combination of the effects of the increase in volume of chemotherapy drugs used, the expansion of products available for generic manufacturing because of patent expiration, and the complexity of manufacture and requirements for Current Good Manufacturing Practices. Entry cannot occur quickly in the sterile injectables industry because of the high fixed costs of specialized production and regulatory protections. Furthermore, because shortages are uncommon and occur in drugs for which capacity is highly specialized, and because there are few penalties for failing to supply contracted drugs, there is no financial return to investing in excess capacity — that is, capacity that is not used outside a supply shortage, and thus earns no revenue except during a supply shortage.
Generic drug manufacturers must make strategic decisions about how to deploy existing production capacity among products, based on their conjectures about what choices their competitors will make and what demand will be. In general, manufacturers will prefer to concentrate on markets with fewer competitors, where they are likely to face less price competition. Conversely, purchasers, such as GPOs, will prefer that multiple competitors produce each product. If manufacturers misjudge their competitors’ choices, there may be excess supply and depressed prices for some drugs and insufficient supply and shortages of others. When markets are small, like those for sterile injectable oncology drugs, which have 2 or 3 participants, one competitor more or less producing a drug can make the difference between profit and loss. By contrast, larger markets for solid dosages may often have 10 or more manufacturers, so that the decision of one firm has less impact on the profitability of others.
Supply Disruptions
The structure of the sterile injectable market, the recent expansion in volume and scope, and the consequent very high level of capacity utilization, means that small disruptions to supply — such as may occur because of quality problems — which would otherwise be absorbed through diversion of capacity, can lead to cascading and persistent shortages. Moreover, high rates of capacity utilization may also limit the ability of manufacturers to perform routine maintenance and keep facilities in good order.[18]
Quality problems in manufacturing are linked to a majority (54 percent) of shortages of sterile injectable drugs. Some of the largest manufacturers of sterile injectable drugs have had serious quality problems leading to the temporary voluntary closure or renovations of major production facilities. This means that quality problems that affect an entire plant may result in shortages for many drugs. This temporary closure of a large manufacturing facility can also lead to other facilities being unable to meet the increased demand for the drug due to the lack of excess capacity and the pressure of ramping up supply for multiple drugs in other facilities.
Over time, entry, and expansions in capacity in the industry, should lead to a situation where shortages due to supply disruptions are sporadic and rare. In the current environment, where capacity is severely constrained, shortages induced by disruptions can cascade throughout the sector and persist for long periods of time.
Framework for Strategies to Reduce Shortages
Reducing the number and severity of shortages can only be achieved through increases in the elasticity of demand and/or supply, or reductions in the number or extent of changes to demand or supply. Each of these approaches — increasing demand flexibility, increasing supply flexibility, reducing demand disruptions (which have been rare and are not discussed below), and reducing supply disruptions — has costs.
Either increasing standardization of care through, for example, use of clinical guidelines, or increased tailoring of care to the particulars of individual cases, reduces the elasticity of demand. Conversely, expanding the range of therapeutic choices available to providers and patients can increase the elasticity of demand — but at the cost of requiring the use of non-standardized treatment (which may increase safety or quality problems).
Increasing inventories of products or reducing the rate of capacity utilization (effectively increasing inventories of manufacturing capacity) raise supply elasticity, but also the cost of production and, ultimately, prices paid by consumers. Private contractual vehicles — failure to supply clauses — that could induce manufacturers to hold excess inventories or manufacturing capacity exist and are in use, although they are weak. In current contracts that incorporate these clauses, penalties are generally of limited duration and the clauses are generally not binding if a shortage exists and no alternative manufacturer is producing a product. Private purchasers could choose to strengthen these clauses — but manufacturers would demand higher prices in exchange for stronger requirements. Those higher prices would go toward the cost of certifying additional input suppliers, lines of equipment, and other resources, which could be used in case of a supply shortage.
New business opportunities can lead to disruptions in supply. Slowing the ability of firms to respond to new business opportunities would reduce supply disruptions but at the cost of reducing industry flexibility or passing up opportunities to improve consumer quality.
Sectors dominated by medically necessary drugs, with high current rates of capacity utilization, expansions in volume, and recent entry of new products are most vulnerable to shortages. FDA’s tailored regulatory response, which considers the risks and benefits of regulation in each situation, may be particularly important when there is a likelihood of shortages across an entire industry sector. However, strategic behavior — behavior that takes into account the likely actions of both competitors and regulators — is a common response to an environment of constrained capacity with few participating firms. Such behavior can lead to increases in concentration and reductions in competition in the longer run.
Recommendations
The following recommendations are based on our examination of the underlying factors that lead to periods of shortage in the prescription drug market, and particularly the underlying market factors that have contributed to the current shortages in the area of sterile injectable oncology drugs. As noted earlier, our report complements the accompanying FDA report, “A Review of FDA’s Approach to Medical Product Shortages”, which focuses on the FDA’s role in monitoring and responding to shortages.
Policymakers must balance the short-run benefits of tailoring regulatory responses to specific situations against the risk of strategic behavior and consequent reductions in competition in the long run.
Steps that both expedite expansion of supply and maintain product quality in sectors with high capacity utilization could reduce the risk of shortages not only in the current situation, but in the future as well. To facilitate this, FDA can expedite review of new manufacturing capacity in this area and we understand that FDA is committed to doing this.
Private organizations that purchase drugs and vaccines (including GPOs and insurers), can help to alleviate future shortages by strengthening the failure-to-supply requirements in their contracts in exchange for increases in price. Such contract changes are likely to lead manufacturers to invest in extra capacity of both production lines and API.
Methods
In preparing this report ASPE staff conducted analyses of data, reviews of the literature, expert consultation, and stakeholder consultations.
We analyzed Medicare Part B data on prices and volumes of services for injectable oncology drugs. We also analyzed data from the Drug Shortage Program (DSP) at the Food and Drug Administration (FDA) and the University of Utah Drug Information System (DIS) sponsored by the AHSP. FDA conducted analyses of IMS data on behalf of the ASPE team.
We consulted with trade and pharmaceutical economists throughout the Federal government.
We spoke to stakeholders from four generic manufacturing companies, one wholesaler, the group purchasing association, and one group purchasing organization. We also spoke to representatives of hospitals and physicians associations.
Appendix A: Drug Shortages Followed by the University of Utah DIS.
Another source for tracking drug shortages is the American Society of Health-System Pharmacists, which is managed by the Drug Information Service (DIS) of the University of Utah Hospitals and Clinics, with support from ASHP and Novation (a group purchasing organization). The DIS defines drug shortages from the perspective of a health care organization, considering a drug shortage to be a supply issue that affects how the pharmacy prepares a product or influences patient care when prescribers must choose an alternative therapy.
The University of Utah DIS reported 211 shortages in 2010 and 166 shortages for all of 2009. DIS drug shortages declined from 120 in 2001 to 58 in 2004, and have risen steadily from 74 in 2005 and 70 in 2006 to 166 in 2009. The University of Utah also reports reasons for shortages. Unknown reasons are reported for 47 percent of drug shortages; manufacturing problems for 28%; supply/demand for 14 percent; discontinuations for 7 percent; raw materials for 3 percent; and regulatory issues for 1 percent. The large percentage of drug shortages attributed to unknown reasons complicates comparison with the FDA data on reasons for drug shortages. The number of shortages followed by the DIS is generally larger than the number followed by FDA, because of the different definitions of shortages mentioned above, as shown in table A1. Additional information on FDA’s data on reasons for drug shortages is provided in the companion FDA report, “A Review of FDA’s Approach to Medical Product Shortages.”
| Year | ASHP/Utah Drug Shortage |
FDA Drug Shortage |
FDA Drug Shortage, Sterile Injectables |
FDA Percent Sterile Injectables |
|---|---|---|---|---|
| 2005 | 74 | 60 | 30 | 50.0 |
| 2006 | 70 | 55 | 25 | 45.5 |
| 2007 | 129 | 92 | 42 | 45.7 |
| 2008 | 149 | 110 | 40 | 36.4 |
| 2009 | 166 | 157 | 75 | 47.8 |
| 2010 | 211 | 178 | 132 | 74.2 |
The University of Utah DIS shared their data on drug shortages with ASPE in August, 2011. In addition to the drug name, the DIS drug shortages are also categorized by type of drug, using the first tier of the classification system of the American Society for Health System Pharmacists. We conducted descriptive analyses of a subset of the DIS data, for shortages beginning in 2001. We excluded from our analysis the categories of blood derivatives and devices, and we combined those categories having a small percentage of drug shortages into a new category, “other”. There were 1252 drug shortages, from 2001 through 2011 in the subset of drug shortages we analyzed.
Figure A1 shows the analysis of time trends of drug shortages by type of drug. We looked at the three drug types with the largest numbers of shortages in the DIS data, anti-neoplastic (oncology), anti-infective and neurologic (CNS) drugs, and combined the other types into a larger “other” category. Shortages of anti-neoplastic (oncology) drugs became more prominent in 2010 and 2011. Figure A2 shows the trend in drug shortages by whether the drugs are injectable.
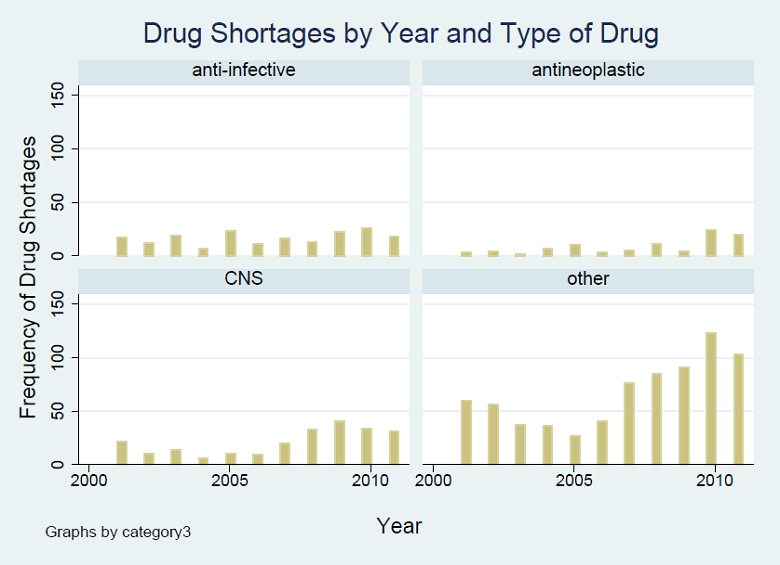
From analysis of the DIS data
Antineoplastic=oncology drugs; CNS=central nervous system, 2011 data are through August, 2011
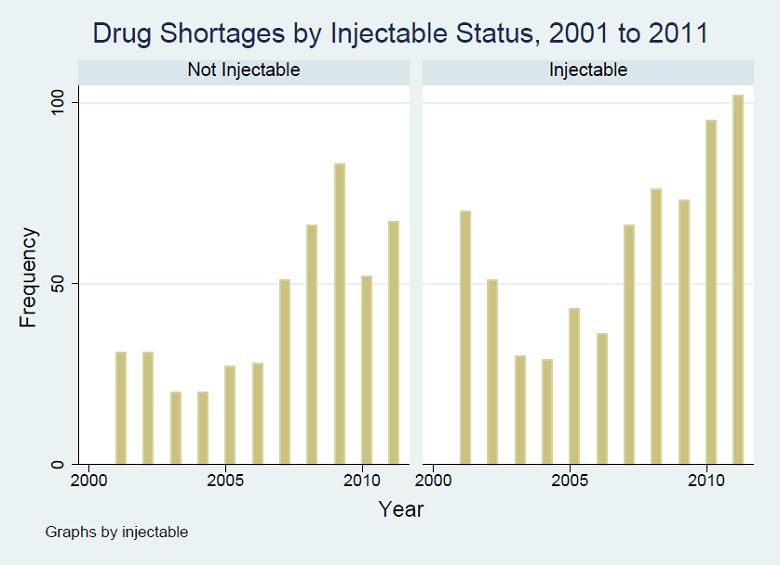
From analysis of the DIS data
Appendix B: Dataset of Average Sales Prices
To better understand the changes in price and quantity of sterile injectable drugs used in oncology treatment, ASPE created a dataset of average sales prices, Medicare Part B volume, and reported shortages of oncology sterile injectable drugs since January 2006. ASPE derived average sales prices from the Medicare Part B quarterly payment limits publicized on the CMS website and adjusted them to 2011 dollars using the CPI-U. Pharmaceutical manufacturers report prices to CMS quarterly, and must include all discounts and rebates to reflect actual market prices. CMS provided ASPE with Medicare Part B quarterly volume for the J9000-J9999 series of HCPCS codes, which includes most oncology sterile injectable drugs. The University of Utah provided ASPE with the dates of active and resolved drug shortages reported to the American Society of Health System Pharmacists. After creating this dataset, ASPE produced graphs of each drug showing average sales prices, Medicare Part B volume, and the timing of reported shortages. ASPE also calculated the average annual change in price and volume for each drug. For consistency in comparing changes across the 2006-2011 period, analysis is restricted to the J9000-J9999 series of HCPCS codes with greater than 100 services in Q1 2006 and an average of more than 1,000 services annually (n = 72). Our sample of oncology sterile injectable drugs in shortage (n = 44) as identified by the University of Utah is a subset of the 132 sterile injectable drug shortages reported by the FDA, which covers more drug classes than oncology drugs. However, the volume patterns are similar to those in the IMS data which includes the entire market of oncology sterile injectable drugs.
ASPE’s analysis of Medicare Part B volume shows that oncology sterile injectable drugs that experienced shortages since 2008 (n = 44) decreased in volume from 3.1 million units in Q1 2006 (average of 70,884 units per drug) to 3.0 million units in Q1 2011 (average of 68,743 units per drug). In contrast, oncology sterile injectable drugs that have not experienced shortages (n = 28) increased in volume from 21.2 million units in Q1 2006 (average of 756,320 units per drug) to 26.2 million units in Q1 2011 (average of 936,079 units per drug). Analysis of average sales prices shows that shows that oncology sterile injectable drugs that experienced shortages since 2008 decreased in price from $56.17 per unit in Q1 2006 to $37.88 per unit in Q1 2011. Oncology sterile injectable drugs that have not experienced shortages have had relatively stable prices over this period.
Shortages of Raw Materials and Manufacturing Components
Some previous drug shortages have been due to scarcity of underlying raw materials, particularly of the active pharmaceutical ingredient (API) for a specific drug. Generic drug manufacturers frequently have only one supplier of API, so if this supplier is unable to meet demand, the drug manufacturer must find another source and this can be a challenge. Changes in manufacturing components may also present challenges. Appropriate alternatives for the raw materials or components must be found that works within the manufacturing process. Changes in raw materials or other manufacturing components must be validated by the drug manufacturer. Once validated, the changes must be approved by the FDA through a supplement to the abbreviated new drug application. Once FDA has reviewed and approved the supplement, which FDA can expedite if the product is in shortage and medically necessary, the manufacturer can begin production using the new raw material or component. API supply failures have been the cause of some high-impact drug shortages. For example, the heparin shortage in 2008 resulted from the import of contaminated raw materials from China. However, although scarcity of raw materials cannot be ignored as a root cause, it does not appear to be an important contributor to the current shortages of sterile injectable drugs. In 2010, unavailable API was cited as a factor in 5 percent and component problems in 2 percent of shortages[19].
Endnotes
[1] The Drug Shortage Program (DSP) at the Food and Drug Administration, Center for Drug Evaluation and Research (CDER) defines a drug shortage as a situation in which the total supply of all clinically interchangeable versions of an FDA-regulated drug is inadequate to meet the current or projected demand at the user level. In general, the DSP prioritizes its work on shortages of products that have a significant effect on public health. For the purpose of this prioritization, DSP determines what drugs are “medically necessary,” which DSP considers to be drugs that are used to treat or prevent a serious disease or medical condition for which there is no other alternative drug, available in adequate supply that is judged by medical staff to be an adequate substitute.
[2] Kaakeh R, Sweet BV, Reilly C, Bush C, DeLoach S, Higgins B, Clark AM, Stevenson J. Impact of drug shortages on U.S. health systems. American Journal of Health-System Pharmacy. 2011;68:e13-e21. http://www.ajhp.org/site/DrugShortages.pdf?fm_preview=1
[3] http://www.ismp.org/pressroom/PR20100923.pdf
[4] FDA presentation at the FDA Drug Shortage workshop, 9/26/2011.
[5] There is some evidence suggesting that physicians and hospitals do change prescribing patterns with changes in their own reimbursement for prescription drugs. Jacobson, Mireille; JP, CC Earle, M Price, JP Newhouse. How Medicare’s Payment Cuts For Cancer Chemotherapy Drugs Changed Patterns of Treatment Health Affairs, 2010, 29(7): 1394-1402.
[6] Ben Venue memo, 9/22/2011.
[7] GPO Memo.
[8] From personal communication with representatives from Greater New York Health Association (GNYHA) 9/22/2011.
[9] FDA presentation at the FDA Drug Shortage workshop, 9/26/2011.
[10] From National Cancer Institute analysis of IMS data.
[11] We have identified fewer than a dozen mergers since 2005, largely relatively small in nature, contradicting the idea that there has been a lot of recent consolidation. As merger and acquisition activity does not appear to have grown in the last 5 years, it does not appear to be a factor in the recent surge of sterile injectable drug shortages.
[12] From personal communications with representatives from Teva, Hospira, Ben Venue, and APP 9/22/2011.
[13] From personal communications with representatives from Teva, 9/22/2011.
[14] Eaches (e.g., vials) and Medicare Part B services do not necessarily represent the same quantity of a drug.
[15] This follows the trend in the larger sterile injectable drug market as described in the accompanying FDA report which showed an increase in total sales revenue for generic injectable products between 2001 and 2010.
[16] From personal communications with representatives Teva, Hospira, Ben Venue, APP 9/22/2011)).
[17] From personal communications with representatives Ben Venue, 9/22/2011.
[18] Donald Gross, John F. Shortle, James M. Thompson, Carl M. Harris, Fundamentals of Queuing Theory, Fourth Edition (John Wiley & Sons, Inc, Hoboken, NJ., 2008).
[19] FDA presentation at the FDA Drug Shortage workshop, 9/26/2011