
PRESENTED TO:
Thomas D. Musco
U.S. Department of Health and Human Services
200 Independence Avenue, SW Room 447D
Washington, DC 20201
202-690-7272
PRESENTED BY:
NORC at the University of Chicago
Jon R. Gabel
Senior Fellow
4350 East-West Highway Bethesda, MD 20814
301-634-9313
This study was conducted by NORC at the University of Chicago under contract number HHSP23320095647WC, task order number HHSP23337021T, with the HHS's Office of Assistant Secretary for Planning and Evaluation. The authors take full responsibility for the accuracy of material presented herein. The views expressed are those of the authors and should not be attributed to ASPE or HHS.
Data on premium increases were collected from 2008-2011 hard copy rate filings submitted by insurance carriers and from rate filings or rate summaries available on state insurance websites for the small group and individual insurance markets. In the individual market, the average premium increase (weighted by member months) was 9.9 percent in 2008, 10.8 percent in 2009, and 11.7 percent in 2010, and then declined to 8.6 percent in 2011. In the small group market, average premium increases declined throughout the study period, from 11.2 percent in 2008 and 2009 to 8.8 percent in 2010 and 6.7 percent in 2011. There was substantial variability across states in the average rate of increase. In addition to having their rate requests accepted or rejected, carriers could reach some compromise with the state for a modified rate. The percentage of requests modified by states increased between 2008 and 2011 in both markets. The Affordable Care Act provides states with rate review grants to help states implement or improve their review rate process. These improvements also resulted in increased transparency with 23 states initiating public websites in 2010 and 2011 displaying rate filing information.
"Executive Summary
During the past 50 years, health insurance markets have been defined by two interrelated characteristics – rapidly increasing premiums and lack of transparency. From 2001 to 2011, the cost of a family policy rose 113 percent while overall consumer prices rose 27 percent.1 Yet, consumers face substantial difficulty in understanding this inflation-prone market. Typically, consumers cannot identify what products are available in the individual market, small group and large group markets; their cost; and the benefit design of each product.
The Patient Protection and Affordable Care Act (hereafter referred to as the Affordable Care Act), which became law in March 2010, includes provisions intended to safeguard consumers against both unreasonable increases in premiums and problems associated with the lack of transparency. To achieve these objectives, the Affordable Care Act (1) authorizes review of the reasonableness of rate increases; (2) requires that carriers meet minimum medical loss ratios (MLRs) described below; and (3) provides grants to states to improve protocols for reviewing proposed premium increases. Regulations issued by the United States Department of Health and Human Services (DHHS) related to rate review stipulate that insurers increasing premiums by 10 percent or more must justify such premium increases to either the state insurance department or DHHS. To improve transparency, the Affordable Care Act requires health insurance issuers offering individual, small group, or large group coverage to submit a report to DHHS each year with data on premium income, administrative expenses, and medical claims expenses.
To prevent insurers from retaining an unreasonable share of the premium dollar for administrative expenses and profits, the Affordable Care Act also requires insurers to meet target medical loss ratios (MLRs), which are the percentage of premium income spent on medical benefits and quality improvement according to the line of business. DHHS set the MLR target at 80 percent for individual and small group coverage. Carriers not meeting this target are required to provide customers with premium rebates.
In September 2010, the DHHS Office of the Assistant Secretary for Planning and Evaluation (ASPE) contracted with NORC at the University of Chicago to conduct an analysis of trends in health insurance premiums for comprehensive major medical insurance products in the individual and small group markets from 2008-2011. To accomplish this analysis, NORC and its partners built a database of carrier rate filings from a sample of states. The project addressed the following research questions:
- How have rates of premium increases changed over time?
- How do premium increases vary by type of insurance product and by state?
- What percentage of premium requests have been denied or modified?
- How do MLRs vary by type of insurance product and by state?
- Have MLRs met state requirements?
- What are state trends in premium increases?
- How has the transparency of rate premium increases changed over time?
The remainder of this executive summary reviews the study’s methods, data limitations and key findings.
1 Cost increase for family policy: Kaiser Family Foundation and Health Research and Educational Trust, “Employer Health Benefits 2011 Annual Survey,” p. 1. Overall consumer price increase: ftp://ftp.bls.gov/pub/special.requests/cpi/cpiai.txt, Accessed July 30, 2012.
Methods
We compiled and analyzed data on rate increase filings for comprehensive major medical insurance products available from a sample of states. The total number of filings in the database is 2,809, of which 1,923 are from the individual/conversion market and 886 from the small group market.
We compiled data on rate filings from a number of sources, including photocopies made in person at state insurance departments and the use of public websites that provided documentation of premium rate increase filings in states where this resource was available. Many websites accessed became available only during the course of the study. During the study NORC discovered and documented several shortcomings in both the availability and quality of the filings necessary to answer the research questions. For example, the Illinois Department of Insurance produced a summary of recent rate increases in the individual market since 2005, but has not updated the information available since October 2010. In some states, such as Colorado, documentation captured from different sources produced data sets with discrepancies that were difficult to reconcile, as no source was clearly authoritative. Many filings we found were incomplete, missing information about product type, enrollment, or disposition following state regulatory review. These data limitations and others are discussed in more detail in the main body of the report and should be considered carefully when interpreting the study’s results.
We developed sample weights using data from the National Association of Insurance Commissioners (NAIC), the Medical Expenditure Panel Survey Insurance Component2 (MEPS-IC), and the filings themselves, to calculate national and state averages. When enrollment data were missing from filings, imputation methods were employed to populate those data. NORC conducted sensitivity analyses to assess how modifications in the approach to weighting or other decision criteria would impact the findings. We concluded that, had we made alternative decisions for weighting and exclusions, the resulting changes in our point estimates would not change the major findings or conclusions of the study.
2 The Medical Expenditure Panel Survey (MEPS) is conducted by AHRQ annually; the Insurance Component (MEPS-IC) draws a sample from both private and public-sector employers and surveys them on the health insurance coverage they offer.
Findings
Our analysis of compiled rate filings showed the following results:
- After the magnitude of premium increases climbed each year between the years 2008 and 2010, this magnitude declined 3.1 percentage points (from an 11.7 to 8.6 percent increase in premiums) in the individual market between 2010 and 2011. Also, between 2010 and 2011, premium increases declined in magnitude by 2.1 percentage points in the small group market. 2011was the first year in which carriers were subject to the Affordable Care Act rebate and MLR requirements. 2011 was also the first year states had funding from review grants providing states greater resources for review.
- In the individual market, the average premium increase was 9.9 percent in 2008, 10.8 percent in 2009, and 11.7 percent in 2010, and then declined to 8.6 percent in 2011.
- In the small group market, average premium increases declined throughout the study period, from 11.2 percent in 2008 and 2009 to 8.8 percent in 2010 and 6.7 percent in 2011.
- There was substantial variability across states in the average rate of increase. In the individual market, in states such as Nebraska, Wisconsin, and Oregon, premiums increased by rates of more than ten percent in most years.
- In the small group market, premiums in Florida, New Jersey, and North Carolina increased by more than ten percent in most years for which there were reportable data. 3 Other states such as Idaho and Kentucky saw premium increases of less than ten percent each year.
- In the individual market, large carriers had comparable cumulative premium increases to smaller carriers from 2008-2011. In the small group market, however, large carriers tended to have lower cumulative premium increases than did smaller carriers over the four year study period.
- HMO plans had lower cumulative increases over the study period in the individual market than did PPOs and indemnity plans.
- The level of scrutiny given to premium rate increases by state regulators is difficult to measure, but some indicators captured by the study suggest it increased from 2008 to 2011. Depending on the state, premium increase requests may be implemented upon filing or are subject to review by the state. Premium increase requests are categorized as approved, disapproved or simply “filed” (the state makes no determination, but the increase goes into effect). The sub-findings below report the percentage of requests, among those subject to prior approval regulation, that were affirmatively approved (as opposed to “filed” or disapproved). Results are weighted by enrollment.
- Although most requested rate increases are approved, our data show some fluctuation in how regulators treated rate increase filings during the study period. In the individual insurance market, regulators approved 76.9 percent of requested rate increases in 2008, 79.3 percent in 2009, 83.1 percent in 2010, and 74.8 percent in 2011.
- In the small group market, 84.4 percent of requested rate increases were approved in 2008, compared with 64.0 percent in 2009, 68.6 percent in 2010, and 69.7 percent in 2011.
- Rate increases that go into effect may be modified by state regulators as part of the review process. Regulators modified a growing share of rate filings over the study period; these modifications nearly always reduced the magnitude of increases in premiums, and thus constitute one measure of the stringency of regulation.4 In most cases, regulators accepted the carrier’s proposed increase, but in some, the effective increase has been modified following correspondence between the carrier and regulator. Below we provide details on modifications to effective rate increases for filings that included information on both the proposed and effective rates.
- The percentage of requests modified by state regulatory agencies increased between 2008 and 2011 in both markets, rising from 13.7 to 20.6 percent in the individual market and 2.0 to 10.4 percent in the small group market. These modifications affected national estimates for the rate of increase, reducing the rate of premium increase in the individual market from 11.3 to 10.3 percent in 2009, 10.7 to 8.8 percent in 2011, and smaller amounts in other years.5 Rates of increase in the small group market were also affected, but by smaller amounts in all years.
- State regulatory authorities modified (reduced) a growing share of proposed premium increases in the individual market during the study period. Among states and years with sufficient data to report, state regulators modified (reduced) estimated premium increases each year in the individual market in Arkansas, Iowa, Maine, North Carolina, Oregon, Pennsylvania, and Washington. Modifications in the small group market made a smaller impact. In this market, among states and years with sufficient data to report, state regulators modified estimated premium increases each year in in Connecticut and Rhode Island.
- The transparency of the individual and small group markets improved over the study period, and much of this improvement likely derives from the Affordable Care Act.
- In 2010 and 2011, 23 states initiated public websites with information on carrier rate filings. Twenty-one of these states received awards under either the first or second cycle of grants authorized under the Affordable Care Act to help states improve their protocols for rate review.6 Launching public websites was a goal for many grantees.
- Since 2010, six additional states, -- Arkansas, Connecticut, Nevada, New Jersey, Nebraska, and South Carolina -- mandated that carriers file rate increases through the System for Electronic Rate and Form Filing (SERFF).7 SERFF provides a standard format making it much easier for one to read, collect, and compare data from rate filings.
- Data on medical loss ratios (MLR) were available for 40 percent of filings in the individual market and 36 percent of filings in the small group market. These figures changed little over the four study years. Due to the high percentage of filings with missing MLR data, the final report does not include an analysis of MLRs. Few states had MLR targets prior to the Affordable Care Act so it is not surprising that filings had little information on MLRs.
3 Data from a given state and year were reported only when filings represented at least half of NAIC-reported member-months (see Methodology section for details).
4 Many filings contain information on both the original rate increase proposed by the carrier and the effective rate approved by the state regulator. All analysis of rate modification is based on the subset of filings listing both the proposed and effective rate, as there is no way to determine if a filing missing the carrier’s original request was modified by regulators. As a result, filings from file and use states are excluded from this analysis, and the state- and national-level estimates of rate increase each year may differ from those elsewhere in the report.
5 These estimates differ from those in Finding 1, as the analysis of rate modification considers only the subset of filings listing both a proposed and effective rate (see Findings subsection “Approval Rates of State Regulators” for details).
6 The ACA allocates $250 million to states in order to assist them in improving their protocols for reviewing proposed health insurance premiums. The first cycle of grants, totaling $43 million, were awarded to 43 states (including the District of Columbia) and 5 territories in August 2010. Grants in Cycle II, worth approximately $109 million, were awarded to 29 states (including the District of Columbia) in September of 2011 to bolster further efforts and incorporate changes from additional rate review regulations passed in May 2011.
7 SERFF was developed by the NAIC, and provides a standardized format for rate requests, which facilitates reading rate filings and identifying pertinent information.
Conclusion
Given inherent limitations in the quality and completeness of the data, readers should view study findings with caution. Study results suggest significant changes in the individual and small group insurance markets since the passage of the Affordable Care Act. Twenty-three states launched public websites and six more required SERFF filings after passage, thereby increasing the transparency of health insurance markets. In 2011, rate increases were approximately three percentage points lower than in 2010 in the individual market and two percentage points lower in the small group market. State regulators were more likely to modify requested premium increases in 2011 than in prior years. These trends are consistent with more stringent regulatory oversight encouraged by the Affordable Care Act.
Background
The Patient Protection and Affordable Care Act (hereafter referred to as Affordable Care Act) created new reporting and regulatory requirements for health insurance issuers in the United States. In 2011, the United States Department of Health and Human Services (DHHS), acting under authority granted by the Affordable Care Act, established a process for health insurance issuers to annually report premium income, administrative expenses and medical claims expenses. DHHS also created a process for state governments or DHHS officials to review increases in premiums for health insurance products sold to groups and individuals. Under the Affordable Care Act, states deemed not to have effective rate review programs would cede their review authority to DHHS.8
Section 1003 of the Affordable Care Act authorizes states or DHHS (in cases where the state’s review process is not deemed effective) to review the reasonableness of rate increases. DHHS regulations stipulate that insurers increasing premiums by 10 percent or more must justify such premium increases either to the state insurance department or to DHHS.9 Individual issuers’ history of unreasonable rate increases may be used to exclude them from participating in the Affordable Care Act-initiated health insurance exchanges in 2014. 10 To prevent insurers from retaining an unreasonable share of the premium dollar for administrative expenses and profits, the Affordable Care Act also requires insurers to meet target medical loss ratios (MLRs), which are the percentage of premium income spent on medical benefits and quality improvement according to the line of business. DHHS set the MLR target at 80 percent for individual and small group coverage. Carriers not meeting this target are required to provide customers with premium rebates.
At the time the Affordable Care Act became law, state regulatory authorities in 31 states had prior approval authority in the individual market and 25 states had prior approval authority in the small group market. This authority constrains carriers from raising premiums without approval from the state regulatory authorities.11 Four more states have authorized rate review in the individual and five more in the small group market since passage of the Affordable Care Act.12 One state – Maine – has dropped prior approval review. Other states either do not require filings for rate increases or allow insurers to “file and use” rates without prior approval. Some “file and use” states subject filings to retrospective review. In practice, differences among file and use states and prior approval states are not always clear. A state may have prior approval authority but approve nearly all requests. Alternatively, a file and use state may exercise retrospective review consistently and thus subject insurers to more rigorous review than the lax prior approval state.
In September 2010, the Assistant Secretary for Planning and Evaluation (ASPE) contracted with NORC at the University of Chicago to conduct a study of trends in premiums in the individual and small group health insurance market from 2008-2011. ASPE aimed to establish trends in the individual and small group market in the years prior to the passage of the Affordable Care Act. NORC was also asked to examine trends in MLRs during the study years. To build the study database, the plan called for NORC to collect insurers’ rate filings with state insurance departments.
8 U.S. Government Accountability Office, Private Health Insurance: State Oversight of Premium Rates, July 2011, GA)-11-701, p. 8.
9 States and the Federal governments review rate increases of non-grandfathered plans in the individual and small group markets above a certain threshold (at or above 10 percent for September 2011 to August 2012) to determine if they are unreasonable. See http://cciio.cms.gov/resources/factsheets/rate_review_fact_sheet.html.
10 The ACA establishes state-based exchanges that begin operation in 2014. Exchanges are organized electronic markets that allow households to purchase insurance coverage outside of the mechanism of employer-sponsored plans. Small employers can also purchase coverage on the exchange. Exchanges are the portal where eligibility for Medicaid and subsidized private insurance are determined. Private insurers will offer plans on the exchange and the exchanges will provide extensive information about these plans. By 2017, about 18 million individuals and 4 million employer-based persons are estimated to enroll in the exchanges. See http://www.cbo.gov/sites/default/files/private/cbofiles/attachments/43057_Health....
11 Most states have some form of “deemer” review. If the state has not issued a decision after some agreed-upon time period, the premium increases go into effect.
12 Kaiser Family Foundation, “State Authority to Review Health Insurance Rates,” http://www.statehealthfacts.org/comparetable.jsp?ind=887&cat=7, accessed August 28, 2012; also see, National Conference of State Legislatures, http://www.ncsl.org/issues-research/health/health-insurance-rate-approva..., accessed July 21, 2012.
Study Objectives and Research Questions
ASPE asked NORC to track the trends in premium increases between 2008 and 2011, including how premium increases vary by state and type of insurance products. NORC was also asked to look at the trends in premium requests being modified or denied and the overall transparency of rate information for the years 2008-2011. Specific research questions included:
- How have rates of premium increases changed over time?
- How do premium increases vary by type of insurance product and by state?
- What percentage of premium requests have been denied or modified?
- How do MLRs vary by type of insurance product and by state?
- Have MLRs met state requirements?
- What are state trends in premium increases?
- How has the transparency of rate premium increases changed over time?
Related Studies
In July 2011, the U.S. Government Accountability Office (GAO) issued a report to Congress entitled “Private Health Insurance: State Oversight of Premium Rates”. 13 The study set out to: (1) describe state methods for overseeing health insurance rates, and (2) examine the changes 41 states receiving DHHS review grants had made to their review process. GAO gathered information through a survey of states and case studies in five states. The report concluded there was considerable variation in the practices of states in review authority and the data that carriers were required to submit. About one-third of states had either enacted or introduced legislation to obtain additional authority to oversee premium rates. Two-thirds of states reported building their capacity to review rates through the hiring of additional staff or contracting with private actuaries. The GAO study did not collect or analyze data from state rate filings.
To our knowledge, this study funded by DHHS-ASPE is the first attempt to build a national database of rate filings from state insurance departments. At the time the study began, little was known about the quality of data used in rate filings to insurance departments. However, the general assumption was that carriers submitted rate filings each year in most states, and that these filings included data on MLRs. The presumption was also that, for prior approval states,14 the filings would include information as to whether the state approved the rate increase.
In reality, we found a lack of publicly available data and often inconsistent, inadequate quality of data from rate filings prior to the Affordable Care Act. Since the passage of the Affordable Care Act, we have found improvements in publicly available data in terms of both the availability and quality of rate summaries of filings. These improvements should increase the transparency of health insurance markets, thereby facilitating price competition and efficiency. Table 13 on page 43 includes data on measures that states have implemented following passage of the Affordable Care Act relating to the transparency of premium increase filings.
13 U.S. Government Accountability Office, Private Health Insurance: State Oversight of Premium Rates, July 2011, GA-11-701.
14 States in which the regulator must give approval before a proposed rate change can take effect are referred to as “prior approval” states; they are contrasted with file and use states, some of which may utilize retrospective review. Some states require prior approval only from HMOs, or only from large carriers like BCBS. See Table 1 for more details.
Methods
To build a national database, NORC attempted to collect rate filings submitted by issuers of comprehensive major medical insurance products to state regulators from 2008 to 2011.15 As noted above, to our knowledge, this is the first study that attempts to build a national database of carrier rate filings. As a result, NORC and its subcontractor, NovaRest, an actuarial consulting firm, began the project with assumptions about data quality and completeness and the general feasibility of the data collection effort that turned out to be incorrect.
One incorrect assumption was that carriers filed rate increases with state insurance departments each year in all states in which they conducted business. In reality, however, some states did not require filings or required filings only for certain products. In these states, many insurers did not file. In addition, the NORC team had assumed that filings would be retained over time, and that states would provide access to filings, would not charge high fees to access them, and would not consider filings proprietary information (i.e., containing confidential business information and therefore not publicly available). Finally, we assumed that rate filings would generally include accurate information on product enrollment, MLRs, and the approval or non-approval decision.
NORC’s proposal to ASPE designated Perr & Knight to collect filings by sending its staff to state insurance departments to obtain PDF documents for sampled carrier rate filings for the years 2008-2011. Perr & Knight collects such documents in the property and casualty insurance business for individual carriers as its core business. These carriers contract with Perr & Knight to gather market intelligence on their competitors. As it turns out, Perr & Knight had far less experience in the health insurance market, and was largely unaware of the quality and quantity of health insurance filings at insurance departments.
By spring 2011, it was apparent that many of NORC’s assumptions were wrong. Rather than the estimated 5,000 filings planned for in the proposal, Perr & Knight had gathered 734 filings usable for this project. They also delivered thousands of filings for large group coverage, Medicare Advantage plans, new products, and form filings, all of which fall outside the scope of this project. The following reviews each of the initial assumptions that proved to be erroneous:
- States receive rate filings for all increases to small group and individual market comprehensive major medical products each year – Some states have no requirements that carriers file for rate increases, particularly in the small group market. Prior to the Affordable Care Act, for instance, Illinois and California had no filing requirement in the small group market.16 Some states, such as Michigan and Hawaii, required only HMOs to file.
- State insurance departments retain filings – Most filings in 2008 and 2009 were paper documents. Some states purged their files after a few years. For example, Indiana retains its paper filings for one year. Kansas purges all foreign carriers after one year. In other states, older filings were stored off-site and de facto unavailable to the public. Also, some filings were even missing from states in which the insurance department had prior approval authority.
- States would provide access to files – Some states, such as Tennessee and South Carolina, charge high fees to copy files, thereby rendering their filings essentially inaccessible.17 Mississippi and Massachusetts did not respond to phone calls from Perr & Knight or NORC. See Table 1 for further details.
- States would not consider filings proprietary – Texas regards all rate filings as proprietary business information and thus restricts public access to them. To view filings, one must write to each carrier and request a copy. Carriers have no obligation to provide the document. Connecticut and Maryland still have laws designating filings proprietary and New York only very recently removed this type of proprietary protection.
- Rate filings would include accurate information on premium increases, product enrollment, MLRs, and the approval or non-approval decision – Some rate filing forms had no information on rate increases. Information on product enrollment was sometimes missing or more commonly of poor quality (for example, listing identical enrollment for all plans offered by the carrier). Overall, MLR information was available for only 40.3 percent of filings in the individual market and 36.5 percent in the small group market.
Table 1: Availability of Rate Filings by State, for States Investigated
| State | Filing Requirements, Individual Market | Filing Requirements, Small Group Market | Are Filings Proprietary? | Public Website Available as of 7/2012 | Public Website Prior to ACA Grant |
|---|---|---|---|---|---|
| Alabama | Informational, except HMO | Informational | Yes, until recently | Yes | No |
| Arkansas | Prior approval | No requirement | No | Yes | Rate filings |
| California | File and use | File and use | No | Yes | No |
| Colorado | Prior approval began in 2009 | Prior approval began in 2009 | No | Yes | Summary information online |
| Connecticut | Prior approval | Prior approval | Yes | Yes | Some rate filings |
| Florida | Prior approval | Prior approval | No | Yes | Rate summary and filings |
| Hawaii | Prior approval | Prior approval | No | No | No |
| Illinois | File with form | File and use | No | Rate summary with limited information, through 12/2010 | No |
| Iowa | Prior approval | Prior approval | No | No | No |
| Indiana | Prior approval | File and use | No | Yes | No |
| Idaho | File and use | File and use | No | No | No |
| Kansas | File and use | File and use | No | Yes | No |
| Kentucky | File and use | File and use | No | Yes | No |
| Massachusetts | Prior approval | No requirement | No | No | No |
| Maine | File and use (unless insurer doesn’t reach MLR standards) | File and use | No | Rate summary and some rate filings | Yes |
| Maryland | Prior approval | Prior approval | Yes | No | No |
| Michigan | HMO and BCBS prior approval | HMO and BCBS prior approval | No | Yes, with limited information | Yes, with limited information |
| Minnesota | Prior approval | Prior approval | Yes | Yes | No |
| Mississippi | Informational | Informational | "For review only" | No | No |
| New Jersey | Prior approval | No requirement | No | No | No |
| North Carolina | Prior approval | Prior approval | No | Yes | “Free of confidential information” |
| Nebraska | File and use | File with form | No | Yes | No |
| New York | Prior approval since 2010 | Prior approval since 2010 | Became public in 2012 | Rate summary with limited information | Limited to premium increases |
| Ohio | Prior approval | Prior approval | No | No | No |
| Oklahoma | File with form | File with form | No | Yes | No |
| Oregon | Prior approval | Prior approval | No | Yes | Rate summary |
| Pennsylvania | Prior approval | Prior approval | No | Yes | Notice of most rate increases and rate filings |
| Rhode Island | Prior approval | Prior approval | No | Yes | Yes |
| South Carolina | Prior approval | No requirement | No | No | No |
| South Dakota | File and use | No requirement | No | No | No |
| Texas | File and use | File and use | Yes | No | No |
| Tennessee | Prior approval | Prior approval | No | No | Post rate changes |
| Virginia | Prior approval | Informational | No | Yes | Published proposed rates |
| Washington | Prior approval | Prior approval | No | Yes | No |
| Wisconsin | File and use | File and use | No | Yes | Yes |
Note: Only states in either the original or final sample are listed (see Table 3).
Sources: Public website prior to ACA is based on “Health Insurance Premium Grants: Detailed State by State Summary of Proposed Activities,” http://www.healthcare.gov/news/factsheets/2010/08/rateschart.html; filing requirements based on that source, “Private Health Insurance Premiums and Rate Reviews,” published by the Congressional Research Service, http://healthreform.kff.org/~/media/Files/KHS/docfinder/crs_1112011priva..., as well as other sources.
Together, these erroneous assumptions constitute an important barrier to data availability and quality. To address the study objectives, NORC revised its original methodology. First, we excluded from the analysis Texas, Tennessee, South Carolina, Mississippi, and New York, and added Arkansas, Nebraska, Kentucky, Oklahoma, and Maine. In replacing some states, we substituted states with similar member counts and MLR requirements when possible.
NovaRest and NORC collected data from some states where Perr & Knight had little success. In New Jersey and Minnesota, NovaRest used its personal contacts to obtain information from the state insurance department. In Maryland, with the pledges of confidentiality and privacy, NORC was able to persuade the insurance department to provide rate filings. Although there were multiple sources, public websites represent the largest single source of filings that were included in the national database.Many filings were available for the first time during 2011. States added new filings to these sites intermittently throughout 2011, and NovaRest and NORC revisited these websites on multiple occasions. In addition to rate filings, some states provided summaries of premium increase requests online for a specific period of time. These state summaries included much of the same information included in the filings themselves, but in a different format. Further information on the data made publicly available through state insurance department websites is included in Table 2.
Table 2: Status and Content of State Websites Available, as of July, 2012
| State | In Final Sample | Content on Website |
|---|---|---|
| Alabama | Yes | Rate filings, starting from June 10, 2010. |
| Arkansas | Yes | Rate filings, starting from March 21, 2008. |
| California | Yes | Rate filings from non-HMO plans, starting from mid-2010. |
| Colorado | Yes | Rate summary, starting from January 1, 2008. Rate filings, starting from 2008. |
| Connecticut | Yes | Rate filings, starting from September 2010. |
| District of Columbia | No | Rate filings, starting from the middle of 2010. |
| Delaware | No | Rate summary, starting from the middle of 2010. Rate filings, starting from September 2011. |
| Florida | Yes | Rate summary, starting from 2008 or before. Rate filings by request. |
| Illinois | Yes | Rate summary, excluding enrollment, through 2010. |
| Iowa | Yes | Rate summary, no longer available online. |
| Indiana | Yes | Rate summary, excluding enrollment, for part of 2010. Rate filings starting from May 2010. |
| Kansas | Yes | Rate filings starting from mid-2010. |
| Kentucky | Yes | Rate filings starting from mid-2010. |
| Maine | Yes | Summary of rate increases and MLRs by market. Rate filings starting from June 2010. |
| Michigan | Yes | Filings, mostly form filings rather than rate filings, starting from August 2001. |
| Minnesota | Yes | Most, but not all, rate filings, starting from June 10, 2010. |
| Nebraska | Yes | Rate summary, excluding enrollment. Rate filings starting from April 2011. |
| North Carolina | Yes | Rate filings, starting from January 2000. |
| North Dakota | No | Rate summary, excluding enrollment, for Blue Cross Blue Shield of North Dakota starting from 2001. |
| New Jersey | Yes | Rate filings, starting from 2012. |
| New Mexico | No | Rate summary, starting from January 2011, including 2012 filings. online. |
| Nevada | No | Rate filings starting from August 2010. |
| New York | No | Rate increases, excluding enrollment, starting from July 2010. |
| Oklahoma | Yes | Rate filings starting from June 2010. |
| Oregon | Yes | Rate filings and rate summaries, starting from 2008. |
| Pennsylvania | Yes | Rate filings and rate summaries, starting from 2004, although summaries may be more complete than filings. |
| Rhode Island | Yes | Rate filings and rate summaries, starting from 2010, but may be incomplete. |
| South Carolina | No | Rate increases, including enrollment, starting from 2012. |
| Tennessee | No | Rate filings, starting from June 2010. Rate summaries, excluding enrollment, starting from 2007. |
| Vermont | No | Rate filings starting from January 2012. |
| Virginia | Yes | Most, but not all, rate filings, starting from June 10, 2010. |
| Washington | Yes | Rate filings starting from July 2011. Some additional rate filings from 2010-2011. |
| Wisconsin | Yes | Rate filings starting from 2001 |
Note: Only states with publicly available websites are listed. State website URLs for states in the final sample are provided in Appendix A.
NORC also altered the sampling approach based on the accessibility of the data (see the section on sample selection below). The original sample called for a proportional stratified random sample within the states. Strata were defined by earned premiums relative to other carriers in the state. The approach to selecting states was altered to accommodate replacements for states where NORC could not access data from websites or through other means.
NORC also altered the planned strategy for within-state selection of the carriers whose filings would be used for analysis. The new strategy for sampling carriers within the states called for using rate filings from both a sample of carriers and all of the filings available from the five largest carriers in the state.
15 Comprehensive insurance products aim to protect beneficiaries from the cost of medical, surgical and hospital care. Comprehensive coverage is distinguished from other coverage that may provide coverage for a single type of service. Examples of the latter include hospital indemnity coverage or dental coverage. Other coverage may protect consumers against dread diseases only such as cancer policies. Comprehensive products usually have copayments, coinsurance, and sometimes deductibles, and cover a wide range of acute and chronic conditions. See http://en.wikipedia.org/wiki/Health_insurance.
16 In 2011, California’s Department of Managed Care began requiring carriers to file rates in the small group market.
17 South Carolina charges fees for obtaining copies of filings (which depend on media: $1 per copied page, $5 per megabyte of emailed document, or $45 per batch download onto a USB drive), as well as a $50 per-filing charge for any file that must be retrieved from their archives. Tennessee’s statute allows regulators some discretion in assessing fees, and offers free public access to filings submitted after June 10, 2010, but it is likely that a request for all filings submitted from 2008 through that date would have a significant impact on the cost of data collection.
Sample Selection
This section describes the original sampling strategy and the subsequent adjustments necessary due to the non-availability of usable data in some states.
Selection of States
Using a stratified random sample design, NORC selected the sample states and carriers (Table 3). States were organized into three strata: (1) states with MLR guidelines in 2010, (2) states without MLR guidelines in 2010, and (3) states that do not require carrier filings. Five states (Alaska, Georgia, Missouri, Montana, and Louisiana) were in the third strata and were excluded from the sample.
The remaining states were selected as follows within the two strata (states with and without MLR guidelines):
- In each stratum, determine the share of the total stratum enrollment for the states included.
- In each stratum, order the states from largest to smallest in terms of their share of the total enrollment in the stratum.
- Expect states with a proportion greater than a uniform selection probability (greater than 5% for the first stratum and greater than 10% for the second stratum) to be automatically selected. Those states will be removed from the selection process and the remaining states will be redistributed.
- Choose a random start point and systematically select the remaining states.
Table 3 provides a listing of the final selected states. The inability to download data from Texas, Tennessee, South Carolina, New York, and Mississippi, resulted in their exclusion from the sample. Kentucky, Arkansas, Oklahoma, Maine, and Nebraska replaced the five excluded states.
Table 3: State Sample Design and Selection
| Stratum | State Does Not Require Filings | Established MLR Guidelines as of 2010 | No MLR Guidelines as of 2010 |
|---|---|---|---|
| Initially Selected States in Final Sample | CA, CO, CT, FL, IA, KS, MD, MA, MI, MN, NJ, NC, OH, OR, PA, SD, VA, WA | AL, HI, ID, IL, IN, RI, WI | |
| Initially Selected States Dropped from Final Sample | NY, SC, TN | MS, TX | |
| Initially Excluded States Added to Final Sample | AR, KY, ME, OK | NE | |
| Initially Excluded States not in Final Sample | AK, GA, MO, MT, LA | AZ, DE, NH, NM, ND, UT, VT, WV | DC, NV, WY |
Selection of Carriers within States
The original sampling strategy called for grouping carriers into three strata based on the number of lives each covers per state: (1) 1,000 or more covered lives, (2) 500 to 999 covered lives, and (3) fewer than 500 covered lives. Under the original plan, NORC aimed to select eight carriers for the group market and seven carriers for the individual market per state. Documents from the NAIC were the source of information for state enrollment in the individual and small group markets. In the revised sampling strategy, any of the five largest carriers in the state for which data were available were selected from the first stratum (1,000 or more covered lives), with the remainder selected from the other two strata in proportion to covered lives between the two strata. Carriers from the second two strata were systematically selected following similar rules as for the selection of states.
For generating the desired state-level and national estimates, we also distinguished filings based on the relevant market and type of product. A market is defined to be individual or small group. We identified conversion policies separately, but included them in the individual market for purposes of the analysis. 18 A product is classified as HMO, PPO, or indemnity. 19 We identified high-deductible plans separately when they were in separate rate filings (in which case they are aggregated with PPO plans for the purposes of this analysis). More frequently, premium increases for high-deductible plans were not filed separately. When reported in a separate filing, we included increases in high-deductible plans with the product type alongside which they were filed (HMO, PPO, or indemnity).
18 Authorized by the Health Portability and Patient Protection Act (HIPPA), conversion policies are available to individuals when an individual’s group health insurance policy ends, usually due to termination of employment. The carrier that provided the employer's group insurance plan also provides the conversion policy. Employees may need to apply for COBRA coverage first, and then wait until the coverage period ends before obtaining a conversion policy. Regulations vary from state to state. See http://www.ehow.com/about_5191713_conversion-medical-insurancepolicy_.html.
19 We believe that many carriers offer plans that use an indemnity license, but are actually PPO plans. The Kaiser Family Foundation/Health Research and Educational Trust Employer Health Benefits Survey estimates that indemnity plans constitute about 1 percent of enrollment in the small group market. Data from filings in the small group market suggest a figure that substantially exceeds 1 percent.
Data Collection
NORC contracted with Perr & Knight to conduct site visits to state insurance regulators, copy filings, and produce electronic PDF files for each filing on-site. Perr & Knight downloaded PDFs of the filings onto a NovaRest website. NovaRest was then to extract the relevant data from the filings and enter them into an Excel file.
Although Perr & Knight delivered more than 10,000 PDFs in the first round, NORC discovered that only a small portion of the documents recovered were complete filings matching the criteria for the study.
Many filings identified as rate filings were in fact form filings or factor filings. Also, filings that were identified as small group were often large group. Finally, filings identified as comprehensive sometimes were in fact Medicare Supplemental or limited-benefit policies.
To correct for the low number of filings, we accessed state websites for additional filings and NovaRest contacted state insurance departments where they had reliable and direct contacts. Even after gathering more filings for the sample carriers, the results were disappointing. To gather more relevant and usable filings for our database, we gathered additional filings from carriers outside of the original sample in states where we could access rate filings from state websites. This resulted in 2,809 filings in the database comprised of the 734 filings matching the study criteria originally delivered by Perr & Knight, 1,764 filings downloaded from state websites by NovaRest and NORC, and 311 filings obtained directly from state insurance departments by NovaRest.
Data Preparation
After NORC obtained the rate filings by downloading them from websites or the other means described above, multiple challenges remained. Within the same state, and sometimes within the same carrier, rate filings differ greatly in format. Some were only a few pages long, while others exceeded 100 pages, with some actually thousands of pages long with the useful information hidden somewhere within. Longer documents display actuarial assumptions. A typical product submission will display different plans embedded with a product, each with its own premium level. Plans bundled together in a single filing usually offer the same benefits but have different levels of cost-sharing. Fortunately, more filings in later years were submitted using a consistent format, the System for Electronic Rate and Form Filing (SERFF). Use of this format is becoming increasingly common and will address many of the challenges of building a standardized database derived from heterogeneous source documents.20 All states accept filings submitted using the SERFF system. Table 4 provides a list of states requiring all filings to be submitted through SERFF.
Table 4: Requirements for Filing SERFF Forms, by State
| State | In Final Sample | Required to use SERFF Forms? | Year SERFF Requirement Began |
|---|---|---|---|
| Alabama | Yes | Yes | 2007 |
| Arkansas | Yes | Yes | 2011 |
| California | Yes | No | n/a |
| Colorado | Yes | Yes | 2008 |
| Connecticut | Yes | Yes | 2011 |
| Delaware | No | Yes | 2007 |
| District of Columbia | No | Yes | 2007 |
| Florida | Yes | No | n/a |
| Georgia | No | Yes | 2009 |
| Hawaii | Yes | No | n/a |
| Illinois | Yes | No | n/a |
| Iowa | Yes | Yes | 2007 |
| Indiana | Yes | No | n/a |
| Idaho | Yes | No | n/a |
| Kansas | Yes | Yes | 2009 |
| Kentucky | Yes | No | n/a |
| Massachusetts | No | Yes | 2009 |
| Maine | Yes | Yes | 2009 |
| Maryland | Yes | No | n/a |
| Michigan | Yes | Yes | 2009 |
| Minnesota | Yes | Yes | 2009 |
| Nevada | No | Yes | 2010 |
| New Hampshire | No | Yes | 2008 |
| New Jersey | Yes | Yes | 2010 |
| New Mexico | No | Yes | 2009 |
| North Carolina | Yes | No | n/a |
| Nebraska | Yes | Yes | 2010 |
| Ohio | Yes | Yes | 2009 |
| Oklahoma | Yes | Yes | 2009 |
| Oregon | Yes | No | n/a |
| Pennsylvania | Yes | No | n/a |
| Rhode Island | Yes | Yes | 2007 |
| South Carolina | No | Yes | 2011 |
| South Dakota | Yes | Yes | 2007 |
| Utah | No | Yes | 2007 |
| Vermont | No | Yes | 2009 |
| Virginia | Yes | No | n/a |
| Washington | Yes | Yes | 2009 |
| West Virginia | No | Yes | 2009 |
| Wisconsin | Yes | No | n/a |
Note: Only states either in the final sample or required to use SERFF forms are listed. Source: State SERFF Mandates, http://www.serff.com/index_state_mandates.htm (life, accident, and health requirements only), accessed August 28, 2016.
As the study progressed, NovaRest obtained filings from sampled states and carriers. Filings came in the form of documents copied and converted into PDF by Perr & Knight, electronic filings downloaded from state websites, summary information on filings in a particular time period downloaded from state websites, and filings sent directly by a state insurance department at NovaRest’s request. Table 5 outlines the methods used to obtain filings for each of the states included in our sample.
NovaRest reviewed each of these rate filings and entered data from the filing, including information identifying the carrier, type of product, market, approval policies of the carrier’s state (file and use versus prior approval), target MLR, and other elements relevant to our research questions (see Appendix C for a complete list of data elements extracted from filings). Following this process, NORC staff continued to add to the database based on ongoing additions to filings from 2011. The findings presented in this version of the report are based on all filings entered into the database forwarded to ASPE on July 20th, 2012.
Table 5: Data Collection Methods Employed, by State
| State | Perr & Knight Obtained Physical Filings | NORC Team Direct Contact with Insurance Departments | Public Website with Summary Documents | Public Websites with Filings |
|---|---|---|---|---|
| Alabama | x | x | ||
| Arkansas | x | |||
| California | x | x | ||
| Colorado | x | x | x | |
| Connecticut | x | x | ||
| Florida | x | x | x | |
| Hawaii | x | |||
| Idaho | x | |||
| Illinois | x | |||
| Indiana | x | x | ||
| Iowa | x | x | ||
| Kansas | x | |||
| Kentucky | x | x | ||
| Massachusetts | x | |||
| Maine | x | x | ||
| Maryland | x | |||
| Michigan | x | |||
| Minnesota | x | x | ||
| Nebraska | x | x | ||
| New Jersey | x | |||
| North Carolina | x | |||
| Ohio | x | |||
| Oklahoma | x | x | ||
| Oregon | x | x | x | |
| Pennsylvania | x | x | ||
| Rhode Island | x | x | ||
| South Dakota | x | |||
| Virginia | x | |||
| Washington | x | x | ||
| Wisconsin | x | x |
Note: Only states where filings were collected are listed.
20 SERFF aims to enable carriers to send and states to receive comments on filings including acceptances and rejections of rate and form filings. First developed by the NAIC in the 1990s, 27 states today mandate the use of SERFF in submitting health and life insurance filings to the state insurance department. SERFF provides a standardized format for filings that were historically characterized by a high degree of heterogeneity.
Quality Assurance
The quality of filings was the largest impediment to the completion of the project. Ultimately, it required NORC to review virtually every filing in the database, sometimes with computer algorithms, but often by manually examining each filing. The following lists some major problems encountered in the qualityreview process:
- Insurers may file more than once each year. Possible errors include duplicate filings or misstatements of annualized increases in premiums.
- The “effective date of the premium increase” may sometimes have been listed as occurring prior to the approval date.
- The proposed rate increase was less than the rate increase approved.
- No effective date was included in the rate filing
- For estimated enrollment, the carrier confused the number of members and the number of contracts or labeled the figure ambiguously.
- In state summary websites, some carriers supplied data on the number of contracts, and some supplied data on the number of members in the same field.
- Many carriers provided identical enrollment for different products filed in the same year.
- Carrier filings on enrollment were sometimes highly inconsistent with enrollment figures from the NAIC.
- Some carriers used different company names when filing as health insurance carriers than they did when filing as life and health or property and casualty carriers. However, reported enrollment, premium increase, and MLR information may be identical so there was a question as to whether it was the same plan.
- A larger company may have two subsidiaries selling the same plan under different names. However, in one state, enrollments were separate, and in another they were identical.
With multiple sources of filings (Perr & Knight, state websites, and filings received directly from state insurance departments), duplicate filings often appeared in the database. The task of removing potential duplicates was not trivial. Some states had no assigned state filing number or SERFF filing. When multiple filings were identified, it was necessary to inspect them manually and determine if the seemingly identical filings were in fact different plans. Below we list some different duplicate-filing scenarios that NORC found upon detailed inspection of the database:
- In some states, carriers filed for multiple plans in the same filing. For example, a PPO, indemnity, and HMO plan might be included in one filing.
- Sometimes information in seemingly duplicative filings did not match for all variables.
- . Under the same filing number, one filing was for a grandfathered block of business, with the other filing for a non-grandfathered block of business.
The most intense quality assurance reviews occurred during February-May of 2012. In March 2012, NORC conducted an audit of 100 randomly selected filings, which involved coding the relevant data and comparing the results to NovaRest data for the same filings in the Excel database. Up to 23 data elements per filing were evaluated, and differences were identified and reconciled by reexamining the filings themselves. Most errors in the database were coding errors, although a few were errors of interpretation. The audit found an error rate of 1.56 percent. The subsequent quality review activities should have reduced this error rate.
Imputations
We have not imputed values for item non-response. The weighting mechanism described above does make adjustments for non-responding carriers in any given year. Most important, we have not imputed any values for dependent variables – premium increases or approval by the state regulatory authority.
Weighting
Given the method by which the sample was ultimately obtained, probabilities of selection are not available. However, information upon which to derive survey weights appropriately representing each filing’s relative size is available from the 2010 NAIC (number of member-months by carrier), 2010 MEPS-IC (estimated enrollment distribution by state by product for the small group market), and, in some cases, carrier filings (number of reported members). The individual and conversion markets were combined for weight calculation and are referred to in this discussion as the “individual market”. The final weights represent the contribution to the estimates for each filing.
The weighting is carried out in a multi-step process. The first six steps are carried out at the state by market by year level. The last three steps are carried out at the market by year level. The weighting steps are described following the listing of steps and are numerically highlighted in Tables 6 and 7.
- Initial carrier weights (to reflect the carrier’s relative contribution to the estimates);
- Within-carrier filing adjustments (to adjust for multiple filings by a carrier);
- State-level product adjustments (small group market only) (to adjust for product enrollment distributions);
- Within-carrier enrollment adjustments (to adjust for the relative size of each filing);
- Weight control adjustments (to control the weights to sum to one within a state-year);
- Final state-level weights (for use in deriving state-level estimates);
- National-level adjustments (to adjust for the relative size of each state);
- National-level single-filer adjustments (to control the influence of single-filers within a state);
- Final national-level weights (for use in deriving state-level estimates).
Initial Carrier Weights: The source for the initial carrier weights is the 2010 NAIC. Information on member-months from NAIC was used to assign initial carrier weights to reflect the relative contribution to the estimates by carrier within strata defined by market (individual, small group), year, and state. Initial carrier weights are defined as:
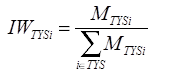
where
MTYSi = number of member-months reported from the 2010 NAIC for sample carrier i reporting in year Y from market type T in state S
Within-Carrier Filing Adjustments: As each carrier may have multiple filings within a market type/year/state, the initial carrier weight must be adjusted to reflect the number of filings within each carrier so as not to over-represent carriers with multiple filings.21 The within-carrier filing adjustment is defined as:
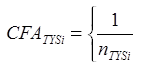
where
nTYSi = number of filings for carrier i from market type T for year Y in state S
State-Level Product Adjustments (small group market only): For the small group market, an adjustment to the survey weights is made so that distributions of the resulting survey weights reflect estimated enrollment distributions from MEPS-IC by state and product. (This information is not available for the individual market.) The sum of the within-carrier filing adjusted weights by product type is adjusted to reflect the MEPS-IC distributions. The product adjustment is defined as:
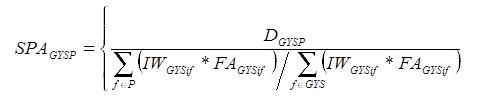
where the sum in the first term of the denominator is across all filings for product type P for which small group filings G22 were obtained for year Y from state S, and the sum in the second term is across all filings for which small group filings were obtained for year Y from state S. This latter term is used to scale the first term to sum to 1.0.
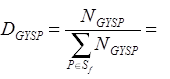 estimated enrollment distribution of the small group market for product type P (relative to product types for which filings were obtained in year Y) within state S from the 2010 MEPS-IC data; f refers to a filing obtained from sample carrier i reporting in year Y from market type G (see footnote 21, infra) in state S
For example, from Table 6 ID=14, the numerator=0.636, the first part of the denominator is the sum of filing adjusted weights for P=Indemnity (0.963690), and the second part of the denominator is the sum of all filing adjusted weights (1.0). The formula then is 0.636 / (0.963690 / 1) = 0.649659, which is Column I in Table 6.
Within-Carrier Enrollment Adjustments: The survey weights are further adjusted to reflect the relative size (if known) of each filing for a carrier. Each filing contained information on either the number of covered members, the number of contracts, both, or neither. Using filings with both the number of covered members and the number of contracts, an estimate of the number of covered members was imputed for those filings with only the number of contracts. The within-carrier product adjustment is defined as:

where
ETYSPif = number of members reported on filing f from individual carrier i for product P from market type T for year Y in state S
nTYSPi = number of filings for carrier i for product P from market type T for year Y in state S
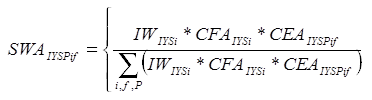
State-Level Weight Adjustments
As the sum of the preliminary survey weights are not constrained to equal 1.0, the weights must by adjusted so as to control the sum of the survey weights to be equal to 1.0.
For the individual market, the state-level weight adjustment is defined as:
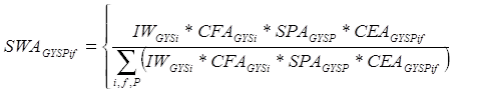
For the small group market, the state-level weight adjustment is defined as:
Final State-Level Weights
The final state-level survey weight for the individual market can thus be defined as the product of the initial carrier weight and the adjustments made for the individual market:
SWIYSPif = IWIYSi *CFAIYSi*CEAIYSPif *SWAIYSPif
The final state-level survey weight for the small group market can thus be defined as the product of the initial carrier weight and the adjustments made for the individual market:
SWGYSPif = IWGYSi * CFAGYSi * SPAGYSP * CEAGYSPif * SWAGYSPif
These final state-level survey weights sum to one with a state/market/year.
National-Level Adjustments
A national adjustment is applied to the final state-level survey weights to reflect the relative sizes across states within a market type (Table 7). The national adjustment is defined as:
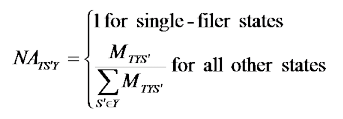
where
S’ = set of sample states for which more than one filing was obtained for year Y
MTS' = number of member-months reported from the 2010 NAIC for all carriers from market type T in state S’
National-Level Single-Filer Adjustments
Given the uncertainty associated with estimates from states with only one filer (resulting from the sensitivity analysis described in Table 8 below) a final adjustment is applied so as to have those single filers included in the estimates but representing only themselves. This is accomplished through separate adjustments being applied to the single filers and all other filers.
The national-level single filer adjustment is defined as:
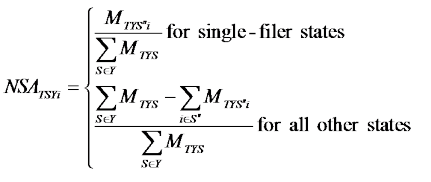
S” = set of sample states for which only one filing was obtained for year Y
MTSY = number of member-months reported from the 2010 NAIC for all carriers from market type T in state S (the set of sample states for which filings were obtained for year Y)
MTS'Yi = number of member-months reported from the 2010 NAIC for sample carrier i reporting in year Y from market type T in state S”
Final National-Level Weights
The final national-level survey weight is then defined as:
NWTYSPif = SWTYSPif * NSATSY * NSATSYi
Table 6: State-Level Weight Calculation for 2011 Alabama Small Group Market
| ID (A | Carrier (B) | Product (C) | Carrier MemberMonths from NAIC (D) | Initial Carrier Weight (E) | Number of Filings within Carrier (F) | WithinCarrier Filing Adjustment Factor (G) | Filing Adjusted Weight | MEPS-IC Distribution (H) | Adjusted MEPS-IC Distribution | State Product Adjustment (I) | Product Adjusted Weight | Enrollment from Filing (J) | WithinCarrier Enrollment Adjustment (K) | Preliminary Weight | State-Level Weight Adjustment (L) | Final StateLevel Weight (M) |
|---|---|---|---|---|---|---|---|---|---|---|---|---|---|---|---|---|
| Total | 3,975,301 | 1.031 | 1.000 | 1.000 | 0.998 | 1.000 | ||||||||||
| 14 | 55433 | Indemnity | 3,830,956 | 0.963690 | 1 | 1 | 0.963690 | 0.314 | 0.636 | 0.649659 | 0.626069 | 24,435 | 1 | 0.626069 | 1.002 | 0.627520 |
| 20 | 79413 | HMO | 119,902 | 0.030162 | 2 | 0.5 | 0.015081 | 0.180 | 0.364 | 17.208278 | 0.259516 | 428 | 1.009259 | 0.257113 | 1.002 | 0.257709 |
| 19 | 79413 | Indemnity | 119,902 | 0.030162 | 2 | 0.5 | 0.015081 | 0.314 | 0.636 | 0.649659 | 0.009797 | 436 | 0.990741 | 0.009888 | 1.002 | 0.009911 |
| 23 | 95322 | HMO | 23,585 | 0.005933 | 1 | 1 | 0.005933 | 0.180 | 0.364 | 17.208278 | 0.102095 | N/A | 1 | 0.102095 | 1.002 | 0.102331 |
| 18 | 95784 | HMO | 858 | 0.000216 | 3 | 0.3333 | 0.000072 | 0.180 | 0.364 | 17.208278 | 0.001238 | 16 | 0.842105 | 0.001043 | 1.002 | 0.001045 |
| 21 | 95784 | HMO | 858 | 0.000216 | 3 | 0.3333 | 0.000072 | 0.180 | 0.364 | 17.208278 | 0.001238 | 22 | 1.157895 | 0.001434 | 1.002 | 0.001437 |
| 22 | 95784 | Indemnity | 858 | 0.000216 | 3 | 0.3333 | 0.000072 | 0.314 | 0.636 | 0.649659 | 0.000047 | 19 | 1.000000 | 0.000047 | 1.002 | 0.000047 |
| N/A | N/A | PPO | N/A | N/A | N/A | N/A | N/A | 0.507 | N/A | N/A | N/A | N/A | N/A | N/A | N/A | N/A |
Table 7: National-Level Weight Calculation for 2011 Small Group Market (Alabama, Single Filer States)
| ID (A) | Carrier (B) | Product (C) | State (D) | Final StateLevel Weight (E) | Carrier MemberMonths from NAIC (F) | State MemberMonths from NAIC (G) | NationalLevel Adjustment (H) | NationalLevel Single File Adjustment (I) | Final NationalLevel Weight (J) |
|---|---|---|---|---|---|---|---|---|---|
| Total | 117,303,294 | ||||||||
| 14 | 55433 | Indemnity | AL | 0.627520 | 3,830,956 | 4,003,034 | 0.035965 | 0.997688 | 0.021414 |
| 20 | 79413 | HMO | AL | 0.009911 | 119,902 | 4,003,034 | 0.035965 | 0.997688 | 0.008794 |
| 19 | 79413 | Indemnity | AL | 0.257709 | 119,902 | 4,003,034 | 0.035965 | 0.997688 | 0.000338 |
| 23 | 95322 | HMO | AL | 0.102331 | 23,585 | 4,003,034 | 0.035965 | 0.997688 | 0.003492 |
| 18 | 95784 | HMO | AL | 0.001045 | 858 | 4,003,034 | 0.035965 | 0.997688 | 0.000036 |
| 21 | 95784 | HMO | AL | 0.001437 | 858 | 4,003,034 | 0.035965 | 0.997688 | 0.000049 |
| 22 | 95784 | Indemnity | AL | 0.000047 | 858 | 4,003,034 | 0.035965 | 0.997688 | 0.000002 |
| (Other multifiling states) | 107,301,971 | ||||||||
| 863 | 49948 | Indemnity | HI | 1 | 1,533,781 | 2,302,815 | 1 | 0.012809 | 0.012809 |
| 1013 | 95839 | HMO | IA | 1 | 6,196 | 2,504,194 | 1 | 0.000051 | 0.000051 |
| 1057 | 60095 | Indemnity | ID | 1 | 507,420 | 1,191,280 | 1 | 0.004183 | 0.004183 |
| Total (multifiling states) | 111,305,005 | ||||||||
As a result of weighting, reported figures represent weighted member-months. When the text reads, hypothetically, “60 percent of carriers in the individual market had their rates approved,” this means that carriers with 60 percent of the weighted member-months in the individual market had their rates approved.
21 While we aggregate conversion filings with those from the individual market for the purposes of analysis, we do not expect these conversion filings to measurably impact the findings as they are few in number (approximately 13% of the individual market sample by count) and they tend to have low enrollments.
22 In this case, G is a constant – the market type T is either small group (G) or individual (I), but the product adjustment is only possible for the small group (G) market type.
Statistical Testing
Statistical testing compared 2011 estimates with previous-year estimates where appropriate. All tests conducted were t-tests with significance determined at the p≤0.05 level. Given that the sample of filings represents a large proportion of the population, variance estimates used in significance testing were adjusted by the finite population correction (FPC) factor. When the proportion of the population in the sample is large, the estimate of the error must be corrected to account for the added precision gained by sampling a larger percentage of the population.
We also conducted an additional set of analyses comparing study dependent variables (such as premium increases) between categories for the same year. For example, we compared premium increases in 2008 for HMO vs. PPO vs. indemnity plans.
Categories include:
- State regulatory authority – prior approval, file and use, HMO review only
- Market concentration – high, medium, low
- Size of carrier – Three largest in the state individual and small group market vs. other carriers
- Type of product – HMO vs. PPO vs. indemnity
Although we conducted statistical testing as to whether differences between categories were significant at p≤.05, we do not show the results in the graphics in order to avoid clutter from additional notations. When differences by category – e.g., HMO vs. PPO – are mentioned in the text, they have met the p<.05 threshold.
Sensitivity Analysis
Due to data shortcomings, the study authors made many decisions regarded as “second best.” Reviewers were concerned about the extent to which findings from the analysis were sensitive to these decisions and specifically those regarding:
- Weighting methods
- Decisions for inclusion of carriers and states in the analysis
Consequently, to determine the effect of different weighting mechanism and inclusion rules, we simulated an extensive set of alternative rules for weighting and inclusion. NORC conducted these simulations in March 2012
Weighting Scenarios
We tested four methods for weighting:
- Original method – NAIC basis with MEPS small group adjustment. This was the original proposed method. Enrollment data from the NAIC was the basis for the initial carrier weights (Table 6, Initial Carrier Weight). MEPS-IC was used to adjust for enrollment distributions by plan type for the small group market as described above (Table 6, MEPS-IC Distribution). We found no comparable data that would allow us to make a similar adjustment for the individual market; hence, we assumed a uniform distribution in that market (i.e., no adjustment was made). This approach made no attempt to adjust weights within carrier on the basis of filing enrollment data.
- Alternative method – Filing enrollment as basis for weights. We used the number of covered lives from filings as the basis for weighting instead of the NAIC data, and no adjustments were made to reflect market differences as in the original method. Results differ significantly from the original method when using this alternative method, primarily due to a large number of observations being excluded due to missing enrollment information (and thus not being able to derive a survey weight). Although the percentage of observations that fell out of the analysis was not large, lost observations were systematic, not random, and distributed non-uniformly across states. States with prior-approval regulations were more likely to have enrollment data. Large carriers were less likely to have enrollment data. HMO plans were more likely to have enrollment information. Thus, this approach would have yielded large non-response bias in the resulting estimates and was therefore rejected.
- Alternative method – Original method with an adjustment based on filing enrollment. We used the number of covered lives from filings where available in the calculation of weights in addition to the original method. Results were similar to the original method. When using this method, not only are MEPS data on enrollment in the small group market used to allocate weights within a carrier’s business in the small group market, but enrollments from the filings are used as a within-carrier adjustment factor when available. Weights in the individual market for a carrier are divided equally among filings and then the adjustment factor based on enrollments from the filings is applied. As this approach comes closest to representing both the population and withincarrier distributions, this is the final method chosen and is fully described above.
- Alternative method – Original method minus the MEPS adjustment. Rather than using MEPS-IC data to distribute enrollment weights within a carrier/year, we assigned equal weights to all plans with filings. This method made little difference in national trends relative to the original method. Given this approach did not yield weights consistent with independent data on product distribution, it was rejected.
- Alternative method – Alternate method 3 with adjustment for PPO. In some states for the small group market, not all products were represented in the filings. Review of the individual filings suggested that carriers may have reported products as indemnity rather than as PPO. Given this potential reporting error, state product adjustments were derived assuming redefining indemnity and PPO filings as indemnity/PPO and deriving the state product adjustments using collapsed indemnity/PPO distributions. Under this approach, weights tended to be larger for indemnity filings, but resulting estimates reflected those obtained from Method 3. Given the similarity of estimates to those from Method 3 and given the lack of information on the true status of filings and the inconsistency in the indemnity/PPO confusion across state, this approach was not used for this analysis.
Methods 1, 3, 4, and 5 are all similar and based on the values shown in Initial Carrier Weight column of Table 6. They differ in the number and types of adjustments made to these weights. Method 3 uses MEP-IC and filing information, while method 4 ignores this information, and Method 5 uses collapsed indemnity/PPO sizes to derive the adjustment. Method 2, on the other hand, uses different information (filings enrollment data versus the NAIC enrollment data) from the other four methods as the basis of the weights. The primary reason for not considering Method 2 is that many observations are lost due to insufficient information in the filings. We opted to use Method 3 fully described above as it used the most information in determining the weights.
Inclusion and Exclusion Scenarios
This study examined differences between measures of interest for 2011 and earlier years for the small group and individual markets at both the state and national level. Because data were sparse in some states, there was concern that: a) some carriers received undue influence in both the state and national statistics for a given year; and b) inconsistency across years in the set of states for which filings were available may have affected study findings. Thus, potential sparse data exclusion rules to address these issues were identified and the impact on state and/or national estimates was determined. Ideally, we would like to include all data so as to provide tabulations that are as complete as possible relative to the avaialable information. Table 8 and the following detail the effects of different exclusion rules and utilizes weights created without a national level single filer adjustment:
- States with just one year of data in specific markets: Here the concern is that states with only one year of filings could adversely affect national level across-year comparions if measures for that state differ largely from the average of measures across the other states. As only one year of state data is available, there are no across-year state level comparisons that could be made. An exclusion rule would be to exclude states with just one year of data for a market.
- With this rule, one state-year (HI 2009) is excluded in the individual market and two stateyears (MA 2011, WI 2011) are excluded in the small group market. In both individual and small group markets, there were no statistically significant changes in premium increases each year, although the estimated national level of the 2011 rate change was 0.7 percentage points lower under this exclusion rule. Given no significant impact on the annual estimates were observed, it was determined not to use this exclusion rule.
- States with just one filing within a market for a given year: Here the concern is two-fold: a) that years with only one filing for a given state could adversely affect state-level comparions between 2011 and earlier years if the carrier submitting the one filing does not appropriately represent the full population of filings for that state-year; and b) the impact of these states adversely affects the national level estimate for the year. An exclusion rule would be to exclude state-years with just one filing for a market.
- With only one filing for a state-year, variance estimates for that state-year cannot be derived and thus this year cannot be compared to other years. Thus the consideration is solely at the national level. With this rule, thirteen state-years (CA 2009, HI 2009, ID 2011, KS 2010, MD 2009, MI 2010, NE 2009, OH 2008, OK 2008, RI 2008, RI 2009, RI 2010, SD 2008) are excluded in the individual and twelve (AL 2009, HI 2011, IA 2008, IA 2011,ID 2008, ID 2011, MN 2009, NE 2010, PA 2009, PA 2010, VA 2009, WA 2009) in the small group market. In the individual market, the estimated national premium increase changes significantly for two of the four years. The majority of these excluded filings are from carriers that constitute a small proportion (<50%) of the total state member-months from the 2010 NAIC. These same filings also tend to have larger premium increases, indicating their inclusion could introduce bias into the national estimates. However, one of the thirteen excluded filings in the individual market and two of the twelve in the small group market are filings for which the carrier constitutes >50% of the state member-months based on the 2010. To make use of all available data but to avoid undue influence of single-filer states, the exclusion rule was modified to include state-years with just one filing for a market but to adjust the weighting methodology so as to allow these single filers to represent only themselves. The estimates from this scenario are shown as 2a in Table 8, and show similar results to those from Option 2. Tests comparing the results for Option 2 and Option 2a found no significant differences (not shown). As this approach accounts for the undue impact of single filers and yet utilizes all the data, this is the scenario chosen for implementation.
- Combination of states with one year of data and states with one filing for the year in a given market: An exclusion rule would be to first exclude state-years with just one filing for a market and then exclude states with just one year of data for a market.
- This rule adds one additional state-year (KS 2009) in the individual market and four additional state-years (IA 2011, MA 2011, NE 2011, WI 2011) to the small group market than that described in scenario #2. The results are similar to scenario #2 for both the individual market and the small group market. In the individual market, two additional filings were excluded beyond those noted in scenario #2. The small group market, however, added 27 additional filings to the exclusion list beyond those noted in scenario #2
- States missing filings in 2008, 2009, 2010, or 2011: As with alternative 1, here the concern is that states with one or more years with missing data could adversely affect national level acrossyear comparions if measures for those states differ largely from the average of measures across the states that have data for every year. Simlar to alternative 1, if data are missing for a year, that year cannot be used for across-year state level comparisons. An exclusion rule would be to exclude states with no filing data in a market for one or more of the three years.
- With this rule seven states (California, Hawaii, Illinois, Kansas, Nebraska, Rhode Island, and South Dakota) in the individual market and nine states (Connecticut, Hawaii, Iowa, Massachusetts, Nebraska, Rhode Island, Virginia, Washington, and Wisconsin) in the small group market are excluded. These exclusions have no significant impact on estimated premium increases in the small group market, but yield significant differences in the individual market for 2009 and 2010. Not surprisingly, the exclusion list of states is similar to those listed in scenarios #2 and # 3, thus producing comparable estimates.
Table 8: Sensitivity Analysis of Average National Level Premium Increase
| Inclusion / Exclusion Scenario | Individual / Conversion 2008 | Individual / Conversion 2009 | Individual / Conversion 2010 | Individual / Conversion 2011† | Small Group 2008 | Small Group 2009 | Small Group 2010 | Small Group 2011† |
|---|---|---|---|---|---|---|---|---|
| Full Database | 10.0% | 11.7% | 13.2% | 8.5% | 11.2% | 10.2% | 8.6% | 6.6% |
| 1. Exclude states with just one year of data in specific markets | 10.0% | 11.7% | 13.2% | 8.5% | 11.2% | 10.2% | 8.6% | 5.9% |
| 2. Exclude states with just one filing | 9.9% | 10.6%* | 11.7%* | 8.7% | 11.3% | 11.3%* | 8.8% | 6.8% |
| 2a. Include states with just one filing, but adjust weighting to allow single filers to represent only themselves | 9.9% | 10.8%* | 11.7%* | 8.6% | 11.2% | 11.2% | 8.8% | 6.7% |
| 3. Exclude both states with one year of data and states with one filing | 9.9% | 10.6%* | 11.7%* | 8.7% | 11.3% | 11.3%* | 8.8% | 6.1% |
| 4. Exclude states with no filings in 2009, 2010, or 2011 | NA | 10.6%* | 12.5%* | 8.7% | NA | 10.5% | 9.2% | 6.2% |
† Data for 2011 are incomplete.
* National level estimate is significantly different from Full Database by year by market at p < .05.
Our decision was to use scenario #2a. We believed that having one filing represent an entire state gave undue weight to one filing and can have an undue effect on national level estimates, but also wanted to include all data in the estimates. Therefore, the weighting methodology was modified to allow single filers to represent only themselves.
State Reporting – In reporting figures for individual states and markets, we do not display figures if filings constitute less than 50 percent of state enrollment for the year. However, all filings are included in the calculation of national figures, including states where enrollment was insufficient for state reporting.
Analysis Methods
We conducted descriptive analyses to address the study research questions. The paper presents national and state-wide results. We examine four-year trends for dependent variables, and analyze variations in dependent variables by selected independent variables. Dependent variables are:
- Premium increases
- Percent of rate increases approved by state regulators
- Percent of premium rate increases modified by state regulators
We present findings separately for the individual insurance and small group markets. Key covariates are:
- State regulatory authority
- Prior approval
- File and use
- HMO review authority only
- Rate review authority
- No requirement for filing
- Product type (HMO, PPO/HDHP, indemnity)
- Carrier size (top three carrier in the state and market, other)
- Market concentration in the individual and small group markets
- High – Largest three carriers in state have 80 or more percent of the market
- Medium – Largest three carriers in state have 50-79 percent of the market
- Low – Largest three carriers in state have less than 50 percent of the market
For state-level estimates, reportability criteria were applied based on the proportion of total state membermonths represented by the filings in each year. We required a minimum proportion of 50 percent to report results. The addition of exclusion scenario #2a added two additional state-years (Nebraska 2009, individual market; Hawaii 2011, small group market). The primary reason for excluding only two additional state-years is that the majority were already considered non-reportable due to insufficient member-months representation. Non-reportable states are listed as N/R in Table 14. Multivariate modeling is beyond the scope of this study.
Findings
Our final database (as of July 20th, 2012) includes a total of 2,809 filings, with 1,923 in the individual market and 886 from the small group market (Table 9). We start our discussion of findings by discussing trends in the volume of filings by year.
Trends in Data Collection
The number of filings nationally for the individual market increased dramatically from 2008 to 2010, and then declined in 2011 (see Table 9), from 365 in 2008, to 540 in 2009, 573 in 2010, and 446 in 2011. In the small group market, filings grew dramatically from 2008 to 2011, from 139 in 2008, to 175 in 2009, 263 in 2010, and 309 in 2011.23 As previously noted, many carriers had not submitted their 2011 filings by the time Perr & Knight visited state insurance departments in the winter and spring of 2011 to photocopy filings. Although NovaRest and NORC did add to the 2011 filings as data became available on state websites, the 2011 data are still incomplete. This is a likely explanation for the decline in filings in the individual market in 2011, which was concentrated in (in order of magnitude) Wisconsin, Illinois, Indiana, Virginia, North Carolina, Ohio, Arkansas, Iowa, and Kentucky.
Table 9: Number of Filings by State and Nationally for Individual and Small Group Markets, 2008-2011
| State | Individual / Conversion 2008 | Individual / Conversion 2009 | Individual / Conversion 2010 | Individual / Conversion 2011† | State | Small group 2008 | Small group 2009 | Small group 2010 | Small group 2011† |
|---|---|---|---|---|---|---|---|---|---|
| TOTAL US | 365 | 540 | 573 | 446 | TOTAL US | 139 | 175 | 263 | 309 |
| AL | . | 2 | 4 | 4 | AL | 2 | 1 | 3 | 7 |
| AR | 13 | 16 | 21 | 9 | AR | . | . | . | . |
| CA | . | 1 | 30 | 19 | CA | . | 4 | 3 | 28 |
| CO | 15 | 27 | 45 | 54 | CO | 15 | 25 | 30 | 26 |
| CT | . | 5 | 6 | 9 | CT | 2 | . | 6 | 2 |
| FL | 42 | 74 | 62 | 72 | FL | 44 | 31 | 52 | 45 |
| HI | . | 1 | . | . | HI | 3 | 2 | . | 1 |
| IA | 56 | 58 | 32 | 21 | IA | 1 | . | . | 1 |
| ID | 8 | 4 | 3 | 1 | ID | 1 | 6 | 2 | 1 |
| IL | 48 | 81 | 32 | . | IL | . | . | . | . |
| IN | 52 | 47 | 29 | 6 | IN | 6 | 10 | 23 | 12 |
| KS | . | 2 | 1 | . | KS | 6 | 8 | 7 | |
| KY | 8 | 2 | 18 | 6 | KY | 9 | 8 | 10 | 14 |
| MA | . | . | . | . | MA | . | . | . | 3 |
| MD | 2 | 1 | 2 | 13 | MD | 5 | 9 | 6 | 8 |
| ME | 3 | 5 | 10 | 8 | ME | . | 2 | 4 | 40 |
| MI | 3 | 3 | 1 | 2 | MI | . | . | . | . |
| MN | 2 | 8 | 11 | 5 | MN | 3 | 1 | 4 | 2 |
| NC | 9 | 18 | 27 | 16 | NC | 8 | 5 | 2 | 16 |
| NE | . | 1 | 3 | 18 | NE | . | . | 1 | 14 |
| NJ | . | 23 | 38 | 54 | NJ | 27 | 32 | 39 | 28 |
| OH | 1 | 3 | 21 | 8 | OH | . | 2 | 15 | 11 |
| OK | 1 | 2 | 4 | 7 | OK | . | . | . | . |
| OR | 20 | 33 | 21 | 26 | OR | 10 | 28 | 20 | 15 |
| PA | 16 | 30 | 24 | 35 | PA | 3 | 1 | 1 | 2 |
| RI | 1 | 2 | 1 | 1 | RI | . | . | 5 | 3 |
| SD | 1 | 5 | 7 | . | SD | . | . | . | . |
| VA | . | 6 | 19 | 2 | VA | . | 1 | 20 | 8 |
| WA | 2 | 7 | 20 | 11 | WA | . | 1 | 9 | 6 |
| WI | 62 | 73 | 81 | 39 | WI | . | . | . | 9 |
† Data for 2011 are incomplete.
Carriers with filings in the database constituted a substantial percentage of the member-months in both the individual and small group market in their state. In the individual market, filings from carriers were 51.1 percent of member-months in 2008, 70.6 percent in 2009, 70.3 percent in 2010, and 63.9 percent in 2011 (Table 10). In the small group market, the percentage of member-months of carriers submitting rate increase filings were 31.2 percent in 2008, 46.1 percent in 2009, 47.8 percent in 2010, and 55.8 percent in 2011.
For the individual market, only one state (Kentucky) had more than 90 percent of its member-months represented in the sample each year. Oregon had 90 percent of its member-months represented for three of four years. Kentucky and Alabama were the only states to have more than 90 percent of membermonths represented in all years in the small group market. Oregon had more than 99 percent of membermonths rated for three of the four study years (Table 10). States with “HMO-only rate approval” tend to have a low percentage of earned premiums in the state with carrier filings. Due to the high concentration of enrollment in the largest plans (generally a Blue Cross/Blue Shield plan), our data for some file and use states such as Alabama represented a very high percentage of enrollments for some years simply because the Blue Cross/Blue Shield plan filed that year.
Table 10: Percentage of Member-Months Included in the Sample, by State and Nationally, in Individual and Small Group Markets
| State | Individual / Conversion 2008 | Individual / Conversion 2009 | Individual / Conversion 2010 | Individual / Conversion 2011† | State | Small Group 2008 | Small Group 2009 | Small Group 2010 | Small Group 2011† |
|---|---|---|---|---|---|---|---|---|---|
| Mean US | 51.1% | 70.6% | 70.3% | 63.9% | Mean US | 31.2% | 46.1% | 47.8% | 55.8% |
| AL | . | **85.7% | **85.7% | **85.9% | AL | **95.7% | **95.7% | **96.3% | **99.3% |
| AR | 1.3% | 11.8% | 10.9% | **81.0% | AR | . | . | . | . |
| CA | . | 7.6% | **91.3% | **100.0% | CA | . | 10.1% | 10.1% | **100.0% |
| CO | 16.9% | 46.1% | **57.8% | **54.8% | CO | 41.8% | **94.5% | **88.8% | **94.0% |
| CT | . | **71.7% | 35.6% | **74.8% | CT | 8.5% | . | **64.3% | 39.0% |
| FL | **67.2% | **67.7% | **78.0% | **64.6% | FL | **65.3% | **70.3% | **72.0% | **55.3% |
| HI | . | 46.8% | . | . | HI | **82.3% | 14.8% | . | 67.5% |
| IA | **91.9% | **89.9% | **84.8% | **87.1% | IA | 0.1% | . | . | 0.3% |
| ID | 37.1% | **71.5% | **72.3% | 33.9% | ID | 42.6% | **87.7% | 43.0% | 42.6% |
| IL | **72.4% | **72.5% | **72.1% | . | IL | . | . | . | . |
| IN | **92.9% | **86.4% | **73.8% | 8.1% | IN | 0.8% | **58.5% | **62.4% | **74.7% |
| KS | . | 19.1% | 0.0% | . | KS | . | 1.5% | 1.4% | 8.8% |
| KY | **94.5% | **94.5% | **94.5% | **95.1% | KY | **90.3% | **95.5% | **90.7% | **95.4% |
| MA | . | . | . | . | MA | . | . | . | 26.5% |
| MD | 1.9% | 3.7% | 27.6% | **72.2% | MD | 6.0% | **61.5% | **77.7% | **68.5% |
| ME | 49.9% | 50.2% | 98.4% | **98.6% | ME | . | 0.0% | 7.5% | **71.4% |
| MI | 1.8% | 1.8% | 0.0% | 1.0% | MI | . | . | . | . |
| MN | 9.6% | **83.3% | **83.4% | **83.3% | MN | 7.1% | 0.4% | **84.4% | **54.8% |
| NC | 9.7% | 12.1% | **84.6% | **89.7% | NC | **63.4% | **63.9% | **63.3% | **69.5% |
| NE | . | 62.7% | **62.8% | **69.5% | NE | . | . | 42.0% | 37.3% |
| NJ | . | **80.9% | **81.8% | **81.8% | NJ | **86.2% | **84.0% | **86.2% | **79.5% |
| OH | 1.8% | 1.8% | 41.8% | 39.2% | OH | . | 6.5% | **66.4% | **68.6% |
| OK | 4.2% | **62.8% | **62.8% | **62.8% | OK | . | . | . | . |
| OR | **83.0% | **99.2% | **96.0% | **89.7% | OR | **65.0% | **100.0% | **99.9% | **99.5% |
| PA | 39.5% | 47.7% | **62.3% | **54.7% | PA | 12.9% | 1.1% | 1.1% | 6.8% |
| RI | 0.5% | 47.8% | 47.3% | 47.3% | RI | . | . | **70.7% | **71.2% |
| SD | 5.1% | **86.3% | **87.6% | . | SD | . | . | . | . |
| VA | . | **73.2% | **77.0% | 0.5% | VA | . | 0.0% | **54.9% | **57.6% |
| WA | 43.2% | 9.7% | **100.0% | **87.2% | WA | . | 13.0% | **71.0% | 24.1% |
| WI | **80.8% | **79.3% | **77.4% | **50.3% | WI | . | . | . | 0.0% |
† Data for 2011 are incomplete.
Note: State estimates highlighted in blue** are reportable. State estimates containing only one filing, no matter its enrollment, are not considered reportable.
Figures 1 and 2 present the percent of national member-months that our filings constitute by state regulatory review authority. Prior approval states accounted for the greatest share of national enrollment from our filings. Thus, in 2011, filings in our database in prior approval states constituted 46.8 percent of the national member-months in the individual market and 34.8 percent in the small group market, whereas filings from file and use states accounted for 15.6 percent of national enrollment.
Figure 1: Percent of National Member-Months for Individual/Conversion Policies Represented by the Sample, by Rate Regulatory Review, by Year
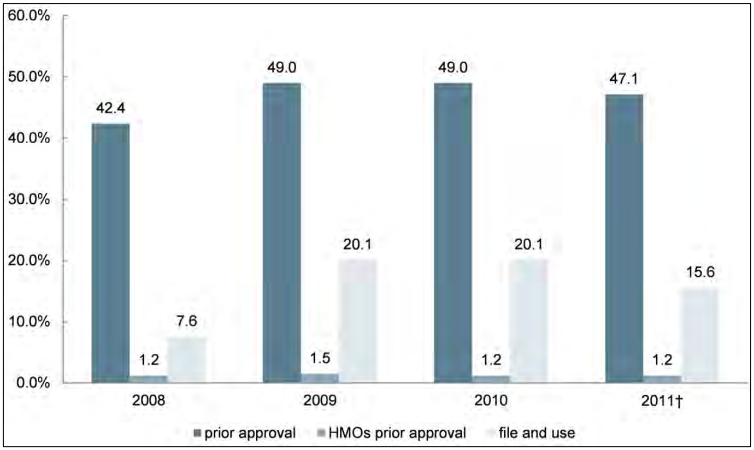
† Data for 2011 are incomplete.
Prior approval – Rates are reviewed for HMO, PPO, and other plans and do not go into effect immediately.
HMO Prior Approval – Rates are reviewed for HMO plans only.
PPO and other plans have file and use requirements only. File and Use – Carriers file rates and the rates go into effect immediately. In some cases, there may be retrospective review.
Figure 2: Percent of National Member-Months for Small Group Coverage Represented by the Sample, by Rate Regulatory Review, by Year
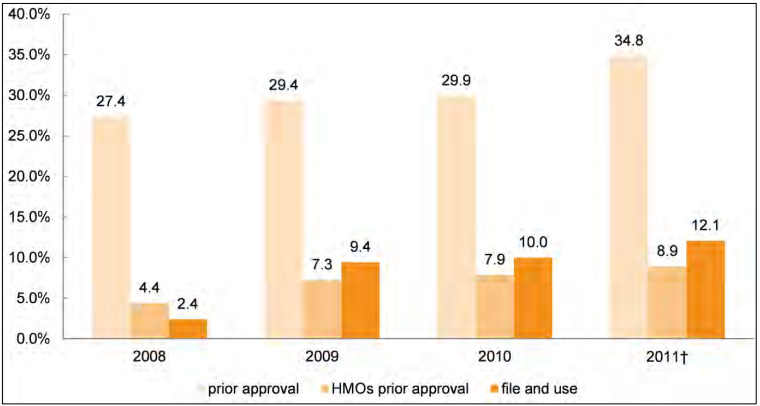
† Data for 2011 are incomplete.
Prior approval – Rates are reviewed for HMO, PPO, and other plans and do not go into effect immediately.
HMO Prior Approval – Rates are reviewed for HMO plans only. PPO and other plans have file and use requirements only.
File and Use – Carriers file rates and the rates go into effect immediately. In some cases, there may be retrospective review.
23 Three filings in the database did not include information on the proposed or approved rate changes – one was disapproved, the second withdrawn, and the third closed. They are included in the database for purposes of tracking the frequency of regulatory approvals, for example, but no values are imputed in analyses of rate increases.
Data on Enrollment from Filings with State Insurance Departments
Over the years included in this study, the percentage of filings including enrollment data grew continuously (Table 11). In the individual market, this percentage increased from 50.1 percent in 2008 to 80.0 percent in 2011. In the small group market, corresponding figures increased from 83.5 percent to 92.9 percent. However, the nature and apparent quality of data were inconsistent throughout the study period, with carriers reporting a mix of contracts held and covered lives, and many reporting identical enrollment figures for different books of business.
Table 11: Number and Percentage of Filings with Enrollment Data, by Market and Year
| 2008 | 2009 | 2010 | 2011† | Total 2008-2011† | |
|---|---|---|---|---|---|
| Number of Filings with Enrollment Data | |||||
| Individual | 183 | 348 | 408 | 357 | 1296 |
| Small Group | 116 | 150 | 227 | 287 | 780 |
| Percentage of Filings with Enrollment Data | |||||
| Individual | 50.1% | 64.4% | 71.2% | 80.0% | 67.4% |
| Small Group | 83.5% | 85.7% | 86.3% | 92.9% | 88.0% |
† Data for 2011 are incomplete.
Availability of Data on Approval Status
Filings submitted through SERFF have several standardized options to indicate their status – in prior approval states, the most common of these are “approved” and “disapproved”, while in file and use states, most are labeled “filed”. In some cases, however, data were ambiguous: some filings from prior approval states are labeled “filed”, and a few filings have non-standard labels including “acknowledged” and “closed”. We believe that, for this former group labeled “filed”, the state regulator may not have issued a final determination, allowing the carrier to implement the rate increase under “deemer” rules. 24 As a result, in assessing the quality of data on filing disposition status, we feel the most meaningful comparison is between filings with a “finalized” disposition – those in prior approval jurisdictions (which includes HMOs in states that only require prior approval for that product type) labeled approved, disapproved, or withdrawn – and those with “incomplete” dispositions.
For the four-year study period in prior approval jurisdictions, 88.7 percent of filings in the individual and 78.8 percent in the small group market provided some information on whether the requested premium increase was approved or not (Table 12). Most filings obtained from state summary tables did not include information on approval status, but their release by state regulators implies that their disposition has been finalized – these filings, from states including Colorado, Maine, and New Jersey, are considered approved. All file and use states are excluded from the table.
Table 12: Number and Percentage of Filings with Finalized Approval Status‡ in Jurisdictions with Regulator Prior Approval, by Market and Year
| 2008 | 2009 | 2010 | 2011† | Total 2008-2011† | |
|---|---|---|---|---|---|
| Number of Filings with Data on Approval Status | |||||
| Individual | 213 | 349 | 365 | 311 | 1238 |
| Small Group | 102 | 130 | 181 | 161 | 574 |
| Percentage of Filings with Data on Approval Status | |||||
| Individual | 86.6% | 93.1% | 87.7% | 86.9% | 88.7% |
| Small Group | 78.5% | 82.3% | 84.6% | 71.2% | 78.8% |
† Data for 2011 are incomplete.
‡ As described above, “finalized approval status” refers to filings which are considered approved, disapproved, or withdrawn by the carrier.
Note: To calculate the percentage of filings, the denominator includes all filings from prior approval states and HMO filings from HMO prior approval states (see Table 1).
24 Some prior approval states have a “deemer” clause. If the state has not acted on the carrier’s rate request, that request goes into effect 30, 60, or 90 days after the insurer files its request, depending upon the state law. In the rate filings, the designated status is usually “closed” or “filed”, but never “deemed”. Some of the rate filings with no disposition may have been settled under “deemer” rules.
Trends in Transparency: Public Websites and Mandatory SERFF Filing
Since passage of the Affordable Care Act in 2010, 23 states have added a public website where interested parties can read either complete rate filings or summaries of rate filings (Table 13). Among the 23 states that launched public websites, nearly all (21) received state grants from DHHS to prepare for the implementation of the Affordable Care Act.
Table 13: Listing of States Adding Public Websites and Mandatory SERFF Filing Following Passage of the Affordable Care Act
| State | Added Public Website Post-ACA | Added Mandatory SERFF filing, 2010-2011 | Received Cycle I Grant | Received Cycle II grant |
|---|---|---|---|---|
| States in Sample | ||||
| Alabama | x | x | ||
| Arkansas | x | x | x | |
| California | x | x | x | |
| Colorado | x | x | ||
| Connecticut | x | x | x | |
| Florida | ||||
| Hawaii | x | x | ||
| Idaho | ||||
| Illinois | x1 | x | x | x |
| Iowa | x2 | |||
| Indiana | x | x | x | |
| Kansas | x | x | ||
| Kentucky | x | x | x | |
| Massachusetts | x | x | ||
| Maine | x | |||
| Maryland | x | x | ||
| Michigan | x | x | ||
| Minnesota | x | x | ||
| New Jersey | x | x | x | |
| North Carolina | x | x | ||
| Nebraska | x | x | x | |
| Ohio | x | x | ||
| Oklahoma | x | |||
| Oregon | x | x | ||
| Pennsylvania | x | x | ||
| Rhode Island | x | x | x | |
| South Dakota | x | x | ||
| Virginia | x | x | ||
| Washington | x | x | ||
| Wisconsin | x | x | x | |
| SUB-TOTAL | 16 | 4 | 25 | 19 |
| States not in Sample | ||||
| Alaska | ||||
| Arizona | x | |||
| Delaware | x | x | ||
| District of Columbia | x | x | x | |
| Georgia | ||||
| Louisiana | x | |||
| Mississippi | x | x | ||
| Missouri | x | |||
| Montana | x | |||
| Nevada | x | x | x | |
| New Hampshire | x | x | ||
| New Mexico | x2 | x | x | |
| New York | x | x | x | |
| North Dakota | x | |||
| South Carolina | x | x | x | |
| Tennessee | x | x | x | |
| Texas | x | |||
| Utah | x | x | ||
| Vermont | x | x | x | |
| West Virginia | x | x | ||
| Wyoming | ||||
| SUB-TOTAL | 7 | 2 | 18 | 10 |
| TOTAL US | 23 | 6 | 43 | 29 |
1 Site not updated
2 Site removed
Twenty-seven states now require carriers to file using SERFF, compared to nine in 2008 (see Table 4). SERFF provides a standard format making it much easier for one to read and collect data from rate filings. Without a standardized format, rate filings may be more than 1,000 pages long, with each filing organized differently. Since 2010, six additional states have mandated the use of SERFF – Arkansas, Connecticut, Nevada, New Jersey, Nebraska, and South Carolina.
Trends in Premium Rate Increases
In this section, we review findings related to trends in premium rate increases.
National Trends: Individual and Small Group Markets
Over the study period, the rate of growth in premiums declined significantly in 2011 in both the individual and small group markets (Figure 3). In the individual market, the average premium increase was 9.9 percent in 2008, 10.8 percent in 2009, 11.7 percent in 2010, and 8.6 percent in 2011. The number of states with statistically significant declines in premium increases from 2010 to 2011 outnumbered those that increased or stayed level by 4:1. In contrast, in 2010, the number of states with statistically significant declines was roughly equal to the number of states with significant increases compared to 2009. In the small group market, premium increases in 2011 were significantly smaller than in prior years.25
Figure 3: Rate of Premium Increase, by Year and Market
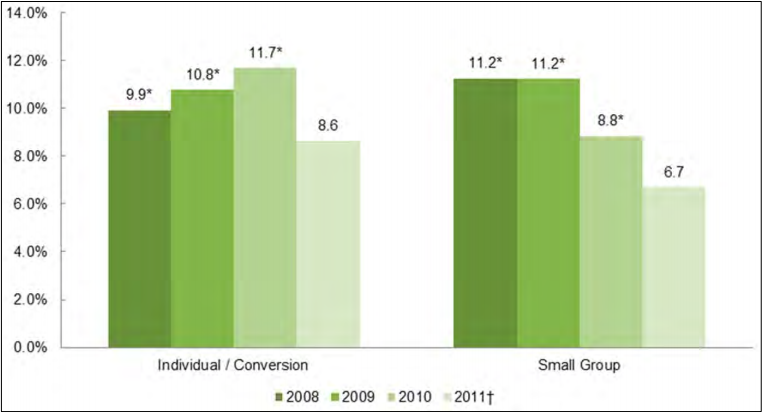
† Data for 2011 are incomplete.
* Estimate is significantly different from 2011 at p < .05.
State-level estimates are reported (Table 14) for all years in which more than 50 percent of membermonths are represented by carriers included in the sample (see Table 10). With smaller sample sizes in individual states one would expect more volatility from year to year at the state level than nationally. However, a number of states had continuous declines or no rise in premium increases from year-to-year. Among these states in the individual market were Alabama, Illinois, Kentucky, Maine, and Minnesota. Premiums increased at double-digit rates in Wisconsin every year, and in Colorado, Nebraska, South Dakota, and Washington in every year for which there were reportable data. Premiums increased at single-digit rates in Kentucky every year, and in Idaho and Pennsylvania in every year for which there were reportable data.
Table 14: Premium Increases in Individual and Small Group Markets, by Year, Nationally and by State, 2008-2011
| State | Individual/ Conversion 2008 | Individual/ Conversion 2009 | Individual/ Conversion 2010 | Individual/ Conversion 2011† | State | Small group 2008 | Small group 2009 | Small group 2010 | Small group 2011† |
|---|---|---|---|---|---|---|---|---|---|
| MEAN US | 9.9%* | 10.8%* | 11.7%* | 8.6% | MEAN US | 11.2%* | 11.2%* | 8.8%* | 6.7% |
| AL | . | 17.5%* | 10.8%* | 9.0% | AL | 9.0%* | 8.9% | 8.7%* | 2.6% |
| AR | N/R | N/R | N/R | 7.2% | AR | . | . | . | . |
| CA | . | N/R | 15.7%* | 7.3% | CA | . | N/R | N/R | 8.0% |
| CO | N/R | N/R | 16.4%* | 10.9% | CO | N/R | 4.9%* | 8.0%* | 3.8% |
| CT | . | 20.1%* | N/R | 8.2% | CT | N/R | . | 16.1%* | N/R |
| FL | 8.2%* | 8.9% | 13.6%* | 9.6% | FL | 17.7%* | 13.3%* | 11.6%* | 5.0% |
| HI | . | N/R | . | . | HI | 8.7% | N/R | . | N/R |
| IA | 2.8%* | 7.3%* | 18.4%* | 10.1% | IA | N/R | . | . | N/R |
| ID | N/R | 6.9% | 3.0% | N/R | ID | N/R | 2.8% | N/R | N/R |
| IL | 14.4% | 10.4% | 9.6% | . | IL | . | . | . | . |
| IN | 13.5% | 15.1% | 8.2% | N/R | IN | N/R | 20.1%* | (1.2)% | 1.7% |
| KS | . | N/R | N/R | . | KS | . | N/R | N/R | N/R |
| KY | 8.1%* | 7.1%* | 5.5%* | 2.8% | KY | (0.4)%* | 3.7%* | 5.4% | 6.1% |
| MA | . | . | . | . | MA | . | . | . | N/R |
| MD | N/R | N/R | N/R | N/R | MD | 1.6% | 12.4% | 0.7% | . |
| ME | N/R | 11.0%* | 11.1%* | 5.2% | ME | . | N/R | N/R | 16.5% |
| MI | N/R | N/R | N/R | N/R | MI | . | . | . | . |
| MN | N/R | 10.7%* | 7.4% | 7.3% | MN | N/R | N/R | 2.6% | (0.3)% |
| NC | N/R | N/R | 11.6%* | 5.2% | NC | 33.7% | 9.8% | 15.7% | . |
| NE | . | N/R | 21.8%* | 10.1% | NE | . | . | N/R | N/R |
| NJ | . | 4.1%* | 10.8%* | 12.7% | NJ | 14.3% | 18.8%* | 20.6%* | 14.5% |
| OH | N/R | N/R | N/R | N/R | OH | . | N/R | 5.6%* | (0.4)% |
| OK | N/R | 8.2% | 13.0%* | 9.9% | OK | . | . | . | . |
| OR | 12.2%* | 15.2%* | 14.9%* | 9.0% | OR | 4.7% | 6.1% | 12.7%* | 6.0% |
| PA | N/R | N/R | 9.0%* | 6.9% | PA | N/R | N/R | N/R | N/R |
| RI | N/R | N/R | N/R | . | RI | . | . | 1.3%* | 11.6% |
| SD | N/R | 14.1% | 16.2% | . | SD | . | . | . | . |
| VA | . | 13.8% | 8.9% | . | VA | . | N/R | 0.0% | 0.3% |
| WA | N/R | N/R | 12.8%* | 11.2% | WA | . | N/R | 4.2% | N/R |
| WI | 14.7%* | 11.1% | 14.0%* | 11.8% | WI | . | . | . | N/R |
† Data for 2011 are incomplete.
* Estimate is significantly different from 2011 at p < .05.
Note: Some estimates are not reportable (N/R) because the proportion of state member months is less than 50%. The mean US figure is a weighted average.
In the small group market, average premium increases steadily declined from 2008 to 2011. Premium increases were 11.2 percent in 2008, 11.2 percent in 2009, 8.8 percent in 2010, and 6.7 percent in 2011 (see Figure 3), with these trends varying significantly by state. In New Jersey, for instance, premiums increased at double-digit rates each year (see Table 14). The rate of premium increase in Alabama and Florida declined each year. Other states had low overall premium increases, with Alabama and Kentucky seeing rate increases in the single digits each year, and Colorado and Oregon seeing single-digit rate increases in three of the four years.
25 Other studies on premium increases in the small group market include the Kaiser Family Foundation/Health Research and Educational Trust Employer Health Benefits Survey. In comparison to that study, our analyses exclude self-insured firms; define the small group market as firms from 3-49 employees, whereas they aggregate firms with 3-199 employees as “small firms”; and consider the “model” price submitted by carriers to state regulators, rather than the actual prices charged to employers, which may include regional, occupational, and other risk-factor-based adjustments. Estimating the net effects of these differences is outside the scope of this project.
Trends for Prior Approval States and Other States
The analysis showed a clear relationship between rates of premium increases in the individual market in file and use states compared to prior approval states (Figure 4). Premium increases were significantly higher in file and use states in 2008, 2009, and 2010 but significantly lower in 2011. Years and regulatory categories with inadequate sample sizes were omitted, so comparisons to states that require prior approval only for HMO plans are generally not feasible, and the rate of increase for 2011 is not significantly different from prior approval states. While average premium increases remained relatively steady between 2008 and 2011 for prior approval states, increases in file and use states fell dramatically in 2011 – from 12.9 percent to 8.1 percent.
Figure 4: Rates of Premium Increase, by Year, by Rate Regulatory Review - Individual/Conversion
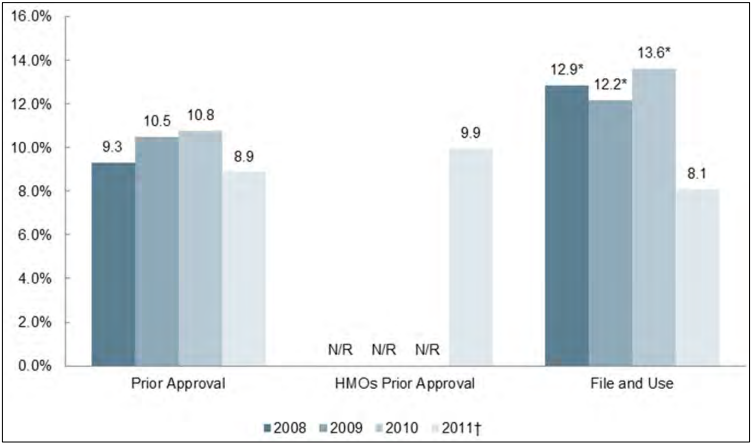
† Data for 2011 are incomplete.
* Estimate is significantly different from prior approval at p < .05.
Note: Entries with fewer than five filings are not reported (N/R).
Prior approval – Rates are reviewed for HMO, PPO, and other plans and do not go into effect immediately.
HMO Prior Approval – Rates are reviewed for HMO plans only. PPO and other plans have file and use requirements only.
File and Use – Carriers file rates and the rates go into effect immediately. In some cases, there may be retrospective review.
In the small group market, there were a limited number of filings in the file and use states, so figures for 2008 cannot be reported (Figure 5). Premium increases in file and use states were significantly lower than prior approval states in 2009, 2010, and 2011. There were likewise a small number of filings from states that require prior approval only for HMO plans – while there were enough to satisfy the minimum threshold for sample size, estimates have a wide confidence interval. Rates of increase were significantly lower in HMO prior approval states in 2010 and 2011.
Figure 5: Rates of Premium Increases, by Year, by Rate Regulatory Review - Small Group
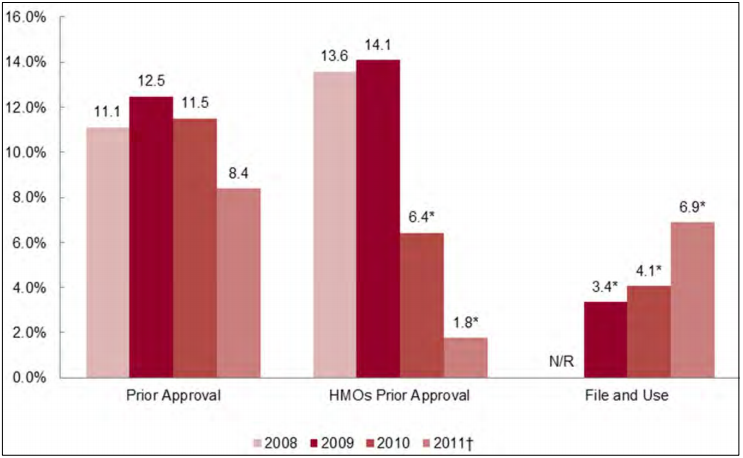
† Data for 2011 are incomplete.
* Estimate is significantly different from prior approval at p < .05.
Note: Entries with fewer than five filings are not reported (N/R).
Prior approval – Rates are reviewed for HMO, PPO, and other plans and do not go into effect immediately.
HMO Prior Approval – Rates are reviewed for HMO plans only. PPO and other plans have file and use requirements only.
File and Use – Carriers file rates and the rates go into effect immediately. In some cases, there may be retrospective review.
The lower rates of increase in file and use states could be due to factors outside the scope of this study, and merit further inquiry. Loss-ratio data in 2009 from the NAIC indicate that MLRs were higher in prior approval states, averaging 0.85, compared to those in file and use and “HMO-only” approval states (average of 0.78).26 One hypothesis is that subsequent premium increases after passage in non-prior approval states were lower to abide by the 80 percent threshold requirement. If MLRs were below 80 percent, and premium increases were sizable, carriers would have to send rebates to policyholders. MLR data from the filings collected for this project are insufficient to verify this explanation. We note that in states where medical inflation was above the national average, or carriers fared poorly in negotiating payment rates with hospitals and doctors, high premium increases may not lead to loss ratios that are below the 0.80 threshold.
26 Authors calculations from J. Abraham and P. Karaca-Mandic, “Regulating the Medical Loss Ratio: Implications for the Individual Market,” The American Journal of Managed Care, 2011; 17 (3): 213-215.
Trends by Product Type
The pattern of premium increases in the individual or small group market differed by product type. 27 In the individual market, PPO and indemnity plans saw double-digit rate increases for at least two of the four years in the sample (Figure 6). Cumulative increases in premiums from 2008-2011 were approximately 12 percentage points lower for HMO plans than for PPO or indemnity plans (Table 15).
Table 15: Cumulative Rate Increases, by Product Type, by Market
| Characteristic | Starting index=100 | 2008 increase | 2009 increase | 2010 increase | 2011† increase | Cumulative Increase |
|---|---|---|---|---|---|---|
| Individual/ conversion | ||||||
| HMO | 100 | 6.9% | 9.1% | 9.8% | 7.1% | 137.2* |
| PPO/HDP | 100 | 9.9 | 12.3 | 12.3 | 7.7 | 149.4 |
| Indemnity | 100 | 11.2 | 9.9 | 11.1 | 10.9 | 150.4 |
| All plans | 100 | 9.9% | 10.8% | 11.7% | 8.6% | 147.6 |
| Small group | ||||||
| HMO | 100 | 7.2 | 10.8 | 10.5 | 8.3 | 142.2 |
| PPO/HDP | 100 | 14.4 | 11.7 | 8.0 | 5.7 | 145.8 |
| Indemnity | 100 | 12.7 | 9.5 | 9.6 | 5.1 | 142.2 |
| All plans | 100 | 11.2% | 11.2% | 8.8% | 6.7% | 143.6 |
† Data from 2011 are incomplete.
* Estimate is significantly different from PPO/HDP at p < .05.
Figure 6: Rates of Premium Increase, by Year, by Product Type - Individual/Conversion
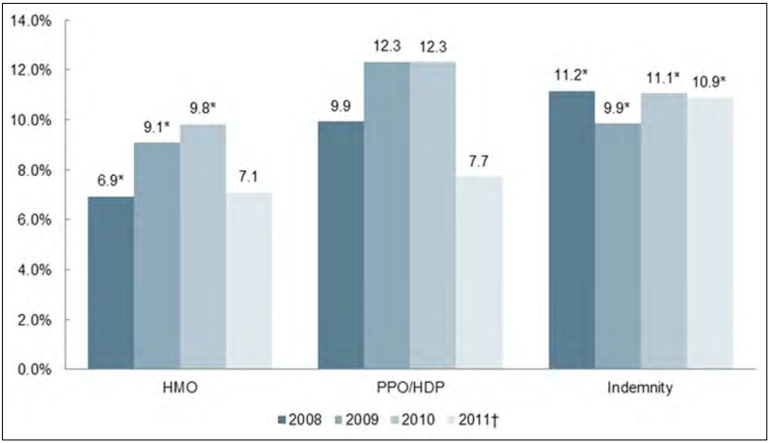
† Data for 2011 are incomplete.
* Estimate is significantly different from PPO/HDP at p < .05.
In the small group market, premium increases declined significantly from 2010 to 2011 for HMO and PPO plans (Figure 7). Premium increases in PPO and indemnity plans declined over all four years and premium increases in HMO plans declined from 2009 to 2011. Cumulative increases over the four-year study period were not significantly different between the plan types (see Table 15).
Figure 7: Rates of Premium Increase, by Year, by Product Type - Small Group
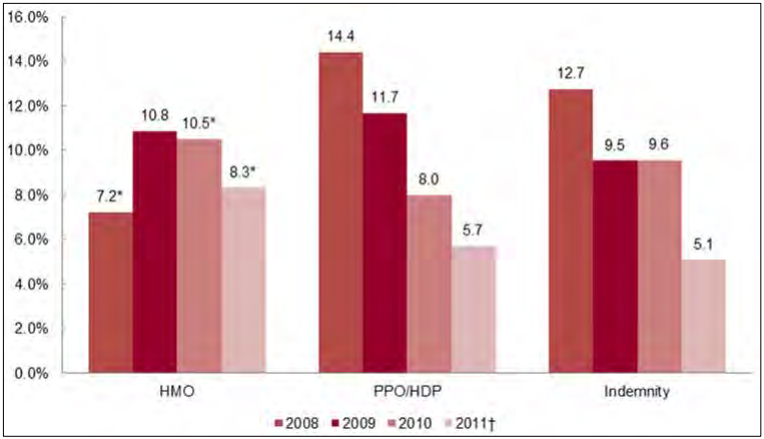
† Data for 2011 are incomplete.
* Estimate is significantly different from PPO/HDP at p < .05.
27 We believe that many plans that filed as indemnity plans are actually PPO plans with an indemnity license given that The Kaiser Family Foundation/Health Research and Educational Trust Employer Benefits Survey estimates indemnity market share in the employer-based market at 1 percent.
Relationships of Carrier Size, Market Concentration, and Premium Increases
In the individual market, large carriers (the three largest in the state’s individual market) had greater premium increases in 2008 than other carriers and smaller premium increases in 2009 and 2010 (Figure 8). Over the four study years, cumulative premium increases were comparable between large carriers and other carriers (Table 16).
Table 16: Cumulative Rate Increases, by Carrier Size, by Market
| Characteristic | Starting index=100 | 2008 increase | 2009 increase | 2010 increase | 2011† increase | Cumulative Increase |
|---|---|---|---|---|---|---|
| Individual/ conversion | ||||||
| Top 3 Carrier | 100 | 11.3% | 10.0% | 11.4% | 8.6% | 147.9 |
| Other Carrier | 100 | 7.5 | 12.6 | 13.2 | 8.9 | 149.1 |
| All plans | 100 | 9.9% | 10.8% | 11.7% | 8.6% | 147.6 |
| Small group | ||||||
| Top 3 Carrier | 100 | 9.2 | 12.6 | 8.9 | 4.3 | 139.6 |
| Other Carrier | 100 | 14.4 | 9.4 | 8.7 | 10.5 | 150.3* |
| All plans | 100 | 11.2% | 11.2% | 8.8% | 6.7% | 143.6 |
† Data from 2011 are incomplete.
* Estimate is significantly different from Top 3 Carrier at p < .05.
In the small group market, large carriers had significantly smaller premium increases for two of the four years, with 2009 showing the opposite difference (Figure 9). Over the four study years, the cumulative increase for “other” carriers was about 10 percentage points higher than for top three carriers (Table 16).
Figure 8: Rates of Premium Increase, by Year, by Carrier Size - Individual/Conversion
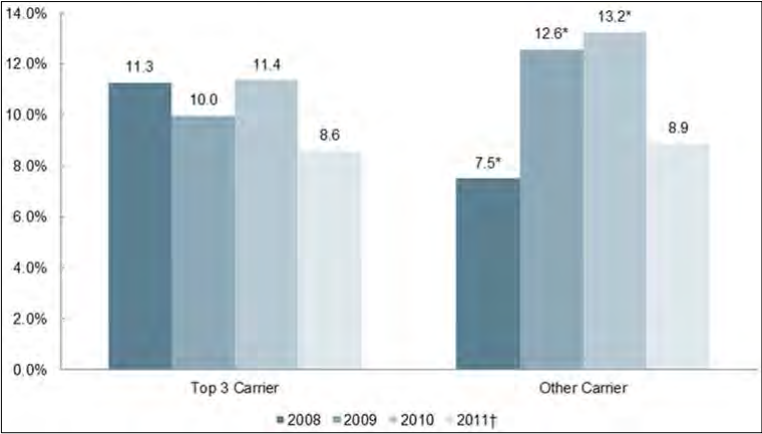
† Data for 2011 are incomplete.
Estimate is significantly different from Top 3 Carriers at p < .05.
Figure 9: Rates of Premium Increase, by Year, by Carrier Size - Small Group
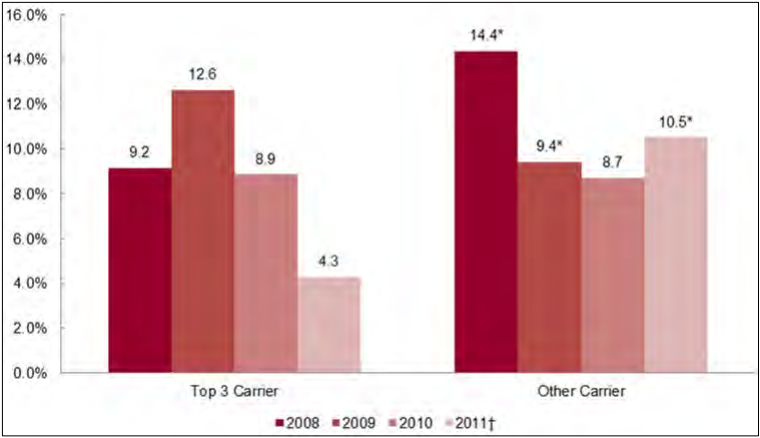
† Data for 2011 are incomplete.
* Estimate is different from Top 3 Carriers at p < .05.
Market concentration did not have a straightforward association with premium trends in a simple two-way analysis. In the individual market, states with medium market concentration – defined as the largest carrier accounting for 50-79 percent of the market’s member-months – had significantly higher premium increases than both states with high-concentration and low-concentration markets for 2008 and 2011, and higher premium increases than states with low-concentration markets for 2009 and 2010 (Figure 10). Appendix B provides data for each state in the nation on the level of market concentration for the individual and small group markets including its concentration classification. Low, medium, and high concentration markets all had significantly lower premium increases from 2010 to 2011. In the individual market over the four-year study period, premium increases for carriers in medium concentration states increased eight percentage points more than in states with low market concentration, and 11 percentage points more than in high market concentration states (Table 17).
Table 17: Cumulative Rate Increases, by Market Concentration, by Market
| Characteristic | Starting index=100 | 2008 increase | 2009 increase | 2010 increase | 2011† increase | Cumulative Increase |
|---|---|---|---|---|---|---|
| Individual/ conversion | ||||||
| Low Market Concentration | 100 | 9.6% | 10.2% | 10.9% | 8.6% | 147.9 |
| Medium Market Concentration | 100 | 11.5 | 11.5 | 12.4 | 9.6 | 149.1 |
| High Market Concentration | 100 | 8.2 | 10.6 | 11.8 | 6.5 | |
| All plans | 100 | 9.9% | 10.8% | 11.7% | 8.6% | 147.6 |
| Small group | ||||||
| Low Market Concentration | 100 | 10.2 | 11.1 | 9.3 | 7.1 | 139.6 |
| Medium Market Concentration | 100 | 14.5 | 11.8 | 7.4 | 4.7 | 150.3* |
| High Market Concentration | 100 | N/R | N/R | N/R | 2.6 | |
| All plans | 100 | 11.2% | 11.2% | 8.8% | 6.7% | 143.6 |
† Data from 2011 are incomplete.
* Estimate is significantly different from Medium Market Concentration at p < .05. Note: Entries with fewer than five filings are not reported (N/R).
Figure 10: Rates of Premium Increase, by Year, by Market Concentration - Individual/Conversion
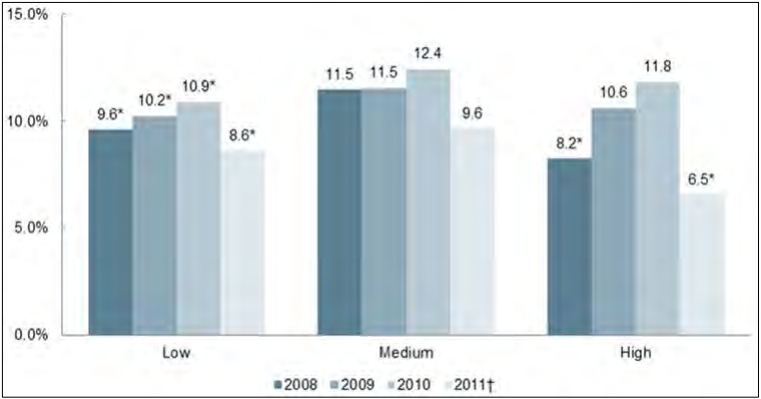
† Data for 2011 are incomplete.
* Estimate is different from Medium Market Concentration at p < .05. Note: Entries with fewer than five filings are not reported (N/R).
In the small group market, there were an inadequate number of carrier filings from states with high market concentration to allow for reporting (Figure 11), while small sample sizes from the medium concentration states produced wide confidence intervals. States with medium concentration had significantly lower premium increases in 2011 when compared with low concentration states, with cumulative premium increases comparable between medium concentration states and low concentration states.
Figure 11: Rates of Premium Increase, by Year, by Market Concentration - Small Group
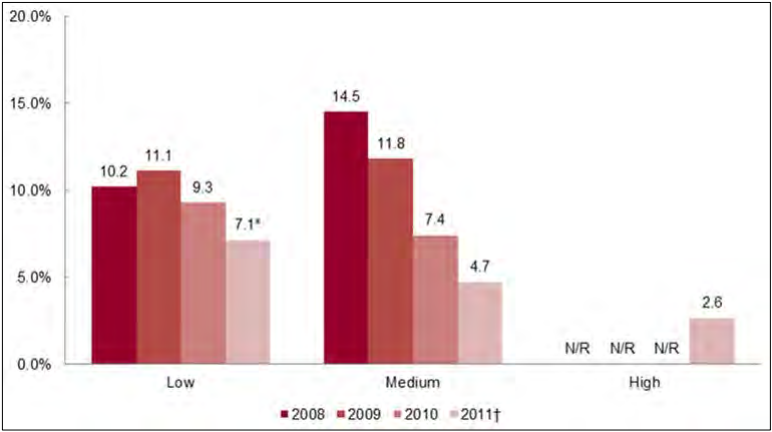
† Data for 2011 are incomplete.
* Estimate is significantly different from Medium Market Concentration at p < .05. Note: Entries with fewer than five filings are not reported (N/R).
Approval Rates of State Regulators
Many filings in prior approval states record both the carrier’s initial proposed rate increase and the increase ultimately enacted. In most cases proposed rate increases were approved without modification by the state’s regulatory agency. For the purposes of these analyses, rate increases that were approved with or without modification are considered ‘approved,’ while those that were denied or withdrawn by the carrier are not. All filings in file and use states that were not denied on retrospective review or withdrawn are considered ‘approved’ for the purposes of our analysis of approval rates (but not for rate modifications, as described below).
In 2011, the percentage of rate requests that were approved declined, particularly in the small group market, suggesting that regulators became more aggressive in their reviews from 2010-2011. In 2008, regulators approved 76.9 percent of proposed rate increases in the individual market (Figure 12). Corresponding figures for subsequent years were 79.3 percent in 2009, 83.1 percent in 2010, and 74.8 percent in 2011. In the small group market, 84.4 percent of requested rate increases were approved in 2008, versus 64.0 percent in 2009, 68.6 percent in 2010, and 69.7 percent in 2011. While multivariate analyses were not conducted for this study, the lower rates of approval for the latter years in the small group market is consistent with year-to-year changes in the composition of the sample, or with increased regulatory scrutiny of proposed rates. Further work is needed in this area to draw a substantive conclusion about these trends and their underlying causes.
Figure 12: Percentage of Premium Increases Approved, by Year and Market
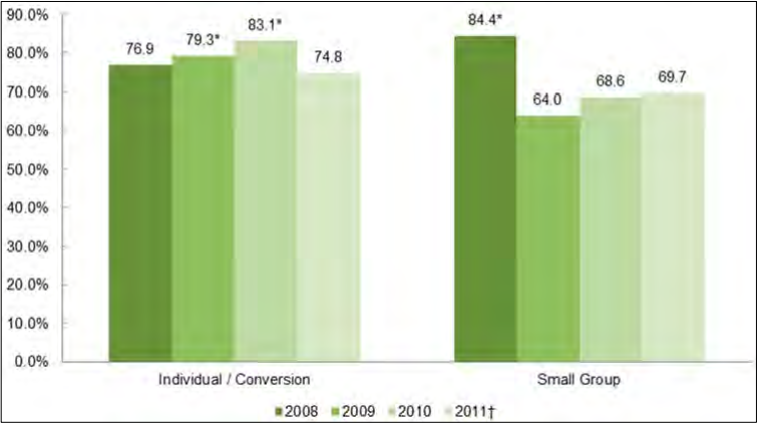
† Data for 2011 are incomplete.
* Estimate is significantly different from 2011 at p < .05.
Note: Percentage is calculated as a share of filings for which the regulatory disposition was known. Filings from file and use jurisdictions are considered approved.
We also analyzed the proportion of filings approved without modification as compared with those changed as a result of interactions with state regulatory agencies (Table 18). This analysis is based on a subset of 1,741 filings that list both a proposed and an approved rate, which differs slightly from the criteria used above. There are several possible explanations for this discrepancy. Filings that were disapproved by regulators or withdrawn list a proposed rate, but not an implemented rate.28 In many cases, filings obtained from state summary documents did not contain a proposed rate, but in being publicly released by the state are implied to have been approved. Conversely, some filings from file and use states did not include enough information to give us confidence that the rate was not changed through retrospective review. As a result, discussion of modified rates is limited to the subset of filings for which review is known.
For most of these filings, the regulator approved the initial proposed rate. In the individual market, the percentage of filings modified increased from 13.7 percent in 2008 to 20.6 percent in 2011. In the small group market, corresponding modification rose from 2.0 percent in 2008 to 10.4 percent in 2011. Seventeen states modified at least one proposed rate increase. States with more known rate modifications include Iowa with 55, all in the individual market; Oregon with 45 in the individual market and 13 in small group; and Pennsylvania with 44 in the individual market and 2 in small group.
Table 18: Number and Percentage of Filings with Known Premium Increase Modifications, by Year and Market
| 2008 | 2009 | 2010 | 2011† | Total | |
|---|---|---|---|---|---|
| Number of Filings with Premium Increase Modifications | |||||
| Individual | 32 | 61 | 85 | 63 | 241 |
| Small Group | 1 | 0 | 13 | 14 | 28 |
| All | 33 | 61 | 98 | 77 | 269 |
| Percentage of Filings with Premium Increase Modifications, as a % of all reviews | |||||
| Individual | 13.7% | 14.2% | 20.9% | 20.6% | 17.5% |
| Small Group | 2.0% | 0.0% | 10.0% | 10.4% | 7.1% |
† Data for 2011 are incomplete.
The quality of the data poses a significant barrier to straightforward analysis of the impact of these modifications on state- and national-level estimates of premium increases. For example, in the individual market in 2011, the 445 total collected filings include 415 listing a proposed rate and 329 listing an approved rate; of those, only 299 include both.29 Direct comparison of the mean proposed rate among the 415 and the mean approved rate among the 329 would, if anything, obscure the effects of the rate review process by diluting the pool of filings with a known review with 146 filings with incomplete information. It is likely that these incomplete filings are missing information for systematic (non-random) reasons, and thus we would urge caution in applying these findings, particularly the estimated rates.
The results of comparing proposed rates with approved rates among filings including both are illustrated below in Figures 13 and 14. In the individual market, rate modification had a significant effect through the years 2009 – 2011, including a reduction of 1.9 percent in both 2010 and 2011. Potential reductions also appeared to occur in the small group market, but small sample sizes and low numbers of known modified rates resulted in wide confidence intervals for the estimates.
Figure 13: Rates of Premium Increases Among Filings with Complete Rate Information, Proposed and Approved, by Year - Individual/Conversion
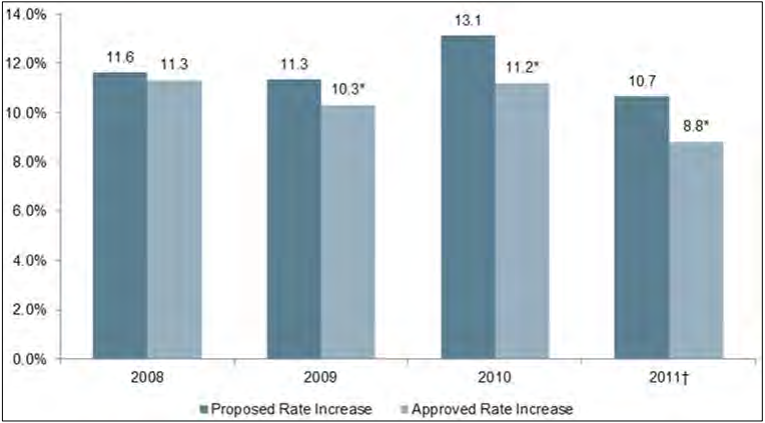
† Data for 2011 are incomplete.
* Estimate is significantly different from Proposed Rate Increase at p < .05.
Figure 14: Rates of Premium Increases Among Filings with Complete Rate Information, Proposed and Approved, by Year - Small Group
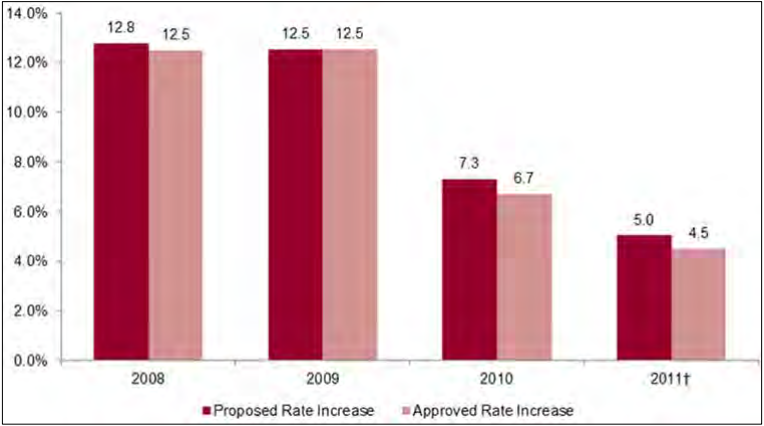
† Data for 2011 are incomplete.
* Estimate is significantly different from Proposed Rate Increase at p < .05.
One caution that applies to both markets is that state procedures for archiving disapproved or withdrawn filings are inconsistent. In some states, files on proposed rate increases that are rejected by the regulator are kept open until a compromise rate increase can be arrived at; in others, the carrier appears to re-file at a later date under a separate tracking number. Furthermore, just as document retention problems may have affected data from earlier study years, it is unclear whether disapproved or withdrawn filings were made available (either to Perr & Knight employees or on public websites) to the same extent as approved rate increases. The effects of premium increase modification on state-level estimates (for filings with complete rate information) for the individual and small group markets are shown below (Tables 19 and 20).
Table 19: Rates of Premium Increases Among Filings with Complete Rate Information, Proposed and Approved, by State and Nationally for the Individual Market, 2008-2011
| State | Individual/ Conversion 2008 Prop | Individual/ Conversion 2008 App | Individual/ Conversion 2009 Prop | ndividual/ Conversion 2009 App | Individual/ Conversion 2010 Prop | Individual/ Conversion 2010 App | Individual/ Conversion 2011† Prop | Individual/ Conversion 2011† App |
|---|---|---|---|---|---|---|---|---|
| AL | . | . | . | . | 9.2% | 9.2% | . | . |
| AR | N/R | N/R | N/R | N/R | N/R | N/R | 10.0% | 7.2% |
| CA | . | . | . | . | . | . | . | . |
| CO | N/R | N/R | N/R | N/R | 16.4% | 16.4% | 10.9% | 10.9% |
| CT | . | . | 20.1% | 20.1% | N/R | N/R | 11.5% | 8.2% |
| FL | 11.4% | 11.4% | 8.9% | 8.8% | ‡12.5% | ‡12.4% | 10.1% | 9.9% |
| HI | . | . | . | . | . | . | . | . |
| IA | 2.9% | 2.8% | 7.6% | 7.3% | 19.6% | 18.4% | 11.6% | 10.2% |
| ID | . | . | . | . | . | . | . | . |
| IL | 14.4% | 14.4% | 10.4% | 10.4% | 9.6% | 9.6% | . | . |
| IN | 13.5% | 13.5% | 15.1% | 15.1% | 10.7% | 8.2% | N/R | N/R |
| KS | . | . | . | . | . | . | . | . |
| KY | 8.9% | 8.1% | 7.1% | 7.1% | 5.5% | 5.5% | 2.8% | 2.8% |
| MA | . | . | . | . | . | . | . | . |
| MD | . | . | . | . | . | . | . | . |
| ME | N/R | N/R | 18.5% | 11.0% | 15.6% | 11.1% | 7.5% | 5.2% |
| MI | N/R | N/R | N/R | N/R | N/R | N/R | N/R | N/R |
| MN | N/R | N/R | 10.7% | 10.7% | 7.2% | 7.2% | 7.3% | 7.3% |
| NC | N/R | N/R | N/R | N/R | 13.9% | 11.6% | 6.2% | 4.9% |
| NE | . | . | . | . | 21.8% | 21.8% | 15.9% | 15.0% |
| NJ | . | . | 4.1% | 4.1% | 10.8% | 10.8% | 12.7% | 12.7% |
| OH | . | . | N/R | N/R | N/R | N/R | N/R | N/R |
| OK | . | . | . | . | . | . | . | . |
| OR | 12.8% | 12.2% | 16.3% | 15.2% | 19.8% | 14.9% | 13.4% | 9.0% |
| PA | N/R | N/R | N/R | N/R | 16.4% | 8.6% | 8.1% | 6.9% |
| RI | N/R | N/R | N/R | N/R | N/R | N/R | N/R | N/R |
| SD | N/R | N/R | 14.1% | 14.1% | 17.5% | 16.2% | . | . |
| VA | . | . | 13.8% | 13.8% | 8.7% | 8.7% | . | . |
| WA | N/R | N/R | N/R | N/R | 14.1% | 13.9% | 11.9% | 10.6% |
| WI | 7.3% | 7.3% | . | . | . | . | . | . |
| MEAN US | 11.6% | 11.3% | 11.3% | 10.3% | 13.1% | 11.2% | 10.7% | 8.8% |
† Data for 2011 are incomplete.
‡ Two observations from 2010 in Florida’s Individual/Conversion market are considered outliers – they are conversion plans which represent the only business in this market for their respective carriers. This gave them a disproportionate impact on the state-level estimate. They were removed from the state-level calculations, but retained for the national estimate.
Note: Approved rates differ from those in Table 14 because this Table is restricted to filings with complete rate information (see supra). Some estimates are not reportable (N/R) because the proportion of state member months represented in the sub-sample is less than 50%.
Table 20: Rates of Premium Increases Among Filings with Complete Rate Information, Proposed and Approved, by State and Nationally for the Small Group Market, 2008-2011
| State | Small group 2008 Prop | Small group 2008 App | Small group 2009 Prop | Small group 2009 App | Small group 2010 Prop | Small group 2010 App | Small group 2011† Prop | Small group 2011† App |
|---|---|---|---|---|---|---|---|---|
| AL | 8.4% | 8.4% | . | . | . | . | . | . |
| AR | . | . | . | . | . | . | . | . |
| CA | . | . | . | . | . | . | . | . |
| CO | . | . | 5.4% | 5.4% | 8.8% | 8.8% | 3.8% | 3.8% |
| CT | . | . | . | . | 15.3% | 15.2% | N/R | N/R |
| FL | 19.2% | 19.2% | 16.4% | 16.4% | 13.1% | 10.9% | 7.2% | 7.2% |
| HI | . | . | . | . | . | . | . | . |
| IA | . | . | . | . | . | . | . | . |
| ID | . | . | . | . | . | . | . | . |
| IL | . | . | . | . | . | . | . | . |
| IN | N/R | N/R | 21.0% | 21.0% | -1.1% | -1.2% | 1.7% | 1.7% |
| KS | . | . | . | . | . | . | . | . |
| KY | -0.4% | -0.4% | 3.7% | 3.7% | 5.4% | 5.4% | 6.1% | 6.1% |
| MA | . | . | . | . | . | . | . | . |
| MD | . | . | . | . | . | . | . | . |
| ME | . | . | . | . | N/R | N/R | 6.7% | 6.7% |
| MI | . | . | . | . | . | . | . | . |
| MN | N/R | N/R | N/R | N/R | 0.1% | 0.1% | -1.2% | -1.2% |
| NC | 40.0% | 40.0% | . | . | . | . | 9.0% | 9.0% |
| NE | . | . | . | . | . | . | N/R | N/R |
| NJ | . | . | . | . | . | . | . | . |
| OH | . | . | N/R | N/R | 4.3% | 4.3% | -0.4% | -0.4% |
| OK | . | . | . | . | . | . | . | . |
| OR | 4.7% | 4.7% | 5.9% | 5.9% | 13.1% | 12.7% | 7.4% | 6.0% |
| PA | N/R | N/R | N/R | N/R | N/R | N/R | N/R | N/R |
| RI | . | . | . | . | 2.0% | 1.3% | 14.3% | 11.6% |
| SD | . | . | . | . | . | . | . | . |
| VA | . | . | . | . | . | . | . | . |
| WA | . | . | . | . | 4.2% | 4.2% | N/R | N/R |
| WI | . | . | . | . | . | . | . | . |
| MEAN US | 12.8% | 12.5% | 12.5% | 12.5% | 7.3% | 6.7% | 5.0% | 4.5% |
† Data for 2011 are incomplete.
Note: Approved rates differ from those in Table 14 because this Table is restricted to filings with complete rate information (see supra). Some estimates are not reportable (N/R) because the proportion of state member months represented in the sub-sample is less than 50%.
28 However, carriers may in some cases file a new application (under a separate tracking number) during the next or even the same quarter, or may aggregate plans differently in subsequent filings. We cannot therefore conclude that policyholders covered by disapproved filings were not subject to a rate increase.
29 Since analysis of mean rate increases in the previous section includes filings with only one listed rate (e.g., the approved rate from a state summary or the proposed rate in a file and use state), these totals may not match those in other parts of the report.
Relationship of Carrier Size, Product Type, and Market Concentration on Approval Rates
We examined whether large carriers had higher approval rates than smaller carriers (Figures 15 and 16) using the same criteria for approval as in Figure 12. With the exception of the 2011 small group market, smaller carriers had significantly lower approval rates throughout the study period.
Figure 15: Percentage of Premium Increases Approved, by Year, by Carrier Size - Individual/Conversion
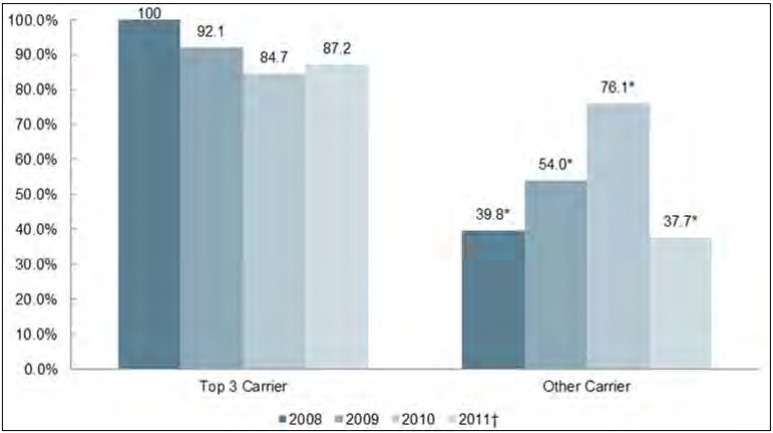
† Data for 2011 are incomplete.
* Estimate is significantly different from Top 3 Carrier at p < .05.
Figure 16: Percentage of Premium Increases Approved, by Year, by Carrier Size - Small Group
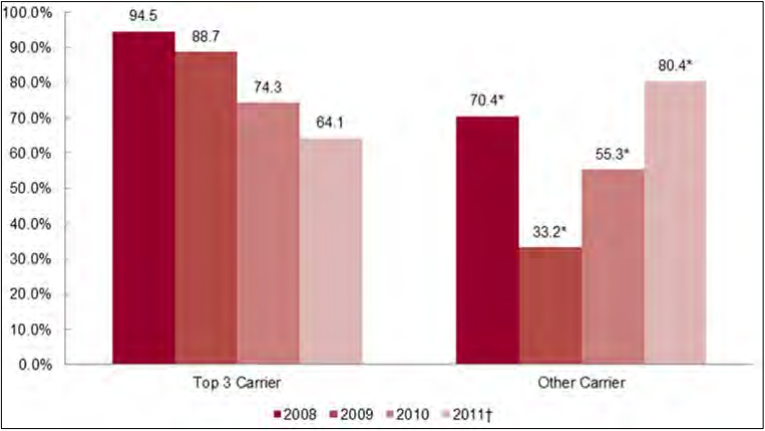
† Data for 2011 are incomplete.
* Estimate is significantly different from Top 3 Carrier at p < .05.
We also analyzed observed differences in approval rates by product type (Figures 17 and 18). In the individual market, PPO and indemnity plans consistently had a higher approval rate than HMO plans. No pronounced pattern was apparent in the small group market. We note that HMO in 2009 had a significantly lower approval rate than PPO and indemnity, but a higher approval rate in 2010.
Figure 17: Percentage of Premium Increases Approved, by Year, by Product Type - Individual/Conversion
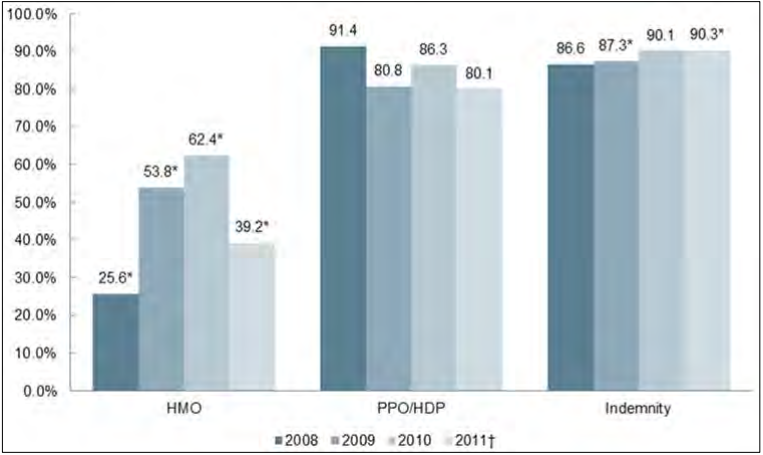
† Data for 2011 are incomplete.
* Estimate is significantly different from PPO/HDP at p < .05.
Figure 18: Percentage of Premium Increases Approved, by Year, by Product Type - Small Group
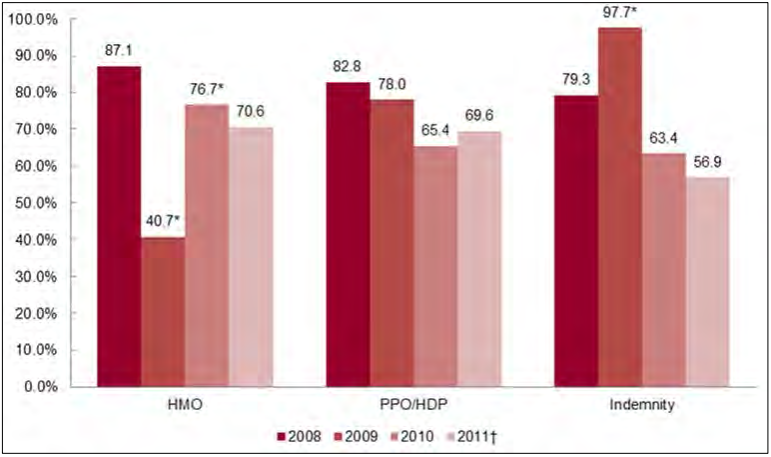
† Data for 2011 are incomplete.
* Estimate is significantly different from PPO/HDP at p < .05.
We additionally explored the association between market concentration and percentage rate requests approved (Figures 19 and 20). In the individual market, high concentration states had the highest rates of approval every year. These same high concentration states also had the lowest rates of increases each year (in Figure 10). Low concentration states had higher approval ratings than did medium concentration states in all but one year. High concentration states in the small group market had only a handful of observations over the study years, and are therefore omitted from the analysis. Low concentration states had higher approval rates all four years compared to medium concentration states.
Figure 19: Percentage of Premium Increases Approved, by Market Concentration, by Year - Individual/Conversion
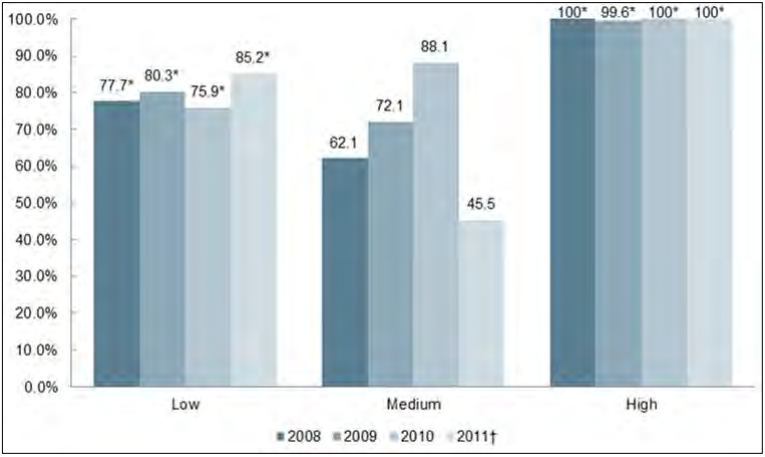
† Data for 2011 are incomplete.
* Estimate is significantly different from Medium Market Concentration at p < .05. Note: Entries with fewer than five filings are not reported (N/R).
Figure 20: Percentage of Premium Increases Approved, by Market Concentration, by Year - Small Group
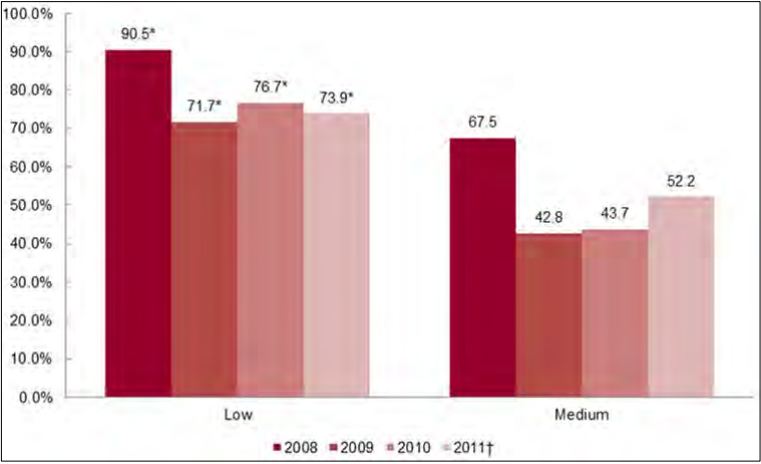
† Data for 2011 are incomplete.
* Estimate is significantly different from Medium Market Concentration at p < .05.
Note: Entries with fewer than five filings are not reported (N/R). No filings were available from states with high market concentration.
Limitations
Readers should be aware of several limitations of this study. First, in many states, filings were missing in some study years. Moreover, important data elements were sometimes absent from existing filings, or of questionable quality. Lack of consistent data on medical loss ratios (MLRs) required us to drop that analysis. Sometimes filings included information on either the requested increase or the approved increase, but not both. Thus, in calculating approval rates or modifications, we had to base our estimates on a sub-population of the sample. Enrollment data on products were generally available, but sometimes of questionable validity. For example, some carriers reported equal enrollment for HMO, PPO and indemnity plans and these figures were equal to total enrollment.
Because of missing or low quality data, it was necessary to impute enrollment in plans for some observations. (Carrier enrollment was based on the NAIC data so there was no imputation for carrier enrollment.) We attempted to use best available data such as MEPs-IC in the state’s small employer market to estimate enrollment in a carrier’s HMO, PPO, and indemnity plan if enrollment data were missing or of inadequate quality.
Because of missing data, we have conducted extensive sensitivity testing around our weighting strategy and criteria for data to be included in the sample. For four different scenarios, point estimates were statistically different for premium increases in eight of 30 estimates. However, these point estimates when statistically significant changed by approximately one percentage point. The major conclusion of the study – that premium increases declined substantially in both the individual and small group markets in 2011 – is not changed with different weighting methods.
Another limitation concerns the sample. Although the original sample design was a stratified random sample, we replaced states purposively when it became clear it was not possible to collect data from some states. Within states, we were to select carriers using a random stratified sample design. Later in the study, to increase the total number of filings, we added as many carriers as possible within the sample states.
Lastly, although the study tracks trends in premiums before the passage of the Affordable Care Act and for the first year after rate review went into effect, the study’s methods do not enable us to assert that the ACA is responsible for the decline in premium increases from 2010-2011.
Conclusion
Based on carrier rate filings with state regulatory agencies, this study built a nationally representative database and then examined trends in premiums prior to and immediately after the passage of the Affordable Care Act. Readers should view findings with caution – we found both the quantity and quality of filings wanting in many states. Some states had few filings and other states’ filings were not accessible. Because of the incompleteness of data, NORC conducted sensitivity testing. The objective was to determine if findings were sensitive to decision criteria for weighting and exclusions of carrier/state observations. NORC tested four different weighting and three different exclusion methods. Ultimately, NORC concluded that changes in point estimates derived from alternative decisions for weighting and exclusions would not result in changes to the main findings of the study.
With the passage of the Affordable Care Act, the growth of the SERFF system, and the proliferation of public websites with rate filing information, the transparency of the individual and small group insurance markets improved, and we expect, will continue to improve. Since the passage of the Affordable Care Act, 23 states have added a public website with information on rate filings. Six states have mandated that carriers file rate increases in SERFF format, thereby adding much-needed standardization to rate filings. Improved transparency should encourage more prudent buying by sophisticated purchasers such as brokers, agents, and navigators, which in turn may promote more price competition.
2011, the first year in which carriers were subject to the MLR requirements of the Affordable Care Act, was also the year of the lowest premium increases in both the individual and small group markets of the four years in the study. National estimates of premium increases were 2.9 and 2.1 percentage points below the figures for the previous year in the individual and small group markets, respectively. The percentage of premium increase requests receiving modifications peaked in 2010 and 2011 in both the individual and small group markets.
The largest three carriers within each state’s small group markets had lower rates of increases in premiums on average during the study period than did other carriers. Over the four-year study period, these large carriers raised rates by 10.7 percent less than smaller carriers did in the small group market. In the individual market, states with medium market concentration, defined as the largest carrier having between 50 and 79 percent of the market, had higher cumulative increases over the four years than did states with low and high market concentration by 8 and 11 percent, respectively.
In conclusion, in the first year of premium and MLR review under the Affordable Care Act, regulators modified and disapproved a higher percentage of requested premium increases than they did in the three years prior to the Affordable Care Act. Premium increases fell by 2.9 percentage points in the individual market and 2.1 percentage points in the small group market. Whether this decline represents a one-time saving or a long-term shift in the cost curve will only be evident in a few years. Lastly, although the study tracks trends in premiums before the passage of the Affordable Care Act and for the first year after rate review went into effect, the study’s methods do not enable us to assert that the ACA is responsible for the decline in premium increases from 2010-2011.
Appendix A: State-Specific Data Gathering Methodology
Alabama
Alabama Individual and Small Group carriers’ (with the exception of HMO, Medicare, long-term care, and rate changes for credit) rate filings have been requested on an informational basis only. This information was considered proprietary and was not subject to public disclosure. As a result, few filings were available for download and information in the filings was limited. Filings are now available online at: http://www.aldoi.gov/Consumers/ACARateFilings.aspx# through a Health Filing Access Interface developed in response to the Affordable Care Act. Rate filings submitted since July 10, 2010, are now available for download.
Arkansas
Arkansas was added to the sample later to replace states in the original selection that had filings of insufficient quality. As it was not included in the original contract, Perr & Knight did not take steps to collect data in Arkansas. Arkansas requires prior approval on rate increases. The filings collected by the Arkansas Insurance Department are considered public and rate filings that were filed after March 21, 2008, are available online at: http://www.insurance.arkansas.gov/LH/FlgShpage/Filings.htm. Many of the rate filings that had complete information were determined to be usable in the database.
California
California poses unique challenges in the private insurance market because regulatory authority is divided among two agencies – the Department of Managed Health Care (DMHC), which is responsible for all managed care including the HMOs in the individual and small group markets, and the Department of Insurance, which regulates the rest of the market. California was a difficult state in which to find usable filings. California did not have prior approval over rate increases. Filings for carriers reporting to the DOI are filed with the Commissioner, and rates become effective 30 days after filing or if they receive written approval prior to that time. Although many filings were collected by Perr & Knight, most were found to be unusable. Usable filings were found using two separate websites. Individual rate filings starting in mid-2010 are made public on the website at: http://www.insurance.ca.gov/0250- insurers/HlthRateFilings/index.cfm. HMO filings starting in 2011 are made public on the website at: http://wpso.dmhc.ca.gov/RateReview.
Colorado
Colorado was initially under consideration to be left out of the sample due to the difficulties of pulling information, but was eventually left in the sample. As of 2009, Colorado has prior approval on rate increases. Many filings were downloaded from Perr & Knight and were usable. Other filings have been available since January 2008 and were downloaded from the state’s website. The portal at: http://www.dora.state.co.us/pls/real/Ins_RAF_Report.main contains summary information for rate filings submitted since January 1, 2008. An alternative portal to Colorado filings submitted through SERFF is at: http://healthinsurance.colorado.gov/pages/filingsSearch.aspx.
Connecticut
Connecticut has prior approval for individual plans and for small group HMOs. Many filings were downloaded from Perr & Knight, but were mostly unusable or included limited information. Many of the filings are labeled “trade secret”, but some are available to the public at: http://www.catalog.state.ct.us/cid/portalApps/RateFilingDefault.aspx.
Florida
Florida has prior approval for rate filings. Information from Florida filings is complete and easily accessible. Many usable filings were downloaded by Perr & Knight. Other information was obtained from annual rate summaries published online by the state. Individual filings are available, but must be requested from the state insurance department. The filings must be requested individually via email, and the insurance department will email a link to the filing. Many of the files are for new products or are underwriting certifications. Files may be requested using the interface at: http://www.floir.com/edms/. Summary information is also available on the public website.
Hawaii
Hawaii has prior approval on HMO plans. Not many filings were available from Perr & Knight, and no filings are available for download on the state insurance department website.
Illinois
Illinois requires Individual plans to file for information purposes. Small Group plans are file and use. Perr & Knight did not retrieve information from Illinois. A summary of products in the individual market through the end of 2010 was previously available at: http://www.insurance.illinois.gov/healthinsurance/ratefilings.asp (and does not appear to be actively updated).
Iowa
Iowa has prior approval for Individual and Small Group plans. Perr & Knight was not able to download many rate filings. The state insurance department website had a summary of rate increase history since 2005 in the individual market through September 2011, but the summary is updated sporadically and has, at times, been removed from their public website. It is available at: http://www.iid.state.ia.us/sites/default/files/private/page/2012/02/15/individua... _history_s_12771.pdf.
Indiana
Indiana has prior approval for individual plans and for small group HMO plans. Other Small Group plans are file and use. Perr & Knight was successful in downloading many usable rate filings. Filings filed after May 1, 2010, are available for download from the website at: http://www.in.gov/IDOI/RateWatch/Default.aspx.
Idaho
Idaho did not have prior approval, but requires filing for informational purposes. Perr & Knight was successful in retrieving usable filings, but Idaho filings are not made public on the insurance department website.
Kansas
Kansas has prior approval in the Individual and Small Group markets. Perr & Knight was successful in retrieving usable rate filings. Filings submitted since June 10, 2010, are available on the website at: http://www.ksinsurance.org/consumers/hfai.php# in response to the Affordable Care Act.
Kentucky
Kentucky was added to the sample to replace Tennessee due to the difficulties of information retrieval. Kentucky has prior approval on both individual and small group policies for rate increases. Group health policies are not required to be filed with the exception of Long-Term Disability, Medicare Supplement, or Large Group policies. Perr & Knight was able to download several filings, but many were unusable. Rate filings since August 2011 are available at: http://insurance.ky.gov/RateFil/default.aspx.
Massachusetts
Massachusetts has prior approval on individual and small group policies as of 2010. Perr & Knight downloaded many rate filings, but most were unusable. Filings are also not available on the department website.
Maine
Maine has prior approval on individual and small group policies unless a carrier elects a 78% guaranteed MLR option. Maine was added to the sample later because of the lack of information in some of the sample states. Perr & Knight was not very successful in finding rate filings. Filings from the top insurers in the state are available on the website at: http://www.maine.gov/pfr/insurance/filings/filings.htm. Only four filings were available at this location, but Maine’s filings were eventually found through a SERFFFbased portal, accessible at: http://www.maine.gov/pfr/insurance/PPACA/HFAI.htm. Rate increase summaries are available at: http://www.maine.gov/pfr/insurance/employer/snapshot_individual.htm and http://www.maine.gov/pfr /insurance/employer/snapshot_small_group.htm.
Maryland
Maryland has prior approval on Individual and Small Group policies. Rate changes must be filed 90 days prior to the effective date. Filings were not investigated by Perr & Knight due to difficulties in pulling information, but were instead retrieved directly from the state Department of Insurance. Filings are not for public viewing on the insurance department website.
Michigan
Michigan has prior approval for HMO plans and all BCBS plans for Small Group and requests filings Individual policies. Perr & Knight retrieved numerous filings, but almost all of them were unusable. The filings lacked vital information as well. There are no filings available for download from the state website (http://www7.dleg.state.mi.us/SerffPortal/) from Blue Cross/Blue Shield which accounts for more than 50 percent of the market share in both individual and small group markets.
Minnesota
Minnesota has prior approval on Individual and Small Group policies. Perr & Knight was able to download many files, but few were usable. More filings were requested from the Department of Commerce, which provided most of Minnesota’s filing information. Many filings submitted since June 10, 2010 are available through the department’s website (http://mn.gov/commerce/insurance/topics/medical/Access-Filings.jsp), although some have been made unavailable.
Nebraska
Nebraska was added to the sample to replace Mississippi due to lack of responsiveness on the part of the Insurance Department. Nebraska has prior approval on Individual policies. Small Group policies are required to file for informational purposes only. Not many filing were available, but Perr & Knight was able to provide some that were usable. Limited filings are available on the department website at: https://doi-ratechanges.ne.gov/DOIRateChange/faces/welcome.xhtml. Summaries, in spreadsheet form, of filings submitted since June 2011 are also available at: http://www.doi.ne.gov/lh/filings/filing_index.htm.
New Jersey
New Jersey has prior approval on Individual and Small Group policies. New Jersey has an 80% MLR requirement. Filings provided by Perr & Knight were unusable. As a result, filings were requested directly from the state Department of Insurance, which provided many filings with good information. No filings are available on the insurance department website, although some information on current premium rates in the individual market is available at: http://www.state.nj.us/dobi/division_insurance/ihcseh/ihcrates.htm.
New York
New York has prior approval on Individual and Small Group policies as of 2010. Filings from Perr & Knight were unusable and thus New York was eliminated from the sample. Summaries of filings are available at: http://www.dfs.ny.gov/insurance/health/prior_app/prior_app.htm and https://myportal.dfs.ny.gov/web/prior-approval/rate-applications-by-company.
North Carolina
North Carolina has prior approval on Individual and Small Group policies. Perr & Knight was able to provide a significant number of filings, many of which were usable. Filings are also available online at: http://infoportal.ncdoi.net/filelookup.jsp?divtype=3 via SERFF interface system.
Ohio
Ohio has prior approval on Individual policies. Filings gathered by Perr & Knight provided a large number of usable filings. Most Small Group policies are required to file for informational purposes only, but some groups and associations require prior approval. Filings are not available to the public on the department website.
Oklahoma
Oklahoma was added to the sample as a replacement for South Carolina due to difficulties in retrieving information. Oklahoma has prior approval for Individual HMO policies and Small Group policies. Perr & Knight provided a substantial number of usable filings for the database. Filings from June 2010 on are available online as a response to the Affordable Care Act and the Oklahoma Open Records Act through a SERFF interface at: http://www.ok.gov/oid/Regulated_Entities/Rate_and_Form_Filing/HFAI_Searc.... Proprietary information is not subject to public disclosure.
Oregon
Oregon has prior approval for Individual and Small Group policies. Perr & Knight provided a large number of usable filings for the database. Additional filings were downloaded from the insurance department website. Oregon filings and rate summaries are available at: http://www.oregonhealthrates.org/#search_form.
Pennsylvania
Pennsylvania has prior approval on Individual policies. For Small Group policies, prior approval is required only for HMOs and nonprofit BCBS plans. Perr & Knight provided a very small number of usable filings for the database, and additional filings were downloaded from the department website. Filings are available at: http://www.insurance.state.pa.us/dsf/rf_filings.html for filings since April 1, 2008. Some archived filings for 2004 – 2008 as well as other reports on the health insurance market are available at: http://www.portal.state.pa.us/portal/server.pt/community/industry_activi....
Rhode Island
Rhode Island has prior approval for Individual and Small Group policies. Perr & Knight provided a few filings, most of which were usable. Filings related to regulatory action, including several filings from Blue Cross & Blue Shield of Rhode Island in the individual market are available on the insurance department website at: http://www.ohic.ri.gov/Insurers_RegulatoryActions.php.
South Dakota
South Dakota has prior approval for Individual policies and requires Small Group policies to file for informational purposes only. Perr & Knight provided a small number of usable filings. No filings are available on the state webpage.
Texas
Texas requires Individual and Small Group policies to file for informational policies only. Texas was originally considered for exclusion from the sample due to difficulties in retrieving information, but was ultimately included to provide better results based on the total number of covered lives. It was later revealed that Texas labels all filings proprietary, the filings that were downloaded were unusable, and Texas was removed from the sample. No filings are available on the department website.
Virginia
Virginia has prior approval for Individual policies, and requires Small Group policies to file for informational purposes only. A large number of usable filings were provided by Perr & Knight. Many, but not all filings submitted since June 10, 2010 are available at: http://www.scc.virginia.gov/boi/SERFFInquiry/LHAccessPage.aspx, under search option 2. Search option 1, on the same page, also appears to provide some summary information on filings submitted after January 1, 2011.
Washington
Washington has prior approval for Individual and Small Group policies. Perr & Knight provided a large number of filings, most of which were large group filings. Additional filings were downloaded from the state website. Filings are available for download at: https://fortress.wa.gov/oic/onlinefilingsearch/. Rate summaries are available at: http://www.insurance.wa.gov/health-rates.shtml.
Wisconsin
Wisconsin is a file and use state for both Individual and Small Group policies. Perr & Knight provided a large number of usable filings. Additional filings were then downloaded from the department webpage. Filings are available at: https://ociaccess.oci.wi.gov/ratereview/pub/webSearch through a SERFF interface. There is also a summary document available.