
U.S. Department of Health and Human Services
Substitutability Across Institutional Post-Acute Care Settings: 1998-2006
Robert Schmitz and Samuel Simon
Mathematica Policy Research, Inc.
September 25, 2009
PDF Version: http://aspe.hhs.gov/daltcp/reports/2009/instPAC.pdf (63 PDF pages)
This report was prepared under contract #HHS-100-03-0017 between the U.S. Department of Health and Human Services (HHS), Office of Disability, Aging and Long-Term Care Policy (DALTCP) and Mathematica Policy Research. For additional information about this subject, you can visit the DALTCP home page at http://aspe.hhs.gov/_/office_specific/daltcp.cfm or contact the ASPE Project Officer, Susan Polniaszek, at HHS/ASPE/DALTCP, Room 424E, H.H. Humphrey Building, 200 Independence Avenue, S.W., Washington, D.C. 20201. Her e-mail address is: Susan.Polniaszek@hhs.gov.
The opinions and views expressed in this report are those of the authors. They do not necessarily reflect the views of the Department of Health and Human Services, the contractor or any other funding organization.
TABLE OF CONTENTS
- I. PROVISION OF POST-ACUTE CARE TO MEDICARE BENEFICIARIES WITH MEDICALLY COMPLEX CONDITIONS
- A. Introduction
- B. Payment Policy and Provider Incentives
- II. PROVIDER AVAILABILITY, CARE UTILIZATION, AND PAYMENT: A SUMMARY OF THE LITERATURE
- A. Introduction
- B. Regulation of the Supply of Post-Acute Care
- C. Provider Supply and Use of Post-Acute Care
- D. SNF Prospective Payment and Access to Care for Beneficiaries with Medically Complex Conditions
- III. POST-ACUTE CARE FOR BENEFICIARIES WITH MEDICALLY COMPLEX CONDITIONS: DATA AND METHODS
- A. Data Sources
- B. Definition of Medically Complex Patients
- C. Comparison Group: Rehabilitation Patients
- D. Defining Episodes of Post-Acute Care
- E. Geographic Units of Analysis
- F. Analysis of Episodes
- IV. THE SUPPLY OF INSTITUTIONAL POST-ACUTE ACTE: 1997-2007
- A. Background
- B. Methods
- C. Institutional Post-Acute Care Availability
- D. Institutional Post-Acute Care: Effects of Region, City Size, and Age of Population
- E. Hospital-Based SNFs and the Growth of LTCHs
- V. MEDICARE INSTITUTIONAL POST-ACUTE CARE: 1998-2006
- A. Background
- B. Post-Acute Care Episodes for Beneficiaries with Medically Complex Conditions
- C. Post-Acute Episodes and the Changing Supply of LTCHs and Hospital-Based SNFs
- APPENDICES
- APPENDIX A: CLINICALLY COMPLEX AND REHABILITATION ICD-9 AND DRG CODES BY YEAR
- APPENDIX B: DATA TABLES FOR REPORT FIGURES
- LIST OF FIGURES
- FIGURE IV.1: Number of Freestanding SNF Beds by Region
- FIGURE IV.2: Number of Hospital-Based SNF Beds by Region
- FIGURE IV.3: Inpatient Rehabilitation Beds by Region
- FIGURE IV.4: Long-Term Care Hospital Beds by Region
- FIGURE IV.5: Freestanding SNF Beds by Size of 65+ Population
- FIGURE IV.6: Hospital-Based SNF Beds by Size of 65+ Population
- FIGURE IV.7: Inpatient Rehabilitation Beds by Size of 65+ Population
- FIGURE IV.8: Long-Term Care Hospital Beds by Size of 65+ Population
- LIST OF TABLES
- TABLE III.1: Conditions Used to Identify Clinically Complex Patients in MedPAR Data
- TABLE III.2: Study CBSAs That Lost All Hospital-Based SNFs Between 1998 and 2006
- TABLE III.3: Number of Post-Acute Care Episodes by Year and Diagnosis Type
- TABLE IV.1: Number of U.S. Post-Acute Care Providers: 1997 and 2007
- TABLE IV.2: Number of U.S. Post-Acute Cost Beds: 1997 and 2007
- TABLE IV.3: Characteristics of CBSAs in Which the Number of Hospital-Based SNFs Decreased Between 1997 and 2007
- TABLE IV.4: Characteristics of CBSAs in Which the Number of Hospital-Based SNF Providers Increased Between 1997 and 2007
- TABLE IV.5: Characteristics of CBSAs in Which the Number of Hospital-Based SNF Providers Remained Constant Between 1997 and 2007
- TABLE IV.6: LTCH Beds per 10,000 Persons Aged 65+, by Configuration of Hospital-Based and Freestanding SNF Beds in 1997
- TABLE V.1: Growth in Post-Acute Care for Medicare Beneficiaries with Medically Complex Diagnoses, by Census Region: 1998 and 2006
- TABLE V.2: Distribution of Initial Provider and Number of Providers for Episodes of Post-Acute Care for Medically Complex Patients, by Census Region: 1998 and 2006
- TABLE V.3: Duration of Post-Acute Episodes Among Medically Complex Patients by Census Region: 1998 and 2006
- TABLE V.4: Rehospitalization and Discharge of Medically Complex Patients to Other Post-Acute Locations, by Census Region: 1998 and 2006
- TABLE V.5: Medicare Payments for Episodes of Post-Acute Care for Medically Complex Patients, by Census Region: 1998 and 2006
- TABLE V.6: Discharge Destination and Medicare Episode Payment, by Change in Hospital-Based SNF Beds: 1998 and 2006
- TABLE V.7: Medicare Post-Acute Episodes for Medically Complex and Rehab Patients in Communities That Lost All Hospital-Based SNFs: 1998 and 2008
- TABLE V.8: Fixed-Effect Regression Results for Medically Complex Patients, by Census Region: 1998-2006
- TABLE V.9: Fixed-Effect Regression Results for Rehabilitation Patients, by Census Region: 1998-2006
- TABLE A.1: Clinically Complex and Rehabilitation ICD-9 and DRG Codes by Year
- TABLE B.1: Number of Freestanding SNF Beds by Region
- TABLE B.2: Number of Hospital-Based SNF Beds by Region
- TABLE B.3: Inpatient Rehabilitation Beds by Region
- TABLE B.4: Long-Term Care Hospital Beds by Region
- TABLE B.5: Freestanding SNF Beds by Size of 65+ Population
- TABLE B.6: Hospital-Based SNF Beds by Size of 65+ Population
- TABLE B.7: Inpatient Rehabilitation Beds by Size of 65+ Population
- TABLE B.8: Long-Term Care Hospital Beds by Size of 65+ Population
EXECUTIVE SUMMARY
When the Medicare prospective payment system (PPS) for skilled nursing facilities (SNFs) was introduced in 1998, long-term care hospitals (LTCHs) were already expanding rapidly, with a corresponding increase in the number of Medicare patients treated in them. In the years immediately following the introduction of PPS, large numbers of hospital-based SNFs closed. While firm evidence has been difficult to adduce, it appeared likely to many that much of the expansion of the LTCH population consisted of patients who might previously have been treated in SNFs--whether freestanding or hospital-based. Because LTCH payments are typically much higher than SNF payments, this trend might well represent an increase in Medicare spending with little or no corresponding benefit to patients. Although LTCHs represent a small fraction of post-acute care providers, the rapid growth in payments to them has been a matter of concern for Medicare Payment Assessment Commission and other policy analysts.
This report examines trends in the provision of post-acute care to beneficiaries with diagnoses indicating a need for complex medical care for the years from 1998 and 2006, with special attention to changes in care provided by LTCHs and hospital-based SNFs. It focuses in particular on the relationship between changes in provider supply at the level of the town or city, as represented by the Core-Based Statistical Area, and characteristics of episodes of Medicare post-acute care.
Episodes were constructed using Medicare Provider Analysis and Review data for calendar years 1997-2007. Medically complex conditions were identified for index hospital stays, using diagnosis codes, procedure codes, and Medicare diagnosis-related group codes. Episodes were defined to include all Medicare-covered post-hospital care with gaps between discharge and subsequent admission of no more than 60 days. The Provider of Service file provided facility-level information, such as ZIP code and facility. Data from all 50 states and the District of Columbia were used for the analysis.
Between 1997 and 2007, both the number of hospital-based SNFs and number of beds declined by over 50 percent. In addition the number of LTCHs more than doubled and the number of LTCH beds increased by 29 percent. By contrast, the number of freestanding SNF beds increased by only 5 percent and the number of inpatient rehabilitation facility beds increased by 1 percent. The supply of LTCH beds increased much more rapidly in cities that lost hospital-based SNFs than in cities that did not.
The analysis of post-acute care episodes found sharp declines in discharge of medically complex patients from hospital to hospital-based SNF in every Region of the country. For the United States as a whole, discharges to hospital-based SNF (among beneficiaries with some post-acute care) fell from 26 percent in 1998 to 9 percent in 2006. There was a corresponding increase in discharges to freestanding SNFs from 54 percent in 1998 to 67 percent in 2006. Although fewer than 10 percent of patients were discharged to LTCHs, the proportional increase was highest for LTCHs in every Region of the United States, but particularly in the South, where discharges to LTCHs nearly doubled from 3.2 percent to 6.2 percent.
In communities that experienced the loss of hospital-based SNF services, medically complex cases shifted to freestanding SNF if there were no LTCHs available. In communities that experienced the loss of hospital-based SNF and the entry of LTCH services, the shift of medically complex case was split between freestanding SNF and the new LTCH.
Episodes that began with a discharge to an LTCH were substantially more expensive ($49,230 in 2006) to the Medicare program than those that began with a discharge to a hospital-based SNF ($14,145) or freestanding SNF ($20,544). To isolate the association between LTCH growth and Medicare episode payment, the analysis focused on a set of 27 communities that lost all hospital-based SNFs between 1998 and 2006 and had no LTCHs in 1998. LTCHs entered 14 of these communities during the period. Mean episode payment in the two groups of communities was almost identical--$13,415 in communities that LTCHs did not enter, and $13,281 in communities that they did enter. Over the period from 1998 to 2006, Medicare episode payment increased by 39 percent in communities that LTCHs did not enter and by 68 percent in communities that LTCHs entered. Hospital readmission rates rose in both sets of communities, slightly more so in communities that did not gain LTCHs. Additional regression analyses confirmed a significant association between LTCH supply and Medicare episode payment, but failed to find any relationship between LTCH entry and hospital readmission.
In the absence of evidence that outcomes of post-acute care have improved markedly as admissions to LTCHs have increased, these results may be viewed as evidence that providers are responding in undesirable ways to the introduction of prospective payment. The per-stay PPS for LTCHs encourages LTCHs to accept medically complex patients that had previously been served by hospital-based SNFs for short-stays before being discharged to freestanding SNFs.
Centers for Medicare and Medicaid Services (CMS) is currently working toward a revision of payment for post-acute care to support value-based purchasing and weaken the association between payment and the site of care. The Post-Acute Care Payment Reform Demonstration is currently testing the systematic collection of patient data upon hospital discharge and admission to and discharge from all forms of post-acute care via the Continuity Assessment Record and Evaluation instrument. Data from the evaluation may eventually support both a post-acute payment that relies more on patient needs and less on the location of care, and also a set of guidelines that define (with varying specificity) which patients and conditions are appropriately suited to the richer mix of services provided by LTCHs and which can appropriately be served by SNFs.
I. PROVISION OF POST-ACUTE CARE TO MEDICARE BENEFICIARIES WITH MEDICALLY COMPLEX CONDITIONS
A. Introduction
From the inception of the Medicare program, payment policy recognized that hospitalized beneficiaries may require follow-up care for a period of time after discharge. The nature and intensity of post-acute care can vary widely from person to person. Many beneficiaries are capable of overseeing their own post-discharge care, traveling to their physicians office or to outpatient clinics for recommended examinations, tests, or therapy. Others, due to the complexity of their condition or to physical or cognitive limitations, may require more formal oversight and delivery of post-acute care. The Medicare program covers three principal types of institutional post-acute care.
-
Skilled Nursing Facilities (SNFs) provide care to patients discharged from a hospital stay of three days or more and who require skilled nursing or rehabilitation on a daily basis.
-
Inpatient Rehabilitation Facilities (IRFs) provide rehabilitation services to patients who are able to participate in three or more hours of therapy per day.
-
Long-Term Care Hospitals (LTCHs) furnish care to patients with complex care needs who are expected to require long stays. To be certified as an LTCH under Medicare, a facility must have an average length of stay greater than 25 days.
Most beneficiaries receive institutional post-acute care in SNFs. These facilities furnish a variety of services, including wound care, IV fluids, skilled monitoring, medication management, and rehabilitation therapy. Some SNFs, particularly hospital-based SNFs, provide more advanced care, such as intensive IV antibiotics, and ventilator support. A smaller, though rapidly growing, share of beneficiaries receive post-acute care in an IRF or LTCH, both of which typically provide a richer and more intensive set of services. At present, there are no rules or official guidelines indicating which type of post-acute care is most appropriate, given a patients diagnoses and functional status.
In order to explicate and understand the changes in institutional post-acute care since the implementation of payment changes between 1998 and 2002, the Office of the Assistant Secretary for Planning and Evaluation (ASPE) of the Department of Health and Human Services (HHS) contracted with Mathematica Policy Research to: (1) identify changes in the availability, utilization, and Medicare payment for institutional post-acute care over the period from 1998 and 2006; (2) investigate geographic differences in the structure of episodes of post-acute care, and (3) quantify the effects of the expansion of LTCHs and the contraction of hospital-based SNFs in specific geographic areas on the use of specific types of post-acute care.
B. Payment Policy and Provider Incentives
Prior to the implementation of the Medicare inpatient prospective payment system (PPS) for acute care hospitals in FY 1984, post-acute care represented a tiny fraction of total Medicare spending. By about 1989, however, the utilization of post-acute care and associated outlays began to grow rapidly.1 Medicare spending for SNF care, for example, increased from $2.5B in 1990 to $13.5B in 1998--an annual growth rate of over 23 percent (Yacker 2001).
Lacking evidence that beneficiary outcomes were improving to a degree even remotely commensurate with increases in spending, policymakers searched for a means to limit growth in future spending. The first step was the institution of prospective systems for post-acute care that paralleled the inpatient PPS. Prior to implementation of these systems, payment was made on the basis of incurred cost, subject to so-called routine cost limits.2 The Balanced Budget Act (BBA) of 1997 required the Centers for Medicare and Medicaid Services (CMS) to develop a PPS for each of the three types of care and for Medicare home health care. In response, CMS implemented a per-diem PPS for SNFs, beginning in July 1998. A stay-based PPS was implemented for IRFs in January 2002 and for LTCHs in October 2002. In each case, payments were risk adjusted in an effort to ensure access for all beneficiaries, regardless of medical symptoms or care needs and to match payments to the expected cost of services required.
PPS and their associated risk adjustment mechanisms are intended to link patient characteristics, such as diagnoses, symptoms, and acuity of conditions, to a payment that is sufficient to support efficient and appropriately delivered care. Such systems are necessarily imperfect in practice. The standardized amounts are frequently based on prior costs, incurred during a period of high provider reimbursement. Moreover, risk adjustment systems can only imperfectly capture the relationship between a patients observed characteristics and the resources needed to deliver proper care.
SNF providers and industry groups have criticized the Resource Utilization Group (RUG-III) system used to adjust SNF payments for failing to account accurately for the cost of caring for medically complex patients, in particular for costs associated with nontherapy ancillaries (NTA). The researchers who constructed the RUG-III system did not attempt to capture the relationship between resident characteristics and NTA cost. Rather, they estimated the relationship between those characteristics and nursing time. NTA costs were assumed to be proportional to estimated nursing time. The resulting payment weights therefore tended to underpredict cost for those patients whose NTA costs are high in relation to nursing time, as may be the case for ventilator patients or those who require high-cost medications.
Treatment of rehabilitation under RUG-III is quite different. Payment weights for the rehabilitation category are determined largely by minutes of therapy actually received by the resident during a specified assessment period. SNFs thus exert a measure of control over the payment they receive for beneficiaries who receive rehabilitation. The implementation of RUG-III as the risk adjustment system for Medicare SNF payment may therefore have led providers to regard beneficiaries who require rehabilitation services as less risky and potentially more profitable than beneficiaries with medically complex care needs. While there is no systematic evidence indicating that beneficiaries with complex care needs are unable to access post-acute care, interviews with hospital discharge planners have suggested that patients with particular care needs, such as those requiring ventilator support or kidney dialysis, have become more difficult to place since SNF PPS was implemented in 1998 (HHS Office of the Inspector General [OIG] 2001).
Whatever effects SNF PPS may have had in reducing the use of SNF care by beneficiaries with medically complex conditions may have been amplified further by the rapid growth in Medicare-certified LTCHs, which increased by over 300 percent between 1992 and 2005. Many LTCHs specialize in services such as ventilator support and weaning and may be far more willing to accept medically complex patients than are most SNFs. Their presence in a community may make them an attractive discharge location for such patients because they provide a wider array of services and possess a richer mix of staffing than SNFs typically do. The per-stay prospective payment received by an LTCH, however, is often much higher than the amount a SNF would receive to care for an identical patient.
Implementation of the Medicare SNF PPS and the expansion of Medicare-certified LTCHs may have led to a gradual shift in the location of post-acute care for patients with medically complex care needs, away from SNFs and toward LTCHs. Whether such a change can be expected to result in higher quality or more efficient provision of care to Medicare beneficiaries is difficult to determine. The Medicare Payment Assessment Commission (MedPAC) has pointed out that many patients treated in LTCHs appear similar to patients who reside in areas without LTCHs and who are treated in SNFs. MedPAC recommended that CMS develop specific criteria defining the diagnoses, conditions, and treatment needs for which LTCH care is considered reasonable and necessary.
This report examines trends in the provision of post-acute care to beneficiaries with diagnoses indicating a need for complex medical care for the years from 1998 and 2006. It focuses in particular on the relationship between changes in provider supply at the level of the town or city, as represented by the Core-Based Statistical Area (CBSA), and characteristics of episodes of Medicare post-acute care. Chapter II of the report summarizes the regulatory environment and summarizes the literature on provider availability and choice of care. Chapter III provides evidence on the growth of LTCHs, IRFs, freestanding SNFs, and hospital-based SNFs over the period under study. Chapter IV describes the data used to define geographic areas and episodes of care. Chapter V presents results and describes the growth and configuration of episodes and Medicare episode payment for areas that did and did not experience changes in provider supply over the period. Chapter VI provides discussion and interpretation of the results.
II. PROVIDER AVAILABILITY, CARE UTILIZATION, AND PAYMENT: A SUMMARY OF THE LITERATURE
A. Introduction
Like other PPS, the SNF PPS was implemented as a means of holding providers financially responsible for the costs they incur, encouraging more efficient provision of care. Medicare payment per SNF day slowed immediately. Having increased by over 7 percent between 1997 and 1998, it increased by only 6 percent over the following three years combined, with no significant change in average length of stay (MedPAC 2004). Other consequences of the SNF PPS were perhaps less desirable. Hospital-based SNFs began leaving the Medicare program almost immediately; one-third of the hospital-based SNFs that existed in 1998 had left the program by 2003. Many appeared to do so because the per-diem PPS rates were lower than their costs MedPAC (2004).
The closure of so many hospital-based SNFs, combined with the perceived bias of the RUG-III risk adjustment system against patients with high need for NTAs led to widespread concern that patients with medically complex conditions might be difficult to place in SNFs.3 Interviews with hospital discharge planners appeared to confirm this perception, at least to a degree, as Section D details.
As Chapter I noted, the SNF PPS was introduced at a time when LTCHs were expanding rapidly, with a corresponding increase in the number of Medicare patients treated in them. While firm evidence has been difficult to adduce, it appeared likely to many that much of the expansion of the LTCH population consisted of patients who might previously have been treated in SNFswhether freestanding or hospital-based. Because LTCH payments are typically much higher than SNF payments, this trend might well represent an increase in Medicare spending with little or no corresponding benefit to patients.
The decline in the number of hospital-based SNFs was almost surely the result of the introduction of the SNF PPS. The increase in the number of LTCHs may very well have been a response, if somewhat delayed, to the Medicare hospital inpatient PPS--a response perhaps accelerated by the SNF PPS. These changes are in some measure undesirable and are hence a source of concern to policymakers. Yet PPS were meant to confront providers with new incentives and to change their behavior. It is unrealistic to expect their behavior to change only in desirable ways. The policy process must rather be understood to be dynamic, adjusting and responding to provider (and beneficiary) responses to earlier policy changes. A short-run response to the rapid increase in the number of LTCHs was contained in the Medicare, Medicaid and SCHIP Extension Act (MMSEA), which imposed a moratorium on the certification of new LTCHs as described in the next section. Two longer-term changes are under development by CMS and are described below.
To improve the accuracy of risk adjustment under the SNF PPS, CMS will introduce Version 4 of Resource Utilization Groups (RUG-IV) in FY 2011 (74 FR 40288, August 11, 2009). The RUG-IV system draws on results from the Staff Time and Resource Intensity Verification project. RUG-IV will contain 66 payment categories (up from 53 in RUG-III) and will change the assessment period for elements of the nursing home Minimum Data Set (MDS) to include only services provided while the patient was a resident of the SNF, and excluding services provided during the previous hospital stay. RUG-IV will also use a statistical model to predict NTA cost. RUG-IV developers modeled NTA costs using data from the MDS and Medicare claims data to produce a risk adjusted, add-on index of NTA for all case-mix groups. Three categories of NTA costs will be included: respiratory-related costs, drug-related costs and other NTA costs. CMS expects to complete research for the NTA add-on by Spring 2010.
CMS has articulated a broader vision for Medicare post-acute care through the Post-Acute Care Payment Reform Demonstration (PAC-PRD) (CMS 2009). Section 5008 of the Deficit Reduction Act of 2005 set a goal for development of a site-neutral payment system for clinically similar patients. During the four year demonstration, a comprehensive assessment instrument will be implemented at the time of hospital discharge to help determine appropriate placement based upon patient care needs and clinical characteristics. The common assessment tool will be used to assess patients, irrespective of site of post-acute care, during treatment and at discharge. Data from this common instrument, in addition to data on fixed and variable costs for each individual and on care outcomes across the continuum of post-acute care, will identify opportunities to streamline payment and align treatment incentives with the goal of more efficient post-acute treatment.
While the demonstration Report to Congress is not due until July 2011, it is anticipated that findings from the PAC-PRD will ultimately have a significant effect on the costs and location of post-acute care for patients with clinically complex care needs.
B. Regulation of the Supply of Post-Acute Care
1. Certificate of Need
State Certificate of Need (CON) regulations for long-term care settings are supply controls designed to match capacity with actual care needs. Initially encouraged by federal guidelines in 1974 to discourage health care facilities from growing at an excessive rate, CON laws typically determine need by using hospital/nursing home bed to population ratios adjusted for population growth (Wiener et al. 1998).
The rationale for CON regulation is a pattern of care known as Roemers Law: under pervasive third-party reimbursement, health care services tend to increase to meet available supply. For example, Wiener et al. (1998) found a strong association between the number of nursing home beds per 1,000 persons aged 75 and over in each state and the number of nursing home residents per 1,000 aged 75 and over in each state. Opponents to this type of regulation argue that CON laws limit competition, which can keep prices high and adversely affect the quality of PAC. However, evidence suggests that quality of care and patient outcomes are generally better in CON than in nonCON states (Vaughan-Sanrazin 2002).
Currently Alabama, Arkansas, Connecticut, Delaware, Florida, Georgia, Hawaii, Illinois, Kentucky, Maine, Maryland, Massachusetts, Michigan, Mississippi, Missouri, Nevada, New Hampshire, New Jersey, New York, North Carolina, Rhode Island, South Carolina, Tennessee, Vermont, Virginia, Washington, West Virginia, District of Columbia and Puerto Rico regulate long-term post-acute care using CONs (National Conference of State Legislatures 2009). Prior research found many LTCHs have entered the market in locations where other LTCHs are already present (MedPAC 2008). The disproportionate expansion of LTCHs into states with more limited oversight suggests (though it certainly does not prove) that LTCH growth has been determined more strongly by regulatory factors than by forecasts of the expected need for care.
2. The LTCH 25 Percent Rule and the IRF 60 Percent Rule
In an effort to control LTCH costs following the introduction of PPS, Medicare enacted the 25 percent rule. The goal of this rule is to insure that admissions to LTCHs are made for clinical rather than financial reasons. Under the rule LTCHs receive reduced payments for any patients admitted from certain referring hospitals over an agreed threshold. Originally this rule targeted so-called hospitals-within-hospitals (HwHs) and satellites in order to limit referrals from the host hospital (Gage et al. 2005; MedPAC 2008). In 2004 Medicare enacted the 75 percent rule, which regulated the extent to which patients admitted to HwHs and satellites could be referred from their host hospital. If facilities exceeded the agreed 75 percent of patients admitted from the host hospital, payment adjustments were incurred. This threshold was reduced to 25 percent effective July 2007 and included all LTCHs, with allowances made for outlier patients and hospitals in rural areas (Gage et al. 2005; MedPAC 2008)
Discharges and spending increased dramatically in IRFs subsequent to the advent of PPS. Medicare responded to this increase in spending by requiring 75 percent of admissions to (IRFs) to have one or more of a list of specific conditions to distinguish IRFs from acute care hospitals by identifying residents who were clinically appropriate for IRF (later changed to 60 percent) of a facilitys census. In 2004, CMS redefined the conditions included in the 75 percent rule and created a four year transition period for IRF compliance with the revised rule. The MMSEA relaxed the compliance threshold to 60 percent and capped it at that level permanently. MedPAC (2008) reported that discharges and spending have decreased and case-mix has increased following the enactment of this rule.
3. The Moratorium on LTCH Certification
In December 2007 MMSEA repealed the 25 percent rule on LTCHs and declared a moratorium on the certification of new LTCHs, LTCH satellites or increases in beds at existing LTCHs from December 29, 2007 to December 30, 2010. Some general exceptions to this rule exist if a LTCH qualified for construction before December 29, 2007, and in more rural locations where there is only one LTCH. The impetus for the moratorium was a strong belief that LTCH care was being substituted for relatively less expensive care in acute hospital or SNF settings, and that limiting the supply of this more costly setting of care was warranted for a period.
C. Provider Supply and Use of Post-Acute Care
While it is tempting to argue that appropriate placement of patients in particular post-acute settings should be determined by their functional and clinical characteristics, the clinical literature contains little evidence relating patient characteristics to expected outcomes of treatment in alternative environments. The only research documenting such relationships is that of Kramer et al. (1997), which found that stroke patients who entered IRFs improved their recovery of measures of function to a greater degree than similar patients who entered SNFs. Later work by Deutsch et al. (2006) found that stroke patients with mild to severe motor disabilities and without severe cognitive impairment had superior outcomes when treated in IRFs rather than SNFs.
The foregoing research aside, there is considerable evidence that availability of post-acute care, as measured, for example, by distance to nearest provider, is a stronger determinant of the type of care received by Medicare beneficiaries than the clinical characteristics of the discharged beneficiary. Indeed, Buntin et al. (2004) found that the availability of PAC was a major determinant of whether patients use PAC and which type of PAC facility they use. While several factors may affect PAC use, including individual demographic and clinical factors, volume of Medicare patients, hospital size, percent of low-income patients, hospital ownership, status as a teaching hospital, and higher income communities, the study found that distance and supply of providers were particularly significant in determining whether a patient is admitted to an IRF or an SNF. A notable exception was a study finding similarities in use of SNFs across the country despite the fact that availability of SNFs varies greatly (Kane et al. 2002). The authors suggest that practice style may be a greater determinant of PAC use than supply and local regulatory practices.
Prior studies of LTCH dispersions have shown that the geographical distribution of LTCHs is not proportional to the geographic distribution of Medicare enrollees nor to the geographic distribution of sickest patients (Liu et al. 2001; MedPAC 2004). The majority of LTCHs are located in Northeastern and Southern states. LTCHs range in type from older freestanding hospitals with a 50 percent Medicare patient base, to newer freestanding hospitals mainly specializing in respiratory and rehabilitation services with a Medicare patient base of 70 percent, to smaller facilities such as HwHs and satellite LTCHs.
Because availability may drive demand for post-acute care, the effect of proximity to care on health and cost outcomes is of interest to payers. In a study using a quasi-experimental design, Buntin et al. (2005) found that among post-acute care patients with a lower extremity joint replacement whose decision to use an IRF or SNF was swayed by the proximity of services, compared with a group of patients who were discharged home with home health care, no mortality differences were observed. However, the likelihood of institutionalization at 120 days post-discharge was higher for the group who went to an institutional site. Likewise, the recipients of institutional post-acute care had higher costs compared with those patients (who underwent the same acute care joint replacement procedure) who received care at home.
D. SNF Prospective Payment and Access to Care for Beneficiaries with Medically Complex Conditions
As noted earlier, the goal of switching from a retrospective cost-based payment system to a PPS was to encourage efficiency and reduce spending. Conflicting evidence characterizes the research exploring the impact of prospective payment on access to post-acute care and the quality of care provided.
1. SNF PPS and Access to Care
Most early studies found that that access to SNF care was little changed as a result of the introduction of SNF PPS. Angelelli et al. (2002) found that access to SNF care in Ohio was not significantly altered following the implementation of the SNF PPS. This finding was replicated later in a survey of discharge planners from a random sample of 300 acute care hospitals (Levinson 2006). Similarly, McCall et al. (2003) found little evidence that changing patterns of post-acute care immediately following implementation of the BBA of 1997 led to changes in outcomes for Medicare patients. While Medicare payments for episodes of post-acute care declined, this was due largely to a decline in payments for home health and SNF care.
Others have found negative associations between the introduction of SNF PPS and measures of access to care. Yip et al. (2002) found the duration and intensity of rehabilitation treatments were adversely affected following implementation of PPS, although this may have been an artifact of coding practices in SNFs, which the General Accounting Office (GAO 2002) found to change dramatically with the introduction of the SNF PPS. That is, categories of rehabilitation with largest reimbursement increases (medium and high levels of therapy utilization) showed a large increase over time, whereas low and ultra high levels of therapy, which had decreases in reimbursement as a result of PPS, had concurrent decreases in prevalence over time. White (2003) identified a slight reduction in the likelihood of SNF use after PPS was implemented, with a concurrent reduction in the total number of SNF days, suggesting reduced access to SNF care.
Wodchis, Fries, and Hirth (2004) compared the rate at which Medicare and nonMedicare SNF patients were discharged to home before and after implementation of the SNF PPS in 1998. They found that while all SNF patients were more likely to be discharged to home after the inception of prospective payment, the increase was not as great for Medicare as for nonMedicare patients. They found no effect of PPS on the rate of hospitalization of Medicare SNF patients.
Surveys of hospital discharge planners conducted by the OIG have recorded some delays in locating SNFs willing to accept certain types of patients. These include patients who are ventilator dependent, or who require dialysis, IV antibiotics, or expensive drugs (OIG 2001, 2006). During interviews with hospital discharge planners, MedPAC (2004) found that while patients who required post-acute rehabilitation were generally easy to place, other patients sometimes experience delays.
As noted in Chapter I, there has been a perception that the RUG-III system used to risk adjust Medicare SNF payments fails to recognize properly the cost of NTAs, which are used most intensively in the care of medically complex patients. Liu et al. (2007) summarized several studies and concluded that RUG-III explains only about 5 percent of the variation in NTA costs.
2. PPS and Hospital-Based SNFs
Hospital-based SNFs typically have a higher proportion of patients with medically complex care needs than do freestanding SNFs (Pizer, White, and White 2002). There are natural reasons for hospital-based SNFs to orient themselves to treatment of medically complex patients. Their proximity to services such as laboratory, imaging, and pharmacy, together with the rich staff mix of a hospital would tend to benefit treatment of such patients to a greater degree than it would benefit treatment of patients who require rehabilitation. Liu and Black (2003) found that patients in hospital-based SNFs were substantially more likely to receive IV therapy, respiratory services, laboratory services, radiology, and medical supplies than were patients in freestanding SNFs. They were also more likely to have received services from coronary care or intensive care units during their preceding hospital stay.
Their higher cost per patient-day, combined with their greater use of services generating higher NTA costs made hospital-based SNFs particularly susceptible to the effects of the SNF PPS. The closure of about one-third of hospital-based SNFs since PPS went into effect is therefore unsurprising. Liu and Jones (2007), for example, found that closure of hospital-based SNFs was often due to unreimbursed care required for the more acute, high nontherapy, ancillary costs incurred by their patient population and the higher staffing levels observed in these facilities.4 Many hospital-based SNFs that remained appear to have reduced their staffing levels and so may have become less capable of providing complex post-acute care. Konetzka et al. (2004) found strong evidence that the SNF PPS was associated with a reduction in professional (registered nurse and licensed practical nurse) staffing, measured as hours per resident day, in SNFs. Although preexisting staffing was found to be higher at hospital-based facilities compared to freestanding SNFs, there were indications that the reduction in staffing was greater at hospital-based SNFs.
If the SNF PPS did lead to a reduction in the availability of post-acute care for medically complex patients in SNFs, then some patients who had previously received such care in SNFs now must receive it elsewhere. They may remain in the hospital longer before discharge, perhaps improving to the point where they can be cared for in a SNF or home health agency. They may also be discharged to an IRF or LTCH. For example, White and Seagrave (2005) found that closure of hospital-based SNFs between 1997 and 2001 was associated with a small (0.12 day) increase in the length of the index acute care stay and an increase of $343 in total Medicare spending for the total episode of care (acute plus post-acute care) due to increased spending for alternative forms of post-acute care. Like other authors, they found no relationship between closure of hospital-based SNFs and the probability of rehospitalization.
A growing share of medically complex patients are being discharged from acute care hospitals to LTCHs, perhaps in part because of the difficulty of finding appropriate care in SNFs. MedPAC (2008) found that patients with certain diagnoses were more likely to be discharged from a hospital to a SNF in areas that lacked LTCHs than in areas with LTCHs. Whether the care received by patients with these diagnoses was measurably better in the LTCH has not been determined and may be difficult to ascertain with certainty. As Buntin et al. (2009) point out, many patients fall into a clinical gray area, where there is not an obvious medical choice for post-acute care site, and these patients are shifted across post-acute sites based on nonclinical factors, including payments and provider supply.
MedPAC has sought to eliminate or at least shrink this clinical gray area by calling on CMS to develop specific criteria meant to define patients for whom care in LTCHs is particularly appropriate. Results from the PAC-PRD are likely to address this need by 2011. In the meantime, the proliferation of LTCHs and the rapid growth in their use remains a source of potentially unnecessary Medicare spending.
III. POST-ACUTE CARE FOR BENEFICIARIES WITH MEDICALLY COMPLEX CONDITIONS: DATA AND METHODS
This chapter describes the data and empirical approach used to carry out the analyses presented in Chapter IV and Chapter V.
A. Data Sources
The analytic file of post-acute care episodes was constructed using two sources of data: the Medicare Provider Analysis and Review (MedPAR) data file and the Provider of Service (POS) file. Data were obtained for calendar years 1997 through 2007, a period spanning the introduction of PPS for SNFs, IRFs, and LTCHs.
MedPAR data were used to identify Medicare-covered services in Medicare-certified facilities at the stay level. We identified stay-specific diagnoses for index hospital stays, procedures, diagnosis-related group (DRG) codes, dates of admission and discharge, length of stay, and Medicare payment. The POS file provided facility-level information, such as ZIP code and facility type (e.g., acute care hospital, SNF, IRF, inpatient rehabilitation unit, and LTCH). Because this data was provided by year, the analytic file accounted for changes in provider availability by year. Data from all 50 states and the District of Columbia were used for the analysis.
B. Definition of Medically Complex Patients
Despite numerous studies focused upon the issue of clinically complex Medicare beneficiaries with high NTA costs, no uniform definition of the clinically complex patient has been adopted (GAO 1999; OIG 2006; MedPAC 2009). To create a candidate set of clinically complex conditions associated with high NTA costs, we began with the conditions listed in the RUG-III clinically complex and extensive care group and consulted with internal clinicians and ASPE staff to expand and refine this list into a comprehensive set of DRG and International Classification of Diseases, ninth edition (ICD-9) diagnosis and procedure codes that would reflect patients with severe infections, mechanical ventilation, renal failure, and high medication costs.5 The list of diagnoses, procedures and DRGs reflects coding changes over the 11-year study period. Appendix A lists the set of codes used for each year in the study. We include a range of conditions including cardiac, digestive, infections, pulmonary/respiratory, renal, skin and other complex medical conditions, listed in Table III.1, below.
| TABLE III.1. Conditions* Used to Identify Clinically Complex Patients in MedPAR Data | |
| Category | Condition/Treatment |
| Cancer | Radiation therapy |
| Cardiac conditions | Cardiomyopathy Endocarditis Mediastinitis Heart failure and shock Peripheral vascular disorders Other circulatory system disorders |
| Digestive conditions | Alimentation Nutritional and Miscellaneous disorders |
| Infections | Osteomyelitis Septic shock Fungemia Post-operative and post-traumatic infections Nervous system infection Respiratory infections Procedures for infectious and parasitic diseases Septicemia |
| Pulmonary conditions | Tracheostomy (includes infections and complications, obstructions) Mechanical ventilation Pulmonary edema/respiratory failure COPD Pneumonia with complications (pleurisy) |
| Renal conditions | ESRD Diabetes with renal manifestations Dialysis Kidney and urinary tract infections |
| Skin conditions | Skin ulcer Skin graft Other skin/subcutaneous tissue and breast procedures Wound debridement for injuries |
| Other complex medical conditions | Complications of treatment with clinical complexity Disorders of the pancreas |
| * Appendix A lists all diagnosis, procedure and DRG codes used in each year. | |
C. Comparison Group: Rehabilitation Patients
A comparison group was selected to distinguish patterns of post-acute care use unique to beneficiaries with medically complex conditions from more general trends in care. We selected a typically homogenous type of patient with relatively high rates of SNF use (pre-PPS) to determine if patterns observed in medically complex patient were observed for other patient types as well. We selected a group of patients well represented in SNF PPS payment systems. In the 2001 version (44 groups) of the SNF RUG-III, there were 14 separate rehabilitation categories.6 The comparison group was defined to include Medicare beneficiaries with one of three rehabilitation-specific DRGs. These DRGs (209 - 211)7 include hospital stays for hip and knee replacements and hip fractures.
D. Defining Episodes of Post-Acute Care
We defined post-acute care episodes by identifying each beneficiarys index hospital stay and all subsequent post-acute care in any of the three sites of care included in this study (SNF [hospital-based and freestanding], IRF,8 and LTCH). Beneficiaries index hospital stays were defined as discharges from acute care hospitals that were not preceded by any institutional care (including other hospital stays) in the 60 days prior to admission. Index-stays were required to have a length of stay of at least one day. Claims for subsequent post-acute care were concatenated for each index-stay until a period of 60 days containing no acute or post-acute care observed. Episodes of 1 day or longer were considered valid.
Because the data included the years 1997 through 2007, some truncation of the data occurred. We attempted to minimize the effects by focusing the analysis on care received between 1998 and 2006, using a buffer period of 60 days prior to and following this time period. For example, we begin looking for index hospital stays in 1998, but we used the 1997 data to identify any prior hospitalizations or post-acute care use to determine if a hospitalization occurring in January or February 1998 was truly an index hospitalization or if it was part of an episode of care that began in 1997.
E. Geographic Units of Analysis
To understand how provider availability, and change in provider availability was associated with patterns of post-acute care for medically complex and rehabilitation patients, we employed alternative approaches to assign geographic units for our analyses. We started this process by first identifying each facilitys CBSA and categorized each facility depending on the geographic definition employed. CBSAs are defined as functional Regions surrounding an urban center of at least 10,000 people. Each episode of post-acute care was assigned to the CBSA and region containing the index-stay hospital. Analyses were conducted for three configurations of geographic areas:
Census Region. Each episode was categorized according to the U.S. Census Region containing the index-stay hospital. As shown in Chapter IV, the level and growth of LTCH beds per beneficiary differed markedly across the four Regions. Regions are defined as follows:
-
Northeast. Connecticut, Maine, Massachusetts, New Hampshire, New Jersey, New York, Pennsylvania, Rhode Island, and Vermont.
-
North Central. Illinois, Indiana, Iowa, Kansas, Michigan, Minnesota, Missouri, Nebraska, North Dakota, Ohio, South Dakota, and Wisconsin.
-
South. Alabama, Arkansas, Delaware, District of Columbia, Florida, Georgia, Kentucky, Louisiana, Maryland, Mississippi, Oklahoma North Carolina, South Carolina, Tennessee, Texas, Virginia, and West Virginia.
-
West. Alaska, Arizona, California, Colorado, Hawaii, Idaho, Montana, Nevada, New Mexico, Oregon, Utah, Washington, and Wyoming.
Cities classified by change in hospital-based SNF beds. CBSAs were grouped as follows according to the change in hospital-based SNF beds per 10,000 beneficiaries: decrease of 8 or more, decrease of 3 to 8, decrease of 1 to 3, decrease of less than 1, no beds in either 1998 or 2006, and increase in beds.
Cities in which all hospital-based SNFs exited between 1998 and 2006. Investigation of the POS files for the years 1998 through 2006 showed a number of CBSAs that: (1) contained one more hospital-based SNFs in 1998, and no hospital-based SNFs in 2006; and (2) had no LTCHs in 1998. One or more LTCHs entered 14 of these areas; we selected 13 similar areas that had no LTCH supply through the period. The CBSAs used in the analysis are shown in Table III.2.
| TABLE III.2. Study CBSAs That Lost All Hospital-Based SNFs Between 1998 and 2006 | |||
| CBSAs in Which LTCHs Entered | CBSAs with No LTCH | ||
| Amarillo, TX Bowling Green, KY Coeur dAlene, ID Dayton, OH Biloxi, MS Harrisburg, PA Jackson, MI | Lancaster, PA London, KY Montgomery, AL Natchez, MS Odessa, TX Prescott, AZ Syracuse, NY | Binghamton, NY Burlington, NC Fort Myers, FL Columbus, IN Cookeville, TN Flagstaff, AZ Muscle Shoals, AL | Kingman, AZ Laurel, MS Melbourne, FL Pascagoula, MS State College, PA Yuma, AZ |
F. Analysis of Episodes
1. Outcome Comparisons
Within each of the three geographic categories described in the previous section, the analysis reports outcome measures available from the MedPAR file. The analysis compares the following outcomes across defined geographic areas:
-
Percent discharged from index hospital stay to freestanding SNF, hospital-based SNF, LTCH, and IRF.
-
Percent discharged from initial post-acute provider to freestanding SNF or LTCH.
-
Mean duration of episode.
-
Percent rehospitalized within 60 days of discharge from index-stay.
-
Mean Medicare payment for episode.
Values are reported for each area in both 1998 and 2006. Where appropriate, the percent change over the period is reported as well.
2. Regression Analysis
Using the full episode datafile, we constructed a CBSA-level analysis file, with the CBSA-year as the unit of analysis. For each CBSA and year, we computed the number of medically complex and rehabilitation episodes, the proportion of episodes that began with discharge to a SNF (freestanding or hospital-based) or LTCHs, the proportion of episodes that contained a rehospitalization within 60 days of the index discharge, and mean episode payment. Using this file, we estimated the fixed-effect regression of four outcome measures on a set of indicator variables that registered increases in LTCHs and decreases in hospital-based SNFs in each CBSA over the years from 1998 to 2006. The specification is shown below.
 |
where,
- LTCH_INCR1 = 1 in the first (and each succeeding) year that the number of LTCHs in a CBSA exceeds the number that existed in 1998, and equals 0 otherwise;
- LTCH_INCR2 = 1 in the first (and each succeeding) year that the number of LTCHs in a CBSA exceeds the number that existed in the year in which LTCH_INCR1 was first equal to one, and equals 0 otherwise;
- SNF_DECR1 = 1 in the first (and each succeeding) year that the number of hospital-based SNFs falls short of the number that existed in 1998, and equals 0 otherwise;
- SNF_DECR2 = 1 in the first (and each succeeding) year that the number of hospital-based SNFs falls short of the number that existed in the year in which HSNF_DECR1 was first equal to one, and equals 0 otherwise;
- YEARjt is a set of dummy variables for year, from 1999 to 2006.
The dependent variable yit represents, in succession, the proportion of post-acute patients admitted to a SNF, the proportion of post-acute patients admitted to an LTCH, the proportion of post-acute patient rehospitalized within 60 days of discharge, and mean episode payment, in each case for CBSA i in year t. The estimates of ß1 and ß2 represent the percentage responsiveness of the dependent variable to successive increases in the number of LTCHs in the CBSA. The estimates of ß3 and ß4 represent the percentage responsiveness of the dependent variable to successive decreases in the number of hospital-based SNFs in the CBSA.
3. Episode Totals
Table III.3 displays the number of episodes involving at least one post-acute stay following an index hospitalization summarized by year of index hospitalization captured in our analytic file. As described previously, we used data from 1997 through 2007 to construct an analytic file containing episodes of post-acute care between calendar 1998 and 2006. The analysis file represents a total of 4,747,007 episodes of post-acute care. Overall, the total number of post-acute care episodes increased by 18.0 percent between 1998 and 2006; the rate of growth during this period was larger for patients with a medically complex diagnosis (21.6 percent) compared to patients with a rehabilitation diagnosis (11.9 percent).9
| TABLE III.3. Number of Post-Acute Care Episodes by Year and Diagnosis Type | |||
| Year of Index Hospitalization | Number of Medically Complex Episodes | Number of Rehabilitation Episodes | Total Episodes in Analysis File |
| 1998 | 306,112 | 180,270 | 486,382 |
| 1999 | 296,263 | 176,380 | 472,643 |
| 2000 | 294,201 | 176,476 | 470,677 |
| 2001 | 307,209 | 189,589 | 496,798 |
| 2002 | 333,278 | 196,098 | 529,376 |
| 2003 | 353,079 | 204,402 | 557,481 |
| 2004 | 357,936 | 210,353 | 568,289 |
| 2005 | 380,083 | 211,246 | 591,329 |
| 2006 | 372,355 | 201,677 | 574,032 |
IV. THE SUPPLY OF INSTITUTIONAL POST-ACUTE CARE: 1997-2007
A. Background
As noted in Chapter I, the number of LTCHs has expanded rapidly during the past 15 years. By contrast, the number of hospital-based SNFs has declined sharply since the introduction of the SNF PPS. The number of freestanding SNFs increased during this same period, and the overall number of SNFs remained roughly constant. This chapter explores regional patterns in the availability of care by provider type. It links data on the number of providers and the number of beds to data on metropolitan areas from the U.S. Census.
B. Methods
The primary data source for this chapter was the CMS POS File, a monthly database created from the Online Survey and Certification Automated Record system. We obtained the December version of the POS file for each year from 1997 through 2007. From these annual files, we created an 11-year data file, with providers as observations. Variables included provider type, number of beds, city and state. To this file, we merged the Census Region and CBSA code, together with its over-65 population and over-85 population in 2000. The latter two variables were estimated by multiplying the share of the 65+ and 85+ populations in the total state population by the population of the CBSA.
C. Institutional Post-Acute Care Availability
Although the total number of providers of Medicare-covered institutional post-acute care increased by less than 2 percent in the ten years from 1997 to 2007, there were dramatic changes in the composition of providers, as shown in Table IV.1. The most striking change was the decline in the number of hospital-based SNFs over the period. The number of hospital-based SNFs reached a maximum of 1,821 in 1998, the year in which the SNF PPS was implemented, and declined continually after that year.
The number of LTCHs doubled over the same period. In the years between 1999 and 2005, the annual rate of increase in the number of LTCH providers ranged from 6.8 to 11.0 percent. While the number of IRFs and LTCHs both grew more rapidly than the number of SNFs, the total number of IRFs and LTCHs remained small, together accounting for less than 5 percent of post-acute care providers in 2007.
| TABLE IV.1. Number of U.S. Post-Acute Care Providers: 1997 and 2007 | |||
| 1997 | 2007 | Percent Change | |
| Freestanding SNF | 10,906 | 11,905 | 9.2 |
| Hospital-Based SNF | 1,806 | 868 | -51.9 |
| Inpatient Rehab Facility (IRF) | 191 | 213 | 11.5 |
| Long-Term Care Hospital (LTCH) | 193 | 388 | 101.0 |
| Total Providers | 13,096 | 13,374 | 2.1 |
| SOURCE: Analysis of CMS POS File, 1997 and 2007 | |||
Rates of change in the number of post-acute care beds, whether positive or negative, were in every case smaller over the period than the rates of change in the number of providers. In particular, LTCH beds grew much more slowly over the period than did the number of LTCH providers, as seen in Table IV.2. The average size of an LTCH fell from 110 beds to 71 beds between 1997 and 2007.
The sharp changes in LTCH and hospital-based SNF beds and over the period led to corresponding changes in LTCH and hospital-based SNF beds per 10,000 people aged 65 and over. However, total (hospital-based plus freestanding) SNF beds per 10,000 people aged 65 and over declined by only 1.6 percent. Despite variation in the growth or decline in post-acute beds of particular types, the total number of post-acute care beds changed little, increasing by less than 1 percent over the ten-year span.
| TABLE IV.2. Number of U.S. Post-Acute Care Beds: 1997 and 2007 | |||
| 1997 | 2007 | Percent Change | |
| Freestanding SNF | |||
| Total beds | 1,343,896 | 1,412,965 | 5.1 |
| Beds per provider | 123.2 | 118.7 | -3.7 |
| Beds per 10,000 pop aged 65+ | 397.8 | 409.8 | 3.0 |
| Hospital-Based SNF | |||
| Total beds | 122,830 | 59,848 | -51.3 |
| Beds per provider | 68.0 | 68.9 | 1.3 |
| Beds per 10,000 pop aged 65+ | 36.4 | 17.4 | -52.2 |
| Inpatient Rehab Facility | |||
| Total beds | 13,837 | 13,972 | 1.0 |
| Beds per provider | 72.4 | 65.6 | -9.4 |
| Beds per 10,000 pop aged 65+ | 4.1 | 4.1 | -0.0 |
| Long-Term Care Hospital (LTCH) | |||
| Total beds | 21,251 | 27,408 | 29.0 |
| Beds per provider | 110.1 | 70.6 | -35.9 |
| Beds per 10,000 pop aged 65+ | 6.3 | 7.9 | 25.4 |
| Total Beds | 1,501,814 | 1,514,193 | 0.8 |
| SOURCE: Analysis of CMS POS File, 1997 and 2007 | |||
D. Institutional Post-Acute Care: Effects of Region, City Size, and Age of Population
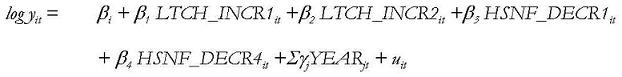
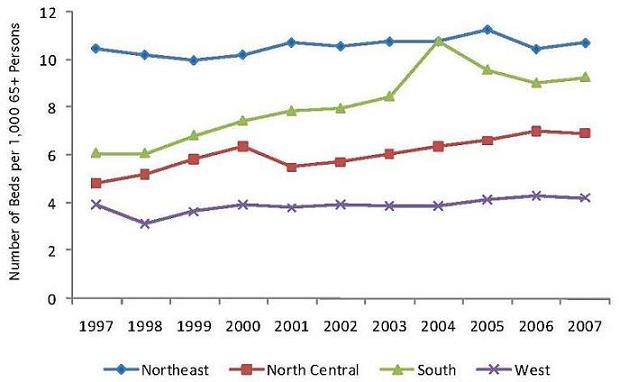
Availability of Medicare post-acute care beds differs markedly across Regions of the United States, as shown in Figure IV.1, Figure IV.2, Figure IV.3 and Figure IV.4, which display beds per 10,000 persons aged 65 and over for each of four types of care, by U.S. Census Region. Several broad themes emerged:
-
In general, the supply of post-acute care beds is lower in the West than in other Regions of the United States. Beds per person aged 65+ were lower in the West in 2007 than in any other Region in three of the four categories shown in Figure IV.1, Figure IV.2, Figure IV.3 and Figure IV.4. Given the low rate of hospital and SNF utilization in the West, the relative dearth of beds in the Region is unsurprising.
-
The decline in hospital-based SNF beds occurred in every Region, but was less pronounced in the Northeast, where beds per person aged 65+ fell 17 percent. Elsewhere the decline ranged from 46 percent in the West to 61 percent in North Central states.
-
While the rapid growth of LTCHs in a number of North Central and Southern states (notably Arkansas, Louisiana, Michigan, Pennsylvania, and Texas) has attracted attention in recent years, the number of LTCH beds per person was highest in the Northeast over the entire ten-year period.
| FIGURE IV.1. Number of Freestanding SNF Beds by Region |
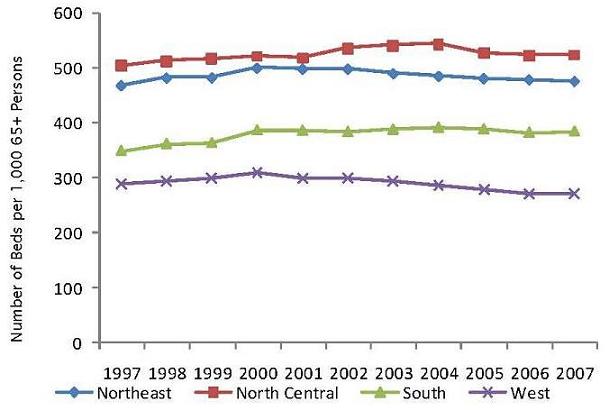 |
| FIGURE IV.2. Number of Hospital-Based SNF Beds by Region |
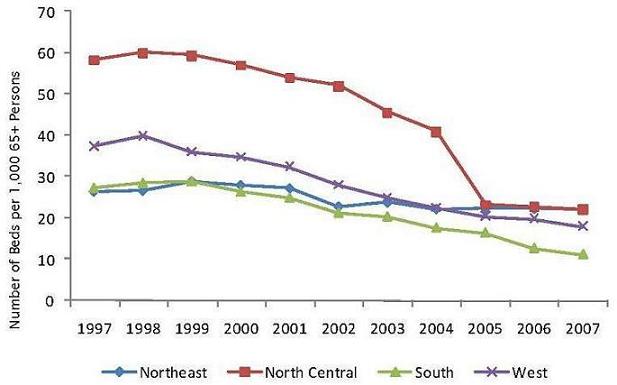 |
| FIGURE IV.3. Inpatient Rehabilitation Beds by Region |
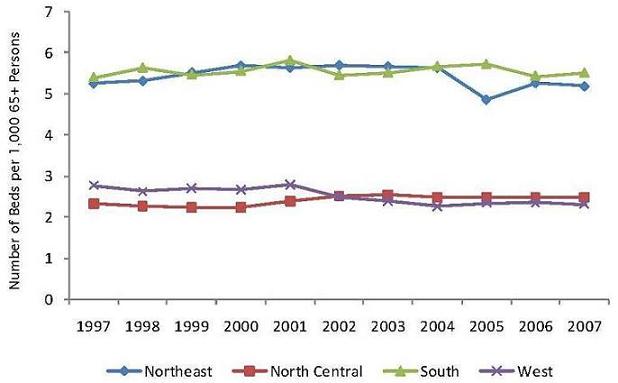 |
| FIGURE IV.4. Long-Term Care Hospital Beds by Region |
 |
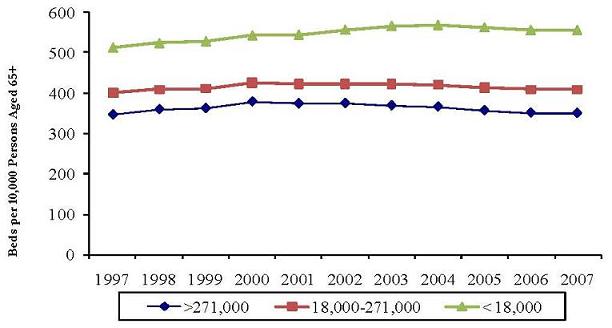
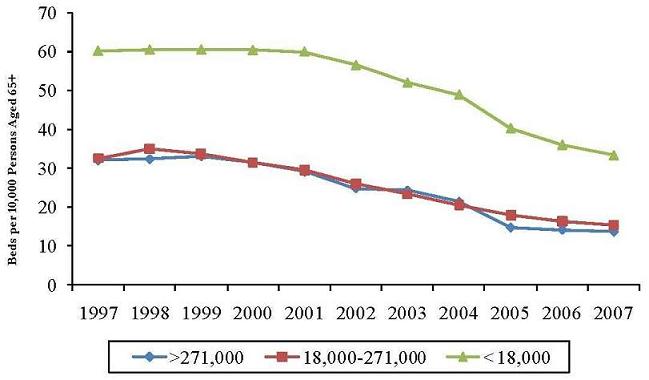
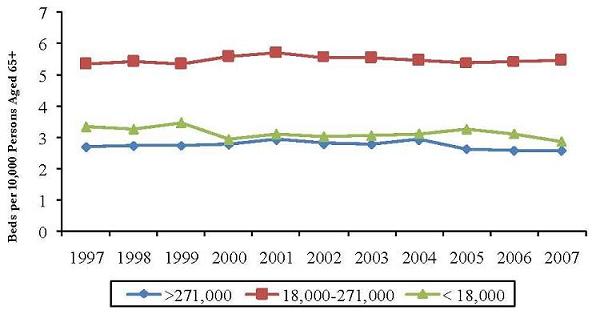
The supply of beds by size of CBSA is shown in Figure IV.5, Figure IV.6, Figure IV.7 and Figure IV.8. Supply might be expected to vary with city size for a number of reasons. LTCHs and IRFs may be unlikely to locate in smaller towns simply because they provide insufficient scale for facilities that are rarely used by Medicare beneficiaries. SNFs, on the other hand, may be more common (relative to the population) in smaller towns because the options for home care are sometimes more limited in small communities that often support large surrounding rural areas.
| FIGURE IV.5. Freestanding SNF Beds by Size of 65+ Population |
 |
| FIGURE IV.6. Hospital-Based SNF Beds by Size of 65+ Population |
 |
| FIGURE IV.7. Inpatient Rehabilitation Beds by Size of 65+ Population |
 |
| FIGURE IV.8. Long-Term Care Hospital Beds by Size of 65+ Population |
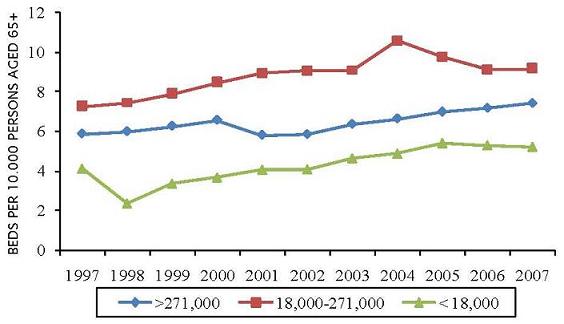 |
The inverse relationship between city size and SNF beds per person aged 65+ is evident, especially for freestanding SNFs (Figure IV.5). In 2007, freestanding SNF beds per person aged 65+ were 16 percent higher in medium-sized cities compared to large cities. Small towns had 59 percent more SNF beds per person than larger cities. The relationship was similar for hospital-based SNFs. Beds per person were nearly identical for large and medium-sized cities. In small towns, however, the number of hospital-based SNF beds per person aged 65+ was approximately double that in large and medium-sized cities.
The rate of change in SNF beds also differed by size of place. The decline in hospital-based SNF beds per person aged 65+ in large, medium, and small places over the ten-year period was 57 percent, 53 percent, and 46 percent respectively. Freestanding SNF beds per person aged 65+ increased by 1 percent in large cities, 2 percent in medium-sized cities, and 8 percent in small cities and towns.
There was no obvious relationship between LTCH or IRF beds and size of place. It is worth noting, however, that the increase in LTCH beds per person aged 65+ was strikingly similar across the three size groupings, ranging only from 25.4 percent to 27.8 percent.
E. Hospital-Based SNFs and the Growth of LTCHs
As noted earlier, the period under study was characterized by a sharp decline in the number of hospital-based SNFs and a doubling in the number of LTCHs. The most rapid changes in both occurred in states in the North Central and South. Whether the closure of so many hospital-based SNFs played some causal role in the opening of LTCHs is difficult to discern. Many hospital-based SNFs in the 1990s were providing relatively intensive care, and received exceptions from the routine cost limits in effect at the time. If these SNFs were especially likely to cease operation, as seems plausible, then it is possible that the resulting decrease in the availability of intensive post-acute care in the area may have created an opportunity for new LTCHs.
Table IV.3, Table IV.4 and Table IV.5 show the number of LTCH beds per 10,000 people aged 65 and over in CBSAs that experienced a decrease, increase, or no change in the number of hospital-based SNFs between 1997 and 2007.10 Most CBSAs experienced a decline in hospital-based SNFs and in these cities LTCH beds per person over 65 nearly doubled, from 3.7 to 7.2. By contrast, hospital-based SNFs increased over the period in only 56 CBSAs. In these cities, LTCH beds per person aged 65+ declined from 4.5 to 3.2. For the most part, this decline did not result from the closure of LTCHs. In only 3 of the 56 CBSAs was there a decline in the number of LTCHs; in 9 cities, the number of LTCHs increased. In the remaining 44 CBSAs, the number of LTCHs remained constant. Overall, in these 56 cities, the total number of LTCH beds expanded more slowly than did the over-65 population.
In 213 CBSAs, the number of hospital-based SNFs did not change over the period. In these areas too, LTCH beds per person aged 65+ declined, from 4.0 to 3.2. These results, however, are difficult to compare to the others because the average population of areas with no change in the number of SNFs is much smaller than for areas with increases or decreases in the number of SNFs.
| TABLE IV.3. Characteristics of CBSAs in Which the Number of Hospital-Based SNFs Decreased Between 1997 and 2007 | |||
| Census Region | Number of CBSAs | Percent | |
| Northeast | 34 | 9.3 | |
| North Central | 103 | 28.1 | |
| South | 160 | 43.7 | |
| West | 69 | 18.9 | |
| Measure | Mean | Min | Max |
| CBSA Population 65+ (2000) | 63,163 | 827 | 1,070,108 |
| LTCH beds per 10,000 Pop Aged 65+: 1997 | 3.7 | 0.0 | 196.4 |
| LTCH Beds per 10,000 Pop Aged 65+: 2007 | 7.2 | 0.0 | 224.0 |
| SOURCE: Analysis of 1997-2007 CMS POS Files. | |||
| TABLE IV.4. Characteristics of CBSAs in Which the Number of Hospital-Based SNF Providers Increased Between 1997 and 2007 | |||
| Census Region | Number of CBSAs | Percent | |
| Northeast | 11 | 19.6 | |
| North Central | 16 | 28.6 | |
| South | 23 | 41.1 | |
| West | 6 | 10.7 | |
| Measure | Mean | Min | Max |
| CBSA Population 65+ (2000) | 74,038 | 2,317 | 1,566,015 |
| LTCH Beds per 10,000 Pop Aged 65+: 1997 | 4.5 | 0.0 | 235.7 |
| LTCH Beds per 10,000 Pop Aged 65+: 2007 | 3.2 | 0.0 | 99.4 |
| SOURCE: Analysis of 1997-2007 CMS POS Files. | |||
| TABLE IV.5. Characteristics of CBSAs in Which the Number of Hospital-Based SNF Providers Remained Constant Between 1997 and 2007* | |||
| Census Region | Number of CBSAs | Percent | |
| Northeast | 29 | 13.0 | |
| North Central | 81 | 36.3 | |
| South | 77 | 34.5 | |
| West | 36 | 16.1 | |
| Measure | Mean | Min | Max |
| CBSA Population 65+ (2000) | 15,042 | 829 | 223,478 |
| LTCH beds per 10,000 Pop Aged 65+: 1997 | 4.0 | 0.0 | 704.2 |
| LTCH Beds per 10,000 Pop Aged 65+: 2007 | 3.2 | 0.0 | 226.9 |
| SOURCE: Analysis of 1997-2007 CMS POS Files. * CBSAs with no hospital-based SNF providers in either 1997 or 2007 are excluded. | |||
Finally, Table IV.6 shows LTCH beds per 10,000 persons aged 65+, arrayed not against the change in the number of SNFs, but rather against the configuration of hospital-based and freestanding SNFs in 1997. The results, at least at this level of aggregation, indicate that CBSAs can be partitioned into three broad categories: (1) areas that had no hospital-based SNF in 1997 and showed little change in LTCH beds per person, (2) areas with one hospital-based SNF in 1997 and rapid growth in LTCH beds per person, and (3) areas with more than one hospital-based SNF in 1997 and moderate growth in LTCH beds per person. Category 3 contains most large urban areas, and had a far higher number of LTCH beds per person in both 1997 and 2007 than did the other two categories. Category 2, despite rapid growth in the number of LTCH beds per person, had a much lower number of LTCH beds per person in 2007 than did Category 3 in 1997.
| TABLE IV.6. LTCH Beds per 10,000 Persons Aged 65+, by Configuration of Hospital-Based and Freestanding SNF Beds in 1997 | |||||
| Configuration of Hospital-Based and Freestanding SNFs, 1997 | |||||
| Category 1 | Category 2 | Category 3 | |||
| HB SNFS:1997 | 0 | 0 | 1 | 1 | >1 |
| FS SNFS:1997 | 0 | >0 | 0 | >0 | >1 |
| Means for Outcome Measures | |||||
| Category 1 | Category 2 | Category 3 | |||
| Pop Aged 65+ | 3,680 | 11,699 | 3,576 | 12,945 | 93,393 |
| LTCH Beds per 10,000 Persons Aged 65+ in: | |||||
| 1997 | 0 | 4.36 | 0 | 0.86 | 7.17 |
| 2007 | 0 | 4.54 | 12.6 | 3.13 | 8.37 |
| N | 15 | 333 | 18 | 311 | 277 |
Taken together, Table IV.6 and Table IV.3 and Table IV.4, suggest that the growth in LTCH beds per person in areas that lost hospital-based SNFs was driven largely by the growth of LTCHs in smaller cities and towns that had a single hospital-based SNF in 1997. While the population of these areas is small, on average, the areas represent just over one third of all United States CBSAs. As we shall see later, entry of LTCHs into areas that lost all hospital-based SNFs during this period showed dramatic changes in post-acute care, compared with similar areas that LTCHs did not enter.
V. MEDICARE INSTITUTIONAL POST-ACUTE CARE: 1998-2006
A. Background
This chapter examines trends and characteristics of episodes of post-acute care for Medicare beneficiaries discharged from short-stay hospitals in the period from 1998 to 2006. Its particular aim is to gauge the effects of the changing number of LTCHs and hospital-based SNFs in United States cities and towns on the nature of post-acute care episodes for medically complex patients. By general agreement, the case-mix adjustment system used for Medicare SNF care does not capture the specific care needs of medically complex patients nearly as accurately as it does the needs of patients who require rehabilitation therapy. The site of post-acute care for medically complex patients may therefore have responded more strongly to the introduction of the SNF PPS than did the site of care for patients who required rehabilitation services.
The analyses reported here focus on trends in the number of episodes, discharge destination, rehospitalization within the first 60 days after discharge from an index hospital stay, and growth in Medicare payment per episode. Section B examines regional variation in episodes of post-acute care. As Chapter IV showed, the availability and patterns of growth of particular types of post-acute care, in particular LTCHs, varied markedly across Regions. The extent to which differences in supply measured at such a high level of aggregation can shape episodes of post-acute care is, of course, a matter of debate. Nonetheless, displaying the characteristics of episodes across Regions provides a useful overview of the variation in patterns of care.
Section C assesses differences in episodes of care in areas with differing rates of growth in the supply of hospital-based SNFs and LTCHs. It first examines differences across episodes in areas defined by the change in hospital-based SNF beds. It then limits the analysis to a set of 27 communities in which all hospital-based SNFs left the Medicare program between 1997 and 2006, comparing those communities that one or more LTCHs entered during the period with those that remained without any LTCH provider. It also reports estimates of the regression model described in Chapter III.
B. Post-Acute Care Episodes for Beneficiaries with Medically Complex Conditions
1. Expansion of Post-Acute Care Use: 1998-2006
Table V.1 shows the number of post-acute care episodes for beneficiaries with medically complex diagnoses who were discharged from acute care stays in 1998 and 2006. In every Region except the West, the number of medically complex episodes increased more rapidly than the number of rehabilitation episodes and also more rapidly than the size of the Medicare population in the Region. By 2006, the number of post-acute episodes per 1,000 beneficiaries was nearly identical in the Northeast, North Central, and South. Post-acute care use in the West was over 30 percent lower than in other Regions. In the West, the percentage increases in medically complex and rehabilitation episodes were nearly identical (about 6 percent), and were far smaller than the growth of the Medicare population (15.9 percent).
| TABLE V.1. Growth in Post-Acute Care for Medicare Beneficiaries with Medically Complex Diagnoses, by Census Region: 1998 and 2006 | |||||
| Northeast | North Central | South | West | U.S. | |
| Medically Complex Episodes | |||||
| 1998 | 66,022 | 73,828 | 118,550 | 47,301 | 306,112 |
| 2006 | 81,762 | 91,527 | 148,704 | 50,147 | 372,355 |
| % Change in Medically Complex Episodes | 23.8 | 24.0 | 25.4 | 6.0 | 21.6 |
| % Change in Rehab Episodes | 16.2 | 6.3 | 15.4 | 5.9 | 11.9 |
| % Change in Medicare Population | 4.3 | 6.5 | 14.4 | 15.9 | 10.6 |
| Post-acute episodes per 1,000 Medicare Beneficiaries, 2006 | 10.2 | 10.0 | 11.0 | 6.9 | 9.8 |
2. Changes in the Provision of Care
Table V.2 shows the distribution of discharge destinations for beneficiaries with medically complex diagnoses in 1998 and 2006. Despite the sharp decline in discharges to hospital-based SNFs, the proportion of beneficiaries discharged to a hospital-based or freestanding SNF fell only slightly in the North Central, South and West, and actually increased in the Northeast. There is an inverse relationship between the proportional decline in discharge to hospital-based SNFs over the period and the proportional increase in discharge to LTCHs. The Northeast showed the smallest decline in discharge to hospital-based SNF (54 percent) and the smallest relative increase in discharge to an LTCH (16 percent). The South showed the largest decline in discharge to hospital-based SNF (70 percent) and the largest increase in discharge to LTCH (94 percent). It is important to bear in mind that the figures reported in the table represent proportions of beneficiaries who received some institutional post-acute care, not proportions of all beneficiaries discharged from an acute care stay.11
The table also shows the trend toward post-acute episodes with multiple providers. In every Census Region, the number of one provider episodes declined, by amount ranging from 7 to 10 percentage points, while the number of episodes with three or more providers increased. By 2006, nearly half of all episodes included two or more providers. Note that acute care hospitals are counted as post-acute care providers for those episodes in which a beneficiary is rehospitalized.
3. The Duration of Episodes
As a general rule, prospective payment is observed to reduce length of stay for providers that are paid on a per-stay basis, as LTCHs and IRFs are. It may also reduce mean length of stay for providers such as SNFs, that are paid on a per-diem basis if it induces providers to reduce staffing levels and so find themselves unable to care for patients suffering from acute exacerbations or other events that require periods of intense care. These events are more likely to occur for medically complex patients than for rehabilitation or other patients because their conditions are less likely to be stable. Even if provider-level length of stay is reduced, however, the length of episodes can increase if the number of post-acute stays per episode increases or if the composition of episodes changes in such as way as to increase the proportion of providers with higher-than-average length of stay.
| TABLE V.2. Distribution of Initial Provider and Number of Providers for Episodes of Post-Acute Care for Medically Complex Patients, by Census Region: 1998 and 2006 | |||||
| Northeast | North Central | South | West | U.S. | |
| Percent of beneficiaries discharged from acute care stay to: | |||||
| Hosp-based SNF | |||||
| 1998 | 17.4 | 28.0 | 25.7 | 35.0 | 26.0 |
| 2006 | 8.0 | 11.4 | 7.8 | 11.5 | 9.2 |
| Freestanding SNF | |||||
| 1998 | 64.5 | 51.7 | 51.0 | 47.7 | 53.5 |
| 2006 | 74.6 | 65.1 | 64.9 | 64.5 | 67.1 |
| LTCH | |||||
| 1998 | 3.1 | 2.0 | 3.2 | 3.3 | 2.9 |
| 2006 | 3.6 | 2.8 | 6.2 | 5.5 | 4.8 |
| IRF | |||||
| 1998 | 14.3 | 17.9 | 19.4 | 13.3 | 17.0 |
| 2006 | 13.2 | 20.3 | 20.6 | 18.0 | 18.5 |
| Distribution of number of providers per episode | |||||
| 1 provider | |||||
| 1998 | 58.1 | 62.3 | 60.2 | 63.9 | 60.8 |
| 2006 | 51.3 | 52.3 | 52.6 | 56.7 | 52.8 |
| 2 providers | |||||
| 1998 | 35.5 | 30.4 | 31.8 | 27.9 | 31.6 |
| 2006 | 39.8 | 31.8 | 36.5 | 32.4 | 35.5 |
| 3+ providers | |||||
| 1998 | 5.6 | 6.6 | 6.5 | 7.2 | 6.4 |
| 2006 | 6.5 | 7.2 | 7.2 | 7.5 | 7.0 |
Table V.3 shows the mean duration of post-acute care episodes, overall, by type of initial provider, and by number of post-acute providers.
| TABLE V.3. Duration of Post-Acute Episodes Among Medically Complex Patients by Census Region: 1998 and 2006 | |||||
| Northeast | North Central | South | West | U.S. | |
| Mean Episode Duration (Days) | |||||
| 1998 | 93.3 | 63.8 | 60.1 | 53.4 | 67.1 |
| 2006 | 75.3 | 68.4 | 69.9 | 62.9 | 69.8 |
| Percent Change | -19.3 | 7.2 | 16.3 | 18.0 | 4.0 |
| Mean Episode Duration by Initial Provider Type | |||||
| Hospital-based SNF | |||||
| 1998 | 57.3 | 44.3 | 42.2 | 39.6 | 44.4 |
| 2006 | 51.6 | 47.1 | 47.2 | 41.9 | 47.2 |
| Percent Change | -9.9 | 6.3 | 11.8 | 5.8 | 6.3 |
| Freestanding SNF | |||||
| 1998 | 110.4 | 79.2 | 72.7 | 62.7 | 82.7 |
| 2006 | 74.1 | 74.0 | 73.2 | 65.0 | 72.5 |
| Percent Change | -32.9 | -6.6 | 0.7 | 3.7 | -12.3 |
| LTCH | |||||
| 1998 | 75.6 | 69.6 | 69.9 | 69.7 | 71.1 |
| 2006 | 67.0 | 73.0 | 65.7 | 72.8 | 68.0 |
| Percent Change | -11.4 | 4.9 | -6.0 | 4.4 | -4.4 |
| IRF | |||||
| 1998 | 59.1 | 48.6 | 48.4 | 49.7 | 50.6 |
| 2006 | 55.8 | 53.2 | 52.0 | 51.8 | 52.9 |
| Percent Change | -5.6 | 9.6 | 7.5 | 4.2 | 4.6 |
| Mean Episode Duration by Number of Episode Providers | |||||
| 1 Provider | |||||
| 1998 | 70.1 | 48.4 | 41.7 | 36.3 | 48.3 |
| 2006 | 45.1 | 46.7 | 43.5 | 39.7 | 44.0 |
| Percent Change | -35.7 | -3.5 | 4.3 | 9.4 | -8.9 |
| 2 Providers | |||||
| 1998 | 120.8 | 83.2 | 82.3 | 74.5 | 90.7 |
| 2006 | 91.8 | 86.1 | 86.7 | 80.5 | 87.0 |
| Percent Change | -24.0 | 3.5 | 5.3 | 8.1 | -4.1 |
| 3 Providers | |||||
| 1998 | 157.4 | 117.5 | 120.8 | 114.9 | 126.2 |
| 2006 | 131.3 | 125.8 | 129.6 | 125.9 | 128.5 |
| Percent Change | -16.6 | 7.1 | 7.3 | 9.6 | 1.8 |
| 4+ Providers | |||||
| 1998 | 195.2 | 172.4 | 176.6 | 181.1 | 179.3 |
| 2006 | 179.2 | 181.4 | 178.4 | 193.7 | 181.8 |
| Percent Change | -8.2 | 5.2 | 1.0 | 7.0 | 1.4 |
In 1998, post-acute episodes were much longer in the Northeast than in any other Region, regardless of the initial provider or the number of providers. During the years from 1998 to 2006, episodes in the Northeast declined sharply in duration, from 93 to 75 days, on average. In other Regions, especially in the South and West, episode durations increased. Much of the increase in episode duration in those Regions appears to be due to the reallocation of post-acute care away from hospital-based SNF care and toward LTCH and freestanding SNF care.
4. Episodes with Multiple Providers
By 2006, nearly half of post-acute episodes for medically complex beneficiaries involved two or more providers, as Table V.2 showed. This trend is of special interest for policy because it has led to increased Medicare spending without corresponding evidence that patient outcomes have improved.
| TABLE V.4. Rehospitalization and Discharge of Medically Complex Patients to Other Post-Acute Locations, by Census Region: 1998 and 2006 | |||||
| Northeast | North Central | South | West | U.S. | |
| Number of beneficiaries discharged from acute care stay to LTCH | |||||
| 1998 | 2,072 | 1,504 | 3,754 | 1,541 | 8,870 |
| 2006 | 2,951 | 2,607 | 9,277 | 2,780 | 17,615 |
| Percent of these stays subsequently discharged to: | |||||
| Rehospitalization | |||||
| 1998 | 32.0 | 20.7 | 23.5 | 18.2 | 24.1 |
| 2006 | 37.2 | 27.4 | 27.1 | 24.4 | 28.4 |
| Freestanding SNF | |||||
| 1998 | 14.2 | 18.9 | 18.6 | 27.2 | 19.1 |
| 2006 | 21.5 | 34.6 | 27.6 | 35.0 | 28.8 |
| Number of beneficiaries discharged from acute care stay to Hosp-based SNF | |||||
| 1998 | 11,502 | 20,693 | 30,495 | 16,544 | 79,234 |
| 2006 | 6,531 | 10,473 | 11,546 | 5,768 | 34,318 |
| Percent of these stays subsequently discharged to: | |||||
| Rehospitalization | |||||
| 1998 | 39.3 | 34.6 | 35.1 | 30.5 | 34.6 |
| 2006 | 43.0 | 41.7 | 42.2 | 36.0 | 41.2 |
| Freestanding SNF | |||||
| 1998 | 8.7 | 12.1 | 11.1 | 13.0 | 11.4 |
| 2006 | 12.1 | 24.5 | 13.0 | 21.0 | 16.9 |
| Number of beneficiaries discharged from acute care stay to freestanding SNF | |||||
| 1998 | 42,597 | 38,193 | 60,402 | 22,567 | 163,758 |
| 2006 | 61,025 | 59,600 | 96,440 | 32,324 | 249,389 |
| Percent of these stays subsequently discharged to: | |||||
| Rehospitalization | |||||
| 1998 | 44.7 | 36.5 | 41.6 | 32.3 | 40.0 |
| 2006 | 53.0 | 46.2 | 51.8 | 43.5 | 49.7 |
| LTCH | |||||
| 1998 | 0.1 | 0.1 | 0.2 | 0.2 | 0.1 |
| 2006 | 0.1 | 0.1 | 0.3 | 0.3 | 0.2 |
Table V.4 shows rates of discharge of medically complex patients to specified other post-acute providers among those discharged from acute care stays to LTCHs, hospital-based SNFs, and freestanding SNFs. Between 1998 and 2006, these rates increased for each of the three provider types and in each Census Region, by amounts ranging from four to ten percentage points. Rates of discharge from both LTCH and hospital-based SNFs to freestanding SNFs increased over the period. By 2006, the rates of discharge from LTCH to freestanding SNF varied from 20 percent to 35 percent; rates of discharge from hospital-based SNFs to freestanding SNFs varied from 12 percent to 25 percent. It is possible that many patients transferred to freestanding SNFs had very short Medicare stays and were subsequently admitted to a nursing facility co-located with the SNF. Why rates of transfer to freestanding SNFs increased between 1998 and 2006 is not immediately clear.
Increased rates of rehospitalization from both LTCHs and SNFs, by contrast, might well have been an expected outcome of the introduction of prospective payment. With payment for each patient stay divorced from the cost of that stay, many facilities may have reduced clinical staffing, thereby reducing their ability to manage even minor exacerbations of patient conditions, and making it more likely that a patient would be sent to an acute care hospital for treatment.
Marked regional differences were evident. Medically complex patients, whether discharged to hospital-based SNFs, LTCHs, or freestanding SNFs, were most likely to rehospitalized in the Northeast and least likely to be rehospitalized in the West in both 1998 and 2006. Patients in the Northeast were also least likely to be discharged from hospital-based SNFs or LTCHs to freestanding SNFs in both years.
5. Medicare Payment for Post-Acute Care
The level and rate of change in total Medicare payment per episode is determined by the number and type of providers who make up the episode and by the length of time beneficiaries spend in SNF care.12 Increased use of multiple providers and increased use of LTCH and IRF care were both evident in Table V.2. As Table V.5 shows, Medicare outlays for post-acute care provided to medically complex patients increased by nearly 50 percent (over 6 percent per year) between 1998 and 2006. In 2006, the cost of care was over $22,000 per episode.
Payment for episodes that began with a stay in a freestanding SNF increased much more rapidly than payment for other episodes. This increase may be the result of the 21.8 percent increase in SNF rates in FY 2001 and the additional changes to SNF payment rates, effective in January 2006, that were particularly likely to affect those with medically complex diagnoses. Nine additional RUG classes were added to capture expected costs associated with patients who satisfied criteria for both extensive services and rehabilitation care. The nursing index of all RUG classes was also increased by 9 percent.
| TABLE V.5. Medicare Payments for Episodes of Post-Acute Care for Medically Complex Patients, by Census Region: 1998 and 2006 | |||||
| Northeast | North Central | South | West | U.S. | |
| Mean Episode Payment | |||||
| 1998 | $16,457 | $12,831 | $14,876 | $15,947 | $14,900 |
| 2006 | $23,901 | $19,673 | $21,867 | $24,929 | $22,181 |
| Percent Change | 44.4 | 53.3 | 47.0 | 56.3 | 48.9 |
| Mean Episode Payment by Initial Provider Type | |||||
| Hospital-Based SNF | |||||
| 1998 | $12,142 | $10,198 | $11,686 | $12,436 | $11,501 |
| 2006 | $15,595 | $13,343 | $13,391 | $15,408 | $14,145 |
| Percent Change | 28.4 | 30.8 | 14.6 | 23.9 | 23.0 |
| Freestanding SNF | |||||
| 1998 | $14,662 | $10,858 | $13,107 | $14,193 | $13,135 |
| 2006 | $22,422 | $18,656 | $19,738 | $22,474 | $20,544 |
| Percent Change | 53.3 | 71.8 | 50.6 | 58.3 | 56.4 |
| LTCH | |||||
| 1998 | $30,143 | $39,839 | $39,846 | $48,073 | $39,002 |
| 2006 | $45,140 | $53,704 | $46,505 | $58,904 | $49,230 |
| Percent Change | 49.8 | 34.8 | 16.7 | 22.5 | 26.2 |
| IRF | |||||
| 1998 | $27,069 | $19,654 | $19,556 | $23,724 | $21,466 |
| 2006 | $33,365 | $26,258 | $25,751 | $30,877 | $27,798 |
| Percent Change | 23.3 | 33.6 | 31.7 | 30.2 | 29.5 |
| Mean Episode Payment by Number of Episode Providers | |||||
| 1 Provider | |||||
| 1998 | $8,996 | $7,335 | $8,937 | $8,727 | $8,516 |
| 2006 | $12,609 | $11,901 | $12,708 | $13,630 | $12,622 |
| Percent Change | 40.2 | 62.2 | 42.2 | 56.2 | 48.2 |
| 2 Providers | |||||
| 1998 | $24,312 | $18,996 | $20,945 | $23,717 | $21,670 |
| 2006 | $32,767 | $27,090 | $28,589 | $33,634 | $29,899 |
| Percent Change | 34.8 | 42.6 | 36.5 | 41.8 | 38.0 |
| Mean Episode Payment by Number Of Episode Providers | |||||
| 3 Providers | |||||
| 1998 | $44,612 | $34,835 | $39,085 | $47,094 | $40,472 |
| 2006 | $62,375 | $52,745 | $56,808 | $72,826 | $59,183 |
| Percent Change | 41.2 | 51.4 | 45.3 | 54.6 | 46.2 |
| 4+ Providers | |||||
| 1998 | $66.576 | $60,881 | $64,749 | $82,908 | $67,848 |
| 2006 | $99,192 | $96,047 | $92,718 | $121,611 | $99,129 |
| Percent Change | 49.0 | 57.8 | 43.2 | 46.7 | 46.1 |
| NOTE: Payments are not adjusted for inflation. | |||||
C. Post-Acute Episodes and the Changing Supply of LTCHs and Hospital-Based SNFs
In order to examine more directly the relationship between changes in the supply of LTCH and hospital-based SNF beds and the nature of post-acute care, this section segments episodes into geographic areas defined by the change in the configuration of hospital-based SNFs and LTCHs. Section 1 examines changes in discharge destination and Medicare payment based solely on the change in hospital-based SNF beds per 10,000 beneficiaries. In Section 2, the locus of attention is restricted to a small number of CBSAs: 15 communities in which all hospital-based SNFs exited the Medicare program and at least one LTCH entered during the period from 1998 to 2006, and 17 communities that in which all hospital-based SNFs exited the Medicare program, but which had no LTCHs throughout the period. Section 3 reports the results of the first-difference regression models described in Chapter III.
1. Post-Acute Episodes and the Supply of Hospital-Based SNFs
In many communities, hospital-based SNFs are regarded as the primary source for post-acute care for medically complex patients because they provide a mix of staffing and services that many freestanding SNFs do not (Liu and Jones 2007). The rapid decline in hospital-based SNFs after 1998 would have forced discharge planners to seek other locations for care, a process that would necessarily be guided by the types of care available in each particular community.
Table V.6 summarizes characteristics of post-acute episodes for medically complex patients in groups of CBSAs, defined by the change in hospital-based SNF beds over the period from 1998 to 2006.
| TABLE V.6. Discharge Destination and Medicare Episode Payment, by Change in Hospital-Based SNF Beds: 1998 and 2006 | ||||||
| Change in Hospital-Based SNF Beds Per 10,000 Beneficiaries: 1998-2006 | ||||||
| Decreaseof 8 or More Beds | Decrease of 3 to 8Beds | Decrease of 1 to 3Beds | Decrease of 0 to 1Bed | 0 in Both 1998 and 2006 | Increase inBeds Per Beneficiary | |
| Number of Episodes | ||||||
| 1998 | 23,712 | 37,141 | 108,325 | 43,844 | 31,140 | 39,633 |
| 2006 | 26,911 | 37,964 | 122,507 | 56,610 | 39,270 | 55,197 |
| % Change in Medically Complex Episodes | 13.5 | 2.2 | 13.1 | 29.1 | 26.1 | 39.3 |
| Percent Discharged from Acute Care Stay to: | ||||||
| Hosp-based SNF | ||||||
| 1998 | 35.5 | 37.6 | 32.1 | 21.7 | 5.4 | 18.2 |
| 2006 | 15.9 | 10.5 | 7.8 | 9.2 | 2.1 | 13.2 |
| % Change for Medically Complex | -55.2 | -72.1 | -75.7 | -57.6 | -61.7 | -27.5 |
| % Change for Rehab | -52.2 | -66.5 | -65.2 | -32.4 | -57.0 | -4.9 |
| Freestanding SNF | ||||||
| 1998 | 48.7 | 42.7 | 48.7 | 60.4 | 69.8 | 60.8 |
| 2006 | 63.1 | 61.6 | 66.8 | 72.0 | 74.3 | 67.5 |
| LTCH | ||||||
| 1998 | 1.2 | 3.1 | 4.9 | 1.4 | 1.8 | 1.8 |
| 2006 | 3.6 | 6.2 | 7.8 | 2.5 | 3.1 | 2.3 |
| Mean episode payment | ||||||
| 1998 | $12,482 | $13,871 | $16,195 | $14,284 | $13,496 | $16,690 |
| 2006 | $19,345 | $21,402 | $24,491 | $21,994 | $20,237 | $23,131 |
| % Change | 55.0 | 54.3 | 51.2 | 54.0 | 50.0 | 38.6 |
The rate of discharge to hospital-based SNFs declined in every category, even among communities in which the ratio of hospital-based SNF beds to beneficiaries increased. Discharge to freestanding SNFs increased over the same period. The largest relative increase in discharge to freestanding SNFs occurred in areas with the largest relative decline in discharge to hospital-based SNFs. Rehabilitation patients were also less likely to be discharged to hospital-based SNFs. However, the percentage decline in was in every case lower for rehabilitation than for medically complex patients.
For LTCHs, the pattern was different. The rate of discharge to LTCH increased in every area, but the relative increase in LTCH admissions from acute care hospitals was more strongly associated with the decline in hospital-based SNF beds per beneficiary than with the change in hospital-based SNF admissions.
There was no discernable relationship between total Medicare episode payment and change in hospital-based SNF beds per beneficiary over the period. The percentage increase in payment was substantially lower in areas in which beds per beneficiary increased. However the 1998 value of Medicare payments was greatest in those same areas, which suggests that some factors other than the change in hospital-based SNF beds may be important.
2. Post-Acute Episodes in Communities That Lost Hospital-Based SNFs
In this section, we examine more directly the structure of episodes in communities (without LTCHs in 1998) that lost all hospital-based SNFs and either gained one or more LTCHs or remained without any LTCH. Table V.7 compares discharge destination and episode cost for both groups of communities.
With no remaining hospital-based SNFs to provide care, discharges to these facilities naturally declined to nearly zero in both sets of communities, for both medically complex and rehabilitation patients. For communities in which LTCHs did not open, the decline in admissions to hospital-based SNFs was accompanied by a nearly equal increase in admissions to freestanding SNFs. The proportion of medically complex patients discharged to a SNF of some kind was nearly unchanged (79.3 percent in 1998, and 77.9 percent in 2006). Rehabilitation patients in these areas were less likely to be discharged to a SNF in 2006 than in 1998, a change accompanied by a corresponding increase in discharges to IRFs and hospital rehabilitation units (not shown in the table).
In communities that gained LTCHs, discharges of medically complex patients to any type of SNF fell from 80.5 percent to 70.0 percent and discharges of to LTCHs increased from less than 1 percent to nearly 11 percent. While discharge of rehabilitation patients to SNFs remained nearly unchanged, discharge to LTCHs increased from 0 to 2.3 percent.
Rates of rehospitalization increased among all groups, though only slightly for rehabilitation patients. Among medically complex patients, the rate of rehospitalization increased more rapidly in areas that LTCHs did not enter, suggesting that the richer mix of services available in LTCHs may have prevented some patients from being rehospitalized in areas that LTCHs entered.
The association between LTCH entry and Medicare episode payment is striking. In the communities that LTCHs did not enter, the increase in episode payment over the nine-year period was virtually identical for medically complex and rehabilitation episodes--about 39 percent. In communities that LTCHs entered, the increase was slightly higher for rehabilitation episodes (44 percent) and much higher (68 percent) for medically complex episodes, despite the smaller increase in rehospitalization in areas that LTCHs entered. Mean Medicare episode payment for medically complex patients in the two areas was nearly equal in 1998. By 2006, mean Medicare payment in areas that LTCHs entered was over 20 percent higher than in areas with no LTCHs.
| TABLE V.7. Medicare Post-Acute Episodes for Medically Complex and Rehab Patients in Communities That Lost All Hospital-Based SNFs: 1998 and 2008 | ||||
| Gained One or More LTCHsa | No LTCHs in 1998 or 2006b | |||
| Medically Complex | Rehab | Medically Complex | Rehab | |
| Number of Episodes | ||||
| 1998 | 4,946 | 3,325 | 4,256 | 2,950 |
| 2006 | 5,013 | 3,564 | 4,640 | 3,182 |
| Percent of Acute Care Discharges to: | ||||
| Hosp-based SNF | ||||
| 1998 | 21.1 | 18.7 | 17.8 | 35.9 |
| 2006 | 0.4 | 0.5 | 0.2 | 0.2 |
| Freestanding SNF | ||||
| 1998 | 59.4 | 40.6 | 61.5 | 46.2 |
| 2006 | 69.6 | 61.0 | 77.7 | 73.7 |
| LTCH | ||||
| 1998 | 0.8 | 0.0 | 1.1 | 0.2 |
| 2006 | 10.6 | 2.3 | 0.7 | 0.1 |
| Rehospitalization Rate | ||||
| 1998 | 25.3 | 13.4 | 23.6 | 14.1 |
| 2006 | 28.1 | 14.5 | 29.1 | 15.1 |
| Mean Episode Payment | ||||
| 1998 | $13,281 | $10,188 | $13,415 | $8,881 |
| 2006 | $22,362 | $14,656 | $18,608 | $13,033 |
| % Change | 68.4 | 43.9 | 38.7 | 38.6 |
| ||||
Table V.8 and Table V.9 report estimates of the fixed-effect regression model specified in Chapter III for medically complex and rehabilitation episodes. The model was estimated separately by Census Region to investigate regional differences in the response to changes in the number of LTCHs and hospital-based SNFs.
There is clear evidence of a negative effect of additional LTCHs on discharges of medically complex patients from hospital to SNF in the South but the size of the effect is quite small. By contrast, increases in LTCHs in a city appear to evoke strong increases in discharges to LTCHs in all Regions for both medically complex and rehabilitation patients.
| TABLE V.8. Fixed-Effect Regression Results for Medically Complex Patients, by Census Region: 1998-2006 | ||||
| Log (Proportion Discharged to SNF) | Log (Proportion Discharged to LTCH) | Log (Proportion Rehospitalized) | Log (Payment per Episode) | |
| Northeast | ||||
| LTCH_INCR1 | -0.039 | 2.144** | -0.015 | 0.051** |
| (0.025) | (0.307) | (0.019) | (0.017) | |
| LTCH_INCR2 | 0.028 | -0.600 | -0.001 | 0.008 |
| (0.037) | (0.450) | (0.027) | (0.025) | |
| HSNF_DECR1 | -0.074** | -0.092 | -0.065** | -0.038** |
| (0.028) | (0.339) | (0.021) | (0.019) | |
| HSNF_DECR2 | 0.005 | -0.168 | 0.007 | -0.022 |
| (0.035) | (0.424) | (0.026) | (0.024) | |
| N | 798 | 798 | 798 | 798 |
| North Central | ||||
| LTCH_INCR1 | 0.032 | 1.540** | -0.009 | 0.044** |
| (0.056) | (0.246) | (0.044) | (0.014) | |
| LTCH_INCR2 | 0.085 | -0.299 | 0.048 | -0.041** |
| (0.084 | (0.364) | (0.066) | (0.022) | |
| HSNF_DECR1 | -0.020 | 0.112 | 0.010 | 0.032** |
| (0.053) | (0.229) | (0.041) | (0.014) | |
| HSNF_DECR2 | 0.026 | -0.545 | 0.026 | 0.008 |
| (0.108) | (0.470) | (0.085) | (0.029) | |
| N | 2,178 | 2,178 | 2,178 | 2,178 |
| South | ||||
| LTCH_INCR1 | -0.077** | 1.531** | -0.025 | 0.040** |
| (0.038) | (0.191) | (0.022) | (0.010) | |
| LTCH_INCR2 | -0.114** | -0.340 | -0.038 | 0.021 |
| (0.053) | (0.267) | (0.031) | (0.014) | |
| HSNF_DECR1 | -0.006 | 0.692** | -0.003 | 0.028** |
| (0.046) | (0.228) | (0.026) | (0.012) | |
| HSNF_DECR2 | -0.120 | -0.706* | -0.010 | -0.007 |
| (0.079) | (0.395) | (0.046) | (0.020) | |
| N | 3,058 | 3,058 | 3,058 | 3,058 |
| West | ||||
| LTCH_INCR1 | -0.096 | 1.958** | 0.033 | 0.073** |
| (0.070) | (0.315) | (0.094) | (0.023) | |
| LTCH_INCR2 | -0.071 | 0.260 | 0.041 | 0.049 |
| (0.127) | (0.573) | (0.172) | (0.043) | |
| HSNF_DECR1 | -0.078 | -0.313 | -0.002 | 0.020 |
| (0.061) | (0.277) | (0.083) | (0.021) | |
| HSNF_DECR2 | -0.036 | 0.446 | -0.009 | 0.0 |
| (0.080) | (0.359) | (0.108) | (0.027) | |
| N | 1,431 | 1,431 | 1,431 | 1,431 |
| NOTE: ** Statistically significant at 0.05 level. * Statistically significant at 0.10 level. Standard errors in parentheses. | ||||
| TABLE V.9. Fixed-Effect Regression Results for Rehabilitation Patients, by Census Region: 1998-2006 | ||||
| Log (Proportion Discharged to SNF) | Log (Proportion Discharged to LTCH) | Log (Proportion Rehospitalized) | Log (Payment per Episode) | |
| Northeast | ||||
| LTCH_INCR1 | 0.018 | 2.454** | -0.001 | 0.027 |
| (0.048) | (0.297) | (0.069) | (0.022) | |
| LTCH_INCR2 | 0.020 | -0.533 | 0.049 | 0.053 |
| (0.072) | (0.441) | (0.102) | (0.033) | |
| HSNF_DECR1 | 0.004 | -0.205 | -0.137* | -0.061** |
| (0.053) | (0.329) | (0.076) | (0.024) | |
| HSNF_DECR2 | -0.039 | 0.314 | 0.022 | -0.047 |
| (0.066) | (0.409) | (0.095) | (0.030) | |
| N | 787 | 787 | 787 | 787 |
| North Central | ||||
| LTCH_INCR1 | 0.058 | 2.130** | -0.121 | -0.034* |
| (0.078) | (0.193) | (0.114) | (0.019) | |
| LTCH_INCR2 | 0.124 | 0.630** | 0.068 | -0.057** |
| (0.119) | (0.293) | (0.173) | (0.029) | |
| HSNF_DECR1 | -0.175** | -0.015 | -0.002 | 0.032* |
| (0.077) | (0.189) | (0.111) | (0.019) | |
| HSNF_DECR2 | 0.197 | 0.954** | -0.103 | -0.073** |
| (0.149) | (0.366) | (0.216) | (0.036) | |
| N | 2,030 | 2,030 | 2,030 | 2,030 |
| South | ||||
| LTCH_INCR1 | -0.099 | 2.659** | -0.016 | 0.009 |
| (0.067) | (0.169) | (0.059) | (0.013) | |
| LTCH_INCR2 | -0.107 | 0.069 | -0.027 | -0.011 |
| (0.095) | (0.242) | (0.085) | (0.019) | |
| HSNF_DECR1 | -0.114 | 0.585** | -0.031 | 0.078** |
| (0.084) | (0.213) | (0.075) | (0.017) | |
| HSNF_DECR2 | -0.284** | -0.228 | -0.092 | 0.011 |
| (0.136) | (0.345) | (0.121) | (0.027) | |
| N | 2,634 | 2,634 | 2,634 | 2,634 |
| West | ||||
| LTCH_INCR1 | 0.020 | 2.757** | 0.014 | 0.001 |
| (0.069) | (0.212) | (0.152) | (0.026) | |
| LTCH_INCR2 | -0.163 | -0.729* | 0.013 | 0.059 |
| (0.126) | (0.387) | (0.278) | (0.048) | |
| HSNF_DECR1 | 0.054 | -0.042 | -0.056 | 0.125** |
| (0.061) | (0.187) | (0.134) | (0.023) | |
| HSNF_DECR2 | -0.015 | -0.126 | 0.150 | -0.015 |
| (0.077) | (0.238) | (0.171) | (0.030) | |
| N | 1,302 | 1,302 | 1,302 | 1,302 |
| NOTE: ** Statistically significant at 0.05 level. * Statistically significant at 0.10 level. Standard errors in parentheses. | ||||
Although LTCHs have a richer mix of staff and services than other post-acute care environments, there is no evidence that increases in the use of LTCHs reduce rates of rehospitalization, for either medically complex or rehabilitation patients. This result is consistent with results from tables presented earlier in this chapter.
Finally, increases in LTCHs are associated with increases in Medicare episode payments for medically complex patients in every Region, although the magnitude of the effect is not large. An increase in LTCHs is associated with an increase in mean episode payment of between 5 percent and 7 percent. Among rehabilitation patients, there is no evidence of an association between LTCH beds and episode payment. Note also that in the North Central and South, decreases in hospital-based SNFs were associated with higher episode payments, though the opposite is true in the Northeast.
VI. SUMMARY AND DISCUSSION
Post-acute care provides a transition for patients who require further skilled care after hospital discharge before returning home or perhaps to custodial care in a nursing facility. Patients transitional care needs vary widely. Some require little more than light physical therapy to counteract the deconditioning that results from prolonged bed rest. Others may need extensive highly skilled services needed for ventilator weaning or other hard-to-manage conditions.
The Medicare program at present lacks a mechanism for directing patients to the most appropriate and cost-effective site of care. This is, to be sure, not for lack of trying but rather from the lack of an evidence base. The many combinations of acute and chronic conditions, treatment needs, alternative caregivers, and levels of frailty present serious challenges to any attempt to link patient characteristics to post-acute sites of care. At present, there is little systematic evidence on which to draw in selecting appropriate discharge locations. A recent study for CMS on uniform patient assessment concluded, Evidence-based criteria or algorithms for optimal placement in the most cost-effective settings for most patients with different conditions and characteristics are lacking for [post-acute care] Lack of a uniform information set at hospital discharge has made it impossible to develop specific norms for different settings, much less algorithms for clinicians to use as guidelines for decision-making (Kramer et al. 2006, p. 123). In similar fashion, MedPAC (2008d) stated ... there is no systematic way to determine whether LTCH admissions are appropriate. In the absence of guidelines or regulations, there is good reason for concern that discharge location may be chosen on the basis of financial or other considerations that may be poorly related to the clinical benefit to the patient.
It is precisely this concern that has accompanied the growth of LTCHs since the early 1990s. Continued growth of LTCHs and the sharp decline in hospital-based SNFs since 1998 has led many researchers and policy analysts to question whether an increasing number of beneficiaries who might appropriately be treated in SNFs are instead being admitted to LTCHs. In particular, there is concern that the SNF PPS, introduced in 1998, discouraged SNFs from accepting, or staffing themselves to appropriately treat medically complex patients. With access to SNF care reduced, even by a little, these medically complex patients might very well be directed to LTCHs which are paid under a stay-based PPS that pays much higher amounts, on average, than SNFs might receive for treating similar conditions.
Results reported here suggest that something of this sort may have occurred. Admissions of medically complex patients to post-acute care in LTCHs increased most sharply in the North Central and South, Regions in which LTCHs increased most rapidly over the period. Admissions to LTCHs increased nearly as fast in the Northeast, the Region with the highest level of LTCH beds per capita. Moreover, those CBSAs in which the decline in hospital-based SNF beds per beneficiary was greatest tended to experience the greatest relative increases in discharge from acute care hospital to LTCH. Finally, there was a clear positive relationship between increases in LTCHs and LTCH beds per beneficiary and total Medicare payment per episode of post-acute care. In a group of 27 communities which lost all hospital-based SNFs between 1998 and 2006, mean payment per episode for medically complex patients increased 68 percent in cities that LTCHs entered during the period and 39 percent in areas where no LTCHs entered. Regression results showed significant, though small, positive effects of increasing LTCH beds on Medicare episode payment for medically complex patients in every Census Region. Results for rehabilitation patients were generally not significant.
It is naturally impossible to know with certainty the mechanism behind these results, but an explanation that relies on financial incentives growing out of the Medicare inpatient PPS and the SNF and LTCH PPSs appears consistent with the available evidence. Hospitals have a clear incentive to discharge patients as soon as it is medically reasonable to do so. For those who require post-acute care, the most common discharge destination is the SNF. But the SNF PPS appears to afford more attractive payment, and certainly lower financial risk, for providing care to those patients who require physical and occupational therapy rather than those who require more intense nursing services and medical management. A busy hospital discharge planner who is encountering difficulty in placing a medically complex patient in a local SNF might very be delighted to find that an LTCH in the same area will accept the patient immediately. It is true that such a placement, and many thousands like it, may lead to increased costs for the Medicare program. But discharge planners primary responsibilities are to their patients and employers, not to Medicare.
It is the responsibility of policymakers to devise and amend payment systems in such a way as to align the financial incentives of providers, the best interests of patients, and the goals of the Medicare program to the greatest extent possible. In the short run, this may be achieved by imposing a temporary moratorium on certification of new LTCHs, as was done in the MMSEA, or by limiting use of LTCHs to patients with particular specified conditions, as MedPAC has recommended.
At present, CMS is pursuing two long-term modifications to Medicare payment policy to address the growth of expensive care that might appropriately be provided in a more cost-effective environment. The first of these is the introduction of the RUG-IV case-mix adjustment system for SNF care, which will be implemented in October 2011. The RUG-IV system aims to better link the characteristics of SNF patients to their expected resource use, particularly for those requiring medically complex care (CMS 2009). CMS has frankly noted that analysis of NTA costs has been limited by the lack of billing detail on incurred cost, especially with regard to drugs and biologicals, the most costly category of NTAs. The RUG-IV system could provide an increase in payment for medically complex patients, thus increasing the financial incentive to admit them. But whether such a change in payment would measurably reverse the tendency to admit medically complex patients to LTCHs in certain markets is open to question. Because payment for SNF patients in rehabilitation payment categories depends more closely on therapy services that SNFs provide, they will continue to be less risky, even if perhaps less profitable than they had previously been.
The second modification to payment is represented by the PAC-PRD, a project that aims at a comprehensive approach to payment for post-acute care. Data from the demonstration will support analysis of incurred cost, utilization, and patient outcomes across providers of all types. The demonstration is employing a patient assessment instrument, known as the Continuity Assessment Record and Evaluation (CARE). Patients in ten demonstration sites are assessed using the CARE tool at hospital discharge, and upon admission to and discharge from SNFs, LTCHs, IRFs, and home health agencies. The PAC-PRD has the potential to produce: (1) a single patient assessment tool to augment existing provider-specific assessment instruments such as MDS, OASIS, and IRFPAI; (2) an evidence base to support value-based purchasing in post-acute care; and (3) a revised payment system for post-acute care that will focus on beneficiary needs rather than provider type and will be characterized by more consistent payments for the same type of care across different sites of service, [and] quality-driven pay-for-performance incentives (73 FR 25931).
Should it fulfill its mission, the PAC-PRD might well produce an amelioration of the problem posed by the proliferation of LTCHs over the past 15 years. If its results lead to payment focused more on patient condition than the location of care, the financial incentive to increase the number of facilities that receive higher payment will be lessened. Furthermore, data from the CARE instrument enable researchers to link patient conditions to appropriate sites of care more clearly and authoritatively than is now possible.
REFERENCES
Angelelli, Joseph, David Gifford, Orna Intrator, Pedro Gozalo, Linda Laliberte, and Vincent Mor. Access to Postacute Nursing Home Care Before and After the BBA. Health Affairs, Vol. 21, No. 5, September/October 2002, pp. 254-264.
Buntin, Melinda, Grace Carter, Orla Hayden, Carrie Hoverman, Susan Paddock, and Barbara Wynn. Inpatient Rehabilitation Facility Care Use Before and After Implementation of IRF Prospective Payment System. Santa Monica, CA: RAND, 2006.
Buntin, Melinda, Jose Escarce, Carrie Hoverman, Susan Paddock, Mark Totten, and Barbara Wynn. Effects of Payment Changes on Trends in Access to Post-Acute Care. Santa Monica, CA: RAND, 2005
Buntin, Melinda, Anita Datar Garten, Susan Paddock, Debra Saliba, Mark Totten, and Jose Escarce. How Much Is Post-Acute Care Use Affected By Its Availability? Santa Monica, CA: RAND, 2004.
Buntin, Melinda, Anita Garten, Susan Paddock, et al. How Much is Postacute Care Use Affected by Its Availability? Health Services Research, Vol. 40, April 2005, pp. 413-434.
Buntin, Melinda, Carrie Colla, and Jose Escarce. Effects of Payment Changes on Trends in Post-Acute Care. Health Services Research, Vol. 44, No. 4, August 2009, pp. 1188-1210.
Center for Medicare and Medicaid Services. Memorandum to State Survey Agency Directors: Moratorium on Classification of Long-Term Care Hospitals (LTCH) or Satellites/Increase in Certified LTCH Beds (S&C: 08-26), June 13, 2008. Available online at http://www.cms.hhs.gov/SurveyCertificationGenInfo/downloads/SCLetter08-2....
Center for Medicare and Medicaid Services, Office of Public Affairs. CMS Announces More Accurate Payment Rates for Medicare Skilled Nursing Facilities in Fiscal Year 2010. Press Release, July 31, 2009.
Gage, B., N. Pilkauskas, K. Dalton, R. Constantine, M. Leung, S. Hoover, and J. Green. Long-Term Care Hospital (LTCH) Payment System Monitoring and Report: Phase II Report. RTI International. CMS Contract No. 500-00-0024, January 2007.
Gage, B., William Bartosch, and Jeremy Green. Long-Term Care Hospital (LTCH) Project Approach. Waltham, MA: RTI International, 2005.
Kane, Robert, Wen-Chiech Lin, and Lynn A. Blewett. Geographic Variation in Use of Post-Acute Care. Health Services Research, Vol. 37, No. 3, June 2002, pp. 667-682.
Konetzka, R. Tamara, Deokhee Yi, Edward Norton, and Kerry Kilpatrick. Effects of Medicare Payment Changes on Nursing Home Staffing and Deficiencies. Health Services Research, Vol. 39, No. 3, June 2004, pp. 463-488.
Kramer, Andrew, et al. Uniform Patient Assessment for Post Acute Care. Prepared for the Center for Medicare & Medicaid Services, January 2006.
Kuhn, H. Statement before Subcommittee on Health of the House Committee on Ways and Means, March 15, 2006.
Liu, Korbin, and Kirsten Black. Hospital-Based and Freestanding Skilled Nursing Facilities: Any Cause for Differential Medicare Payments? Inquiry, Vol. 40, Spring 2003, pp. 94-104.
Liu, Korbin, and Emily Jones. Closures of Hospital-Based SNF Units: Insights from Interviews with Administrators, Discharge Planners, and Referring Physicians. A Study Conducted by Staff from the Urban Institute for MedPAC. Washington, DC: MedPAC, 2007. http://www.medpac.gov.
Liu, Korbin, et al. Options for Improving Medicare Payment for SNFs. Final Report to the Center for Medicare & Medicaid Services, August 2007.
Liu, Korbin, Cristina Baseggio, Douglas Wissoker, Stephanie Maxwell, Jennifer Haley, and Sharon Long. Long-Term Care Hospitals under Medicare: Facility-Level Characteristics. Health Care Financing Review, Vol. 23, No. 2, Winter 2001, pp. 1-18.
McCall, Nelda, Jodi Korb, Andrew Petersons, and Stanley Moore. Reforming Medicare Payment: Early Effects of the 1997 Balanced Budget Act on Postacute Care, Milbank Quarterly 81(2003): 277-303.
Medicare Payment Advisory Commission. A Data Book: Healthcare Spending and the Medicare Program. Washington, DC: MedPAC, June 2009.
Medicare Payment Advisory Commission. A Data Book: Healthcare Spending and the Medicare Program. Washington, DC: MedPAC, June 2008a.
Medicare Payment Advisory Commission. Long-Term Care Hospital Payment System. Washington, DC: MedPAC, October 2008b.
Medicare Payment Advisory Commission. Rehabilitation Facilities (Inpatient) Payment System. Washington, DC: MedPAC, October 2008c.
Medicare Payment Advisory Commission. Report to the Congress: Medicare Payment Policy. Washington, DC: MedPAC, March 2008d.
Medicare Payment Advisory Commission. Skilled Nursing Facility Services Payment System. Washington, DC: MedPAC, October 2008e.
Medicare Payment Advisory Commission. Report to the Congress: New Approaches to Medicare. Washington, DC: MedPAC, June 2004.
Medicare Payment Advisory Commission. Report to the Congress: Medicare Payment Policy.Washington, DC: MedPAC, March 2004.
Medicare Program; Prospective Payment and Consolidated Billing for Skilled Nursing Facilities for FY 2010; Minimum Data Set Version 3.0 for Skilled Nursing Facilities and Medicaid Nursing Facilities, 74 Federal Register 153 (August 11, 2009), pp. 40288-40395.
National Conference of State Legislatures. Certificate of Need: State Health Laws and Programs. http://www.ncsl.org/IssuesResearch/Health/CONCertificateofNeedStateLaws/tabid/14373/Default.aspx. Accessed July 10, 2009.
National Health Policy Forum. Implementing the BBA: The Challenge of Moving Medicare Post-Acute Care to PPS (Issue Brief No.743). Washington, DC: George Washington University, 1999.
Scanlon, William. MEDICARE POST-ACUTE CARE: Cost Growth and Proposals to Manage It Through Prospective Payment and Other Controls. Testimony before the Committee on Finance, U.S. Senate. April 9, 1997. GAO/T-HEHS-97-106.
U.S. Department of Health and Human Services, Office of the Inspector General. Medicare Beneficiary Access to Skilled Nursing Facility Services: 2001. OEO-02-01-00160, July 2001.
U.S. Department of Health and Human Services, Office of the Inspector General. Medicare Beneficiary Access to Skilled Nursing Facility Services: 2004. OEI-02-04-00270, July 2006.
U.S. Department of Health and Human Services. Medicare Program; Prospective Payment System for Long-Term Care Hospitals RY 2007: Proposed Annual Payment Rate Updates, Policy Changes, and Clarification. Federal Register, Vol. 71, No. 18, January 27, 2006.
U.S. General Accounting Office. Skilled Nursing Facilities: Medicare Payments Exceed Costs for Most But Not All Facilities. GAO-03-183, Washington DC, December 2002.
Vaughan-Sarrazin, Mary, Edward Hannan, Carol Gormley, and Gary Rosenthal. Mortality in Medicare Beneficiaries Following Coronary Artery Bypass Graft Surgery in States With and Without Certificate of Need Regulation. Journal of the American Medical Association, Vol. 288, No. 4, October 16, 2002, pp. 1859-1866.
White, Chapin, and Susanne Seagrave. What Happens When Hospital-Based Skilled Nursing Facilities Close? A Propensity Score Analysis Health Services Research, 2005, vol. 40 pp. 1883-1897.
Wiener, Joshua, David Stevenson, and Susan Goldenson. Controlling the Supply of Long-Term Care Providers at the State Level. Washington, DC: The Urban Institute, 1998.
Wodchis, Walter. Physical Rehabilitation following Medicare Prospective Payment for Skilled Nursing Facilities. Health Services Research, Vol. 39, No. 5, October 2004, pp. 1299-1318.
Wodchis, Walter, Brant Fries, and Richard Firth. The Effect of Medicares Prospective Payment System on Discharge Outcomes of Skilled Nursing Facility Residents. Inquiry, Vol. 41, Winter 2004/2005, pp. 418-434.
Yacker, Heidi G. Medicares Skilled Nursing Facility Benefit. Congressional Research Service, RS20386, April 16, 2001.
Yip, Judy, Kathleen Wilber, and Robert Myrtle. The Impact of the 1997 Balanced Budget Amendments Prospective Payment System on Patient Case Mix and Rehabilitation Utilization in Skilled Nursing. The Gerontologist, Vol. 42, No. 5, 2002, pp. 653-660.
APPENDIX A. CLINICALLY COMPLEX AND REHABILITATION ICD-9 AND DRG CODES BY YEAR
| TABLE A.1. Clinically Complex and Rehabilitation ICD-9 and DRG Codes by Year | |||||||||||
| ICD-9 Diagnosis/Procedure | 2007 | 2006 | 2005 | 2004 | 2003 | 2002 | 2001 | 2000 | 1999 | 1998 | 1997 |
| Endocarditis | 424.9 | 424.9 | 424.9 | 424.9 | 424.9 | 424.9 | 424.9 | 424.9 | 424.9 | 421.0 | 421.0 |
| Osteomyelitis (unspecified) | 730.2 | 730.2 | 730.2 | 730.2 | 730.2 | 730.2 | 730.2 | 730.3 | 730.2 | 730.2 | 730.2 |
| Cardiomyopethy | 425 | 425 | 425 | 425 | 425 | 425 | 425 | 426 | 425 | 425 | 425 |
| Tracheostomy | - | - | - | - | - | - | - | - | - | - | - |
| Infection of Tracheostomy | 519.01 | 519.01 | 519.01 | 519.01 | 519.01 | 519.01 | 519.01 | 519.01 | - | 519.0 | 519.0 |
| Infection | 519.01 | 519.01 | 519.01 | 519.01 | 519.01 | 519.01 | 519.01 | 519.01 | 519.01 | 519.01 | 519.01 |
| Sepsis | 519.01 | 519.01 | 519.01 | 519.01 | 519.01 | 519.01 | 519.01 | 519.01 | 519.0 | 519.01 | - |
| Mechanical complication of tracheostomy | 519.02 | 519.02 | 519.02 | 519.02 | 519.02 | 519.02 | 519.02 | 519.02 | 519.00 | 519.02 | - |
| Obstruction | 519.02 | 519.02 | 519.02 | 519.02 | 519.02 | 519.02 | 519.02 | 519.02 | 519.0 | 519.02 | - |
| Stenosis | 519.02 | 519.02 | 519.02 | 519.02 | 519.02 | 519.02 | 519.02 | 519.02 | 519.0 | 519.02 | - |
| Other tracheostomy complications | 519.09 | 519.09 | 519.09 | 519.09 | 519.09 | 519.09 | 519.09 | 519.09 | 519.0 | 519.09 | - |
| Attention to Complication | 519.00 | 519.00 | 519.00 | 519.00 | 519.00 | 519.00 | 519.00 | 519.00 | 519.0 | 519.00 | - |
| Hemorrhage | 519.09 | 519.09 | 519.09 | 519.09 | 519.09 | 519.09 | 519.09 | 519.09 | 519.0 | 519.09 | - |
| Malfunctioning | 519.09 | 519.09 | 519.09 | 519.09 | 519.09 | 519.09 | 519.09 | 519.09 | 519.0 | 519.09 | - |
| Mediastinitis | 519.2 | 519.2 | 519.2 | 519.2 | 519.2 | 519.2 | 519.2 | 519.2 | 519.2 | 519.2 | 519.2 |
| End-stage renal disease (ESRD) | 585.6 | 585.6 | 585.6 | ||||||||
| Diabetes with renal manifestations | 250.6 | 250.4 | 250.4 | 250.4 | 250.4 | 250.4 | 250.4 | 250.4 | 250.4 | 250.8 | 250.8 |
| Septic shock | 785.52 | 785.52 | 785.52 | 785.52 | 785.52 | 785.59 | 785.59 | 785.59 | 785.59 | 785.6 | 785.59 |
| Fungemia | 117.9 | 117.9 | 117.9 | 117.9 | 117.9 | 112 | 112 | 112 | 112 | 112 | 112 |
| Alimentation | 99.29 | 99.29 | 99.29 | 99.29 | 99.29 | 99.29 | 99.29 | 99.29 | 99.29 | 99.29 | 99.29 |
| Continuous mechanical ventilation | 96.7 | 96.7 | 96.7 | 96.7 | 96.7 | 96.7 | 96.7 | 96.7 | 96.7 | 96.7 | 96.7 |
| Continuous mechanical ventilation of unspecified duration | 96.7 | 96.7 | 96.7 | 96.7 | 96.7 | 96.7 | 96.7 | 96.7 | 96.7 | 96.7 | 96.7 |
| Continuous mechanical ventilation for less than 96 hours | 96.71 | 96.71 | 96.71 | 96.71 | 96.71 | 96.71 | 96.71 | 96.71 | 96.71 | 96.71 | 96.71 |
| Placement of dialysis catheter | 38.95 | 38.95 | 38.95 | 38.95 | 38.95 | 38.95 | 38.95 | 38.95 | 38.95 | 38.95 | 38.95 |
| Creation of dialysis fistula | 39.27 | 39.27 | 39.27 | 39.27 | 39.27 | 39.27 | 39.27 | 39.27 | 39.27 | 39.27 | 39.93 |
| Renal dialysis | 39.95 | 39.95 | 39.95 | 39.95 | 39.95 | 39.95 | 39.95 | 39.95 | 39.95 | 39.95 | 39.95 |
| Peritoneal dialysis | 54.98 | 54.98 | 54.98 | 54.98 | 54.98 | 54.98 | 54.98 | 54.98 | 54.98 | 54.98 | 54.98 |
| Radiation therapy | 92.2 | 92.2 | 92.2 | 92.2 | 92.2 | 92.2 | 92.2 | 92.2 | 92.2 | 92.2 | 92.2 |
| DRG Description | |||||||||||
| Other Resp system OR procedures w cc | 76 | 76 | 76 | 76 | 76 | 76 | 76 | 76 | 76 | 76 | 76 |
| Pulmonary edema & respiratory failure | 87 | 87 | 87 | 87 | 87 | 87 | 87 | 87 | 87 | 87 | 87 |
| COPD | 88 | 88 | 88 | 88 | 88 | 88 | 88 | 88 | 88 | 88 | 88 |
| Pneumona + Pleurisy | 89 | 89 | 89 | 89 | 89 | 89 | 89 | 89 | 89 | 89 | 89 |
| Heart failure + shock | 127 | 127 | 127 | 127 | 127 | 127 | 127 | 127 | 127 | 127 | 127 |
| Peripheral vascular disorders w cc | 130 | 130 | 130 | 130 | 130 | 130 | 130 | 130 | 130 | 130 | 130 |
| Other Circulatory system dxs W cc | 144 | 144 | 144 | 144 | 144 | 144 | 144 | 144 | 144 | 144 | 144 |
| Other digestive system diagnoses w cc | 188 | 188 | 188 | 188 | 188 | 188 | 188 | 188 | 188 | 188 | 188 |
| Hip replacement | 544, 545 | 544, 545 | 209 | 209 | 209 | 209 | 209 | 209 | 209 | 209 | 209 |
| Hip fracture with CC | 210 | 210 | 210 | 210 | 210 | 210 | 210 | 210 | 210 | 210 | 210 |
| Hip fracture w/o CC | 211 | 211 | 211 | 211 | 211 | 211 | 211 | 211 | 211 | 211 | 211 |
| Skin ulcer | 271 | 271 | 271 | 271 | 271 | 271 | 271 | 271 | 271 | 271 | 271 |
| Nutritional and Misc Metabolic disorders w cc | 296 | 296 | 296 | 296 | 296 | 296 | 296 | 296 | 296 | 296 | 296 |
| Kidney and UTI W cc | 320 | 320 | 320 | 320 | 320 | 320 | 320 | 320 | 320 | 320 | 320 |
| Postoperative and post-traumatic infections | 418 | 418 | 418 | 418 | 418 | 418 | 418 | 418 | 418 | 418 | 418 |
| Complications of treatment W cc | 452 | 452 | 452 | 452 | 452 | 452 | 452 | 452 | 452 | 452 | 452 |
| Nervous system infection except viral meningitis | 20 | 20 | 20 | 20 | 20 | 20 | 20 | 20 | 20 | 20 | 20 |
| Respiratory infections and inflammations age >17 w/CC | 79 | 79 | 79 | 79 | 79 | 79 | 79 | 79 | 79 | 79 | 79 |
| Other respiratory system diagnoses w/cc | 101 | 101 | 101 | 101 | 101 | 101 | 101 | 101 | 101 | 101 | 101 |
| Endocarditis | 126 | 126 | 126 | 126 | 126 | 126 | 126 | 126 | 126 | 126 | 126 |
| Disorders of pancreas except malignancy | 204 | 204 | 204 | 204 | 204 | 204 | 204 | 204 | 204 | 204 | 204 |
| Osteomyelitis | 238 | 238 | 238 | 238 | 238 | 238 | 238 | 238 | 238 | 238 | 238 |
| Skin graft and or debride for skin ulcer or cellulitis w/cc | 263 | 263 | 263 | 263 | 263 | 263 | 263 | 263 | 263 | 263 | 263 |
| Other skin, subcutaneous tissue and breast procedure w/cc | 269 | 269 | 269 | 269 | 269 | 269 | 269 | 269 | 269 | 269 | 269 |
| Renal failure | 316 | 316 | 316 | 316 | 316 | 316 | 316 | 316 | 316 | 316 | 316 |
| Other kidney and urinary tract diagnoses age>17 w/cc | 331 | 331 | 331 | 331 | 331 | 331 | 331 | 331 | 331 | 331 | 331 |
| OR procedure for infectious and parasitic diseases | 415 | 415 | 415 | 415 | 415 | 415 | 415 | 415 | 415 | 415 | 415 |
| Septicemia | 416 | 416 | 416 | 416 | 416 | 416 | 416 | 416 | 416 | 416 | 416 |
| Wound debridement for injuries | 440 | 440 | 440 | 440 | 440 | 440 | 440 | 440 | 440 | 440 | 440 |
| Respiratory System Diagnosis with Ventilator Support | 475 | 475 | 475 | 475 | 475 | 475 | 475 | 475 | 475 | 475 | 475 |
| Tracheostomy | 483 | 483 | 483 | 483 | 483 | 483 | 483 | 483 | 483 | 483 | 483 |
APPENDIX B: DATA TABLES FOR REPORT FIGURES
Each table in this Appendix provides data used in developing the corresponding figure in this report. For example, Table B.1 provides the number of beds for each region by year listed in Figure IV.1.
| TABLE B.1. Number of Freestanding SNF Beds by Region | ||||
| Year | Region | |||
| North Central | Northeast | South | West | |
| 1997 | 503.304 | 468.412 | 348.744 | 288.730 |
| 1998 | 512.137 | 481.943 | 361.253 | 293.654 |
| 1999 | 516.306 | 482.335 | 363.093 | 297.936 |
| 2000 | 520.435 | 499.805 | 386.626 | 308.863 |
| 2001 | 518.418 | 497.604 | 385.836 | 299.278 |
| 2002 | 535.402 | 498.151 | 383.621 | 299.172 |
| 2003 | 540.327 | 489.915 | 387.701 | 292.881 |
| 2004 | 543.371 | 485.070 | 391.011 | 285.518 |
| 2005 | 526.545 | 480.914 | 388.053 | 278.557 |
| 2006 | 522.386 | 478.569 | 382.042 | 271.627 |
| 2007 | 523.304 | 475.933 | 384.212 | 270.506 |
| TABLE B.2. Number of Hospital-Based SNF Beds by Region | ||||
| Year | Region | |||
| North Central | Northeast | South | West | |
| 1997 | 58.244 | 26.453 | 27.247 | 37.484 |
| 1998 | 60.030 | 26.635 | 28.443 | 40.063 |
| 1999 | 59.441 | 28.932 | 28.812 | 36.075 |
| 2000 | 57.072 | 27.990 | 26.255 | 34.832 |
| 2001 | 53.949 | 27.231 | 24.865 | 32.486 |
| 2002 | 51.964 | 22.831 | 21.234 | 28.044 |
| 2003 | 45.547 | 23.843 | 20.323 | 25.003 |
| 2004 | 40.960 | 22.220 | 17.606 | 22.488 |
| 2005 | 23.268 | 22.307 | 16.447 | 20.461 |
| 2006 | 22.676 | 22.286 | 12.682 | 19.793 |
| 2007 | 22.099 | 22.114 | 11.205 | 17.929 |
| TABLE B.3. Inpatient Rehabilitation Beds by Region | ||||
| Year | Region | |||
| North Central | Northeast | South | West | |
| 1997 | 2.329 | 5.226 | 5.383 | 2.756 |
| 1998 | 2.269 | 5.285 | 5.617 | 2.608 |
| 1999 | 2.229 | 5.496 | 5.446 | 2.672 |
| 2000 | 2.230 | 5.657 | 5.534 | 2.644 |
| 2001 | 2.392 | 5.614 | 5.798 | 2.778 |
| 2002 | 2.505 | 5.671 | 5.439 | 2.475 |
| 2003 | 2.531 | 5.640 | 5.490 | 2.372 |
| 2004 | 2.481 | 5.605 | 5.653 | 2.242 |
| 2005 | 2.481 | 4.837 | 5.700 | 2.320 |
| 2006 | 2.458 | 5.242 | 5.418 | 2.327 |
| 2007 | 2.458 | 5.162 | 5.488 | 2.289 |
| TABLE B.4. Long-Term Care Hospital Beds by Region | ||||
| Year | Region | |||
| North Central | Northeast | South | West | |
| 1997 | 4.809 | 10.468 | 6.082 | 3.936 |
| 1998 | 5.182 | 10.198 | 6.074 | 3.144 |
| 1999 | 5.845 | 9.974 | 6.825 | 3.646 |
| 2000 | 6.356 | 10.213 | 7.443 | 3.918 |
| 2001 | 5.495 | 10.711 | 7.847 | 3.803 |
| 2002 | 5.706 | 10.565 | 7.951 | 3.936 |
| 2003 | 6.045 | 10.750 | 8.457 | 3.892 |
| 2004 | 6.373 | 10.767 | 10.769 | 3.892 |
| 2005 | 6.616 | 11.250 | 9.570 | 4.154 |
| 2006 | 7.017 | 10.439 | 9.020 | 4.300 |
| 2007 | 6.928 | 10.695 | 9.263 | 4.217 |
| TABLE B.5. Freestanding SNF Beds by Size of 65+ Population | |||
| Year | >271,000 | 18,000-271,000 | 18,000 |
| 1997 | 347.359 | 400.092 | 513.228 |
| 1998 | 360.146 | 408.967 | 524.255 |
| 1999 | 362.834 | 411.407 | 529.265 |
| 2000 | 378.784 | 427.033 | 543.376 |
| 2001 | 374.248 | 422.876 | 544.774 |
| 2002 | 374.622 | 423.466 | 557.141 |
| 2003 | 369.506 | 422.299 | 566.416 |
| 2004 | 366.104 | 421.677 | 568.746 |
| 2005 | 356.749 | 414.377 | 562.949 |
| 2006 | 351.718 | 408.520 | 556.256 |
| 2007 | 350.962 | 408.748 | 556.533 |
| TABLE B.6. Hospital-Based SNF Beds by Size of 65+ Population | |||
| Year | >271,000 | 18,000-271,000 | 18,000 |
| 1997 | 31.945 | 32.500 | 60.036 |
| 1998 | 32.267 | 35.011 | 60.313 |
| 1999 | 33.075 | 33.757 | 60.324 |
| 2000 | 31.316 | 31.430 | 60.203 |
| 2001 | 29.023 | 29.450 | 59.823 |
| 2002 | 24.760 | 26.021 | 56.382 |
| 2003 | 24.168 | 23.279 | 51.884 |
| 2004 | 21.297 | 20.427 | 48.863 |
| 2005 | 14.622 | 18.036 | 40.288 |
| 2006 | 14.053 | 16.400 | 36.067 |
| 2007 | 13.574 | 15.309 | 33.437 |
| TABLE B.7. Inpatient Rehabilitation Beds by Size of 65+ Population | |||
| Year | >271,000 | 18,000-271,000 | 18,000 |
| 1997 | 2.700 | 5.341 | 3.333 |
| 1998 | 2.738 | 5.437 | 3.259 |
| 1999 | 2.741 | 5.361 | 3.455 |
| 2000 | 2.779 | 5.584 | 2.946 |
| 2001 | 2.933 | 5.718 | 3.111 |
| 2002 | 2.799 | 5.566 | 3.033 |
| 2003 | 2.790 | 5.553 | 3.061 |
| 2004 | 2.920 | 5.458 | 3.119 |
| 2005 | 2.633 | 5.362 | 3.257 |
| 2006 | 2.581 | 5.406 | 3.118 |
| 2007 | 2.578 | 5.474 | 2.879 |
| TABLE B.8. Long-Term Care Hospital Beds by Size of 65+ Population | |||
| Year | >271,000 | 18,000-271,000 | 18,000 |
| 1997 | 5.867 | 7.249 | 4.118 |
| 1998 | 5.977 | 7.430 | 2.375 |
| 1999 | 6.258 | 7.892 | 3.360 |
| 2000 | 6.554 | 8.471 | 3.675 |
| 2001 | 5.792 | 8.929 | 4.059 |
| 2002 | 5.832 | 9.060 | 4.078 |
| 2003 | 6.352 | 9.072 | 4.638 |
| 2004 | 6.626 | 10.578 | 4.861 |
| 2005 | 6.973 | 9.732 | 5.395 |
| 2006 | 7.171 | 9.116 | 5.281 |
| 2007 | 7.414 | 9.154 | 5.212 |
NOTES
-
Scanlon (1997) pointed out that the Health Care Financing Administration, no CMS, had expected use spending for post-acute care to grow in response to hospital PPS, but managed to control growth through relatively stringent interpretation of coverage and eligibility criteria. He further noted that court decisions in the last 1980s had the effect of expanding Medicare coverage for SNF and home health care.
-
For IRFs and LTCHs, the cost limits were facility-specific, and were calculated using facility costs in a base year as specified by the Tax Equity and Fiscal Responsibility Act of 1982.
-
The Balanced Budget Refinement Act of 1999 increased payment, but did not measurably slow the exit of hospital-based SNFs from the Medicare program.
-
Some hospital-based SNFs may have closed for reasons unrelated to the SNF PPS. MedPAC (2004) reported that occupancy rates at acute care hospitals increased over the same time period. Some hospital administrators reported shifting resources from the SNF to the hospital or closing the SNF altogether.
-
The authors are grateful to the contributions of ASPE staff for valuable insight and contributions to this project.
-
There are six clinically complex categories in the RUG-III system.
-
Reflecting the CMS rule change implemented in FY 2006, we use DRGs 544 and 5454 in place of DRG 209.
-
IRF stays were defined to include stays in acute care rehabilitation units paid under the IRF PPS.
-
We note that due to the way in which the analytic file was constructed, episodes of care begun in 2006 that were not captured in the 2007 data (i.e., discharge from the post-acute setting outside of the 60-day window) results in an underestimate of the 2006 episode count.
-
Cities with no hospital-based SNF in either 1997 or 2007 were excluded from the tables.
-
The percent of patients by discharge location will typically sum to a number less than 100 because a small fraction of episodes (not reported here) include stays in psychiatric hospitals and drug and alcohol rehabilitation facilities.
-
Payment is also affected by each patients case-mix category, used to determine the payment weight under the relevant PPS.
To obtain a printed copy of this report, send the full report title and your mailing information to:
U.S. Department of Health and Human ServicesOffice of Disability, Aging and Long-Term Care PolicyRoom 424E, H.H. Humphrey Building200 Independence Avenue, S.W.Washington, D.C. 20201FAX: 202-401-7733Email: webmaster.DALTCP@hhs.gov
RETURN TO:
Office of Disability, Aging and Long-Term Care Policy (DALTCP) Home [http://aspe.hhs.gov/_/office_specific/daltcp.cfm]Assistant Secretary for Planning and Evaluation (ASPE) Home [http://aspe.hhs.gov]U.S. Department of Health and Human Services Home [http://www.hhs.gov]