
U.S. Department of Health and Human Services
SSI-Related Disabled Children and Medicaid
Marilyn Rymer Ellwood
SysteMetrics/McGraw-Hill
June 1990
This report was prepared under contract between the U.S. Department of Health and Human Services (HHS), Office of Family, Community and Long-Term Care Policy (now the Office of Disability, Aging and Long-Term Care Policy) and SysteMetrics. For additional information about the study, you may visit the DALTCP home page at http://aspe.hhs.gov/_/office_specific/daltcp.cfm or contact the ASPE Project Officer, John Drabek, at HHS/ASPE/DALTCP, Room 424E, H.H. Humphrey Building, 200 Independence Avenue, SW, Washington, DC 20201. His e-mail address is: John.Drabek@hhs.gov.
With the implementation of the SSI program in 1974, a new group of beneficiaries was added to the Medicaid program--disabled children in low-income families. Prior to SSI, severely disabled children generally had qualified for cash assistance and Medicaid only if their families were eligible through the AFDC provisions. With SSI, children became eligible for Medicaid in their own right if: 1) their disabilities were severe enough to satisfy the SSI disability criteria, and 2) they (or their families) were poor enough to meet the program's financial requirements. Adult disability determinations for SSI are largely based on whether a person is capable of work. For children, SSI disability assessments until recently focused on whether a child suffered from a condition included in (or equal to) a listing of medical impairments promulgated by the Social Security Administration. As will be discussed later in the paper, a recent ruling by the Supreme Court (Sullivan v. Zebley, February 20, 1990) has required the SSI program to implement new standards for child disability determinations. The new standards will include individualized functional assessments for children which will focus on the impact of a child's handicap on his/her normal daily activities. It is generally believed that the new standards will result in a much higher approval rate for disabled child applicants.
This paper presents available data on the Medicaid experience of disabled children, with disabled children defined as those who met the (pre-Zebley) disability test of SSI. The study population includes disabled children eligible for Medicaid and SSI cash assistance, as well as other optional groups of children who meet the disability test of SSI, but only qualify for Medicaid (not SSI cash assistance). The analysis focuses on the Medicaid patterns of disabled children in California, Georgia and Michigan, using Tape-to-Tape data for 1984. This is the most recent readily available data on this Medicaid population group. The research questions addressed by this study include:
-
What are the Medicaid enrollment, utilization and expenditure patterns of SSI-related disabled children?
-
What proportion of overall child Medicaid enrollment and expenditures do disabled children represent? How do disabled children fit into the overall disabled Medicaid population and expenditures?
-
What are the disabling conditions of SSI disabled children and how do these conditions relate to Medicaid expenditure levels?
-
What differences are seen among selected subgroups of disabled children on Medicaid, including SSI children (noninstitutionalized), disabled children not receiving SSI benefits (noninstitutionalized), and institutionalized disabled children?
-
What impact might the Supreme Court's Zebley decision have on Medicaid patterns for disabled children?
DATA SOURCES
The data for this study were drawn from the Tape-to-Tape data base. Tape-to-Tape is a multi-state Medicaid data base developed by the Office of Research and Demonstrations at HCFA. The Tape-to-Tape data base includes information on every Medicaid enrollee and every claim processed by the Medicaid Management Information System (MMIS) in four States since 1980. The data used for this study are 1984 data--the most recent available on disabled children at the time of this study--for California, Georgia and Michigan. Table 1 shows the number of Medicaid disabled children and the level of Medicaid expenditures for the study population. These three States accounted for about 16% of SSI children nationwide in 1984, and represent a range with regard to the comprehensiveness of their Medicaid programs.
| TABLE 1. Disabled Child Medicaid Enrollees and ExpendituresCalifornia, Georgia and Michigan, 1984 | ||
| Number of Children | Expenditures | |
| California | 35,645 | $144,984,000 |
| Georgia | 12,715 | $34,862,000 |
| Michigan | 11,255 | $36,234,000 |
The study also made use of data from the SSI program which were linked to the Tape-to-Tape files. The SSI data came from the Characteristics Extract Record (CER), a 10% sample from the national data base on SSI recipients and applicants maintained by the Social Security Administration. The CER includes information on the major disabling condition for each SSI recipient. The disease categories used in coding the type of disability are based on the International Classification of Diseases, 9th Revision, Clinical Modification (ICD-9-CM).
MEDICAID ELIGIBILITY IN THE STUDY STATES
The study States varied somewhat in the groups of disabled children which they included for Medicaid in 1984. All three States automatically enrolled SSI disabled children in their Medicaid programs. California and Michigan also covered disabled children under their medically needy programs in 1984, but Georgia did not. Medically needy disabled children are those who passed the SSI-related disability test, but had too much income or resources to meet the financial criteria for SSI cash assistance. Although Georgia did not cover medically needy disabled children, it covered two optional groups of the disabled who were institutionalized: those who would be eligible for SSI if they were not institutionalized, and those who were eligible under special income level for the institutionalized.
The three study States varied substantially in the financial criteria which were used to determine Medicaid eligibility for disabled children in 1984. The SSI program is federally administered and has a nationwide minimum benefit level for a person with no other sources of income. States also have the option to supplement the Federal benefit level (called the State supplementation payment). Among the study States in 1984, California and Michigan elected to supplement the Federal amount, while Georgia did not. The monthly SSI benefit levels (including State supplementation) in 1984 are shown in Table 2.
| TABLE 2. Monthly Benefit Level, Including State Supplementation, for SSI Disabled Living Independently:California, Georgia, and Michigan, 1984 | |
| California | $477 |
| Georgia | 314 |
| Michigan | 338 |
Obviously, California's SSI benefit level was more generous than that of the other two States. The Federal poverty level in 1984 for one person under 65 years of age was $450 monthly. Thus, the benefit level in California was above the Federal poverty level; the other two States used an income standard that was considerably less.
The income levels for medically needy coverage used by California and Michigan are shown in Table 3. The medically needy level used by California was considerably higher than its SSI level (with supplementation), while Michigan's medically needy level was virtually the same as its SSI level. Thus, California potentially extended Medicaid eligibility to disabled children whose families had much higher incomes than either Michigan or Georgia.
| TABLE 3. Medically Needy Income Level for One Person:California and Michigan, 1984 | |
| California | $600 |
| Michigan | 339 |
With a medically needy program, a State can allow persons to qualify for Medicaid through "spending-down," even if their income exceeds the medically needy income level. The spend-down process allows applicants to deduct medical expenses from income in determining financial eligibility. Thus, disabled children from families of any income level could qualify for Medicaid, assuming their medical bills were large enough (and the disabled child satisfied the disability criteria).
In all three study States, all-groups of disabled children were entitled to the same set of services. States have a mandatory set of Medicaid services, as well as optional services that they can elect to offer. Further, States can elect to set utilization limits on specific services, if they wish. As a result, the services included under any one State's Medicaid program can vary. There were some differences among the study States worth noting. Generally, the Medicaid program in Georgia was more limited than the programs in California and Michigan during 1984. Georgia limited the number of outpatient hospital visits that could be reimbursed by Medicaid to 12 visits per year, whereas the other two States imposed no limit. Georgia also limited the number of physician office visits during the year to 12. Neither California nor Michigan placed any restrictions on outpatient hospital or physician office visits. Although the restrictions in Georgia would not affect the utilization of the majority of disabled children, average measures of ambulatory services per enrollee may be affected. It should also be noted that Georgia did not cover inpatient psychiatric services for children during the study period.
OVERVIEW OF MEDICAID DISABLED CHILDREN
HCFA does not routinely collect data on the number of disabled child Medicaid recipients nationwide or their expenditures. The only nationwide data available on Medicaid disabled children is a count of the number of disabled children receiving Federally administered cash assistance benefits under the SSI program. According to the Social Security Administration, 288,725 children under age 22 were enrolled in the SSI program in December, 1987. This represented about 10% of overall SSI disability enrollment. As shown in Figure 1, SSI child enrollment has remained generally flat since 1980, in contrast to the substantial growth during this period of the SSI adult disabled population.
Study data showed disabled children to be a small Medicaid group with regard to enrollment, but their expenditure levels are significant. Among the study states, they represented 2-5% of child Medicaid enrollment, as shown in Figure 2. As expected, their expenditure levels were substantially higher than for other children on Medicaid. They accounted for 14-33% of overall child Medicaid expenditures.
Disabled children can also be viewed as a subset of the disabled Medicaid population. Among the study States, they represented 8-12% of overall disabled Medicaid enrollment, and about 8-13% of disabled Medicaid expenditures (Figure 3). However, about 30% to 40% of the adult disabled among the study States were also enrolled in the Medicare program, thus reducing their proportion of Medicaid expenditures. For the Medicare crossover group, Medicare is the first payer (before Medicaid) for many services.


Almost all disabled child enrollees qualify for Medicaid through the SSI cash assistance program. Among the study States, 97% of disabled children in California and Michigan and 99% of disabled children in Georgia were eligible for Medicaid because they received SSI assistance, as shown in Table 4. Even among the 5-10% of institutionalized disabled children in each study State, most were eligible because they received SSI benefits. Only 1% of disabled children in Georgia and 3% in California and Michigan were eligible through other coverage provisions.
Generally, disabled children are older than their counterparts in the AFDC program. The average age for disabled children ranged from 13 to 15 across the study States. From 68% to 78% of the disabled Medicaid children in each study State were over 10 years of age. In contrast, only 16% of AFDC children nationwide were over age 12 in 1982.1
| TABLE 4. Selected Eligibility and Demographic Data on Disabled Medicaid ChildrenCalifornia, Georgia and Michigan, 1984 | |||
| All Disabled Medicaid Children | |||
| CA | GA | MI | |
| Eligibility Group | |||
| Percent SSI Children | 96.6 | 98.7 | 97.4 |
| Percent No Cash Children | 3.4 | 1.3 | 2.6 |
| Percent Institutionalized | 9.5 | 4.7 | 8.2 |
| Percent SSI Children | 9.5 | 4.7 | 8.2 |
| Percent No Cash Children | 1.2 | 0.7 | 0.7 |
| Age Distribution | |||
| Percent 1 Year | 0.7 | 2.5 | 0.5 |
| Percent 1-4 Years | 9.4 | 11.8 | 7.9 |
| Percent 5-9 Years | 16.3 | 17.8 | 14.1 |
| Percent 10-14 Years | 19.6 | 21.1 | 17.7 |
| Percent 15-18 Years | 23.9 | 22.3 | 24.6 |
| Percent 19-20 Years | 30.2 | 24.4 | 35.2 |
| Average Age | 14.1 | 13.2 | 14.7 |
| Percent Male | 57.1 | 57.1 | 56.8 |
| Mean Length of Enrollment (Months) for Study Year | 9.9 | 10.3 | 9.6 |
| Percent Non-White | NA | 49.3 | 26.5 |
Another difference from AFDC children is that there are significantly more males than females among disabled children. Among the study States, about 57% of disabled children were male, while AFDC children are generally evenly distributed by sex.
Once disabled children enroll in Medicaid, they experience little turnover. In Georgia, disabled children averaged 10.3 months of enrollment for the study year, compared to 9.9 for California and 9.6 for Michigan.
Data on primary disabling conditions were available for SSI cash children, based on the 10% research sample compiled by SSA. The distribution of SSI children by major disease categories, as shown in Table 5, shows a remarkably similar pattern by State. Four disease categories accounted for the vast majority of SSI children in each of the study States (over 80%). Mental retardation is the leading cause of disability for SSI children. The percent of SSI children with mental retardation ranged from 30% in California to 40% in Michigan among the study States. This compares to a nationwide average of 43% for SSI disabled children (in 1987).
| TABLE 5. Distribution of SSI Cash Children by Major Disabling Condition*California, Georgia, and Michigan, 1984 | |||||
| All Disabled SSI Cash Children(percent) | |||||
| CAn=2,234 | GAn=822 | MIn=736 | U.S.** | ||
| Child | Adult | ||||
| Infectious/Parasitic | 1.3 | 0.6 | 0.3 | 0.4 | 0.8 |
| Neoplasms | 1.5 | 2.9 | 1.8 | 2.5 | 1.8 |
| Endocrine/Nutritional Metabolic/Immunity | 1.4 | 1.5 | 1.0 | 1.8 | 4.6 |
| Blood | 1.3 | 2.9 | 1.2 | 1.9 | 0.5 |
| Mental disorders: Psychoses/Neuroses | 19.2 | 17.3 | 16.7 | 6.4 | 28.1 |
| Mental Retardation | 30.4 | 33.5 | 40.1 | 42.5 | 24.4 |
| Nervous System/Eye and Ear | 26.1 | 21.5 | 26.0 | 25.7 | 8.8 |
| Circulatory | 0.9 | 0.5 | 1.0 | 0.9 | 9.9 |
| Respiratory | 1.0 | 1.5 | 0.7 | 1.6 | 3.5 |
| Digestive | 0.2 | 0.6 | -- | 0.5 | 1.3 |
| Genitourinary | 0.8 | 1.1 | 0.5 | 0.4 | 1.1 |
| Skin/Subcutaneous | -- | -- | -- | -- | 0.2 |
| Musculoskeletal | 1.3 | 1.3 | 0.3 | 1.3 | 8.6 |
| Congenital | 11.4 | 10.1 | 8.0 | 9.5 | 1.1 |
| Symptoms/Signs/Ill-defined | 1.6 | 2.1 | 1.0 | 3.6 | 1.6 |
| Injury/Poisoning | 1.6 | 2.3 | 1.6 | 0.9 | 3.7 |
| * Data set with information on major disabling condition is only for SSI Cash children. Further, data set is limited to 10% research file.** Social Security Bulletin: Annual Statistical Supplement, 1998, Table 9.F1. | |||||
Diseases of the nervous system and sense organs are also a leading cause of disability for SSI children. The percent of SSI children with diseases in this category ranged from 22% in Georgia to 26% in California and Michigan, similar to the nationwide average for SSI children. Included in this disease category are infantile cerebral palsy, multiple sclerosis, epilepsy and muscular dystrophy, hearing loss or deafness, and blindness.
Two other disease categories accounted for a high proportion of SSI children: mental disorders including psychoses and neuroses (but excluding mental retardation) and congenital anomalies. The percent of SSI children with mental disorders ranged from 17% in Georgia and Michigan to 19% in California. This rate is considerably higher than the nationwide average of 6% of SSI children with mental disorders. Diseases reported in this category were specific delays in development (for example, learning and speech disorders) and schizophrenic disorders, particularly paranoid schizophrenia. The proportion of children with congenital anomalies was 8% in Michigan, 10% in Georgia and 11% in California. These rates were close to the nationwide average of SSI children with this disorder. Included in this disease category are spinal bifida, hypoplastic left heart syndrome, and Down's syndrome. All other diagnostic categories accounted for 3% or less of SSI children.
Table 6 presents limited study data on expenditures per child by disabling condition. These data are not presented for many cells due to the small sample sizes. If there were not at least 30 children in a cell, data on expenditures per child were not included.
In California, only three disease categories had significantly higher than average expenditures per enrollee -- neoplasms; the category of endocrine, nutritional, and metabolic diseases and immunity disorders; and injury and poisoning. In Georgia, only children with congenital disorders had higher than average expenditures. Finally, in Michigan, children with mental disorders fell into this grouping.
| TABLE 6. Average Annual Medicaid Expenditure Per SSI Child Enrollee by Disabling Condition*California, Georgia, and Michigan, 1984 | |||
| All Disabled SSI Cash Children | |||
| CA | GA | MI | |
| Infectious/Parasitic | ** | ** | ** |
| Neoplasms | $21,642 | ** | ** |
| Endocrine/Nutritional Metabolic/Immunity | $7,735 | ** | ** |
| Blood | ** | ** | ** |
| Mental disorders: Psychoses/Neuroses | $3,566 | $2,587 | $9,471 |
| Mental Retardation | $2,629 | $2,186 | $2,146 |
| Nervous System/Eye and Ear | $3,505 | $1,879 | $2,205 |
| Circulatory | ** | ** | ** |
| Respiratory | ** | ** | ** |
| Digestive | ** | ** | ** |
| Genitourinary | ** | ** | ** |
| Skin/Subcutaneous | -- | -- | -- |
| Musculoskeletal | ** | ** | ** |
| Congenital | $3,500 | $4,044 | $1,878 |
| Symptoms/Signs/Ill-defined | $3,313 | ** | ** |
| Injury/Poisoning | $6,975 | ** | ** |
| Average | $3,733 | $2,739 | $3,537 |
| * Data set with information on major disabling condition is only for SSI Cash children. Further, data set is limited to 10% research file.** These expenditure data are not reported because of small sample size (30 children). | |||
To provide a summary picture of the relative expenditures by disabling conditions in each study State, the overall distribution of Medicaid dollars for SSI children by major condition is presented in Table 7. Generally, the four disease categories which accounted for the greatest proportion of SSI children also accounted for the greatest proportion of Medicaid expenditures--mental retardation, other mental disorders, diseases of the nervous system and sense organs, and congenital anomalies.
| TABLE 7. Percent of Total Medicaid Expenditures for SSI Disabled Children by Major Disabling Condition* | |||
| Disease Category | All Disabled SSI Cash Children | ||
| CA | GA | MI | |
| Infectious/Parasitic | 0.9 | 0.3 | 0.2 |
| Neoplasms | 8.7 | 6.7 | 1.8 |
| Endocrine/Nutritional Metabolic/Immunity | 2.9 | 3.3 | 0.1 |
| Blood | 2.6 | 3.5 | 3.2 |
| Mental disorders: Psychoses/Neuroses | 18.3 | 16.6 | 44.8 |
| Mental Retardation | 21.4 | 26.7 | 24.3 |
| Nervous System/Eye and Ear | 24.5 | 14.8 | 16.2 |
| Circulatory | 1.1 | 1.0 | 0.8 |
| Respiratory | 2.4 | 2.9 | 1.6 |
| Digestive | 0.2 | 0.6 | -- |
| Genitourinary | 0.5 | 1.7 | 1.7 |
| Skin/Subcutaneous | -- | -- | -- |
| Musculoskeletal | 1.5 | 1.7 | 0.8 |
| Congenital | 10.7 | 14.9 | 4.3 |
| Symptoms/Signs/Ill-defined | 1.4 | 1.2 | 0.1 |
| Injury/Poisoning | 2.9 | 4.3 | 0.3 |
| * Data set with information on disabling condition is only for SSI children. Further, the data set is limited to 10% research file. | |||
However, the relative distribution of expenditures by disabling conditions is not completely consistent with the distribution of children by disabling condition. For example, although 30% to 40% of SSI children were reported to be mentally retarded, only 21%-27% of Medicaid expenditures for SSI children were attributable to this group of children across the study States. In Michigan, children with mental disorders accounted for 45% of overall Medicaid expenditures for SSI children, but they were only 17% of the SSI child population. In California and Georgia, children with neoplasms accounted for a much greater proportion of expenditures than enrollment.
MEDICAID PATTERNS FOR SUBGROUPS OF DISABLED MEDICAID CHILDREN
Although the profile of disabled children by demographic characteristics and type of disabling condition presented above generally holds true across all disabled children, there are significant utilization and expenditure differences among various subgroups of disabled children. To better understand these differences, disabled children were divided into three subgroups, by order of size:
-
SSI Cash (noninstitutionalized). This group includes disabled children receiving cash assistance through the SSI program who were not in a long-term care institution during the study period.
-
Institutionalized. Children who were institutionalized in a long-term care facility at some point during the study period were defined as a separate group. In determining eligibility, parental income is generally not considered to be available for institutionalized children. Thus, disabled children in institutions may come from families not considered to be low-income. Most disabled children in institutions received an SSI payment of $25 (in 1984) to meet their personal needs. States with medically needy coverage automatically extend coverage to the disabled in institutions if their income is less than the cost of their medical care. If a state does not have a medically needy program, it can elect from two optional coverage groups for the institutionalized: the disabled who would be eligible for SSI except that they are in an institution, and the disabled who qualify under a special income level for the institutionalized. Georgia did not have a medically needy program during 1984; however, it extended Medicaid eligibility to the institutionalized disabled under a special income level.
-
Noncash (noninstitutionalized). This group of children mainly consists of noninstitutionalized children receiving coverage under a state medically needy program. However, it also includes other mandatory and optional groups, such as those eligible for but not receiving SSI, and children qualifying under a waiver provision.
The distribution of disabled children in the study States by these subgroups is shown in Table 8, showing both proportions of enrollment and expenditures. The largest subgroup in terms of enrollment is SSI cash children living in the community. However, this group accounted for the majority of Medicaid expenditures for disabled children in only one of the three study states, Georgia. In California and Michigan, institutionalized disabled children accounted for 58% and 71% respectively of disabled child Medicaid expenditures, but only 8-10% of enrollment. Noninstitutionalized disabled children not receiving SSI benefits were only a small proportion of enrollment and expenditures in each of the States.
| TABLE 8. Distribution of Medicaid Enrollment and Expenditures for Disabled Children By Selected SubgroupsCalifornia, Georgia, and Michigan, 1984 | |||
| CA | GA | MI | |
| Percent of Enrollees | |||
| SSI Cash/Noninstitutionalized | 88.3 | 94.7 | 89.9 |
| Institutionalized | 9.5 | 4.7 | 8.2 |
| No Cash/Noninstitutionalized | 2.2 | 0.6 | 1.9 |
| Total | 100.0 | 100.0 | 100.0 |
| Percent of Expenditures | |||
| SSI Cash/Noninstitutionalized | 39.3 | 57.9 | 28.1 |
| Institutionalized | 57.5 | 41.8 | 70.9 |
| No Cash/Noninstitutionalized | 3.3 | 0.4 | 1.0 |
| Total | 100.1 | 100.1 | 100.0 |
SSI CASH (NONINSTITUTIONALIZED) DISABLED CHILDREN
As mentioned above, the vast majority of disabled children in each study State were SSI cash assistance beneficiaries. Further, most of the SSI children were living in the community. As shown in Table 8, 88% of California children and 90% of Michigan children were in this group, compared to 95% of Georgia children. The relatively higher percent of Georgia children in the SSI cash/noninstitutionalized group is attributable to two factors. First, Georgia had a much lower proportion of institutionalized disabled children than the other two States. Second, Georgia did not have a medically needy program for the disabled during the study period.
As shown in Table 9, most SSI disabled children utilized at least one Medicaid service during the year and thus were considered to be Medicaid recipients. Recipiency rates ranged from 84% in Michigan to 90% in California. It is somewhat puzzling that not all children received services during the year's period; however, the disabling conditions of some children (e.g., mild mental retardation) may not warrant medical services. Also, some children may have had private insurance coverage, in addition to Medicaid.
| TABLE 9. Medicaid Utilization and Expenditure Patterns of SSI Cash Children (Noninstitutionalized)California, Georgia and Michigan, 1984(Using Person Years of Enrollment) | |||
| Disabled SSI Cash Children(Noninstitutionalized) | |||
| CA(n=31,479) | GA(n=12,045) | MI(n=10,119) | |
| Percent Recipients of Any Service | 89.7 | 87.1 | 84.4 |
| Percent Inpatient Hospital Users | 13.8 | 20.3 | 10.9 |
| Hospital Days per User | 12.9 | 12.5 | 12.9 |
| Hospital Discharges per User | 2.0 | 2.0 | 2.0 |
| Percent Physician/Ambulatory Users | 80.8 | 75.9 | 74.9 |
| Visits per User | 9.8 | 10.3 | 7.9 |
| Percent Home Health Users | 1.0 | 1.9 | 3.2 |
| Home Health Visits Per User | 14.4 | 28.3 | 15.0 |
| Percent Dental Users | 34.4 | 27.1 | 29.2 |
| Visits per User | NA | 2.1 | 1.9 |
| Percent Using Prescription Drugs | 65.4 | 71.5 | 64.0 |
| Prescriptions per User | 9.5 | 13.3 | 13.4 |
| Percent Institutional Users | NA | NA | NA |
| Days per User | NA | NA | NA |
| Percent Inpatient Psychiatric Users | NA | NA | NA |
| Days per User | NA | NA | NA |
| Percent ICF/MR Users | NA | NA | NA |
| Days per User | NA | NA | NA |
| Percent Other ICF User | NA | NA | NA |
| Days per User | NA | NA | NA |
| Percent SNF Users | NA | NA | NA |
| Days per User | NA | NA | NA |
| Total Annual Expenditure per Enrollee | $2,434 | $2,251 | $1,490 |
| Inpatient Hospital | $1,338 | $1,352 | $755 |
| Physician/Ambulatory | $250 | $167 | $111 |
| Home Health | $7 | $27 | $38 |
| Dental | $28 | $39 | $23 |
| Prescription Drugs | $116 | $145 | $125 |
| Institutional (Long-Term Care) | 0 | 0 | 0 |
| Inpatient Psychiatric | 0 | 0 | 0 |
| ICF/MR | 0 | 0 | 0 |
| Other ICF | 0 | 0 | 0 |
| SNF | 0 | 0 | 0 |
| Other | $696 | $521 | $438 |
The rate of inpatient hospitalization for noninstitutionalized SSI children ranged from 11% in Michigan to 20% in Georgia. The higher hospitalization rate in Georgia conforms with other studies which have shown higher hospital use in the South compared to other regions. In all three states, SSI children averaged 13 days per hospital user. The physician/ambulatory user rate ranged from about 75% in Georgia and Michigan to 81% in California. The average number of visits per user was 10 in California and Georgia, compared to 8 for Michigan.
Only 1-3% of disabled SSI children received home health services during the year. The average number of home health visits per user ranged from 14 in California to 28 in Georgia. The majority of SSI disabled children did not receive any dental services during the study year. Dental care user rates ranged from 27% in Georgia to 34% in California, with an average of 2 visits per user. About two-thirds of disabled SSI children received at least one prescription drug during the year. Georgia and Michigan children averaged about 13 prescriptions per user, compared to 11 for California children.
The annual Medicaid expenditure per SSI child (noninstitutionalized) ranged from $1,490 in Michigan to $2,434 in California, with Georgia in between at $2,251. Across all three states, at least half the annual expenditure per enrollee was attributable to inpatient hospital care. Michigan spent considerably less per SSI child for inpatient hospital care than the other States. Michigan's expenditures for hospital care were $755 per child, compared to about $1,350 for California and Georgia. Michigan's lower hospital costs were attributable to a lower user rate (especially relative to Georgia) and a lower reimbursement rate per day of care (relative to California).
Since average data can be misleading, Table 10 shows the distribution of SSI children by annual Medicaid expenditure level. These data are different from the expenditure means presented earlier in two ways: they are not weighted by personyears of enrollment and they exclude those children who did not use any Medicaid services during the year. Although SSI disabled children who used services averaged $2,104 per child in California, the median expenditure was only $396. Georgia showed a similar pattern, with an overall average of $2,016 per child recipient, but $411 for the median expenditure. Finally, in Michigan the average was $1,255 per recipient, but the median expenditure was $239. The most expensive children had expenditures of $83,595 per recipient in Georgia, $216,128 in Michigan, and $536,085 in California. These distributional data show that a minority of children accounted for most of the expenditures, a pattern seen with most insurance groups.
| TABLE 10. Distributional Analysis of Annual Medicaid Expenditures Per Recipient for SSI Cash Disabled Children (Noninstitutionalized)California, Georgia and Michigan, 1984 | |||
| Disabled SSI Cash Children(Noninstitutionalized) | |||
| CA | GA | MI | |
| Average Annual Expenditure per Recipient | $2,104 | $2,016 | $1,255 |
| Median Annual Expenditure per Recipient | $396 | $411 | $239 |
| Annual Expenditure per Recipient at 25th Percentile | $132 | $133 | $80 |
| Annual Expenditure per Recipient at 75th Percentile | $1,347 | $1,697 | $788 |
| Annual Expenditure per Recipient at 90th Percentile | $3,943 | $5,137 | $2,566 |
| Annual Expenditure per Recipient at 95th Percentile | $7,678 | $9,374 | $4,754 |
| Highest Annual Expenditure per Enrollee | $536,085 | $83,595 | $216,128 |
| * Distribution does not include children without expenditures, and is not adjusted by personyears of enrollment. | |||
INSTITUTIONALIZED DISABLED CHILDREN
California and Michigan had similar proportions of institutionalized disabled children, 9% and 8% respectively. Georgia had a much lower institutionalization rate, with only 5% of disabled children institutionalized during 1984. A couple of factors contribute to the lower rate in Georgia, Georgia has fewer ICF/MR facilities relative to the other States, and it does not offer inpatient psychiatric care to children.
As mentioned earlier, most institutionalized children among the study States received SSI benefits of $25 per month to cover their personal needs, These children qualified for SSI assistance since the income of their families was not considered when they became institutionalized, and they had no income of their own. Only 13% of the institutionalized children in California, 15% in Georgia, and 9% in Michigan were not receiving SSI benefits. Generally, these no cash children qualified for coverage through the medically needy programs in California and Michigan, and under Georgia's optional coverage group which used a special income level to determine eligibility for the institutionalized.
By definition, all institutionalized children utilized Medicaid services during the year and thus were considered to be Medicaid recipients. In addition to institutional services, about 16-17% of institutional children in each study State used inpatient hospital care during the year (Table 11). The number of hospital days per user ranged from 11 in Michigan to 19 in California.
Much more variation was reported for physician/ambulatory care. In California and Michigan, 74-78% of institutionalized children used physician/ambulatory care during the year, compared to only 44% of Georgia children. The number of visits per user ranged from 19 to 26 in California and Michigan, respectively. The number of visits per user was only 8 in Georgia. However, these numbers have to be interpreted with caution. Georgia "bundles" physicians and other services into its institutional service package. The same bundling problem complicates the comparison of user rates for dental services and prescription drugs.
Study data show that most institutionalized children were in an institution for most of the study year. The average number of institutional days ranged from 300 in California to 333 in Georgia.
| TABLE 11. Medicaid Utilization and Expenditure Patterns of Institutionalized Disabled ChildrenCalifornia, Georgia and Michigan, 1984(Using Person Years of Enrollment) | |||
| Disabled Children Institutionalized | |||
| CA(n=3,386) | GA(n=597) | MI(n=926) | |
| Percent Recipients of Any Service | 100.0 | 100.0 | 100.0 |
| Percent Inpatient Hospital Users | 17.0 | 16.0 | 16.0 |
| Hospital Days per User | 19.2 | 16.9 | 11.3 |
| Hospital Discharges per User | 1.9 | 1.7 | 1.7 |
| Percent Physician/Ambulatory Users | 74.2 | 44.2 | 78.3 |
| Visits per User | 18.8 | 7.7 | 25.8 |
| Percent Home Health Users | 0.8 | 1.5 | 3.0 |
| Home Health Visits Per User | 13.8 | 12.1 | 20.4 |
| Percent Dental Users | 33.1 | 1.8 | 22.8 |
| Visits per User | NA | 1.3 | 1.6 |
| Percent Using Prescription Drugs | 57.2 | 33.3 | 68.5 |
| Prescriptions per User | 23.9 | 25.0 | 24.8 |
| Percent Institutional Users | 100.0 | 100.0 | 100.0 |
| Days per User | 300.0 | 332.8 | 305.3 |
| Percent Inpatient Psychiatric Users | 1.4 | NA | 16.3 |
| Days per User | 26.1 | NA | 103.8 |
| Percent ICF/MR Users | 65.4 | 73.1 | 47.9 |
| Days per User | 311.1 | 388.2 | 309.2 |
| Percent Other ICF User | 4.4 | 5.0 | 3.3 |
| Days per User | 129.4 | 270.3 | 222.3 |
| Percent SNF Users | 33.7 | 23.0 | 34.2 |
| Days per User | 261.3 | 313.0 | 299.3 |
| Total Annual Expenditure per Enrollee | $28,349 | $26,792 | $31,638 |
| Inpatient Hospital | $1,834 | $853 | $731 |
| Physician/Ambulatory | $370 | $62 | $234 |
| Home Health | $7 | $10 | $29 |
| Dental | $21 | $3 | $11 |
| Prescription Drugs | $185 | $103 | $175 |
| Institutional (Long-Term Care) | $25,304 | $25,461 | $29,926 |
| Inpatient Psychiatric | $70 | 0 | $3,999 |
| ICF/MR | $15,189 | $21,960 | $19,256 |
| Other ICF | $312 | $347 | $391 |
| SNF | $9,733 | $3,154 | $6,280 |
| Other | $627 | $300 | $532 |
The most common type of institutional care for this disabled child group was care in an ICF/MR facility. About 48% of institutionalized children in Michigan received care in ICF/MR facilities during the year, compared to 65% of California children and 73% of Georgia children. In all three States, children who used ICF/MR facilities averaged over 300 days of care during the year.
About 23% of Georgia institutionalized children and a third of such children in California and Michigan received services in SNF facilities during the year. The average number of days per SNF user was quite high, ranging from 261 to 313. Relatively fewer institutionalized children (3-5%) received services in other types of ICF facilities. The number of days per other ICF user ranged from 129 to 270.
It is difficult to compare the States with regard to the use of inpatient psychiatric care for children. Georgia did not cover this service for children during the study period. Available data showed 16% of Michigan's institutionalized children used inpatient psychiatric care during 1984, compared to 1% of California children. However, California's data may not be complete. Some mental health services in California are administered through a county-administered mental health program. When these services are provided to Medicaid enrollees, Medicaid pays the claims outside the regular MMIS system. Thus, there may be some underreporting of children receiving inpatient psychiatric care in California, complicating any comparisons to Michigan. However, it is not believed this underreporting would significantly impact the overall Medicaid patterns in California for institutionalized disabled children.
The annual Medicaid expenditure per institutionalized disabled child ranged from $26,792 in Georgia to $31,638 in Michigan, with California in between at $28,349, with most of the cost attributable to long-term care. ICF-MR care accounted for more than half the expenditures for institutionalized in all three study states.
As shown in Table 12, there was not as much of a difference in the distribution of annual expenditures per enrollee for institutionalized children, as was observed with SSI cash children (noninstitutionalized).
| TABLE 12. Distributional Analysis of Annual Medicaid Expenditures Per Recipient for Institutionalized Disabled ChildrenCalifornia, Georgia and Michigan, 1984 | |||
| Institutionalized Disabled Children | |||
| CA | GA | MI | |
| Average Annual Expenditure per Recipient | $24,615 | $24,387 | $27,746 |
| Median Annual Expenditure per Recipient | $19,694 | $25,475 | $22,442 |
| Annual Expenditure per Recipient at 25th Percentile | $11,559 | $14,674 | $14,533 |
| Annual Expenditure per Recipient at 75th Percentile | $41,425 | $35,006 | $41,292 |
| Annual Expenditure per Recipient at 90th Percentile | $45,898 | $37,532 | $51,756 |
| Annual Expenditure per Recipient at 95th Percentile | $49,194 | $38,176 | $55,698 |
| Highest Annual Expenditure per Enrollee | $248,301 | $68,976 | $175,935 |
| * Distribution does not include children without expenditures, and is not adjusted by personyears of enrollment. | |||
NO CASH DISABLED CHILDREN (NONINSTITUTIONALIZED)
Very few noninstitutionalized disabled children among the study States qualified for Medicaid through the optional eligibility groups extending Medicaid coverage to children not receiving SSI cash assistance. This group accounted for only 2% of Medicaid disabled children in California and Michigan and less than 1% in Georgia. The vast majority of the no cash children in California and Michigan qualified through the medically needy provisions, while the Georgia no cash children qualified under other provisions.
Disabled no cash children were enrolled for 6 to 7 months during the study year, compared to 10 or more months for all other disabled children (data not shown). This shorter length of enrollment probably relates to the more frequent redeterminations involved with medically needy and other optional coverage groups.
| TABLE 13. Medicaid Utilization and Expenditure Patterns of No Cash Disabled Children (Noninstituitonalized)California, Georgia and Michigan, 1984(Using Person Years of Enrollment) | |||
| Disabled No Cash Children(Noninstitutionalized) | |||
| CA(n=780) | GA(n=73) | MI(n=210) | |
| Percent Recipients of Any Service | 80.2 | 64.9 | 89.2 |
| Percent Inpatient Hospital Users | 25.7 | 21.6 | 17.1 |
| Hospital Days per User | 37.9 | 63.0 | 21.3 |
| Hospital Discharges per User | 3.1 | 3.1 | 2.3 |
| Percent Physician/Ambulatory Users | 67.8 | 51.4 | 77.5 |
| Visits per User | 21.3 | 29.2 | 15.1 |
| Percent Home Health Users | 2.6 | 5.4 | 7.2 |
| Home Health Visits Per User | 8.0 | 4.0 | 209.7 |
| Percent Dental Users | 21.8 | 10.8 | 31.5 |
| Visits per User | NA | 2.2 | 2.1 |
| Percent Using Prescription Drugs | 49.0 | 45.9 | 69.4 |
| Prescriptions per User | 11.1 | 14.3 | 13.7 |
| Percent Institutional Users | NA | NA | NA |
| Days per User | NA | NA | NA |
| Percent Inpatient Psychiatric Users | NA | NA | NA |
| Days per User | NA | NA | NA |
| Percent ICF/MR Users | NA | NA | NA |
| Days per User | NA | NA | NA |
| Percent Other ICF User | NA | NA | NA |
| Days per User | NA | NA | NA |
| Percent SNF Users | NA | NA | NA |
| Days per User | NA | NA | NA |
| Total Annual Expenditure per Enrollee | $12,821 | $5,037 | $3,700 |
| Inpatient Hospital | $10,705 | $3,154 | $1,835 |
| Physician/Ambulatory | $682 | $421 | $198 |
| Home Health | $10 | $12 | $30 |
| Dental | $27 | $13 | $755 |
| Prescription Drugs | $167 | $126 | $129 |
| Institutional (Long-Term Care) | 0 | 0 | 0 |
| Inpatient Psychiatric | 0 | 0 | 0 |
| ICF/MR | 0 | 0 | 0 |
| Other ICF | 0 | 0 | 0 |
| SNF | 0 | 0 | 0 |
| Other | $1,229 | $1,311 | $753 |
Disabled no cash children were more likely to be hospitalized than the other subgroups of disabled children, with hospital user rates ranging from 17-26% across the study states (Table 13). The number of hospital days per user were also considerably higher, ranging from 21 to 63. Although the user rates for physician/ambulatory care were not consistently higher in each of the states, this group of children had many more physician visits per user, ranging from 15 to 29 per child.
Not surprising when, the annual Medicaid expenditure per disabled no cash child was 2-5 times greater than that of SSI cash children, with annual expenditures per enrollee ranging from $3,700 to $12,821 across the study States. The vast majority of expenditures for this disabled group were for inpatient hospital care.
Table 14 presents data on the distribution of no cash children by their annual expenditure level. The reader is reminded that this table is not adjusted by personyears of enrollment, nor does it include children without expenditures. Thus, the average expenditure per child is considerably lower than the average presented in Table 13, since children in this group were usually enrolled for only 6-8 months. Although the average expenditure per no cash child in California in this table was $8,460, children at the median only had expenditures of $744. Georgia also showed a considerable disparity with these levels--the median child had expenditures of $1,006 compared to $3,085 on average. Similarly, in Michigan the average was $2,008, but children at the median were only at $1,222. The expenditures per child were very high at the 90th percentile in all three States. Thus, as with SSI cash children, a minority of children accounted for most of the expenditures.
| TABLE 14. Distributional Analysis of Annual Medicaid Expenditures Per Recipient for No Cash Disabled Children (Noninstitutionalized)California, Georgia and Michigan, 1984 | |||
| Disabled No Cash Children(Noninstitutionalized) | |||
| CA | GA | MI | |
| Average Annual Expenditure per Recipient | $8,460 | $3,085 | $2,008 |
| Median Annual Expenditure per Recipient | $744 | $1,006 | $261 |
| Annual Expenditure per Recipient at 25th Percentile | $163 | $204 | $69 |
| Annual Expenditure per Recipient at 75th Percentile | $4,145 | $3,643 | $1,222 |
| Annual Expenditure per Recipient at 90th Percentile | $23,534 | $8,891 | $3,521 |
| Annual Expenditure per Recipient at 95th Percentile | $40,738 | $12,328 | $11,290 |
| Highest Annual Expenditure per Enrollee | $417,757 | $28,345 | $43,055 |
| * Distribution does not include children without expenditures, and is not adjusted by personyears of enrollment. | |||
THE SUPREME COURT'S ZEBLEY DECISION
A final study objective was to assess whether study data might provide any insights into the impact of the Supreme Court's Zebley decision (February 20, 1990) on the Medicaid program. As mentioned earlier, the court ruled that the Social Security Administration (SSA) had been using a harsher disability test for children applying to the SSI program than had been intended by Congress or used for adults. Although individualized assessments of ability to work were used (when necessary) for adult SSI disability determinations, no comparable individualized functional assessments were used for children. Instead, children could qualify for SSI only if they suffered from a condition included in or equal to a specific listing of impairments developed by SSA.
Several problems exist with the listings for children which SSA has been using, according to Jameson and King.2 First, many childhood conditions are not included in the listings, and the listings do not address the symptoms that accompany many conditions. Specific disabling conditions which have proved to be problematic for SSI child applicants include Tourette syndrome, attention deficit disorder, Down syndrome, cystic fibrosis, sleep apnea, AIDS, muscular dystrophy, infant drug dependence and fetal alcohol syndrome. Second, the child listings have not been periodically revised to reflect current medical knowledge since 1977 (when they were originally developed), unlike the adult listings. Third, the listings do not describe the functional limitations associated with childhood disability. For example, they do not take into account a child's dependence on medical technology in order to function. Finally, the listings do not describe disease processes in terms of the various stages of childhood. Particular problems have been encountered with the disability determination process for infants and toddlers.
Prior to the ruling, SSA maintained that a functional assessment for children comparable to the vocational assessment for adults was not feasible. However, the court maintained that SSA could assess the impact of a disability on a child's ability to undertake normal daily activities, such as speaking, walking, washing, dressing, feeding oneself, going to school, playing, etc. Thus, children who have disabilities which are not included in the SSA listings will be entitled to an individualized assessment which uses an age-appropriate functional standard.
As part of the ruling, up to 250,000 children rejected for SSI since 1983 will be entitled to have their cases redetermined.3 In addition, the eligibility of all future child applicants will be determined using the new standards. Thus, the Medicaid program can be expected to show a sharp increase in enrollment for SSI-related disabled children . Also, although the Court's ruling does not speak directly to the Medicaid eligibility of any children found to be retroactively eligible for SSI benefits, HCFA has stated that it will grant provide Federal matching dollars to any State which requests them for children covered retroactively under the new provisions.
How many children are likely to qualify under the new standards? The Washington Post quotes Social Security Deputy Commissioner Louis Enoff as declining to provide an estimate, but saying, "tens of thousands of children and hundreds of millions of dollars" will be involved over the next few years. The same article says "some experts" estimate one-third of the 50,000 now being denied benefits on an annual basis will be eligible. Specific estimates of the numbers of children affected are not available from SSA or HCFA.
Will the Medicaid patterns of disabled children qualifying under the new functional standards be different from children qualifying under the pre-Zebley approach? Program analysts at HCFA and SSA, as well as the legal counsel for the Zebley case, were contacted to see what information they had on the characteristics of disabled children affected by the Zebley ruling. Unfortunately, no one seems to have a clear sense of the ruling's impact, particularly with regard to any Medicaid effects. First, some of these children denied SSI disability benefits in the past may have qualified for Medicaid anyway under other provisions, such as the AFDC, Ribicoff and/or medically needy groups. Second, no one knows which types of disabling conditions are most likely to be affected by the rulings. Some limited administrative data from SSA categorize children denied SSI coverage in 1989 by the "body system" of their disabilities. These data show children with "mental disorders" to account for 35% of the denied applicants. Another 14% of the denied group were reported to have "neurological" problems. No other body system accounted for more than 10% of the denied population of children. In any event, it is unknown which types of disabling conditions will be the most affected.
Thus, study data can only be used cautiously in estimating the impact of the Zebley decision. Assuming the "experts" are correct and approximately 17,000 children are added to the SSI rolls on an annual basis, total Medicaid expenditures could be increased by $10 to $47 million annually. The lower bound estimate assumes the average annual expenditure would be about $550 per child (using the 1984 California and Georgia median expenditure data of approximately $400 per noninstitutionalized SSI child, adjusted to 1989 dollars using the medical care price index). The higher bound estimate assumes annual Medicaid expenditures of $2,750 per child (using the 1984 California and Georgia average expenditure data of approximately $2,000 per child for noninstitutionalized SSI children, adjusted to 1989 dollars). Although the higher bound number is a sizeable amount, it would not represent a noticeable increase for Medicaid at the Federal level. Total FY1989 Medicaid expenditures exceeded $54 billion.
SUMMARY AND CONCLUSIONS
Study data on the personal characteristics of disabled children on Medicaid were generally consistent with other published information on SSI children. There are slightly more males than females among disabled children, and the average age was about 14 years. Four disease categories accounted for the vast majority of SSI children--mental retardation, diseases of the nervous system and sense organs (including infantile cerebral palsy, multiple sclerosis, epilepsy and muscular dystrophy, hearing loss and blindness), mental disorders, and congenital anomalies.
Among the study States, disabled Medicaid children accounted for 2-5% of child Medicaid enrollment and about 8-13% of child Medicaid expenditures. Disabled children were 8-12% of overall disabled Medicaid enrollment and a similar proportion of overall disabled Medicaid expenditures.
There were consistent differences in the Medicaid experience of three subgroups of disabled children among the study States in 1984:
-
Noninstitutionalized SSI Cash Assistance Children. The vast majority of disabled children disabled children on Medicaid were in this group (88% to 95%). They lived at home in the community and received SSI cash assistance benefits. The annual Medicaid expenditure per child in 1984 ranged from $1,490 to $2,434, but the median expenditure per child was only $239 to $411 among the study States. A minority of children in each State had exceptionally high expenditures, thus substantially increasing the overall average per child. About half the Medicaid expenditures for this group went to inpatient hospital care for the 11% to 20% of children who were hospitalized during the year.
-
Institutionalized Children. About 5%-10% of disabled children in each State were institutionalized, mainly in ICFs/MR and SNFs. The average number of institutional care days per child exceeded 300 for the year. About 17% also used inpatient hospital care during the year. The annual Medicaid expenditure per institutionalized child ranged from $26,792 to $31,638. Most children in this group received an SSI cash benefit each month of $25 to cover their personal needs.
-
Noninstitutionalized No Cash Children. Perhaps the most notable comment about this group is that there were so few disabled children living at home who received Medicaid benefits, but not SSI cash assistance. They accounted for only 1%-2% of disabled children among the study States. This group of children showed very different Medicaid utilization patterns. Their hospital user rate was 17%-26%, and they averaged many more days per hospital user than SSI cash children (noninstitutionalized). They were only enrolled for 6-7 months of the study year, compared to 10+ months for the other groups. The average Medicaid expenditure for the year ranged from $3,700 to $12,821 per child, but a small group of children had exceptionally high expenditures which greatly inflated the averages.
What conclusions can we draw then about Medicaid's coverage of disabled children. To start, study data showed the SSI program is currently the main gateway to Medicaid eligibility for low-income disabled children. Very few disabled children are gaining access to Medicaid through the medically needy provisions. In California, the most generous States with regard to its medically needy income threshold, only 2% of disabled children qualified through the medically needy provisions. A similar proportion was seen in Michigan, the other study State with medically needy coverage.
Why are so few disabled children qualifying under the medically needy provisions? Because State Medicaid programs deem family income to be available to children living in the community, many families with disabled children have income considerable in excess of State medically needy levels. Only when there is a major health crisis, such as a hospitalization, will they be able to incur medical liabilities of a sufficient amount to reduce their income to the medically needy level (through the spend-down process). Several study results point to this pattern. Disabled children in the no cash noninstitutionalized group had considerably higher Medicaid expenditures per enrollee when compared to SSI cash noninstitutionalized children. They had shorter lengths of enrollment during the study year. Their inpatient hospital user rates were considerably higher, and they averaged many more hospital days per user. In a sense, the medically needy program is giving these children catastrophic coverage, but not the ongoing coverage provided to SSI cash children.
Also, many low-income families with disabled children may not be aware of access to Medicaid coverage through the medically needy provisions. An application for SSI (and automatic Medicaid coverage) is handled by the Social Security Administration, but an application for medically needy coverage is processed by the local welfare department. The family of a disabled child denied SSI coverage may not understand that Medicaid eligibility might be possible with a second application to the welfare department. In any event, it certainly represents an additional administrative hassle. Finally, there is the stigma associated with welfare offices, which can reportedly discourage separate Medicaid applications.
There have been repeated calls for reform to the medically needy provisions, especially the income spend-down component. Generally, the reforms call for eliminating spend-down and changing to a buy-in provision for Medicaid coverage, using a fixed percent of income for a family.
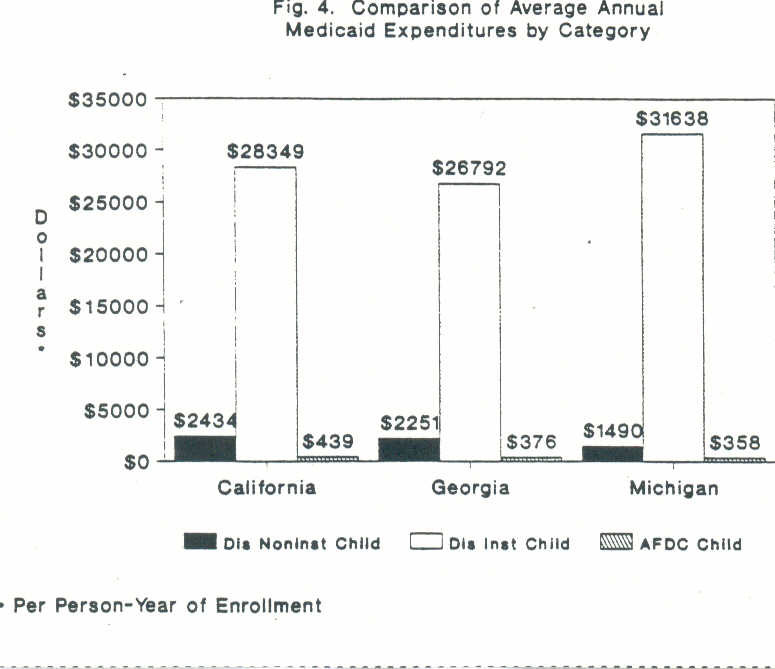
A second stud pattern of importance is the extreme difference in Medicaid expenditure levels per child between institutionalized disabled children and disabled children living in the community. Figure 4 shows the average Medicaid expenditure for the two main groups of disabled children--non-institutionalized SSI cash children and institutionalized children. The annual expenditure levels for institutionalized children were $28,000 to $32,000 across the study States, compared to $1,490 to $2,434 for SSI cash assistance children living in the community. Although the institutionalized only accounted for 5%-10% of Medicaid disabled children in each of the study States, the accounted for a much greater proportion of total Medicaid expenditures for disabled children. In two of the study States, well over half of the total Medicaid expenditures for disabled children were for the institutionalized.
These expenditure patterns underscore the importance of the optional Medicaid groups introduced during the 1980s to allow States to waive the Medicaid deeming rules for institutionalized children who could be cared for appropriately and cost-effectively at home. Recently available data indicates chat 36 States have home and community-based waiver programs which include disabled children, although only 9 States operated programs exclusively for disabled children in 1989. An additional 17 States offer TEFRA State plan options which allow the State to ignore parental income and resources when determining eligibility for home care. Estimates are not available on the number of disabled children receiving waiver services, but an estimated 4,000 children are being served through the TEFRA option nationwide.4
Certainly, study data showed a very low user rate for home health services in 1984--only 1%-3% for disabled children among the study States. More recent data may show a different pattern. Nevertheless, it seems safe to assume there is still opportunity for reducing institutional expenditures through the greater use of home health services.
A third conclusion of importance is that many noninstitutionalized disabled children did not have high Medicaid expenditures annually. There was substantial variation in the distribution of expenditures among children in the noninstitutionalized group, with a small proportion of very high cost children substantially increasing the overall average. The median annual expenditure per noninstitutionalized SSI cash child ranged from $239 in Michigan to $441 in Georgia. Thus, many disabled children do not have high annual Medicaid expenditures. Policymakers may mistakenly assume at times that all disabled children incur substantial Medicaid costs each year. Study data should be helpful in refuting this image.
Figure 4 also shows the annual Medicaid expenditure level in each of the study States for AFDC children. Although the average annual expenditure levels for noninstitutionalized SSI cash children were about 4-6 times the AFDC level for the study period, the median SSI child expenditure levels were much closer to the average AFDC levels.
As a final note, the Supreme Court's Zebley decision earlier this year may change the situation for the number of disabled children on Medicaid considerably. On February 20, 1990 the court ruled that the SSI program has been too harsh in its interpretation of the disability requirements for children. The Social Security Administration has been ordered to use individualized assessments in determining the disability status of children in the future. As a result, the overall level of Medicaid enrollment and expenditures for disabled children may change substantially. Study data indicate the expanded coverage may result in Medicaid increases of $10-$42 million annually.
NOTES
-
"Findings of the May 1981-May 1982 AFDC Study," SSA Publication No.13-11731, January 1985.
-
Jameson, E.J. and King, S.C., "The Failure of the Federal Government to care for Disabled Children: A Critical Analysis of the Supplemental Security Income Program," Columbia Human Rights Law Review, Vol.20, No.2, Spring, 1989.
-
The Washington Post, March 1, 1990.
-
Hall, L., Medicaid Home Care Options for Disabled Children, National Governors' Association, 1990; and Miller, N., "Medicaid 2176 Home and Community-Based Waivers: Program Trends, Research Directions," HCFA Office of Demonstrations and Evaluation, draft not dated.