
U.S. Department of Health and Human Services
Risk Selection Among SSI Enrollees in TennCare
Steven C. Hill, Christopher Trenholm, Craig Thornton and Judith Wooldridge
Mathematica Policy Research, Inc.
February 1999
PDF Version: http://aspe.hhs.gov/daltcp/reports/1999/TNRisk.pdf (40 PDF pages)
This report was prepared under contract #500-94-0047 between the U.S. Department of Health and Human Services (HHS), Office of Disability, Aging and Long-Term Care Policy (DALTCP) and and Mathematica Policy Research, Inc. Additional funding were provided by the HHS Health Care Financing Administration. For additional information about this subject, you can visit the DALTCP home page at http://aspe.hhs.gov/_/office_specific/daltcp.cfm or contact the office at HHS/ASPE/DALTCP, Room 424E, H.H. Humphrey Building, 200 Independence Avenue, S.W., Washington, D.C. 20201. The e-mail address is: webmaster.DALTCP@hhs.gov. The Project Officer was Hunter McKay.
The opinions and views expressed in this report are those of the authors. They do not necessarily reflect the views of the Department of Health and Human Services, the contractor or any other funding organization.
TABLE OF CONTENTS
A. CHARACTERISTICS OF THE TENNCARE PROGRAM, 1994 TO 1996
1. Types of Managed Care Plans, Provider Networks, and Regions in TennCare
2. Factors Likely Affecting Choice and Risk Selection
3. TennCares Payment System for Plans
B. TENNCARE ENROLLMENT PATTERNS
1. TennCare Enrollment Process
2. Distribution of Blind and Disabled SSI Beneficiaries Among Plans
D. RESULTS
1. Evidence of Risk Selection in TennCare, 1994 through 1996
2. Plan Switching and Effects on Risk Selection
3. Regional Variation in Risk to Plans
E. DISCUSSION
LIST OF FIGURES
FIGURE 1: TennCare Enrollment Process: Startup
FIGURE 2: Distribution of SSI Beneficiaries and AFDC Families by Type of TennCare Plan, October 1994
FIGURE 3: Risk Selection Among SSI Beneficiaries in TennCare, October 1994
LIST OF TABLES
TABLE 1: Medicaid Expenditures and Utilization Among SSI Beneficiaries Prior to TennCare Enrollment
TABLE 2: Risk Selection Among SSI Beneficiaries in TennCare, 1994-1996
TABLE 3: Risk Selection Among TennCare Plans Under Alternative Measures, 1994
TABLE 4: Risk Indexes for Sample Members Who Changed Plans Between October 1994 and January 1995
TABLE 5: Risk Indexes for Sample Members Who Changed Plans Between January 1, 1995, and January 1, 1996
TABLE 6: Alternative Risk Selection Indexes that Control for Regional Variations in Expenditures
PREFACE
This report is part of a broader study to evaluate five Medicaid state health reform initiatives, which are being conducted as Section 1115 research and demonstration projects. States propose and administer these projects, while the federal government approves the applications and monitors the projects. The five state projects being evaluated in this five-year research endeavor are Hawaii's QUEST, Rhode Island's Rite Care, Tennessee's, TennCare, Oklahoma's Sooner Care, and Maryland's HealthChoice. These projects greatly increase the scope of managed care for Medicaid beneficiaries and, sometimes, expand eligibility for coverage.
The early stages of the evaluation involve assessments of the design and initial implementation of the new projects. Later stages will include analyses of the programs' impacts, based on household surveys and, where feasible, analyses of existing claims and encounter data.
The project is being conducted under contract #500-94-0047 from the Health Care Financing Administration (HCFA), with additional support from the Substance Abuse and Mental Health Services Administration (SAMHSA) and the Office of the Assistant Secretary for Planning and Evaluation (ASPE). The federal project offices are Penny Pine of HCFA, John Drabeck and Floyd Brown of ASPE, and Jeff Buck of SAMHSA. Mathematica Policy Research, Inc. (MPR) is the prime contractor and the Urban Institute is a subcontractor. The project director is Judith Wooldridge (MPR). Craig Thornton (MPR) leads the disability, mental health, and substance abuse analyses. Leighton Ku (Urban Institute) leads the implementation analyses and Randall Brown (MPR) leads the impact analyses.
ACKNOWLEDGMENTS
This report has benefited from the work of many individuals. We appreciate the contributions of our project officers, John Drabek and Floyd Brown at the Office of the Assistant Secretary for Planning and Evaluation and Jamie Hadley at the Health Care Financing Administration. In addition, Paul Saucier provided helpful comments about the policy implications of risk selection. Sheila Hoag's knowledge about TennCare operational issues was an immense help throughout the development of this paper. Lorenzo Moreno and Leighton Ku reviewed the paper and provided many helpful suggestions. Sue Dodds provided expertise on research using Medicaid data. Marjorie Mitchell and Jane Nelson produced the report, which was edited by Patricia Ciaccio and Roy Grisham.
EXECUTIVE SUMMARY
Risk selection greatly complicates the administration of Medicaid managed care. It occurs when the health care needs of beneficiaries enrolled in a specific plan differ systematically from the needs of the overall beneficiary population. When risk selection occurs, state administrators should adjust payments to the managed care plans to ensure that each plan's payment accurately reflects the needs of its enrollees. Without such a payment system, problems for plans and beneficiaries are likely to arise. Plans with adverse selection (that is, a disproportionately large number of high-need beneficiaries) are likely to lack the resources required to deliver adequate care to their enrollees. Such plans face pressures to cut back on needed care and may ultimately drop out of the state's Medicaid managed care system. Plans with favorable selection (a disproportionately large number of low-need beneficiaries) will be paid more than is necessary to provide care.
The issue of risk selection is particularly important for states that enroll blind and disabled Supplemental Security Income (SSI) beneficiaries in managed care. SSI beneficiaries often need atypical and complex services. Many will require ongoing management by specialists, especially those beneficiaries with relatively rare conditions or with mental conditions. Furthermore, many SSI beneficiaries require ongoing social support services to address chronic limitations in functioning, while others have conditions that make communicating with providers difficult. The seriousness of these limitations and the underlying medical conditions mean that individuals can experience severe declines in their health and independence if proper services are not delivered. Managed care plans, which often began by serving healthier, employed populations, will be challenged to arrange for this needed care even if capitation payments accurately reflect the underlying health care needs of their members. In the face of adverse selection, those challenges can be magnified substantially.
We examine risk selection among SSI beneficiaries in Tennessee's Medicaid managed care program, TennCare. We focus on blind and disabled SSI beneficiaries younger than age 65, who are not simultaneously in Medicare and who enrolled in TennCare at its start in January 1994. Because beneficiaries could change plans in subsequent years (and thereby mitigate or exacerbate the initial risk selection), we track risk selection through TennCare's first two years. We used 1993 fee-for-service claims data and TennCare plan enrollment data for our analysis.
The level of risk among blind and disabled SSI beneficiaries is measured using information about pre-TennCare expenditure and use patterns. Our basic risk measure was each SSI beneficiary's 1993 expenditures under fee-for-service Medicaid. Previous fee-for-service expenditures have been used in numerous studies of risk selection, and expenditures are highly correlated across years for disabled SSI beneficiaries. We use these expenditure levels to estimate a "risk index" for each managed care plan that equals the average 1993 Medicaid expenditures for a plan's SSI enrollees, divided by the average 1993 expenditures for all SSI beneficiaries in TennCare. For a given plan, the higher the risk index is above a value of 1, the stronger the evidence that the plan has experienced adverse selection.
There was substantial risk selection among the managed care plans serving SSI beneficiaries in TennCare. In particular, the initial TennCare enrollment process resulted in substantial adverse selection for plans affiliated with medical schools and for the largest plan, which did not require primary care gatekeepers. The estimated risk indexes of the SSI beneficiaries enrolled in these plans were 12 to 40 percent above the average for all SSI beneficiaries. At the same time, a few plans experienced favorable selection among this population. In those plans, we estimate that the enrolled SSI beneficiaries had health care needs as much as 50 percent below the average for all SSI beneficiaries. The pattern of risk selection remained largely unchanged throughout the first three annual opportunities to change plans, and it is consistent across several alternative risk indexes.
Risk selection may have consequences for plans and beneficiaries. Some of the plans with adverse selection among the SSI beneficiaries also had financial problems, and one plan that experienced favorable selection reported substantial profits in the early years of TennCare. However, these apparent financial impacts on plans should be interpreted cautiously, because SSI beneficiaries are only 13 percent of the TennCare population, and many other factors, including the actuarial soundness of the rates overall, affect profitability. The fee-for-service claims data used for this paper could not be employed to assess actual profits from SSI beneficiaries or any impacts on access and quality of care.
Risk selection is difficult to prevent or reduce. States will find it difficult to reduce risk selection because it is hard to address the three factors causing it: beneficiary choice; differences among plans; and, in Tennessee, the assignment process for people who did not select a plan. Risk selection cannot easily be reduced by eliminating choice, because choice in all areas of life is important to people with disabilities, and federal government regulations require that beneficiaries have choices among plans. To some extent, states can control differences among plans. However, it seems likely that differences in plans' networks, reputations, provider payment systems, and other factors will persist, thus leading consumers to choose, and their providers to recommend, specific plans. The assignment process would be the easiest factor for states to address because it is under the state's direct control. Nevertheless, states may want to use the assignment feature most responsible for risk selection, assigning beneficiaries to plans whose networks contain the providers who have served those beneficiaries, because that feature also promotes continuity of care.
States have only limited options for addressing the consequences of risk selection. States can implement payment systems that match plan compensation to the expected needs of plan enrollees. Improving the match between payments and needs will likely reduce plans' incentives to market to healthier consumers, enhance the financial stability of plans that attract members with greater needs, and reduce the extent to which states pay plans with healthier members more than is necessary to provide care. States have two basic options:
-
Partial Capitation. By providing at least some compensation based on capitation, this method gives plans an incentive to provide cost-effective treatment. At the same time, providing some compensation based on costs or charges can help ensure that a plan has enough resources to arrange for the care required by high-need individuals.
-
Risk Adjusted Capitation. This method creates a set of group-specific capitation rates that reflect the expected costs of care for defined groups. It creates a stronger incentive to provide cost-effective treatment. The groups must be defined by diagnosis, to effectively predict expected costs of people with disabilities.
States have implemented each of these options, and, to date, there is little information on which specific method is most effective in reducing risk selection or the effects of risk selection on plans or SSI beneficiaries.
Implementing risk-adjusted capitation or partial capitation requires good data. When managed care is initially implemented, states can use the diagnostic information included in claims data from fee-for-service Medicaid to assign beneficiaries to rate cells for risk adjustment. But, as the managed care program matures over time, states need more recent data, including diagnostic information for people newly enrolled and for those with new or worsening health conditions. To implement reinsurance or risk corridors, states need reliable data on expenditures for care from each plan. Encounter data from managed care plans is the obvious source for diagnostic and expenditure information, but states have had difficulty acquiring accurate encounter data from the plans in the early years of managed care, and states have required substantial resources and time to implement full review systems and provide the plans with the feedback necessary to improve plan data accuracy. However, the benefits of these investments may be great, because the data are useful not only for rate setting, but also for numerous other purposes, including monitoring access and quality.
Risk selection will happen, states have limited options for reducing the consequences for plans and beneficiaries, and those efforts require encounter data. We found considerable risk selection among the SSI population in TennCare, and it is fairly certain to occur in other states, too. If states do nothing to adjust for risk selection in their payments to plans, some plans with adverse selection may eventually close and beneficiaries may be affected. States can implement payment systems to reduce the impacts of risk selection, and these payment systems require states and plans to invest substantial resources in their encounter data systems.
Risk selection can greatly complicate the administration of Medicaid managed care. It occurs when the health care needs of beneficiaries enrolled in a specific plan differ systematically from the needs of the overall beneficiary population. When risk selection occurs, state administrators should adjust payments to the managed care plans to ensure that each plan's compensation accurately reflects the needs of its enrollees. Without such a payment system, several problems are likely to arise. Plans with adverse selection (that is, a disproportionately large number of high-need beneficiaries) are likely to lack the resources required to deliver adequate care to their enrollees. Such plans face pressures to cut back on needed care and may ultimately drop out of the state's Medicaid managed care system. Plans with favorable selection (a disproportionately large number of low-need beneficiaries) will be paid more than is necessary to provide care.
Risk selection can arise for many reasons in Medicaid managed care. It can arise through the direct actions of managed care plans that systematically seek to enroll low-need beneficiaries by tailoring their marketing approaches to appeal to people who are unlikely to use much care. It can also arise indirectly as a result of the types of providers that plans include in their networks. For example, a plan that included a major academic medical center in its network is likely to attract the many high-need patients who receive care at that center. Similarly, plans that offer easy access to specialists or have large networks of specialists may also attract high-need beneficiaries. Finally, risk selection can arise through the efforts of states to assign beneficiaries to plans. For example, a state may try to assign beneficiaries that have been treated by a specific provider to the plan that includes that provider in its network. This assignment rule can concentrate high-need beneficiaries in a few plans if the providers that treat those beneficiaries are similarly concentrated in a few plans.
The issue of risk selection is especially important for states that enroll blind and disabled Supplemental Security Income (SSI) beneficiaries in managed care. SSI beneficiaries often need atypical and complex services. Many will require ongoing management by specialists, particularly those beneficiaries with relatively rare conditions or with mental conditions. Furthermore, many SSI beneficiaries require ongoing social support services to address chronic limitations in functioning and other conditions that make communicating with providers difficult. The seriousness of these limitations and the underlying medical conditions mean that individuals can experience severe declines in their health and independence if proper services are not delivered (Tanenbaum and Hurley 1995; and Smith and Ashbaugh 1995). Managed care plans, which often began by serving healthier, employed populations, will be challenged to arrange for this needed care even if capitation payments accurately reflect the underlying health care needs of their members. In the face of adverse selection, those challenges can be magnified substantially.
In this paper, we examine risk selection among managed care plans for SSI beneficiaries in Tennessee's Medicaid managed care program, TennCare, focusing in particular on TennCare's first two years (starting January 1994 and ending January 1996). Our analysis starts with a review of the TennCare program, especially the characteristics of the participating managed care plans that may have affected the choices of blind and disabled SSI beneficiaries and the nature of the payment system. We then summarize processes that Tennessee used to enroll beneficiaries in managed care plans and the overall distribution of SSI beneficiaries among the plans. Next, we describe the data available for analyzing risk selection and our analytic approach. Finally, we review the evidence of risk selection and conclude with a review of the lessons that Tennessee's experience provides for future payment and policies.
Our study focuses on blind and disabled SSI beneficiaries younger than age 65 who enrolled in TennCare at its start and who were not simultaneously enrolled in Medicare.1 Because beneficiaries could change plans in subsequent years (and thereby mitigate or exacerbate the initial risk selection), we track plan enrollments through early 1996. To assess risk selection, we use each SSI beneficiary's 1993 expenditures under fee-for-service Medicaid as a measure of his or her long-term health care needs relative to those of other beneficiaries. This approach has been used in many studies of risk selection (Hellinger 1995), and expenditures are highly correlated across years for disabled SSI beneficiaries (Kronick et al. 1996). We use these expenditure levels to calculate a "risk index" for each plan that is based on the average 1993 Medicaid expenditures for its SSI enrollees, divided by the average 1993 expenditures for all SSI beneficiaries in TennCare included in our study. For a given plan, the higher the risk index is above a value of 1, the stronger the evidence that the plan has experienced adverse selection. The risk index indicates the relative costs of a plan's members; it does not indicate a plan's actual expenditures. Plans can use provider networks, provider payment methods, and utilization management to control actual expenditures. In addition, because the year-to-year correlation of costs is not perfect, expenditure levels for 1993 will indicate only the general level of risk. States would need reliable encounter data to monitor the actual expenditures or health status of enrollees in plans.
Our findings suggest substantial risk selection among SSI beneficiaries with disabilities. In particular, the TennCare enrollment process resulted in substantial adverse selection for plans affiliated with medical schools and for the largest plan, which did not require enrollees to have primary care gatekeepers. The average 1993 Medicaid expenditure of SSI beneficiaries subsequently enrolled in these plans was 15 to 40 percent above the SSI average. At the same time, a few plans experienced favorable selection, enrolling SSI beneficiaries for whom we estimate substantially lower-than-average risk levels. The pattern of risk selection remained largely unchanged throughout the two years during which we tracked plan enrollees, and it is consistent across several alternative risk indexes that are based on measures of 1993 expenditures and utilization. TennCare's payment system, which provides a single rate for all blind and disabled beneficiaries and limited supplemental payments for high-cost cases, did not account fully for this risk selection. Thus, Tennessee faces the challenge of refining its payment system in order to avoid the long-term negative outcomes from risk selection.
A. CHARACTERISTICS OF THE TENNCARE PROGRAM, 1994 TO 1996
When Tennessee established its Medicaid managed care program, called TennCare, in 1994, it became one of the first states to enroll nearly all its SSI beneficiaries in managed care (Wooldridge et al. 1996; and U.S. General Accounting Office 1996). Prior to TennCare, only 6 percent of all Tennesseans were in managed cared (Wooldridge et al. 1996). Starting in January 1994, Tennessee enrolled almost a quarter of its population, 1.2 million people, into managed care, including its Medicaid population of about 800,000, among whom were approximately 150,000 blind and disabled SSI beneficiaries. The TennCare budget for the 1994-1995 fiscal year was approximately $2.8 billion.
1. Types of Managed Care Plans, Provider Networks, and Regions in TennCare
Twelve plans participated in the TennCare program in 1994:
-
Five Preferred Provider Organizations (PPOs): Blue Cross/Blue Shield of Tennessee (BCBS), OmniCare Health Plan (OmniCare), Preferred Health Partnership (PHP), HealthNet, and TennSource
-
Three Health Maintenance Organizations (HMOs) Affiliated with Medical Schools: TLC Family Care Health Plan (TLC; in Memphis), Vanderbilt Health Plan CommunityCare (VHP; in Nashville), and Total Health Plus (Total Health; in Knoxville)
-
Four Other HMOs: John Deere Health Care/Heritage National Health Plan (John Deere), Phoenix Health Care (Phoenix), Prudential HealthCare Community Plan (Prudential), and Access MedPlus
State licensure and contractual requirements were different for HMOs and PPOs. The HMOs had to be licensed by the state, which mandated that they meet requirements for financial reserves. The state capitated the HMOs but placed no limits on HMO administrative costs and allowed them to retain any profits. The contracts with the HMOs, however, expected the HMOs to have primary care gatekeepers from whom beneficiaries would have to obtain referrals before receiving specialty and nonemergency hospital care. In contrast, although state contracts with the PPOs paid them through the same capitation approach, they did not require PPOs to have primary care gatekeepers initially. Nevertheless, four of the five PPOs (HealthNet, OmniCare, PHP, and TennSource) had some form of gatekeeping, leaving BCBS as the only plan that did not require members to obtain referrals before seeing specialists (Harkey and Associates 1996). Although the PPOs did not have to be licensed, they were required to maintain adequate financial reserves. The state also limited the PPOs' administrative costs to 10 percent of total capitation payments and allowed the PPOs to keep only 5 percent of any profits they generated (another 5 percent of profits were supposed to be distributed to providers, with the remaining 90 percent returned to the state). Unlike many commercial PPOs, those in TennCare covered no out-of-network care. The PPOs were considered a transition system to help introduce managed care into Tennessee. By January 1997, all TennCare PPOs had converted to HMOs.
The TennCare Bureau divided the state into 12 geographic regions--4 urban (Chattanooga, Knoxville, Memphis, and Nashville) and 8 rural. It allowed participating plans to enroll members in any or all the regions in which they established adequate provider networks. In most regions during 1994, five to seven plans were available; in two western rural regions, however, beneficiaries could choose only between the two statewide plans, BCBS and Access MedPlus. All plans were available in at least three regions, with the exception of the HMOs affiliated with medical schools, which participated only in the home region of the medical school. This system continued to evolve over time so that, by January 1996, three plans operated statewide (Phoenix went statewide in late 1996) and one HMO, Total Health Plus, had been purchased by BCBS.2
2. Factors Likely Affecting Choice and Risk Selection
Federal and state policies that give beneficiaries choices among managed care plans, underlying differences among the plans, and the assignment process for those who did not choose the plans combined to produce risk selection. If beneficiaries had no choice in their plan, but instead were assigned randomly to plans, there would be no risk selection. Similarly, if there were no differences among plans, then, even if beneficiaries were allowed to choose a plan, we would not expect to find risk selection. Problems arise when plans differ and beneficiaries are free to choose the plan that appears most likely to meet their needs. For example, numerous studies have found that plans with rigid gatekeeping systems have favorable selection (Hellinger 1995), and experts believe that marketing can result in favorable selection (Newhouse et al. 1997).
TennCare allowed beneficiary choice and had substantial differences among the participating managed care plans. Thus there was a high likelihood that risk selection would arise. Because there are no premiums or co-payments for SSI beneficiaries in TennCare, plans did not compete for enrollees on the basis of price, as often happens in commercial insurance markets. Instead, the major differences among plans were in their provider networks, gatekeeping policies, name recognition, supplemental benefits, and marketing approaches.
Provider Networks. The networks of HMOs affiliated with medical schools were distinguished by the skills and reputation of those schools, which are likely to make the PPOs and HMOs affiliated with medical schools more attractive to people with the greatest medical needs (Retchin 1998).
Gatekeeping Policies. BCBS was the one plan that did not have gatekeepers at the beginning of TennCare (eventually, the state required it to have gatekeepers starting in 1996). As a result, this plan may have been more attractive to those SSI beneficiaries who had been using specialty providers in the past or who anticipated needing easy access to such providers in the future.
Name Recognition. The name recognition of the BCBS plan may have been particularly important for the choices of TennCare beneficiaries. Managed care was essentially new to Tennessee in 1994, and the 12 plans in TennCare had virtually no experience by which beneficiaries could judge their likely performance. Because BCBS had a long history as a health insurer in Tennessee, it had name recognition among beneficiaries even though it had not operated a managed care plan in Tennessee before TennCare. Access MedPlus had operated a voluntary Medicaid managed care plan in western Tennessee, but despite its track record, consumers may have had difficulty assessing its reputation because the earlier plan had a different name. The HMOs affiliated with medical schools (TLC, Total Health, and VHP) may have benefited from the long-term reputation of the schools.
Supplemental Benefits. Under TennCare's guidelines, the plans could add supplemental benefits to the basic TennCare benefit package, and some did so. For example, Access MedPlus offered reduced rates for routine adult dental care and vision care, an incentive program for pregnant women, and some free over-the-counter medications.3 Prudential offered extra coverage for adult emergency dental visits and special services for people with severe and persistent mental illness. TLC offered free home pregnancy testing kits.
Marketing Approaches. Unlike many other states, Tennessee permitted direct marketing by the plans. The plans responded with strategies that ranged from the intensive outreach and marketing efforts of Access MedPlus to the virtually nonexistent effort of VHP (Wooldridge et al. 1996). Some of the most noteworthy approaches are as follows:
-
Two of the HMOs affiliated with medical schools (TLC and VHP) focused their marketing and recruiting efforts on patients from the schools' hospitals and clinics, a marketing focus that is likely to result in adverse selection.
-
Some plans offered credit cards and free disposable diapers. These benefits may attract people with few health care needs, while those with greater needs (and higher costs) might make their choice on the basis of reputation for quality or access to expertise in chronic conditions and disability. However, no studies have linked these types of extra benefits to favorable selection.
-
OmniCare's aggressive marketing practices may have resulted in favorable selection. At the start of TennCare, this plan retained independent marketing agents, some of whom enrolled prisoners and other people not eligible for TennCare (Tennessee Comptroller of the Treasury 1995). People were also switched to OmniCare without their knowledge. The state later found that OmniCare was spending a significantly lower proportion of its gross TennCare revenues on patient care than other plans. That finding suggests overall favorable selection at OmniCare and that there may also have been favorable selection among SSI beneficiaries.
In May 1994, the state published marketing guidelines that constrained the managed care plans' marketing activities. The new rules required that the state approve all marketing materials, including advertisements and brochures, before they are printed or aired. These guidelines disallowed such marketing devices as offering credit cards but continued to allow some practices that are not permitted in other states, such as door-to-door marketing and offering life insurance.
It is important to note that risk selection can occur even when most beneficiaries make haphazard plan choices. The key to risk selection is the decisions of the people who require substantial ongoing care. These people and their health care providers are likely to be better informed about providers than is the general beneficiary population. In addition, the tendency of those individuals to maintain ongoing provider relationships will concentrate high-need beneficiaries in the plans whose networks include the specialists and other providers who serve those high-need beneficiaries. Thus, risk selection can occur even in a situation like the early years of TennCare, when many beneficiaries lacked information about plans or even how to get information about plans.
3. TennCare's Payment System for Plans
The TennCare payment system includes a basic adjustment for risk selection. All MCOs were paid the same capitation rates, based on the demographic characteristics and eligibility categories of their members. There were eight rate cells in the system: (1) children younger than age 1 (2) children ages 1 to 13, (3) males 14 to 44, (4) females 14 to 44, (5) adults 45 to 64, (6) adults 65 or older, (7) beneficiaries who also were eligible for Medicare, and (8) people classified as blind or disabled (most of whom were SSI beneficiaries). There are no geographic adjustments to the rates. At the start of TennCare, the rate for blind and disabled beneficiaries was $245 per member per month--more than twice the average rate for all eight groups ($101). The rate applied to beneficiaries who were blind or disabled, younger than age 65, and not concurrently receiving Medicare. This group included SSI beneficiaries and former SSI beneficiaries.4 Rates were based on average 1993 Medicaid expenditures per beneficiary, adjusted for inflation, and discounted for assumed savings from managed care and reductions in charity care and local government expenditures (Wooldridge et al. 1996). Rates increased in July 1994 and annually thereafter.5
For PPOs, the state capped management fees at 10 percent of capitation payments and required that 90 percent of any savings be returned to it. Thus, the state shared profits but not losses with the PPOs. One PPO, OmniCare, repaid the state $14.4 million in 1994, approximately 23 percent of its TennCare revenues, and owed the state $8 million in 1995, approximately 11 percent of its TennCare revenues.6 HMOs were not constrained in this regard.7
Capitation payments to plans are supplemented by a High Cost Chronic Conditions risk payment pool. Plans can apply to the pool for additional payments for members with any of the following six specific conditions: (1) AIDS, (2) coagulation defects, (3) cystic fibrosis, (4) transplants, (5) premature births, and (6) high-risk pregnancies and births. The supplemental payments from the pool are based on the average 1993 Medicaid expenditures for treating people with these conditions minus the capitation already paid for the enrollee. A plan can request payments from the pool for any TennCare enrollee, not just those who are eligible because they are SSI beneficiaries.
This pool was intended to account for adverse selection, but in fact, it appears to have played a minor role. The pool was funded for a fixed amount each year: $20 million in fiscal year 1994 and $40 million in fiscal years 1995 and 1996. This amount represents approximately 1.4 percent of the total TennCare budget. The state prorates all the requests for payment submitted by MCOs so that the entire pool is paid out each year. In fiscal year 1995, the average payment per individual with one of the conditions averaged $101, or about 3 percent of the capitation payments made for a blind and disabled person who was enrolled for a full year.8 The ability of the pool to offset the effects of risk selection among SSI beneficiaries is limited because pool payments are available for any beneficiary with one of the high-cost conditions. As a result, a substantial share of the pool payments are for non-SSI beneficiaries. Furthermore, the pool covers only a few of the high-cost conditions prevalent among disabled TennCare beneficiaries. Nonetheless, executives at one plan told us the pool was very helpful in maintaining its financial viability in the face of adverse selection.
B. TENNCARE ENROLLMENT PATTERNS
The TennCare enrollment process sought to match beneficiaries with the plan of their choice or, for those who did not make a choice, the plan whose network included the providers the beneficiary had used previously. The enrollment process succeeded in bringing more than a million people into managed care, but it was marred by substantial beneficiary confusion. In the end, the distribution of blind and disabled SSI beneficiaries among the plans was almost identical to the distribution of the much larger population of families receiving Aid to Families with Dependent Children (AFDC).
1. TennCare Enrollment Process
Initial enrollment in managed care plans was confusing for TennCare participants, because TennCare was implemented rapidly and because people were unfamiliar with managed care (Wooldridge et al. 1996). SSI beneficiaries followed the same process as other Medicaid beneficiaries, but the state also funded an Advocate Line to provide telephone assistance to people with disabilities or chronic conditions (Figure 1). In October 1993, three months before the start of TennCare, the state mailed each beneficiary a ballot listing the plans available in his or her region. Those who ranked their choices usually received their first choice. Approximately 60 percent of all Medicaid beneficiaries chose a plan, but the state did not keep statistics about the choices made by SSI beneficiaries or other subgroups or about assignment rates in each plan (Wooldridge et al. 1996).
The state assigned beneficiaries to plans when they did not make an explicit choice or when none of the beneficiary's first three choices was available (8 of the 20 plans listed on the initial ballots never contracted with TennCare). Assignment was a three-stage process (Wooldridge et al. 1996). First, the state reviewed an individual's claims history and tried to identify the primary care provider. It then determined in which plan the provider participated and assigned the individual to that plan. This stage is likely to exacerbate adverse selection among HMOs affiliated with medical schools, because beneficiaries with complex cases who previously had visited providers affiliated with medical schools probably were assigned to these HMOs. Second, the state checked to determine whether a beneficiary had been enrolled in the Tennessee Managed Care Network. Because that HMO was the precursor to Access MedPlus, all former enrollees who had not selected another TennCare plan were assigned to Access MedPlus. This stage affected only the few hundred SSI beneficiaries who had voluntarily enrolled in the Tennessee Managed Care Network prior to TennCare. Third, the state randomly assigned the remaining unassigned beneficiaries to plans in the same proportion as beneficiaries who had made a selection themselves. Some attempt was made to ensure that disabled enrollees were distributed proportionately across all plans.
| FIGURE 1. TennCare Enrollment Process: Startup |
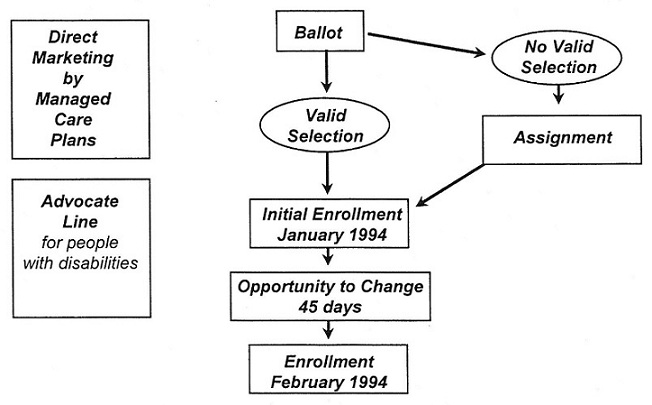 |
The Health Care Financing Administration required the state to reopen plan choice for 45 days (December 1, 1993, to January 15, 1994) because 8 of the 20 plans listed on the ballot did not sign contracts with the state and because of a lack of information about which providers were participating in each plan at the time of the initial ballot (Wooldridge et al. 1996). The TennCare Bureau sought to facilitate consumers' choices during this 45-day period by sending beneficiaries notices of their assigned plans and by notifying them of their opportunity to select new ones. Even after the 45 days, additional switching among plans occurred as some beneficiaries appealed their assignments and subsequently changed plans.
2. Distribution of Blind and Disabled SSI Beneficiaries Among Plans
Our analysis of plan enrollment and risk selection begins October 1994, after beneficiaries had two opportunities to select a plan. By this time, consumers had a chance to learn about TennCare and the participating plans and to make their enrollment decisions. Those consumers who initially were assigned to plans had an opportunity to choose another plan. Consumers had more opportunity to understand information about the plans available from their physicians, the plans' extensive marketing, and the Advocate Line.
In October 1994, 10 months after beneficiaries were given the initial opportunities to choose a plan, SSI beneficiaries and AFDC families had similar enrollment patterns (Figure 2). The two statewide plans had by far the highest enrollments: BCBS enrolled roughly 40 percent of AFDC and SSI beneficiaries, while Access MedPlus enrolled 31 percent. BCBS had the largest market share in most regions, although Access MedPlus had the largest share in Memphis, and the market shares of the two plans were about equal in Chattanooga. The marketing success of BCBS may be related to its name recognition and large provider network, as well as its lack of gatekeepers.
| FIGURE 2. Distribution of SSI Beneficiaries and AFDC Families by Type of TennCare Plan, October 1994 |
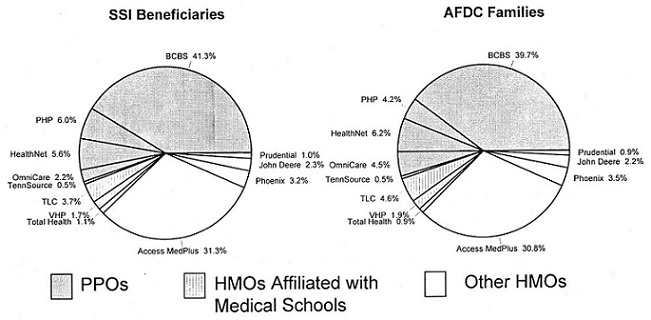 |
| SOURCE: Authors calculations from TennCare enrollment files, October 1994. NOTE: SSI sample includes blind/disabled beneficiaries in Medicaid through 1993 and in TennCare on October 1, 1994; January 1, 1995; and January 1, 1996. It excludes SSI beneficiaries over age 65, dual eligibles, and persons in a capitated plan in 1993. |
Some plans with low total enrollments were nonetheless important in particular regions, and at the regional level some plans were more important to SSI beneficiaries. Each of the three HMOs affiliated with a medical school had between 17 and 19 percent of the enrollment in its respective urban region. In Nashville and Knoxville, a greater percentage of SSI beneficiaries than AFDC families enrolled in the HMOs affiliated with a medical school, which is consistent with these HMOs being more attractive to people with greater health care needs.9 Other plans with large regional market shares were HealthNet, in Nashville and rural central Tennessee; OmniCare, in Memphis; Phoenix, in Chattanooga and Nashville; and PHP, in Knoxville and rural eastern Tennessee.
In October 1994 and each year thereafter, the state mailed beneficiaries ballots on which they could choose a new plan for the forthcoming calendar year. Although some beneficiaries did switch plans, overall enrollment patterns remained fairly stable. The main change consisted of increased enrollment in BCBS at the expense of all other plans, so that by January 1996, 51 percent of SSI beneficiaries were in BCBS (up from 41 percent in October 1994). This pattern was similar for AFDC families, so that by January 1996, 48 percent of them were in BCBS.
C. DATA AND METHODS
To analyze risk selection, we focus on 78,770 TennCare enrollees who were blind or disabled SSI beneficiaries, younger than age 65, and not simultaneously enrolled in Medicare.10 We selected nonelderly SSI beneficiaries enrolled only in Medicaid for all of 1993. We used 1993 beneficiaries because we could not construct our measure of expected medical costs under TennCare without prior Medicaid expenditure data. To compare risk selection through time for a consistent sample, we excluded all those beneficiaries not enrolled in TennCare in October 1994, January 1995, and January 1996 or who became dually eligible before then. To the extent that we could examine the enrollment patterns and degree of risk selection for the excluded groups, their results are consistent with those for our analysis sample.11 The final sample of 78,770 SSI beneficiaries accounts for 63 percent of all the SSI beneficiaries enrolled in TennCare on October 1, 1994, and who were under 65 years old and not in Medicare.
Slightly more than half of our sample of SSI beneficiaries are female, close to 60 percent are white, and about 30 percent are black. The average age at the time of sample selection was 34. This group is similar to the overall population of nonelderly Tennessee SSI beneficiaries, except that our sample contains somewhat fewer beneficiaries between ages 45 and 64. This slight age difference is due to our requirement that sample members be under age 65 throughout the entire period. About one out of five beneficiaries resided in the Memphis region of TennCare, whereas another 20 percent resided in one of the three other urban regions.
During the year preceding TennCare enrollment (1993), beneficiaries in our sample had highly variable and greatly skewed Medicaid expenditures and utilization (Table 1). The average monthly expenditure was $228, but the median monthly expenditure was only $81, and one in six beneficiaries had no expenditures.12 On the upper tail of the distribution, 10 percent of the sample members had monthly Medicaid expenditures that exceeded $579, and 5 percent had monthly expenditures exceeding $929. The maximum level of expenditures was more than $16,000 per month. With respect to service utilization, beneficiaries in our sample averaged almost 12 ambulatory visits during 1993. However, because some people made numerous visits, only one-third of the sample actually had 12 or more visits that year. About 12 percent had no visits, whereas 10 percent had more than 28 visits. Approximately 15 percent of beneficiaries had an inpatient stay for a reason not related to mental health. On average, beneficiaries spent 1.4 days in the hospital.
In all our analyses, we focus only on those 1993 Medicaid costs that correspond to services subsequently covered by TennCare plans. Thus, the expenditures shown in Table 1 (and the risk indexes described in the following paragraphs) pertain to services for which TennCare plans were responsible, which reflect about 70 percent of total Medicaid expenditures for the sample. The services excluded from TennCare plans' benefits were mental health services for adults with severe and persistent mental illness, mental health services for children with severe emotional disturbances, and the institutional cost of stays in long-term-care facilities.13
| TABLE 1. Medicaid Expenditures and Utilization Among SSI Beneficiaries Prior to TennCare Enrollment | |
| Average Monthly Expenditures (1993)a | |
| Mean | $228.22 |
| Median | $80.58 |
| 90th Percentile | $579.00 |
| 95th Percentile | $929.42 |
| Percentage with No Expenditures | 12.9 |
| Average Annual Utilization (1993) | |
| Ambulatory Visits | |
| Mean | 11.9 |
| Median | 6.0 |
| Percentage with More than 12 Visits | 33.0 |
| Percentage with Hospital Discharge | 14.7 |
| Mean Hospital Days | 1.4 |
| SAMPLE SIZE | 78,770 |
SOURCE: Authors calculations from Tennessee State Medicaid Research Files, 1993.NOTE: The SSI sample reflects blind/disabled beneficiaries in Medicaid throughout 1993 and in TennCare on October 1, 1994; January 1, 1995; and January 1, 1996. It excludes SSI beneficiaries over age 65, dually eligible for Medicaid and Medicare, and the few hundred SSI beneficiaries who were in a capitated plan prior to TennCare.
| |
To measure the extent of risk selection among TennCare plans, we use beneficiaries' 1993 experiences to construct a risk index for each plan. The basic risk index is calculated as the ratio of the average 1993 expenditure among SSI beneficiaries subsequently enrolled in a given plan to the overall sample average ($228). Thus, for example, if the mean expenditure for those who later enrolled in a given plan was $280, then that plan would have a risk index of 1.23 ($280 - $228), suggesting that it had experienced adverse selection.
This index is a good indicator of risk levels because of the high year-to-year correlation among expenditures for blind and disabled Medicaid beneficiaries. Kronick et al. (1995) found that expenditures in one year were highly predictive of expenditures in the following year for this population (they found correlations that ranged from 0.55 to 0.72). Furthermore, they found that mean annual expenditures varied little from year to year for groups of beneficiaries with specific chronic conditions.
Despite the predictive value of our risk index, it has two potential limitations for an analysis of risk selection. First, given the skewed distribution of Medicaid expenditures, this basic index may be unduly affected by a small number of beneficiaries with very high expenditures, particularly in smaller plans, where just a few outliers could significantly affect mean expenditures for an entire plan. Second, the expenditures of a given beneficiary under fee-for-service Medicaid do not reflect the actual costs that would be incurred by TennCare plans. Managed care plans might be able to increase the efficiency of the care delivered, and we would need reliable encounter data to measure actual expenditures by the plans. The risk index is a measure of the relative health care needs of a plan's members who are SSI beneficiaries, rather than the plan's actual expenditures on this population.
Because of these limitations, we investigate the sensitivity of our results to several additional measures of risk to TennCare plans. To eliminate the disproportionate effects of outliers, we use median 1993 Medicaid expenditures for beneficiaries enrolled in each plan as an alternative measure of risk. In addition, we use the percentage of beneficiaries in each plan who had no expenditures in 1993 and the percentage of beneficiaries in each plan who were in the top expenditure decile (among all beneficiaries) during 1993. Finally, four use measures (estimated using the pre-TennCare data from 1993) constitute alternatives to expenditures as predictors of risks (1) mean annual ambulatory visits, (2) percentage of beneficiaries with 12 or more visits, (3) mean annual inpatient days, and (4) percentage of beneficiaries with an inpatient stay during the year. As with the basic risk index, the degree of risk selection under each of these alternative measures is given by the ratio of the measure among SSI beneficiaries subsequently in the plan to the measure for all SSI beneficiaries.
D. RESULTS
The evidence suggests that there was substantial risk selection among SSI beneficiaries in TennCare. The TennCare enrollment process resulted in substantial adverse selection for most PPOs and for the HMOs affiliated with medical schools. At the same time, most other HMOs had favorable selection. This result remained largely unchanged throughout the three opportunities to choose plans during which we tracked enrollees, and it is generally consistent for all our alternative risk indexes based on measures of 1993 expenditures and utilization.
1. Evidence of Risk Selection in TennCare, 1994 Through 1996
For the first year of the TennCare program, 1994, the basic risk index (constructed from mean 1993 Medicaid expenditures) indicates substantial risk selection across the 12 TennCare plans (Figure 3). Seven plans experienced adverse selection. VHP, the HMO affiliated with the Vanderbilt University Medical Center, in Nashville, had the most severe adverse selection, with a risk index of 1.40. This index indicates that the 1993 Medicaid expenditures for the disabled SSI beneficiaries enrolled in VHP were 40 percent above the 1993 average for all disabled SSI beneficiaries in our sample. The other HMOs affiliated with medical schools, TLC and Total Health, also experienced adverse selection, with indexes M.12 and 1.38, respectively. John Deere, one of the smallest TennCare plans, was the only HMO not affiliated with a medical school that experienced adverse selection (its index was 1.10). Finally, three of the five PPOs (BCBS, HealthNet, and PHP) experienced adverse selection; BCBS, the largest TennCare plan, had an index of 1.14.
Four plans had favorable selection in 1994. This group included three of the four HMOs that were not affiliated with medical schools (Access MedPlus, Phoenix, and Prudential) and one relatively small PPO (OmniCare). Prudential, which enrolled only 3 percent of SSI beneficiaries in Memphis (the only region in which this plan operated), realized the most favorable selection, with a risk index of just 0.52. Access MedPlus, the second largest plan, faired nearly as well, with a risk index of 0.71. Finally, OmniCare and Phoenix had risk indexes of 0.64 and 0.87, respectively. TennSource did not experience risk selection.
| FIGURE 3. Risk Selection Among SSI Beneficiaries in TennCare, October 1994 |
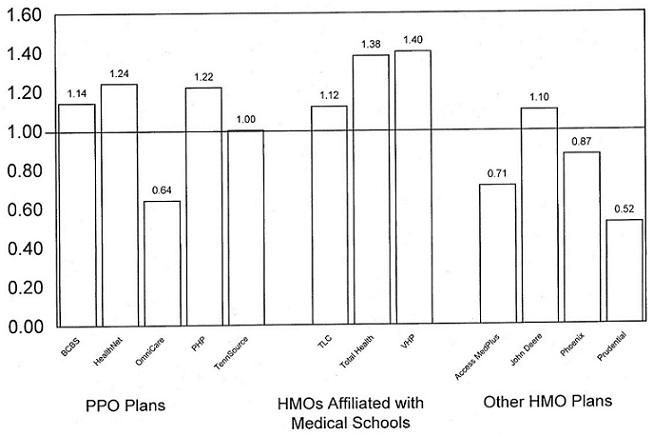 |
| SOURCE: Authors calculations from Tennessee State Medicaid Research Files, 1993, and TennCare enrollment files, October 1994. NOTE: Risk selection for a given plan is calculated as the mean (1993) Medicaid expenditures for SSI beneficiaries in the MCO divided by the mean for all SSI beneficiaries in our sample. |
The pattern of risk selection did not change substantially from October 1994 through January 1996, even though TennCare enrollees had annual opportunities to change plans (Table 2). Of the seven plans experiencing adverse selection in 1994, only John Deere and Total Health had more than a 10 percent change in selection in 1995 or 1996. For John Deere, adverse selection all but disappeared in 1995 but then increased to its highest level (a risk index of 1.22) in 1996. The changes for Total Health (which had just been purchased by BCBS) were much less substantial; its risk index fell from 1.38 in 1994 to 1.25 in 1996.14 The risk indexes of the four plans experiencing favorable selection in 1994 were largely unchanged in 1995 and 1996. Access MedPlus experienced the largest change in its risk index, but this change was fairly small (less than 10 percentage points) and in the direction of even more favorable selection.
| TABLE 2. Risk Selection Among SSI Beneficiaries in TennCare, 1994-1996 | |||||
| Sample Size1994a | Risk Index | PercentChange: 1994-1996 | |||
| 1994 | 1995 | 1996 | |||
| PPOs | 45,002 | 1.14 | 1.14 | 1.13 | -0.9 |
| BCBS | 34,039 | 1.14 | 1.15 | 1.14 | 0.0 |
| Health Net | 4,613 | 1.24 | 1.21 | 1.19 | -4.0 |
| OmniCare | 1,479 | 0.64 | 0.61 | 0.64 | 0.0 |
| PHP | 4,433 | 1.22 | 1.20 | 1.19 | -2.5 |
| TennSource | 438 | 1.00 | 1.02 | 1.01 | 1.0 |
| HMOs Affiliated with Medical Schools | 5,188 | 1.23 | 1.23 | 1.19 | -3.3 |
| TLC | 3,129 | 1.12 | 1.12 | 1.11 | -0.9 |
| Total Health | 836 | 1.38 | 1.40 | 1.25 | -9.4 |
| VHP | 1,223 | 1.40 | 1.42 | 1.42 | 1.4 |
| Other HMOs | 28,580 | 0.74 | 0.67 | 0.67 | -9.5 |
| Access MedPlus | 24,643 | 0.71 | 0.65 | 0.62 | -12.7 |
| John Deere | 1,854 | 1.10 | 1.02 | 1.22 | 10.9 |
| Phoenix | 1,604 | 0.87 | 0.81 | 0.88 | 1.1 |
| Prudential | 479 | 0.52 | 0.51 | 0.50 | -3.8 |
SOURCE: Authors calculations from Tennessee State Medicaid Research Files, 1993, and TennCare enrollment files, October 1994, January 1995, and January 1996.NOTE: Risk selection for a given plan is calculated as the mean (1993) Medicaid expenditures for beneficiaries in the plan divided by the mean for all beneficiaries in our sample.
| |||||
Not only are the selection results stable through time, but they are also consistent among alternative measures of risk for most plans (Table 3).15 The two largest plans, BCBS and Access MedPlus, had highly consistent results; based on any of the eight measures, BCBS had strong adverse selection, whereas Access MedPlus showed strong favorable selection. For these plans, as well as for most of the others, the risk measure that produces the most dissimilar results relative to our basic measure is the one based on median (1993) expenditures. However, this risk measure suggests that the degree of selection may be even more severe than is suggested by the basic risk index. For Access MedPlus, the results are particularly striking: using median 1993 expenditures rather than mean expenditures to measure risk yields a risk index of 0.48, rather than 0.71.
Although the results generally are consistent regardless of the risk measure used, we observe a pattern of results that suggests two of the HMOs affiliated with medical schools, TLC and VHP, experienced adverse selection primarily because they enrolled a disproportionate number of the highest-cost beneficiaries. For both plans, the basic risk index, which uses 1993 mean expenditures, suggests adverse selection. Little or no selection, however, is evident when we use measures that are unaffected by particularly high expenditure or utilization levels. These measures include median expenditures, the percentage of beneficiaries who incurred any expenditures, and the percentage with more than 12 visits. In contrast, for measures strongly affected by outlier levels of expenditures/utilization (the percentage in the top expenditure decile and the mean length of an inpatient stay), the selection results indicate even greater adverse selection than does the basic index. This finding is perhaps unsurprising. Medical sc1ools are more likely than other providers to treat patients with the most severe conditions (Retchin 1998). Thus, we might expect that a plan affiliated with a medical school would enroll a disproportionate number of the most expensive SSI beneficiaries.
| TABLE 3. Risk Selection Among TennCare Plans Under Alternative Measures, 1994 | ||||||||
| Expenditure Measures | Utilization Measures | |||||||
| Mean ($228) | Median ($81) | Percentagewith Positive Expenditures (87%) | Percentage in TopDecile(10%) | Mean Physician Visits(12 Visits) | Percentage with 12+Visits(33%) | Percentage withHospitalDischarge(15%) | MeanHospitalDays (1.4 Days) | |
| PPOs | 1.14 | 1.36 | 1.07 | 1.17 | 1.14 | 1.17 | 1.13 | 1.12 |
| BCBS | 1.14 | 1.35 | 1.07 | 1.17 | 1.14 | 1.17 | 1.13 | 1.12 |
| Health Net | 1.24 | 1.49 | 1.07 | 1.28 | 1.19 | 1.21 | 1.23 | 1.20 |
| OmniCare | 0.64 | 0.58 | 1.03 | 0.53 | 0.68 | 0.61 | 0.93 | 0.75 |
| PHP | 1.22 | 1.70 | 1.08 | 1.28 | 1.30 | 1.32 | 1.19 | 1.12 |
| TennSource | 1.00 | 1.09 | 1.02 | 1.06 | 1.01 | 1.06 | 0.88 | 0.92 |
| HMOs Affiliated with Medical Schools | 1.23 | 1.02 | 1.04 | 1.32 | 1.08 | 0.97 | 1.24 | 1.41 |
| TLC | 1.12 | 0.94 | 1.07 | 1.17 | 1.02 | 0.94 | 1.25 | 1.45 |
| Total Health | 1.38 | 1.44 | 0.99 | 1.49 | 1.24 | 1.06 | 1.13 | 1.31 |
| VHP | 1.40 | 1.01 | 0.98 | 1.59 | 1.14 | 1.01 | 1.29 | 1.37 |
| Other HMOs | 0.74 | 0.52 | 0.88 | 0.68 | 0.76 | 0.74 | 0.75 | 0.74 |
| Access MedPlus | 0.71 | 0.48 | 0.87 | 0.64 | 0.73 | 0.72 | 0.72 | 0.71 |
| John Deere | 1.10 | 1.20 | 1.03 | 1.06 | 1.04 | 1.12 | 1.09 | 1.15 |
| Phoenix | 0.87 | 0.65 | 0.90 | 0.85 | 0.88 | 0.81 | 0.78 | 0.82 |
| Prudential | 0.52 | 0.36 | 0.92 | 0.53 | 0.57 | 0.45 | 0.66 | 0.71 |
| SOURCE: Authors calculations from Tennessee State Medicaid Research Files, 1993, and TennCare enrollment files, October 1994.NOTE: For each measure, risk selection for a given plan is calculated as the level/rate for beneficiaries in the plan dividied by the level/rate overall. | ||||||||
2. Plan Switching and Effects on Risk Selection
The most important reason for the stability of risk selection between 1994 and 1996 is the small number of beneficiaries in our sample who switched plans during this period (Table 4). Overall, only 12 percent of beneficiaries switched plans between 1994 and 1995 (only 9 percent switched between 1995 and 1996). Those who switched to a new plan generally had slightly higher costs than those who remained with their original plan. During the period October 1994 to January 1995, beneficiaries who switched had a risk index (based on 1993 mean expenditures) of 1.05, compared with 0.99 among those who stayed in their plan; in 1996, the respective ratios were 1.06 and 0.99.
People who switched tended to select plans that had enrollees with similar risk indexes; that is, people with high-risk indexes tended to switch to plans with adverse selection, and those with low risk indexes tended to switch to plans with favorable selection. For the period 1994 to 1995, enrollment in BCBS grew because people switched from every other plan to BCBS. This additional enrollment actually increased the adverse selection at BCBS, because the risk index of beneficiaries switching to BCBS was identical to the index of those who stayed in BCBS (1.15) but higher than the index of those who left BCBS (0.89). In contrast, net enrollment in other plans declined, but most plans managed to add at least a small number of beneficiaries with a lower-risk index than the index of those who left.16 This pattern was particularly evident among the four plans that already had experienced favorable selection in 1994 (Access MedPlus, OmniCare, Phoenix, and Prudential). For example, the risk index for people leaving Access MedPlus was 1.03, whereas the index for those entering was 0.85.
| TABLE 4. Risk Indexes for Sample Members Who Changed Plans Between October 1994 and January 1995 | ||||||
| People Leaving the Plan | People Entering the Plan | People Staying in the Plan | ||||
| Index | Number | Index | Number | Index | Number | |
| PPOs | 1.04 | 3,047 | 1.12 | 7,419 | 1.15 | 41,955 |
| BCBS | 0.89 | 1,293 | 1.15 | 6,424 | 1.15 | 32,746 |
| Health Net | 1.31 | 511 | 0.90 | 345 | 1.24 | 4,102 |
| OmniCare | 0.75 | 324 | 0.63 | 250 | 0.6 | 1,155 |
| PHP | 1.24 | 799 | 1.08 | 387 | 1.22 | 3,634 |
| TennSource | 0.96 | 120 | 1.23 | 13 | 1.01 | 318 |
| HMOs Affiliated with Medical Schools | 1.13 | 835 | 0.92 | 263 | 1.25 | 4,353 |
| TLC | 0.93 | 417 | 0.82 | 217 | 1.15 | 2,712 |
| Total Health | 1.29 | 216 | 0.97 | 19 | 1.41 | 620 |
| VHP | 1.37 | 202 | 1.67 | 27 | 1.41 | 1,021 |
| Other HMOs | 1.05 | 5,831 | 0.84 | 2,031 | 0.66 | 22,749 |
| Access MedPlus | 1.03 | 4,558 | 0.85 | 1,845 | 0.64 | 20,085 |
| John Deere | 1.17 | 862 | 0.81 | 39 | 1.03 | 992 |
| Phoenix | 1.09 | 338 | 0.87 | 118 | 0.81 | 1,266 |
| Prudential | 0.65 | 73 | 0.61 | 29 | 0.50 | 406 |
| All Plans | 1.05 | 9,713 | 1.05 | 9,713 | 0.99 | 69,057 |
| SOURCE: Authors calculations from Tennessee State Medicaid Research Files, 1993, and TennCare enrollment files, October 1994 and January 1995.NOTE: The risk index for a given plan is calculated as the mean 1993 Medicaid expenditures for beneficiaries in the plan, divided by the mean for all beneficiaries. | ||||||
Plan switching between 1995 and 1996 left the overall pattern of risk selection unchanged (Table 5). Switching increased enrollment in BCBS and four other plans. Unlike 1994-1995, however, the newest BCBS enrollees had a somewhat lower risk index (1.10) than did those who left BCBS (1.25). Access MedPlus experienced the largest net decline in enrollment but almost no change in the average risk level of its enrollees. The pattern of changes in other plans' risk indexes was mixed, with three experiencing a net increase in risk as a result of switching and seven experiencing a net reduction.
| TABLE 5. Risk Indexes for Sample Members Who Changed Plans Between January 1, 1995, and January 1, 1996 | ||||||
| People Leaving the Plan | People Entering the Plan | People Staying in the Plan | ||||
| Index | Number | Index | Number | Index | Number | |
| PPOs | 1.20 | 2,469 | 1.06 | 4,875 | 1.14 | 46,905 |
| BCBS | 1.25 | 1,355 | 1.10 | 4,145 | 1.14 | 37,815 |
| Health Net | 1.28 | 424 | 0.80 | 175 | 1.20 | 4,023 |
| OmniCare | 0.56 | 193 | 0.73 | 336 | 0.62 | 1,212 |
| PHP | 1.23 | 444 | 0.92 | 175 | 1.20 | 3,577 |
| TennSource | 1.10 | 53 | 1.05 | 44 | 1.00 | 278 |
| HMOs Affiliated with Medical Schools | 1.27 | 657 | 0.73 | 210 | 1.22 | 3,959 |
| TLC | 0.93 | 324 | 0.67 | 192 | 1.15 | 2,605 |
| Total Health | 1.82 | 164 | 0.60 | 5 | 1.25 | 475 |
| VHP | 1.41 | 169 | 1.68 | 13 | 1.42 | 879 |
| Other HMOs | 0.94 | 3,775 | 1.11 | 1,816 | 0.63 | 21,005 |
| Access MedPlus | 0.93 | 3,159 | 0.92 | 825 | 0.61 | 18,771 |
| John Deere | 0.97 | 290 | 1.59 | 355 | 1.04 | 741 |
| Phoenix | 1.11 | 291 | 1.15 | 579 | 0.73 | 1,093 |
| Prudential | 0.45 | 35 | 0.43 | 57 | 0.51 | 400 |
| All Plans | 1.06 | 6,901 | 1.06 | 6,901 | 0.99 | 71,869 |
| SOURCE: Authors calculations from Tennessee State Medicaid Research Files, 1993, and TennCare enrollment files, January 1995 and January 1996.NOTE: The risk index for a given plan is calculated as the mean 1993 Medicaid expenditures for beneficiaries in the plan, divided by the mean for all beneficiaries. | ||||||
3. Regional Variation in Risk to Plans
Because nine TennCare plans accepted enrollment in only 1 to 5 of the 12 regions of the state, regional variation in medical costs might explain much of the observed risk selection. Average 1993 Medicaid expenditures and utilization among SSI beneficiaries did vary widely among regions. On the basis of beneficiaries' regions of residence in 1994, for example, mean 1993 Medicaid expenditures varied from just $169 per month in Memphis to $300 per month in Knoxville, both areas with medical schools. Because of this regional expenditure variation and the lack of geographic adjustments to rates, plans that enroll beneficiaries from only one or two regions in the state may experience risk selection relative to the statewide TennCare program. For example, a plan that enrolled only beneficiaries from the Knoxville region would experience adverse selection (their enrollees would be expected to have 1993 Medicaid expenditures above the statewide average), whereas a plan that enrolled only from the Memphis region would experience favorable selection. This type of risk selection can occur even if there is no risk selection within a region.
After controlling for the effects of this regional variation in mean expenditures, we find that the degree of risk selection among plans generally weakens but does not disappear (Table 6).17 Although controlling for regional variation changed the estimated values of the risk indexes, doing so altered our qualitative findings about risk selection for only two small plans, TennSource and Total Health. Examining the seven plans for which we estimated adverse selection, using our basic risk index, shows that controlling for region suggests slightly less adverse selection. Not surprisingly, the risk index for BCBS changed little when controlling for region, because this plan operates statewide. The remaining plans with adverse selection showed small declines in the degree of selection, with one exception; TLC, the HMO affiliated with a medical school in Memphis, showed much greater adverse selection when we used the index that controls for the low average costs- of beneficiaries in TLC's region. Among the plans for which the basic index showed favorable selection, the results when controlling for region also show favorable selection. Even after controlling for the fact that OmniCare and Prudential operated in regions with low average expenditures in 1993, we find significant favorable selection. Taken together, these results suggest that, although cost differences among market areas may have exacerbated risk selection under TennCare, they are not the primary source for such selection.
| TABLE 6. Alternative Risk Selection Indexes That Control for Regional Variations in Expenditures | ||||||
| Basic Index | Indexes Controlling for Regional Variations | |||||
| 1994 | 1995 | 1996 | 1994 | 1995 | 1996 | |
| PPOs | 1.14 | 1.14 | 1.13 | 1.10 | 1.10 | 1.09 |
| BCBS | 1.14 | 1.15 | 1.14 | 1.11 | 1.11 | 1.10 |
| Health Net | 1.25 | 1.21 | 1.18 | 1.15 | 1.11 | 1.09 |
| OmniCare | 0.62 | 0.60 | 0.63 | 0.82 | 0.78 | 0.83 |
| PHP | 1.24 | 1.21 | 1.19 | 1.13 | 1.10 | 1.09 |
| TennSource | 1.02 | 1.05 | 1.03 | 0.76 | 0.78 | 0.77 |
| HMOs Affiliated with Medical Schools | 1.23 | 1.24 | 1.21 | 1.38 | 1.40 | 1.40 |
| TLC | 1.12 | 1.12 | 1.12 | 1.51 | 1.50 | 1.51 |
| Total Health | 1.43 | 1.46 | 1.28 | 1.07 | 1.10 | 0.96 |
| VHP | 1.42 | 1.43 | 1.44 | 1.27 | 1.30 | 1.30 |
| Other HMOs | 0.74 | 0.68 | 0.67 | 0.78 | 0.73 | 0.72 |
| Access MedPlus | 0.71 | 0.66 | 0.62 | 0.76 | 0.72 | 0.69 |
| John Deere | 1.06 | 0.99 | 1.19 | 1.01 | 0.91 | 1.06 |
| Phoenix | 0.87 | 0.83 | 0.90 | 0.82 | 0.78 | 0.86 |
| Prudential | 0.52 | 1.51 | 0.51 | 0.69 | 0.68 | 0.68 |
| SOURCE: Authors calculations from Tennessee State Medicaid Research Files, 1993, and TennCare enrollment files, October 1994, January 1995, and January 1996.NOTE: The risk index for a given plan is calculated as the mean 1993 Medicaid expenditures for beneficiaries in the plan, divided by the mean for all beneficiaries. We controlled for regional variation by scaling mean 1993 expenditures in each region to equal the statewide mean. | ||||||
E. DISCUSSION
The available evidence suggests that there was substantial risk selection among the managed care plans in TennCare. In particular, according to several measures of risk selection, blind and disabled SSI beneficiaries with higher than average health care needs disproportionately enrolled in seven plans, while beneficiaries with relatively low needs disproportionately enrolled in four other plans (one plan appears to have enrolled an average mix of beneficiaries). Moreover, except for one small plan, the degree of adverse selection was consistent over time and could not be explained by regional variations in beneficiary costs.
The financial performance of several plans was associated with risk selection, although it is impossible to disentangle completely the consequences of this risk selection for SSI beneficiaries from the effects of other factors. Total Health, for example, experienced substantial adverse selection among SSI beneficiaries and was purchased by BCBS in fall 1995, after almost two consecutive years of losses. Similarly, HealthNet, which also experienced adverse selection, sold its TennCare product to Phoenix in 1997. Other plans experiencing adverse selection took measures to sustain their viability. VHP, which experienced the worst adverse selection, diversified into commercial and Medicare markets. By 1998, its TennCare enrollment accounted for only 20 percent of its membership, down from 88 percent in 1995 (Harkey 1998). TLC, which also experienced adverse selection, expanded its market area, in hope that a larger population base would enhance its financial position. In contrast, OmniCare, which experienced favorable selection, reported substantial profits in the early years of TennCare (under TennCare regulations, 90 percent of those profits were returned to the state). However, these apparent impacts on plans' financial status, ownership, and marketing strategies should be cautiously interpreted, because (1) SSI beneficiaries are only 13 percent of TennCare beneficiaries, (2) many other factors (including the actuarial soundness of the rates overall) affect profitability, and (3) we could not measure actual profits or losses due to SSI beneficiaries.
Risk selection may also have affected the care delivered to beneficiaries, but we cannot assess the impacts of TennCare on access, service use, and quality with the fee-for-service claims data employed for this paper.
States will have difficulty preventing or reducing risk selection because it is hard to address three factors causing it: beneficiary choice among plans, the assignment process for people who did not select a plan, and differences among plans. Ending beneficiary choice among plans conflicts with federal government regulations, which require that beneficiaries have choices, and with the goals of people with disabilities, who seek consumer choice in all areas of their lives. If overcoming these obstacles were desirable, states could, for example, enroll all beneficiaries in a single plan or randomly assign them to plans. States could use random assignment for beneficiaries who did not select a plan, but this may conflict with efforts to promote continuity of care. States can use the assignment process to promote continuity of care by assigning each beneficiary to a plan whose network contains providers who previously served the beneficiary. Tennessee, for example, used this as an assignment criterion.
It seems likely that plans will continue to differ in ways that are important to people with relatively high care needs, although states can, to some extent, reduce risk selection through contracting and regulation efforts designed to minimize differences among plans (Enthoven 1993). Plans are likely to continue to differ in their provider networks, reputations, and provider payment arrangements. High-need individuals will continue to be drawn to specific plans because of these differences and to maintain relationships with specific providers or to seek care from well-regarded specialists. However, states have undertaken efforts to reduce differences created by marketing strategies. Horvath and Kaye (1997) report that most state Medicaid managed care programs require all plans to offer the same benefits package (something Tennessee did not do). States also have tried to control competition among plans by directly providing beneficiaries with information about plans and by contracting with enrollment brokers to provide impartial assistance to consumers. Tennessee has addressed competition by regulating plans' direct-marketing materials. In these ways, states may be able to reduce those differences among plans that might systematically lead some types of individuals to choose specific plans.
If states are unsuccessful in eliminating the underlying causes of risk selection, then they can reduce the negative consequences of risk selection by implementing a payment system that will match plan compensation with the expected needs of plan enrollees. Improving the match between payments and needs will likely reduce incentives to market to healthier consumers, enhance the financial stability of plans that attract members with greater needs, and reduce the extent to which states pay plans with healthier members more than is necessary to provide care. Two options are partial capitation and risk-adjusted capitation, but, to date, little information is available on whether these partial capitation or risk-adjusted capitation arrangements have reduced risk selection or the effects of risk selection on plans or SSI beneficiaries.
Partial capitation arrangements combine elements of fee-for-service and capitated payment systems and have the advantages and disadvantages of both systems (Newhouse et al. 1997). By providing at least some compensation based on capitation, partial capitation provides an incentive for plans to provide cost-effective treatment. At the same time, providing some compensation based on costs or charges can help ensure that a plan has enough resources to arrange for the care required by high-need individuals. Partial capitation, however, still creates an incentive for plans to compete for lower-cost consumers.
Many states have implemented some form of partial capitation, although some, including Tennessee, have not (Horvath and Kaye 1997). One form of partial capitation is reinsurance or risk corridors: plans may be held liable for expenses up to a per person or aggregate limit, after which the state is responsible for some or all additional costs.18 Partial capitation requires plans to provide reliable expenditure data for high-cost cases. The plans participating in TennCare that appear to have had adverse selection due to disproportionate enrollment of very-high-cost cases, TLC and VHP, could have benefited from a partial capitation system that focuses on cost outliers.
Another partial capitation option is to exclude certain high-cost groups or high-cost services from managed care. Many states have excluded from managed care high-cost groups, especially SSI beneficiaries and people with serious mental illness. Tennessee excludes some services from managed care, specifically home- and community-based waiver program services and nursing home care.
Risk-adjusted capitation puts plans fully at risk and pays them for each member according to a specific rate cell in which the member falls. The rate cell for a given beneficiary is the expected cost of providing care to beneficiaries with similar characteristics, most often based on the average fee-for-service expenditures. Full capitation provides a strong incentive for managed care plans to minimize costs, and risk adjustment reduces the incentives to compete for beneficiaries with lower expected costs. Rate cells defined by beneficiaries' health conditions, rather than merely by demographics, more effectively predict the expected costs of people with disabilities. However, even risk adjustment may not completely eliminate risk selection, because it would be difficult to develop rate cells for different levels of severity for every health condition, and managed care plans will still have some incentive to compete for beneficiaries with lower expected costs for their rate cells.
A few states have implemented risk adjustment. Colorado and Maryland pay plans prospectively, based on diagnoses prior to enrollment in managed care. Since 1996, Colorado has used the Disability Payment System to pay plans that participate in its Medicaid program. Under this system, the rate cell for each Medicaid beneficiary is defined by diagnoses of medical conditions recorded in fee-for-service claims data that have been found to be highly predictive of future costs (Kronick et al. 1996). In 1997, Maryland implemented a risk-adjustment system for people with disabilities that currently uses 9 rate cells based on diagnoses and 22 cells based on demographics. The capitation rates varied from $95 to $1,105 per member per month in 1997 (Ormond and Goldenson 1999).
The risk payment pool used by TennCare is an example of retrospective risk adjustment, under which each plan is paid an additional fixed amount for beneficiaries experiencing certain conditions after enrolling in the plan. Although TennCare successfully implemented a risk pool that helped plans with some high-cost cases, the risk pool was too limited in scope and funding to reimburse plans appropriately for high-cost beneficiaries, particularly given the substantial risk selection that plans experienced. However, a more comprehensive risk pool, which was better funded and included a wider array of conditions, could constitute an adequate approach to mitigate the effects of risk selection. Such a pool probably would need to be very large, perhaps accounting for a quarter to more than half of all payments to plans (Newhouse et al. 1997). The TennCare Bureau is in the process of changing the payment pool method and basing it on the Ambulatory Care Groups method instead of the chronic conditions list; therefore, it will likely include more conditions that are important to people with disabilities. This change would not alter the primary limitation of the risk pool, because the budget will remain unchanged at $40 million each year (or 2.5 percent of the basic MCO capitation pool).
Implementing either risk-adjusted or partial capitation requires good data. When managed care is initially implemented, states can use the diagnostic information included in claims data from fee-for-service Medicaid to assign beneficiaries to rate cells for risk adjustment. As the managed care program matures over time, however, states need more recent data, including diagnostic information for people newly enrolled and for those with new or worsening health conditions. To implement reinsurance or risk corridors, states must have reliable data on expenditures for care from each plan. Encounter data from managed care plans is the obvious source for diagnostic and expenditure information, but states have had difficulty acquiring accurate encounter data from the plans in the early years of managed care, and it has taken time for states to implement full review systems and provide plans with the feedback necessary to improve the accuracy of plan data (Wooldridge and Hoag 1999).
Risk selection will happen, states have limited options for reducing the consequences for plans and beneficiaries, and those efforts require encounter data. This paper shows that Tennessee experienced considerable risk selection among its SSI population. It is fairly certain that other states will also do so unless they do not allow beneficiaries to choose their managed care plan. If states allow beneficiary choice but do nothing to adjust for risk selection in their payments to plans, some plans with adverse selection may eventually close.19 States have a choice of methods for paying plans that reduce both plans' incentive for risk selection and the potential impacts of risk selection on beneficiaries and plans. Because these payment systems require adequate encounter data, states and plans need to invest in their data systems. Creating reliable encounter data systems requires substantial resources, but the benefits may be great, because the data are useful not only for rate setting, but also for many other purposes, including monitoring access and quality of care (Wooldridge and Hoag 1999).
REFERENCES
Enthoven, Alain C. The History and Principles of Managed Competition. Health Affairs, vol. 12, supplement, 1993, pp. 24-48.
Harkey, John B., ed. Tennessee Managed Care. Nashville, TN: Harkey & Associates, Inc., 1998.
Harkey and Associates, Inc. MCO Physician Gatekeeper Programs: An Overview. TennCare News, vol. 1, no. 3, May 1996, pp. 1-3.
Harkey and Associates, Inc. Statistics. Tennessee Managed Care News. September 1995a.
Harkey and Associates, Inc. OmniCare Plans Capital Infusion. Tennessee Managed Care News, vol. 8, no. 3, November 1995b, p. 13.
Hellinger, Fred J. Selection Bias in HMOs and PPOs: A Review of the Evidence. Inquiry, vol. 32, no. 2, summer 1995, pp. 135-142.
Horvath, Jane, and Neva Kaye. Medicaid Managed Care: A Guide for States. Third ed. Portland, MD: National Academy for State Health Policy, 1997.
Kronick, Richard, Tony Dreyfus, Lora Lee, and Zhiyaan Zhou. Diagnostic Risk Adjustment for Medicaid: The Disability Payment System. Health Care Financing Review, vol. 17, no. 3, spring 1996, pp. 7-33. [http://aspe.hhs.gov/daltcp/reports/diarskad.htm]
Kronick, Richard, et al. Making Risk Adjustment Work for Everyone. Inquiry, vol. 32, no. 1, spring 1995, pp. 41-55.
Ku, Leighton, and Sheila Hoag. Medicaid Managed Care and the Marketplace: State Health Reforms in Hawaii, Oklahoma, Rhode Island, and Tennessee. Report submitted to the Health Care Financing Administration. Princeton, NJ: Mathematica Policy Research, Inc., February 11, 1998.
Newhouse, Joseph, et al. Risk Adjustment and Medicare: Taking a Closer Look. Health Affairs, vol. 16, no. 5, September/October 1997, pp. 26-43.
Ormond, Barbara, and Susan Goldenson. The Implementation of Marylands Medicaid Reform Program: HealthChoice. Report submitted to the Health Care Financing Administration. Washington, DC: Urban Institute, forthcoming.
Retchin, Sheldon M. Adverse Selection of Academic Health Centers. Clinical Practice Management, vol. 6, no. 1, January-March 1998, pp. 38-43.
Smith, Gary, and John Ashbaugh. Managed Care for People with Developmental Disabilities: A Guidebook. Alexandria, VA: National Association of State Directors of Developmental Disabilities Services, Inc., 1995.
Tanenbaum, Sandra J., and Robert E. Hurley. Disability and the Managed Care Frenzy: A Cautionary Note. Health Affairs, vol. 14, no. 4, winter 1995, pp. 213-219.
Tennessee Comptroller of the Treasury. Audit Report: OmniCare Health Plan Inc. for the Period January 1 through December 31, 1994. Nashville, TN: Tennessee Comptroller of the Treasury, October 31, 1995.
Tennessee Department of Commerce and Insurance. Examination Report of OmniCare Health Plan, Inc. Memphis, Tennessee as of December 31, 1995. Nashville, TN: Tennessee Department of Commerce and Insurance, December 31, 1995.
U.S. General Accounting Office. Medicaid Managed Care: Serving the Disabled Challenges State Programs. Washington: DC: U.S. Government Printing Office, July 1996.
U.S. House of Representatives, Committee on Ways and Means. Overview of Entitlement Programs (1996 Green Book). Washington, DC: U.S. Government Printing Office, November 4, 1996.
Wooldridge, Judith, and Sheila Hoag. The Perils of Pioneering: Medicaid Managed Care. Princeton, NJ: Mathematica Policy Research, Inc., forthcoming.
Wooldridge, Judith, Leighton Ku, Teresa Coughlin, Lisa Dubay, Marilyn Ellwood, and Shruti Rajan. Implementing State Health Care Reform: What Have We Learned from the First Year? The First Annual Report of the Evaluation of Health Reform in Five States. Report submitted to the Health Care Financing Administration. Princeton, NJ: Mathematica Policy Research, Inc., December 18, 1996.
OTHER REPORTS AVAILABLE
Reports issued under this project include:
-
Ormond, Barbara A., and Susan Goldenson. The Implementation of Marylands Medicaid Reform Program: HealthChoice. Washington, DC: The Urban Institute, January 5, 1999.
-
Ku, Leighton, and Sheila Hoag. Medicaid Managed Care and the Marketplace. Inquiry, vol. 35, fall 1998, pp. 332-345.
-
Ku, Leighton, and Sheila Hoag. Medicaid Managed Care and the Marketplace: State Health Reforms in Hawaii, Oklahoma, Rhode Island, and Tennessee. Washington, DC: The Urban Institute, February 11, 1998.
-
Ku, Leighton, and Susan Wall. The Implementation of Oklahomas Medicaid Reform Program: SoonerCare. Washington, DC: The Urban Institute, October 23, 1997.
-
Ku, Leighton, Judith Wooldridge, Shruti Rajan, Marilyn Ellwood, Lisa Dubay, Terri Coughlin, Sheila Hoag, and Susan Wall. The New Generation of Statewide Medicaid Managed Care Programs: State Health Reform Projects in Hawaii, Oklahoma, Rhode Island and Tennessee. In Remaking Medicaid: Managed Care for the Public Good, edited by Stephen A. Somers and Stephen M. Davidson, Jossey-Bass, Inc.
-
Wooldridge, Judith, Leighton Ku, Terri Coughlin, Lisa Dubay, Marilyn Ellwood, Shruti Rajan, and Sheila Hoag. Reforming State Medicaid Programs: First-Year Implementation Experiences from Three States. Executive Summary. Princeton, NJ: Mathematica Policy Research, Inc., January 1997. (Reproduced in Contemporary Managed Care, edited by Marsha Gold, Health Administration Press, 1998.)
-
Wooldridge, Judith, Leighton Ku, Terri Coughlin, Lisa Dubay, Marilyn Ellwood, Shruti Rajan, and Sheila Hoag. Implementing State Health Care Reform: What Have We Learned from the First Year? The First Annual Report of the Evaluation of Health Reform in Five States. Report submitted to the Health Care Financing Administration. Princeton, NJ: Mathematica Policy Research, Inc. and the Urban Institute, December 18, 1996.
Copies of the reports can be obtained by contacting:
Librarian Mathematica Policy Research, Inc. P.O. Box 2393 Princeton, NJ 08543-2393 (609) 275-2334
NOTES
-
We exclude those "dually eligible" for Medicaid and Medicare because TennCare is not the primary payer for this group and there were few benefits for the plans to manage. This group accounts for approximately 25 percent of the total population of SSI beneficiaries in Tennessee who are blind or disabled.
-
BCBS purchased Total Health Plus in October 1995 and was in the process of combining it with its BlueCare Plan in January 1996.
-
During the first year of TennCare, Access MedPlus also offered benefits for accidental death or disability. However, the state disallowed this supplemental benefit after the first year.
-
As a result of ongoing litigation, many former SSI beneficiaries in Tennessee continue to receive Medicaid and continue to be classified as cash beneficiaries in the TennCare eligibility files.
-
This paper does not assess the actuarial soundness of the rates.
-
Authors' calculations, based on Harkey and Associates (1995), Tennessee Comptroller of the Treasury (1995), and Tennessee Department of Commerce and Insurance (1995).
-
Beginning in 1997, the state required all TennCare plans to be licensed as HMOs, and it required its TennCare HMOs to use primary care gatekeepers.
-
Authors' calculations, based on data provided by the TennCare Bureau (Donna Dickens, Director of Budget and Finance, TennCare Bureau, personal communications, December 6 and 9, 1996). In the beginning of TennCare operations, a second pool compensated MCOs for above-average utilization. The funds from the second pool were combined with the "high-cost pool" (letter from Rusty Siebert, TennCare Bureau Chief, June 28, 1995).
-
This pattern is obscured in the statewide statistics because a greater proportion of AFDC families than SSI beneficiaries live in urban areas.
-
The sample includes both current and former SSI beneficiaries, because TennCare eligibility files do not distinguish between the two (see footnote 4). Based on aggregate SSI enrollment figures, approximately 65 percent of the population for this study was currently in SSI.
-
For example, results from a preliminary analysis using a larger sample of 82,288 SSI beneficiaries enrolled through January 1995 are consistent with the results for the smaller sample presented in this paper.
-
Mean expenditures for those who left TennCare or became dually eligible during our analysis period (and thus were excluded from our sample) are nearly 60 percent higher ($364). This difference is due largely to the high cost of those who died in 1993 and the older age of those who became dually eligible. As noted, to the extent that we could examine the distribution of this group among TennCare plans, it was very similar to the distribution in our analysis sample.
-
These exclusions pertain to the early years of TennCare, 1994 through 1996. All mental health services were included in the TennCare Partners program, which began in July 1996. Home- and community-based waiver services, less than 1 percent of Tennessee's fiscal year 1993 Medicaid budget, were also excluded from TennCare plans' benefits, but we could not identify these in the claims data, so they are included in our risk index.
-
Total Health was purchased by BCBS in October 1995; however, it continued to operate independently through January 1996.
-
Table 3 shows selection results under alternative measures for 1994 only. The results for 1995 and 1996 are very similar.
-
This change did not ensure that the plan would experience an overall improvement in selection, as the group leaving the plan may have had more favorable selection than did those who stayed.
-
We control for regional variation by scaling the mean (1993) expenditure level in each region to be equal to the overall mean, $228. For example, the expenditures of beneficiaries in Memphis were increased by 34.9 percent (228 ÷ 169) to account for the relatively low average expenditures ($169) of beneficiaries in this region.
-
States that require plans to purchase reinsurance in private markets are not at risk.
-
In the short run, these plans may stay in the program by cross-subsidizing from other products. Plan closure also may depend more on whether the basic capitation rates are actuarially sound than on whether there is risk selection, since plans could survive in an environment of "overpayment" even if they have adverse risk selection.
DISABILITY SUPPLEMENT TO HCFA EVALUATION OF MEDICAID MANAGED CARE IN TENNESSEE REPORTS AVAILABLE
Risk Selection Among SSI Enrollees in TennCare
Executive Summary http://aspe.hhs.gov/daltcp/reports/1999/TNRiskes.htm
Full HTML Version http://aspe.hhs.gov/daltcp/reports/1999/TNRisk.htm
Full PDF Version http://aspe.hhs.gov/daltcp/reports/1999/TNRisk.pdf
SSI Enrollees in TennCare: Room for Improvement
Executive Summary
HTML
To obtain a printed copy of this report, send the full report title and your mailing information to:
U.S. Department of Health and Human ServicesOffice of Disability, Aging and Long-Term Care PolicyRoom 424E, H.H. Humphrey Building200 Independence Avenue, S.W.Washington, D.C. 20201FAX: 202-401-7733Email: webmaster.DALTCP@hhs.gov
RETURN TO:
Office of Disability, Aging and Long-Term Care Policy (DALTCP) Home [http://aspe.hhs.gov/_/office_specific/daltcp.cfm]Assistant Secretary for Planning and Evaluation (ASPE) Home [http://aspe.hhs.gov]U.S. Department of Health and Human Services Home [http://www.hhs.gov]