
Vernon L. Greene, Ph.D., Mary E. Lovely, Ph.D., Mark D. Miller, M.S., and Jan I. Ondrich, Ph.D.
Syracuse University
"This report was prepared under grant #87ASPE184A between the U.S. Department of Health and Human Services (HHS), Office of Disability, Aging and Long-Term Care Policy (DALTCP) and Syracuse University. For additional information about this subject, you can visit the DALTCP home page at http://aspe.hhs.gov/_/office_specific/daltcp.cfm or contact the office at HHS/ASPE/DALTCP, Room 424E, H.H. Humphrey Building, 200 Independence Avenue, S.W., Washington, D.C. 20201. The e-mail address is: webmaster.DALTCP@hhs.gov. The Project Officer was Robert Clark.
The opinions and views expressed in this report are those of the authors. They do not necessarily reflect the views of the Department of Health and Human Services, the contractor or any other funding organization.
ACKNOWLEDGEMENTS
We would like to thank the Office of Assistant Secretary for Planning and Evaluation and our project officer, Robert Clark, for patience and support in a project that was technically and logistically demanding far beyond anyone's anticipation.
--- --- --- --- --- --- --- --- --- --- --- ---
Vernon L. Greene, Ph.D., Director, Policy Center on Aging, and Associate Professor of Public Administration, The Maxwell School, Syracuse University, Syracuse, New York.
Mary E. Lovely, Ph.D., Assistant Professor of Economics and Senior Research Associate, Metropolitan Studies Program, The Maxwell School, Syracuse University, Syracuse, New York.
Mark D. Miller, M.S., Senior Programming Consultant, Academic Computing Services, Syracuse University, Syracuse, New York.
Jan I. Ondrich, Ph.D., Associate Professor of Economics, Senior Research Fellow on the Policy Center on Aging, and Senior Research Associate of the Metropolitan Studies Program, The Maxwell School, Syracuse University, Syracuse, New York.
ABSTRACT
There is a rather substantial consensus among policy researchers that community based long-term care services have negligible ability to offset nursing home use, and that programs designed around them for this purpose are unlikely to succeed. In this study we argue that such a conclusion may be premature, and that community services might be made more effective through better management of their mix and allocation. To test this idea, we use data from the National Long-Term Care Channeling Demonstration to estimate a function relating nursing home use to the use of various types of community services. We then use this in forming an objective function for a mathematical optimization which minimizes total population nursing home use as a function of community service use, subject to a total expenditure constraint. We find that marked reductions in nursing home use can be produced without increasing community expenditures, but that the implied service mix and allocation pattern is considerably different from that which was actually observed.
INTRODUCTION
Scope of the Study
This study explores the capability of community long-term care (CLTC) services to reduce nursing home use when services are allocated strategically for this purpose. We accomplish this by first considering an actual CLTC clientele--the persons screened into the National Long-Term Care Channeling Demonstration (NLTCCD). We take note of these persons' existing use of CLTC services and their costs, as well as the nursing home use experience of the population. We then through simulation reallocate the existing budget for these services over the population so that the service packages received by each individual have the property that projected total nursing home use by the population is minimized.
In this way, we begin to answer some key questions regarding CLTC services that have not yet been systematically addressed in the literature. First, by comparing nursing home use under the simulated optimum service allocation with that actually observed, we assess the technical capacity of CLTC services to reduce nursing home use when optimally committed to this goal. Second, by comparing the existing allocation of budget and services in the NLTCCD population with that which minimizes nursing home use, we gain insight into the nature of existing inefficiencies and possible changes in aggregate service mixes and individual use criteria that may be broadly useful in policy analysis and service planning.
Technically, the problem solved here is a large-scale nonlinear programming (NLP) problem. We use a logistic transition-probability model (TPM) to empirically estimate the relationship between use of community services and nursing home use. From these results, we parameterize an objective function for the optimization problem, which we then solve.
The plan of the study is this. We begin by briefly reviewing the relevant literature on community services and nursing home use. We then define a transition probability model for nursing home use and detail the variables in terms of which it is estimated. Next, we define our optimization model, and link it to the TPM. Finally, we describe our sample, present the empirical results from the estimation of the TPM and the consequent NLP solution, and discuss their policy implications.
We should note that we are not concerned here specifically with the effects of the Channeling demonstration. Rather, we are interested in the broader question of the influence of formal CLTC services as such, regardless of their source and method of financing. Thus we treat the additional services provided by the demonstration just as those from any other source, public or private.
We emphasize also that the optimization that we conduct assumes that all existing expenditures in the study sample for community services are under its control, whether services are financed by public or private sources. Implied is a rather authoritarian "social planning" model in which public resources can be reallocated at will, and private resources can in effect be taxed away when they can be more effectively used elsewhere in reducing nursing home use in the community as a whole. We do not endorse this model as desirable or, as a practical matter, feasible. The issue we seek to isolate and address clearly is the theoretical potential of a fixed budget for community services to reduce nursing home use when services are unequivocally committed to this as a goal. Once this baseline potential has been established, it will then be possible to better understand the consequences of the constraints, inefficiencies, and multiple purposes found in the real world. On the other hand, if the potential to reduce nursing home use is found to be negligible even under conditions which theoretically maximize this effect, then this outcome can safely be abandoned as a policy goal.
Previous Studies
There exists a substantial literature concerned generally with modeling nursing home use. Because it has recently been extensively reviewed elsewhere (Garber and MaCurdy, 1989; Greene and Ondrich, 1990; Greene, Lovely, and Ondrich, 1992; Wolinsky et al., 1992) we will not consider it further here. Most studies that explicitly consider the effects of CLTC services on nursing home use have been experimental or quasi-experimental evaluations of demonstrations which have measured the aggregate (average) effect of providing a package of supplemental community services to a treatment group. Because extensive and capable reviews of these demonstration findings have also appeared recently in the literature (Hughes, 1985; Kemper, Applebaum and Harrigan, 1987; Weissert, Cready and Pawelak, 1988), we will not consider them at length here except to note that in the more rigorously conducted studies, save for a demonstration integrated with nursing home admission screening, the demonstration services have not been found to offset sufficient nursing home use to cover their costs of operation. This was the finding also in the NLTCCD (Thornton, Dunstan, and Kemper, 1988).
The demonstration studies, while important, offer little guidance in certain key policy areas--particularly in matters of individual service targeting and allocational efficiency. This is because they consider aggregate, rather than individual level, service effects, and because they do not attempt to disaggregate the effects of the component services in the service "package." With respect to these evaluations, Kane (1988) has pointed out that "If all of these [CLTC] services continue to be bundled together as "alternatives" to nursing homes, we continue to postpone much needed research to look at the effective design and targeting of each kind of community service."
Only two empirical studies, to our knowledge, have appeared which address the issue of efficient or optimal allocation of CLTC services in reducing nursing home use. The most recent of these (Davidson, Moscovice, and McCaffrey, 1989) is not an optimization analysis as such, but an empirical test for a necessary efficiency condition that would hold under some conditions: assuming these conditions, allocations were found to be efficient. An earlier, and notably innovative, study was that by Miller (1987) which undertook a direct optimization of community service assignments in minimizing institutionalization. Each of these studies considers only a single composite "service," however, and so does not operationally address issues of individual service effectiveness or targeting.
THE TRANSITION PROBABILITY MODEL
Estimating Risk
Our analysis estimates individuals' risk for nursing home residence from their observed characteristics. Thus, we turn first to the problem of specifying a discrete-time transition probability model of nursing home use, and estimating it from the NLTCCD data files. A discrete-time transition probability is the likelihood that an individual in a given state of affairs at the beginning of an interval of time will leave that state for some other during that interval. In the case at hand, we refer to: (1) the probability that an individual in the community at the beginning of a month will enter a nursing home during that month; and (2) the probability that an individual in a nursing home will return to the community (which we define as any survival state other than being in a nursing home: adjustment of results for hospital use is explained below). For aggregate analyses, we assume that persons who die or otherwise permanently exit the service system will be quickly replaced by very similar individuals, constrained by the system's capacity. Hence the system case-mix itself is in stationary equilibrium and is not affected by mortality or other permanent ("absorbing") states that may befall individuals within in.
A transition probability function (TPF) is one that expresses the probability of transition for an individual as a function of that individual's characteristics and environment. For our purposes, these are the levels of use of the principal types of community services, as well as a variety of individual and environmental characteristics that previous research has indicated are related to nursing home use.
Unlike ordinary regression models, the unit of analysis for a discrete-time transition probability function is the person-interval (here person-month) rather than the individual person as such (see Allison, 1984, for an introductory treatment). Every person in the NLTCCD sample faced a probability of transition from their then-current state during each of the 12 months of the demonstration for which a continuous nursing home use history for the full sample was recorded. The study sample used here, which will be described in more detail below, consisted of 3,446 individuals, who could in principle have been at risk of transition during 41,352 (3,446 x 12) person-months. Actually, mortality and other attrition reduce the actual risk set to 36,199 person-months. Because we are interested specifically in analyzing the transitions of living individuals into and out of nursing homes, the risks estimated here condition explicitly on survival. Thus we have structured our transition probability analysis so that risk for transition at each month is measured relative to the survivor pool at that point in time (see Ingram and Kleinman, 1989). In light of the finding of Garber and MaCurdy (1989) that factors which predict institutionalization in the NLTCCD population are largely orthogonal to those which predict death, conditioning on survival can be expected to make little difference in any event relative to an unconditional analysis.
The observed outcome variable in estimating a discrete-time transition probability function for leaving a current state is a dummy variable indicating whether a transition from that state has occurred during the period. At every person-month, this variable will be either one or zero; one if a transition has occurred during that month, zero if not. To determine whether a transition has occurred in a given month, a surviving individual's state (nursing home or community) in that month is compared to their state in the previous month. If the state is the same, no transition is taken to have occurred (a plausible assumption in that it seems unlikely that many will have more than one transition in a single month). If the state in the previous month is different, a transition during the current month is assumed to have occurred. Since the NLTCCD public use data do not permit an unequivocal determination of the precise timing of admissions and exits during a month, we assume that an individual who spends any part of a month in a nursing home spends the entire month there, and that transitions occur at the beginning of a month. The NLTCCD data sets contain indicator variables for each of the first 12 months of the project, plus an initial baseline variable that indicates whether or not an individual was initially in a nursing home (a Skilled Nursing or Intermediate Care Facility). These data permit construction of the transition dummy variables in the manner described above.
There are two distinct TPF's involved, one for transitions from community to nursing home (which we call the C N function) and the other for transitions from nursing home to community (the NC function). Note further that each of the 3,446 individuals can in principle contribute to the person-months for both functions, assuming they changed state at least once. Of the 36,199 person-months in the risk set, 2,551 were spent in nursing homes, with 283 transitions to the community, while 33,648 were spent in the community, with 573 transitions to nursing homes.
The two TPF's can be estimated by forming two distinct data sets depending on transition origin state. One consists of person-months during which individuals were in a nursing home, and hence were at risk of transition to the community; the other of person-months during which individuals were in the community and at risk of entering a nursing home. The first is used to estimate the parameters of the NC function, the second to estimate the CN function.
Because the observed outcome is a dichotomous or dummy variable indicating whether a transition did or did not occur in that month, familiar models for dichotomous choice can be used to specify and estimate the transition probability models. As in most previous studies, we have specified the probability models as logistic where
 |
Where Pin(t) and Pic(t) are, respectively, the probability of nursing home admission and exit during month t for individual i. Vectors of logistic regression coefficients for admissions and exits are given by ß and  , respectively, while Zi(t) is a data vector of regressors, including service use, for individual i at time t. Expression (1) defines a pair of binary person-time logistic regression functions which may be estimated by standard maximum likelihood methods (Ingram and Kleinman, 1989). Once the coefficients in the expressions in (1) have been estimated, individual transition probabilities may be estimated by the usual expedient of substituting the observed regressor values for that individual, including service use, into the right-hand side of the equations and obtaining the predicted probabilities.
Given a 2-state system such as ours, the steady-state probability of being found in a nursing home for an individual, conditional on survival, may be expressed in terms of the transition probabilities as follows (Kemeny and Snell, 1960):
 |
Here  i is the probability of individual i being in nursing home care, while the P-terms are the transition probabilities defined in expression (1). Observe that will be high for those who have both high probability of admission and low probability of exit once admitted--that is, those who will tend to be heavy users of nursing home care if they do not die. Alpha may be thought of equivalently as the long-run proportion of time expected to be spent in nursing home residence by individual i, conditional on survival.
The transition probabilities are not here indexed by time (t), as in expression (1), because in order to satisfy the usual Markov assumption of fixed individual probabilities of transition, we assume in the optimization analysis that the transition probabilities remain fixed at their values 6 months into the demonstration. By this time we assume the component of services due to the NLTCCD to have reached normal operating levels but not yet to have been affected by the anticipated end of the demonstration. We also make the usual Markov assumption that transition probabilities at any point in time are independent of the previous transition history (Kemeny and Snell, 1960). This is probably a questionable assumption in the case of nursing home use, but data limitations preclude a time-inhomogeneous specification of the Markov chains.
Variables in the Model
The dependent variables in the analysis (transition indicators for movement into and out of nursing home care) have been described above. Independent variables in the model consist of community services which are central to the analysis here, and a variety of factors which previous research has indicated are significant predictors of nursing home use (Greene, Lovely and Ondrich, 1992).
The service variables consist of measures, in hours per month, of formal community services received by each individual in the sample. We measure four categories of community service: home nursing, home health aide, personal care aide, and housekeeper. These represent the vast majority (over 90 percent) of total in-home services consumed by the sample. Other categories (e.g. physical therapy) were not used with sufficient frequency to permit reliable statistical estimation of their effects.
In the regressions, services are entered interacted with client impairment indicators found to be substantial predictors of differential impact for that service on nursing home risk. Interactions are paired symmetrically with both the presence and absence of the indicated functional impairment. In two cases (the interaction of home health aide services with the absence of severe cognitive impairment and the interaction of personal care aide services with the absence of severe ADL impairment) the interaction terms were small and statistically insignificant, but had the "wrong" sign in at least one of the logits. Because we believe the anomalous signs are due to sampling error, and because such sign inversions would severely hinder convergence in the optimization algorithm, these two coefficients were set to zero in the analysis. Obviously, with multiple services which may themselves be interactive, both among themselves and with other client characteristics, more elaborate specifications are possible and reasonable. But our experience with these was that collinearity problems become so prevalent in the estimations that it seems likely that experimental rather than observational studies will be necessary to pursue these more subtle and complex specifications.
Information on formally supplied services in the NLTCCD dataset is drawn from surveys administered at the sixth month and again at the twelfth month of the demonstration. The survey instrument uses retrospective questioning that required participants to recall the total hours of services, by type, received in the previous week of community residence from all sources. Because of the retrospective nature of the questioning, we assume that the “snapshot” of service hours reported at the time of the six-month survey (rescaled from weeks to months) is representative of the actual hours received in months 1 through 6. Similarly, information reported at the twelve-month survey is imputed to months 7-12. The longitudinal measurement of community service use in the NLTCCD involved a number of complications, our treatment of which is detailed in Appendix A, which also explains the price data used.
The other regressors fall roughly into three categories: (1) personal and demographic characteristics, (2) indicators of health and impairment status, and (3) location and demonstration-specific factors. In our models, these variables are set to their baseline values: only service levels are permitted to vary over time. Hence the perspective taken is one of a prospective or predictive planning model with services presumed to be potentially subject to manipulation during the planning period. While a time-varying regressor approach would be of greater theoretical interest, such a specification would introduce endogeneity and identification problems that could not be resolved with available data.
Personal and demographic characteristics as measured included dummy variables indicating whether the individual was African-American, Hispanic-American, female, a homeowner, or lived alone. Included also are quantitative variables for monthly household income, age (years), and number of surviving children (as a proxy for availability of family support).
Impairment and health-related variables include indicators of whether the individual was severely impaired in ADL, IADL or cognition, or used a wheelchair. Measured as a continuous variable is self-rated health.
Site and demonstration-related variables included the nursing home bed supply in the client site (beds per thousand over age 65), whether the individual was in the demonstration treatment or control group in a "basic" or "financial control" demonstration site [these were the two different intervention modes for the NLTCCD--see Carcagno and Kemper (1988) for details]. In general, "financial control" sites were established in areas with more extensive service systems than "basic" sites, and permitted case managers to authorize purchase of additional services--in contrast to "basic" sites where case managers worked with existing services. The nursing home bed rate, as a proxy for availability, may be expected to influence nursing home use.
Because the non-service regressors serve only as control variables in this study, because many have been considered in other studies using similar methodology (e.g. Branch and Jette, 1982; Weissert and Cready, 1989), and because an extensive treatment of their measurement and the rationale for their inclusion in models predicting nursing home use using the NLTCCD data have been provided elsewhere (Greene and Ondrich, 1990; Garber and MaCurdy, 1989), we will for sake of brevity not repeat these discussions here. Before presenting results of the logit analysis, we outline the optimization problem they will be used to solve.
OPTIMIZING SERVICE ASSIGNMENTS
The optimization problem solved is this: subject to spending no more on community services than was estimated to have been actually spent during the period of the NLTCCD demonstration among the observed population, assign hours of these services to individuals in such a manner that the proportion of total sample exposure expected to be spent in nursing home care is as small as possible. Since this overall proportion is itself a function of the proportion of time that each individual may expect to spend in nursing home care, which in turn is a function of the individual transition probabilities, which are finally themselves in turn a function of community services received and baseline individual characteristics, it follows that the proportion of sample exposure expected to be spent in nursing home residence is itself in part a function of services used by individuals.
The resulting objective function, detailed below, relates the optimization criterion (expected proportion of total exposure time spent in nursing home residence by the sample) to the set of "control variables" whose values (the types and levels of services assigned to each individual) may be set by decision makers, subject to a constraint on total expenditures. This latter is set equal to the estimated actual expenditures for these services within the optimization study sample, since the question of interest is whether this same "budget" could in principle have been used to greater overall effect in reducing nursing home use.
One should bear in mind that nursing home use in the sample is determined not only by admissions to nursing home care, but by exits from it as well. Hence, the optimization assigns services to two distinct groups. The first group consists of frail, elderly persons observed in the community but who are at risk of nursing home entry. The second group consists of people observed during the demonstration to be in nursing homes but who, if appropriate packages of services were available to them, might be able to return to the community. A given individual may be in a different group at different times. In this way, the optimization is designed to minimize nursing home use among the complete eligible population.
Some Characteristics of Optimal Service Assignment
The optimization problem outlined above imposes a structure on the assignment of services that leads to the largest reduction in nursing home use possible, given the amount of resources spent on community-based care. The optimization was conducted separately for each NLTCCD site, so that resources, while they could be reallocated among the individuals at a given geographical site, could not be reallocated between sites. This was to prevent the program from optimizing by "moving" budget resources to sites where community services are relatively cheap and nursing home beds relatively scarce or expensive. For our purposes, we wanted the optimization to be driven principally by the risk-related characteristics of individuals, relative local service prices, and relative service effectiveness in altering risk, rather than by variations across local economics and regulatory environments.
The structure imposed on service assignment by this optimization has a variety of technical characteristics that merit being made making explicit, since they define the conditions for efficiency being sought by the optimization algorithm. We note initially that because the expected nursing home cost per month at each site is taken to be the same for all individuals at that site (it is the site-specific average observed cost), minimizing nursing home use at a site is equivalent to minimizing expected nursing home expenditures. Thus:
-
When service assignment is optimal, the marginal reduction in nursing home use stemming from the last dollar spent on any two services offered to the same person must be equal. This characteristic of optimal assignment can be understood if one considers the cost of providing a given service to a given individual. The cost of providing the incremental hour of service is the hourly price of the service. The value of the reduction in nursing home use stemming from this service provision is the marginal impact on nursing home use of that hour of community service, multiplied by the expected cost of nursing home care (which we estimate as the observed average cost in each site or community). If one divides the value of the nursing home reduction by the price of the service, one obtains a measure of the dollar reduction in nursing home use per dollar of service provided. At the optimum, any two services provided to the same individual must result in the same dollar reduction in nursing home expenditures per dollar of service provided. If the two services did not result in the same cost savings per dollar spent, additional savings could be achieved by providing less of the relatively ineffective service and more of the other service. Therefore, in the optimal service assignment, the marginal value of the nursing home reduction stemming from the last dollar spent on any two services offered to the same person must be equal.
-
When service assignment is optimal, the marginal value of the reduction in nursing home use stemming from the last dollar spent on the same service offered to any two people must be equal. If the two marginal values are not equal, a dollar spent on providing the service to one person has a larger expected value, in terms of reduced nursing home expenditures, than does a dollar spent on providing that service to the other person. In this case, additional savings could be achieved by providing more of the service to the person for whom it has a larger deterrence effect, reducing the level of service provided to the person for whom the effect is relatively weak.
-
The optimal assignment need not result in all or any services being provided to a given client. When services are assigned strategically to reduce nursing home expenditures, resources must be directed toward the clients for whom the greatest reduction in nursing home use is expected as a result of providing those resources. With a limited budget, this targeting of services means that not every client will receive each, or any, community service. Only those clients for whom a service will have a relatively large deterrence effect will receive it.
-
The optimal assignment need not result in provision of all services. The effectiveness of each service in deterring nursing home use varies from service to service, and from individual to individual. The transition probability functions, in that they describe the technology available to reduce nursing home use through community-based services, provide a measure of each service's effectiveness in deterring nursing home use. These measures of effectiveness must then be weighed against the cost of each service, for it may or may not be the case that relatively inexpensive services are effective on a per-dollar basis. Optimizing within a limited budget, only those services that produce the largest reduction per dollar spent will be provided, regardless of their price.
Turning now to our model, consider first the i term in expression (2). As noted, this is the steady-state proportion of time that an individual with the characteristics of individual i would, conditional on survival, be expected to spend in nursing home care. The arithmetic mean of these terms is itself easily shown to be the steady-state proportion of time (total exposure) that the sample can be expected to spend in nursing home residence. It is this measure of total nursing home use that we seek to minimize through controlling the assignment of CLTC services in the sample, subject to the constraint that total expenditures for CLTC services not increase. We may state the problem formally as:
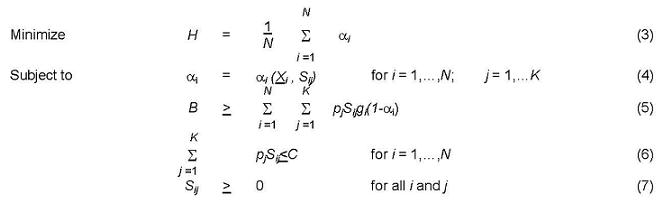 |
where i indexes individuals, and j indexes community service types.
Expression (3) is the objective function to be minimized, giving the steady-state proportion of total exposure the population is expected to spend in nursing home care. Expression (4) simply notes that is a function of a vector of exogenous characteristics (Xi) for the ith individual and her levels (hours per month) of services (Sij) where j indexes the different community service types. These service levels are the model's endogenous or "control" variables, in that they are taken to be under the control of the optimization algorithm.
The budget constraint (5) requires some elaboration. Consider first the left-hand side of the inequality; the bound, B. This bound is defined as
 |
This bound is an estimate of total community service expenditures as actually observed in the study sample. The optimization may not exceed this aggregate expenditure level. In detail, i here again indexes individuals in the sample and j indexes the community service categories, while the superscript o indicates these were the values actually observed at the 6-month survey. The pj terms are the hourly charges (prices) for services. This bound is thus the sum of the price-weighted service quantities (i.e., nominal community service expenditures), weighted by the term gi (1-i). This latter term is a factor that discounts estimated community expenditures by correcting for the probability that the individual was actually in a true community service setting--not in a hospital or nursing home. The term gi is the individual probability of not being in the hospital, conditional on not being in a nursing home. (The manner in which this probability was estimated is described in Appendix B.) The term oi is simply that given by expression (2); that is, it is the steady-state risk for nursing home use for this individual given the services she was actually using at the time of the 6-month survey in the demonstration (Sijo).
Because one minus oi is the (unconditional) probability of being found outside of a nursing home given observed services, it follows by the joint probability law that the probability of being neither in a nursing home nor a hospital (and thus actually presumed to be using community program resources) is given by gi (1-oi). Observe that if this discount factor were not applied in expression (5), the implied budget bound would be that for the case in which all individuals spent the entire budget period using community resources. Because of hospital and nursing home use, however, estimated actual expenditures are less, as reflected in the discounting.
From a prospective standpoint, the undiscounted total expenditure bound may be thought of as what a program "offers" or "promises," while the discounted total is what it actually expects to spend, and hence determines its effective budget. An analogy might be the practice of commercial airlines, which promise more capacity than they actually have, counting on a certain proportion of passengers not to actually claim a seat.
The right-hand side of expression (5) has the same form and meaning, except that now community services (and the subsequent proportion of time spent in a nursing home) are taken to be endogenous (subject to the control of the optimization program), rather than to have the values observed in the survey. The quantity gi is taken to be exogenous (fixed); that is, we assume that hospital use is not affected by community service reallocation. This assumption is more realistic with respect to the pre-DRG era (1984) when the survey was conducted that it would be today.
The next constraint in the minimization problem, equation (6), restricts total community-based service expenditures for any given sample member in a month to be less than or equal to the average cost of nursing home care in their area for the same period (C). This bound is imposed partly for technical reasons--it greatly assists convergence in what is computationally a very complex NLP problem. But it is also substantively reasonable in that while the objective of the analysis is minimizing nursing home use (or, equivalently, expenditures), it would seem inappropriate in a budget-constrained context to spend more in the community than it would cost to maintain the client in a nursing home. As a practical matter, this constraint was not active in the final solutions anyway. The final constraint simply restricts the program to assign only non-negative values of community services to clients.
DATA AND EMPIRICAL FINDINGS
The Data Set
Data for the analysis are from the public use data files for the NLTCCD. The overall NLTCCD study sample was a targeted group from 10 sites representing considerable geographic and socioeconomic diversity (the sites being Baltimore; Houston; Cleveland; Miami; Philadelphia; an eight county region in Eastern Kentucky; a two county region in southern Maine; Middlesex County, New Jersey; Rensselaer County, New York; and Greater Lynn, Massachusetts). The NLTCCD enrolled persons who were relatively old and frail. Persons who applied for its programs were screened to be of age 65 or older, substantially impaired in functional capacity and to have some degree of unmet need in important functional areas. Those enrolled while in nursing home care were further required to be deemed a good prospect for discharge within 90 days. Details of eligibility criteria, and a comparison of sample characteristics with those from a simulated national probability sample, can be found in Applebaum (1988). Because the observed sample is self-selected by application to the NLTCCD, as well as screened on the targeting criteria, the reference population for the data analysis to follow should be confined to the universe of eligible persons who would apply and qualify for such programs. Insofar as factors that influence the likelihood of application are correlated with factors unmeasured in our statistical models, inferences to the otherwise eligible population which did not apply will to an unknown extent be subject to sample selection bias.
The data sets contain a 12-month nursing home use history for 4,593 individuals (see Wooldridge and Schore, 1986, for a complete description of this data, which is a subsample of the 6,326 individuals for whom survey data were obtained). From this group we eliminated all individuals for whom there was missing data for any variable in our models, or who did not survive long enough after baseline to contribute at least one person-month of nursing home use history, which reduced the effective sample size to 3,446. The descriptive statistics for this subgroup (see Table 1) are virtually identical to those for the full NLTCCD data set (Wooldridge and Schore, 1986; Applebaum, 1988), suggesting that the subsample is accurately representative of the entire study sample. This subsample was used to statistically estimate the transition logits. For the optimization analysis, the analysis sample was reduced further to 2,406 individuals because of missing data on variables used in the tobit models in estimating the proportion of time in the community not spent in hospital. Again, descriptive statistics for this subsample differ very little from those for the full sample, indicating that the subsample remains representative.
Statistical Results
Results from the maximum likelihood estimation of the logistic TPFs defined in expression (1) are given in Table 2. Coefficients measure the change in log-odds of transition per unit change in the independent variable. While both functions are significant below p=.0001 on a chi-square test of fit relative to a null model, our results are similar to those of other investigators in showing limited success in predicting nursing home use. With cutoffs set at the observed transition prevalence rate, sensitivity and specificity for the CN TPF are 57% and 76% respectively, while the same quantities for NC TPF are 63% and 62%. Areas under the ROC curves are .67 and .68 respectively.
In considering the control variables (the interaction terms involving the service levels), one observes first that the coefficients for the service levels themselves are of the expected sign (negative for the CN function, positive for NC), indicating that community services indeed reduce risk of admission to nursing homes and facilitate exit once admitted, thus reducing use overall. Observe that in both T`PFs, the coefficients for nursing care are considerably larger than that for the other services, indicating a much greater direct effect on nursing home use per hour of service than is the case for the other services.
Considering first the CN function, the impact of nursing hours on risk for those requiring wheelchairs (a proxy for major health impairment) is strong and statistically significant, but weaker and insignificant for others. Home health aide services are seen to significantly enhance chances of remaining in the community for those cognitively impaired, while personal care aide services significantly enhance prospects for those more severely impaired in ADL functioning. Housekeeping services were particularly effective for those impaired in IADL, as would be expected.
Turning now to the NC function, available nursing services are a strong and significant predictor of return to the community for those not in wheelchairs (bearing in mind that the nursing home sample was selected to be good prospects for discharge within 90 days), but less so for others. Personal care services significantly increase discharge prospects for those more impaired in ADL, home health aide services for those more impaired in cognition and housekeeping for those severely impaired in IADL.
As we noted previously, the effects of the exogenous covariates on nursing home use have been considered extensively elsewhere (Garber and MaCurdy, 1989; Greene and Ondrich, 1990). For sake of space, they will not be considered at length here. Suffice it to say that for those in the community, African-Americans, Hispanic-Americans, homeowners, those with greater income and with more children are at significantly lower risk of nursing home admission. Conversely, being older, living alone, being more impaired in ADL, IADL or cognition, or being in an area with a larger nursing home bed supply, all increase risk of admission.
For those in a nursing home, prospects of return to the community are significantly enhanced by homeownership, being in the Channeling demonstration treatment group at a financial control site, and reporting better health. Prospects are reduced by having lived alone at time of admission and -being more impaired in IADL functioning or cognition.
Optimization Results
Expected long-run nursing home use in the study sample fell dramatically under optimum service distribution as compared to the distribution actually observed (Table 3). The proportion of total person-months expected to be spent in nursing home care fell from nearly 12 percent to just over 3 percent, a 75 percent reduction. This is equivalent to a reduction in expected nursing home use by the 3,446 individuals in the full study sample on an annual basis from 4,383 person-days to 1,282 person-days. Bear in mind that this reduction was achieved without increasing total expenditures, indicating that the observed service distribution was extremely inefficient from the standpoint of mitigating nursing home use. It indicates also that, optimally used to this end, community services can in principle have a very much more substantial impact on nursing home use.
As seen also in Table 3, the aggregate service distributions changed substantially under optimum assignment. Hours per month of nursing services increased from the observed 0.77 to 1.24 at optimum, a 61 percent increase, while the incidence of nursing services (the percent receiving at least some service) remained virtually unchanged (14 and 15 percent respectively). Thus the optimization increases the intensity of nursing service use relative to the use actually observed in the sample, but not its incidence.
Changes for lower level services are more dramatic. Home health aide hours fell from an observed average of 5.26 hours per month to 1.2 hours, and service incidence fell from 7 percent to 2. Personal care aide services, which was by far the dominant service in terms of volume in observed use, was eliminated alto ether under the optimization. Conversely, use of housekeeping services was dramatically increased by the optimization, from a mean of 5.9 hours per month to a mean of 47 hours at optimum. The shift in overall service use by the sample is shown in Table 4.
The detailed basis for reallocation of services to individuals by the optimization algorithm is a complex reflection of individual client and service characteristics involved in the objective function. But the dominating factors driving the aggregate results just considered are clearly the services effectiveness (indicated by the magnitude of their TPM coefficients) and their prices (because of the budget constraint). Other things equal, the optimization favors services whose effect is large relative to their cost. That is, it favors services with a high "bang for the buck." An inspection of the coefficients in Table 2 and the costs reported in Appendix A makes it clear that nursing and housekeeping indeed have high impact coefficients relative to their unit cost when compared to home health and personal care aide services.
These aggregate changes, of course, merely summarize the underlying changes that are occurring as services are reallocated across individuals by the optimization. Shifts in nursing hours for individuals ranged from a reduction in services of 98 hours per month at one extreme to an increase of 32 hours per month at the other. Overall, 14 percent (331 of 2,406) of the sample were allocated increased nursing services by the optimization, 12 percent saw reductions in their nursing services, while 74 percent saw their service levels unchanged--these last being nearly all individuals using no nursing services to begin with.
As would be expected given the data in Table 3, the trend for change in home health aide services is negative, the average reduction being 4.1 hours per week. The extremes ranged from a reduction of 722 hours per month (a case of round-the-clock service being reduced to zero) to an increase of 144 hours per month. Personal care aide services, as noted, were eliminated for everyone by the optimization, with their costs being used for other services.
Housekeeping services saw an increase of 41 hours on average, the extremes ranging from a decrease of 370 hours per month to an increase of 187 hours per month. Since these figures seem unreasonably large for housekeeping activities as such, it is clear that other services are being provided under this rubric as well.
Of most general interest is the question of the basis for the resource reallocations generated by the optimization. That is, who is getting more resources (hence reducing their expected nursing home use) at optimum and who is getting less? To descriptively summarize an answer to this question, the difference between the expected nursing home use for each individual [the coefficient given in expression (2)] at its observed value and at optimum was computed. Those getting more services, other things equal, will show a reduction in this risk, while those whose services were reduced will show an increase in risk. The average change in was -0.086, reflecting the strong tendency toward reduction in risk under optimum conditions. Overall, 78 percent of the sample (1,887 of 2,406) were put at reduced risk through the optimization, while 13 percent (305) were actually put at increased risk. These latter are individuals who were among those consuming resources that the optimization determined could be better used elsewhere. About 9 percent of the sample saw their risk unaffected by the optimization.
As a summary analysis of characteristics associated with change in risk under optimization, results of a linear regression of the change in risk () on a variety of individual characteristics are given in Table 5. Change is coded so that a positive coefficient indicates that predicted risk increases (indicating a decrease in effective community services) for individuals with the characteristic indicated. (While significance levels are reported, the simulated data are not a sample, and results should be considered descriptive only.)
Referring to the regressions, immediately noteworthy is the fact that the optimization has moved resources away from African- and Hispanic-Americans, leaving them, on average, at considerably higher risk. This reflects the fact that many in these groups were at much lower initial risk (see Table 2), making them relatively unproductive targets for additional resources, and indeed often presenting the opportunity to transfer resources from them to others where risk levels are higher and are more responsive at the margin to additional resources.
There was no significant difference by gender--on average men and women were treated similarly by the optimization. Older persons on average saw their risks decline, but homeowners saw theirs increase very substantially as their relatively low prior risk made them relatively unattractive as a target for resources.
Note that the optimization shifts considerable additional resources to persons with the classic risk factors for nursing home use--those living alone, those severely impaired in ADL, IADL, or cognition, and those with fewer children or lower income. Those in better health and (unexpectedly) those in wheelchairs saw their services decline somewhat.
Discussion
The principal implications of our findings are that community based services can, in theory, have a very substantial impact on aggregate nursing home use when committed solely to this purpose and that existing systems of allocation are technically very inefficient in this, regard. On the one hand this is neither surprising nor necessarily undesirable: most use of community based services reflects individual and family resources and preferences, and arise from decisions that do not have reducing global nursing home use as a purpose in any event. Even in cases where services are managed, case managers have neither necessary information, or necessarily the incentives, to pursue such a goal--even when it is the avowed program purpose. However, our findings indicate that if we want to develop systems of community service management and financing that do more explicitly focus on overall reducing nursing home use, then the theoretical potential to do so is there.
The optimization produced substantial shifts in the aggregate pattern of service use by type. It uses considerably more home nursing services than was actually observed in use, indicating that medically more intensive long-term care services are being underutilized, perhaps in part because their clearly observable higher unit cost outweighs their less readily observable higher unit impact relative to other services. The optimization also shifted much more resources to the opposite end of the care intensity spectrum (housekeeping), while pulling resources out of the middle of the spectrum (home health aide and personal care services). We find the very dramatic shifts here to be prima facie rather implausible, and we believe that what is very likely going on is that these service categories overlapped considerably in their actual measurement as derived from client perceptions (see Appendix A).
Of greater interest is the pattern of changes in service allocations to individuals. The strong shift of resources away from minority elders, for example, make clear that a single-minded focus on reducing aggregate nursing home use may have redistributional consequences that reinforce existing social inequities: an outcome undesirable on other grounds.
On the other hand, it is clear that the optimization makes more explicit than previous studies the advantages to be gained by allocating resources on the basis of classic need-related factors (impairment and less supportive social and economic circumstances). Adhering rigorously to such targeting criteria is a potential source of substantial efficiency gains in using community services to restrain nursing home use.
Finally, we would point out that the work reported here has important weaknesses and imitations that should not be underestimated. This is particularly the case in longitudinal measurement of service use levels, and in several necessary but simplistic assumptions made in the formal models. Our detailed findings should be the impetus for further research and methodological refinement, not the basis for confident conclusions. But we hope that the advances given here in the formal framing of the issues, the methodological approaches to them, and the strong general indication of the presence of important unrealized efficiencies in community care in mitigating risk for nursing home use, will facilitate further constructive work in the area.
| TABLE 1: Baseline Descriptive Statistics for Analysis Sample (n=3,446) |
||
|---|---|---|
| Mean | Standard Deviation | |
| Income (monthly) | 520 | 331 |
| Financial Control Site | 0.527 | 0.499 |
| Married | 0.313 | 0.464 |
| Physical Visits | 1.788 | 2.521 |
| Live Alone | 0.381 | 0.486 |
| Smoker | 0.128 | 0.334 |
| Self-Rated Health | 3.294 | 0.829 |
| IV Tubes | 0.008 | 0.088 |
| Catheter | 0.085 | 0.279 |
| Hispanic | 0.047 | 0.212 |
| Black | 0.219 | 0.413 |
| Age | 79.677 | 8.670 |
| Gender (1=male) | 0.265 | 0.442 |
| Homeowner | 0.426 | 0.494 |
| Rural | 0.157 | 0.364 |
| Education | 8.183 | 4.036 |
| Treatment Group | 0.603 | 0.489 |
| TABLE 2: Maximum Likelihood Estimates of Transition Logits | ||
|---|---|---|
C N NCoefficient |
NC Coefficient |
|
| Constant | -5.853*** | -1.190 |
| Nursing x Wheelchair | -0.306* | 0.283 |
| Nursing x No Wheelchair | -0.091 | 0.320* |
| Home Health x Cognitive Impairment | -0.028** | 0.083*** |
| Personal Care x ADL | -0.007** | 0.013*** |
| Housekeeper x IADL | -0.033* | 0.125*** |
| Housekeeper x No IADL | -0.021 | 0.044 |
| African-American | -0.709*** | -0.201 |
| Hispanic-American | -0.838*** | 0.528 |
| Gender (1=female) | -0.082 | -0.037 |
| Age (years) | 0.009* | -0.012 |
| Homeowner | -0.316*** | 0.310** |
| Lives Alone | 0.462*** | -0.370*** |
| ADL (1=very or extremely severe) | 0.537*** | -0.146 |
| IADL (1=very or extremely severe) | 0.501*** | -0.862*** |
| Self-Rated Health | 0.001 | 0.185** |
| Wheelchair Use | 0.036 | 0.225 |
| Cognitive Impairment (1=severe or worse) | 0.575*** | -0.357** |
| Bed Supply | 0.013*** | -0.001 |
| Monthly Income | -0.351** | 0.233 |
| Number of Surviving Children | -0.061*** | 0.027 |
| Treatment Group/Basic Site | -0.086 | 0.152 |
| Treatment Group/Financial Control Site | -0.025 | 0.427*** |
| * p < 0.1 ** p < 0.05 *** p < 0.005 |
||
| TABLE 3: Distributions of Nursing Home Risk and Hours per Month of Services under Observed and Optimum Service Allocations | ||||||||||
|---|---|---|---|---|---|---|---|---|---|---|
| Nursing Home Risk () |
Nursing Hours | Home Health Hours | Personal Care Hours | Housekeeping Hours | ||||||
| Observed | Optimum | Observed | Optimum | Observed | Optimum | Observed | Optimum | Observed | Optimum | |
| Mean | 0.117 | 0.031 | 0.77 | 1.24 | 5.26 | 1.20 | 30.25 | 0.00 | 5.90 | 47.06 |
| Percent Receiving Service | 0.15 | 0.14 | 7 | 2 | 49 | 0 | 22 | 71 | ||
| Percentiles | ||||||||||
| Minimum | 0.000 | 0.004 | 0.00 | 0.00 | 0.00 | 0.00 | 0.00 | 100.00 | 0.00 | 0.00 |
| 1 | 0.004 | 0.010 | 0.00 | 0.00 | 0.00 | 0.00 | 0.00 | 0.00 | 0.00 | 0.00 |
| 5 | 0.013 | 0.012 | 0.00 | 0.00 | 0.00 | 0.00 | 0.00 | 0.00 | 0.00 | 0.00 |
| 10 | 0.019 | 0.013 | 0.00 | 0.00 | 0.00 | 0.00 | 0.00 | 0.00 | 0.00 | 0.00 |
| 25 | 0.038 | 0.021 | 0.00 | 0.00 | 0.00 | 0.00 | 0.00 | 0.00 | 0.00 | 0.00 |
| 50 | 0.084 | 0.027 | 0.00 | 0.00 | 0.00 | 0.00 | 8.69 | 0.00 | 0.00 | 49.19 |
| 75 | 0.153 | 0.036 | 0.00 | 0.00 | 0.00 | 0.00 | 38.7 | 0.00 | 0.00 | 77.53 |
| 90 | 0.274 | 0.056 | 2.15 | 4.86 | 0.00 | 0.00 | 86.00 | 0.00 | 17.22 | 99.46 |
| 95 | 0.353 | 0.065 | 4.30 | 10.03 | 25.80 | 0.00 | 129.00 | 0.00 | 34.40 | 113.09 |
| 99 | 0.542 | 0.114 | 12.90 | 17.48 | 109.65 | 63.46 | 275.20 | 0.00 | 86.00 | 135.11 |
| Maximum | 0.796 | 0.141 | 60.2 | 31.49 | 722.40 | 144.12 | 825.60 | 0.00 | 369.80 | 159.32 |
| TABLE 4: Monthly Hours of Services under Observed and Optimal Assignment | |||||
|---|---|---|---|---|---|
| Nurse | Home Health Aide |
Personal Care Aide |
Housekeeper | All Services | |
| Observed | 1,836 | 12,655 | 72,795 | 14,186 | 101,472 |
| Optimal | 2,898 | 2,817 | 0 | 113,245 | 118,960 |
| TABLE 5: Linear Regression of Changes in Risk on Selected Individual Characteristics | |
|---|---|
| Independent Variables | Coefficient |
| Intercept | 0.038* |
| African-American | 0.036** |
| Hispanic-American | 0.097** |
| Gender | 0.000 |
| Age | -0.002** |
| Homeowner | 0.047** |
| Lives Alone | -0.054** |
| IADL | -0.097** |
| ADL | -0.047** |
| Self-Rated Health | 0.019** |
| Cognitive Impairment | -0.086** |
| Wheelchair Use | -0.019** |
| Number of Surviving Children | 0.006** |
| Monthly Income | 0.056** |
| Adjusted R2 = 0.62** * p < 0.05 ** p < 0.0001 |
|
APPENDIX A. SERVICE AND COST MEASUREMENT
Although we have data at monthly intervals for nursing home transitions, data for community services in the NLTCCD were collected only at 6 month intervals (the survey points). For individuals in the community, we assume that the services they were found to be receiving at the 6 month survey are representative of those received in months 1-6 while those they reported receiving at the 12 month survey are imputed to months 7-12. Service variations within these intervals are thus not captured.
Individuals in a nursing home at a point in time are, of course, not actually consuming community services at that time. What is at issue in predicting their transition is what services are available to them in the community at that time. We do not have direct measures of such "potential" services. For individuals who exited a nursing home during the study period, we take the services they were found to be receiving at the next survey point after exit to be representative of what was available to them during the preceding period of institutionalization. A better measure would have been services received at the time of exit, but again we face the problem that services were measured only at regular 6 month intervals. On average, we are measuring services for these individuals about 2.5 months after discharge, and so are probably tending to underestimate services provided at time of discharge. On the other hand, insofar as discharge planning reflects not just services at point of discharge, but also a longer run consideration of service availability, our delayed data are capturing valid information. At a minimum, these data are a reasonable proxy measure.
For individuals in the sample who began the study period in a nursing home and did not exit alive, we have of course no data on community service use during the study period (these are about 25 percent of those initially in a nursing home--some 2 percent of the sample overall). For these persons, their baseline report of service use at the time of most recent admission was used as a proxy for services available. Individuals who had been in a nursing home more than two months at baseline and for whom recall error was likely to be excessive, were excluded.
Categorization of services used by provider type was done as follows. Respondents were asked to describe the services actually received on a given provider visit. Using uniform definitions developed from an extensive analysis of service definitions from a variety of official sources (Corson et al., 1986, App. B), researchers from Mathematica Policy Research (the principal contractor for the NLTCCD evaluation) coded each encounter as involving services from nursing, therapy, home health aide, personal care aide and housekeeper services. In effect, the NLTCCD evaluation identified each encounter and type of service provider by the highest level of service rendered in that encounter. Thus, if a function identified as "nursing" occurred during an encounter, the caregiver is taken to be a nurse and the length of the encounter (service hours) is attributed to "nursing hours." It should be noted that this does not assure that lower level services did not take up some portion of the encounter, and hence it seems likely that the measurement scheme will tend to overstate the intensity of higher level services being provided. Thus, a one hour nursing encounter might in principle consist of 30 minutes of attention to matters requiring professional nursing skills and 30 minutes of more routine matters that might have been within the skill range of a home health aide. The data do not permit us to distinguish these cases. Also, we cannot distinguish cases where an insufficiently credentialed provider may have performed higher level functions. While these measures are only proxies for the underlying structural service variables, they are the best longitudinal service use data currently available that are linked to a detailed nursing home use history.
For cost data, site-specific average costs experienced by the 20 percent subsample for whom provider record extracts were obtained were used to estimate the community service and nursing home prices facing individuals at that site (see Carcagno and Brown, 1986). The hourly cost of home nursing over the ten sites varied from $29 to $72 with a mean of $48. Home health aide hourly costs ranged from $7 to $33, with a mean of $16. Costs for personal care ranged from $4.50 to $11.50 per hour, with a mean of $7.20, and costs for housekeeper services ranged from $4.70 to $10 per hour, with a mean of $6.60. Bear in mind that sites varied widely in geographical region and degree of urbanization, with some being principally rural.
APPENDIX B. ADJUSTING FOR HOSPITAL USE
To adjust expected community long term care costs for hospital use, the expected proportion of time outside of a nursing home that an individual can be expected to spend in a hospital, equivalent to the probability of being in hospital conditional on not being in a nursing home, was estimated. Because most observed values for days spent in hospital over the 12-month study period are zeros, a tobit model was used to obtain predicted values. Only survivors over the entire 12 months with a complete nursing home indicator time series were used in the estimation because the level of hospital use by those near death so skewed the distribution that the tobit estimation was unacceptably unstable.
For each of the individuals that remained, two variables were created, total community (i.e., non-nursing home) days and total community days spent in the hospital. To estimate total community days, we multiplied 30.4 times the number of months in which the individual spent no time in a nursing home. To determine total community days spent in the hospital we counted the number of hospital days in months in which the individual spent no time in a nursing home. Observations were dropped if (1) total community days was missing; (2) total community days spent in the hospital was missing; or (3) total community days did not exceed total community days spent in the hospital (indicating a coding error).
For the 2,654 observations that remained, the ratio of total community days spent in a hospital to total community days was formed. Using the tobit procedure available in SAS, the ratio was regressed on: a constant term, the treatment group binary, age, marital status, a binary variable for living alone, informal care hours, number of visits to a physician over the previous two months, self-perceived health, indicators for nursing home application and being on a nursing home waiting list, life satisfaction, cognitive and functional impairment indicators, an unmet needs indicator, and nine of the ten site indicators. A predicted value for the ratio was calculated for each of the 3,446 individuals in the main data set using the coefficients from this regression. The maximum value of the predicted ratio (proportion of community time spent in hospital) was 0.18, the minimum value was zero, and the mean value was 0.02. Hence the estimated, probability of being in the community (and not in hospital) conditional on not being in nursing home care was on average .98, ranging from .82 to 1.0. Call this probability g. Then by the joint probability law, the probability of a surviving individual being outside a nursing home but also not in the hospital is given by g  (1-). It is this latter term which is used to weight community care costs in expressions (5) and (8) in the text for the empirical simulations.
REFERENCES
Allison, P. Event History Analysis: Regression for Longitudinal Even Data. Sage Publications, Beverly Hills, (1984).
Applebaum, R.A. “Recruitment and Characteristics of Channeling Clients.” Health Services Research, 23(1988):51-66.
Branch, L.G., and Jette, A.M. “A Prospective Study of Long-Term Care Institutionalization among the Aged.” American Journal of Public Health 72, no. 12 (December 1982):1373-79.
Carcagno, G. and Kemper, P. “An Overview of the Channeling Demonstration and Its Evaluation,” Health Services Research, 23(1988):1-22.
Corson, W., Granneman, T., Holden, N. and Thornton, C. Channeling Effects On Formal Community-Based Services and Housing. Mathematica Policy Research, Inc., Princeton, NJ, (1986). [http://aspe.hhs.gov/daltcp/reports/1986/commtyes.htm]
Davidson, G., Moscovice, I. and McCaffrey, D. “Allocative Efficiency of Case Managers for the Elderly,” Health Services Research 24, no. 4 (1989):539-554.
Garber, A.M. and MaCurdy, T. “Predicting Nursing Home Utilization Among the High Risk Elderly,” National Bureau of Economic Research Working Paper Number 2843, Cambridge, MA, (1989).
Greene, V., Lovely, M. and Ondrich, J. “Do Community-Based Long-Term Care Services Reduce Nursing Home Use? A Transition Probability Analysis.” Occasional Paper No. 134, Metropolitan Studies Program, Syracuse University, (1990a).
Greene, V., Lovely, M. and Ondrich, J. “The Cost-Effectiveness of Community Services In a Frail Elderly Population.” All-University Gerontology Center, Public Policy Series, Syracuse University (1990b).
Greene, V. and Ondrich, J. “Risk Factors for Nursing Home Admissions and Exits in the National Long-Term Care Channeling Demonstration: A Discrete-time Hazard Function Approach.” The Journals of Gerontology: Social Services, forthcoming, (1990).
Greene, V., Lovely, M., Miller, M. and Ondrich, J. Reducing Nursing Home Use Through Community Based Long-Term Care: An Optimization Analysis. All-University Gerontology Center, Public Policy Series, Syracuse University, (1989).
Hughes, S. “Apples and Oranges? A Review of Community-Based Long-Term Care.” Health Services Research, 20(1985):461-487.
Ingram, D. and Kleinman, J. “Empirical Comparisons of Proportional Hazards and Logistic Regression Methods.” Statistics In Medicine, 8(1989):525-538.
Kane, R.A. “The Noblest Experiment of Them All: Learning From the National Channeling Evaluation.” Health Services Research, 23(1988):189-198.
Kemeny, J. and Snell, J. Finite Markov Chains, D. Van Nostrand, Princeton, NJ, (1960).
Kemper, P., Applebaum, R.A. and Harrigan, M. “Community Care Demonstrations: What Have We Learned?” Health Care Financing Review, 8(1987):87-100.
Manheim, L.M. and Hughes, S.L. “Use of Nursing Homes by a High-Risk Long-Term Care Population.” Health Services Research, 21(1986):161-176.
Miller, L. Optimum Service Allocation in a Community-Based Long-Term Care Program. MSSP Evaluation, University of California, Berkeley, (1987).
Thornton, C., Dunstan, S.M. and Kemper, P. “The Effect of Channeling on Health and Long-Term Care Costs.” Health Services Research, 23(1988):129-142.
Weissert, W. and Cready, C.M. “Toward of Model for Improved Targeting of Aged at Risk of Institutionalization.” Health Services Research, 24(1989):483-508.
Weissert, W., Cready, C.M. and Pawelak, J. “The Past and Future of Home- and Community-Based Long-Term Care.” The Milbank Quarterly, 66(1988):309-388.
Wolinsky, F.D., Callahan, C.M., Fitgerald, J.F., and Johnson, R.J. “The Risk of Nursing Home Placement and Subsequent Death Among Older Adults.” The Journal of Gerontology: Social Science, 47:4 (1992), S173-182.
Wooldridge, J. and Schore, J. Evaluation of the National Long-Term Care Demonstration: Channeling Effects on Hospital, Nursing Home, and Other Medical Services, Mathematica Policy Research, Inc., Princeton, NJ, (1986). [http://aspe.hhs.gov/daltcp/reports/1986/hospites.htm]