
September 2020
Printer Friendly Version in PDF Format (58 PDF pages)
ABSTRACT
Per Section 223(d)(7)(A) of the Protecting Access to Medicare Act (PAMA) of 2014 (Public Law 113-93), the HHS Secretary must submit to Congress an annual report on the use of funds provided under all demonstration programs conducted under this subsection, not later than one year after the date on which the first state is selected for a demonstration program under this subsection, and annually thereafter. Each report shall include assessments of: (1) access to community-based mental health services; (2) the quality and scope of services provided by Certified Community Behavioral Health Clinics (CCBHCs); and (3) the impact of the demonstration programs on the federal and state costs of a full range of mental health services.
This 2019 report informs the third annual report to Congress and details how states have been reporting and utilizing the required quality measures for quality improvement. This report also assesses the costs to CCBHCs for providing the required services, and compares the demonstration payment rates to actual costs.
Subsequent annual reports to Congress on this demonstration will include more details, benefitting from data pending on quality measures and cost reports now being collected by CCBHCs and by demonstration states as required. In addition, claims analyses will be conducted to answer the questions about the demonstration posed by Congress.
This report was prepared under contract #HHSP233201600017I between HHS's ASPE/BHDAP and Mathematica Policy Research to conduct the national evaluation of the demonstration. For additional information about this subject, you can visit the BHDAP home page at https://aspe.hhs.gov/bhdap or contact the ASPE Project Officer, Judith Dey, at HHS/ASPE/BHDAP, Room 424E, H.H. Humphrey Building, 200 Independence Avenue, S.W., Washington, D.C. 20201. Her e-mail address is: Judith.Dey@hhs.gov.
DISCLAIMER: The opinions and views expressed in this report are those of the authors. They do not reflect the views of the Department of Health and Human Services, the contractor or any other funding organization. This report was completed and submitted on October 21, 2019.
TABLE OF CONTENTS
I. BACKGROUND
A. Description of the Certified Community Behavioral Health Clinic Demonstration
B. Goals of the National Evaluation
A. Interviews with State Officials
B. CCBHC Progress Reports
C. Site Visits
D. State Reports of PPS Rates
E. CCBHC DY1 Cost Reports
III. CERTIFIED COMMUNITY BEHAVIORAL HEALTH CLINIC PAYMENT RATES AND COSTS OF CARE
A. How did States Establish the CCBHC Rates? What were the DY1 Rates?
B. To What Extent did CCBHCs Succeed in Collecting and Reporting Information Requested in the Cost Reporting Templates?
C. What were the Total Costs and Main Cost Components in CCBHCs on a Per Visit-Day or Per Visit-Month Basis?
D. How did Visit-Day and Visit-Month Rates Compare with Actual Visit-Day and Visit-Month Costs Incurred during DY1?
E. Did States Change DY2 Rates based on the Experience of DY1?
IV. REPORTING OF QUALITY MEASURES
A. To What Extend do States and CCBHCs Expect to Succeed in Collecting and Reporting Data on the Quality Measures According to the Prescribed Specifications?
B. How have CCBHCs and States used Performance on the Quality Measures to Improve the Care They Provide?
C. What Measures and Thresholds did States use to Trigger QBPs in DY1?
APPENDICES
- APPENDIX A: PPS-2 Population-Specific DY1 Rates and Blended Rates across Clinics
- APPENDIX B: Outlier Payments in PPS-2 States
- APPENDIX C: Distribution of Labor Costs
LIST OF FIGURES
- FIGURE ES.1: DY1 Rates as Percent Above or Below DY1 Costs Per Visit-Day or Per Visit-Month for Clinics by State
- FIGURE III.1: DY1 Visit-Day Rates for PPS-1 Clinics by State
- FIGURE III.2: DY1 Average Blended Visit-Month Rates for PPS-2 Clinics by State
- FIGURE III.3: DY1 Daily Per-Visit Costs for PPS-1 Clinics by State
- FIGURE III.4: DY1 Blended Cost Per Visit-Month for PPS-2 Clinics by State
- FIGURE III.5: Major Cost Components Across All Clinics in DY1
- FIGURE III.6: Proportion of Clinic Costs Allocated to Direct Labor in DY1 by State
- FIGURE III.7: Proportion of Labor Costs by Staff Category Across All Clinics
- FIGURE III.8: DY1 Rate Paid as Share of Cost Per Visit-Day or Per Visit-Month for Clinics by State
- FIGURE C.1: Proportion of Labor Costs by Staff Category Across All PPS-1 Clinics
- FIGURE C.2: Proportion of Labor Costs by Staff Category Across All PPS-2 Clinics
LIST OF TABLES
- TABLE ES.1: Number of CCBHCs, Demonstration Start Date, and PPS
- TABLE ES.2: Quality Measures Used for Determining Quality Bonus Payments
- TABLE I.1: Number of CCBHCs, Demonstration Start Dates, and PPS Model
- TABLE III.1: New Jersey Five-Level Classification for PPS-2 Rates
- TABLE III.2: Oklahoma Six-Level Classification for PPS-2 Rates
- TABLE IV.1: Required CCBHC and State-Reported Quality Measures
- TABLE IV.2: Features of CCBHC EHR and HIT Systems
- TABLE IV.3: Percentage of CCBHCs that Used Demonstration Quality Measures to Support Changes in Clinical Practice by State
- TABLE IV.4: Quality Measures Used to Determine Quality Bonus Payments in DY1
- TABLE IV.5: Estimated Funding Available for QBPs
- TABLE A.1: New Jersey CCBHC Rates for DY1
- TABLE A.2: Oklahoma CCBHC Rates for DY1
- TABLE B.1: Thresholds for Triggering an Outlier Payment in New Jersey and Oklahoma
- TABLE B.2: Number of Threshold Payments Made to Clinics in New Jersey
ACRONYMS
The following acronyms are mentioned in this report and/or appendices.
| ADD | Follow-up Care for Children Prescribed ADHD Medication |
|---|---|
| ADHD | Attention Deficit Hyperactivity Disorder |
| AMA | American Medical Association |
| AMM | Antidepressant Medication Management |
| ASAM | American Society of Addiction Medicine |
| ASPE | HHS Office of the Assistant Secretary for Planning and Evaluation |
| BA | Bachelor of Arts |
| CCBHC | Certified Community Behavioral Health Clinic |
| CDF-A | Screening for Clinical Depression and Follow-Up Plan |
| CMHC | Community Mental Health Center |
| CMS | HHS Centers for Medicare & Medicaid Services |
| DCO | Designated Collaborating Organizations |
| DY | Demonstration Year |
| DY1 | First Demonstration Year |
| DY2 | Second Demonstration Year |
| EHR | Electronic Health Record |
| FTE | Full-Time Equivalent |
| FUH | Follow-Up after Hospitalization for mental illness |
| HEDIS | Healthcare Effectiveness Data and Information Set |
| HHS | U.S. Department of Health and Human Services |
| HIT | Health Information Technology |
| ICD | International Classification of Diseases |
| IET | Initiation and Engagement of Alcohol and other Drug Dependence Treatment |
| MEI | Medicare Economic Index |
| MHSIP | Mental Health Statistics Improvement Program |
| NCQA | National Committee for Quality Assurance |
| NQF | National Quality Forum |
| PAMA | Protecting Access to Medicare Act |
| PCPI | Physician Consortium for Performance Improvement |
| PCR-AD | Plan All-Cause Readmission Rate |
| PHQ | Patient Health Questionnaire |
| PPS | Prospective Payment Systems |
| PPS-1 | PPS First Model/Methodology |
| PPS-2 | PPS Second Model/Methodology |
| PTSD | Post-Traumatic Stress Disorder |
| QBP | Quality Bonus Payment |
| SAA | Adherence to Antipsychotic Medications for Individuals with Schizophrenia |
| SAMHSA | HHS Substance Abuse and Mental Health Services Administration |
| SED | Serious Emotional Disturbance |
| SMI | Serious Mental Illness |
| SRA | Suicide Risk Assessment |
| SUD | Substance Use Disorder |
EXECUTIVE SUMMARY
Section 223 of the Protecting Access to Medicare Act (PAMA), enacted in April 2014, authorized the Certified Community Behavioral Health Clinic (CCBHC) demonstration to allow states to test new strategies for delivering and reimbursing services provided in community mental health centers (CMHCs). The demonstration aims to improve the availability, quality, and outcomes of ambulatory services provided in CMHCs by establishing a standard definition and criteria for CCBHCs and developing new prospective payment systems (PPS) that account for the total cost of providing comprehensive services to all individuals who seek care. The demonstration also aims to provide coordinated care that addresses both behavioral and physical health conditions. CCBHCs and demonstration states must also report a common set of quality measures and report their costs as a condition of participating in the demonstration.
Both the payment and quality reporting requirements are central features of the CCBHC model. Historically, Medicaid has reimbursed CMHCs through negotiated fee-for-service or managed care rates, and there is some evidence that these rates did not cover the full cost of CMHC services.[1] The CCBHC demonstration addresses this problem by allowing states to develop a PPS that reimburses CCBHCs for the total cost of providing care to their patients based on projected costs. Specifically, states selected between two PPS models developed by the U.S. Department of Health and Human Services (HHS) Centers for Medicare & Medicaid Services (CMS) (although states could exercise some flexibility in operationalizing the models). The first model (PPS-1) provides CCBHCs with a fixed daily payment for each day that a Medicaid beneficiary receives services from the clinic (this is similar to the PPS model used by Federally Qualified Health Centers). The PPS-1 model also includes a state option to provide quality bonus payments (QBPs) to CCBHCs that meet state-specified performance requirements on quality measures. The second model (PPS-2) provides CCBHCs with a fixed monthly payment for each month in which a Medicaid beneficiary receives services from the clinic. PPS-2 rates have multiple rate categories--a standard rate and separate rates for special populations that are defined by the state. PPS-2 also requires states to make QBPs based on quality measure performance, and outlier payments for costs above and beyond a specific threshold (that is, payment adjustments for extremely costly Medicaid beneficiaries).
Aligning the payment with the actual cost of care was intended to provide CCBHCs with the financial resources necessary to provide high-quality comprehensive care. In addition, CCBHCs receive PPS payments based on anticipated daily or monthly per-patient cost rather than the cost of specific services provided during any particular patient visit. This allows clinics flexibility in the services they provide and the staffing models they use to meet the needs of individual patients without requiring specific billable services to ensure financial sustainability. Finally, the PPS financially incentivizes the delivery of high-quality care by rewarding performance on quality measures.
In October 2015, HHS awarded planning grants to 24 states to begin certifying CMHCs to become CCBHCs, develop their PPS, and plan for the implementation of the demonstration. To support the first phase of the demonstration, HHS developed criteria (as required by PAMA) for certifying CCBHCs in six important areas: (1) staffing; (2) availability and accessibility of services; (3) care coordination; (4) scope of services; (5) quality and reporting; and (6) organizational authority.[2] The criteria established a minimum threshold for the structures and processes that CCBHCs should have to provide high-quality care, although states may exercise some discretion in implementing the criteria to reflect their particular needs.
CCBHCs must provide coordinated care and offer a comprehensive range of nine types of services to all who seek help, including but not limited to those with serious mental illness (SMI), serious emotional disturbance (SED), and substance use disorder.[3] Services must be person and family-centered, trauma-informed, and recovery-oriented, and the integration of physical and behavioral health care must serve the "whole person." To ensure the availability of the full scope of these services, CCBHCs can partner with Designated Collaborating Organizations (DCOs) to provide selected services. DCOs are entities not under the direct supervision of a CCBHC but are engaged in a formal relationship with a CCBHC and provide services under the same requirements. CCBHCs that engage DCOs maintain clinical responsibility for services provided by a DCO to CCBHC consumers, and the CCBHC provides payment to the DCO.
In December 2016, HHS selected eight states to participate in the demonstration (listed in Table ES.1) from among the 24 states that received planning grants. As required by PAMA, HHS selected the states based on the ability of their CCBHCs to: (1) provide the complete scope of services described in the certification criteria; and (2) improve the availability of, access to, and engagement with a range of services (including assisted outpatient treatment). As shown in Table ES.1, six of the eight demonstration states (representing a total of 56 CCBHCs) selected the PPS-1 model and two states (representing ten CCBHCs) selected the PPS-2 model. As of October 2019, the demonstration will end on November 21, 2019.
| TABLE ES.1. Number of CCBHCs, Demonstration Start Date, and PPS | |||
|---|---|---|---|
| State | Number of CCBHCs | Demonstration Start Date | PPS |
| Minnesota | 6 | July 1, 2017 | PPS-1b |
| Missouri | 15 | July 1, 2017 | PPS-1b |
| Nevada | 3a | July 1, 2017 | PPS-1b |
| New Jersey | 7 | July 1, 2017 | PPS-2 |
| New York | 13 | July 1, 2017 | PPS-1b |
| Oklahoma | 3 | April 1, 2017 | PPS-2 |
| Oregon | 12 | April 1, 2017 | PPS-1 |
| Pennsylvania | 7 | July 1, 2017 | PPS-1b |
| SOURCE: Mathematica/RAND review of CCBHC demonstration applications and telephone consultations with state officials. NOTES: As of October 2019, the demonstration ends in all states on November 21, 2019.
|
|||
Goals of the National Evaluation
In September 2016, the HHS Office of the Assistant Secretary for Planning and Evaluation (ASPE) contracted with Mathematica and its subcontractor, the RAND Corporation, to conduct a comprehensive national evaluation of the CCBHC demonstration. ASPE is overseeing the evaluation in collaboration with CMS. Working with these federal partners, Mathematica and RAND designed a mixed-methods evaluation to examine the implementation and outcomes of the demonstration and to provide information for HHS to include in its reports to Congress.
Specifically, Section 223 of PAMA mandates that HHS's reports to Congress must include: (1) an assessment of access to community-based mental health services under Medicaid in the area or areas of a state targeted by a demonstration program as compared to other areas of the state; (2) an assessment of the quality and scope of services provided by CCBHCs as compared to community-based mental health services provided in states not participating in a demonstration program and in areas of a demonstration state not participating in the demonstration; and (3) an assessment of the impact of the demonstration on the federal and state costs of a full range of mental health services (including inpatient, emergency, and ambulatory services). To date, the evaluation has focused on providing critical information to Congress and the larger behavioral health community about the implementation of the CCBHC model across the eight demonstration states.
In June 2018, Mathematica and RAND submitted to ASPE the report "Interim Implementation Findings from the National Evaluation of the Certified Community Behavioral Health Clinic Demonstration."[4] The report described the progress that states and CCBHCs made (through April 2018) in implementing the demonstration and their successes and challenges. In June 2019, Mathematica and RAND submitted a second report, "Implementation Findings from the National Evaluation of the Certified Community Behavioral Health Clinic Demonstration,"[5] which provided updated information on the demonstration's implementation through April 2019 (approximately the first 22 months of the demonstration for six states and 24 months for the remaining two states).
In this latest report, we describe the costs during the first demonstration year (DY1) and the experiences of states and CCBHCs reporting the required quality measures. Given the novelty of reimbursing CCBHCs through a PPS, state and federal policymakers, and other behavioral health system stakeholders, have an interest in understanding the functioning of the PPS and the extent to which PPS rates covered the full costs of care. In addition, given that the adoption of electronic health records (EHRs) and other health information technology (HIT) has been slower among behavioral health providers than other sectors of the health care system (in part, because these providers have not historically received the same incentives as medical providers to adopt such technologies),[6]stakeholders also have an interest in understanding how CCBHCs made changes to their EHR/HIT systems to facilitate reporting the required quality measures. Stakeholders in the demonstration are also interested in how CCBHCs and states used performance on those measures to improve care and make QBPs to CCBHCs.
The findings in this report draw on data collected from: (1) interviews with state Medicaid and behavioral health officials; (2) progress reports submitted by all 66 CCBHCs; (3) cost reports submitted by all 66 CCBHCs; and (4) site visits to select CCBHCs. Most CCBHCs and states did not submit quality measure performance data to HHS in time for this report. As a result, information in this report regarding quality measures focuses on CCBHCs' and states' experiences reporting the quality measures and the enhancements they made to data collection and reporting systems to facilitate reporting the measures (based on our interviews with state officials), CCBHC progress reports, and site visits to CCBHCs.
A. Findings Regarding CCBHC PPS Rates and Costs
During the planning grant year, states worked with clinics that were candidates for CCBHC certification to set visit-day rates for PPS-1 states or visit-month rates for PPS-2 states. At the end of DY1, the CCBHCs submitted detailed cost reports, which include information on total costs of clinic operations. It is important to note that the rates, which were set prior to the beginning of the demonstration, might differ from the actual costs, reported by the clinics at the end of DY1. This report summarizes the rate-setting process and the costs of providing care in the CCBHCs during DY1. We also highlight potential reasons that the rates differed from the DY1 costs.
Establishment of PPS rates. States set the PPS rates using a formula, wherein projected total allowable costs were divided by the projected number of visit-days (for PPS-1) or visit-months (for PPS-2). To set the rates, states collected data on clinics' historical operating costs and visits using a cost report template provided by CMS. Clinics in seven of the eight participating states did not have experience in collecting and reporting their operating costs prior to the demonstration. In these states, officials reported that collecting this information for the purposes of setting rates was a major challenge for clinics. State officials also reported that they anticipated that the rates during DY1 would differ from the actual DY1 costs due to the limitations of the historical data on costs, particularly for services included in the CCBHC criteria that the clinics either did not deliver or bill separately prior to the demonstration. As a result, states and CCBHCs had to project the costs and number of visits for these new services based on very limited information or uncertain assumptions. Several states provided technical support (such as funding for accounting consultations) to the clinics to improve their cost-reporting capabilities.
The average daily rate across the 56 clinics in PPS-1 states was $264 (median rate was $252, and ranged from $151 to $667). PPS-1 rates were, on average, higher in urban CCBHCs than rural CCBHCs, and in CCBHCs that served a smaller number of clients (as measured by total visit-days) versus those that served a higher number of clients. Urban CCBHCs were likely to have higher rates due to higher labor costs and larger CCBHCs were likely to have lower rates due to apportionment of fixed costs across a larger number of visit-days. PPS-1 rates were also, on average, higher among CCBHCs in which a larger share of their total full-time equivalent staff was dedicated to medical doctors. The average blended PPS-2 rate was $714 in New Jersey and $704 in Oklahoma.[7] PPS-2 rates tended to be higher in CCBHCs that served a smaller number of clients versus those that served a higher number of clients, as measured by the total visit-months.
Cost-reporting by clinics. All the CCBHCs submitted cost reports that were approved by their state governments. However, in discussions with state officials and site visits to CCBHCs, we often heard about the challenges of reporting accurate cost information. To assist CCBHCs in providing accurate cost report information, states reported providing extensive technical assistance to clinic financial and administrative staff during DY1. Some states hired consulting firms to work directly with the CCBHCs on the reports during DY1. State officials in Pennsylvania instituted a "dry run" of the cost reports, which covered the first six months of the demonstration. Having the clinics go through the process of collecting and reporting cost information helped the state identify and address reporting challenges before the first federally mandated cost reports were due. Overall, CCBHCs were ultimately able to provide the information in the cost reports.
Total costs of CCBHC operations during DY1. Across all PPS-1 clinics, the average DY1 visit-day cost was $234 and ranged from $132 to $639. The state average visit-day cost ranged from $167 in Nevada to $336 in Minnesota. Across all PPS-2 clinics, the blended visit-month costs averaged $759 and ranged from $443 to $2,043. The state average visit-month cost was $679 in Oklahoma and $793 in New Jersey.
Direct labor costs accounted for 65 percent of the total allowable costs for all CCBHCs. This proportion is similar to the proportion reported for outpatient care centers in the Census Bureau's Service Annual Survey. According to that survey, labor costs account for 68 percent of total outpatient care center costs in 2016.[8] Indirect costs accounted for 23 percent of costs, and other direct costs accounted for 11 percent of costs. The distribution of costs across these categories was similar across states. About 1 percent of DY1 costs were payments by CCBHCs to DCOs. Although the total amount paid to DCOs was a small percentage of costs across all CCBHCs, among the 34 CCBHCs that had DCOs, the proportion of total costs paid to DCOs ranged from 0.02 percent to 14 percent and averaged 2 percent. The percentage of costs allocated to direct labor, indirect, other direct, and DCOs were similar for PPS-1 and PPS-2 states.
Rates relative to costs during DY1. In seven of the eight demonstration states, the rate per visit-day or per visit-month was higher, on average, than the cost per visit-day or per visit-month during DY1. As illustrated in Figure ES.1, four of the eight states had rates that, on average, were no more than 10 percent higher than costs, and four of the states had rates, on average, more than 10 percent higher than costs, ranging from 18 percent to 48 percent above cost on average. In Oregon and New Jersey, the rates were similar to costs on average, but the rate to cost ratio varied widely across clinics. In contrast, the rate to cost ratios for Missouri CCBHCs are closely grouped around the state average.
| FIGURE ES.1. DY1 Rates as Percent Above or Below DY1 Costs Per Visit-Day or Per Visit-Month for Clinics by State |
|---|
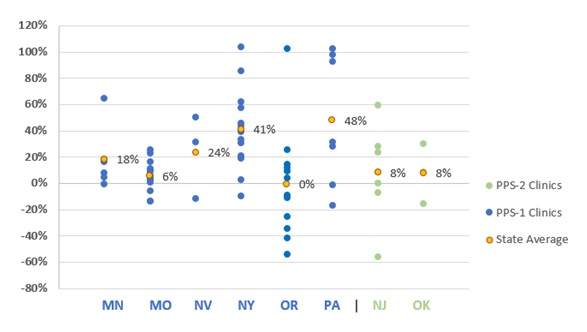 |
| SOURCE: Mathematica and the RAND Corporation analysis of DY1 CCBHC cost reports. NOTE: A positive percentage indicates how much the rate was greater than the cost and a negative percentage indicates how much the rate was less than the cost. |
There are at least two potential reasons for the tendency of the CCBHC rates to be higher than costs during DY1. First, as described above, state officials indicated in our interviews that the rates were set under the assumption that the CCBHCs would be fully staffed throughout the demonstration project. Although state officials recognized that not all CCBHCs would be fully staffed at the outset of the demonstration, it was important to set the rates under this assumption in order to avoid constraining hiring. If staff positions went unfilled, the clinic would have lower costs than had been anticipated and their costs would be lower than their rate. Second, as we described in a separate report, CCBHCs made efforts to increase access to services, including introduction of "open-access" systems where consumers could receive same-day appointments.[9] During site visits, several CCBHCs reported increases in the volume of consumers they see. Visit-days and visit-months would also increase if consumers were seen more frequently, on average, than the historical data on which the rates were set would suggest. If the number of consumer visits increased, while the costs were relatively constant, the actual costs per visit-day or visit-month would be lower than had been anticipated. Moreover, if the staffing costs were lower than anticipated while the number of visit-days or visit-months were greater than anticipated, the divergence between the rates and costs would be magnified.
Changes to rates for the second demonstration year (DY2). States were able to raise or lower their PPS rates for DY2 to bring rates into closer alignment with costs. The states could use a combination of re-basing (that is, re-calculation of the rates based on the DY1 cost reports), or inflation adjustment, using the Medicare Economic Index (MEI) (a measure of inflation in the health care sector). Six of the demonstration states re-based CCBHC rates: Minnesota, New Jersey, New York, Nevada, Oklahoma, and Pennsylvania. Oregon and Missouri chose to only adjust the rates between DY1 and DY2, based on the MEI. As state officials explained, their decision to adjust, not re-base, was related to not feeling comfortable with the length of time and the availability of cost, utilization, and staff hiring data to appropriately inform re-basing the rates.
B. Findings regarding CCBHC quality measure reporting
CCBHC criteria specify 21 quality measures for the demonstration, including nine clinic-reported measures and 12 state-reported measures. Clinic-reported quality measures are primarily process measures that focus on how clinics are achieving service provision target (for example, time to initial evaluation, whether screening and services were provided) and are based on clinical data typically derived from EHRs or other electronic administrative sources. State-reported measures focus on CCBHC consumer characteristics (for example, housing status), screening and treatment of specific conditions, follow-up and readmission, and consumer and family experiences of care. (See Table IV.1 in the report for a list of the measures and potential data sources that CCBHCs and states use to calculate the measures.)
Development of infrastructure to report measures. Nearly all clinics (97 percent) across all states made changes to their EHRs or HIT systems to meet certification criteria and support quality measure and other reporting for the CCBHC demonstration. The most commonly reported changes were modification of EHR/HIT specifications (for example, data fields; forms) to support collection and output of data required for quality measure reporting, and the addition of features to allow the electronic exchange of clinical information with DCOs and other external providers. State officials reported investing considerable resources, including extensive technical assistance in some cases, prior to and following the demonstration launch to ensure that participating clinics had appropriate data systems in place to meet the demonstration quality reporting requirements. This highlights the importance of building-out technological infrastructure for the demonstration to support data collection for mandated quality reporting.
In addition, many clinics modified approaches to screening and the use of standardized tools to assess specific indicators (for example, implementing the Patient Health Questionnaire (PHQ-9) to assess symptoms of depression for the 12-month depression remission measure). During site visits, many CCBHC staff reported that similar screening tools had been used prior to the demonstration, but virtually all sites reported implementing changes to screening protocols (for example, the frequency with which screenings were conducted) and how screening data were used in clinical practice, including how and where results were displayed in a consumer's chart. These changes were typically accompanied by extensive staff trainings and frequent data reviews to ensure provider compliance with screening and data entry procedures.
Successes and challenges reporting measures. Many clinics experienced challenges in the early stages of the demonstration with data collection and reporting the CCBHC-reported measures. In interviews with state officials during DY1, all states reported that many clinics initially experienced challenges with their EHR/HIT systems, particularly when collecting and aggregating data needed to generate quality measures (for example, querying databases to specify the correct numerators and denominators within a given timeframe). State officials most often reported challenges associated with CCBHCs' lack of familiarity with the required measure specification and difficulty obtaining certain variables, such as new service codes or new population subgroups, from clinic EHRs. Many clinic staff echoed these concerns during interviews on CCBHC site visits. In the early stages of the demonstration, many clinics relied upon ad hoc strategies to overcome these challenges and facilitate data collection and reporting. To help clinics resolve these early challenges, state officials provided ongoing technical assistance in the form of training webinars and direct support through multiple channels (phone, online, in-person) to: (1) explain the measures and the information needed from the CCBHCs to report on each of them; (2) provide examples of how to extract information and calculate measures from EHR data (for example, what queries to run; what numerators and denominators to use; etc.); and (3) explain how to complete the reporting template. By the end of DY2, officials in all states reported that the majority of issues surrounding CCBHC-reported quality measures had been resolved.
Use of quality measures to inform quality improvement. Although CCBHCs and states were not required to use quality measure data to monitor or improve the quality of care they provide, both state officials and clinics reported using quality measure data to support a wide range of quality improvement efforts. For example, officials in all states reported using quality measures data to support ongoing monitoring and oversight of CCBHCs (for example, to assess compliance with certification criteria). In addition, Pennsylvania utilized a "dashboard" that displayed CCBHC performance on quality measures and allowed individual CCBHCs to readily compare their performance against other CCBHCs in the state. Many clinics also reported using CCBHC quality measures to support quality improvements, although the use of individual quality measures (for example, time to initial evaluation; depression remission; suicide risk assessment [SRA]) varied depending on site-specific areas of focus.
| TABLE ES.2. Quality Measures Used for Determining Quality Bonus Payments | ||
|---|---|---|
| Required or Optional for Determining QBPsa | States with QBPs that Used the Measure to Determine QBPsb | |
| CCBHC-Reported Measures | ||
| Child and adolescent major depressive disorder: SRA (SRA-BH-C) | Required | All |
| Adult major depressive disorder: SRA (SRA-BH-A; NQF-0104) | Required | All |
| CDF-A | Optional | MN |
| Depression Remission at 12 months (NQF-0710) | Optional | None |
| State-Reported Measures | ||
| Adherence to Antipsychotic Medications for Individuals with Schizophrenia (SAA-BH) | Required | All |
| Follow-Up After Hospitalization for Mental Illness, ages 21+ (adult) (FUH-BH-A) | Required | All |
| FUH, ages 6-21 (child/adolescent) (FUH-BH-C) | Required | All |
| Initiation and Engagement of Alcohol and other Drug Dependence Treatment (IET-BH) | Required | All |
| PCR-AD | Optional | MN, NV, NY |
| Follow-up Care for Children Prescribed ADHD Medication (ADD-C) | Optional | None |
| Antidepressant Medication Management (AMM-A) | Optional | None |
| SOURCE: Appendix III -- Section 223 Demonstration Programs to Improve Community Mental Health Services Prospective Payment System (PPS) Guidance (Available at https://www.samhsa.gov/sites/default/files/grants/pdf/sm-16-001.pdf#page=94. Accessed July 26, 2019) and data from interviews with state Medicaid and behavioral health agency officials conducted by Mathematica and the RAND Corporation, February 2019. NOTES:
|
||
Quality Bonus Payment (QBP) programs. QBP programs were optional for states that implemented PPS-1 and required for states that implemented PPS-2. CMS specified six quality measures that states were required to use if they implemented a QBP program; states could choose from among an additional five measures or ask for approval for use of non-listed measures (required and optional measures are listed in Table ES.2). All demonstration states except Oregon offered bonus payments based on CCBHCs' performance on quality measures. Pennsylvania, Missouri, New Jersey, and Oklahoma used only the six CMS-required measures to determine bonus payments. Minnesota, Nevada, and New York also used the CMS-optional measure for Plan All-Cause Readmission Rate (PCR-AD) in addition to the six CMS-required measures. In addition to the six required measures, Minnesota also used the CMS-optional measure Screening for Clinical Depression and Follow-Up Plan (CDF-A) in determining QBPs, and New York added two state-specific measures based on state data regarding suicide attempts and deaths from suicide.
States varied in the criteria they used to award QBPs. In some states, CCBHCs could qualify for the QBP during DY1 simply by reporting the quality measures. Several states assessed performance on the quality measures during the first six months of the demonstration and used that information to set improvement goals for the remainder of DY1. Some states decided to weight some measures more heavily than others. As of Spring 2019, Missouri and Nevada had assessed CCBHC performance relative to the QBP program standards, and, in both states, all CCBHCs met the criteria. Officials from the other five states with QBPs reported that they were still receiving or analyzing data to finalize determinations of QBPs.
C. Future Evaluation Activities
In Summer 2020, we will update this report to include findings from the DY1 quality measures and DY2 cost reports. That report will provide updated information for the evaluation questions described in this report. In addition, we plan to address a number of additional evaluation questions related to changes in rates, costs, and cost components over time. We will also examine if states' changes to rates resulted in closer alignment with actual costs.
We are in the process of obtaining Medicaid claims and encounter data from states to examine the impacts of CCBHC services on hospitalization rates, emergency department service utilization, and ambulatory care relative to within-state comparison groups (Medicaid beneficiaries with similar diagnostic and demographic characteristics who did not receive care from CCBHCs). Depending on the availability of data within each state, we expect that the impact analyses will use approximately four years of Medicaid claims/encounter data (up to a two-year pre-demonstration period and a two-year post-implementation period). We will report these findings in our final report in May 2021, along with updated findings that draw on both years of CCBHC cost reports and quality measures.
I. BACKGROUND
A. Description of the Certified Community Behavioral Health Clinic (CCBHC) Demonstration
Section 223 of the Protecting Access to Medicare Act (PAMA), enacted in April 2014, authorized the Certified Community Behavioral Health Care (CCBHC) demonstration to allow states to test new strategies for delivering and reimbursing services provided in community mental health centers (CMHCs). The demonstration aims to improve the availability, quality, and outcomes of ambulatory services provided in CMHCs by establishing a standard definition and criteria for CCBHCs and developing a new payment system that accounts for the total cost of providing comprehensive services to all individuals who seek care. The demonstration also aims to provide coordinated care that addresses both behavioral and physical health conditions.
In October 2015, the U.S. Department of Health and Human Services (HHS) awarded planning grants to 24 states to begin certifying CMHCs to become CCBHCs, develop new prospective payment systems (PPS), and plan for the demonstration's implementation. To support the demonstration's first phase, HHS developed criteria (as required by PAMA) for certifying CCBHCs in six important areas: (1) staffing; (2) availability and accessibility of services; (3) care coordination; (4) scope of services; (5) quality and reporting; and (6) organizational authority. The criteria established a minimum threshold for the structures and processes that CCBHCs should have to provide high-quality care, although states may exercise some discretion in implementing the criteria to reflect their particular needs.
States used the planning grants to select a PPS model, develop PPS rates, and develop the infrastructure to support the demonstration. The HHS Centers for Medicare & Medicaid Services (CMS) developed two PPS models that participating states could implement. The first model (PPS-1) is a daily rate, similar to the PPS model used by Federally Qualified Health Centers. PPS-1 pays CCBHCs a fixed amount for each day that a Medicaid beneficiary receives CCBHC services. The payment is the same regardless of the type or volume of services the beneficiary receives on that that day. States that adopted the PPS-1 model also had the option of including a quality bonus payment (QBP) mechanism--a payment above the standard PPS rate based on performance on quality measures.
The second model (PPS-2) is a monthly rate that pays a fixed amount to the CCBHC for each month in which a beneficiary receives CCBHC services. The payment is the same regardless of the number of visits the beneficiary makes in a month or the types or volume of services they receive. The PPS-2 model has multiple rate levels--a standard rate and separate monthly rates for special populations defined by state-specified clinical conditions. CMS required that states implementing the PPS-2 model include a QBP mechanism, and an outlier payment mechanism (a supplemental payment to cover extremely high cost consumers). However, CMS allowed states flexibility to design the criteria and payment amounts for their QBP mechanisms and the thresholds and amounts for their outlier payments.
Both PPS models are "cost-based," meaning that the rates are intended to cover the actual costs of operating the CCBHC to provide the scope of services required in the certification criteria. The cost-based rate gives clinics the flexibility to structure their services and financial management systems in a way that enables them to provide the full scope of services without having to bill for each of these services individually. CMS requires that CCBHCs participating in the demonstration submit annual cost reports with details of their total operating costs. In addition, participating CCBHCs and states must submit to HHS performance data for a core set of quality measures specified in the criteria. States could also elect to require CCBHCs to submit additional quality measures.
In December 2016, HHS selected eight states to participate in the demonstration from among the 24 states that received planning grants. As required by PAMA, HHS selected the states based on the ability of their CCBHCs to: (1) provide the complete scope of services described in the certification criteria; and (2) improve the availability of, access to, and engagement with a range of services (including assisted outpatient treatment). HHS selected Minnesota, Missouri, Nevada, New Jersey, New York, Oklahoma, Oregon, and Pennsylvania to participate in the demonstration. As summarized in Table I.1, 66 CCBHCs are participating across the eight states; only two states elected the PPS-2 model. As of October 2019, the demonstration will end on November 21, 2019.
| TABLE I.1. Number of CCBHCs, Demonstration Start Dates, and PPS Model | |||
|---|---|---|---|
| State | Number of CCBHCs | Demonstration Start Date | PPS |
| Minnesota | 6 | July 1, 2017 | PPS-1b |
| Missouri | 15 | July 1, 2017 | PPS-1b |
| Nevada | 3a | July 1, 2017 | PPS-1b |
| New Jersey | 7 | July 1, 2017 | PPS-2 |
| New York | 13 | July 1, 2017 | PPS-1b |
| Oklahoma | 3 | April 1, 2017 | PPS-2 |
| Oregon | 12 | April 1, 2017 | PPS-1 |
| Pennsylvania | 7 | July 1, 2017 | PPS-1b |
| SOURCE: Mathematica/RAND review of CCBHC demonstration applications and telephone consultations with state officials. NOTES: As of October 2019, the demonstration ends in all states on November 21, 2019.
|
|||
The participating CCBHCs must provide coordinated care and offer a comprehensive range of nine types of services to all who seek help, including but not limited to those with serious mental illness (SMI), serious emotional disturbance (SED), and substance use disorder (SUD). Services must be person and family-centered, trauma-informed, and recovery-oriented, and the integration of physical and behavioral health care must serve the "whole person." To ensure the availability of the full scope of these services, CCBHCs can partner with Designated Collaborating Organizations (DCOs) to provide selected services. DCOs are entities not under the direct supervision of a CCBHC but are engaged in a formal relationship with a CCBHC and provide services under the same requirements. CCBHCs that engage DCOs maintain clinical responsibility for services provided by a DCO to CCBHC consumers, and the CCBHC provides payment to the DCO.
B. Goals of the National Evaluation
In September 2016, HHS Office of the Assistant Secretary for Planning and Evaluation (ASPE) contracted with Mathematica and its subcontractor, the RAND Corporation, to conduct a comprehensive national evaluation of the CCBHC demonstration. ASPE is overseeing the evaluation in collaboration with CMS.
Working with these federal partners, Mathematica and RAND designed a mixed-methods evaluation to examine the implementation and outcomes of the demonstration and to provide information for HHS to include in its reports to Congress. Specifically, Section 223 of PAMA mandates that HHS submit annual reports to Congress that include: (1) an assessment of access to community-based mental health services under Medicaid in the area or areas of a state targeted by a demonstration program as compared to other areas of the state; (2) an assessment of the quality and scope of services provided by CCBHCs as compared to community-based mental health services provided in states not participating in a demonstration program and in areas of a demonstration state not participating in the demonstration; and (3) an assessment of the impact of the demonstration on the federal and state costs of a full range of mental health services (including inpatient, emergency, and ambulatory services). To date, the evaluation has focused on providing critical information to Congress and the larger behavioral health community about the strategies that CCBHCs employ to improve care. As more data become available, the evaluation will describe the effects of the demonstration on consumer outcomes and costs.
Purpose of report. This report describes the costs during the first demonstration year (DY1) and the experiences of states and CCBHCs reporting the required quality measures. The payment system and required reporting of quality measures are integral to the CCHBC model and innovative in the context of community-based mental health services. Historically, Medicaid has reimbursed these providers using negotiated fee-for-service or managed care rates tied to specific services. In contrast, the PPS provides a fixed payment for every day (in the case of PPS-1) or every month (in the case of PPS-2) that a patient has at least one service. These payments do not change based on the amount of services a patient receives on a given day or within a month, with the exception of outlier payments in the PPS-2 mechanism, described below.
Analyses of Medicaid payments to CMHCs prior to the CCBHC demonstration found that these payments were in most cases below the costs of providing care, and that the new PPS rates for CCBHCs would likely be higher than historical Medicaid payments for mental health services.[10] States set the PPS rates based on the actual costs of providing care using a relatively simple formula. Specifically, states divided the total cost of providing care by the number of anticipated visit-days (in the case of PPS-1) or visit-months (in the case of PPS-2). States relied on historical cost data to set the PPS rates but they also had to make assumptions about the number of visits and costs for the full scope of services required by the CCBHC criteria (most CCBHCs added services to meet the demonstration requirements, and therefore did not have historical information on costs for every type of CCBHC service). This uncertainty with respect to the costs of care for CCBHCs, coupled with uncertainty about the number of visits that consumers would make, led to considerable uncertainty about how well the rates would match the actual costs incurred during the demonstration.
Finally, in all states except New York, CCBHCs did not submit cost reports prior to the demonstration. This reporting requirement introduced a more detailed and sophisticated level of accounting to clinics. CCBHCs' experiences collecting and reporting the cost reports can inform future efforts to apply cost-reporting requirements to CMHCs.
The demonstration also requires that states and CCBHCs report a standard set of quality measures. Given that the adoption of electronic health records (EHRs) and other health information technology (HIT) has been slower among behavioral health providers than other sectors of the health care system (in part, because these providers did not historically receive the same incentives as medical providers to adopt such technologies), the evaluation examined how CCBHCs' made changes to their EHR/HIT systems to facilitate reporting the required quality measures and how both CCBHCs and states used performance on those measures to improve care and make QBPs to CCBHCs.
This report answers the following evaluation questions:
-
How did the states initially establish the CCBHC rates? What were the DY1 rates?
-
To what extent did CCBHCs succeed in collecting and reporting information requested in the cost-reporting templates?
-
What were the total costs and main cost components in CCBHCs per visit or per month in DY1?
-
How did anticipated costs per visit or per month compare with actual costs incurred in DY1?
-
Did states change the second demonstration year (DY2) rates based on the experience of DY1?
-
To what extent do states and CCBHCs expect to succeed in collecting and reporting data on the quality measures according to the prescribed specifications?
-
How have CCBHCs and states used their performance on the quality measures to improve the care they provide?
-
What measures and thresholds did states use to trigger QBPs in DY1? How much funding did states set aside for QBPs?
We will update this report in Summer 2020. The updated report will include an analysis of the performance of the CCBHCs on the required quality measures during DY1 and an analysis of cost reports from DY2. The final evaluation report will include an analysis of the impact of the demonstration on health care utilization and quality of care using Medicaid claims data.
II. DATA SOURCES AND METHODS
Mathematica and RAND collected and analyzed the following data for this report: (1) interviews with state officials; (2) progress reports obtained from CCBHCs; (3) site visits to CCBHCs; (4) state reports of CCBHC PPS rates; and (5) CCBHC DY1 Cost Reports. This chapter describes these data sources and our analytic methods.
A. Interviews with State Officials
We conducted three rounds of telephone interviews with state behavioral health and Medicaid officials involved in leading implementation of the demonstration in each state. We conducted the first and second rounds of interviews at two points in DY1--September to October 2017 and February to March 2018, respectively. We conducted the third round toward the end of DY2--February to April 2019.
The first round of interview questions gathered information about early implementation, decisions made during the demonstration planning phase, early successes and challenges in fulfilling the certification requirements and following the data collection and monitoring procedures, and anticipated challenges or barriers to successful implementation. The second round of interviews gathered information on interim successes and challenges since the time of the initial interview, success in implementing demonstration cost-reporting procedures and quality measures, and early experiences with the PPS systems and QBPs (if applicable). The third round of interviews collected information on the same categories covered in the second round of interviews, with an emphasis on any changes in implementation successes and challenges experienced in DY2.
Mathematica and RAND conducted a total of 29 interviews (ten during each of the first two rounds, and nine in the third). In the first two rounds of interviews, behavioral health and Medicaid officials in six states participated in the interviews together to reduce scheduling burden and provide comprehensive answers; we conducted two separate interviews with behavioral health and Medicaid officials in two states. During the final round of interviews, officials in one state elected to conduct separate interviews for each group of state officials--one with behavioral health officials and one with Medicaid officials. Each interview lasted approximately 60 minutes.
Two researchers conducted each interview, with one leading the interview and one taking notes. We asked interviewees' permission to audio record the discussions to ensure the accuracy and completeness of interview notes. Following the interviews, we organized the interview information into categories defined by our evaluation questions. We summarized interviewees' responses for each state and then identified cross-state themes in the findings.
B. CCBHC Progress Reports
In Spring 2018 (DY1) and Spring 2019 (DY2), CCBHCs submitted online progress reports to Mathematica that gathered information about their staffing, training, accessibility of services, scope of services, HIT capabilities, care coordination activities, and relationships with other providers. The questions in the Spring 2019 progress report were almost identical to those in the 2018 progress report, with a few minor changes to reduce burden for CCBHC respondents and update the referenced timeframes. We collaborated with the demonstration lead in each state to conduct outreach to clinic leadership via phone and email before and during the collection of the progress reports to encourage their participation and answer any questions. All 66 CCBHCs completed the progress reports for 2018 and 2019--a 100 percent response rate. Findings in this report draw on both the 2018 and 2019 progress reports.
C. Site Visits
In February and March of 2019 (DY2), we conducted site visits to clinics in four demonstration states (Missouri, Oklahoma, Oregon, and Pennsylvania). In collaboration with our federal partners, we used information from the CCBHC progress reports described above and examined transcripts from the first and second round of interviews with state officials to select two CCBHCs within each state (three in Pennsylvania) to visit. We selected the final group of clinics to be diverse in terms of the following characteristics: urban-rural designation; location and proximity to other CCBHCs; size and number of CCBHC service locations; implementation of intensive team-based supports, Assertive Community Treatment, and Medication-Assisted Treatment; and any innovative engagement strategies or mobile/community-based supports.
During the site visits, we conducted in-depth discussions with clinic administrators and front-line clinical staff about how care has changed following implementation of the demonstration. Interview topics included: successes and barriers related to CCBHC staffing, steps clinics have taken to improve access to care and expand their scope of services, the CCBHCs' experience with payments and the PPS, and quality and other reporting practices. We asked interviewees' permission to audio record the discussions to facilitate our analysis. Following the interviews, we organized the interview information into categories defined by the CCBHC certification criteria, and the research team reviewed these data to identify cross-site themes.
D. State Reports of PPS Rates
Mathematica and RAND asked state officials to provide the rates that they paid each of the CCBHCs. For PPS-1 states, we report the average, median and range of rates across CCBHCs. For PPS-2 states, for which there are separate rates for each population category, we calculated a blended rate by weighting the category specific rates by the actual distribution of consumers across the rate categories (based on information contained in the cost reports, described below). We used Pearson correlation coefficients to examine the relationship between clinic characteristics, such as clinic size or rural versus urban location, and the rates. The evaluation team did not have access to the cost reports that CCBHCs completed during the rate-setting process. As a result, information in this report about the rate-setting process was based on interviews with state officials.
E. CCBHC DY1 Cost Reports
We obtained data on CCBHC costs during DY1 from the standardized cost reports that states were required to submit to CMS during the first half of 2019. States submitted the cost reports to CMS for all 66 CCBHCs in Excel format, and we obtained them from CMS and conducted the analysis using Excel. We reviewed the cost reports and communicated with state officials to obtain clarifying information as needed.
The cost reports include information on clinic operating costs and the total number of clinic visit-days (PPS-1) or visit-months (PPS-2) that occurred during the DY. Visit-days are unique days on which a consumer received at least one service, and visit-months are months in which a consumer received at least one service. The reports include all visit-days or visit-months for all consumers, not only visits covered under Medicaid or the PPS. The operating costs include both direct costs, such as labor and medical supplies, and indirect costs, such as rent payments.
Although clinics used the same CMS-provided form to report cost information, there were some differences across clinics and across states in the reporting. These differences required harmonization by the evaluation team for purposes of comparison. New Jersey's cost reports covered an earlier time period (the year prior to the demonstration) than the cost reports from the other demonstration states. We applied the Medicare Economic Index (MEI) to the cost data to adjust for the time difference. Missouri cost reports were split into two reports; one reporting costs for specialized services and the other reporting costs for comprehensive services. We then followed the procedure used by the state to combine information from the two reports to calculate a single cost estimate.
We conducted several types of analyses using the cost report data:
-
Total cost per visit-day or visit-month calculations and cost component analyses. We used the cost reports to calculate the total costs per visit-day or visit-month for each clinic, depending on whether the clinic was in a state with a PPS-1 or PPS-2 system. We calculated cost per visit-day or visit-month by dividing the total costs reported for the DY1 period by the total number of visit-days or visit-months. In addition, we used the detailed cost breakdowns provided in the reports to compare the CCBHCs with respect to the proportions of their total cost that was devoted to various cost components, including staff types. The breakdown of costs into cost components (for example, direct, indirect) was calculated as a share of total allowable costs. We also examined DCO costs because the DCO mechanism is a unique feature of the CCBHC model meant to allow CCBHCs flexibility to contract out some services within the PPS mechanism. DCO costs could cover a wide range of services, depending on the role the DCO played in the CCBHC of which it was a part.
-
Labor costs. We examined labor costs in greater detail because they are the largest cost component. We developed staffing categories to facilitate consistent comparisons across the clinics and states despite variability in the original staff classifications.
-
Costs versus rates. We compared DY1 costs with the PPS rates (as reported by the states). We report this comparison as the percentage by which the rates were higher or lower than the costs.
While interpreting the cost report information, we found some limitations of the data. Some states used different methods to allocate and present direct and indirect costs, and in some cases the costs cover different time periods. This is most evident in the classification of staffing, for which we devised a classification system to enable comparisons across CCBHCs and states. We did not independently audit the cost reports for accuracy. Nonetheless, these cost reports are the first source of information available on the financial administration of CCBHCs and they provide insight into the model's functioning.
III. CERTIFIED COMMUNITY BEHAVIORAL HEALTH CLINIC PAYMENT RATES AND COSTS OF CARE
This chapter describes the PPS, rates, and costs of CCBHCs, drawing on data from interviews with state officials and the DY1 cost reports. We first describe the PPS rates and how they varied across CCBHCs within and across states. We then present the actual DY1 costs and the major cost components. Finally, we summarize DY1 PPS rates relative to actual DY1 costs.
A. How did States Establish the CCBHC Rates? What Were the DY1 Rates?
Establishing the rates. States set the PPS rates for each CCBHC by dividing projected total allowable costs by the projected number of visit-days (for PPS-1) or visit-months (for PPS-2). In the case of PPS-2, states used the same formula to set rates for each of the special populations defined by the state's rate schedule. Although the formula for calculating the rates is simple, the rate calculation requires accurate data for calculating the allowable costs and number of visit-days or visit-months. According to state officials, collecting this data prior to the beginning of the demonstration was a challenge for states and the clinics that were to become CCBHCs.
To set the rates, states collected data on clinics' historical operating costs using a cost report template provided by CMS. In New York, the clinics have historically been required to submit detailed, audited cost reports to the state--the CMS rate-setting form was filled in using information from these reports. However, clinics in the seven other states participating in the demonstration did not have experience completing these types of cost-reporting forms or reporting their operating costs. In these states, state officials reported that collecting this information was a major challenge for clinics. Several states provided technical support to the clinics, such as funding for accounting consultations, to improve their cost-reporting capabilities. States conducted desk reviews of the cost reports submitted by clinics to ensure accuracy.
In addition to the information from the cost reports on clinics' historical operating costs, the rate-setting process also required information on changes to those costs that were anticipated due to the implementation of the CCBHC certification criteria. Since the clinics would be broadening their scope of services to meet the criteria, they would generally be increasing their total operating costs. However, because there was a lack of historical data on the actual costs of providing the enhanced scope of services, the additional costs had to be estimated. To estimate the additional costs, CCBHCs applied market rates for additional staff, spending on training or infrastructure, and other anticipated costs approved by the states.
Clinics were also required to estimate the number of visit-days or visit-months they would have over the course of DY1. While the clinics had historical information on patterns of service utilization, they may not have collected information on visit-days or visit-months prior to the demonstration. In addition, as CCBHCs, they planned to change their internal organization of care delivery and make extensive efforts to increase access to care. Due to these efforts, they could anticipate that the number of visit-days or visit-months would be quite different during the demonstration than they had been historically. However, the clinics lacked accurate methods for precisely estimating the impact that becoming a CCBHC would have on the number of visit-days or visit-months they would have in a year.
Because states set PPS rates for DY1 by dividing the projected total allowable costs by the projected number of visit-days or visit-months, there are two ways the rates could diverge from the actual visit-day or visit-month costs incurred during DY1. First, the projected total costs of operating the CCBHC could be different from the actual total costs. This could happen, for example, if the CCBHC hired higher or lower salaried staff than anticipated or incorporated services that were more expensive to provide than anticipated. Second, the PPS rates could be different than the actual costs if the actual number of consumer visit-days or visit-months was higher or lower than anticipated. For example, if the clinic increased the number of visit-days or visit-months beyond the expected number, while their total costs remain constant, their actual cost per visit-day or visit-month would be lower than anticipated.
The evaluation team did not have access to the data nor the calculations used to set the DY1 rates. Therefore, we were unable to identify specific data limitations that may have led to inaccuracy in the rate-setting. However, state officials indicated in our interviews that they were aware of these data limitations and expected the rates to be inaccurate to a certain degree during DY1. For instance, officials in one state noted that the rates would differ from the actual costs because the rates were calculated under the assumption that the CCBHCs would be fully staffed from the beginning of the demonstration. However, the state officials expected that the CCBHCs would require some amount of time to hire staff, and that consequently they would not incur the full amount of anticipated costs. Similarly, staff turnover at a CCBHC during the year could reduce CCBHC costs, since they would not be paying staff costs for positions that were unfilled. If the incurred staffing costs were below projections, then the actual CCBHC operating costs would be lower than anticipated and the CCBHCs would be paid at a rate above their actual costs.
DY1 rates. DY1 rates varied across CCBHCs and states. The average daily rate across the 56 clinics in PPS-1 states was $264 (median rate was $252). Across all states, PPS-1 rates ranged from $151 to $667, a four-fold difference.
As shown in Figure III.1, PPS-1 rates varied across clinics within states, as well as across states. For some states, such as Minnesota and Pennsylvania, rates varied widely across clinics, whereas in other states, such as Missouri and Nevada, the rates varied less across clinics. The state average rates ranged from a low of $197 in Nevada to $379 in Minnesota.
-
Across all PPS-1 states, clinics in rural areas had on average slightly lower rates ($254 on average) compared with those in urban areas ($271 on average). This may be due to lower staffing costs or other factors.
-
Across all PPS-1 states, clinics with a higher volume of consumer visit-days had lower rates ($229 on average) than clinics with lower volume of consumer visit-days ($298 on average). Rates may be lower in clinics with more visits due to economies of scale.
-
Across all PPS-1 states, clinic rates were positively associated with the proportion of the clinic's total full-time equivalent (FTE) staff that were medical doctor positions (psychiatrists or other medical doctors). The correlation between the proportion of FTE staff that were medical doctors and the rates was 0.4.
| FIGURE III.1. DY1 Visit-Day Rates for PPS-1 Clinics by State |
|---|
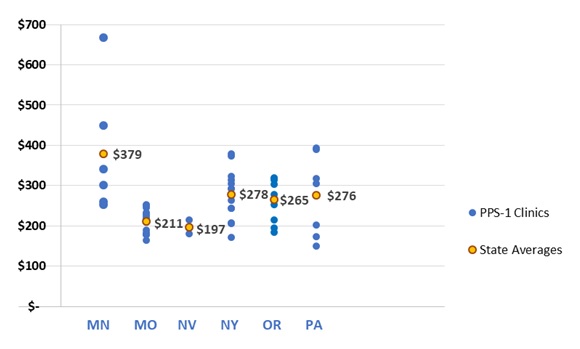 |
| SOURCE: Mathematica and the RAND Corporation analysis of DY1 CCBHC cost reports. |
PPS-2 rates are structurally more complicated than PPS-1 rates. The PPS-2 has multiple rate categories, one rate for the "standard" population and additional rates for special populations (that is, consumers who met criteria for certain conditions expected to have different costs on average). CMS allowed states to define their special populations and associated rates for the demonstration. As shown in Table III.1 and Table III.2, New Jersey and Oklahoma use different definitions for their special populations. Both states included individuals with SMI and SUD as special populations. However, the states differed with respect to other special populations: New Jersey included individuals with post-traumatic stress disorder (PTSD) and SED as special populations whereas Oklahoma designated individuals into special populations based on age, homelessness, and the presence of first-episode psychosis. The special population rates were higher on average than the standard population rates, although this pattern did not hold for all CCBHCs (see Appendix A for the rates for each CCBHC). In addition, four CCBHCs in New Jersey and one in Oklahoma applied the same rate to more than one special population. In some cases, this was done when a clinic had zero cases in one of the categories during the year prior to DY1 (the year on which the rates were based). In other cases, clinics averaged costs across two or more categories to arrive at a single rate, due to small sample sizes.
| TABLE III.1. New Jersey Five-Level Classification for PPS-2 Rates | |||||
|---|---|---|---|---|---|
| Standard Population | Special Population 1 | Special Population 2 | Special Population 3 | Special Population 4 | |
| Population definition | Individuals who do not have an ICD-9 or ICD-10 diagnosis code corresponding to any of the following special populations | SMI | SUD | PTSD | SED |
| Average rate across clinics | $627 | $748 | $795 | $750 | $724 |
| SOURCE: New Jersey CCBHC Demonstration Application Part 3. NOTE: Standard population: Individuals who do not have an ICD-9 or ICD-10 diagnosis code corresponding to any of the special populations within the reporting period. See Appendix A for special population definitions. The state used the term severe emotional disorder (SED). |
|||||
To compare the PPS-2 rates within and across states, we calculated a blended rate for each CCBHC using the standard population rate and each of the special population rates. For each clinic, we weighted each population rate by the number of visit-months in that category in DY1 according to the cost reports and then calculated the average for the clinic. We then calculated the average across the clinics to report a state average.
Across the ten PPS-2 clinics in Oklahoma and New Jersey, the average blended rate was $711, and the median blended rate was $727. The blended rates ranged across CCBHCs from a low of $558 to a high of $902.
| TABLE III.2. Oklahoma Six-Level Classification for PPS-2 Rates | ||||||
|---|---|---|---|---|---|---|
| Standard Population | Special Population 1 |
Special Population 2 |
Special Population 3 |
Special Population 4 |
Special Population 5 |
|
| Population definition | Individuals who are not classified in any of the following special populations | High-risk SMI or co-occurring SUD | High-risk SED or co-occurring condition | Adults with significant SUD | Adolescents with significant SUD | Chronic homelessness or first time psychosis episode for children and adults |
| Average rate across clinics | $636 | $993 | $1,135 | $1,055 | $1,010 | $830 |
| SOURCE: Oklahoma CCBHC Demonstration Application Part 3. NOTE: Standard population: Individuals who are not classified in any of the 5 special populations during the reporting period. See Appendix A for special population definitions. |
||||||
As shown in Figure III.2, the average blended rates in New Jersey and Oklahoma were similar to each other, $714 and $704 respectively. The range across clinics in the blended rates was wider in New Jersey than in Oklahoma, which is not surprising given the larger number of CCBHCs in that state. The blended rates were lower on average in clinics with higher numbers of visit-months, similar to the finding with respect to rates and visit-days in the PPS-1 clinics.
Contrary to the pattern in PPS-1 rates, the PPS-2 rates were higher in rural areas than in urban areas. The average blended rate in rural areas was $852 and the average blended rate in urban areas was $676. The lowest blended rate in a rural clinic, $801, was higher than the highest blended rate in an urban clinic, $793. This finding should be interpreted with caution given the very small sample size, which includes only two rural clinics, one in each PPS-2 state. It is unclear if this pattern reflects general conditions in rural versus urban areas or simply the particular conditions of the small number of clinics in the PPS-2 states.
| FIGURE III.2. DY1 Average Blended Visit-Month Rates for PPS-2 Clinics by State |
|---|
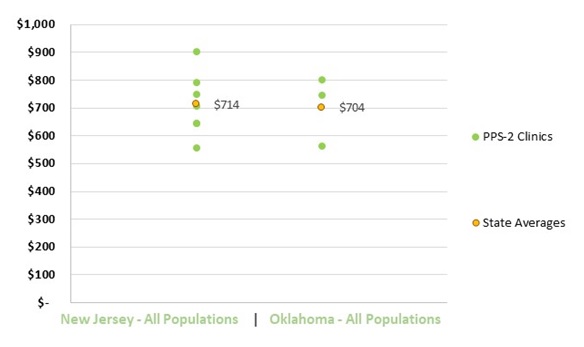 |
| SOURCE: Mathematica and the RAND Corporation analysis of DY1 CCBHC cost reports. NOTES: The figure presents a blended rate for each clinic. The blended rates were calculated by averaging across the population rates, weighting each population rate by the proportion of visit-months to which it was assigned. |
The PPS-2 states also specified outlier payment thresholds for the standard population and each of the special populations distinguished in their rate schedule. Appendix B summarizes the outlier payment thresholds for each state. Unlike the PPS-2 rates, the thresholds applied to all CCBHCs within the state and were not specific to each CCBHC. The thresholds were set at higher levels of cost in Oklahoma than they were in New Jersey.
B. To What Extent did CCBHCs Succeed in Collecting and Reporting Information Requested in the Cost-Reporting Templates?
Cost-reporting was challenging for most CCBHCs. In discussions with state officials and site visits to CCBHCs, we often heard about the challenges of reporting accurate cost information. For example, interviewees from a number of states reported that many clinics--particularly those with limited experience in preparing cost reports--had some initial difficulty in completing cost forms. Of the states participating in the demonstration, only New York had a history of requiring cost reports from specialty mental health clinics. To assist CCBHCs in providing accurate cost information, states reported providing extensive technical assistance to clinic financial and administrative staff. The technical assistance began during the planning year, and, in some cases, continued throughout the demonstration. Some states hired consulting firms to work directly with the CCBHCs on the reports during DY1. State officials in Pennsylvania instituted a "dry run" of the cost reports, which covered the first six months of the demonstration. Having the clinics go through the process of collecting and reporting cost information helped the state identify and address reporting challenges before the first federally mandated cost reports were due.
Interviewees noted that many clinics initially experienced challenges with reporting anticipated costs, due to limited familiarity with PPS and uncertainty over the extent to which staffing and the number of consumers served would change as a result of new services and efforts to increase access to care. During nearly all clinic site visits, financial and reporting staff members also noted challenges in anticipating costs.
Some of the challenges in reporting cost information became clear from our analyses of the data that were reported. In particular, some clinics struggled to accurately report staff costs and FTEs. The cost reports included details on staff types, the salaries and benefits associated with each staff type, and staff work time (as measured in FTEs); however, this information was reported in varying ways and sometimes with significant gaps. Wherever we noticed data omissions, errors, or inconsistent reporting methods, we requested via email supplemental information from states and clinics, and states and clinics were highly responsive to our questions. We incorporated what we learned from states into our analyses of the cost reports.
Inconsistency in the reporting of staff cost information does not impact rate calculations, which are based on total costs. However, they do impact our ability to analyze the cost distribution by staff type in a consistent fashion across states and CCBHCs. Below, we detail some examples of specific reporting challenges identified through our analysis of the cost reports:
-
All states except Missouri reported staff categories that CMS had pre-populated in the Excel cost report workbook. One clinic in Minnesota and one in Oregon also submitted their own unique staff categories and did not report cost data for any of the staff categories in the CMS cost report template.
-
Several clinics did not report any FTEs, or omitted FTE data for certain staff categories. However, all but one CCBHC supplied full information on FTEs after we requested it.
-
Some clinics included anticipated FTEs in their cost reports and some did not.
-
Consultant FTEs were included in FTE totals by some CCBHCs and excluded by others. We requested this information when it was omitted and added it to our calculations.
-
Some clinics excluded a portion of salary costs for staff when salaries were paid in part by other entities.
C. What were the Total Costs and Main Cost Components in CCBHCs on a Per Visit-Day or Per Visit-Month Basis (depending on the PPS model)?
Total costs. Across all PPS-1 clinics, the average DY1 visit-day cost was $234 and ranged from $132 to $639. Figure III.3 shows the distribution of visit-day costs across clinics and the average visit-day cost for each state. The state average visit-day cost ranged from $167 in Nevada to $336 in Minnesota. For some states, such as Minnesota and Oregon, the visit-day costs varied widely across CCBHCs within the state, while in others, such as Missouri and New York, the costs were tightly clustered around the mean value.
| FIGURE III.3. DY1 Daily Per Visit Costs for PPS-1 Clinics by State |
|---|
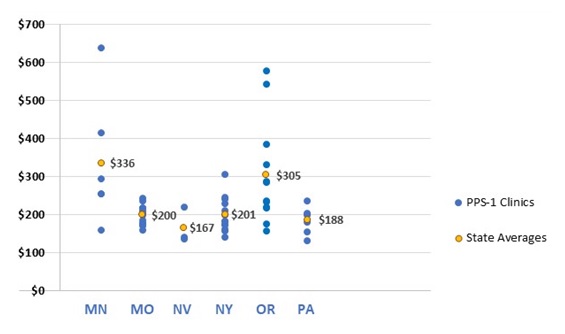 |
| SOURCE: Mathematica and the RAND Corporation analysis of DY1 CCBHC cost reports. |
| FIGURE III.4. DY1 Blended Cost Per Visit-Month for PPS-2 Clinics by State |
|---|
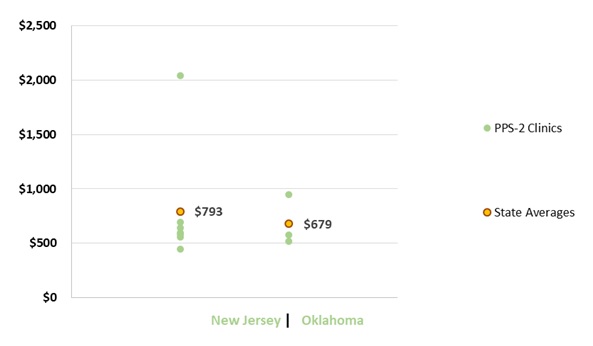 |
| SOURCE: Mathematica and the RAND Corporation analysis of DY1 CCBHC cost reports. |
Across all PPS-2 clinics, the blended visit-month costs averaged $759 and ranged from $443 to $2,043. Figure III.4 shows the distribution of visit-month costs across clinics and the average visit-month costs for each state. The state average visit-month cost was $679 in Oklahoma and $793 in New Jersey. Oklahoma had fewer clinics, and their range was tighter than that observed in New Jersey.
We did not include outlier payments in the calculation of the visit-month costs reported above. None of the clinics in Oklahoma reported any outlier payments. Of the seven clinics in New Jersey, five reported receiving outlier payments, and the number of outlier payments ranged from 37 to 1,522. Appendix B provides information about outlier payments.
Major components of CCBHC costs. Direct labor costs accounted for 65 percent of the total allowable costs for CCBHCs (Figure III.5). This proportion is similar to the proportion reported for outpatient care centers in the Census Bureau's Service Annual Survey. Outpatient care centers include specialty mental health clinics, such as CMHCs, as well as general medical facilities, such as primary care offices. According to that survey, labor costs account for 68 percent of total outpatient care center costs in 2016.[11] Indirect costs accounted for 23 percent of costs, and other direct costs accounted for 11 percent of costs.
The DCO costs, which might include a combination of labor and other direct costs, were quite small, about 1 percent of the total. We also examined the proportion of costs that were paid to DCOs among only the 34 CCBHCs that had DCOs. Among these clinics, the proportion of total costs that were paid to DCOs ranged from 0.02 percent to 14.6 percent, and averaged 2.3 percent. The percentage of costs allocated for direct labor, indirect, other direct, and DCO costs were similar for PPS-1 and PPS-2 states.
The low percentage of costs for DCOs may reflect the fact that CCBHCs elected to provide most services directly rather than through a DCO. Based on the DY1 CCBHC progress reports, roughly one-third of CCBHCs provided emergency crisis intervention or 24-hour mobile crisis teams through a DCO relationship, and only 21 percent provided crisis stabilization through a DCO. For all other required CCBHC services, fewer than 10 percent of CCBHCs provided the service through a DCO. The extent to which CCBHCs utilized the DCOs is unclear from the cost reports and our interviews with state officials. However, it is notable that CCBHCs often reported providing a required service and contracting with a DCO for the service, and therefore it seems likely that DCOs may have only served a subset of CCBHC consumers. For example, in DY1, 88 percent of CCBHCs reported providing emergency crisis services directly, suggesting that they provided these services to some consumers but also contracted with a DCO to supplement their crisis services (for example, to serve clients outside of regular office hours). As a result, the low DCO costs could also be the result of a low-volume of consumers referred to the DCOs.
| FIGURE III.5. Major Cost Components Across All Clinics in DY1 |
|---|
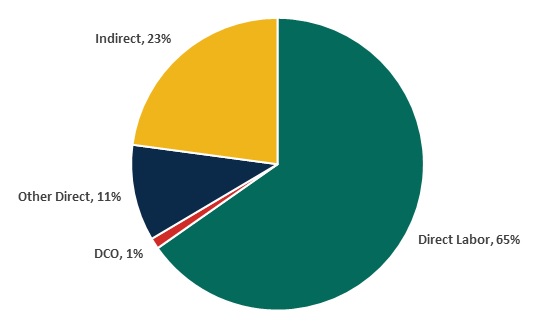 |
| SOURCE: Mathematica and the RAND Corporation analysis of DY1 CCBHC cost reports. |
We focus in some detail on direct labor costs because they were by far the largest single cost category. Figure III.6 shows the variation across and within states in the proportion of total clinic costs that were devoted to direct labor costs. The state averages are all in a narrow range between 60 percent and 69 percent. However, for several states, there was wide variation across clinics in the proportion of costs allocated to direct labor, with clinics in Minnesota showing the widest range.
| FIGURE III.6. Proportion of Clinic Costs Allocated to Direct Labor in DY1 by State |
|---|
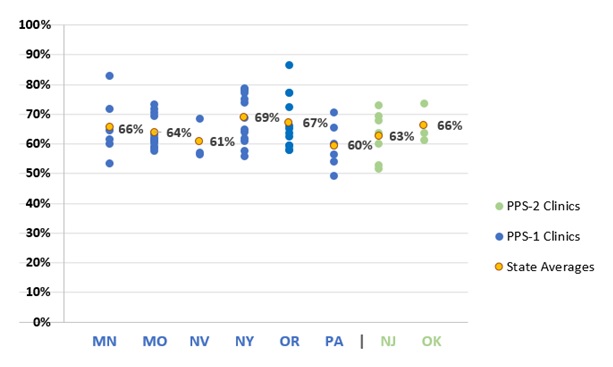 |
| SOURCE: Mathematica and the RAND Corporation analysis of DY1 CCBHC cost reports. |
Staff classifications. As described above, CCBHCs differed in how they reported the types of staff they employed. We classified staff into five categories that could be applied across all states. Figure III.7 shows the proportions of total costs for each category of staff. The figure combines information on the PPS-1 and PPS-2 states, which were very similar in this regard. Appendix C contains staff costs for PPS-1 and PPS-2 states separately.
Labor costs for professional staff comprised about 29 percent of costs, with psychiatrists and other medical doctor staff comprising 19 percent and other non-medical doctor professional staff (for example, psychologists) comprising the remaining 10 percent. Roughly equal portions of the total costs were for staff with a Bachelor of Arts (BA) degree or a BA degree plus some additional clinical license or master's degree. Less than 10 percent of costs were for staff with less than a BA degree.
| FIGURE III.7. Proportion of Labor Costs by Staff Category Across All Clinics |
|---|
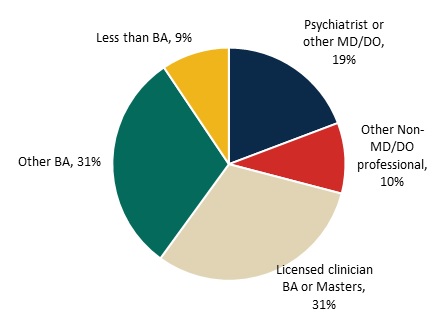 |
| SOURCE: Mathematica and the RAND Corporation analysis of DY1 CCBHC cost reports. |
D. How did Visit-Day and Visit-Month Rates Compare with Actual Visit-Day and Visit-Month Costs Incurred during DY1?
In seven of the eight demonstration states, the rate per visit-day or per visit-month was higher on average than the cost per visit-day or per visit-month during DY1 (Figure III.8). We observed this finding for 49 of the 66 CCBHCs. As illustrated in Figure III.8, four of the eight states had rates that, on average, were no more than 10 percent higher than costs, and four of the states had rates on average more than 10 percent higher than costs (ranging from 18 percent to 48 percent above costs). In Oregon and New Jersey, the rates were similar to cost average, but the rate to cost ratio varied widely across clinics. In contrast, the rate to cost ratios for Missouri CCBHCs are closely grouped around the state average.
| FIGURE III.8. DY1 Rates as Percent Above or Below DY1 Costs Per Visit-Day or Per Visit-Month for Clinics by State |
|---|
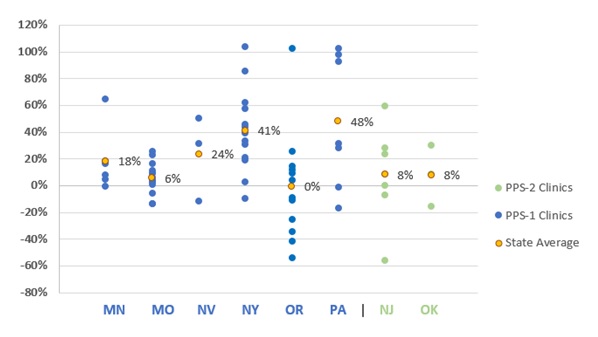 |
| SOURCE: Mathematica and the RAND Corporation analysis of DY1 CCBHC cost reports. NOTES: A positive percentage indicates how much the rate was greater than the cost and negative percentages indicates how much the rate was less than the cost. |
To understand the potential reasons for divergence of the rates from the actual DY1 costs, it is important to remember that the rates were calculated by dividing the total anticipated costs of operating the clinic by the anticipated number of visit-days or visit-months, depending on the PPS. Therefore, the rates could differ from the actual DY1 costs if either the anticipated costs or the anticipated visit-days or visit-months differed from the actual DY1 total costs or total visit-days or visit-months. We were unable to conduct a direct comparison between the rate calculations and the actual costs per visit-day or visit-month. However, we can infer, based on evidence described above and in our prior report on implementation, that there were differences between the anticipated and actual DY1 values for both the total costs and the total numbers of visit-days or visit-months. In both cases, the differences would tend to lead to the rates exceeding the costs, for reasons described below.
First, as described above, state officials indicated in our interviews that the rates were set under the assumption, known to be unrealistic, that the CCBHCs would be fully staffed throughout the demonstration project. This was important to do so that CCBHCs would not be constrained in hiring. However, there would be periods of time when staff positions would be empty, due to normal challenges of hiring staff and regular turnover. If staff positions went unfilled, the clinic would have lower costs than had been anticipated and their costs would be lower than their rate.
Second, as we described in a separate report, CCBHCs made efforts to increase access to services. This included the introduction of "open-access" systems where consumers could receive same-day appointments. During site visits, several CCBHCs reported increases in the volume of consumers they see. Visit-days and visit-months would also increase if consumers were seen more frequently, on average, than the historical records would suggest. If the number of consumer visits increased, while the costs were relatively constant, the actual costs per visit-day or visit-month would be lower than had been anticipated. Moreover, if the staffing costs were lower than anticipated while the number of visit-days or visit-months were greater than anticipated, the divergence between the rates and costs would be magnified.
In the above analyses, we assumed that the costs that clinics reported after DY1 were in fact accurate and allowable. If we examined costs more closely, some reported costs, visit-days, and visit-months might not be strictly allowable under demonstration rules; such vetting of the quality of clinics' reported data was beyond the scope of this project. Some clinics may have also failed to report data that could have increased their allowable costs. For example, one clinic in Oregon reported zero indirect costs, but it is likely that they had at least some allowable indirect costs in DY1. In short, we do not know the extent to which data quality issues may distort DY1 actual costs; we simply used cost, visit-day, and visit-month data as reported.
E. Did States Change DY2 Rates Based on the Experience of DY1?
States were able to raise or lower the payment rates for some or all their CCBHCs for DY2 to bring rates into closer alignment with costs. The states could use a combination of re-basing (that is, re-calculation of the rates based on the DY1 cost reports), and/or inflation adjustment, using the MEI, a measure of inflation in the health care sector. State officials reported in phone interviews their decisions for re-basing and/or adjusting rates between DY1 and DY2. Six of the demonstration states re-based CCBHC rates: Minnesota, New Jersey, New York, Nevada, Oklahoma, and Pennsylvania.
-
State officials in Oklahoma reported using data from just the fourth quarter of DY1 to set new rates for DY2 because they observed a lot of ramping up during the first three-quarters of the year and thought costs would be better reflected in the fourth quarter.
-
Pennsylvania officials decided to re-base clinic rates between DY1 and DY2 based on their analyses of interim and DY1 cost reports, which indicated differences between the DY1 rates and costs.
-
New York officials initially planned to only make an MEI adjustment for DY2, but they changed this plan after deciding to continue the CCBHC model beyond the two-year demonstration project. To inform future CCBHC rates, state officials worked with the state finance team and the CCBHCs to re-base rates for DY2.
-
State officials from Minnesota, New Jersey, and Nevada reported that during the re-basing process most clinics' rates were close to actual costs. However, for those clinics with rates that were not close, state officials were glad to re-base between DY1 and DY2.
-
Oregon and Missouri chose to only adjust the rates between DY1 and DY2 based on MEI. These state officials explained that their decisions to adjust rates, not re-base, were related to not feeling comfortable with the length of time and the availability of cost, utilization, and staff hiring data to appropriately inform re-basing the rates. Additionally, Missouri state officials felt that it would be difficult to re-base rates for all 15 of their CCBHCs.
Summary. The cost reports and the rate-setting process are important parts of the CCBHC model, and they remain both innovative and challenging for the public mental health sector. Cost-reporting during DY1 was challenging for clinics and required technical assistance from states. However, the effort was largely successful, judging from the overall quality of the cost report data. This success demonstrates that cost-reporting by CCBHCs is feasible on a broader scale, presuming that CCHBCs receive technical assistance to establish the required expertise. Completing the DY1 cost reports was an important learning experience for clinics and the beginning of a more robust data source for the setting of future payment rates. Similarly, the demonstration states lacked detailed historical information from which they could estimate the PPS rates, but the experience of DY1 and the cost report data provide a stronger basis for these rates for DY2.
IV. REPORTING OF QUALITY MEASURES
This chapter describes CCBHCs' and states' experiences collecting and reporting quality measures for the demonstration, as well as the ways in which measures have been used to support quality improvement efforts over the course of the demonstration. Quality measure reporting provided clinics and state officials with standardized metrics to monitor the quality of care and inform quality improvement efforts. In addition, quality measure reporting has an important role in the context of the PPS through which the CCBHCs are reimbursed for services. In a PPS, where payment is not linked to the provision of specific services, providers are paid the same amount regardless of the procedures they administer. In this context, quality measurement provides an alternative form of accountability, ensuring that quality of care does not suffer. Quality care is also incentivized in the demonstration through QBPs that are awarded to CCBHCs that meet or exceed state-specified performance thresholds assessed by performance on specified quality measures. Therefore, it is important to understand the experiences of the CCBHCs with reporting quality measures to inform the design of future payment systems in the specialty mental health sector.
The CCBHC criteria specify 21 quality measures for the demonstration. The CCBHCs report on nine of the measures, based on clinical data typically derived from EHRs or other electronic administrative sources. The states report on the other 12 measures, based on Medicaid claims and encounter data and other accessible data sources. Table IV.1 summarizes the measures that CCBHCs and states are required to report for the demonstration. CCBHC-reported quality measures focus on initial evaluation, preventive care and screening, and depression. Most required CCBHC-reported measures are process measures, which focus on how well the clinics are doing with respect to service provision targets (for example, whether screening and services were provided, whether follow-up occurred, time to initial evaluation, etc.); one measure, remission from depression, pertains to service outcomes. State-reported quality measures focus on housing status, screening and treatment of specific conditions, follow-up and readmission, and consumer and family experiences of care. In addition to the required quality measures, demonstration states had the authority to require additional measures for participating CCBHCs, based upon state-specific areas of focus and/or identified needs of consumers served by CCBHCs. Individual CCBHCs could also choose to collect data on additional measures based upon clinic-specific goals and areas of focus.
| TABLE IV.1. Required CCBHC and State-Reported Quality Measures | ||
|---|---|---|
| Potential Source(s) | Measure Steward | |
| Required CCBHC-Reported Measures | ||
| Number/percent of new clients with initial evaluation provided within 10 business days, and mean number of days until initial evaluation for new clients | EHR, Electronic scheduler | SAMHSA |
| Preventive care and screening: Adult body mass index screening and follow-up | EHR, Patient records | CMS |
| Weight assessment and counseling for nutrition and physical activity for children/adolescents | EHR, Encounter data | NCQA |
| Preventive care & screening: Tobacco use -- screening & cessation intervention | EHR, Encounter data | AMA-PCPI |
| Preventive care and screening: Unhealthy alcohol use -- screening and brief counseling | EHR, Patient records | AMA-PCPI |
| Child and adolescent major depressive disorder: SRA | EHR, Patient records | AMA-PCPI |
| Adult major depressive disorder: SRA | EHR, Patient records | AMA-PCPI |
| CDF-A | EHR, Patient records | CMS |
| Depression remission at 12 months | EHR, Patient records, Consumer follow-up with standardized measure (PHQ-9) | Minnesota Community Measurement |
| Required State-Reported Measures | ||
| Housing status (residential status at admission or start of the reporting period compared to residential status at discharge or end of the reporting period) | Uniform reporting system | SAMHSA |
| Follow-up after emergency department for mental health | Claims data/encounter data | NCQA |
| Follow-up after emergency department for alcohol or other dependence | Claims data/encounter data | NCQA |
| PCR-AD | Claims data/encounter data | NCQA |
| Diabetes screening for people with schizophrenia or bipolar disorder who are using antipsychotic medications | Claims data/encounter data | NCQA |
| Adherence to antipsychotic medications for individuals with schizophrenia (SAA-BH) | Claims data/encounter data | CMS |
| Follow-Up After Hospitalization for Mental Illness (FUH), ages 21+ (adult) | Claims data/encounter data | NCQA |
| FUH, ages 6-21 (child/adolescent) | Claims data/encounter data | NCQA |
| Follow-up Care for Children Prescribed ADHD Medication (ADD) | Claims data/encounter data | NCQA |
| Antidepressant medication management (AMM-A) | Claims data/encounter data | NCQA |
| IET | EHR, Patient records | NCQA |
| Patient experience of care survey and family experience of care survey | MHSIP Survey | SAMHSA |
| SOURCE: Substance Abuse and Mental Health Services Administration. "Criteria for the Demonstration Program to Improve Community Mental Health Centers and to Establish Certified Community Behavioral Health Clinics." Rockville, MD: SAMHSA, 2016. Available at https://www.samhsa.gov/sites/default/files/programs_campaigns/ccbhc-criteria.pdf. Accessed July 26, 2019. NOTES: Measure Steward is the organization that is responsible for maintaining documentation on the justification, evidence, specifications, use, and results of a particular measure. |
||
A. To What Extent do States and CCBHCs Expect to Succeed in Collecting and Reporting Data on the Quality Measures According to the Prescribed Specifications?
CCBHCs made changes to data infrastructure and clinical processes to support reporting. As a result of the CCBHC certification process, nearly all CCBHCs across all states made changes to their EHRs or HIT systems to support quality measure and other reporting. Progress report data from DY1 showed that 97 percent of CCBHCs (n = 65) reported changing their EHR or HIT systems to meet CCBHC certification requirements, and 33 percent (n = 22) adopted a new EHR or HIT system as part of the CCBHC certification process. The most commonly reported changes with respect to EHR/HIT were modification of EHR/HIT specifications (for example, data fields; forms) to support collection and output of data required for quality measure reporting, and the addition of features to allow electronic exchange of clinical information with DCOs and other external providers. This underscores the importance of building-out technological infrastructure to support data collection for mandated quality reporting.
Many features of EHR/HIT systems that CCBHCs reported having in place in DY2 progress reports directly supported calculation of clinic-led quality measures. For example, all clinics reported including mental health, SUD, and care coordination records in EHR/HIT systems. However, as of DY2, not all EHR/HIT systems contained all necessary information to readily compute all quality measures. For example, only 56 percent of clinics reported that their EHR/HIT system contained primary care records; this may have introduced challenges for some CCBHCs (for example, need to merge/reference multiple data sources) when generating quality measures that are likely to rely on data from primary care records (for example, body mass index screening and follow-up). Table IV.2 shows the number and percentage of CCBHCs that reported having various EHR/HIT system features in place in DY2 progress reports.
| TABLE IV.2. Features of CCBHC EHR and HIT Systems | ||
|---|---|---|
| Feature | CCBHCs Reporting "Yes" in 2019 | |
| N | % | |
| Contains mental health records | 66 | 100% |
| Contains SUD records | 66 | 100% |
| Contains case management or care coordination records | 66 | 100% |
| Electronic prescribing | 63 | 95% |
| Generates electronic care plan | 61 | 92% |
| Quality measure reporting capabilities | 61 | 92% |
| Clinical decision support | 54 | 82% |
| Incorporation of laboratory results into health record | 53 | 80% |
| Communication with laboratory to request tests or receive results | 38 | 58% |
| Contains primary care records | 37 | 56% |
| Electronic exchange of clinical information with other external providers | 30 | 45% |
| Electronic exchange of clinical information with DCOs | 20 | 30% |
| SOURCE: CCBHC Annual Progress Report DY2 data collected by Mathematica and the RAND Corporation, March 2019. | ||
State officials reported investing considerable resources prior to the demonstration launch to ensure that participating CCBHCs had appropriate data systems in place to meet the quality reporting requirements. Clinics also focused their efforts on readying data systems during the certification process. For example, officials in New York and Pennsylvania reported that they conducted extensive training and technical assistance prior to the demonstration that included an emphasis on HIT/EHR preparation. Other states implemented new state-level reporting systems during the early phase of the demonstration to help facilitate information exchange between disparate data systems and to streamline the reporting process. For example, CCBHCs in Missouri utilize the statewide Care Manager system, which integrates consumer data from various sources and provides a secure portal for CCBHC care management/coordination staff. The state piloted the system during the CCBHC planning grant period, and the state conducted extensive training and technical assistance with CCBHCs leading up to and following the demonstration launch to ensure that CCBHC staff members were prepared to utilize the system.
CCBHCs introduced standardized screening tools to facilitate data collection. To support standardized data collection on required CCBHC quality measures, many clinics also modified approaches to screening and the use of standardized tools to assess specific indicators. During CCBHC site visits, nearly all sites reported using standardized screening tools to assess key metrics. For example, a number of interviewees reported implementing the Suicide Risk Assessment (SRA) (both adult and child/adolescent versions) tool to assess suicide risk and the Patient Health Questionnaire (PHQ-9) to assess symptoms of depression. This is not surprising, as data on symptoms of depression (for example, the PHQ-9) are used for the depression remission at 12 months quality measure. In many instances, interviewees reported that similar screening tools had been used prior to the CCBHC demonstration period to assess key outcomes of interest. However, virtually all sites reported implementing changes to screening protocols (for example, the frequency with which screenings were conducted) and use of screening data in clinical practice, including how and where results were displayed in a consumer's chart. At the clinic-level, these changes were typically accompanied by extensive staff trainings and frequent data reviews to ensure provider compliance with screening and data entry procedures.
CCBHCs encountered challenges with quality measure data collection and reporting. In interviews, state officials reported very few issues with reporting state-required measures. Among the few states that reported challenges, notable challenges pertained to acquiring data on consumer and family experience of care. This was attributed to difficulty extracting information from existing data systems and consumer non-response. That states experienced relatively few challenges reporting state-required measures may be attributable to the fact that the majority of state-required measures are drawn from claims and encounter data, and all states had prior experience collecting data for two of the three remaining measures (namely, housing status and consumer and family experience) to meet the HHS Substance Abuse and Mental Health Services Administration (SAMHSA) Community Mental Health Block Grant reporting requirements. In contrast, multiple state officials noted that the reporting process itself and/or the types of CCBHC-reported measures collected were new to many CCBHCs. As one interviewee in the final round of telephone interviews stated, "this is all really brand new to most of the clinics, the quality measure reporting."
The data collection and reporting challenges state officials identified generally pertained to the CCBHC-reported measures. Despite extensive support and technical assistance during the certification process leading up to the demonstration launch, many CCBHCs experienced challenges with collecting data on quality measures in the early stages of the demonstration. In interviews with state officials during DY1, all states reported that many clinics initially experienced challenges with their EHR/HIT systems, particularly with respect to collecting and aggregating data needed to generate quality measures (for example, querying databases to specify the correct numerators and denominators within a given timeframe; ensuring that fields were correctly specified in all records to allow for aggregate reports to be generated directly from the EHR/HIT system rather than having to transfer data to intermediate files to generate necessary metrics).
State officials most often reported challenges associated with CCBHCs' lack of familiarity with the required measures and difficulty obtaining certain variables, such as new service codes or new population subgroups, from clinic EHRs. For example, state officials from Minnesota and New York said that some CCBHCs were having technical difficulty querying some service and client count data in EHRs to extract data for quality measure calculation. These challenges tended to be idiosyncratic to individual CCBHCs, varying widely depending upon the data system that a clinic used prior to the CCBHC demonstration, specific design features and protocols/processes used for data collection, and the nature and extent of modifications. In some cases, changes to EHR/HIT systems to support CCBHC data collection and reporting were more challenging and labor intensive than states and clinics had anticipated during the certification process. Many CCBHCs experienced unanticipated delays with respect to EHR/HIT modifications. As noted by one of the state official interviewees, some of these delays were seen as being outside of the CCBHCs' or states' control (for example, due to EHR/HIT vendor-related issues, such as delays in implementing requested changes/upgrades and/or responding to queries): "We didn't anticipate--and the [CCBHCs] acted in good faith and didn't anticipate--some of the delays with the vendors. The vendors did some over promising and under delivering, particularly around the timelines and deadlines."
To overcome these challenges CCBHCs relied upon ad hoc strategies to facilitate data collection and reporting, and these strategies were often laborious and time-consuming. For example, in the early stages of implementation, some CCBHCs in Minnesota relied on paper records while an old EHR system was being transitioned out, and then the paper records were transferred into the new EHR system after the demonstration launch. In New York, some CCBHCs previously recorded and reported some quality measures on paper--or not at all because some of the quality measures required were not monitored--and CCBHCs needed to build them into their EHRs. Interviewees on CCBHC site visits echoed similar issues with data collection. For example, multiple data systems staff cited ongoing challenges with EHR systems in outputting the necessary numerators or denominators to generate required metrics for quality reporting. In some cases, staff members resolved these issues by computing metrics "by hand" in intermediate data files, which were then used to generate quality measures. In some instances, the data management labor associated with these workarounds was considerable, exceeding expectations of CCBHC administrators.
Most state officials were unable to comment on the specific quality measures that CCBHCs found challenging to report. However, in the final round of telephone interviews, state officials from Minnesota, New Jersey, and Oklahoma reported that CCBHCs continued to experience some challenges with collecting information on depression remission, primarily due to challenges with extracting follow-up data from EHRs and concerns regarding operational definitions of remission based on specific screening tools (for example, score of >= 5 on the PHQ-9). Similarly, information gathered from CCBHC site visit interviews supported the notion that challenges with quality reporting tended to be driven by site-specific data system issues; across clinics, staff did not systematically report that any given measure was more challenging to report than any other.
States reported providing extensive technical assistance to CCBHCs on data collection and reporting for quality measures. During the demonstration period, states and sponsoring agencies provided ongoing support to CCBHCs in collecting and reporting the quality measures. State officials organized training webinars and ongoing direct technical assistance through multiple channels (phone, online, in-person) to: (1) explain the measures and the information needed from the CCBHCs to report on each of them; (2) provide examples of how to extract information and calculate measures from EHR data (for example, what queries to run; what numerators and denominators to use; etc.); and (3) explain how to complete the reporting template.
For example, officials in New York conducted a webinar to review the process for reporting CCBHC-level quality measures using the reporting template and created and distributed a list of frequently asked questions to all CCBHCs in the state. New York officials also reported conducting quarterly phone calls with each CCBHC to assess progress and identify common issues with data collection and reporting; as new issues are identified, the state updates and circulates guidance documents to all CCBHCs. Officials in Pennsylvania and Missouri convened monthly group meetings with CCBHC data managers to discuss data collection and reporting issues, share lessons learned and best practices, and provide ongoing technical assistance for data collection and reporting. Further, in most states, state Medicaid agencies conducted "test" data collection efforts with CCBHCs in an effort to forestall and check for missing and inaccurate data and issues with the collection and reporting process for CCBHC-reported measures.
By the final round of telephone interviews, conducted toward the end of the two-year demonstration period, officials in most states reported that the vast majority of clinics that had experienced early EHR/HIT challenges had either resolved those issues or had developed appropriate workarounds to facilitate timely and accurate reporting of the required measures. For example, one official in New York noted that: "At the end of demonstration year one, all of the clinics were in a good place. In DY1, there were struggles with the vendors getting the EHR ready. Now in DY2, we are seeing good data reporting."
These improvements were generally attributed to extensive technical assistance provided by the states in conjunction with national partners and EHR/HIT vendors. As reported by one official in Pennsylvania: "The state began group meetings very early in the planning and DY1 and built a culture of group support. We took a funnel approach with technical capacity. There has been an extreme amount of technical support to the clinics to be able to adhere to the measures." Interviewees from multiple states highlighted the extensive efforts undertaken by CCBHC staff members at the clinic-level to create and implement procedures to successfully generate required quality measures from EHR data systems.
B. How have CCBHCs and States Used Performance on the Quality Measures to Improve the Care They Provide?
Although the CCBHC criteria did not include explicit requirements that CCBHCs or states use the quality measure data to monitor or improve the quality of care they provide, both state officials and CCBHCs reported a wide range of quality improvement efforts through which they used the quality measure data they collected. Officials in all states reported using quality measures data to support ongoing monitoring and oversight of CCBHCs (for example, to assess compliance with certification criteria). Multiple state official interviewees also reported reviewing aggregate data regarding performance on quality measures across CCBHCs in their state to better understand the challenges and technical assistance needs of individual clinics.
Efforts to share data on CCBHC performance on quality measures among CCBHCs and with other state agencies varied by state. Some states implemented formal systems for sharing aggregate quality measures data with CCBHCs to provide them with "benchmarks" for different measures. For example, in DY2, Pennsylvania established and launched a dashboard system for all CCBHCs in the state, which displayed figures to visualize quarterly CCBHC-level quality measure data for all CCBHCs in the state, so that clinics can monitor their performance in different domains and compare themselves with other CCBHCs. Many state officials reported having formally or informally shared information on clinic-specific performance on the quality measures relative to other CCBHCs in the state during collaborative meetings. For example, officials in Missouri noted that, in response to requests from CCBHC leaders, they had shared such data with the CCBHCs to inform quality improvement and technical assistance plans.
State officials also reported that most CCBHCs utilize quality measures data to inform quality improvement efforts. For example, some CCBHCs produce internal reports of performance on quality measures to examine trends over time, determine areas for improvements, and monitor the impact of quality improvement efforts. Consistent with reports from state officials, data from CCBHC progress reports indicated that a majority of clinics utilized CCBHC quality measures to inform clinical practice. In DY1, when CCBHCs were in the early stages of using the information from quality measures to improve care, 79 percent of CCBHCs (n = 53) reported using the quality measure data to support changes in clinical practice. The number of clinics that used quality data to inform clinic improvements increased over time, with 89 percent of CCBHCs (n = 59) reporting that they used quality measures to support changes in clinical practice in DY2 (2019).
In both DY1 and DY2, states varied in the proportion of CCBHCs that used the CCBHC-reported quality measures to support changes in clinical practice (see Table IV.3). Within each state, the percentage of CCBHCs using quality measures to support changes in clinical practice either stayed the same or increased from 2018 to 2019.
| TABLE IV.3. Percentage of CCBHCs that Used Demonstration Quality Measures to Support Changes in Clinical Practice by State | ||||||||
|---|---|---|---|---|---|---|---|---|
| Demonstration Year | MN | MO | NJ | NV | NY | OK | OR | PA |
| 2018 | 67% | 87% | 86% | 25% | 77% | 100% | 92% | 71% |
| 2019 | 83% | 93% | 100% | 67% | 77% | 100% | 92% | 100% |
| SOURCE: DY1 and DY2 CCBHC Annual Progress Reports collected by Mathematica and the RAND Corporation, March 2018 and 2019. | ||||||||
Based on open-ended responses in progress reports, CCBHCs appeared to utilize the full range of CCBHC quality measures to support quality improvements, although clinics' use of the measures varied considerably depending on site-specific areas of focus. For example, more CCBHCs reported using data on depression and suicide screening and time to initial evaluation to support quality improvements than the other CCBHC-reported measures. Specifically:
-
Twenty-six percent (n = 14) reported using SRA and prevention measures, such as the Columbia Suicide Severity Rating Scale, in routine practice and providing staff training on the measures.
-
Nineteen percent (n = 10) reported increasing the consistency with which they used measures to screen for depression (especially the PHQ-9) and the frequency with which they conducted follow-up assessments using such measures.
-
Seventeen percent (n = 9) described using measures related to reducing time between client intake and initial evaluation to ensure that clients received timely care.
CCBHCs have used diverse methods to implement changes in response to performance on quality measures, including hiring more providers, expediting intake and assessment processes, and hiring external consultants to help implement changes. For example, Oregon state officials said that one of the CCBHCs noticed numbers were very low for one of their population health measures (note: officials did not specify which measure) and, subsequently, hired a consultant to address the issue indicated by the quality data.
C. What Measures and Thresholds did States Use to Trigger QBPs in DY1?
CMS required the use of six quality measures to trigger bonus payments to CCBHCs (two of the CCBHC-reported measures and four of the state-reported measures; see Table IV.4). In addition to these six measures, CMS allowed (but did not require) states to use five additional measures to trigger bonus payments. CMS allowed states to define the thresholds of quality measure reporting or performance that would trigger the bonus payments.
In DY1, all demonstration states except Oregon offered bonus payments tied to quality measures to CCBHCs:
-
Pennsylvania, Missouri, New Jersey, and Oklahoma used only the six CMS-required measures to determine bonus payments.
-
Minnesota, Nevada, and New York used the CMS-optional measure for Plan All-Cause Readmission Rate (PCR-AD) in determining QBPs in addition to the six required measures.
-
In addition to the six required measures, Minnesota used the CMS-optional measure Screening for Clinical Depression and Follow-Up Plan (CDF-A) in determining bonus payments.
-
In addition to the six required measures, New York used two state-specific measures that they calculated using state data on suicide attempts and deaths from suicide.
| TABLE IV.4. Quality Measures Used to Determine Quality Bonus Payments in DY1 | ||
|---|---|---|
| Required or Optional for Determining QBPsa |
States with QBPs that Used the Measure to Determine QBPsb |
|
| CCBHC-Reported Measures | ||
| Child and adolescent major depressive disorder: SRA (SRA-BH-C) | Required | All |
| Adult major depressive disorder: SRA (SRA-BH-A; NQF-0104) | Required | All |
| CDF-A | Optional | MN |
| Depression Remission at 12 months (NQF-0710) | Optional | None |
| State-Reported Measures | ||
| Adherence to Antipsychotic Medications for Individuals with Schizophrenia (SAA-BH) | Required | All |
| FUH, ages 21+ (adult) (FUH-BH-A) | Required | All |
| FUH, ages 6-21 (child/adolescent) (FUH-BH-C) | Required | All |
| IET-BH | Required | All |
| PCR-AD | Optional | MN, NV, NY |
| ADD-C | Optional | None |
| AMM-A | Optional | None |
| SOURCE: "Appendix III - Section 223 Demonstration Programs to Improve Community Mental Health Services Prospective Payment System (PPS) Guidance" Available at https://www.samhsa.gov/sites/default/files/grants/pdf/sm-16-001.pdf#page=94. Accessed July 26, 2019) and data from interviews with state Medicaid and behavioral health agency officials conducted by Mathematica and the RAND Corporation, February 2019. NOTES:
|
||
With the exception of New Jersey (described below), all of the states providing QBPs in DY1 planned to equally consider performance on all of the measures they selected in determining whether to award a QBP. States varied in other features of their QBP thresholds and determination processes:
-
Minnesota planned to identify minimum performance thresholds during DY1 for each of their selected measures. Due to the absence of state-specific historical performance data and lack of comparable regional or national benchmark data on the adult and child SRA measures (SRA-BH-A and SRA-BH-C), Minnesota planned to collect and analyze data from the initial six months of the demonstration to inform its decisions regarding the minimum performance level for these measures.
-
Missouri planned to use prior year statewide Missouri Department of Mental Health averages as the minimum performance threshold, if such data were available by the end of the first quarter of DY1. If not available, then Missouri would substitute published national rates for the most recent time period available. Payments would be triggered if a clinic performed above the threshold or showed improvement over its own prior year rate during the DY.
-
Nevada clinics were eligible to receive QBPs just for submitting data on all measures in DY1, which the state used to establish a benchmark by which to assess progress and make DY2 QBPs. In DY2, Nevada clinics must submit data on all measures to earn a portion of the bonus payment and also meet the performance thresholds to earn the remaining portion of the bonus payment. The DY2 performance thresholds require CCBHCs to either meet state-specified improvement goals for each measure or improve on the measures from DY1 to DY2 by at least a 10 percent reduction in the gap between DY1 performance and the improvement goal. Four of the state-specified improvement goals are based on Healthcare Effectiveness Data and Information Set (HEDIS) National Medicaid averages.
-
New Jersey planned to weight one measure--Initiation and Engagement of Alcohol and Other Drug Dependence Treatment (IET-BH)--more heavily than the others to further incentivize the CCBHCs in the state to address the state's goal of increasing screening and engagement of the CCBHC population in SUD treatment. At the time of the last interview with New Jersey state officials, they had not completed the QBP determination processes for DY1.
-
New Jersey planned to use HEDIS National Medicaid averages, where available, as the performance thresholds. Where an appropriate national average is not available, New Jersey planned to create a sliding scale based on CCBHC data, with the lowest scoring CCBHC receiving no payment and the highest scoring CCBHC receiving maximum payment for that measure.
-
New York planned to establish performance thresholds for each measure using existing data from providers or paid Medicaid claims. They planned to use a similar process to establish thresholds for DY2 using DY1 data. New York CCBHCs will be eligible for QBPs if performance thresholds are met for all nine of the state's selected measures. The thresholds are unique for each measure and range from 0 percent improvement (maintaining the minimum performance threshold level) to 10 percent improvement.
-
Oklahoma planned to collect and analyze data from the initial six months of the demonstration to establish minimum performance thresholds for DY1 for each required measure. At the time of the last interviews with state officials, threshold details were still being finalized.
-
Pennsylvania planned to use prior year data to determine DY1 performance thresholds for four of the six required measures. Because prior data did not exist for the SRA-BH-A and SRA-BH-C measures, the state used data from the initial six months of the demonstration to determine DYI thresholds for these measures. DY1 data will be used to determine the DY2 thresholds for all required measures. The state requires CCBHCs to improve on each measure by at least 1 percent each year to be eligible for the incentive payment tied to that measure. Payments could be higher for improvement greater than 1 percent. For example, 1 percent above threshold on the SRA-BH-A measure would earn 10 percent of the incentive payment tied to that measure, whereas 10 percent above the threshold would earn 100 percent of the payment tied to that measure.
All seven states providing QBPs reported that they were the funding source for the QBPs (for example, state general revenues or state appropriations). However, the amount of funds states planned to make available for QBPs varied. As shown in Table IV.5, New Jersey planned to set aside the least funding for QBPs ($350,000 per DY), and Missouri planned to set aside the most ($4.2 million per year).
| TABLE IV.5. Estimated Funding Available for QBPs | |
|---|---|
| State | Total Estimated Funding per DY |
| Minnesota | 5% of total payments or approximately $2.5 million |
| Missouri | 1% of total payments or approximately $4.2 million |
| Nevada | 10% in DY1 and 15% in DY2 of total payments or approximately $1.5 million |
| New Jersey | Approximately $350,000 |
| New York | Approximately $2 million |
| Oklahoma | 1% or approximately $1 million |
| Pennsylvania | 3% of total payments or approximately $2.1 million |
| SOURCE: State CCBHC Demonstration Applications Part 3, and data from interviews with State Medicaid and behavioral health agency officials conducted by Mathematica and the RAND Corporation, February 2019. | |
As of February 2019, only two states--Missouri and Nevada--had determined that all clinics in their states met the measure thresholds to receive QBPs for DY1; officials from five states reported that they were still receiving or analyzing data to finalize determinations of QBPs.
Summary. Overall, reporting on quality measures was challenging for CCBHCs, but state officials and CCBHC staff with whom we spoke indicated that they were able to collect the appropriate data and report on the measures. CCBHC-reported measures were generally seen as more challenging to implement than state-reported measures, largely due to technical issues associated with EHR/HIT buildout that impacted clinics' ability to generate data to support these metrics. Technical assistance (particularly during the CCBHC certification process and the early stages of the demonstration) was viewed by state officials and CCBHC staff we interviewed as critical for facilitating successful collection and reporting of quality measurement data. By DY2, nearly 90 percent of CCBHCs reported using CCBHC-required measures to inform changes in clinical practice, and all states reported using quality measures as part of ongoing compliance and performance monitoring and to inform clinics' quality improvement efforts.
V. CONCLUSIONS AND NEXT STEPS
The findings in this report can inform the efforts of federal and state agencies, CMHCs, and other stakeholders in the behavioral health system to plan for and implement future CCBHCs and PPS. This final chapter summarizes key findings. In Summer 2020, we will update this report to include findings from the DY1 quality measures and DY2 cost reports.
Structure of CCBHC payment systems. The structure of the PPS-1 was relatively simple, with a single rate for each day on which a service was provided to a consumer, regardless of the services provided on that day. However, the rates themselves varied considerably across states and across CCBHCs within states. In addition, all but one of the states that used PPS-1opted to provide QBPs.
The PPS-2 systems were more complicated, with different rates for different populations and outlier payments for high cost beneficiaries. The two PPS-2 states differed from each other in two important ways. First, each state defined the populations eligible for the special population rates quite differently. Second, one PPS-2 state chose a much higher threshold for outlier payments than the other. As required for PPS-2, both states established systems for awarding QBPs to CCBHCs that meet specified criteria.
Costs of treating consumers in the CCBHCs. State averages of actual CCBHC DY1 costs per visit-day in PPS-1 states ranged from $167 to $336, and the average blended costs per visit-month in PPS-2 states was $679 in one state and $793 in the other. Costs also varied widely across CCBHCs within states. Two CCBHC characteristics--rural versus urban location and clinic size--were associated with the per visit-day/visit-month costs used to establish the DY1 payment rates and, therefore, the payment rates themselves. In PPS-1, payment rates were lower for clinics in rural areas than those in urban areas. For both PPS-1 and PPS-2, payment rates were lower for clinics that served a higher number of clients versus those that served a smaller number.
The PPS, which reflect the anticipated costs per visit-day or visit-month, tended to be lower than the actual costs per visit-day or visit-month as reported in the DY1 cost reports. Of the 66 CCBHCs, 49 had rates that were above actual costs. Five CCBHCs had rates that exceeded costs by 90 percent or more. There are two likely explanations for this pattern. First, the rates assumed operational costs for fully staffed clinics, while in fact some positions went unfilled due to hiring challenges or staff turnover. Having fewer staff than anticipated would lower total operating costs. Second, states' initial PPS rate calculations may have assumed smaller caseloads, while CCBHCs increased their caseload size through efforts to increase access to care. Increasing the caseload size, the total number of visit-days or visit-months, would also lower costs relative to rates.
State officials were aware of the limitations of the data available to set rates and expected that the rates would vary from costs during the demonstration, with stabilization over time as more accurate data become available. States can use the DY1 cost reports to inform rate adjustments.
Main components of CCBHC costs. As expected, labor was the main component of CCBHC costs: across states labor costs accounted for between 60 percent and 70 percent of total CCBHC costs. DCOs accounted for a very small portion of costs across the entire demonstration project. However, for several clinics, DCOs accounted for greater than 10 percent of total costs; this suggests that DCOs played an important role for these particular clinics.
Collecting and reporting on required quality measures. According to state officials, the CCBHCs and state agencies were successful in collecting and reporting data on the required quality measures to CMS during DY1. However, this success required investments of time and resources in technical assistance and technological infrastructure, particularly at the clinic-level. In addition to technical assistance, some states established learning networks so that CCBHCs could learn from each other as they collected data for the quality measures. Quality measure reporting was the most commonly cited reason for investing in improvements to EHRs during the CCBHC certification process.
CCBHC use of the quality measures to improve quality of care. During the demonstration, some CCBHCs and states not only reported quality measure data to CMS, but also used the data to improve care in a variety of ways. Several states created dashboards to report quality performance data directly back to clinics in a timely fashion. Some dashboards also provide data showing CCBHCs how their performance compares with the performance of other CCBHCs in their state. Some CCBHCs are using quality measurement data to identify areas of low quality for targeted improvement efforts. The requirement that CCBHCs must report data on quality measures to their states encouraged some CCBHCs to introduce additional care monitoring systems to support clinic-specific quality improvement efforts.
Future evaluation activities. In Summer 2020, we will update this report to include findings from the DY1 quality measures and DY2 cost reports. That report will provide updated information for the evaluation questions described in this report. In addition, we plan to address a number of additional evaluation questions related to changes in rates, costs, and cost components over time. We will also examine whether changes to rates were successful in bringing rates into closer alignment with actual costs.
APPENDIX A. PPS-2 POPULATION-SPECIFIC DY1 RATES AND BLENDED RATES ACROSS CLINICS
The tables below show the visit-month rates for each clinic in the two PPS-2 states, New Jersey and Oklahoma. We calculated the blended rates as weighted averages of the standard population and special population rates, with rates drawn from the proportion of visit-months within each category.
For New Jersey Clinic 1, the state assigned three special populations the same rate. In this clinic, there were zero visit-months in two of the three special population categories during the pre-DY1 year for which the cost data were collected. In New Jersey Clinics 5, 6, and 7, two or more special populations were paid at the same rate, and the state set the rate for these special populations by calculating the weighted average of the costs for each special population based on pre-DY1 cost data.
| TABLE A.1. New Jersey CCBHC Rates for DY1 | ||||||
|---|---|---|---|---|---|---|
| Blended Rate | Standard Population | SMI | SUD | PTSD | SED | |
| NJ Clinic 1 | $902 | $1,027 | $845 | $935 | $935 | $935 |
| NJ Clinic 2 | $749 | $516 | $830 | $827 | $758 | $689 |
| NJ Clinic 3 | $646 | $630 | $632 | $667 | $670 | $685 |
| NJ Clinic 4 | $706 | $626 | $750 | $751 | $615 | $488 |
| NJ Clinic 5 | $646 | $460 | $789 | $863 | $661 | $661 |
| NJ Clinic 6 | $793 | $633 | $804 | $800 | $888 | $888 |
| NJ Clinic 7 | $558 | $497 | $582 | $722 | $722 | $722 |
| Average across NJ clinics | $714 | $627 | $748 | $795 | $750 | $724 |
| SOURCE: Mathematica and the RAND Corporation analysis of DY1 CCBHC cost reports. SPECIAL POPULATIONS: The state used primary diagnosis (ICD-9 and ICD-10 codes) from historical claims data to categorize individuals receiving CCBHC services into special populations: SMI, SUD, PTSD, and SED (the state used this term). The New Jersey CCBHC Cost Report Instructions Appendices includes a complete list of the ICD-9 and ICD-10 diagnosis codes the state used to identify these populations. |
||||||
Oklahoma Clinic 2 assigned the same rate to adults and adolescents with SUD. This clinic-reported zero adolescent patients during the pre-DY1 year, when the cost data were collected to set the rates.
| TABLE A.2. Oklahoma CCBHC Rates for DY1 | |||||||
|---|---|---|---|---|---|---|---|
| Blended Rate | Standard Population | High Risk SMI or Co-occurring SUD |
High Risk SED or Co-occurring Condition |
Adults with Significant SUD |
Adolescents with Significant SUD |
Chronic Homelessness or First Time Psychosis Episode for Children and Adults |
|
| OK Clinic 1 | $801 | $686 | $1,022 | $1,187 | $1,250 | $1,178 | $817 |
| OK Clinic 2 | $562 | $533 | $691 | $984 | $749 | $749 | $690 |
| OK Clinic 3 | $748 | $690 | $1,264 | $1,233 | $1,165 | $1,104 | $983 |
| Average across Oklahoma clinics | $704 | $636 | $993 | $1,135 | $1,055 | $1,010 | $830 |
| SOURCE: Mathematica and the RAND Corporation analysis of DY1 CCBHC cost reports. SPECIAL POPULATION 1: High-risk SMI or co-occurring individuals with SMI* or co-occurring SUD, and at least 1 high cost special population** or co-occurring SUD, with no high cost special population and either: 2 non-psychiatric hospital admissions within the fiscal year or 1 psychiatric hospital admission within the fiscal year; or 2 Crisis Center admissions. SPECIAL POPULATION 2: High-risk SED or co-occurring condition SED: SED (as defined in Oklahoma Administrative Code 317:30-5-240.1) or disorders with individual Client Assessment Record scores that meet criteria for Level 3 or a substance use diagnosis; OR a caregiver rated Ohio Scale shows critical impairment (score of 25 and above on the Problems Subscale or a score of 44 and below on the Functioning Subscales; co-occurring conditions defined by: substance use; psychiatric hospitalization within past year; multiple psychiatric hospitalizations, ER use and/or crisis center admissions (at least 2); intensive array of services are in place, including at a minimum case management, therapy, and medication management; chronic physical health condition, such as diabetes, asthma, or other chronic physical health condition; child was in custody of Oklahoma Department of Human Services or Oklahoma Office Juvenile Affairs, or had been in and out of court multiple times within the past six months; or child is at high-risk of out of home/out of school and /or community placement as indicated by an attestation signed by a Licensed Behavioral Health Practitioner. SPECIAL POPULATION 3: ASAM Level of Care 2.1: Intensive outpatient services (age 18 and over) adults who meet the following specifications: Dimension 2 (biomedical conditions or problems exist) and Dimension 3 (if any emotional behavioral, or cognitive conditions, or problems exist), and at least 1 of the following: Dimension 4 (readiness to change), Dimension 5 (relapse, continued use, or continued problem potential), or Dimension 6 (recovery environment). SPECIAL POPULATION 4: Adolescents with significant SUD: ASAM Level of Care 2.1: Intensive outpatient services (age 12-17). Adolescents who meet the stability specifications: Dimension 1 (if any withdrawal problems exist) and Dimension 2 (if any biomedical conditions or problems exist), and at least 1 of the following: Dimension 3 (if any emotional behavioral, or cognitive conditions, or problems exist, Dimension 4 (readiness to change), Dimension 5 (relapse, continued use, or continued problem potential), or Dimension 6 (recovery environment). SPECIAL POPULATION 5: Chronic homelessness or first time psychosis episode for children and adults: An individual with mental health or substance use diagnosis: That meets the HUD Category 1 Definition, OR that meets the first-time psychosis episode criteria. |
|||||||
APPENDIX B. OUTLIER PAYMENTS IN PPS-2 STATES
The PPS-2 systems include an outlier payment, which is intended to reimburse clinics for Medicaid beneficiaries with high costs. The states provide this supplemental payment to a clinic when the costs of providing care for a consumer during a visit-month exceeds a pre-established cost threshold. States set the outlier payment amount and the cost thresholds that trigger the outlier payment. This Appendix provides information on the thresholds that were set in the two states that implemented PPS-2 and the number of payments that were made to each clinic. We gathered the information in this appendix from the DY1 cost reports and additional discussions with state officials.
Appendix Table B.1 summarizes the thresholds for triggering an outlier payment for each special population group. There are separate thresholds set for the standard population and for each special population specified in the states' PPS-2 rate schedule. In DY1, the thresholds in Oklahoma were higher than the thresholds in New Jersey.
| TABLE B.1. Thresholds for Triggering an Outlier Payment in New Jersey and Oklahoma | ||||||
|---|---|---|---|---|---|---|
| Outlier Thresholds | Standard Population | Special Population 1 |
Special Population 2 |
Special Population 3 |
Special Population 4 |
Special Population 5 |
| NJ clinics | $700 | $800 | $1,900 | $1,500 | $1,300 | n/a |
| OK clinics | $1,300 | $2,200 | $2,400 | $2,500 | $2,400 | $1,800 |
| SOURCE: Mathematica and the RAND Corporation analysis of DY1 CCBHC cost reports. NOTE: See Appendix A for definitions of the special populations. |
||||||
There were no outlier payments made to clinics in Oklahoma in DY1. Appendix Table B.2 shows the number of outlier payments made to clinics in New Jersey in DY1. The state made a total of 2,574 outlier payments to CCBHCs during DY1. The number of outlier payments varied across clinics, with two of the seven clinics receiving no outlier payments and two of the clinics receiving over 500 outlier payments.
| TABLE B.2. Number of Threshold Payments Made to Clinics in New Jersey | ||||||
|---|---|---|---|---|---|---|
| Clinic | Standard Population | SMI | SUD | PTSD | SED | Total |
| Clinic 1 | 0 | 0 | 0 | 0 | 0 | 0 |
| Clinic 2 | 37 | 0 | 0 | 0 | 0 | 37 |
| Clinic 3 | 306 | 983 | 207 | 0 | 26 | 1,522 |
| Clinic 4 | 175 | 27 | 0 | 0 | 0 | 202 |
| Clinic 5 | 0 | 0 | 0 | 0 | 0 | 0 |
| Clinic 6 | 72 | 130 | 7 | 6 | 6 | 221 |
| Clinic 7 | 324 | 164 | 97 | 7 | 0 | 592 |
| TOTAL | 914 | 1,304 | 311 | 13 | 32 | 2,574 |
| SOURCE: Mathematica and the RAND Corporation analysis of DY1 CCBHC cost reports. NOTE: See Appendix A for definitions of the special populations. |
||||||
APPENDIX C. DISTRIBUTION OF LABOR COSTS
| FIGURE C.1. Proportion of Labor Costs by Staff Category Across All PPS-1 Clinics |
|---|
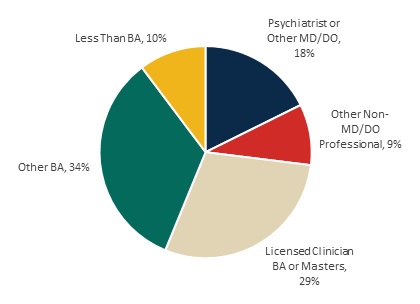 |
| SOURCE: Mathematica and the RAND Corporation analysis of DY1 CCBHC cost reports. |
| FIGURE C.2. Proportion of Labor Costs by Staff Category Across All PPS-2 Clinics |
|---|
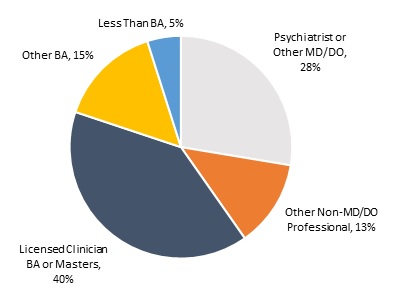 |
| SOURCE: Mathematica and the RAND Corporation analysis of DY1 CCBHC cost reports. |
NOTES
-
Scharf, D.M., et al. (2015). Considerations for the Design of Payment Systems and Implementation of Certified Community Behavioral Health Centers. Santa Monica, CA: RAND.
-
HHS Substance Abuse and Mental Health Services Administration (SAMHSA). "Criteria for the Demonstration Program to Improve Community Mental Health Centers and to Establish Certified Community Behavioral Health Clinics." Rockville, MD: SAMHSA, 2016. Available: https://www.samhsa.gov/sites/default/files/programs_campaigns/ccbhc-criteria.pdf. Accessed July 26, 2019.
-
The nine types of services are: (1) crisis mental health services, including 24-hour mobile crisis teams, emergency crisis intervention services, and crisis stabilization; (2) screening, assessment, and diagnosis, including risk assessment; (3) patient-centered treatment planning or similar processes, including risk assessment and crisis planning; (4) outpatient mental health and substance use services; (5) outpatient clinic primary care screening and monitoring of key health indicators and health risk; (6) targeted case management; (7) psychiatric rehabilitation services; (8) peer support and counselor services and family supports; and (9) intensive, community-based mental health care for members of the armed forces and veterans. CCBHCs must provide the first four service types directly; a DCO may provide the other service types. In addition, crisis behavioral health services may be provided by a DCO if the DCO is an existing state-sanctioned, certified, or licensed system or network. DCOs may also provide ambulatory and medical detoxification in American Society of Addiction Medicine (ASAM) categories 3.2-WM and 3.7-WM.
-
See https://www.samhsa.gov/sites/default/files/ccbh_clinicdemonstrationprogram_071118.pdf.
-
See https://aspe.hhs.gov/report/certified-community-behavioral-health-clinics-demonstration-program-report-congress-2018.
-
Ranallo, P.A., A.M. Kilbourne, A.S. Whatley, & H.A. Pincus. (2016). "Behavioral Health Information Technology: From Chaos To Clarity." Health Affairs 35(6): 1106-1113.
-
As described in detail in the report, the PPS-2 states established rates for the general population and rates for special populations. We calculated an average blended rate by weighting each rate by the number of visit-months in that category in DY1 according to the cost reports and then calculated the average for the clinic. We then calculated the average across the clinics to report a state average.
-
Ashwood, J.S., K.C. Osilla, M. DeYoreo, J. Breslau, J.S. Ringel, C.K. Montemayor, N. Shahidinia, D.M. Adamson, M. Chamberlin, and M.A. Burnam, Review and Evaluation of the Substance Abuse, Mental Health, and Homelessness Grant Formulas. Santa Monica, CA: RAND Corporation, 2019. https://www.rand.org/pubs/research_reports/RR2454.html.
-
Siegwarth, A., R. Miller, J. Little, J. Brown, C. Kase, J. Breslau, and M. Dunbar. "Implementation Findings from the National Evaluation of the Certified Community Behavioral Health Clinic Demonstration." Report prepared for the U.S. Department of Health and Human Services, Office of the Assistant Secretary for Planning and Evaluation. Washington, DC: Mathematica Policy Research, June 2019.
-
Scharf, D.M., et al. (2015). Considerations for the Design of Payment Systems and Implementation of Certified Community Behavioral Health Centers. Santa Monica, CA: RAND.
-
Ashwood, J.S., K.C. Osilla, M. DeYoreo, J. Breslau, J.S. Ringel, C.K. Montemayor, N. Shahidinia, D.M. Adamson, M. Chamberlin, and M.A. Burnam, Review and Evaluation of the Substance Abuse, Mental Health, and Homelessness Grant Formulas. Santa Monica, CA: RAND Corporation, 2019. https://www.rand.org/pubs/research_reports/RR2454.html.
EVALUATION OF THE CERTIFIED COMMUNITY BEHAVIORAL HEALTH CLINIC DEMONSTRATION PROGRAM
These reports were prepared under contract #HHSP233201600017I between HHS's ASPE/BHDAP and Mathematica Policy Research to conduct the national evaluation of the demonstration. For additional information about this subject, you can visit the BHDAP home page at https://aspe.hhs.gov/bhdap or contact the ASPE Project Officer, Judith Dey, at HHS/ASPE/BHDAP, Room 424E, H.H. Humphrey Building, 200 Independence Avenue, S.W., Washington, D.C. 20201. Her e-mail address is: Judith.Dey@hhs.gov.
Reports Available
Certified Community Behavioral Health Clinics Demonstration Program: Report to Congress, 2019
- HTML version: https://aspe.hhs.gov/basic-report/certified-community-behavioral-health-clinics-demonstration-program-report-congress-2019
- PDF version: https://aspe.hhs.gov/pdf-report/certified-community-behavioral-health-clinics-demonstration-program-report-congress-2019
Implementation Findings from the National Evaluation of the Certified Community Behavioral Health Clinic Demonstration
- HTML version: https://aspe.hhs.gov/report/implementation-findings-national-evaluation-certified-community-behavioral-health-clinic-demonstration
- PDF version: https://aspe.hhs.gov/pdf-report/implementation-findings-national-evaluation-certified-community-behavioral-health-clinic-demonstration
Preliminary Cost and Quality Findings from the National Evaluation of the Certified Community Behavioral Health Clinic Demonstration
- HTML version: https://aspe.hhs.gov/basic-report/preliminary-cost-and-quality-findings-national-evaluation-certified-community-behavioral-health-clinic-demonstration
- PDF version: https://aspe.hhs.gov/pdf-report/preliminary-cost-and-quality-findings-national-evaluation-certified-community-behavioral-health-clinic-demonstration