
Health Conditions Among Individuals with a History of Homelessness
ASPE RESEARCH BRIEF
Harper Sutherland, Mir M. Ali, and Emily Rosenoff
U.S. Department of Health and Human Services
Office of the Assistant Secretary for Planning and Evaluation
January 2021
Link to Printer Friendly Version in PDF Format (16 PDF pages)
ABSTRACT: This paper uses a proprietary data set with electronic health records of more than 54,000 individuals with ICD-10 code of homelessness between 2015 and 2019. The paper found that for many chronic conditions, people with a history of homelessness have a greater prevalence than a comparison cohort of individuals matched on age and gender. In addition, the cohort with a history of homelessness had twice the rate of ever having head injuries and high rates of viral hepatitis, alcohol abuse, and opioid abuse.
This brief was prepared through intramural research by the U.S. Department of Health and Human Services, Office of the Assistant Secretary for Planning and Evaluation, Office of Behavioral Health, Disability, and Aging Policy. For additional information about this subject, you can visit the BHDAP home page at https://aspe.hhs.gov/bhdap or contact the ASPE Project Officers at HHS/ASPE/BHDAP, Room 424E, H.H. Humphrey Building, 200 Independence Avenue, S.W., Washington, D.C. 20201; Mir.Ali@hhs.gov, Emily.Rosenoff@hhs.gov.
DISCLAIMER: The opinions and views expressed in this brief are those of the authors. They do not reflect the views of the Department of Health and Human Services, the contractor or any other funding organization. This brief was completed and submitted on July 2020.
| Summary Non-medical factors often influence a person's health, and homelessness can have negative impacts on health status. However, most health care data does not have indicators of a person's housing status. This paper uses a proprietary dataset with electronic health records (EHRs) of more than 54,000 individuals with International Classification of Disease, Tenth Revision (ICD-10) code of homelessness between 2015 and 2019. More than 90% of the individuals received their first ICD-10 homelessness code in a hospital setting, and more than one-third of them had a diagnosis of major depression, anxiety disorder, or alcohol abuse. The paper also found that for many of the health conditions examined, people with a history of homelessness have a greater prevalence than the comparison cohort of individuals matched on age and gender. In particular, the cohort with a history of homelessness had twice the rate of ever having head injuries and high rates of viral hepatitis, alcohol abuse, and opioid abuse. |
Background
Homelessness and health are interrelated. Disabilities and medical crises may lead to job loss and economic hardship, which increase the risk of becoming homeless. Homelessness, in turn, exacerbates many medical conditions. Recent research following individuals in Oakland, California has shown that older adults experiencing homelessness have greater functional impairment, chronic diseases, urinary incontinence, and mortality (Brown et al., 2017). People experiencing homelessness are more likely than people who are stably housed to be sick, according to any number of measures, including disease burden and length of hospitalization (Kushel, Vittinghoff, & Haas, 2001). In addition, homelessness puts individuals at increased risk for violent victimization (Meinbresse et al., 2014) and trauma (National Academies of Sciences, Engineering, & Medicine, 2018). People who experience homelessness are likely to use emergency departments frequently and to rely upon emergency care instead of other types of health care (e.g., primary care providers). These patterns are true even when these individuals are connected to insurance programs (Lin, Bharel, Zhang, O'Connell, & Clark, 2015). Lastly, people experiencing homelessness are at a greater risk for death. A recent study found that in high-income countries, mortality for individuals experiencing homelessness was between three and 11 times higher than the general population (Baxter, Tweed, Katikireddi, & Thomson, 2019).
While researchers have examined the relationship between housing and health for a number of years, most studies have followed a small group of individuals experiencing homelessness over time or have provided a picture of health care use within particular health care settings. Generally, person's housing status is not indicated within health care data. There have been state and regional efforts to link state Medicaid data to Homelessness Management Information System (HMIS) data[1] (Corporation for Supportive Housing, 2014). However, each of these efforts is limited to the particular state, and (by design) is restricted to people experiencing homelessness who access homelessness services and who are also enrolled in Medicaid. On the federal level, the U.S. Department of Housing and Urban Development (HUD) counts the number of people experiencing homelessness in their annual Point-in-Time Count, but the information collected about health is limited.
In recent years there has been a greater acknowledgement that social determinants of health and non-medical factors can have on an effect individual's health and well-being (National Academies of Sciences, Engineering, & Medicine, 2016). As a result there is a greater effort to document such conditions within EHRs. The ICD-10 Z codes document "factors that influence health status and contact with health services" within the EHR. The ICD-10 code Z59.0 specifically indicates "homelessness." While the ICD-10 Z codes provide a good opportunity for documenting homelessness within an EHR, we do not know to what extent providers are screening for housing status or using the codes regularly. Although ICD codes such as the Z codes are standardized, not every provider uses them. One reason is that typically there is no requirement to do so (Mathew, Hodge, & Khau, 2020). Despite concerns about under reporting housing status within EHRs, we see the ICD-10 Z codes as an opportunity to better understand the health care conditions and health care utilization of people who have been identified as homeless.
Methods
This analysis used IBM Watson Health's Explorys all-payer EHR dataset from 2015 through 2019. This dataset includes over 70 million unique individuals from 26 United States health care systems across all 50 states and includes all payers including "self-pay" (i.e., uninsured). While the health systems span all 50 states, it was not designed to be a nationally representative sample. The sample for this analysis included 54,155 individuals who had an ICD-10 Z code of homelessness (Z59.0) applied by a medical service provider between the years 2015 and 2019 (inclusive). The year 2015 was chosen as the start date because the United States transitioned from ICD Ninth Revision, clinical modification, to ICD Tenth Revision, and the reformed ICD code for homelessness (Z59.0) entered into medical records of health systems after October 1, 2015.
The comparison group included 76,539 individuals who were matched on age and gender to the population of interest, but were not recorded to be experiencing homelessness. These individuals also had to have a health care encounter in the same years of sample as the cohort experiencing homelessness: 2015-2019. The comparison group was drawn from a subset of individuals who had at least two encounters from among the following four medical locations in the sampling time period: hospital emergency department, hospital outpatient, hospital inpatient, or [doctor's] office visit. The selection criteria for the comparison cohort to have two encounters imparts a conservative bias to our estimates and may lead to a sicker comparison group, relative to the non-homeless general population of the United States. However, 83.4% of adults see a medical professional at least once per year (Centers for Disease Control & Prevention, 2018).
Health conditions were identified using the Systematized Nomenclature of Medicine--Clinical Terms classification system or SNOMED CT. All prevalence rates include lifetime diagnoses, so a person may not have been diagnosed with the given condition during the 2015 to 2019 time period. This might lead to an over-representation of some conditions. However many of the conditions examined are chronic or long-term health conditions, so a diagnosis in one's lifetime would likely have long-term impacts on an individual's ability to function, including maintaining housing, employment, and health. Given that the data on the homeless population and the comparison group comes from two distinct cohorts with unique population characteristics and that large sample sizes result in statistically significant results even for small differences, we utilized the Cohen's h (Cohen, 1988) measure of effect size (h>0.2) to interpret meaningful differences in health conditions.
To benchmark our findings with existing data on homelessness, we compare the demographics of our homelessness cohort to the Annual Homeless Assessment Report (AHAR) which is the most recent estimate of people experiencing homelessness in the United States. The AHAR is based on information collected in January 2019 as part of HUD's annual Point-in-Time Count. The AHAR represents the most recent federal figures for a specific year, whereas the IBM dataset pulls the records of people ever coded as homeless from late 2015 through 2019. The AHAR defines homeless persons based on the relatively strict definition used by HUD, which is "a person who lacks a fixed, regular, and adequate nighttime residence" (Henry, Watt, Mahathey, Ouellette, & Sitler, 2020); other children living in temporary situations (such as "doubled up" with other families) qualify as homeless under other federal agency statutes. We do not know what criteria or screening questions providers may have used when using the Z59.0 code.
Results
Demographics
By comparing our homeless cohort to national homeless data we see that some populations experiencing homelessness are under-represented in our cohort of people experiencing homelessness.
Table 1 shows demographic information from the AHAR and the two cohorts. The left column shows information from the 2019 AHAR.
| TABLE 1. Demographic Comparison across Cohorts: AHAR, Homeless and Comparison Cohorts | |||
|---|---|---|---|
| 2019 AHAR Total Homeless (N=567,715) | Homeless Cohort (N=54,155) | Comparison Cohort (N=76,539) | |
| Age | |||
| Under 18 | 18.9% | 0% | 0% |
| 18 to 24 | 8.0% | 0% | 0% |
| 25 to 49 | 73.1% | 55% | 55% |
| 50 to 64 | 38% | 38% | |
| 65+ | 8% | 8% | |
| Gender | |||
| Male | 60.5% | 67% | 68% |
| Female | 38.7% | 33% | 32% |
| Gender non-conforming* | 0.2% | --- | --- |
| Transgender | 0.6% | --- | --- |
| Ethnicity | |||
| Hispanic/Latino | 22.0% | 5% | 5% |
| Non-Hispanic/Latino | 78.0% | 61% | 67% |
| Unknown | --- | 34% | 28% |
| Race | |||
| White | 47.7% | 59% | 73% |
| African American | 39.8% | 20% | 14% |
| Asian | 1.3% | 1% | 1% |
| Multiple races | 6.5% | 0% | 1% |
| Other | --- | 3% | 2% |
| Refused | --- | 1% | 1% |
| Unknown | --- | 3% | 3% |
| Missing | --- | 13% | 4% |
| Pacific Islander | 1.6% | --- | --- |
| Native American | 3.2% | --- | --- |
| NOTE: * The IBM cohorts were selected from individuals with a known gender (binary male or female) demographic record, so there are no individuals identifying as gender non-conforming or transgender. | |||
Based on the EHR data, young people experiencing homelessness are not being coded as such. There is only one individual in the homeless cohort younger than 18, and four individuals in the "Transition Age Youth" range (18-24 years old). The comparison cohort was selected based on categorical age matching, so it similarly does not have children in the sample. However, we know from other data sources that there are a significant number of children and youth experiencing homelessness in the United States. The AHAR reports that 107,069 children (18.9% of the homeless population) were experiencing homelessness in January 2019. The U.S. Department Education estimates that there were more than 1.5 million children experiencing homelessness in the three school years spanning from 2015 to 2018 (National Center for Homeless Education, 2020).
Our homeless cohort had a smaller percentage of African Americans than we would have expected. From HUD's AHAR, we know that African Americans are disproportionately represented among people experiencing homelessness. Although African Americans are approximately 13% of the United States population, they represent about 40% of the population of persons experiencing homelessness (Henry, Watt, Mahathey, Ouellette, & Sitler, 2020). However, African Americans make up only 20% of the cohort of people with a history of homelessness in our dataset. This difference may be a result of geography[2] and the providers that are included in the IBM dataset. Alternatively, this may suggest that African Americans experiencing homelessness are not accessing health care, or that when they do, African Americans are less likely to be coded as experiencing homelessness.
Insurance
Using the EHR dataset gives us a new opportunity to look at health insurance coverage for people experiencing homelessness. Most homelessness and health research to date has either used Medicaid data linked to HMIS (local homelessness administrative data), or followed small samples of individuals, or looked at one provider setting (e.g., Health Care for the Homeless providers). Table 2 compares the health insurance status within the EHR data to our comparison group.[3]
| TABLE 2. Comparison of Insurance Status between Homeless Cohort and Comparison Cohort* | ||
|---|---|---|
| Insurance | Homeless (N=54,155) | Comparison (N=76,539) |
| Medicaid | 36% | 11% |
| Medicare | 15% | 10% |
| Other | 4% | 3% |
| Private | 15% | 50% |
| Self-Pay** (uninsured) | 15% | 2% |
| Unknown | 16% | 24% |
| NOTES: * For individuals with a Z code of homelessness, the insurance is the type of insurance at the closest, time-wise, encounter from 2015 to 2019 with the Z code. In the comparison cohort, it is the insurance of the most recent encounter. ** The terminology used by the IBM database is "self-pay," which is considered here to be analogous to "uninsured." | ||
The majority (66%) of our homeless cohort had some form of private or public health insurance coverage. As shown in Table 2, a plurality of individuals coded as experiencing homelessness had Medicaid (36%) while only 11% of those with no history of homelessness had Medicaid. Notably, 15% of the cohort with a history of homelessness and 10% of the comparison cohort had Medicare coverage. Individuals with a history of homelessness are much more likely to have their insurance status coded as "self-pay" than those with no history of homelessness (15% vs. 2%). Private insurance is a much smaller share in the cohort with a history of homelessness than in the comparison cohort (15% vs. 50%).
Provider Settings
Given the limited use of Z codes, it is of interest to know where individuals experiencing homelessness are being seen and where they are first coded as homeless in the EHR. This is shown in Table 3 below.
| TABLE 3. Health Care Setting for First Z59.0 Encounter | ||
|---|---|---|
| Encounter Type | Number of Patients | % |
| Hospital inpatient | 19,245 | 47% |
| Hospital outpatient | 2,782 | 7% |
| Hospital emergency room | 15,683 | 38% |
| Office visit | 1,347 | 3% |
| Psychiatric facility | 1,140 | 3% |
| Others | 939 | 2% |
| Total* | 41,136 | 100% |
| NOTE: * Information on provider associated with first Z59.0 code was missing for 13,019 patients in the homeless cohort. | ||
The majority of encounters during which the Z59.0 code was first recorded in individual's EHRs were in a hospital setting. Specifically, 47% of individuals first had a Z59.0 entered in their EHRs in a hospital inpatient setting, 38% had their first code recorded in a hospital emergency room and 7% had their code first recorded in a hospital outpatient setting. Other settings where people received their first Z59.0 code includes office visits (3%), psychiatric facility (3%) and other settings (1%) -- such as nursing facility, rehabilitation center and long-term care setting.
| TABLE 4. Top 10 ICD Codes for Individuals during Their First Z59.0 Encounter | ||||||
|---|---|---|---|---|---|---|
| Hospital Inpatient | Hospital Outpatient | Emergency Room | Office Visit | Psychiatric Facility | Others | |
| Number of patients | 19,245 | 2,782 | 15,683 | 1,347 | 1,140 | 939 |
| SNOMED Concept | ||||||
| Abdominal pain | 27% | 33% | 24% | 34% | 30% | 28% |
| Alcohol abuse | 30% | 27% | 23% | 16% | 36% | 29% |
| Anxiety disorder | 34% | 30% | 25% | 32% | 39% | 33% |
| Bipolar disorder | 24% | 22% | 21% | 15% | 35% | 21% |
| Chest pain | 31% | 41% | 28% | 40% | 29% | 36% |
| Depressive disorder | 28% | 34% | 23% | 42% | 50% | 39% |
| Essential hypertension | 47% | 47% | 34% | 52% | 39% | 51% |
| Nicotine dependence | 69% | 59% | 51% | 45% | 64% | 57% |
| Major depression episode | 38% | 37% | 28% | 41% | 62% | 42% |
| Suicidal thoughts | 35% | 28% | 26% | 11% | 74% | 32% |
| NOTES: The conditions are not mutually exclusive. | ||||||
We were interested to know what conditions were involved in causing individuals to seek care for the visits where they were first coded as experiencing homelessness, because presumably at that visit their housing status was significant enough to be noted. Table 4 reflects the provider settings and conditions during the encounter where the individual was first coded with the Z59.0 code of homelessness. Multiple codes are usually entered per encounter (i.e., the conditions are not mutually exclusive), thus the percentages do not add up to 100. Behavioral health related conditions were predominant among individuals at the time of their first Z59.0 code receipt. Across all settings, behavioral health conditions such as nicotine dependence, alcohol abuse, depressive disorder, anxiety disorder, and bipolar disorder were prevalent among more than a quarter of the individuals.
Health Conditions
The next section of this paper highlights some health conditions among people with a history of homelessness. The rates of prevalence are all based upon lifetime diagnoses which may inflate the prevalence. However, the conditions examined all have lifelong or long-term health effects, which lends reason for the use of lifetime diagnoses.
Most Prevalent Chronic Health Conditions
Table 5 displays a list of the 15 most prevalent chronic conditions among people with a history of homelessness, and the rates of those conditions in the comparison group. The conditions range from ulcer (15.7%) to high blood pressure (49.4%). Many of the health conditions had a higher prevalence rate among individuals with a history of homelessness compared to the comparison cohort. In particular, anemia, asthma, diabetes, heart disease, viral hepatitis, kidney disease, and lung disease were present at a higher rate in the homeless cohort.
| TABLE 5. 15 Most Common/Prevalent Chronic Health Conditions Among People with a History of Homelessness | |||
|---|---|---|---|
| Condition | Homeless Cohort | Comparison Cohort | Cohen's h |
| Allergic condition | 49.4% | 59.6% | 0.2* |
| Anemia | 29.7% | 22.4% | 0.2* |
| Asthma | 24.2% | 16.7% | 0.2* |
| Diabetes (mellitus) | 26.2% | 22.4% | 0.1 |
| Heart disease | 45.5% | 38.2% | 0.1 |
| Viral hepatitis | 17.5% | 3.4% | 0.5* |
| High blood pressure ("essential hypertension") | 49.4% | 51.5% | 0.0 |
| Kidney disease | 27.5% | 25.0% | 0.1 |
| Chronic obstructive lung disease | 23.0% | 10.6% | 0.3* |
| Neoplastic disease | 28.3% | 44.7% | 0.3* |
| Malignant neoplastic disease | 20.3% | 19.6% | 0.0 |
| Obesity | 18.5% | 30.2% | 0.3* |
| Disorder of mouth | 24.1% | 16.6% | 0.2* |
| Disorder of soft tissue of head | 18.8% | 27.4% | 0.2* |
| Ulcer | 15.7% | 10.6% | 0.2* |
| NOTES: * Indicates statistically significant difference. | |||
Conditions More Frequently Affecting Individuals with a History of Homelessness
Table 6 shows chronic health conditions that are more likely to be present among people with a history of homelessness compared to the comparison group. These conditions are often mentioned in the literature as being more prevalent for people experiencing homelessness (Nikoo et al., 2014). Notably, some of the diseases with the highest differences are communicable diseases: tuberculosis, HIV, and hepatitis. Rates of oral infection are also high. Tuberculosis rates in the United States have been on a 25-year decline from 1993 to 2018. In 2018, there were only 9,025 cases nationally, with a prevalence of 2.8 cases per 100,000 persons (0.0028%) (Centers for Disease Control & Prevention, 2019). Therefore, the 3.2% prevalence of tuberculosis in the cohort of those with a history of homelessness is extremely high. Another condition that is much more common among people with a history of homelessness is HIV infection -- 5.8%, more than 5 times the prevalence (1.1%) in the comparison group.
| TABLE 6. Conditions More Likely to Affect People with a History of Homelessness | |||
|---|---|---|---|
| Condition | Homeless Cohort | Comparison Cohort | Cohen's h |
| Amputation (procedure) | 3.4% | 1.5% | 0.1 |
| Cerebrovascular accident (i.e., stroke) | 4.3% | 1.0% | 0.2* |
| Chronic diarrhea | 0.4% | 0.1% | 0.1 |
| Alzheimer's disease | 0.8% | 0.3% | 0.1 |
| Dementia** | 5.7% | 1.9% | 0.2* |
| Epilepsy | 10.9% | 3.3% | 0.3* |
| Viral hepatitis | 17.5% | 3.4% | 0.5* |
| Chronic hepatitis C | 9.1% | 1.9% | 0.3* |
| Acute hepatitis | 2.6% | 0.3% | 0.2* |
| HIV infection | 5.8% | 1.1% | 0.3* |
| Injury of head | 33.9% | 15.2% | 0.4* |
| Cirrhosis of liver | 7.2% | 1.9% | 0.3* |
| Chronic obstructive lung disease | 23.0% | 10.6% | 0.3* |
| Oral infection | 9.0% | 3.7% | 0.2* |
| History of pneumonia | 3.4% | 1.5% | 0.1 |
| Tuberculosis | 3.2% | 0.8% | 0.2* |
| NOTES: * Indicates statistically significant difference. ** Dementia includes all dementias including Alzheimer's disease. | |||
Conditions Associated with Advanced Age
In recent years there has been concern over the increase in homelessness among older adults, along with the concern that many conditions that are more prevalent among advanced aged individuals might be common among individuals experiencing homelessness regardless of their age (Culhane et al., 2019). The following table displays these conditions among the entire sample cohorts. For most of these chronic conditions, people who have a history of homelessness have higher prevalence than the comparison group. However, in our research, several conditions associated with advanced age (arthritis, cataracts, glaucoma, hearing loss, hypertension, and osteoporosis) were more prevalent in the comparison group.
Several factors may be impacting these diagnoses, in confounding ways: some diseases and conditions are more likely to be diagnosed by specialists, so people who do not have access to specialty care are less likely to be diagnosed; however, chronic disease and geriatric conditions set in earlier for homeless adults (Culhane et al., 2019; Brown et al., 2017).
| TABLE 7. Conditions Associated With Advanced Age | |||
|---|---|---|---|
| Condition | Homeless Cohort | Comparison Cohort | Cohen's h |
| Arthritis | 11.8% | 19.7% | 0.2* |
| Cataract | 3.1% | 6.7% | 0.2* |
| Cerebrovascular accident (i.e., stroke) | 4.3% | 1.0% | 0.2* |
| Alzheimer's disease | 0.8% | 0.3% | 0.1 |
| Dementia | 5.7% | 1.9% | 0.2* |
| Dementia associated with another disease | 2.7% | 1.2% | 0.1 |
| Presenile dementia | 0.1% | 0.1% | 0.0 |
| Senile dementia | 0.1% | 0.1% | 0.0 |
| Diabetes (mellitus) | 26.2% | 22.4% | 0.1 |
| Glaucoma | 3.0% | 3.4% | 0.0 |
| Hearing loss | 4.9% | 7.6% | 0.1 |
| Heart Disease | 45.5% | 38.2% | 0.1 |
| High blood pressure ("essential hypertension") | 49.4% | 51.5% | 0.0 |
| Osteoporosis | 2.3% | 3.7% | 0.1 |
| NOTE: * Indicates statistically significant difference. | |||
Trauma
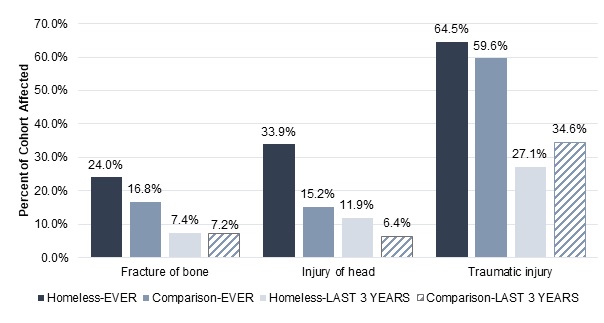
Our analysis found that the cohort with a history of homelessness had higher rates of ever having had fractures or injuries. Figure 1 displays the prevalence of some traumatic injuries: fracture of bone, injury of head, and traumatic injury broadly. The darkest columns show the prevalence of these injuries in homeless and comparison cohorts at any time, whereas the light gray and hatching columns show the prevalence of the injuries within the last 3 years.
Our expectation was that people who have experienced homelessness have generally worse health (suffer from more health conditions) and are more likely to have suffered injuries. Research shows that many homeless people undergo traumatic injuries and have high rates of traumatic brain injury compared to non-homeless populations (Stubbs et al., 2020). The diagnoses in this chart do not reveal the causes of these traumatic injuries, but rates of victimization among people who experience homelessness are high. Victimization of violence is estimated to range from 14% to 21% in the homeless population. Older age and being homeless for a longer period of time are associated with higher risk of victimization (Meinbresse et al., 2014).
Figure 1 shows that the cohort with a history of homelessness has more than twice the rate of ever having injuries to the head (33.9% vs. 15.2%) compared to our comparison group. However, as shown in Figure 1, there is not a clear or consistent pattern of people who have a history of homelessness having higher prevalence of the broad category of traumatic injury than people without a history of homelessness. One factor that could be driving high rates of traumatic injuries in the comparison cohort is a bias related to the construction of the comparison sample -- a person had to seek out medical attention, and they might have been pushed to do so because of a traumatic injury.
| FIGURE 1. Prevalence of Traumatic Injuries by Cohort, in Two Different Time Periods |
|---|
 |
Substance Use
Across all the substance use related diagnoses, people with a history of homelessness have higher prevalence than the comparison group. Substance use is common in the sample of people with a history of homelessness. This is concordant with other research on the rate of substance use among people experiencing homelessness. In a study of New York hospitals, substance use was the primary diagnosis for 28.5% of homeless individuals admitted, in comparison to 9.2% of low-income housed individuals treated at public hospitals. Patients without permanent addresses also stayed longer in the hospital, adjusting for the severity of their illnesses (Salit, Kuhn, Hartz, Vu, & Mosso, 1998).
Opioid abuse is particularly high in the cohort who have experienced homelessness (15.2%) in contrast to the comparison cohort (1.95%). The most commonly used substances are tobacco (used by 63.1% of the homeless cohort) and alcohol (causing a disorder in 42.6% of the homeless cohort). These are both legal but controlled substances. Cocaine and cannabis abuse were also prevalent in more than 15% of the homeless cohort.
| TABLE 8. Substance Abuse | |||
|---|---|---|---|
| Condition | Homeless Cohort | Comparison Cohort | Cohen's h |
| Abuse of antidepressant drug | 0.2% | 0.0% | 0.1 |
| Amphetamine abuse | 7.6% | 0.4% | 0.4* |
| Cannabis abuse | 20.2% | 2.8% | 0.6* |
| Cocaine abuse | 17.7% | 1.6% | 0.6* |
| Disorder caused by alcohol | 42.6% | 8.5% | 0.8* |
| Hallucinogen abuse | 1.5% | 0.1% | 0.2* |
| Hypnotic or anxiolytic abuse | 0.3% | 0.1% | 0.0 |
| Inhalant abuse | 0.5% | 0.0% | 0.1 |
| Opioid abuse | 15.2% | 2.0% | 0.5* |
| Sedative abuse | 3.5% | 0.4% | 0.2* |
| Tobacco user** | 63.1% | 37.3% | 0.5* |
| NOTE: * Indicates statistically significant difference. ** "Tobacco user" is unlike the other items in the list because it is not a diagnosis of substance abuse, but rather, the use of a legal substance. | |||
Discussion
Our study provides a new look on health conditions for people experiencing homelessness using EHRs as a source for information on more than 50,000 individuals from across the United States who had experienced homelessness. Our results shows that there are some conditions for which the homelessness cohort has a significantly higher prevalence of disease including, heart disease, high blood pressure, cirrhosis of the liver, tuberculous and dementia. We also see high rates of various substance use, with "disorders caused by alcohol" being the most prevalent condition among our homelessness cohort.
Our findings match other research that suggests the homeless underutilize basic medical care and over utilize emergency services. People experiencing homelessness may not seek health care unless there is an urgent need, and therefore would not have an opportunity to be screened for housing instability. Emergency departments are generally required to provide screening and stabilizing treatment for emergency medical conditions regardless of an individual's ability to pay. For people who are uninsured and experiencing homelessness, this may mean that they only seek emergency treatment. This may also explain why so many of the encounters where individuals were first coded as experiencing homelessness were in hospitals and emergency departments. Previous research has also indicated that even with health insurance coverage and chronic conditions, people experiencing homelessness may be reluctant to seek regular care (Garibaldi et al., 2005).
Limitations
Comparing our homelessness cohort from the EHR dataset to other sources of data in the US reveals the limitations of using this dataset for estimates of homelessness generally. The AHAR is the best estimate of homelessness in the United States because it is the only regular, nation-wide undertaking to comprehensively count people living in sheltered and unsheltered locations. Comparing the demographic information from the AHAR to our sample, we find major differences. In particular, we find nearly no children under 18 coded as experiencing homelessness, and under-representation of African Americans compared to the percentage in the AHAR. One hypothesis for the low count of children in the EHR database is a fear from parents or providers that disclosing a child's status as homeless may lead to involvement with Child Protective Services.
Additionally, 20% of the racial demographic information is obscured from analysis, mostly in categories of refused, missing, and unknown, but also in small numbers of individuals in racial identity groups such as Native American and Pacific Islander. Because of this, Native Americans, who are over-represented nationally in the homeless population (3.2%), are under-represented in the dataset. Therefore our findings should not be interpreted as representing the health conditions of all people experiencing homelessness, but are only the subset of people who were coded within their EHR. Even with that caveat, our findings do provide a robust picture of the health conditions for over 50,000 individuals who were coded as experiencing homelessness.
Conclusions
Our findings show a cohort of individuals with a high prevalence of chronic health conditions, behavioral health disorders, communicable diseases and infections, and history of head injuries among a cohort of individuals experiencing homelessness. To the extent that diseases like diabetes, heart disease and substance use are better managed with regular medication/treatment, stable housing may be the first step in managing such conditions.
Future research related to social determinants of health could consider using EHR data especially if there are policy changes that can be made to encourage greater use of Z codes. Since Z-coding is not required for submitting a health care claim, the overall use of Z codes is likely very low. Recent research found that only 16% of physician practices and 24% of hospitals screen for food, housing, transportation needs and interpersonal violence, but that screening was more likely in practices participating in programs such as ACOs, bundled payments or primary care improvement models (Fraze et al., 2019). With greater adoption of innovative payment models, providers may be further encouraged to use the Z codes to document the non-medical challenges affecting their patients.
References
Baxter, A.J., Tweed, E.J., Katikireddi, S.V., & Thomson, H. (2019). Effects of Housing First approaches on health and well-being of adults who are homeless or at risk of homelessness: Systematic review and meta-analysis of randomised control trials. J Epidemiol Community Health, (73), 379-387.
Berchik, E.R., Barnett, J.C., & Upton, R.D. (2019). Health Insurance Coverage in the United States: 2018. Retrieved from U.S. Census Bureau: https://www.census.gov/library/publications/2019/demo/p60-267.html.
Brown, R.T., Hemati, K., Riley, E.D., Lee, C.T., Ponath, C., Tieu, L., Guzman, D., & Kushel, M.B. (2017). Geriatric Conditions in a Population-Based Sample of Older Homeless Adults. Gerontologist, 57(4), 757-766.
Centers for Disease Control and Prevention. (2018). Summary Health Statistics, National Health Interview Survey. Retrieved from Centers for Disease Control and Prevention, National Center for Health Statistics: https://ftp.cdc.gov/pub/Health_Statistics/NCHS/NHIS/SHS/2018_SHS_Table_A-18.pdf.
Centers for Disease Control and Prevention. (2019). Trends in Tuberculosis, 2018. Retrieved from Centers for Disease Control and Prevention, National Center for Health Statistics: https://www.cdc.gov/tb/publications/factsheets/statistics/tbtrends.htm.
Centers for Medicare & Medicaid Services. (2020). Z Codes Utilization among Medicare Fee-for-Service (FSS) Beneficiaries in 2017.
Cohen, J. (1988). Statistical Power Analysis for Behavioral Sciences, 2nd ed. Waltham, MA: Academic Press.
Corporation for Supportive Housing. (2014). First Match of State Medicaid and Homelessness Data Reveals Opportunities to Improve Health Outcomes, Reduce State Costs. Retrieved from Corporation for Supportive Housing: https://www.csh.org/wp-content/uploads/2014/01/RH-CSH_MedicaidHMISMatchSummary.pdf.
Culhane, D. (2013). The Age Structure of Contemporary Homelessness: Evidence and Implications for Public Policy. Retrieved from The Society for the Psychological Study of Social Issues: http://www.nchv.org/images/uploads/The_Age_Structure_of_Contemporary_Homelessness_WEB.pdf.
Culhane, D., Treglia, D., Byrne, T., Metraux, S., Kuhn, R., Doran, K., Johns, E., & Schretzman, M. (2019). The Emerging Crisis of Aged Homelessness: Could Housing Solutions Be Funded by Avoidance of Excess Shelter, Hospital, and Nursing Home Costs? Philadelphia, PA: University of Pennsylvania.
Cutuli, J.J., Ahumada, S.M., Herbers, J.E., Lafavor, T.L., Masten, A.S., & Oberg, C.N. (2017). Adversity and children experiencing family homelessness: Implications for health. J Child Poverty, 23(1), 41-55. doi:10.1080/10796126.2016.1198753.
Dey, J., Rosenoff, E., & West, K. (2016). Benefits of Medicaid Expansion for Behavioral Health. Retrieved from Office of the Assistant Secretary for Planning and Evaluation, Department of Health and Human Services: https://aspe.hhs.gov/pdf-report/benefits-medicaid-expansion-behavioral-health.
Fraze, T.K., Brewster, A.L., Lewis, V.A., Beidler, L.B., Murray, G.F., & Colla, C.H. (2019). Prevalence of screening for food insecurity, housing instability, utility needs, transportation needs, and interpersonal violence by US physician practices and hospitals. JAMA Netw Open, 2(9): e1911514. doi:10.1001/jamanetworkopen.2019.11514.
Garibaldi, B., Conde-Martel, A., & O'Toole, T.P. (2005). Self-reported comorbidities, perceived needs, and sources for usual care for older and younger homeless adults. Journal of General Internal Medicine, 20(8), 726-730. doi:10.1111/j.1525-1497.2005.0142.x.
Henry, M., Watt, R., Mahathey, A., Ouellette, J., & Sitler, A. (2020). The 2019 Annual Homeless Assessment Report (AHAR) to Congress: Part 1: Point-in-Time Estimates of Homelessness. Retrieved from Abt Associates: https://files.hudexchange.info/resources/documents/2019-AHAR-Part-1.pdf.
Kushel, M.B., Vittinghoff, E., & Haas, J.S. (2001). Factors associated with the health care utilization of homeless persons. JAMA, 285(2), 200-206. doi:10.1001/jama.285.2.200.
Lin, W.C., Bharel, M., Zhang, J., O'Connell, E., & Clark, R.E. (2015). Frequent emergency department visits and hospitalizations among homeless people with Medicaid: Implications for Medicaid expansion. American Journal of Public Health, 105(Suppl 5), S716-S722.
Mathew, J., Hodge, C., & Khau, M. (2020). Z Codes Utilization among Medicare Fee-for-Service (FFS). CMS OMH Data Highlight, 17. Retrieved from: https://www.cms.gov/files/document/cms-omh-january2020-zcode-data-highlightpdf.pdf.
Meinbresse, M., Brinkley-Rubinstein, L., Grassette, A., Benson, J., Hall, C., Hamilton, R., Malott, M., & Jenkins, D. (2014). Exploring the experiences of violence among individuals who are homeless using a consumer-led approach. Violence and Victims, 29(1), 122-135.
National Academies of Sciences, Engineering, and Medicine. 2016. A Framework for Educating Health Professionals to Address the Social Determinants of Health. Washington, DC: National Academies Press. doi:10.17226/21923.
National Academies of Sciences, Engineering and Medicine. (2018). Permanent Supportive Housing: Evaluating the Evidence for Improving Health Outcomes Among People Experiencing Chronic Homelessness. Washington, DC: National Academies Press.
National Center for Homeless Education. (2020). Federal Data Summary School Years 2015-2016 Through 2017-2018. Greensboro, NC: University of North Carolina.
National Health Care for the Homeless Council. (2020). Health Insurance at HCH Programs, 2018. Retrieved from National Health Care for the Homeless Council: https://nhchc.org/wp-content/uploads/2020/01/Health-Insurance-HCH-Programs-2018.pdf.
Nikoo, N., Motamed, M., Mohammad, A., Strehlau, V., Neilson, E., Saddicha, S., & Krausz, M. (2014). Chronic physical health conditions among homeless. Journal of Health Disparities Research and Practice, 8(1): 81-97.
Roncarati, J.S., Baggett, T.P., O'Connell, J.J., Hwang, S.W., Cook, E.F., Krieger, N. & Sorensen, G. 2018. Mortality Among Unsheltered Homeless Adults in Boston, Massachusetts, 2000-2009. JAMA Intern Med, 178(9): 1242-1248.
Rountree, J., Hess, N., & Lyke, A. (2019). Health Conditions Among Unsheltered Adults in the U.S. Retrieved from California Policy Lab: https://www.capolicylab.org/wp-content/uploads/2019/10/Health-Conditions-Among-Unsheltered-Adults-in-the-U.S.pdf.
Salit, S.A., Kuhn, E.M., Hartz, A.J., Vu, J.M., & Mosso, A.L. (1998). Hospitalization costs associated with homelessness in New York City. New England Journal of Medicine, 338(24), 1734-1740. doi:10.1056/NEJM199806113382406.
Stubbs, J.L., Thornton, A.E., Sevick, J.M., Silverberg, N.D., Barr, A.M., Honer, W.G., & Panenka, W.J. (2020). Traumatic brain injury in homeless and marginally housed individuals: A systematic review and meta-analysis. Lancet Public Health, 5(1): e19-e32. [Published correction appears in Lancet Public Health, 2019 Dec 18.]
Appendix
Concerns about Insurance Status in the Data
While we present our findings from the EHR data in our paper, we found that this dataset may not be suited to answer questions of insurance coverage compared to claims-based data. However, since EHR data can tell us information on encounters for uninsured individuals, we thought it was important to include our findings. Typically, studies that examine insurance coverage use datasets formed by claims-based data, as this is a naturally rich source of information for these questions. But by definition, claims are paid by a specific program or plan, whereas our EHR data should be covering encounters for all types of payers including "self-pay" (i.e., uninsured).
Our concerns center around age-group analyses, where Medicare coverage indicate surprisingly low rates of coverage of individuals in the over-65 population for both groups.
Of the group with a history of homelessness, 13.7% who were under 65 had Medicare vs. 7.62% of the comparison cohort who were under 65. This is consistent with our understanding that people experiencing homelessness have high rates of lifelong disabling conditions that make them eligible for Medicare prior to age 65.
However, looking at the over 65 population, 42.6% of the homeless cohort and 51.7% of the comparison group had Medicare. These are very low Medicare coverage rates for the comparison population over age 65. In further analyzing the Medicare coverage among even older age groups, such as 70-74 years old with the EHR data, the rate of Medicare coverage was still not as high as one would expect for a universal health care coverage program -- 50% among people with a history of homelessness and 58% in the comparison group. Recent government estimates of health care coverage show that 94.1% of adults aged 65 or older are covered by a public plan (primarily Medicare), indicating that our dataset underestimates Medicare coverage (Berchik, Barnett, & Upton, 2019).
Endnotes
-
HMIS is the data system that local HUD homelessness grantees use to track clients experiencing and at risk of homelessness. HMIS data is housed within each continuum of care, the entity that coordinates homelessness funding for a region.
-
According to the 2019 AHAR, Caucasians are nearly 75% of individuals experiencing homelessness in rural areas, whereas African Americans are 45% of individuals in major cities (Henry, Watt, Mahathey, Ouellette, & Sitler, 2020).
-
Our concerns about the validity of the health insurance coverage information in the Explorys dataset, particularly for Medicare, is noted in the Appendix.