
Arkadipta Ghosh, Robert Schmitz and Randall Brown
Mathematica Policy Research
"This report was prepared under contract #HHSP23320095642WC between the U.S. Department of Health and Human Services (HHS), Office of Disability, Aging and Long-Term Care Policy (DALTCP) and Mathematica Policy Research. For additional information about this subject, you can visit the DALTCP home page at http://aspe.hhs.gov/office_specific/daltcp.cfm or contact the ASPE Project Officers, Hakan Aykan and Jhamirah Howard, at HHS/ASPE/DALTCP, Room 424E, H.H. Humphrey Building, 200 Independence Avenue, S.W., Washington, D.C. 20201. Their e-mail addresses are: Hakan.Aykan@hhs.gov and Jhamirah.Howard@hhs.gov.
The opinions and views expressed in this report are those of the authors. They do not necessarily reflect the views of the Department of Health and Human Services, the contractor or any other funding organization.
ABSTRACT
Purpose of the Study. We examine the effects of the Program of All-Inclusive Care for the Elderly (PACE) on Medicare and Medicaid expenditures, use of nursing home (NH) services, and mortality.
Design and Methods. The study was limited to PACE programs in the eight states that had at least 250 new PACE enrollees during 2006-2008 and had at least 3,000 new enrollees in home and community-based services (HCBS) 1915(c) waiver programs for aged and disabled individuals over the same period. We used a matched comparison group design for the study where new enrollees in PACE during 2006-2008 in those states were matched to two different comparison groups composed of: (1) Medicare beneficiaries who are either new recipients of HCBS waiver services or new NH entrants in the same year that the new PACE enrollee entered that program; and (2) Medicare beneficiaries who are new recipients of HCBS waiver services alone. We used a nearest neighbor matching algorithm based on propensity score estimation--implemented separately for each of the eight states--to create the two matched comparison samples.
Results. Using the matched comparison group comprised of both HCBS waiver enrollees and NH entrants, actual monthly capitated Medicare expenditures for PACE enrollees during successive six-month intervals were mostly similar to the predicted expenditures they would have incurred had they been in fee-for-service (FFS) Medicare, with significant differences in only a few periods. Actual capitated Medicaid expenditures on PACE enrollees, however, significantly exceeded predicted expenditures in all intervals, with the magnitude of the difference remaining stable over time. State-specific findings uncovered several differences in the Medicaid expenditure findings, such as a large and positive Medicaid spending gap in California that increased over time, a smaller positive spending gap in Massachusetts that decreased over time, and finally, significantly lower Medicaid spending under PACE in New York. Using a matched comparison group comprised of HCBS waiver enrollees alone, results were broadly similar, but the estimated gap in expenditures, with higher actual payments under PACE, was larger, especially for Medicaid payments.
PACE enrollees experienced significantly better outcomes, as measured by mortality and long-term NH stays, than the comparison group. PACE enrollees had a significantly lower mortality rate than enrollees in the matched comparison group comprised of both HCBS waiver enrollees and NH entrants, and also had lower mortality, though with smaller differences, when compared to a matched comparison group comprised of HCBS waiver enrollees alone. However, the mortality findings could be affected by unobserved differences in health and functional status between the groups and need to be interpreted with caution. For the NH utilization outcomes, our primary analysis compared PACE enrollees against the matched comparison group comprised of HCBS waiver enrollees alone, and the results suggest that PACE enrollees were more likely to use a NH, although the proportion of days in the NH was similar across PACE and matched HCBS waiver enrollees, as was the likelihood of being in a NH for at least 30 days. PACE enrollees were significantly less likely to be in a NH for at least 90 days compared to matched waiver enrollees in a particular interval, although the cumulative rates of being in a NH for at least 90 days was similar across PACE and matched HCBS enrollees across intervals. Compared to the matched comparison group comprised of both NH entrants and HCBS waiver enrollees, PACE enrollees, expectedly, had significantly lower utilization of NH services with large, negative differences on all NH utilization outcomes.
Implications. Our findings on Medicare and Medicaid expenditures and on mortality across all eight states are similar to results from prior studies. However, state-specific findings on Medicaid expenditures differ across states, for example, we find significantly lower Medicaid spending under PACE in New York. The findings for NH utilization go beyond what has been studied in the past, and suggest that although PACE enrollees were more likely to be admitted to a NH, their NH use tended to be limited in duration, with PACE enrollees being less likely than the comparison group to have a stay of 90 days or longer in any interval. However, PACE and matched HCBS enrollees had similar cumulative rates of long-term NH stay across intervals, suggesting greater overlap across intervals among HCBS enrollees who experience long-term NH stays.
These findings, taken together, suggest that the PACE program delivers strongly favorable results from enrollees' perspective, with increased longevity and less institutionalization. However, at the capitation rates prevailing during the study period, PACE does not generate savings to Medicare (except during the first six months after enrollment) compared to what Medicare FFS costs would have been, and actually increases Medicaid costs compared to what would have been incurred. However, the wide differences across states suggest that if states hold the line on Medicaid capitation rates for a few years, they may be able to bring them below the escalating FFS costs and generate net savings.
ACRONYMS
The following acronyms are mentioned in this report and/or appendices.
| ADL | Activity of Daily Living |
|---|---|
| CAD | Coronary Artery Disease |
| CCW | Chronic Conditions Warehouse |
| CHF | Congestive Heart Failure |
| CMS | Centers for Medicare and Medicaid Services |
| ER | Emergency Room |
| FFS | Fee-For-Service |
| HCBS | Home and Community-Based Services |
| HCC | Hierarchical Conditions Category |
| IP | Inpatient file |
| LT | Long-Term Care file |
| LTC-MDS | Long-Term Care Minimum Dataset |
| MARx | Medicare Advantage and Prescription Drug |
| MAX | Medicaid Analytic eXtract |
| MBSF | Master Beneficiary Summary File |
| MDS | Minimum Dataset |
| NH | Nursing Home |
| OT | Other file |
| PACE | Program of All-Inclusive Care for the Elderly |
| PBPM | Per Beneficiary Per Month |
| PS | Personal Summary file |
| Rx | Prescription Drug file |
| SAF | Standard Analytic File |
| SNF | Skilled Nursing Facility |
| SNP | Special Needs Plan |
| UPL | Upper Payment Limit |
EXECUTIVE SUMMARY
The primary goal of this study is to determine whether the previous findings of cost neutrality for Medicare expenditures and of higher Medicaid expenditures (relative to fee-for-service [FFS]) under the Program of All-Inclusive Care for the Elderly (PACE), is still the case, and if not, how it has changed. We focus on more recent cohorts of PACE enrollees to capture the effects of changes in capitation payments, especially in Medicare payments to PACE plans, on Medicare and Medicaid expenditures. Along with program effects on costs, we also examine effects on the use of nursing home (NH) services and mortality. Results are compared across states with enough observations to support state-specific analysis.
Data and Methods
We use data on dually eligible beneficiaries newly enrolled in PACE during 2006-2008 in eight states who are followed until 2011 along with data on two different matched comparison groups comprised of--(1) new enrollees in Medicaid home and community-based services (HCBS) 1915(c) waiver programs and new entrants to NHs in the same states; and (2) new enrollees in HCBS waiver programs alone--who are followed over an identical time period. We included eight states in this study that had a sufficient number of PACE enrollees during 2006-2008 and also had participants in the HCBS 1915(c) waiver program during the same years. We used a nearest neighbor matching algorithm based on propensity score estimation to select the two comparison groups--implemented separately for each of the eight states, with pre-enrollment demographics, chronic conditions, and service utilization and costs included as covariates in the model.
We use Medicare and Medicaid enrollment and claims data from a variety of sources for: (1) identifying PACE and HCBS enrollees, and new NH entrants; (2) imposing our sample selection criteria; (3) matching; and (4) constructing variables for the outcomes analysis. The specific data sources or files we used include Medicare Advantage and Prescription Drug data, Medicaid Analytic eXtracts, Master Beneficiary Summary File, Medicare Standard Analytic Files, and the Minimum Dataset Timeline File. We examine per beneficiary per month Medicare expenditures, Medicaid expenditures, and total expenditures over successive six-month intervals from the month of sample entry for PACE and matched comparison group enrollees. Specifically, we compare actual expenditures (Medicare and Medicaid capitation payments) for PACE enrollees in each six-month interval to predicted values for the FFS expenditures that the PACE enrollees would have incurred had they not enrolled in PACE, using a regression model estimated on the matched comparison group to obtain the prediction. We examine the cumulative mortality rates for PACE and both matched comparison groups (HCBS enrollees and NH entrants, or HCBS enrollees alone) over successive six-month intervals from sample entry using a separate logistic regression for each interval. We also compare PACE and matched HCBS waiver enrollees on any use of NH services, proportion of days in a NH, likelihood of being in a NH for at least 30 days, likelihood of being in a NH for at least 90 days, and the cumulative risk of being in a NH for at least 90 days over successive six-month intervals from sample entry, using either logistic or linear regressions. We repeated the analysis of NH utilization using the matched comparison group comprised of both NH entrants and HCBS waiver enrollees although NH utilization was expected to be significantly high in the matched comparison group, since it included NH entrants.
Results
Across all eight states, actual capitated monthly Medicare expenditures for PACE enrollees during successive six-month intervals were mostly similar to the predicted expenditures that the enrollees would have incurred had they been in FFS Medicare. Actual Medicaid expenditures on PACE enrollees, however, significantly exceeded predicted expenditures in all intervals, with the magnitude of the difference remaining stable over time. These main findings were robust to alternative sample definitions, such as the exclusion of New York (the largest study state) from the sample, and the exclusion of PACE enrollees with prior HCBS enrollment or NH use and of matched HCBS enrollees with prior NH use. To address concerns about the possibility of the results being driven by New York (the study state with the largest sample size), we examined findings after excluding New York from the study. This led to similar findings for Medicare expenditures but a slightly different pattern of findings for Medicaid expenditures--the significant positive gap in Medicaid spending was much higher, once New York was excluded. New York had actual Medicaid expenditures under PACE that were significantly lower than projected FFS expenditures, but actual Medicare expenditures tended to be significantly higher than the projected counterfactual costs, with the combined effect being that total capitated expenditures for PACE enrollees were lower or similar to predicted FFS expenditures. The Medicaid expenditure findings for New York are, therefore, quite different from those in earlier studies, and from those for the other seven states in this study, including California and Massachusetts. One possible explanation for these different findings for New York is higher FFS payment rates for the comparison group of matched NH entrants and HCBS waiver enrollees in New York compared to FFS payment rates in other states. The Medicaid spending under PACE in California was significantly higher-than-predicted expenditures, with the difference growing over time--mainly due to Medicaid capitation payments increasing at a faster rate than the projected FFS costs. In Massachusetts, the capitated Medicaid payments were significantly higher than the projected FFS costs in spite of the fact that the capitation payments declined over time, because predicted expenditures also declined. However, the discrepancy decreased to statistically insignificant levels over time.
Using a matched comparison group comprised of HCBS waiver enrollees alone, results were broadly similar, but the estimated gap in expenditures, with higher actual payments under PACE, was larger, especially for Medicaid payments. This difference is as expected, since Medicaid costs predicted from a comparison group comprised solely of HCBS enrollees are lower than those for a comparison group comprised of a mix of new NH entrants and new HCBS recipients.
Throughout the followup period, PACE enrollees had a lower mortality rate than enrollees in the matched comparison group comprised of HCBS waiver enrollees and NH entrants, with the difference being large and significant in each period and ranging from eight to 17 percentage points during each six month followup period after the first year through month 60 after enrollment. Comparing PACE to matched HCBS waiver enrollees alone, PACE enrollees still had significantly lower mortality, but by a smaller magnitude of 5-6 percentage points after the first year through month 48 after enrollment. However, the mortality findings could be affected by unobserved differences in health and functional status between the groups and need to be interpreted with caution.
For the NH utilization outcomes, our primary analysis compared PACE enrollees against a matched comparison group comprised of HCBS waiver enrollees alone. PACE enrollees were more likely to use a NH in each of the seven intervals, with the difference being statistically significant during the first four intervals. Proportion of days in the NH was similar for PACE and matched HCBS waiver enrollees, as was the likelihood of being in a NH for at least 30 days. PACE enrollees were significantly less likely to be in a NH for at least 90 days compared to matched waiver enrollees in five of the seven intervals, although the cumulative rates of being in a NH for at least 90 days were similar across PACE and matched HCBS enrollees across intervals. The NH results were robust to the exclusion of New York from the study sample. Compared to the matched comparison group comprised of both NH entrants and HCBS waiver enrollees, PACE enrollees, expectedly, had significantly lower utilization of NH services with large, negative differences on all NH utilization outcomes.
Implications
While our main findings on Medicare and Medicaid expenditures are in line with results from prior studies meeting standards for a rigorous nonexperimental evaluation, we find important new evidence in both the trend and the variation across states. We find, like previous studies, that PACE capitation rates are essentially equivalent to what enrollees would have cost Medicare had they been in FFS (except during the first six months after enrollment, when Medicare costs under PACE are significantly lower), but for Medicaid, the capitated costs are significantly higher than what that program would likely have paid under FFS. However, prior studies found that the gap in Medicaid spending decreased over time, while we find that the Medicaid spending gap was fairly stable in the pooled analysis across all eight states using the matched comparison group of both HCBS and NH entrants. However, the Medicaid spending gap was higher and did decrease over time, using a matched comparison group of HCBS enrollees only--in line with findings from prior studies meeting standards for a rigorous evaluation. More importantly, the findings for New York and California are in stark contrast to each other and to those from earlier studies and point towards success in controlling Medicaid expenditures on PACE enrollees in New York, but increasing overpayments in California. However, the findings are not all favorable for New York, since capitated Medicare expenditures under PACE in New York are significantly higher than expected FFS expenditures in several intervals, unlike in California and Massachusetts where the Medicare cost differences were mostly negative or insignificant.
Our results for mortality and NH use suggest that PACE enrollees have greater longevity and lower likelihood of suffering a long (and possibly permanent) NH stay. Our finding of substantially lower mortality under PACE corroborates similar findings in several earlier studies, regardless of whether enrollees are compared to a matched sample comprised solely of new HCBS waiver enrollees or of a combination of new waiver enrollees and new NH entrants. However, it is unclear whether the favorable findings for mortality can strictly be interpreted as an effect of PACE rather than unobserved differences across the three groups. For instance, terminally ill patients may be less likely to enroll in PACE, leading to lower mortality for PACE enrollees. Also, the inclusion of NH entrants--who are likely to be sicker--in the first matched comparison group together with imperfect risk adjustment due to absence of baseline data on health and functional status immediately preceding enrollment could further bias the mortality findings in favor of PACE. The findings for NH utilization are interesting and require thorough examination, in that PACE enrollees were found to have a significantly higher likelihood of being in a NH during the followup period, but their proportion of days in the NH was similar to that for the matched HCBS waiver enrollees for most of the followup period, as was their likelihood of being in a NH for at least 30 days. However, PACE enrollees were significantly less likely to experience a nursing facility stay of at least 90 days compared to their matched HCBS waiver counterparts in a particular interval, although the cumulative rates of being in a NH for at least 90 days were similar across PACE and matched HCBS enrollees across all intervals. Taken together, these findings suggest that: (1) additional PACE enrollees experienced long-term NH stays in each successive interval, while there was greater overlap across intervals among HCBS enrollees who experience long-term NH stays, and for longer time periods in each interval than PACE enrollees; and (2) PACE may be using NHs in lieu of hospital admissions in some cases, or to shorten hospital stays, but enables enrollees to avoid long NH stays or institutionalization, in general. The potential to substitute nursing facility stays for hospital stays is much greater for PACE than for FFS, because PACE enrollees are not required to have a three-day hospital stay in order to qualify for Medicare coverage of a nursing facility stay.
While the findings either corroborate or extend earlier studies of PACE, having to rely exclusively on secondary data does create some limitations. Future research can expand the scope of the current study to include survey-based (or assessment) measures of beneficiary characteristics, such as physical and cognitive functioning, examine additional survey-based outcomes on quality of life, and use a longer followup for Medicaid expenditures with additional years of Medicaid data. It would also be important to look at acute care utilization outcomes, such as hospitalizations and emergency department visits.
I. INTRODUCTION
The Program of All-Inclusive Care for the Elderly (PACE) established as a permanent Medicare benefit by the Balanced Budget Act of 1997, attempts to help nursing home (NH) eligible seniors avoid institutional care by providing them with a rich mix of acute and long-term care services in the community. PACE is a Medicare managed care program and a Medicaid state plan option with the great majority of PACE enrollees being dually eligible, that is, enrolled in both Medicare and Medicaid.1 Therefore, PACE organizations receive two capitation payments per month for their enrollees, and assume full financial risk for all the health care services that participants use.
Individuals who are 55 or older, certified by their state of residence as being eligible for NH level of care, and live in the service area of a PACE program are eligible to enroll in PACE. Designed for the frail elderly or disabled individuals, PACE programs are centered around: (1) the adult day health center where participants receive medical and social services; and (2) an interdisciplinary team comprising of physicians, nurse practitioners, social workers, nutritionists, therapists, personal care attendant, and drivers. The typical PACE enrollee tends to be over 75 years old and female with multiple chronic conditions, as well as two or more limitations in activities of daily living (ADLs) (MedPAC 2012; Hirth et al. 2009). Currently, there are 88 PACE sites across 29 states serving over 25,000 enrollees (National PACE Association 2012), most of whom are dually eligible.
PACE is a comprehensive care model that aims to not only meet the health care needs of frail and NH eligible seniors in the community, but also integrate and coordinate care in an efficient manner that avoids fragmentation in care delivery and reduce the use of expensive and potentially avoidable acute and long-term care services. Through the provision of integrated care and with complete flexibility to use the capitation amounts in any manner deemed essential, PACE programs are intended to improve care quality and beneficiary satisfaction, while cutting down on wasteful health expenditures.2 Hence, one of the key questions central to the success of PACE as a publicly funded and capitated comprehensive care program, is how the capitation payments compare to what costs would have been for these enrollees had they been in fee-for-service (FFS) Medicare and Medicaid? Our study aims to address this question using secondary data and a nonexperimental research design.
Trying to answer this question, however, leads to a second and equally important question of how we estimate what those FFS costs would have been; that is, who or what comprises the right comparison group for PACE enrollees? Among alternative strategies, some prior studies based on administrative claims data have relied on using a comparison group of enrollees in home and community-based services (HCBS) 1915(c) waiver programs, who, similar to PACE enrollees, are required to be certified by the state as being eligible to receive NH care (Foster, Schmitz, and Kemper 2007). This is a reasonable comparison group strategy in the absence of any evidence suggesting that dual eligibles who choose to enroll in PACE have different health care needs on average than dual eligible recipients of HCBS waiver services. Even if service use and chronic conditions prior to enrollment in PACE is similar to service use prior to receipt of HCBS, PACE enrollees could have higher (or lower) expected need for services in the future than those who choose to receive HCBS in their homes. While people who choose to receive their care at a PACE day center might be expected to be frailer on average than those receiving HCBS, some HCBS recipients are home bound, and therefore even more functionally impaired than those who are able to attend a day center. A few other studies have either used multiple comparison groups of HCBS waiver enrollees and NH residents (Mancuso, Yamashiro, and Felver 2005) or have combined those two groups together to define a broader comparison group consisting of both waiver enrollees and NH residents (Wieland et al. 2012). Using such an expanded definition of the comparison group has the advantage of addressing the belief of some PACE proponents that many or most beneficiaries enrolling in PACE would have entered a NH in the absence of the program. Hence, a comparison group consisting of both HCBS waiver enrollees and NH entrants seems to provide a well-balanced counterfactual of beneficiaries residing either in the community or in a NH for evaluating PACE programs.
Being constrained by project resources to rely on administrative claims alone, we adopt a similar approach in this study. The treatment group (PACE) in our study sample, therefore, consists of NH eligible seniors, and are well-matched on other baseline characteristics, chronic conditions, as well as Medicare service use and costs to the comparison group, consisting of a matched group of NH eligible seniors who were either enrolling in HCBS or new entrants to a NH, as described in subsequent sections of this paper.3 In line with the approach used in some prior studies, we also use a second matched comparison group comprised of HCBS waiver enrollees alone to examine all outcomes.
Not surprisingly, a review of existing evaluations of PACE (Ghosh, Orfield, and Schmitz 2013) shows that there are significant challenges in evaluating PACE, including the reliance on quasi-experimental research designs for such evaluations and difficulties in defining an appropriate comparison group. Most previous studies examining the effect of PACE on expenditures do not meet the standards for a rigorous nonexperimental evaluation--either due to the absence of a comparison group or due to the inability to establish baseline equivalence between PACE enrollees and comparison group beneficiaries. In the two studies that do meet these criteria, only one examined Medicare costs. That study found that the PACE capitation payments from Medicare were very similar to the Medicare FFS expenditures that these enrollees would have experienced in the absence of PACE (Foster, Schmitz, and Kemper 2007). However, PACE was associated with Medicaid expenditure that were several hundred dollars per beneficiary per month (PBPM) higher than a comparison group consisting of HCBS waiver enrollees only, with the gap in expenditures between PACE and comparison group members diminishing over time (Mancuso, Yamashiro, and Felver 2005; Foster, Schmitz, and Kemper 2007). Medicaid expenditures under PACE were similar to that of a comparison group consisting of NH residents (Mancuso, Yamashiro, and Felver 2005).4
These findings from prior evaluations looking at potential cost savings under PACE are likely to be outdated, given changes to the PACE financing structure over time, especially for Medicare capitation payments, as calculated under the Medicare managed care program, also known as Medicare Advantage.5 Currently, the base Medicare capitation rate for PACE is a risk-adjusted payment, based on the Centers for Medicare and Medicaid Services (CMS)-hierarchical conditions category (HCC) risk adjustment model. Moreover, since 2008, the base rate is multiplied by a plan-specific frailty factor, rather than the uniform frailty factor used previously.6 See Appendix A for details on how changes in the Medicare capitation payment for PACE evolved over time.
The Medicaid monthly capitation rate is negotiated between the PACE organization and the state Medicaid agency and is contractually specified. Medicaid capitation rates for PACE plans are subject to an upper payment limit (UPL) based on the cost of a comparable FFS equivalent population. The UPL is determined separately by each state. Most states calculate the UPL by using a blend of FFS costs for NH residents and HCBS waiver enrollees. The monthly capitation rate to PACE plans is then set as a percentage of the UPL, for example, between 85 and 95 percent. However, states are experimenting with alternative approaches to setting capitation rates--for example, using risk-based models. Finally, states vary in their approaches for adjusting rates for trends and for frailty and health status.
Given the changes in Medicare's payment methodology for PACE, prior studies investigating potential cost savings under PACE need to be updated by new studies that examine Medicare and Medicaid costs for PACE under the current capitation system relative to the prevailing FFS model. In particular, it is important to pose the question as to whether the shift towards a better calibrated Medicare capitation rate has generated cost savings for Medicare, and whether changes in Medicaid payment rates have led to gains or losses for Medicaid.
The primary goal of this study, therefore, is to determine whether the previous findings of cost neutrality for Medicare expenditures and overpayment (relative to FFS) for Medicaid expenditures under PACE, is still the case, and if not, how it has changed. We focus on more recent cohorts of PACE enrollees to capture the effects of the changes in the Medicare capitation payment as well as any changes in Medicaid capitation rates. Specifically, we use data from eight states on dually eligible beneficiaries newly enrolled in PACE during 2006-2008, along with data on two different comparison groups: (1) a matched comparison group of beneficiaries either enrolling in Medicaid HCBS waiver programs or entering a NH around the same time and in the same states; and (2) a matched comparison group of beneficiaries entering Medicaid HCBS waiver programs alone around the same time and in the same states. Both groups are followed from their sample entry point through 2011. However, the change in payment methodology is not the only reason to expect that the cost impacts of the program may have changed. Secular changes have also been occurring in long-term care, with greater emphasis on community-based services and less on NH care (often referred to as "re-balancing" long-term care spending). These changes have been supported or driven by the large Money Follows the Person program, by states' NH diversion programs, and by the increasing availability of NH alternatives such as assisted living facilities and group homes. Hence, it is important to obtain updated estimates for cost savings under PACE.
It is important, at the outset, to emphasize two critical points so that the methods and aim of the paper are clear. First, expenditure comparisons between PACE enrollees and members of selected comparison groups do not depend in any way on the behavior of PACE plans. Rather, they are constructed as contrasts of PACE capitation rates, set by Medicare and Medicaid policy, with the (regression-adjusted) FFS expenditures that they are predicted to have incurred had they not been in PACE and remained in FFS Medicare. That prediction is based on the experiences of comparison group members with the same diagnoses and characteristics. We stress this point here to remind readers not to ascribe findings of net "saving" or net "cost" associated with enrollment in PACE to efficient or inefficient behavior by PACE plans. The contrasts provide information about the degree to which payments made to PACE plans result in higher or lower costs than the Medicare and Medicaid programs would likely have incurred for PACE enrollees had the PACE option not existed.
The second caution is to bear in mind that, because this study relies exclusively on administrative data, it does not compare important dimensions of patient outcomes related to quality of care and quality of life. It would have been preferable, were greater resources available to this project, to accompany cost comparisons of PACE to care in NHs or other community-based care with an examination of the effect of PACE on enrollees' health outcomes, support for ADLs, feelings of security and well-being, and control over their own lives. The all-inclusive nature of PACE care and the dedication of PACE to comprehensive care planning might well have strong effects on health and well-being. Were this to be established, then comparative effectiveness of the PACE intervention would be a natural subject for future studies.
Along with program effects on costs, we examine effects of PACE on the use of nursing facility services7 and differences in mortality between PACE and matched comparison group members. We specifically address the following research questions in this paper. Comparing PACE enrollees to a matched comparison group of enrollees in FFS setting:
-
Do PACE participants have lower Medicare and Medicaid expenditures?
-
Do PACE participants have a lower likelihood of NH admission, fewer days in NH, and also lower likelihood of being in a NH for at least 30 days or at least 90 days during each followup interval?
-
Do PACE enrollees have lower mortality rates?
-
How do these differences vary by length of enrollment in the program and by state?
The remainder of this paper is organized as follows. In Section II, we describe the study design, data, and methods. Results are presented in Section III, and Section IV concludes with a discussion of the findings, study limitations, and possible direction for future research in this area.
II. DESIGN AND METHODS
A. Study States
The study included eight states that had a sufficient number of PACE enrollees during 2006-2008 (the years of sample entry for the study) and also had participants in at least one Medicaid HCBS 1915(c) waiver program targeted at aged enrollees during the same years. Specifically, we selected states that had at least 250 new PACE enrollees over the three year period from 2006 to 2008 and had a sizeable number of new enrollees (over 3,000) in waiver programs of type G (aged and disabled waiver) and type H (aged waiver), over the same period.8 The eight states included in the study are: California, Colorado, Massachusetts, Michigan, New Mexico, New York, Oregon, and Pennsylvania. They include states with a relatively large PACE population (e.g., the states of California, Massachusetts, and New York, which each had over 1,000 new entrants across the three years), as well as states with somewhat smaller PACE population (e.g., New Mexico and Oregon). This set of states includes at least one from all regions of the United States except the Deep South--the Northeast (Massachusetts, New York, and Pennsylvania), Midwest (Michigan), Southcentral (Colorado), Southwest (New Mexico), and the West/Northwest (California and Oregon).
B. Sample Selection
We use a matched comparison group design for the study. New enrollees in PACE (treatment group) during 2006-2008 in each of those eight states were either matched to: (1) new enrollees in the HCBS 1915(c) waiver programs and new NH entrants in each of those three years; or (2) new enrollees in HCBS waiver programs alone. Participants in HCBS waiver programs alone could offer a reasonable comparison group for PACE enrollees, since waiver participants also have to meet standards for NH certifiability in their respective states, just like their counterparts in PACE. However, the National PACE Association and the PACE plans have previously asserted that PACE enrollees have higher health care service and support requirements than HCBS enrollees. For instance, some PACE enrollees likely would have entered a NH had PACE not been a local alternative. To address such concerns about unmeasured differences between PACE and matched comparison group enrollees in our analysis, we include in the pool of potential comparison group members both new HCBS waiver enrollees and new NH entrants in constructing the first matched comparison group, thereby offering a credible alternative to a comparison group comprised of HCBS waiver enrollees alone. This approach allows the matching algorithm (described below) to choose the closest matches from the comparison group pool for each PACE enrollee, regardless of whether the closest match for the enrollee is a NH entrant or waiver enrollee.9
For each of the eight states, the treatment group is comprised of new enrollees in PACE who meet the following sample selection criteria: (1) entered PACE between July 2006 and December 2008; (2) were enrolled in FFS Medicare for at least one month in the year prior to enrollment in PACE, had nonmissing information on Medicare service utilization in the prior year, and were at least 66 years old at PACE entry; (3) were enrolled in Medicaid within a month of entering PACE; and (4) had at least one month of enrollment during the followup period, that is, was alive and enrolled in PACE for at least one month (to ensure nonzero Medicare/Medicaid capitation payments). HCBS waiver enrollees and NH entrants in the comparison group had to meet similar criteria, as follows: (1) entered a type G or type H waiver program between July 2006 and December 2008, or entered a NH over the same period with the duration of the first stay being at least 21 days;10 (2) were enrolled in FFS Medicare in the year prior to enrollment in HCBS or NH entry, had nonmissing information on Medicare service utilization in the prior year, and were at least 66 years old at HCBS/NH entry; (3) had a ZIP code of residence that was among the ZIP codes of residence for PACE enrollees in that state and for the same year of sample entry; and (4) had at least one month of Medicare and Medicaid FFS enrollment during the followup period, that is, was alive and not in managed care for at least one month (we examine FFS Medicare/Medicaid expenditures only for our comparison group members; that is, we do not examine managed care expenditures for comparison group members (we stop following comparison group members once they enroll in either Medicare or Medicaid managed care). Also, we do not examine post-disenrollment FFS expenditures for PACE enrollees who disenroll from the program and return to FFS). Figure 1a, Figure 1b and Figure 1c describe the sample selection process for PACE entrants as well as sample members in the comparison group (HCBS waiver enrollees and NH entrants).
C. Matching Algorithm
Once the final PACE, HCBS, and NH samples were chosen, we used a nearest neighbor matching algorithm based on propensity score estimation--implemented separately for each of the eight states. Under this approach, we first estimated a logistic regression with a binary outcome variable for treatment status (PACE = 1; HCBS/NH = 0) and with pre-enrollment demographics, chronic conditions, and service utilization and costs included as covariates in the model. Specific covariates that we included in the model are--age; gender; indicators for race; indicators for chronic conditions (Alzheimer's disease or dementia, coronary artery disease (CAD), congestive heart failure (CHF), depression, diabetes, and stroke); number of chronic conditions; indicators for any inpatient hospitalizations, any emergency room (ER) visits, any SNF use, and any home health service use; and annualized total Medicare expenditures--all measured over the calendar year prior to the year of enrollment in PACE or HCBS waiver services or NH entry, and obtained from the Master Beneficiary Summary File (MBSF, described below).
Next, we used the propensity scores or the predicted probabilities of being a treatment group (PACE) enrollee, as obtained from the logistic regression, to implement our matching algorithm. Using the nearest neighbor algorithm, we matched each PACE enrollee to the comparison group (HCBS enrollee or NH entrant) with the closest propensity score. To allow for the best possible matches, we implemented matching with replacement, that is, the same comparison group enrollee could be matched to more than one PACE enrollee (overwhelming majority of the matched comparison group members--nearly 88 percent--were matched to a single PACE enrollee). The final matching weight of a comparison group enrollee is, therefore, the number of treatment group enrollees to whom she has been matched, and the weighted comparison group sample size is equal to the number of PACE enrollees in the sample. We estimated the propensity score model and implemented the nearest neighbor algorithm separately for each of the eight states in our sample.
Next, we repeated the matching process with only HCBS waiver enrollees in the comparison group pool, that is, without the NH entrants, in order to draw a second matched comparison group consisting of HCBS waiver enrollees alone (using matching with replacement, over 76 percent of matched HCBS enrollees were matched to a single PACE enrollee). We use this second matched group of HCBS waiver enrollees to examine all outcomes--expenditures, mortality, and NH utilization--for PACE versus matched comparison group members. Also, this second matched comparison group forms the basis of our main findings for the NH utilization outcomes since NH utilization in the first comparison group would be severely skewed upwards by the inclusion of NH entrants. Matching results, including evidence of baseline equivalence, are presented for both matched comparison samples in Section III below.
D. Data
We use Medicare and Medicaid enrollment and claims data from a variety of sources for identifying PACE and HCBS enrollees as well as NH entrants, imposing our sample selection criteria, matching, and outcomes analysis. The specific data sources or files we used are described below together with the purposes for which we used them.
-
Medicare Advantage and Prescription Drug (MARx) data. This dataset includes information on managed care enrollment and Medicare payments for all beneficiaries in a Medicare managed care plan, including PACE. We used MARx data for 2006-2011 to identify new enrollees in PACE as well as their ZIP codes of residence during 2006-2008, track disenrollment from PACE during the followup period, and obtain Medicare capitation payments for every month during the followup period, through 2011.
-
Medicaid Analytic eXtracts (MAX) files. These files are derived from the Medicaid Statistical Information System, contain information on Medicaid-covered services, and are intended for analytic use. MAX consists of the following five files: person summary (PS) file, inpatient (IP) file, long-term care (LT) file, prescription drug (Rx) file, and the other (OT) file. We used the MAX PS file to identify PACE enrollees who were dually eligible for both Medicare and Medicaid; identify new HCBS enrollees and NH entrants in each of the three years (2006-2008). We used the other MAX files to calculate total Medicaid expenditures for HCBS enrollees and NH entrants, and obtain Medicaid capitation payments for PACE enrollees during 2006-2009 (latest available year).
-
Master Beneficiary Summary File (MBSF). The MBSF, produced by the Chronic Conditions Warehouse (CCW), provides summary information on FFS Medicare beneficiaries on a calendar year basis. It consists of the following four segments: base segment with beneficiary enrollment information, demographics, state and county codes, ZIP code, etc.; the chronic conditions segment with CCW flags for several chronic conditions; cost and utilization segment with summarized annual information on service utilization and Medicare payments, by service type; and the national death index segment with cause of death information. We used the MBSF for 2005-2011 to obtain data on pre-enrollment demographics, chronic conditions, and Medicare cost/use for both the PACE and comparison group (HCBS and NH) members in the calendar year prior to the year of enrollment or NH entry, and also for mortality information during the followup period.
-
Medicare Standard Analytic Files (SAFs). These files contain details about Part A and Part B services covered by Medicare, including dates of service, descriptions of services, diagnoses, provider types, and reimbursement amounts for Medicare beneficiaries receiving care on a FFS basis. SAFs are built from "final action, fully adjusted" claims suitable for research. SAFs consist of the following types of Medicare claims files for Part A and Part B services: Carrier (or, physician/supplier Part B claims), durable medical equipment, home health, hospice, inpatient, outpatient, and SNF. We used data from the SAFs over 2006-2011 to measure total Medicare expenditures for members of the matched comparison group in the followup period.
-
Minimum Dataset (MDS) Timeline File. The detailed Timeline file, produced on a calendar year basis, contains a separate variable for each day of the year to identify whether a beneficiary was in the community or in a NH, SNF, or hospital. We used this file during 2006-2009 (latest available year) to obtain information on the utilization of NH services by both PACE and matched HCBS waiver enrollees during the followup period. We specifically used a value of "M" or MDS on the daily flag in the Timeline file to identify PACE or HCBS enrollees in the NH on a particular day during the followup period.11 Our outcome measures for use of nursing facility services, based on the Timeline File, could therefore include some nursing facility stays that initially began as a SNF stay. Since PACE enrollees are in managed care, their use of nursing facility services is not observed in either Medicare or Medicaid claims data. Thus, the Timeline file was the only source of information for consistently identifying the use of nursing facility services for both PACE and matched HCBS enrollees, but it does not enable us to distinguish SNF stays from other NH stays.
E. Outcomes
Medicare and Medicaid Expenditures
We examine PBPM Medicare expenditures, Medicaid expenditures, and total expenditures over successive six-month intervals from the month of enrollment or NH entry for PACE enrollees and their matched comparison group counterparts (HCBS enrollees and NH entrants). For PACE enrollees, aggregate expenditures during a particular interval are essentially the sum of monthly Medicare or Medicaid capitation payments during that interval, and for HCBS enrollees or NH entrants these are the total FFS expenditures (Medicare or Medicaid) during that interval. PACE enrollees in our sample who leave PACE are therefore lost to followup in our study. Similarly, we also stop following matched comparison group members once they leave FFS Medicare or Medicaid and enroll in a managed care program.12 In other words, unlike in an intent-to-treat analysis where beneficiaries would have been followed until death or till the end of the observation period regardless of their enrollment status, we follow treatment group beneficiaries as long as they are alive and enrolled in PACE, and follow comparison group beneficiaries as long as they are alive and not in managed care. Hence, PBPM expenditures during each six-month interval are calculated as Medicare or Medicaid expenditures during that interval divided by the number of eligible months during that interval, where eligible months are defined as months alive and enrolled in PACE or months alive, enrolled in Medicaid and Medicare, and not in managed care (for the HCBS and NH groups).
We compare the weighted mean capitation payments (separately for Medicare and Medicaid, and the combined total) PBPM, for PACE enrollees in each six-month interval, where the weights are equal to the share of months eligible during that interval, to the weighted mean of their predicted expenditures. To predict what the monthly Medicare and Medicaid expenditures for PACE sample members would have been in the absence of PACE, we estimated linear regression models for these two public programs using the matched comparison group of beneficiaries in each interval. These regressions use weights calculated as the product of share of months eligible and the matching weight for comparison group members. The independent variables in the regression models include all variables used in propensity score matching, as well as the number of months between the end of the pre-enrollment year and the month of sample entry, a binary indicator for NH use in the 90 days prior to sample entry, and indicators for state. We used the estimated regression coefficients for the matched comparison group to predict what the mean monthly expenditures for PACE sample members would have been had they begun using HCBS or entered a NH instead of receiving PACE services, when their followup period began. For each six-month interval of Medicare or Medicaid expenditures, we insert the mean baseline characteristics of PACE sample members into the regression equation that was estimated for the members of the matched comparison group. The difference between actual expenditures and predicted expenditures represents the estimated effect of PACE on Medicare and Medicaid expenditures. Standard errors for the regression-adjusted comparisons of actual and predicted expenditures for PACE enrollees had to be separately computed because they involve a comparison of mean expenditures for PACE participants to a regression-based prediction of mean expenditures that PACE participants would have incurred had they started using HCBS or entered a NH instead of enrolling in PACE. These calculations are described in Appendix B.
Given that the earliest enrollment in our study sample occurs in July 2006, we are able to follow Medicare expenditures for a maximum of 66 months (through 2011) after program entry, but are able to follow Medicaid expenditures for only a maximum of 42 months (through 2009). Thus, we examine Medicare expenditures for a total of 11 six-month intervals and examine Medicaid expenditures for a total of seven intervals.
Our main findings from the expenditures analysis is based on comparing PACE enrollees to the matched comparison group comprised of both HCBS waiver enrollees and NH entrants. However, we repeat the expenditures analysis with the second comparison group comprised of matched HCBS waiver enrollees alone and discuss those results separately.
Mortality
We examine the cumulative mortality rates for PACE and the matched comparison group (HCBS enrollees and NH entrants) over successive six-month intervals from sample entry. The denominators for the mortality rate calculations were fixed in both groups as the number of treatment and matched comparison group members in the final matched sample for the first six intervals (since all sample members had at least 36 months of followup, with mortality data available through 2011), and restricting the samples in later intervals to those whose period of sample entry would allow us to observe their mortality in a particular interval.13 For each interval, we estimate a separate logistic regression with the mortality indicator as the dependent variable and with similar control variables as for the expenditures analysis, plus a binary indicator identifying the observation as a PACE enrollee or comparison group member. We obtain regression-adjusted predictions of mortality for both PACE enrollees and their matched counterparts in the comparison group. For the mortality analysis, we also compare PACE enrollees to the second matched comparison group comprised of matched HCBS waiver enrollees alone, that is, we present separate mortality results from using both comparison group strategies. Observations for matched comparison group members are weighted using the matching weights only.
Nursing Home Utilization
We also examine use of NH services for both PACE and matched comparison group members, using both matched comparison samples. However, for the NH utilization outcomes, we lead with the results obtained from using the matched comparison group comprised of HCBS waiver enrollees alone. As mentioned above, since NH entrants have high NH utilization by default, using the matched comparison group comprised of both NH entrants and HCBS waiver enrollees would skew the findings in favor of PACE. As a sensitivity test, we do present findings from using this alternative comparison group strategy, and the results are in line with our expectation of being highly favorable for PACE.
For this analysis involving PACE and matched HCBS waiver enrollees, we obtained information on NH utilization from the MDS Timeline file. Specifically, we compare four outcomes--(1) any use of the NH; (2) proportion of days in a NH; (3) at least 30 days (not necessarily consecutive) in a NH; and (4) at least 90 days (not necessarily consecutive) in a NH--for PACE and matched HCBS members over successive six-month intervals from enrollment or sample entry through 2009, that is, for a maximum of 42 months of followup or a total of seven intervals. The last two outcomes (at least 30 or 90 days in a NH) are defined conditional on a sample member being alive during an interval. For each interval, we estimate a separate linear regression for proportion of days in a NH, and separate logistic regressions for the three other binary outcome variables, and obtain regression-adjusted predictions of NH utilizationfor both treatment and matched comparison group members. The control variables in the regression model are same as those used for the mortality analysis. These regressions use the eligibility weights for the treatment group, and eligibility weights multiplied by the matching weights for matched HCBS members, as for the analysis involving expenditures.
III. RESULTS
A. Results from Matching
The final analysis sample using the first comparison group strategy consisted of 3,725 PACE and 3,264 matched comparison group members, of whom 1,834 were NH entrants and 1,430 were HCBS waiver enrollees. Table 1 shows the distribution of the final, matched study sample across the eight states in the study, by treatment status. The number of PACE enrollees in our final matched sample ranged from 118 in New Mexico to 952 in New York, with New York, Massachusetts, and California being the three largest states in terms of sample size or the number of treatment and matched comparison group members.14 For four states (California, Massachusetts, Michigan, and Pennsylvania) NH entrants comprised the majority of the matched comparison group, while for the other four states (Colorado, New Mexico, New York, and Oregon), there were a greater number of HCBS waiver enrollees in the matched comparison group. Table 1 also shows the sample breakdown for the second matched comparison group, comprised of HCBS waiver enrollees alone. The second matched comparison group is somewhat smaller, with 2,745 HCBS waiver enrollees.
Figure 2a and Figure 2b present histograms of the estimated propensity score in the treatment and matched comparison groups, for the two matched samples. In each of these figures, the distribution of the score across the treatment and matched comparison groups, that is, the percentage of treatment and matched comparison group enrollees in each bin of the probability distribution of being in PACE, was similar. In other words, the treatment and matched comparison groups were well-matched on the probability distribution of being in treatment status.
In Table 2, we present the results from testing for baseline equivalence in the matched sample when PACE enrollees are matched to the combined pool of NH entrants and HCBS waiver enrollees (A) or to HCBS enrollees alone (B). We find that PACE and the matched comparison group A were well-matched in baseline characteristics, chronic conditions, and in Medicare service use and costs. For instance, the average age of beneficiaries in both groups was 79 years with around 70 percent being female; more than a third of beneficiaries in both groups had Alzheimer's or dementia, around a third of the enrollees had an inpatient admission in the calendar year prior to the year of sample entry, and their average, annualized Medicare expenditures in the prior year were over $14,000. The only statistically significant difference between the two groups was in the prior use of SNFs, with the treatment group at a slightly higher rate of use (13 percent) relative to the matched comparison group (11 percent). An F-test reported at the bottom of Table 2 did not reject the null hypothesis of equality in the joint distribution of all matching variables across the two groups. Also, when PACE enrollees were matched to HCBS waiver enrollees alone (matched comparison group B in Table 2), the two groups were nearly identical in their mean baseline characteristics, chronic conditions, and Medicare service use and costs--with none of the differences being statistically significant.
Table 2 also reports means for two other variables that were not used in matching --whether a beneficiary was enrolled in Medicaid in the 12 months prior to sample entry and whether a beneficiary was in a NH in the 90 days prior to sample entry. We find that a similar percent of treatment and matched comparison group members had Medicaid enrollment in the prior 12 months. Specifically, 79 percent of PACE enrollees, 77 percent of matched comparison group members in sample A, and 81 percent of matched HCBS waiver enrollees in sample B were enrolled in Medicaid in the prior 12 months, with the difference between PACE enrollees and matched comparison group members in sample A being statistically significant. In general, a small percentage of members in the treatment and matched comparison groups--7 percent, 2 percent, and 5 percent respectively in PACE, mixed comparison sample (A), and HCBS-only comparison sample (B)--were in a NH in the prior 90 days, with the treatment-comparison difference statistically significant in both matched samples. This percentage is especially low (2 percent) in the matched comparison sample A, since we excluded NH entrants with any NH stay in the prior 90 days from the study sample, and therefore, we did not use this as a matching variable in our analysis.15
B. Results from the Analysis of Medicare and Medicaid Expenditures
1. Results for Medicare and Medicaid Expenditures Using the Matched Comparison Group of Both NH Entrants and HCBS Waiver Enrollees
Using the sample of PACE enrollees matched to the combined pool of NH entrants and HCBS waiver enrollees, we compared the average per beneficiary monthly capitation payments under PACE with predicted expenditures for PACE enrollees had they been in an HCBS waiver program or in a NH in successive six-month intervals since enrollment. Most of the differences between actual and predicted monthly Medicare expenditures for PACE enrollees were statistically insignificant at the 10 percent level (Table 3). In the first six months after sample entry, actual Medicare expenditures for PACE enrollees were significantly lower than predicted expenditures by nearly $2,000 (p-value < 0.001).16 However, in three other intervals (third, fifth, and tenth), actual Medicare expenditures significantly exceeded predicted expenditures by $234 to $445. In the remaining seven intervals, the difference between actual and predicted Medicare expenditures was statistically insignificant.
Actual monthly Medicaid expenditures on PACE enrollees, however, significantly exceeded predicted Medicaid expenditures in all seven intervals. The magnitude of the difference was also quite stable over time--between $546 and $647, and around the $600 mark (all p-values < 0.001). For combined Medicare and Medicaid expenditures, actual costs for PACE enrollees significantly exceeded predicted expenditures by $426 to $917 in five intervals, and the difference, though positive and large, was statistically insignificant in the last interval. However, in the first interval, actual costs were significantly lower by $1,400--a consequence of the large negative Medicare cost difference.
Results from Sensitivity Tests for Medicare and Medicaid Expenditures
We ran two sensitivity tests for the expenditures analysis to confirm that the main findings were robust to changes in the study sample. First, we dropped 606 PACE enrollees, comprising about 16 percent of the treatment group members, who were either enrolled in HCBS waiver services in the six months prior to enrolling in PACE or were in a NH in the 90 days prior to enrolling in PACE, and also dropped around 4 percent of the HCBS waiver enrollees who were in a NH in the 90 days prior to enrolling in the waiver program. The reason for dropping these PACE or HCBS enrollees from the sample prior to matching was to maintain comparability between the two groups by limiting the samples to individuals who were initiating a need for long-term support services at the time of sample entry. We reran matching with the remaining 3,119 PACE enrollees and obtained 2,806 matched comparison group members (1,619 NH entrants and 1,187 HCBS waiver enrollees). The two groups (PACE enrollees and matched HCBS waiver and NH entrants) were well-matched in all baseline covariates, as before (not shown). Further, the results for Medicare, Medicaid, and combined expenditures were similar to the main findings, with few significant differences in Medicare expenditures, actual Medicaid expenditures significantly higher-than-predicted expenditures in all seven intervals, and actual combined expenditures being significantly higher-than-predicted expenditures in all but the first interval, where it was significantly lower by close to $1,500 (Table 4). One difference between the findings from this first sensitivity test and the main findings was that the difference in capitation payments and predicted Medicaid expenditures increased over time from $458 to $964, instead of remaining stable around $600. This is reflected in the findings for combined Medicare and Medicaid expenditures as well.
In another sensitivity test, we excluded the State of New York from the study sample. This test served dual purposes. First and most important, New York being the largest state in the sample and comprising over one-quarter of the full PACE sample, it allowed us to test that the results were not driven by New York. Second, since New York has a number of managed long-term care plans with capitated HCBS but all other Medicaid services provided on an FFS basis, Medicaid expenditures for the matched comparison enrollees from New York could be underestimated, since we calculate FFS expenditures only from the MAX files. Note that the direction of possible bias in the findings from such an underestimation of Medicaid costs for the matched comparison group is quite clear--it underestimates the cost that PACE enrollees would likely have incurred had they remained in FFS, and therefore increases the likelihood of finding that capitated Medicaid payments for PACE exceed predicted expenditures in New York and overall (if New York is included). Given Medicaid expenditure results that do suggest higher Medicaid expenditures under PACE, it was important to test that our main results were unaffected after the exclusion of New York from the study sample.
With the treatment and matched comparison group members from only seven study states, we obtained a new set of findings from the expenditures analysis that closely resembled the main findings (Table 5), further boosting confidence in these impact estimates. For instance, there were only a few significant differences for Medicare expenditures; significantly higher actual Medicaid expenditures for PACE enrollees relative to predicted expenditures in all intervals, and higher actual combined expenditures than predicted expenditures in all but the first interval, as before. One important difference was that the significant gap in Medicaid spending--between actual and predicted expenditures for PACE enrollees--was much higher at $990-$1,323, compared to differences of around $600 in the main findings. This suggests that capitated Medicaid expenditures for PACE enrollees was lower than predicted expenditures in New York, as is borne out by results in the following subsection. More importantly, it suggests that once we rule out any incompleteness in Medicaid expenditures data by excluding New York from the analysis, PACE enrollees still have consistently higher Medicaid capitation payments than predicted expenditures across the remaining seven study states, and in all seven intervals. This also leads to a higher gap between actual and predicted combined expenditures, as reflected in the findings for combined Medicare and Medicaid expenditures in Table 5.
State-Specific Findings for States with Adequate Sample Size
We also looked at state-specific results for the three states with the largest new PACE enrollment over the 2006-2008 period--California, Massachusetts, and New York. However, for these state-specific results--especially for Massachusetts--the sample sizes in most of the later cost intervals, for example, all cost intervals from month 37 of the followup period onwards, were rather small. Hence, the results for these later intervals are likely to be less reliable, especially for Massachusetts.
The state-specific results point towards some interesting differences across states in the expenditure findings. For instance, in California, as for all eight states taken together--there were few significant differences for Medicare expenditures (four significant difference--all negative, suggesting lower actual expenditures than predicted expenditures--for the first four intervals), and significantly higher actual Medicaid and combined expenditures than predicted expenditures for PACE (Table 6). However, the Medicaid spending gap in California was much larger compared to that for the main findings across all eight states, and increased over time from $1,574 in the first interval to $2,672 in the last (and over $3,000 in the fourth and sixth intervals)--due both to an increase in actual PACE capitation payments and a reduction in predicted expenditures over time--a pattern present in the results for combined Medicare and Medicaid expenditures as well.
For Massachusetts, we discuss results through month 36 or the first six intervals only, since the number of PACE enrollees drops to 66 or below in the later intervals. In general, the pattern of findings in Massachusetts for Medicare, Medicaid, and combined expenditures was similar to the main findings (Table 7). However, the Medicaid spending gap decreased over time from $648 in the first interval to $172 in the sixth--due to an increase in predicted expenditures--and the spending gap was statistically significant only in the first three intervals.
The Medicaid expenditure findings for New York differ markedly from the main findings and from those for California and Massachusetts. First, capitated Medicare expenditures were significantly higher under PACE than predicted expenditures in three intervals, with the difference in the first interval continuing to be negative and significant as before. Enrollees' actual Medicaid costs under PACE were significantly lower than their predicted Medicaid FFS costs in all seven intervals by $674-$1,046. Combined Medicare and Medicaid capitated expenditures were lower in all intervals as well, though significantly different from predicted expenditures only in three of the seven intervals (Table 8). Since Medicaid expenditures for the matched comparison group are likely to be underestimated in New York, the magnitude of the negative gap in Medicaid spending would be even larger if Medicaid costs in the comparison group were not potentially incomplete. Hence, our findings show that actual Medicaid expenditures under PACE were significantly lower in New York than expected costs had PACE enrollees been in HCBS waiver programs or in NHs instead.
The Medicaid results in New York seem to be driven by fairly constant or slightly decreasing Medicaid capitation payments over time that are consistently lower than the slightly increasing predicted Medicaid expenditures. For California, the four negative and statistically significant differences on Medicare expenditures was a consequence of both lower actual Medicare capitation payments and higher predicted Medicare expenditures than other states. Finally, for Massachusetts, even though Medicaid capitation payments were lower than all eight states taken together, even lower predicted expenditures resulted in a positive Medicaid spending gap, which diminished as predicted expenditures increased over time. With a longer followup for Medicaid expenditures, it would have been possible to test for favorable Medicaid expenditure findings in Massachusetts as well.
Notably, for both California and Massachusetts--states with a positive Medicaid spending gap--NH entrants comprised the majority of matched comparison group members, especially in California. This suggests that in spite of higher expected Medicaid costs in the comparison group for these states, PACE capitation payments from Medicaid still exceeded predicted Medicaid expenditures. In contrast, the mix of NH entrants and HCBS waiver enrollees was more balanced in New York, with HCBS enrollees slightly outnumbering NH entrants. This could possibly lead to an additional under-prediction of comparison group Medicaid costs in New York, which further established the robustness of our finding of a negative Medicaid spending gap in favor of PACE in New York.
We also tested the state-specific impact estimates for Medicare, Medicaid and total expenditures to determine if estimated impacts were significantly different from each other across states. In general, the impact estimates for Medicaid expenditures were significantly different from each other in all state-to-state comparisons, while the impact estimates for Medicare expenditures tended to differ across states in the first few intervals only (results not shown). Comparing California and Massachusetts, the impact estimates for Medicare expenditures were significantly different from each other at the 10 percent level in the first four intervals, impact estimates for Medicaid expenditures differed significantly in all intervals, and impact estimates for combined expenditures were different in all six intervals reported for Massachusetts. Comparing California and New York, the impact estimates for Medicare expenditures were significantly different from each other at the 10 percent level in the first five intervals, impact estimates for Medicaid expenditures differed significantly in all intervals, and impact estimates for combined expenditures were different in all but the first interval. Finally, comparing Massachusetts and New York, the impact estimates for Medicare expenditures were significantly different from each other at the 10 percent level only in the first interval, impact estimates for Medicaid expenditures differed significantly in all six intervals reported for Massachusetts, and impact estimates for combined expenditures were different in the second to fifth intervals.
2. Results for Medicare and Medicaid Expenditures Using the Second Comparison Group of Matched HCBS Waiver Enrollees Alone
Since some of the previous studies looking at expenditures under PACE used HCBS waiver enrollees alone as a comparison group, we repeated our analysis of Medicare and Medicaid expenditures using the second matched comparison group comprised of HCBS waiver enrollees alone (matched sample B). Both pooled and state-specific results from this analysis are presented in Tables 9-12. Broadly, the main findings across all eight states are essentially the same as for the main comparison group--actual expenditures under PACE are consistently higher-than-predicted expenditures. The positive difference for Medicare expenditures is statistically significant in five intervals, where the magnitude of the difference ranges from $243 to $784 PBPM (the negative difference of $42 in the first interval is now much smaller and not statistically significant, with the NH entrants no longer in the comparison group). Actual Medicaid expenditures PBPM under PACE are significantly higher in all seven intervals, with the magnitude of the Medicaid spending gap decreasing over time from over $2,016 to $1,284, as predicted expenditures increase (Table 9). Consequently, combined actual expenditures also significantly exceed predicted expenditures in all intervals, with the magnitude of the difference ranging from $1,323 to $1,974. Overall, with the second comparison group strategy, the magnitude of the estimated positive expenditure gap (higher actual payments under PACE) are much larger, consistent with lower expenditures in the comparison group with NH entrants excluded from it.
As before, for the state-specific results, the sample sizes in most of the later cost intervals, for example, all cost intervals from month 37 of the followup period onwards, were rather small. Hence, the state-specific results need to be interpreted with caution. None of the Medicare cost differences were significant in California, but actual Medicaid payments significantly exceeded predicted expenditures in all intervals,and by a larger magnitude of over $3,000, compared to the results before (Table 10). In Massachusetts (we discuss results through month 36 or the first six intervals only, since the number of PACE enrollees drops to 66 or below in the later intervals), once again, half the Medicare cost differences were not significant, and the Medicaid spending gap was positive and significant in all intervals--decreasing over time from $1,931 to $844 (Table 11). As before, the results for New York differed from those for the other states. Actual Medicare expenditures PBPM were significantly higher-than-predicted expenditures in seven of the 11 intervals by $748-$1,264. The Medicaid spending gap of $273-$644 was positive and significant in the first two intervals, but decreased over time, becoming negative in the last three intervals with magnitudes of $177-$377, with the negative difference of $214 in the fifth interval being statistically significant (Table 12). For all three states, combined actual expenditures exceeded predicted expenditures in all intervals, with the difference being statistically significant in most intervals.
As for the analysis involving the first matched comparison group, we checked if the state-specific impact estimates for Medicare, Medicaid and total expenditures were significantly different from each other in the analysis involving the second matched comparison group comprised of HCBS recipients only. As before, the impact estimates for Medicaid expenditures were significantly different from each other in all state-to-state comparisons, while the impact estimates for Medicare expenditures tended to differ across states in fewer intervals (results not shown). Comparing California and Massachusetts, the impact estimates for Medicare expenditures were significantly different from each other at the 10 percent level in the sixth interval only, impact estimates for Medicaid expenditures differed significantly in all intervals, and impact estimates for combined expenditures were different in the first five of the six intervals reported for Massachusetts. Comparing California and New York, the impact estimates for Medicare expenditures were significantly different from each other at the 10 percent level in the first three and the sixth intervals, impact estimates for Medicaid expenditures differed significantly in all intervals, and impact estimates for combined expenditures were different in all but the sixth interval. Finally, comparing Massachusetts and New York, the impact estimates for Medicare expenditures were significantly different from each other at the 10 percent level only in the first three intervals, impact estimates for Medicaid expenditures differed significantly in all intervals, and impact estimates for combined expenditures were different only in the fourth interval.
C. Findings from Analyzing Additional Outcomes
We also examined two important patient outcomes--mortality and use of NH services--for evidence of PACE's effects. For the mortality analysis, we used both comparison group strategies in separate analyses--the matched comparison group comprised of both NH entrants and HCBS waiver enrollees, and the one comprised of matched HCBS waiver enrollees alone. For examining NH utilization, we lead with the results from comparing the sample of PACE enrollees matched to waiver enrollees alone, but also present results from comparing PACE enrollees to the matched comparison group comprised of both NH entrants and HCBS waiver enrollees.
1. Mortality
The denominators for the mortality rate calculations were fixed in both groups as the number of treatment and matched comparison group members in the final matched sample for the first six intervals (since all sample members had at least 36 months of followup, with mortality data available through 2011), and restricting the samples in later intervals to those whose period of sample entry would allow us to observe their mortality in a particular interval.17
Compared to both NH entrants and HCBS waiver enrollees in the first matched comparison group, in all ten intervals throughout the 60-month followup period, PACE enrollees had a lower mortality rate than enrollees in the matched comparison group, with the difference being statistically significant in all intervals (Table 13). A year after enrollment, about 9 percent of PACE enrollees had died compared to nearly 22 percent for the matched comparison enrollees. Three years after enrollment, the rates were around 29 percent and 44 percent respectively among the PACE and the matched comparison groups, and by the end of the followup period (month 60), nearly 43 percent of PACE enrollees were deceased compared to nearly 51 percent for their matched counterparts who were NH entrants or HCBS waiver enrollees. The difference in mortality ranged from eight to nearly 17 percentage points during each six-month interval after the first post-enrollment year.
Compared to matched HCBS waiver enrollees alone, PACE entrants still had significantly lower mortality in most intervals through month 60, except in the last two intervals, where mortality rates in the two groups were similar (Table 14). Also, the difference in mortality was much smaller--around 5-6 percentage points--in most intervals after the first post-enrollment year and through month 48 after enrollment.
2. Results for Nursing Home Use with the Matched Comparison Group of HCBS Waiver Enrollees Alone
Results for NH use varied dramatically, depending on how use was measured. We examined four measures, each defined over the six-month intervals: any NH use; proportion of days spent in a NH, whether spent at least 30 days in a NH, and whether spent at least 90 days in a NH.
Compared to matched waiver enrollees, PACE enrollees were more likely to use a NH in almost all seven intervals, with the rate of NH use under PACE (11-17 percent) exceeding that of their matched counterparts (9-15 percent), in most intervals (Table 15). The difference of 3-4 percentage points was significant at the 1 percent level during the first four intervals, and the difference was smaller (1 percentage point or less) and not statistically significant in the last three intervals.
No such difference in NH use is observed when measured as the proportion of days during the six month interval that are spent in a NH. Proportion of days in the NH was lower for PACE enrollees compared to the matched comparison enrollees in six intervals, but only one of those differences was statistically significant--the four percentage point difference in interval six (p < 0.01). In the very first interval, PACE enrollees had a higher proportion of days in the NH (p < 0.05).
When NH use is measured by whether the sample member had a long stay in a NH during the period, the results change even more. PACE and matched waiver enrollees had similar predicted probabilities of being in a NH for at least 30 days during the seven intervals (Table 15, Panel 3), except the fifth and sixth intervals, when they had a 2-3 percentage points (p < 0.10 and p < 0.05 respectively) lower probability of spending at least 30 days in a NH. However, PACE enrollees were significantly less likely to be in a NH for at least 90 days in five of the seven intervals, by about 2-4 percentage points (Table 15, Panel 4). The difference was not statistically significant in the first and last intervals.
Results from Sensitivity Tests for Nursing Home Use
We examined the NH results after excluding New York from the study sample in order to confirm that the results were not driven by the state with the largest sample size. The findings were mostly similar with minor differences, mainly in terms of showing larger differences in predicted probabilities for some outcomes (Table 16). For instance, with New York excluded, PACE enrollees in the remaining sample had significantly lower proportion of days in the NH by 2-5 percentage points in three intervals--fourth, fifth, and sixth. Also, instead of in two intervals, PACE enrollees were now significantly less likely to be in the NH for at least 30 days in three intervals and by 2-4 percentage points (p < 0.10 in the fourth interval and p < 0.05 in the fifth and sixth intervals). Finally, as before, PACE enrollees were significantly less likely to be in a NH for at least 90 days in five of the seven intervals, but by about 2-6 percentage points, instead of 2-4 percentage points earlier.
Cumulative Risk of Nursing Home Use
In addition to the NH use outcomes reported above, we also examined the cumulative risk of being in a NH for at least 90 days over successive six-month intervals from sample entry for PACE and matched HCBS enrollees. While the outcome--whether in a NH for at least 90 days during a specific interval--described above, examines this separately for each six-month interval, the additional outcome for the cumulative risk of having been in a NH for at least 90 days offers a mechanism for examining how the aggregate risk of long-term NH use changes over time in each group. For any beneficiary, this binary outcome was coded as one for all intervals starting from the interval in which she is in a NH for at least 90 days (not necessarily consecutive). The sample sizes for examining this outcome were fixed at the number of treatment and matched comparison group members in the final matched sample for the first two intervals (since all sample members had at least 12 months of followup, with NH data available through 2009), and restricting the samples in later intervals to those whose period of sample entry would allow us to observe their cumulative risk of being in a NH for at least 90 days in a particular interval.18
There were no significant differences in the cumulative risk of being in a NH for at least 90 days over successive six-month intervals between PACE and the matched comparison group enrollees (Table 17), with all such differences being small--1 percentage point or less. Our findings remained unchanged, once New York was dropped from the study sample (results not shown). These findings differ from those reported above that showed PACE enrollees being significantly less likely to be in a NH for at least 90 days in five of the seven intervals (Table 15 and Table 16). The two sets of findings can be reconciled if there was little overlap among PACE enrollees who experienced long-term NH stays in each successive interval, while there was greater overlap across intervals among HCBS enrollees who experienced long-term NH stays, and for longer time periods in each interval than PACE enrollees.
3. Results for NH Use with the Matched Comparison Group of NH Entrants and HCBS Waiver Enrollees
Compared to the matched comparison group comprised of both NH entrants and HCBS waiver enrollees, PACE enrollees were significantly less likely to be in a NH, had significantly lower proportion of days in the NH, and were significantly less likely to experience NH stays of at least 30 or 90 days. These findings are along expected lines, since NH use is expected to be high when a large fraction of the matched comparison sample is made up of NH entrants.
Compared to matched NH entrants and HCBS waiver enrollees, PACE enrollees were significantly less likely to use a NH, with the rate of NH use under PACE (11-17 percent) substantially below that of their matched counterparts (25-59 percent) in all intervals (Table 18). The difference of 15-47 percentage points was significant at the 1 percent level during all seven intervals. Similarly, proportion of days in the NH was significantly lower for PACE enrollees in all intervals by 11-30 percentage points (p < 0.01).
PACE enrollees had a significantly lower likelihood of being in a NH for at least 30 days during the seven intervals (Table 18, Panel 3) by 16-42 percentage points (p < 0.01), and a significantly lower likelihood of being in a NH for at least 90 days during the seven intervals (Table 18, Panel 4) by 13-33 percentage points (p < 0.01).
Excluding New York from the study sample did not change these findings in any meaningful way (Table 19). For instance, with New York excluded, the proportion of days in the NH remained significantly lower for PACE enrollees in all intervals, but the margin was 14-32 percentage points (p < 0.01), instead of the 11-30 percentage points difference observed when New York was included.
Finally, compared to the matched comparison group comprised of both NH entrants and HCBS waiver enrollees, the cumulative risk of being in a NH for at least 90 days over successive six-month intervals was significantly lower for PACE enrollees by 20-32 percentage points (Table 20). These findings were similar with somewhat larger differences (26-35 percentage points), once New York was dropped from the study sample (results not shown).
IV. DISCUSSION
Our main findings on Medicare and Medicaid expenditures across all eight states are in line with results from prior studies meeting standards for a credible evaluation that also found little or no effect of PACE on Medicare costs but significantly higher Medicaid costs under PACE.19 However, prior studies found that the gap in Medicaid spending decreased over time, while in our case the Medicaid spending gap was fairly stable in the pooled analysis across all eight states, using the preferred comparison group strategy of keeping both NH entrants and HCBS waiver enrollees in the matched comparison group. We do detect a reduction in the Medicaid spending gap over time using the second matched comparison group of HCBS waiver enrollees alone, in line with findings from prior studies meeting standards for a credible evaluation (Mancuso, Yamashiro, and Felver 2005; Foster, Schmitz, and Kemper 2007).
More importantly, we uncover several differences in the state-specific findings using the matched comparison group comprised of both HCBS and NH entrants. New York stands out with significantly lower Medicaid expenditures under PACE, but with significantly higher Medicare expenditures in several intervals, with the net effect being of lower or similar total expenditures for PACE enrollees compared to predicted expenditures.20 The findings for New York differ markedly from those in earlier studies meeting standards for a rigorous evaluation, and are likely driven by both lower (and slower-growing) PACE capitation payments compared to that in other states and possibly more generous FFS coverage of and payments for HCBS waiver services and NH care in New York. Among other state-specific findings, Medicaid spending under PACE in California was significantly higher-than-predicted expenditures, and the gap increased with the length of enrollment--as Medicaid capitation payments increased and predicted FFS costs declined during the first two years after enrollment in PACE. In Massachusetts, the Medicaid spending gap was positive in spite of lower capitation payments than other states, and due to even lower predicted expenditures, but the Medicaid spending gap decreased to statistically insignificant levels with the length of time since enrollment.21
Our finding of lower mortality under PACE is supported by similar findings in several earlier studies (Chatterji et al. 1998; Mancuso, Yamashiro, and Felver 2005; Wieland et al. 2010). While our estimated treatment-comparison differences are larger than other studies found when using our composite comparison group, the more conservative estimates of 5-6 percentage points difference in mortality rates based on the comparison to the matched sample drawn only from new enrollees in HCBS programs are similar in size to those found by others. However, the mortality findings are likely to be susceptible to unobserved differences in health and functional status between the groups and need to be interpreted with caution. In particular, it is unclear whether the favorable findings for mortality can strictly be interpreted as an effect of PACE or not, if, for instance, terminally ill patients or those with higher disease severity are less likely to enroll in PACE leading to lower mortality for PACE enrollees. Also, the inclusion of NH entrants--who are likely to be sicker--in the first matched comparison group, together with imperfect risk adjustment due to absence of baseline data on health and functional status immediately preceding enrollment, could further bias the mortality findings in favor of PACE.
The findings for NH utilization with the matched comparison sample of HCBS waiver enrollees alone are important and nuanced, in that PACE enrollees were found to have a significantly higher likelihood of being in a NH during the followup period, but their proportion of days in the NH was similar to that for the matched HCBS waiver enrollees for most of the followup period, as was their likelihood of being in a NH for at least 30 days. Furthermore, PACE enrollees were significantly less likely to be in a NH for at least 90 days in any interval compared to their matched HCBS waiver counterparts, although the cumulative risk of being in a NH for at least 90 days was similar across PACE and matched HCBS enrollees across all intervals. The pattern in these results was similar but more accentuated once New York was dropped from the sample. Taken together, these apparently divergent findings can only be reconciled if: (1) there was little overlap among PACE enrollees who experienced long-term NH stays in each successive interval, while there was greater overlap across intervals among members of the HCBS comparison group who experience long-term NH stays, and have longer stays in each interval than PACE enrollees; and (2) PACE enrollees were more likely than the comparison group to use the NH for short-stay, recuperative purposes, but less likely to have to move into a NH or be institutionalized for long time periods. This could easily be the case if PACE plans substitute short-term NH stays for hospital admissions, since they are not bound by the Medicare requirement imposed on FFS Medicare patients of a three-day hospital admission prior to being eligible for a skilled NH admission. Indeed, at least two prior studies either hinted at or reached similar conclusions. For instance, Beauchamp et al. (2008) attributed their finding of greater NH use among PACE enrollees compared to their matched HCBS counterparts to the possibly greater use of NHs for short-stay purposes under PACE, although they did not provide any direct evidence for the same. A second study by Nadash (2004), with a somewhat weak design, obtained similar findings of higher NH utilization for PACE enrollees, with the median length of stay being shorter under PACE. In an older study, Chatterji et al. (1998), however, found NH utilization, in general, to be lower under PACE.
Our study, therefore, is among the first to offer strong evidence for two opposing effects of PACE on NH utilization--higher rates of utilization with shorter lengths of stay--with the net effect being a similar proportion of time spent in a long-term care institution across PACE and matched HCBS enrollees during each six-month interval and also similar cumulative rates of having had a long-term NH stay across all intervals. Combined with findings in the earlier literature that shows lower hospital utilization under PACE (for example, see Chatterji et al. 1998; Kane et al. 2006; Beauchamp et al. 2008; Meret-Hanke 2011) these findings suggest that PACE enrollees possibly spend a greater amount of time in the community (that is, in neither a hospital nor a NH) as opposed to their FFS counterparts.
Compared to the matched comparison group comprised of both NH entrants and HCBS waiver enrollees, PACE enrollees had significantly lower utilization of NHs with large, negative differences on all NH utilization outcomes. These findings are along expected lines and are perhaps less credibly interpreted as impacts, since baseline period NH entrants in the mixed comparison group are likely to have higher NH utilization in the followup period, skewing the results strongly in favor of PACE. One can argue that some PACE enrollees would likely have had to enter a NH had PACE not been an option, and therefore, this comparison group provides a valid counterfactual. However, it seems unlikely that over half of PACE entrants would have gone into a NH for a long-term or permanent stay at a comparable point-in-time as they entered PACE, had PACE not been an option for them. Thus, the estimates relying on this mixed HCBS/NH comparison group are likely an overestimate of PACE effects on long-term NH stays.
Our study has several limitations. First, even after matching and establishing baseline equivalence between the treatment and matched comparison groups, we cannot rule out the possibility that PACE and matched HCBS waiver enrollees or NH entrants differ along unobserved or unmeasured characteristics. There is likely to be a complex pattern of unobserved factors underlying the decision to enroll in PACE that could also affect outcomes, with the effect of PACE on outcomes--mediated by such unobservables--working in opposite directions in some cases. If, as claimed by PACE advocates, PACE enrollees are sicker than comparable entrants in HCBS waiver programs, and therefore, have higher costs, then we should also expect to see higher mortality under PACE. Our findings, however, point towards significantly lower mortality under PACE, with similar or higher costs than FFS beneficiaries in HCBS waiver programs or in NHs. This suggests that either PACE significantly lowers mortality risk in spite of the greater sickness of PACE enrollees, or the complex pattern of unobserved factors leading to PACE enrollment has positive correlation with costs and negative correlation with mortality. For instance, it is possible that PACE is a more attractive proposition for beneficiaries with functional and cognitive impairments and a high need for daily management of their conditions, but less so for beneficiaries who have severe medical conditions or who are terminally ill. This latter group, which would include those who are truly homebound, could find it more valuable to continue existing relationships with their primary care physician or enroll in hospice care or enter a NH while still being in FFS Medicare and Medicaid. This, in turn, could lead to lower mortality rate among PACE enrollees, but they still may be just as expensive, or more expensive, to care for as comparison group individuals with comparable illnesses who do not enroll in PACE. In other words, the mortality findings could be biased in favor of PACE due to such unobserved differences, especially when using the matched comparison sample comprised of both NH entrants and HCBS waiver enrollees, since NH entrants are more likely to die in the near term than HCBS recipients. Limited by claims and enrollment data alone in our analysis, we were not able to explore the underlying differences--for example, differences in health and functional status--right before or at sample entry across PACE, HCBS, and NH entrants, which would have been possible with primary data collection.
To address such concerns about unobserved differences across the treatment and matched comparison groups, which are typical of most observational studies with a nonexperimental research design, we carried out three sensitivity tests. First, we dropped about 16 percent of PACE enrollees, who were either enrolled in HCBS waiver services in the six months prior to enrolling in PACE or were in a NH in the 90 days prior to enrolling in PACE, and also dropped around 4 percent of the HCBS waiver enrollees who were in a NH in the 90 days prior to enrolling in the waiver program. These exclusions were applied prior to matching PACE enrollees to the combined pool of waiver enrollees and NH entrants. After rerunning the matching algorithm and the outcomes analysis, our main findings for expenditures and mortality effects remained unaltered. Second, we selected our matched comparison group in two ways, first including in the pool of potential matches both those newly enrolled in an HCBS waiver program and those entering a NH, and then restricting it to only those enrolled in an HCBS waiver. While estimated effects on expenditures and mortality were different using alternative comparison group strategies, the direction and statistical significance of the findings were similar, leading to the same conclusions. For instance, the magnitude of the estimated difference in mortality rates (with lower mortality under PACE) was smaller using the matched comparison group of HCBS waiver enrollees alone, while the estimated gap in expenditures (higher actual payments under PACE) was also smaller, especially for Medicaid payments. This is consistent with the expected lower costs in the comparison group of HCBS waiver enrollees alone. Finally, as a third sensitivity test (results not shown) we controlled for a mortality indicator in the expenditures regression for the first two intervals (months 1-6, and months 7-12) to account for unobserved differences in health and functional status that possibly accounts for the high mortality gap in favor of PACE in these first two intervals. We found that our findings for Medicare and Medicaid expenditures were broadly similar in the first two intervals even after controlling for mortality during these periods. Predicted means were lower in the first two intervals with consequent reductions in the estimated difference between actual and predicted expenditures for PACE enrollees, but the direction of the difference and the statistical significance of the estimates were unchanged.
A second limitation was that although we utilize several data sources for Medicare and Medicaid enrollment and claims information, we were only able to obtain administrative data. More specifically, we lack information on certain beneficiary characteristics, especially their physical and cognitive functional status before enrollment--likely to be a crucial determinant for enrolling in PACE or HCBS waiver services as well as for NH entry, long-term care utilization, and predicted costs--that could have allowed us to use a richer set of variables for matching the treatment and comparison group members at baseline. We partially mitigate this inadequacy by using information on several chronic conditions, including one for cognitive impairment (whether an enrollee had Alzheimer's or dementia), defined using CCW's claims-based algorithm, as well as information on utilization of acute care (inpatient and ER) and post-acute care (SNF and home health) services (likely to be a marker for functional impairment) in matching. However, the Medicare expenditures and service utilization variables used in matching were based on claims information in the MBSF for the calendar year prior to the year of sample entry. As such, for at least some beneficiaries (for example, those enrolling in PACE or HCBS or entering a NH later in the year), we do not observe expenditures and service utilization in the months immediately preceding sample entry. Therefore, our analysis might fail to capture or control for possibly high service utilization and expenditures or the onset of new chronic conditions or ADL limitations that may have precipitated the enrollment of beneficiaries in PACE or HCBS or their admission to a NH. While this missing data exists for all three groups, it may be particularly acute for NH entrants immediately prior to entering a NH, leading to incomplete risk adjustment in the models predicting expenditures and mortality. If true, use of the blended HCBS/NH comparison group would lead to overestimates of the costs and mortality rate that PACE enrollees would have experienced in the absence of PACE, biasing results for both outcomes in favor of the PACE program when this comparison sample is used. Due to the fact that our study included individuals who enrolled in PACE or waiver programs (or entered nursing facilities) 5-7 years ago, and the fact that observations were drawn from eight different states, it was not possible to obtain retrospective data on NH assessments or care plans at the time of enrollment.
A third limitation is that, given the lag in the preparation and availability of certain secondary datasets, such as the MAX and the Timeline file, we were constrained in our use of a maximum of a 42-month followup for several outcomes. This is especially a concern for the findings on Medicaid expenditures where the gap between actual and predicted Medicaid expenditures for PACE enrollees was found to gradually diminish over time for at least one state--Massachusetts. With a longer followup--preferably five years or more--it would have been possible to test whether the Medicaid expenditure gap falls to a statistically insignificant level. NH use could also diverge for the PACE and comparison samples with a longer followup. However, as shown by the mortality findings, at least a third of the sample died by month 42 after enrollment. Therefore, 42 months of followup is still a reasonably long period of time to observe cost outcomes for this population, given the tradeoff between a longer followup and the decrease in sample size over time.
Fourth, PACE enrollees in our sample are lost to followup once they disenroll from PACE (we only examine capitation payments for PACE enrollees), although we follow all FFS costs for the matched HCBS enrollees and NH entrants, as long as they are alive and not in managed care.22 So, costs for the comparison group enrollees could potentially be overstated compared to that for enrollees in the treatment group. Note, however, that this limitation actually makes our findings of capitated Medicaid costs being higher-than-predicted FFS costs a relatively conservative estimate. Thus, our findings of higher Medicaid (and overall) expenditures on PACE is not driven by this difference between treatment and comparison samples due to disenrollment, but rather reinforced by it.
Our findings should be of interest to policymakers and researchers interested in the role of PACE in improving outcomes among the frail and elderly duals, and controlling Medicare and Medicaid expenditures for such beneficiaries. Our expenditure findings suggest that although Medicaid capitation payments for PACE enrollees under the existing PACE program structure exceed what we expect their Medicaid FFS expenditures would have been for the eight states combined, the results for New York are very different, showing that PACE capitation rates there were set below what we estimate these enrollees would have cost Medicaid had they not enrolled in PACE. The favorable mortality and NH findings also suggest that PACE is likely to be good option for many frail dual eligibles, and that the Medicare capitation rate is comparable to what FFS costs are likely to have been. However, as always, caution should be exercised in drawing inferences from this study about the likely effects of expanding PACE to other areas or changing its structure to include in home visits ("PACE at home"), since we cannot predict how such a change would affect the types of individuals who choose to enroll in PACE or the effects of PACE on them. If future investigations into PACE's effects are conducted, they would benefit greatly from data on the functioning, family support systems, and other characteristics of PACE entrants at the time of enrollment compared to those of beneficiaries in the comparison group. Finding a way to measure hospitalizations from the same source for PACE enrollees and the comparison group would also be worthwhile, given the importance of this measure to both enrollees' well-being and costs to the capitated PACE plans. Such studies should also incorporate a longer followup for Medicaid expenditures and NH outcomes.
The data limitations of this study make it difficult to assess the implications of our findings for setting PACE payment rates. Taken at face value, the study suggests that Medicaid incurs substantially higher costs for PACE enrollees than it would have had these enrollees not entered PACE, but instead relied on Medicaid long-term care services provided either through HCBS programs or NHs. However, the study was unable to compare PACE and HCBS enrollees in terms of ADL limitations or ongoing conditions such as incontinence or dementia at the time of enrollment, so it is possible that the PACE enrollees would have cost more than our projections suggest, had they not been able to enroll in PACE. The similarity of our findings to previous findings suggests that the estimated overpayment is probably real,however, especially given the finding that even when new entrants to NHs are included in the comparison sample, the capitation payment exceeds the projected cost that PACE enrollees would have incurred.
On the other hand, policymakers must consider the findings that mortality rates and long-term NH stays are lower for PACE enrollees than for their nonPACE counterparts. Furthermore, the study could not measure the trajectory of personal outcomes in overall health, quality of care, and satisfaction with the quality of daily life. Nor was the study able to assess the effects of PACE on family caregivers, which are likely to be highly favorable. All of these quality and length of life considerations could lead policymakers to conclude that even if costs are higher under PACE, the benefits may be worth some additional cost. States and the Federal Government may therefore wish to investigate the care needs and outcomes of Medicaid enrollees receiving care under PACE and HCBS to ascertain whether the two groups are comparable at enrollment and whether quality of life outcomes are similar or different for the two programs in making their decisions.
One important consideration for policymakers is the substantial variation across states in Medicaid capitation rates paid to PACE plans, and the very different divergence from their FFS outlays for individuals receiving HCBS care. States may find it beneficial to compare their actuarial processes to ensure the most accurate methods and calculation of Medicaid PACE capitation rates. This is not to say, of course, that rates should be the same in all states and localities. But a greater understanding and agreement regarding the nature of Medicaid risk adjustment for the PACE population, and the factors considered in setting base rates, would be of significant value in arriving at a well-founded approach to rate-setting.
REPORT FIGURES AND TABLES
| FIGURE 1a. Sample Selection Process for PACE Enrollees | ||||||
|---|---|---|---|---|---|---|
| Initial Sample from MARx Data |  |
Medicare Checks in MBSF | |
Medicaid Checks in MAX | |
Final PACE Sample |
| Identify beneficiaries entering PACE between July 2006 & December 2008 in any of the 8 study states. | Keep in sample if:
|
Keep in sample if:
|
Keep in sample if:
|
|||
| FIGURE 1b. Sample Selection Process for HCBS Waiver Enrollees | ||||||
|---|---|---|---|---|---|---|
| Initial Sample from MARx Data | |
Medicare Checks in MBSF | |
ZIP Code Checks in MAX | |
Final HCBS Waiver Sample |
| Identify beneficiaries entering type G or type H waiver program between July 2006 & December 2008 in any of the 8 study states. | Keep in sample if:
|
Keep in sample if:
|
Keep in sample if:
|
|||
| FIGURE 1c. Sample Selection Process for Nursing Home Entrants | ||||||
|---|---|---|---|---|---|---|
| Initial Sample from MARx Data | |
Medicare Checks in MBSF | |
ZIP Code Checks in MAX | |
Final HCBS Waiver Sample |
| Identify beneficiaries entering a NH between July 2006 & December 2008 in any of the 8 study states, with the duration of the first stay being at least 21 days. | Keep in sample if:
|
Keep in sample if:
|
Keep in sample if:
|
|||
| FIGURE 2a. Distribution of Estimated Propensity Scores for PACE Enrollees Matched to Both Nursing Home Entrants and HCBS Waiver Enrollees, by Group |
|---|
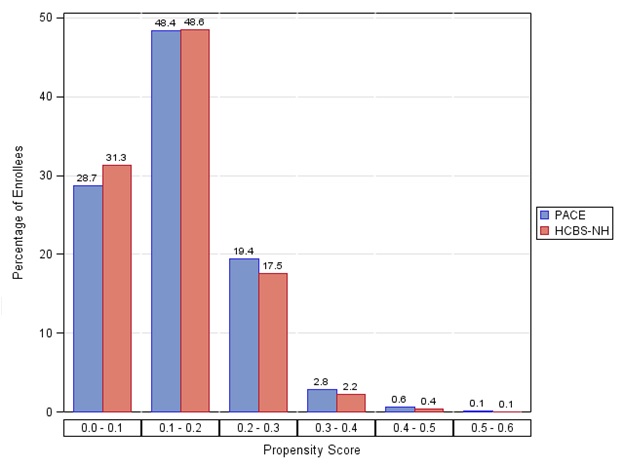 |
| FIGURE 2b. Distribution of Estimated Propensity Scores for PACE Enrollees Matched to HCBS Waiver Enrollees Only, by Group |
|---|
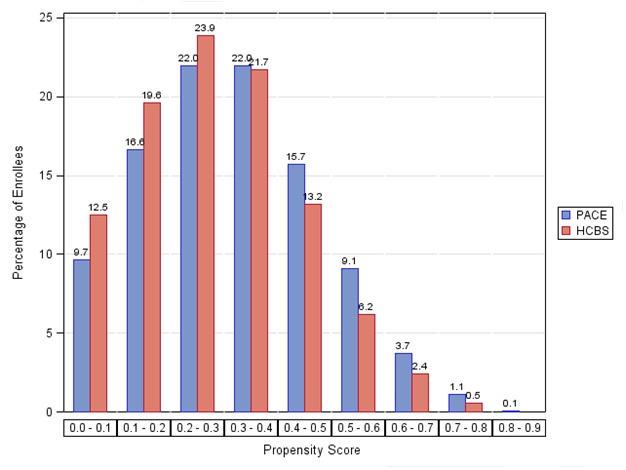 |
| TABLE 1. Distribution of the Matched Sample across the Study States for PACE Enrollees Matched to Both NH Entrants and HCBS Waiver Enrollees or Matched to HCBS Waiver Enrollees Alone, by Group | |||||
|---|---|---|---|---|---|
| State | PACE Enrollees |
Matched Comparison Group A Comprised of NH Entrants and HCBS Waiver Enrollees |
Matched Comparison Group B Comprised of HCBS Waiver Enrollees Only |
||
| All | NH Entrants | HCBS Waiver Enrollees | |||
| California | 661 | 579 | 453 | 126 | 396 |
| Colorado | 405 | 319 | 145 | 174 | 278 |
| Massachusetts | 821 | 710 | 422 | 288 | 593 |
| Michigan | 164 | 143 | 108 | 35 | 106 |
| New Mexico | 118 | 86 | 42 | 44 | 75 |
| New York | 952 | 901 | 404 | 497 | 840 |
| Oregon | 155 | 139 | 46 | 93 | 123 |
| Pennsylvania | 449 | 387 | 214 | 173 | 334 |
| Total | 3,725 | 3,264 | 1,834 | 1,430 | 2,745 |
| NOTE: The matched comparison group A consists of a total of 3,264 sample members, of whom 1,834 are NH entrants and 1,430 are HCBS waiver enrollees. Matched comparison group B consists of a total of 2,745 HCBS waiver enrollees only. | |||||
| TABLE 2. Sample Characteristics at Program Entry for PACE Enrollees Matched to Both NH Entrants and HCBS Waiver Enrollees or Match to HCBS Waiver Enrollees Alone, by Group (percentages, unless otherwise noted) |
|||||
|---|---|---|---|---|---|
| PACE Group |
Matched Comparison Group A |
p-value | Matched Comparison Group B |
p-value | |
| Age | 79.08 | 79.08 | 0.99 | 79.15 | 0.76 |
| Female | 0.70 | 0.70 | 0.84 | 0.71 | 0.65 |
| Race/Ethnicity | |||||
| White | 0.59 | 0.58 | 0.97 | 0.58 | 0.84 |
| African American | 0.18 | 0.18 | 0.18 | ||
| Hispanic | 0.08 | 0.09 | 0.08 | ||
| Other | 0.15 | 0.15 | 0.16 | ||
| Chronic Conditions | |||||
| Alzheimer's disease or dementia | 0.35 | 0.35 | 0.81 | 0.35 | 0.59 |
| CAD | 0.42 | 0.42 | 0.95 | 0.42 | 0.91 |
| CHF | 0.28 | 0.28 | 0.86 | 0.27 | 0.30 |
| Depression | 0.22 | 0.22 | 0.83 | 0.21 | 0.32 |
| Diabetes | 0.36 | 0.35 | 0.78 | 0.35 | 0.70 |
| Stroke | 0.10 | 0.09 | 0.30 | 0.09 | 0.22 |
| Number of chronic diseases | 4.80 | 4.75 | 0.49 | 4.73 | 0.29 |
| Service Use and Costs | |||||
| Any inpatient admissions | 0.32 | 0.33 | 0.68 | 0.32 | 0.91 |
| Any ER visits | 0.45 | 0.44 | 0.87 | 0.43 | 0.19 |
| Any SNF stays | 0.13 | 0.11 | 0.04 | 0.11 | 0.14 |
| Any Home Health use | 0.27 | 0.26 | 0.94 | 0.28 | 0.31 |
| Average annualized Medicare expenditures | $14,302 | $14,625 | 0.60 | $14,211 | 0.89 |
| F-Statistic for the joint equality of means on all variables used in matching (p-value) | 0.64 (0.96) |
0.71 (0.80) |
|||
| Variables not used in matching | |||||
| Enrolled in Medicaid in the 12 months prior to sample entry | 0.79 | 0.77 | 0.01 | 0.81 | 0.14 |
| Any NH stay in the 90 days prior to sample entry | 0.07 | 0.02 | <0.01 | 0.05 | <0.01 |
| Number of enrollees (unweighted) | 3,725 | 3,264 | 2.745 | ||
| NOTE: The matched comparison group A consists of a total of 3,264 sample members, of whom 1,834 are NH entrants and 1,430 are HCBS waiver enrollees. Matched comparison group B consists of a total of 2,745 HCBS waiver enrollees only. The means for the comparison groups were calculated using propensity score matching weights that are equal to the number of the treatment group members each comparison group member was matched to. Hence, the weighted number of enrollees in the matched comparison group is equal to that in the treatment group (3,725). | |||||
| TABLE 3. Estimated Effect of PACE on PBPM Expenditures (dollars) with Matched Comparison Group Members Comprised of Both NH Entrants and HCBS Waiver Enrollees | |||||
|---|---|---|---|---|---|
| Months from Entry | Number of PACE Enrollees |
Actual Mean for PACE Group |
Predicted Mean for PACE Group |
Estimated Effect |
p-value |
| Medicare Expenditures | |||||
| 1 to 6 | 3,725 | $2,040 | $4,031 | -$1,991 | 0.00 |
| 7 to 12 | 3,277 | $2,257 | $2,393 | -$136 | 0.17 |
| 13 to 18 | 2,946 | $2,326 | $2,091 | $234 | 0.02 |
| 19 to 24 | 2,187 | $2,348 | $2,159 | $190 | 0.13 |
| 25 to 30 | 1,496 | $2,330 | $2,010 | $320 | 0.05 |
| 31 to 36 | 911 | $2,327 | $2,345 | -$17 | 0.93 |
| 37 to 42 | 441 | $2,362 | $2,234 | $128 | 0.80 |
| 43 to 48 | 411 | $2,357 | $2,452 | -$94 | 0.77 |
| 49 to 54 | 372 | $2,269 | $1,739 | $530 | 0.16 |
| 55 to 60 | 330 | $2,110 | $1,665 | $445 | 0.05 |
| 61 to 66 | 306 | $2,030 | $2,374 | -$344 | 0.45 |
| Medicaid Expenditures | |||||
| 1 to 6 | 3,725 | $3,744 | $3,152 | $593 | 0.00 |
| 7 to 12 | 3,277 | $3,764 | $3,203 | $561 | 0.00 |
| 13 to 18 | 2,946 | $3,830 | $3,264 | $566 | 0.00 |
| 19 to 24 | 2,187 | $3,880 | $3,281 | $598 | 0.00 |
| 25 to 30 | 1,496 | $3,943 | $3,346 | $597 | 0.00 |
| 31 to 36 | 911 | $4,012 | $3,466 | $546 | 0.00 |
| 37 to 42 | 441 | $4,128 | $3,481 | $647 | 0.00 |
| Medicare and Medicaid Expenditures | |||||
| 1 to 6 | 3,725 | $5,784 | $7,183 | -$1,399 | 0.00 |
| 7 to 12 | 3,277 | $6,021 | $5,596 | $426 | 0.00 |
| 13 to 18 | 2,946 | $6,156 | $5,356 | $800 | 0.00 |
| 19 to 24 | 2,187 | $6,228 | $5,440 | $788 | 0.00 |
| 25 to 30 | 1,496 | $6,273 | $5,356 | $917 | 0.00 |
| 31 to 36 | 911 | $6,339 | $5,811 | $528 | 0.01 |
| 37 to 42 | 441 | $6,490 | $5,714 | $775 | 0.13 |
| NOTE: The matched comparison group consists of both NH entrants and HCBS waiver enrollees. Actual means for PACE enrollees are weighted by eligibility weights, defined as the number of months a beneficiary was alive and enrolled in PACE during each 6-month interval. Predicted means for PACE enrollees were obtained by first estimating a separate linear regression for each measurement period and outcome variable on the matched comparison group that controlled for demographics, chronic conditions, pre-enrollment Medicare service utilization and costs, months between the end of the pre-enrollment period and sample entry, indicator for any NH use in the 90 days prior to sample entry, and state indicators. The regressions incorporated the final weight for matched comparison group members obtained by multiplying the eligibility weights--defined as the number of months alive and not in managed care during each 6-month interval--with the propensity score matching weights. The estimated coefficients from these regressions were then used to predict expenditures for PACE enrollees in each interval, using the mean characteristics of the PACE sample in the equation. In some cases, the estimated effect is not exactly equal to the difference in means due to rounding. ADDITIONAL NOTE: After this report was posted, we received information from the National PACE Association noting that Medicaid amounts for PACE enrollees in California appear to be inconsistent with capitation rates for PACE plans published by the California Department of Health Care Services. We are working to resolve this issue and will amend entries in this table and associated discussion in the text if changes are required. |
|||||
| TABLE 4. Estimated Effect of PACE on PBPM Expenditures--After Excluding PACE Enrollees with Prior HCBS Enrollment or NH Use and Excluding HCBS Enrollees with Prior NH Use (dollars) |
|||||
|---|---|---|---|---|---|
| Months from Entry | Number of PACE Enrollees |
Actual Mean for PACE Group |
Predicted Mean for PACE Group |
Estimated Effect |
p-value |
| Medicare Expenditures | |||||
| 1 to 6 | 3,119 | $1,958 | $3,909 | -$1,951 | 0.00 |
| 7 to 12 | 2,757 | $2,180 | $2,436 | -$256 | 0.01 |
| 13 to 18 | 2,515 | $2,267 | $2,233 | $34 | 0.75 |
| 19 to 24 | 1,904 | $2,298 | $2,124 | $173 | 0.23 |
| 25 to 30 | 1,320 | $2,283 | $2,080 | $202 | 0.25 |
| 31 to 36 | 814 | $2,278 | $1,917 | $361 | 0.19 |
| 37 to 42 | 399 | $2,324 | $2,519 | -$195 | 0.56 |
| 43 to 48 | 373 | $2,328 | $2,418 | -$89 | 0.77 |
| 49 to 54 | 337 | $2,241 | $1,972 | $269 | 0.44 |
| 55 to 60 | 298 | $2,103 | $2,234 | -$131 | 0.70 |
| 61 to 66 | 278 | $2,024 | $2,540 | -$516 | 0.14 |
| Medicaid Expenditures | |||||
| 1 to 6 | 3,119 | $3,811 | $3,352 | $458 | 0.00 |
| 7 to 12 | 2,757 | $3,820 | $3,263 | $557 | 0.00 |
| 13 to 18 | 2,515 | $3,880 | $3,300 | $580 | 0.00 |
| 19 to 24 | 1,904 | $3,922 | $3,452 | $471 | 0.00 |
| 25 to 30 | 1,320 | $3,981 | $3,426 | $555 | 0.00 |
| 31 to 36 | 814 | $4,047 | $3,363 | $684 | 0.00 |
| 37 to 42 | 399 | $4,180 | $3,217 | $964 | 0.00 |
| Medicare and Medicaid Expenditures | |||||
| 1 to 6 | 3,119 | $5,769 | $7,261 | -$1,492 | 0.00 |
| 7 to 12 | 2,757 | $6,001 | $5,700 | $301 | 0.01 |
| 13 to 18 | 2,515 | $6,147 | $5,533 | $614 | 0.00 |
| 19 to 24 | 1,904 | $6,220 | $5,576 | $644 | 0.00 |
| 25 to 30 | 1,320 | $6,264 | $5,506 | $757 | 0.00 |
| 31 to 36 | 814 | $6,325 | $5,280 | $1,044 | 0.00 |
| 37 to 42 | 399 | $6,504 | $5,736 | $769 | 0.03 |
| NOTE: The matched comparison group consists of both NH entrants and HCBS waiver enrollees. Actual means for PACE enrollees are weighted by eligibility weights, defined as the number of months a beneficiary was alive and enrolled in PACE during each 6-month interval. Predicted means for PACE enrollees were obtained by first estimating a separate linear regression for each measurement period and outcome variable on the matched comparison group that controlled for demographics, chronic conditions, pre-enrollment Medicare service utilization and costs, months between the end of the pre-enrollment period and sample entry, indicator for any NH use in the 90 days prior to sample entry, and state indicators. The regressions incorporated the final weight for matched comparison group members obtained by multiplying the eligibility weights--defined as the number of months alive and not in managed care during each 6-month interval--with the propensity score matching weights. The estimated coefficients from these regressions were then used to predict expenditures for PACE enrollees in each interval, using the mean characteristics of the PACE sample in the equation. In some cases, the estimated effect is not exactly equal to the difference in means due to rounding. ADDITIONAL NOTE: After this report was posted, we received information from the National PACE Association noting that Medicaid amounts for PACE enrollees in California appear to be inconsistent with capitation rates for PACE plans published by the California Department of Health Care Services. We are working to resolve this issue and will amend entries in this table and associated discussion in the text if changes are required. |
|||||
| TABLE 5. Estimated Effect of PACE on PBPM Expenditures with Matched Comparison Group Members Comprised of Both NH Entrants and HCBS Waiver Enrollees--After Excluding New York (dollars) |
|||||
|---|---|---|---|---|---|
| Months from Entry | Number of PACE Enrollees |
Actual Mean for PACE Group |
Predicted Mean for PACE Group |
Estimated Effect |
p-value |
| Medicare Expenditures | |||||
| 1 to 6 | 2,773 | $2,009 | $4,211 | -$2,201 | 0.00 |
| 7 to 12 | 2,450 | $2,245 | $2,453 | -$208 | 0.06 |
| 13 to 18 | 2,197 | $2,321 | $2,127 | $194 | 0.10 |
| 19 to 24 | 1,613 | $2,330 | $2,234 | $95 | 0.52 |
| 25 to 30 | 1,078 | $2,312 | $2,150 | $163 | 0.41 |
| 31 to 36 | 631 | $2,315 | $2,400 | -$85 | 0.78 |
| 37 to 42 | 295 | $2,292 | $2,323 | -$31 | 0.98 |
| 43 to 48 | 273 | $2,267 | $2,675 | -$409 | 0.56 |
| 49 to 54 | 251 | $2,156 | $1,572 | $584 | 0.07 |
| 55 to 60 | 225 | $1,999 | $1,474 | $525 | 0.16 |
| 61 to 66 | 205 | $1,979 | $2,295 | -$316 | 0.71 |
| Medicaid Expenditures | |||||
| 1 to 6 | 2,773 | $3,719 | $2,729 | $990 | 0.00 |
| 7 to 12 | 2,450 | $3,785 | $2,730 | $1,054 | 0.00 |
| 13 to 18 | 2,197 | $3,882 | $2,812 | $1,070 | 0.00 |
| 19 to 24 | 1,613 | $3,946 | $2,862 | $1,084 | 0.00 |
| 25 to 30 | 1,078 | $4,045 | $2,908 | $1,136 | 0.00 |
| 31 to 36 | 631 | $4,154 | $3,094 | $1,060 | 0.00 |
| 37 to 42 | 295 | $4,358 | $3,035 | $1,323 | 0.00 |
| Medicare and Medicaid Expenditures | |||||
| 1 to 6 | 2,773 | $5,729 | $6,939 | -$1,211 | 0.00 |
| 7 to 12 | 2,450 | $6,029 | $5,183 | $846 | 0.00 |
| 13 to 18 | 2,197 | $6,204 | $4,939 | $1,264 | 0.00 |
| 19 to 24 | 1,613 | $6,276 | $5,096 | $1,179 | 0.00 |
| 25 to 30 | 1,078 | $6,357 | $5,058 | $1,299 | 0.00 |
| 31 to 36 | 631 | $6,469 | $5,493 | $975 | 0.00 |
| 37 to 42 | 295 | $6,650 | $5,358 | $1,292 | 0.23 |
| NOTE: The matched comparison group consists of both NH entrants and HCBS waiver enrollees. Actual means for PACE enrollees are weighted by eligibility weights, defined as the number of months a beneficiary was alive and enrolled in PACE during each 6-month interval. Predicted means for PACE enrollees were obtained by first estimating a separate linear regression for each measurement period and outcome variable on the matched comparison group that controlled for demographics, chronic conditions, pre-enrollment Medicare service utilization and costs, months between the end of the pre-enrollment period and sample entry, indicator for any NH use in the 90 days prior to sample entry, and state indicators. The regressions incorporated the final weight for matched comparison group members obtained by multiplying the eligibility weights--defined as the number of months alive and not in managed care during each 6-month interval--with the propensity score matching weights. The estimated coefficients from these regressions were then used to predict expenditures for PACE enrollees in each interval, using the mean characteristics of the PACE sample in the equation. In some cases, the estimated effect is not exactly equal to the difference in means due to rounding. ADDITIONAL NOTE: After this report was posted, we received information from the National PACE Association noting that Medicaid amounts for PACE enrollees in California appear to be inconsistent with capitation rates for PACE plans published by the California Department of Health Care Services. We are working to resolve this issue and will amend entries in this table and associated discussion in the text if changes are required. |
|||||
| TABLE 6. Estimated Effect of PACE on PBPM Expenditures in California with Matched Comparison Group Members Comprised of Both NH Entrants and HCBS Waiver Enrollees (dollars) |
|||||
|---|---|---|---|---|---|
| Months from Entry | Number of PACE Enrollees |
Actual Mean for PACE Group |
Predicted Mean for PACE Group |
Estimated Effect |
p-value |
| Medicare Expenditures | |||||
| 1 to 6 | 661 | $1,731 | $6,116 | -$4,384 | 0.00 |
| 7 to 12 | 580 | $1,958 | $2,886 | -$928 | 0.00 |
| 13 to 18 | 530 | $2,061 | $2,649 | -$588 | 0.04 |
| 19 to 24 | 400 | $2,087 | $2,726 | -$638 | 0.08 |
| 25 to 30 | 300 | $2,055 | $2,357 | -$301 | 0.40 |
| 31 to 36 | 201 | $2,032 | $2,383 | -$351 | 0.57 |
| 37 to 42 | 114 | $2,097 | $1,827 | $270 | 0.86 |
| 43 to 48 | 109 | $2,262 | $3,077 | -$815 | 0.64 |
| 49 to 54 | 102 | $2,140 | $1,935 | $205 | 0.81 |
| 55 to 60 | 93 | $1,955 | $868 | $1,087 | 0.28 |
| 61 to 66 | 86 | $1,905 | $2,185 | -$280 | 0.91 |
| Medicaid Expenditures | |||||
| 1 to 6 | 661 | $5,296 | $3,721 | $1,574 | 0.00 |
| 7 to 12 | 580 | $5,458 | $3,042 | $2,416 | 0.00 |
| 13 to 18 | 530 | $5,717 | $2,932 | $2,786 | 0.00 |
| 19 to 24 | 400 | $5,861 | $2,852 | $3,009 | 0.00 |
| 25 to 30 | 300 | $5,863 | $3,043 | $2,820 | 0.00 |
| 31 to 36 | 201 | $5,879 | $2,871 | $3,009 | 0.00 |
| 37 to 42 | 114 | $5,896 | $3,225 | $2,672 | 0.00 |
| Medicare and Medicaid Expenditures | |||||
| 1 to 6 | 661 | $7,027 | $9,837 | -$2,810 | 0.00 |
| 7 to 12 | 580 | $7,416 | $5,927 | $1,488 | 0.00 |
| 13 to 18 | 530 | $7,778 | $5,580 | $2,198 | 0.00 |
| 19 to 24 | 400 | $7,949 | $5,578 | $2,371 | 0.00 |
| 25 to 30 | 300 | $7,918 | $5,400 | $2,518 | 0.00 |
| 31 to 36 | 201 | $7,912 | $5,253 | $2,658 | 0.00 |
| 37 to 42 | 114 | $7,994 | $5,052 | $2,942 | 0.07 |
| NOTE: The matched comparison group consists of both NH entrants and HCBS waiver enrollees. Actual means for PACE enrollees are weighted by eligibility weights, defined as the number of months a beneficiary was alive and enrolled in PACE during each 6-month interval. Predicted means for PACE enrollees were obtained by first estimating a separate linear regression for each measurement period and outcome variable on the matched comparison group that controlled for demographics, chronic conditions, pre-enrollment Medicare service utilization and costs, months between the end of the pre-enrollment period and sample entry, indicator for any NH use in the 90 days prior to sample entry, and state indicators. The regressions incorporated the final weight for matched comparison group members obtained by multiplying the eligibility weights--defined as the number of months alive and not in managed care during each 6-month interval--with the propensity score matching weights. The estimated coefficients from these regressions were then used to predict expenditures for PACE enrollees in each interval, using the mean characteristics of the PACE sample in the equation. In some cases, the estimated effect is not exactly equal to the difference in means due to rounding. ADDITIONAL NOTE: After this report was posted, we received information from the National PACE Association noting that Medicaid amounts for PACE enrollees in California appear to be inconsistent with capitation rates for PACE plans published by the California Department of Health Care Services. We are working to resolve this issue and will amend entries in this table and associated discussion in the text if changes are required. |
|||||
| TABLE 7. Estimated Effect of PACE on PBPM Expenditures in Massachusetts with Matched Comparison Group Members Comprised of Both NH Entrants and HCBS Waiver Enrollees (dollars) |
|||||
|---|---|---|---|---|---|
| Months from Entry | Number of PACE Enrollees |
Actual Mean for PACE Group |
Predicted Mean for PACE Group |
Estimated Effect |
p-value |
| Medicare Expenditures | |||||
| 1 to 6 | 821 | $2,196 | $4,775 | -$2,579 | 0.00 |
| 7 to 12 | 726 | $2,486 | $2,408 | $78 | 0.74 |
| 13 to 18 | 661 | $2,526 | $1,962 | $564 | 0.02 |
| 19 to 24 | 480 | $2,464 | $2,077 | $387 | 0.17 |
| 25 to 30 | 313 | $2,450 | $2,108 | $341 | 0.19 |
| 31 to 36 | 162 | $2,531 | $2,540 | -$8 | 0.99 |
| Medicaid Expenditures | |||||
| 1 to 6 | 821 | $3,210 | $2,562 | $648 | 0.00 |
| 7 to 12 | 726 | $3,235 | $2,792 | $443 | 0.00 |
| 13 to 18 | 661 | $3,237 | $2,920 | $317 | 0.01 |
| 19 to 24 | 480 | $3,243 | $3,057 | $186 | 0.22 |
| 25 to 30 | 313 | $3,244 | $3,159 | $85 | 0.60 |
| 31 to 36 | 162 | $3,283 | $3,111 | $172 | 0.41 |
| Medicare and Medicaid Expenditures | |||||
| 1 to 6 | 821 | $5,406 | $7,337 | -$1,931 | 0.00 |
| 7 to 12 | 726 | $5,720 | $5,200 | $520 | 0.05 |
| 13 to 18 | 661 | $5,763 | $4,881 | $882 | 0.00 |
| 19 to 24 | 480 | $5,708 | $5,135 | $573 | 0.07 |
| 25 to 30 | 313 | $5,694 | $5,267 | $426 | 0.14 |
| 31 to 36 | 162 | $5,814 | $5,650 | $164 | 0.76 |
| NOTE: The matched comparison group consists of both NH entrants and HCBS waiver enrollees. Actual means for PACE enrollees are weighted by eligibility weights, defined as the number of months a beneficiary was alive and enrolled in PACE during each 6-month interval. Predicted means for PACE enrollees were obtained by first estimating a separate linear regression for each measurement period and outcome variable on the matched comparison group that controlled for demographics, chronic conditions, pre-enrollment Medicare service utilization and costs, months between the end of the pre-enrollment period and sample entry, indicator for any NH use in the 90 days prior to sample entry, and state indicators. The regressions incorporated the final weight for matched comparison group members obtained by multiplying the eligibility weights--defined as the number of months alive and not in managed care during each 6-month interval--with the propensity score matching weights. The estimated coefficients from these regressions were then used to predict expenditures for PACE enrollees in each interval, using the mean characteristics of the PACE sample in the equation. In some cases, the estimated effect is not exactly equal to the difference in means due to rounding. | |||||
| TABLE 8. Estimated Effect of PACE on PBPM Expenditures in New York with Matched Comparison Group Members Comprised of Both NH Entrants and HCBS Waiver Enrollees (dollars) |
|||||
|---|---|---|---|---|---|
| Months from Entry | Number of PACE Enrollees |
Actual Mean for PACE Group |
Predicted Mean for PACE Group |
Estimated Effect |
p-value |
| Medicare Expenditures | |||||
| 1 to 6 | 952 | $2,128 | $3,669 | -$1,541 | 0.00 |
| 7 to 12 | 827 | $2,296 | $2,253 | $43 | 0.86 |
| 13 to 18 | 749 | $2,339 | $1,925 | $415 | 0.05 |
| 19 to 24 | 574 | $2,400 | $2,192 | $208 | 0.42 |
| 25 to 30 | 418 | $2,375 | $1,906 | $470 | 0.12 |
| 31 to 36 | 280 | $2,356 | $1,954 | $402 | 0.20 |
| 37 to 42 | 146 | $2,504 | $1,863 | $641 | 0.17 |
| 43 to 48 | 138 | $2,540 | $1,748 | $792 | 0.01 |
| 49 to 54 | 121 | $2,507 | $2,053 | $454 | 0.51 |
| 55 to 60 | 105 | $2,343 | $1,616 | $727 | 0.05 |
| 61 to 66 | 101 | $2,112 | $1,767 | $346 | 0.64 |
| Medicaid Expenditures | |||||
| 1 to 6 | 952 | $3,819 | $4,493 | -$674 | 0.00 |
| 7 to 12 | 827 | $3,701 | $4,699 | -$998 | 0.00 |
| 13 to 18 | 749 | $3,675 | $4,610 | -$936 | 0.00 |
| 19 to 24 | 574 | $3,692 | $4,604 | -$911 | 0.00 |
| 25 to 30 | 418 | $3,683 | $4,729 | -$1,046 | 0.00 |
| 31 to 36 | 280 | $3,689 | $4,658 | -$969 | 0.00 |
| 37 to 42 | 146 | $3,662 | $4,489 | -$827 | 0.00 |
| Medicare and Medicaid Expenditures | |||||
| 1 to 6 | 952 | $5,947 | $8,162 | -$2,215 | 0.00 |
| 7 to 12 | 827 | $5,997 | $6,952 | -$955 | 0.00 |
| 13 to 18 | 749 | $6,014 | $6,535 | -$521 | 0.13 |
| 19 to 24 | 574 | $6,092 | $6,796 | -$704 | 0.02 |
| 25 to 30 | 418 | $6,059 | $6,635 | -$576 | 0.12 |
| 31 to 36 | 280 | $6,045 | $6,612 | -$566 | 0.10 |
| 37 to 42 | 146 | $6,166 | $6,352 | -$186 | 0.71 |
| NOTE: The matched comparison group consists of both NH entrants and HCBS waiver enrollees. Actual means for PACE enrollees are weighted by eligibility weights, defined as the number of months a beneficiary was alive and enrolled in PACE during each 6-month interval. Predicted means for PACE enrollees were obtained by first estimating a separate linear regression for each measurement period and outcome variable on the matched comparison group that controlled for demographics, chronic conditions, pre-enrollment Medicare service utilization and costs, months between the end of the pre-enrollment period and sample entry, indicator for any NH use in the 90 days prior to sample entry, and state indicators. The regressions incorporated the final weight for matched comparison group members obtained by multiplying the eligibility weights--defined as the number of months alive and not in managed care during each 6-month interval--with the propensity score matching weights. The estimated coefficients from these regressions were then used to predict expenditures for PACE enrollees in each interval, using the mean characteristics of the PACE sample in the equation. In some cases, the estimated effect is not exactly equal to the difference in means due to rounding. | |||||
| TABLE 9. Estimated Effect of PACE on PBPM Expenditures (dollars) with Matched Comparison Group Members Comprised of HCBS Waiver Enrollees Alone | |||||
|---|---|---|---|---|---|
| Months from Entry | Number of PACE Enrollees |
Actual Mean for PACE Group |
Predicted Mean for PACE Group |
Estimated Effect |
p-value |
| Medicare Expenditures | |||||
| 1 to 6 | 3,725 | $2,040 | $2,081 | -$42 | 0.54 |
| 7 to 12 | 3,277 | $2,257 | $2,014 | $243 | 0.00 |
| 13 to 18 | 2,946 | $2,326 | $2,038 | $288 | 0.00 |
| 19 to 24 | 2,187 | $2,348 | $2,017 | $331 | 0.00 |
| 25 to 30 | 1,496 | $2,330 | $1,998 | $333 | 0.04 |
| 31 to 36 | 911 | $2,327 | $2,215 | $112 | 0.67 |
| 37 to 42 | 441 | $2,362 | $2,155 | $207 | 0.40 |
| 43 to 48 | 411 | $2,357 | $2,246 | $112 | 0.68 |
| 49 to 54 | 372 | $2,269 | $1,485 | $784 | 0.00 |
| 55 to 60 | 330 | $2,110 | $1,773 | $337 | 0.22 |
| 61 to 66 | 306 | $2,030 | $1,847 | $183 | 0.59 |
| Medicaid Expenditures | |||||
| 1 to 6 | 3,725 | $3,744 | $1,729 | $2,016 | 0.00 |
| 7 to 12 | 3,277 | $3,764 | $2,122 | $1,642 | 0.00 |
| 13 to 18 | 2,946 | $3,830 | $2,333 | $1,497 | 0.00 |
| 19 to 24 | 2,187 | $3,880 | $2,465 | $1,414 | 0.00 |
| 25 to 30 | 1,496 | $3,943 | $2,643 | $1,300 | 0.00 |
| 31 to 36 | 911 | $4,012 | $2,802 | $1,210 | 0.00 |
| 37 to 42 | 441 | $4,128 | $2,844 | $1,284 | 0.00 |
| Medicare and Medicaid Expenditures | |||||
| 1 to 6 | 3,725 | $5,784 | $3,810 | $1,974 | 0.00 |
| 7 to 12 | 3,277 | $6,021 | $4,136 | $1,885 | 0.00 |
| 13 to 18 | 2,946 | $6,156 | $4,370 | $1,785 | 0.00 |
| 19 to 24 | 2,187 | $6,228 | $4,483 | $1,745 | 0.00 |
| 25 to 30 | 1,496 | $6,273 | $4,640 | $1,633 | 0.00 |
| 31 to 36 | 911 | $6,339 | $5,016 | $1,323 | 0.00 |
| 37 to 42 | 441 | $6,490 | $4,999 | $1,490 | 0.00 |
| NOTE: The matched comparison group consists of HCBS waiver enrollees. Actual means for PACE enrollees are weighted by eligibility weights, defined as the number of months a beneficiary was alive and enrolled in PACE during each 6-month interval. Predicted means for PACE enrollees were obtained by first estimating a separate linear regression for each measurement period and outcome variable on the matched comparison group that controlled for demographics, chronic conditions, pre-enrollment Medicare service utilization and costs, months between the end of the pre-enrollment period and sample entry, indicator for any NH use in the 90 days prior to sample entry, and state indicators. The regressions incorporated the final weight for matched comparison group members obtained by multiplying the eligibility weights--defined as the number of months alive and not in managed care during each 6-month interval--with the propensity score matching weights. The estimated coefficients from these regressions were then used to predict expenditures for PACE enrollees in each interval, using the mean characteristics of the PACE sample in the equation. In some cases, the estimated effect is not exactly equal to the difference in means due to rounding. ADDITIONAL NOTE: After this report was posted, we received information from the National PACE Association noting that Medicaid amounts for PACE enrollees in California appear to be inconsistent with capitation rates for PACE plans published by the California Department of Health Care Services. We are working to resolve this issue and will amend entries in this table and associated discussion in the text if changes are required. |
|||||
| TABLE 10. Estimated Effect of PACE on PBPM Expenditures in California (dollars) with Matched Comparison Group Members Comprised of HCBS Waiver Enrollees Alone | |||||
|---|---|---|---|---|---|
| Months from Entry | Number of PACE Enrollees |
Actual Mean for PACE Group |
Predicted Mean for PACE Group |
Estimated Effect |
p-value |
| Medicare Expenditures | |||||
| 1 to 6 | 661 | $1,731 | $1,927 | -$196 | 0.24 |
| 7 to 12 | 580 | $1,958 | $1,875 | $83 | 0.64 |
| 13 to 18 | 530 | $2,061 | $2,119 | -$58 | 0.85 |
| 19 to 24 | 400 | $2,087 | $1,786 | $301 | 0.35 |
| 25 to 30 | 300 | $2,055 | $1,632 | $424 | 0.15 |
| 31 to 36 | 201 | $2,032 | $3,534 | -$1,502 | 0.18 |
| 37 to 42 | 114 | $2,097 | $1,412 | $685 | 0.54 |
| 43 to 48 | 109 | $2,262 | $1,093 | $1,169 | 0.44 |
| 49 to 54 | 102 | $2,140 | $1,512 | $628 | 0.32 |
| 55 to 60 | 93 | $1,955 | $902 | $1,053 | 0.28 |
| 61 to 66 | 86 | $1,905 | $770 | $1,135 | 0.26 |
| Medicaid Expenditures | |||||
| 1 to 6 | 661 | $5,296 | $1,758 | $3,538 | 0.00 |
| 7 to 12 | 580 | $5,458 | $2,045 | $3,413 | 0.00 |
| 13 to 18 | 530 | $5,717 | $2,214 | $3,503 | 0.00 |
| 19 to 24 | 400 | $5,861 | $2,219 | $3,643 | 0.00 |
| 25 to 30 | 300 | $5,863 | $2,486 | $3,377 | 0.00 |
| 31 to 36 | 201 | $5,879 | $2,491 | $3,388 | 0.00 |
| 37 to 42 | 114 | $5,896 | $2,626 | $3,270 | 0.00 |
| Medicare and Medicaid Expenditures | |||||
| 1 to 6 | 661 | $7,027 | $3,685 | $3,342 | 0.00 |
| 7 to 12 | 580 | $7,416 | $3,920 | $3,496 | 0.00 |
| 13 to 18 | 530 | $7,778 | $4,333 | $3,445 | 0.00 |
| 19 to 24 | 400 | $7,949 | $4,005 | $3,944 | 0.00 |
| 25 to 30 | 300 | $7,918 | $4,117 | $3,801 | 0.00 |
| 31 to 36 | 201 | $7,912 | $6,025 | $1,887 | 0.10 |
| 37 to 42 | 114 | $7,994 | $4,039 | $3,955 | 0.01 |
| NOTE: The matched comparison group consists of HCBS waiver enrollees. Actual means for PACE enrollees are weighted by eligibility weights, defined as the number of months a beneficiary was alive and enrolled in PACE during each 6-month interval. Predicted means for PACE enrollees were obtained by first estimating a separate linear regression for each measurement period and outcome variable on the matched comparison group that controlled for demographics, chronic conditions, pre-enrollment Medicare service utilization and costs, months between the end of the pre-enrollment period and sample entry, indicator for any NH use in the 90 days prior to sample entry, and state indicators. The regressions incorporated the final weight for matched comparison group members obtained by multiplying the eligibility weights--defined as the number of months alive and not in managed care during each 6-month interval--with the propensity score matching weights. The estimated coefficients from these regressions were then used to predict expenditures for PACE enrollees in each interval, using the mean characteristics of the PACE sample in the equation. In some cases, the estimated effect is not exactly equal to the difference in means due to rounding. ADDITIONAL NOTE: After this report was posted, we received information from the National PACE Association noting that Medicaid amounts for PACE enrollees in California appear to be inconsistent with capitation rates for PACE plans published by the California Department of Health Care Services. We are working to resolve this issue and will amend entries in this table and associated discussion in the text if changes are required. |
|||||
| TABLE 11. Estimated Effect of PACE on PBPM Expenditures in Massachusetts (dollars) with Matched Comparison Group Members Comprised of HCBS Waiver Enrollees Alone | |||||
|---|---|---|---|---|---|
| Months from Entry | Number of PACE Enrollees |
Actual Mean for PACE Group |
Predicted Mean for PACE Group |
Estimated Effect |
p-value |
| Medicare Expenditures | |||||
| 1 to 6 | 821 | $2,196 | $2,644 | -$448 | 0.02 |
| 7 to 12 | 726 | $2,486 | $2,536 | -$50 | 0.80 |
| 13 to 18 | 661 | $2,526 | $2,469 | $57 | 0.75 |
| 19 to 24 | 480 | $2,464 | $2,057 | $407 | 0.09 |
| 25 to 30 | 313 | $2,450 | $2,221 | $229 | 0.48 |
| 31 to 36 | 162 | $2,531 | $1,858 | $673 | 0.07 |
| Medicaid Expenditures | |||||
| 1 to 6 | 821 | $3,210 | $1,279 | $1,931 | 0.00 |
| 7 to 12 | 726 | $3,235 | $1,817 | $1,418 | 0.00 |
| 13 to 18 | 661 | $3,237 | $2,160 | $1,077 | 0.00 |
| 19 to 24 | 480 | $3,243 | $2,198 | $1,045 | 0.00 |
| 25 to 30 | 313 | $3,244 | $2,180 | $1,064 | 0.00 |
| 31 to 36 | 162 | $3,283 | $2,438 | $844 | 0.00 |
| Medicare and Medicaid Expenditures | |||||
| 1 to 6 | 821 | $5,406 | $3,923 | $1,483 | 0.00 |
| 7 to 12 | 726 | $5,720 | $4,353 | $1,368 | 0.00 |
| 13 to 18 | 661 | $5,763 | $4,629 | $1,134 | 0.00 |
| 19 to 24 | 480 | $5,708 | $4,255 | $1,453 | 0.00 |
| 25 to 30 | 313 | $5,694 | $4,401 | $1,293 | 0.00 |
| 31 to 36 | 162 | $5,814 | $4,297 | $1,518 | 0.00 |
| NOTE: For Massachusetts, we only report results through month 36 after sample entry, due to very small sample sizes (fewer than 70 PACE enrollees) in later intervals. The matched comparison group consists of HCBS waiver enrollees. Actual means for PACE enrollees are weighted by eligibility weights, defined as the number of months a beneficiary was alive and enrolled in PACE during each 6-month interval. Predicted means for PACE enrollees were obtained by first estimating a separate linear regression for each measurement period and outcome variable on the matched comparison group that controlled for demographics, chronic conditions, pre-enrollment Medicare service utilization and costs, months between the end of the pre-enrollment period and sample entry, indicator for any NH use in the 90 days prior to sample entry, and state indicators. The regressions incorporated the final weight for matched comparison group members obtained by multiplying the eligibility weights--defined as the number of months alive and not in managed care during each 6-month interval--with the propensity score matching weights. The estimated coefficients from these regressions were then used to predict expenditures for PACE enrollees in each interval, using the mean characteristics of the PACE sample in the equation. In some cases, the estimated effect is not exactly equal to the difference in means due to rounding. | |||||
| TABLE 12. Estimated Effect of PACE on PBPM Expenditures in New York (dollars) with Matched Comparison Group Members Comprised of HCBS Waiver Enrollees Alone | |||||
|---|---|---|---|---|---|
| Months from Entry | Number of PACE Enrollees |
Actual Mean for PACE Group |
Predicted Mean for PACE Group |
Estimated Effect |
p-value |
| Medicare Expenditures | |||||
| 1 to 6 | 952 | $2,128 | $1,360 | $768 | 0.00 |
| 7 to 12 | 827 | $2,296 | $1,330 | $966 | 0.00 |
| 13 to 18 | 749 | $2,339 | $1,591 | $748 | 0.00 |
| 19 to 24 | 574 | $2,400 | $1,650 | $750 | 0.00 |
| 25 to 30 | 418 | $2,375 | $1,537 | $838 | 0.01 |
| 31 to 36 | 280 | $2,356 | $1,404 | $952 | 0.01 |
| 37 to 42 | 146 | $2,504 | $1,868 | $636 | 0.22 |
| 43 to 48 | 138 | $2,540 | $1,754 | $786 | 0.10 |
| 49 to 54 | 121 | $2,507 | $1,243 | $1,264 | 0.00 |
| 55 to 60 | 105 | $2,343 | $1,639 | $704 | 0.27 |
| 61 to 66 | 101 | $2,112 | $2,387 | -$275 | 0.62 |
| Medicaid Expenditures | |||||
| 1 to 6 | 952 | $3,819 | $3,175 | $644 | 0.00 |
| 7 to 12 | 827 | $3,701 | $3,428 | $273 | 0.00 |
| 13 to 18 | 749 | $3,675 | $3,568 | $107 | 0.21 |
| 19 to 24 | 574 | $3,692 | $3,579 | $113 | 0.27 |
| 25 to 30 | 418 | $3,683 | $3,897 | -$214 | 0.09 |
| 31 to 36 | 280 | $3,689 | $3,867 | -$177 | 0.31 |
| 37 to 42 | 146 | $3,662 | $4,040 | -$377 | 0.16 |
| Medicare and Medicaid Expenditures | |||||
| 1 to 6 | 952 | $5,947 | $4,535 | $1,412 | 0.00 |
| 7 to 12 | 827 | $5,997 | $4,758 | $1,239 | 0.00 |
| 13 to 18 | 749 | $6,014 | $5,159 | $855 | 0.00 |
| 19 to 24 | 574 | $6,092 | $5,229 | $863 | 0.00 |
| 25 to 30 | 418 | $6,059 | $5,434 | $625 | 0.07 |
| 31 to 36 | 280 | $6,045 | $5,271 | $775 | 0.06 |
| 37 to 42 | 146 | $6,166 | $5,908 | $258 | 0.67 |
| NOTE: The matched comparison group consists of HCBS waiver enrollees. Actual means for PACE enrollees are weighted by eligibility weights, defined as the number of months a beneficiary was alive and enrolled in PACE during each 6-month interval. Predicted means for PACE enrollees were obtained by first estimating a separate linear regression for each measurement period and outcome variable on the matched comparison group that controlled for demographics, chronic conditions, pre-enrollment Medicare service utilization and costs, months between the end of the pre-enrollment period and sample entry, indicator for any NH use in the 90 days prior to sample entry, and state indicators. The regressions incorporated the final weight for matched comparison group members obtained by multiplying the eligibility weights--defined as the number of months alive and not in managed care during each 6-month interval--with the propensity score matching weights. The estimated coefficients from these regressions were then used to predict expenditures for PACE enrollees in each interval, using the mean characteristics of the PACE sample in the equation. In some cases, the estimated effect is not exactly equal to the difference in means due to rounding. | |||||
| TABLE 13. Regression-Adjusted Mean Mortality Rate for PACE and Matched Comparison Group Members Comprised of Both NH Entrants and HCBS Waiver Enrollees, by Group (cumulative percentages) |
||||||
|---|---|---|---|---|---|---|
| Deceased by End of: | Number of PACE Enrollees |
Regression-Adjusted Mean for PACE Group |
Number of Matched Comparison Group Enrollees |
Regression-Adjusted Mean for Matched Comparison Group |
Estimated Effect |
p-value |
| Month 6 | 3,725 | 4.36% | 3,264 | 12.17% | -7.81% | 0.00 |
| Month 12 | 3,725 | 9.17% | 3,264 | 21.57% | -12.40% | 0.00 |
| Month 18 | 3,725 | 13.81% | 3,264 | 29.07% | -15.26% | 0.00 |
| Month 24 | 3,725 | 18.44% | 3,264 | 35.41% | -16.96% | 0.00 |
| Month 30 | 3,725 | 23.47% | 3,264 | 39.58% | -16.10% | 0.00 |
| Month 36 | 3,725 | 28.86% | 3,264 | 44.46% | -15.59% | 0.00 |
| Month 42 | 3,073 | 33.02% | 2,690 | 48.72% | -15.70% | 0.00 |
| Month 48 | 2,313 | 36.84% | 2,019 | 52.40% | -15.56% | 0.00 |
| Month 54 | 1,553 | 40.85% | 1,455 | 54.02% | -13.17% | 0.00 |
| Month 60 | 844 | 42.73% | 827 | 50.95% | -8.21% | 0.00 |
| NOTE: The matched comparison group consists of both NH entrants and HCBS waiver enrollees. Regression-adjusted means were obtained from a separate logistic regression for each measurement period that controlled for demographics, chronic conditions, pre-enrollment Medicare service utilization and costs, months between the end of the pre-enrollment period and sample entry, indicator for any NH use in the 90 days prior to sample entry, and state indicators. For each regression, the entire matched sample was used for the first 6 intervals (since all sample members had at least 36 months of followup, with mortality data available through 2011), and the estimation sample in later intervals was restricted to those whose period of sample entry would allow us to observe their mortality in a particular interval. The predicted means are the cumulative mortality rate in each group, in each interval. Also, the regressions incorporate propensity score matching weights for the matched comparison group. In some cases, the estimated effect is not exactly equal to the difference in means due to rounding. We do not present results for the 11th interval (months 61-66) after enrollment due to the small sample sizes in both the treatment and matched comparison groups, which make the mortality estimates unreliable for that interval. | ||||||
| TABLE 14. Regression-Adjusted Mean Mortality Rate for PACE and Matched Comparison Group Members Comprised of HCBS Waiver Enrollees Alone, by Group (cumulative percentages) |
||||||
|---|---|---|---|---|---|---|
| Deceased by End of: | Number of PACE Enrollees |
Regression-Adjusted Mean for PACE Group |
Number of Matched Comparison Group Enrollees |
Regression-Adjusted Mean for Matched Comparison Group |
Estimated Effect |
p-value |
| Month 6 | 3,725 | 4.39% | 2,745 | 6.09% | -1.70% | 0.00 |
| Month 12 | 3,725 | 9.24% | 2,745 | 13.02% | -3.79% | 0.00 |
| Month 18 | 3,725 | 13.89% | 2,745 | 18.77% | -4.88% | 0.00 |
| Month 24 | 3,725 | 18.49% | 2,745 | 24.61% | -6.12% | 0.00 |
| Month 30 | 3,725 | 23.55% | 2,745 | 29.43% | -5.88% | 0.00 |
| Month 36 | 3,725 | 28.93% | 2,745 | 33.71% | -4.78% | 0.00 |
| Month 42 | 3,073 | 33.07% | 2,245 | 38.82% | -5.74% | 0.00 |
| Month 48 | 2,313 | 36.85% | 1,804 | 42.02% | -5.17% | 0.00 |
| Month 54 | 1,553 | 40.60% | 1,323 | 42.67% | -2.07% | 0.20 |
| Month 60 | 844 | 43.59% | 895 | 44.19% | -0.60% | 0.78 |
| NOTE: The matched comparison group consists of HCBS waiver enrollees only. Regression-adjusted means were obtained from a separate logistic regression for each measurement period that controlled for demographics, chronic conditions, pre-enrollment Medicare service utilization and costs, months between the end of the pre-enrollment period and sample entry, indicator for any NH use in the 90 days prior to sample entry, and state indicators. For each regression, the entire matched sample was used for the first 6 intervals (since all sample members had at least 36 months of followup, with mortality data available through 2011), and the estimation sample in later intervals was restricted to those whose period of sample entry would allow us to observe their mortality in a particular interval. The predicted means are the cumulative mortality rate in each group, in each interval. Also, the regressions incorporate propensity score matching weights for the matched comparison group. In some cases, the estimated effect is not exactly equal to the difference in means due to rounding. We do not present results for the 11th interval (months 61-66) after enrollment due to the small sample sizes in both the treatment and matched comparison groups, which make the mortality estimates unreliable for that interval. | ||||||
| TABLE 15. Estimated Effect of PACE on NH Utilization with Matched Comparison Group Members Comprised of HCBS Waiver Enrollees Alone | ||||||
|---|---|---|---|---|---|---|
| Months from Entry | Number of PACE Enrollees |
Regression-Adjusted Mean for PACE Group |
Number of Matched Comparison Group Enrollees |
Regression-Adjusted Mean for Matched Comparison Group |
Estimated Effect |
p-value |
| Any Nursing Home Use | ||||||
| 1 to 6 | 3,725 | 0.125 | 2,745 | 0.093 | 0.032 | 0.00 |
| 7 to 12 | 3,277 | 0.151 | 2,481 | 0.107 | 0.044 | 0.00 |
| 13 to 18 | 2,946 | 0.165 | 2,228 | 0.126 | 0.039 | 0.00 |
| 19 to 24 | 2,187 | 0.166 | 1,653 | 0.131 | 0.035 | 0.00 |
| 25 to 30 | 1,496 | 0.162 | 1,237 | 0.148 | 0.014 | 0.26 |
| 31 to 36 | 911 | 0.142 | 854 | 0.144 | -0.002 | 0.89 |
| 37 to 42 | 441 | 0.112 | 591 | 0.113 | -0.002 | 0.92 |
| Proportion of Days in the Nursing Home | ||||||
| 1 to 6 | 3,725 | 0.027 | 2,745 | 0.022 | 0.005 | 0.03 |
| 7 to 12 | 3,277 | 0.053 | 2,481 | 0.059 | -0.006 | 0.26 |
| 13 to 18 | 2,946 | 0.065 | 2,228 | 0.074 | -0.009 | 0.14 |
| 19 to 24 | 2,187 | 0.073 | 1,653 | 0.084 | -0.011 | 0.15 |
| 25 to 30 | 1,496 | 0.075 | 1,237 | 0.088 | -0.013 | 0.14 |
| 31 to 36 | 911 | 0.059 | 854 | 0.095 | -0.036 | 0.00 |
| 37 to 42 | 441 | 0.049 | 591 | 0.056 | -0.007 | 0.58 |
| At Least 30 Days in the Nursing Home | ||||||
| 1 to 6 | 3,561 | 0.049 | 2,590 | 0.041 | 0.008 | 0.13 |
| 7 to 12 | 3,121 | 0.079 | 2,314 | 0.082 | -0.003 | 0.67 |
| 13 to 18 | 2,799 | 0.089 | 2,090 | 0.096 | -0.007 | 0.35 |
| 19 to 24 | 2,082 | 0.101 | 1,551 | 0.111 | -0.010 | 0.31 |
| 25 to 30 | 1,412 | 0.102 | 1,179 | 0.124 | -0.022 | 0.06 |
| 31 to 36 | 850 | 0.085 | 815 | 0.116 | -0.032 | 0.02 |
| 37 to 42 | 420 | 0.085 | 557 | 0.102 | -0.017 | 0.37 |
| At Least 90 Days in the Nursing Home | ||||||
| 1 to 6 | 3,561 | 0.017 | 2,590 | 0.016 | 0.001 | 0.69 |
| 7 to 12 | 3,121 | 0.045 | 2,314 | 0.060 | -0.015 | 0.01 |
| 13 to 18 | 2,799 | 0.054 | 2,090 | 0.078 | -0.024 | 0.00 |
| 19 to 24 | 2,082 | 0.065 | 1,551 | 0.088 | -0.023 | 0.01 |
| 25 to 30 | 1,412 | 0.068 | 1,179 | 0.094 | -0.027 | 0.01 |
| 31 to 36 | 850 | 0.056 | 815 | 0.097 | -0.041 | 0.00 |
| 37 to 42 | 420 | 0.043 | 557 | 0.069 | -0.026 | 0.10 |
| NOTE: The matched comparison group consists of HCBS waiver enrollees only. Regression-adjusted means were obtained from a separate logistic regression (linear regression for proportion of days) for each measurement period that controlled for demographics, chronic conditions, pre-enrollment Medicare service utilization and costs, months between the end of the pre-enrollment period and sample entry, indicator for any NH use in the 90 days prior to sample entry, and state indicators. The outcomes--at least 30 or 90 days in the NH--were defined conditional on a beneficiary being alive during an interval. The regressions incorporate eligibility weights for PACE enrollees and eligibility weights multiplied with propensity score matching weights for the matched comparison group. In some cases, the estimated effect is not exactly equal to the difference in means due to rounding. | ||||||
| TABLE 16. Estimated Effect of PACE on NH Utilization, After Excluding New York, with Matched Comparison Group Members Comprised of HCBS Waiver Enrollees Alone | ||||||
|---|---|---|---|---|---|---|
| Months from Entry | Number of PACE Enrollees |
Regression-Adjusted Mean for PACE Group |
Number of Matched Comparison Group Enrollees |
Regression-Adjusted Mean for Matched Comparison Group |
Estimated Effect |
p-value |
| Any Nursing Home Use | ||||||
| 1 to 6 | 2,773 | 0.152 | 1,905 | 0.113 | 0.040 | 0.00 |
| 7 to 12 | 2,450 | 0.179 | 1,678 | 0.128 | 0.051 | 0.00 |
| 13 to 18 | 2,197 | 0.202 | 1,477 | 0.152 | 0.050 | 0.00 |
| 19 to 24 | 1,613 | 0.198 | 1,025 | 0.159 | 0.039 | 0.01 |
| 25 to 30 | 1,078 | 0.194 | 701 | 0.190 | 0.004 | 0.81 |
| 31 to 36 | 631 | 0.189 | 418 | 0.181 | 0.008 | 0.72 |
| 37 to 42 | 295 | 0.157 | 203 | 0.158 | 0.000 | 0.99 |
| Proportion of Days in the Nursing Home | ||||||
| 1 to 6 | 2,773 | 0.033 | 1,905 | 0.025 | 0.008 | 0.01 |
| 7 to 12 | 2,450 | 0.061 | 1,678 | 0.071 | -0.010 | 0.13 |
| 13 to 18 | 2,197 | 0.078 | 1,477 | 0.088 | -0.010 | 0.19 |
| 19 to 24 | 1,613 | 0.084 | 1,025 | 0.106 | -0.022 | 0.03 |
| 25 to 30 | 1,078 | 0.090 | 701 | 0.112 | -0.022 | 0.08 |
| 31 to 36 | 631 | 0.076 | 418 | 0.129 | -0.053 | 0.00 |
| 37 to 42 | 295 | 0.067 | 203 | 0.074 | -0.006 | 0.74 |
| At Least 30 Days in the Nursing Home | ||||||
| 1 to 6 | 2,636 | 0.057 | 1,772 | 0.047 | 0.009 | 0.14 |
| 7 to 12 | 2,319 | 0.089 | 1,538 | 0.098 | -0.009 | 0.32 |
| 13 to 18 | 2,090 | 0.106 | 1,373 | 0.117 | -0.010 | 0.29 |
| 19 to 24 | 1,530 | 0.119 | 948 | 0.140 | -0.021 | 0.09 |
| 25 to 30 | 1,009 | 0.119 | 663 | 0.162 | -0.043 | 0.01 |
| 31 to 36 | 586 | 0.107 | 395 | 0.151 | -0.044 | 0.02 |
| 37 to 42 | 278 | 0.125 | 186 | 0.130 | -0.004 | 0.88 |
| At Least 90 Days in the Nursing Home | ||||||
| 1 to 6 | 2,636 | 0.020 | 1,772 | 0.017 | 0.004 | 0.33 |
| 7 to 12 | 2,319 | 0.051 | 1,538 | 0.072 | -0.021 | 0.00 |
| 13 to 18 | 2,090 | 0.064 | 1,373 | 0.092 | -0.028 | 0.00 |
| 19 to 24 | 1,530 | 0.076 | 948 | 0.112 | -0.036 | 0.00 |
| 25 to 30 | 1,009 | 0.082 | 663 | 0.121 | -0.038 | 0.01 |
| 31 to 36 | 586 | 0.072 | 395 | 0.129 | -0.056 | 0.00 |
| 37 to 42 | 278 | 0.067 | 186 | 0.076 | -0.009 | 0.70 |
| NOTE: The matched comparison group consists of HCBS waiver enrollees only. Regression-adjusted means were obtained from a separate logistic regression (linear regression for proportion of days) for each measurement period that controlled for demographics, chronic conditions, pre-enrollment Medicare service utilization and costs, months between the end of the pre-enrollment period and sample entry, indicator for any NH use in the 90 days prior to sample entry, and state indicators. The outcomes--at least 30 or 90 days in the NH--were defined conditional on a beneficiary being alive during an interval. The regressions incorporate eligibility weights for PACE enrollees and eligibility weights multiplied with propensity score matching weights for the matched comparison group. In some cases, the estimated effect is not exactly equal to the difference in means due to rounding. | ||||||
| TABLE 17. Estimated Effect of PACE on the Cumulative Risk of Being in a NH For At Least 90 Days with Matched Comparison Group Members Comprised of HCBS Waiver Enrollees Alone | ||||||
|---|---|---|---|---|---|---|
| Months from Entry | Number of PACE Enrollees |
Regression-Adjusted Mean for PACE Group |
Number of Matched Comparison Group Enrollees |
Regression-Adjusted Mean for Matched Comparison Group |
Estimated Effect |
p-value |
| 1 to 6 | 3,725 | 0.019 | 2,745 | 0.016 | 0.003 | 0.34 |
| 7 to 12 | 3,725 | 0.058 | 2,745 | 0.058 | 0.000 | 1.00 |
| 13 to 18 | 3,073 | 0.080 | 2,245 | 0.079 | 0.001 | 0.87 |
| 19 to 24 | 2,313 | 0.107 | 1,804 | 0.101 | 0.006 | 0.46 |
| 25 to 30 | 1,553 | 0.119 | 1,323 | 0.106 | 0.013 | 0.24 |
| 31 to 36 | 844 | 0.118 | 895 | 0.112 | 0.005 | 0.71 |
| NOTE: The matched comparison group consists of HCBS waiver enrollees only. Regression-adjusted means were obtained from a separate logistic regression for each measurement period that controlled for demographics, chronic conditions, pre-enrollment Medicare service utilization and costs, months between the end of the pre-enrollment period and sample entry, indicator for any NH use in the 90 days prior to sample entry, and state indicators. For each regression, the entire matched sample was used for the first 2 intervals (since all sample members had at least 12 months of followup, with NH use data available through 2009), and the estimation sample in the later intervals was restricted to those whose period of sample entry would allow us to observe their NH use in those intervals. The predicted means are the cumulative risk of being in a NH for at least 90 days in each group, in each interval. The regressions incorporate propensity score matching weights for the matched comparison group. In some cases, the estimated effect is not exactly equal to the difference in means due to rounding. We do not present results for the 7th interval (months 37-42) after enrollment due to the small sample sizes in both the treatment and matched comparison groups, which make the estimates unreliable for that interval | ||||||
| TABLE 18. Estimated Effect of PACE on NH Utilization with Matched Comparison Group Members Comprised of Both NH Entrants and HCBS Waiver Enrollees | ||||||
|---|---|---|---|---|---|---|
| Months from Entry | Number of PACE Enrollees |
Regression-Adjusted Mean for PACE Group |
Number of Matched Comparison Group Enrollees |
Regression-Adjusted Mean for Matched Comparison Group |
Estimated Effect |
p-value |
| Any Nursing Home Use | ||||||
| 1 to 6 | 3,725 | 0.126 | 3,264 | 0.592 | -0.466 | 0.00 |
| 7 to 12 | 3,277 | 0.153 | 2,736 | 0.449 | -0.296 | 0.00 |
| 13 to 18 | 2,946 | 0.166 | 2,363 | 0.425 | -0.259 | 0.00 |
| 19 to 24 | 2,187 | 0.166 | 1,690 | 0.401 | -0.235 | 0.00 |
| 25 to 30 | 1,496 | 0.162 | 1,166 | 0.387 | -0.225 | 0.00 |
| 31 to 36 | 911 | 0.142 | 807 | 0.355 | -0.214 | 0.00 |
| 37 to 42 | 441 | 0.105 | 483 | 0.252 | -0.147 | 0.00 |
| Proportion of Days in the Nursing Home | ||||||
| 1 to 6 | 3,725 | 0.028 | 3,264 | 0.308 | -0.280 | 0.00 |
| 7 to 12 | 3,277 | 0.053 | 2,736 | 0.354 | -0.301 | 0.00 |
| 13 to 18 | 2,946 | 0.064 | 2,363 | 0.327 | -0.263 | 0.00 |
| 19 to 24 | 2,187 | 0.070 | 1,690 | 0.286 | -0.216 | 0.00 |
| 25 to 30 | 1,496 | 0.070 | 1,166 | 0.266 | -0.196 | 0.00 |
| 31 to 36 | 911 | 0.051 | 807 | 0.235 | -0.183 | 0.00 |
| 37 to 42 | 441 | 0.034 | 483 | 0.146 | -0.112 | 0.00 |
| At Least 30 Days in the Nursing Home | ||||||
| 1 to 6 | 3,561 | 0.050 | 2,877 | 0.474 | -0.424 | 0.00 |
| 7 to 12 | 3,121 | 0.080 | 2,463 | 0.413 | -0.332 | 0.00 |
| 13 to 18 | 2,799 | 0.090 | 2,136 | 0.396 | -0.307 | 0.00 |
| 19 to 24 | 2,082 | 0.101 | 1,545 | 0.367 | -0.266 | 0.00 |
| 25 to 30 | 1,412 | 0.102 | 1,097 | 0.361 | -0.259 | 0.00 |
| 31 to 36 | 850 | 0.085 | 754 | 0.328 | -0.244 | 0.00 |
| 37 to 42 | 420 | 0.077 | 450 | 0.233 | -0.156 | 0.00 |
| At Least 90 Days in the Nursing Home | ||||||
| 1 to 6 | 3,561 | 0.018 | 2,877 | 0.328 | -0.310 | 0.00 |
| 7 to 12 | 3,121 | 0.046 | 2,463 | 0.374 | -0.328 | 0.00 |
| 13 to 18 | 2,799 | 0.055 | 2,136 | 0.349 | -0.294 | 0.00 |
| 19 to 24 | 2,082 | 0.065 | 1,545 | 0.305 | -0.240 | 0.00 |
| 25 to 30 | 1,412 | 0.067 | 1,097 | 0.286 | -0.220 | 0.00 |
| 31 to 36 | 850 | 0.057 | 754 | 0.268 | -0.211 | 0.00 |
| 37 to 42 | 420 | 0.037 | 450 | 0.170 | -0.133 | 0.00 |
| NOTE: The matched comparison group consists of both NH entrants and HCBS waiver enrollees. Regression-adjusted means were obtained from a separate logistic regression (linear regression for proportion of days) for each measurement period that controlled for demographics, chronic conditions, pre-enrollment Medicare service utilization and costs, months between the end of the pre-enrollment period and sample entry, indicator for any NH use in the 90 days prior to sample entry, and state indicators. The outcomes--at least 30 or 90 days in the NH--were defined conditional on a beneficiary being alive during an interval. The regressions incorporate eligibility weights for PACE enrollees and eligibility weights multiplied with propensity score matching weights for the matched comparison group. In some cases, the estimated effect is not exactly equal to the difference in means due to rounding. | ||||||
| TABLE 19. Estimated Effect of PACE on NH Utilization, After Excluding New York, with Matched Comparison Group Members Comprised of Both NH Entrants and HCBS Waiver Enrollees | ||||||
|---|---|---|---|---|---|---|
| Months from Entry | Number of PACE Enrollees |
Regression-Adjusted Mean for PACE Group |
Number of Matched Comparison Group Enrollees |
Regression-Adjusted Mean for Matched Comparison Group |
Estimated Effect |
p-value |
| Any Nursing Home Use | ||||||
| 1 to 6 | 2,773 | 0.152 | 2,363 | 0.642 | -0.490 | 0.00 |
| 7 to 12 | 2,450 | 0.181 | 1,930 | 0.488 | -0.307 | 0.00 |
| 13 to 18 | 2,197 | 0.202 | 1,638 | 0.458 | -0.256 | 0.00 |
| 19 to 24 | 1,613 | 0.196 | 1,109 | 0.439 | -0.242 | 0.00 |
| 25 to 30 | 1,078 | 0.192 | 698 | 0.442 | -0.250 | 0.00 |
| 31 to 36 | 631 | 0.190 | 425 | 0.426 | -0.236 | 0.00 |
| 37 to 42 | 295 | 0.150 | 183 | 0.335 | -0.186 | 0.00 |
| Proportion of Days in the Nursing Home | ||||||
| 1 to 6 | 2,773 | 0.033 | 2,363 | 0.334 | -0.301 | 0.00 |
| 7 to 12 | 2,450 | 0.061 | 1,930 | 0.381 | -0.320 | 0.00 |
| 13 to 18 | 2,197 | 0.078 | 1,638 | 0.352 | -0.274 | 0.00 |
| 19 to 24 | 1,613 | 0.081 | 1,109 | 0.311 | -0.230 | 0.00 |
| 25 to 30 | 1,078 | 0.087 | 698 | 0.304 | -0.217 | 0.00 |
| 31 to 36 | 631 | 0.072 | 425 | 0.291 | -0.219 | 0.00 |
| 37 to 42 | 295 | 0.059 | 183 | 0.202 | -0.143 | 0.00 |
| At Least 30 Days in the Nursing Home | ||||||
| 1 to 6 | 2,636 | 0.057 | 2,046 | 0.512 | -0.455 | 0.00 |
| 7 to 12 | 2,319 | 0.090 | 1,705 | 0.447 | -0.357 | 0.00 |
| 13 to 18 | 2,090 | 0.106 | 1,461 | 0.426 | -0.320 | 0.00 |
| 19 to 24 | 1,530 | 0.118 | 999 | 0.406 | -0.288 | 0.00 |
| 25 to 30 | 1,009 | 0.118 | 649 | 0.414 | -0.297 | 0.00 |
| 31 to 36 | 586 | 0.107 | 393 | 0.395 | -0.288 | 0.00 |
| 37 to 42 | 278 | 0.110 | 163 | 0.309 | -0.200 | 0.00 |
| At Least 90 Days in the Nursing Home | ||||||
| 1 to 6 | 2,636 | 0.021 | 2,046 | 0.355 | -0.334 | 0.00 |
| 7 to 12 | 2,319 | 0.051 | 1,705 | 0.403 | -0.352 | 0.00 |
| 13 to 18 | 2,090 | 0.064 | 1,461 | 0.374 | -0.310 | 0.00 |
| 19 to 24 | 1,530 | 0.074 | 999 | 0.333 | -0.259 | 0.00 |
| 25 to 30 | 1,009 | 0.079 | 649 | 0.325 | -0.246 | 0.00 |
| 31 to 36 | 586 | 0.072 | 393 | 0.328 | -0.257 | 0.00 |
| 37 to 42 | 278 | 0.054 | 163 | 0.206 | -0.152 | 0.00 |
| NOTE: The matched comparison group consists of both NH entrants and HCBS waiver enrollees. Regression-adjusted means were obtained from a separate logistic regression (linear regression for proportion of days) for each measurement period that controlled for demographics, chronic conditions, pre-enrollment Medicare service utilization and costs, months between the end of the pre-enrollment period and sample entry, indicator for any NH use in the 90 days prior to sample entry, and state indicators. The outcomes--at least 30 or 90 days in the NH--were defined conditional on a beneficiary being alive during an interval. The regressions incorporate eligibility weights for PACE enrollees and eligibility weights multiplied with propensity score matching weights for the matched comparison group. In some cases, the estimated effect is not exactly equal to the difference in means due to rounding. | ||||||
| TABLE 20. Estimated Effect of PACE on the Cumulative Risk of Being in a NH For At Least 90 Days with Matched Comparison Group Members Comprised of Both NH Entrants and HCBS Waiver Enrollees | ||||||
|---|---|---|---|---|---|---|
| Months from Entry | Number of PACE Enrollees |
Regression-Adjusted Mean for PACE Group |
Number of Matched Comparison Group Enrollees |
Regression-Adjusted Mean for Matched Comparison Group |
Estimated Effect |
p-value |
| 1 to 6 | 3,725 | 0.020 | 3,264 | 0.304 | -0.284 | 0.00 |
| 7 to 12 | 3,725 | 0.059 | 3,264 | 0.383 | -0.324 | 0.00 |
| 13 to 18 | 3,073 | 0.082 | 2,690 | 0.397 | -0.314 | 0.00 |
| 19 to 24 | 2,313 | 0.109 | 2,019 | 0.386 | -0.277 | 0.00 |
| 25 to 30 | 1,553 | 0.123 | 1,455 | 0.371 | -0.248 | 0.00 |
| 31 to 36 | 844 | 0.117 | 827 | 0.315 | -0.198 | 0.00 |
| NOTE: The matched comparison group consists of both NH entrants and HCBS waiver enrollees. Regression-adjusted means were obtained from a separate logistic regression for each measurement period that controlled for demographics, chronic conditions, pre-enrollment Medicare service utilization and costs, months between the end of the pre-enrollment period and sample entry, indicator for any NH use in the 90 days prior to sample entry, and state indicators. For each regression, the entire matched sample was used for the first 2 intervals (since all sample members had at least 12 months of followup, with NH use data available through 2009), and the estimation sample in the later intervals was restricted to those whose period of sample entry would allow us to observe their NH use in those intervals. The predicted means are the cumulative risk of being in a NH for at least 90 days in each group, in each interval. The regressions incorporate propensity score matching weights for the matched comparison group. In some cases, the estimated effect is not exactly equal to the difference in means due to rounding. We do not present results for the 7th interval (months 37-42) after enrollment due to the small sample sizes in both the treatment and matched comparison groups, which make the estimates unreliable for that interval. | ||||||
REFERENCES
Beauchamp, Jody, Valerie Cheh, Robert Schmitz, Peter Kemper, and John Hall. "The Effect of the Program of All-Inclusive Care for the Elderly (PACE) on Quality." Report submitted to the Centers for Medicare and Medicaid Services. Princeton, NJ: Mathematica Policy Research, February 12, 2008.
Chatterji, Pinka, Nancy R. Burstein, David Kidder, and Alan White. "Evaluation of the Program of All-Inclusive Care for the Elder (PACE) Demonstration: The Impact of PACE on Participant Outcomes."Report submitted to the Health Care Financing Administration. Cambridge, MA: Abt Associates, Inc., July 1998.
Foster, Leslie, Robert Schmitz, and Peter Kemper. "The Effects of PACE on Medicare and Medicaid Expenditures." Report submitted to the Centers for Medicare and Medicaid Services. Princeton, NJ: Mathematica Policy Research, August 29, 2007.
Ghosh, Arkadipta, Cara Orfield, and Robert Schmitz. "Evaluating PACE: A Review of the Literature." Report Submitted to the Department of Health and Human Services, Office of the Assistant Secretary for Planning and Evaluation. Washington, DC: Mathematica Policy Research, January 2014. Available at: http://aspe.hhs.gov/daltcp/reports/2014/PACELitRev.shtml.
Hirth, V., J. Baskins, and M. Dever-Bumba. "Program of All-Inclusive Care (PACE): Past, Present, and Future." Journal of American Medical Directors Association, 2009, vol. 10, pp. 155-160.
Kane, Robert L., Patricia Homyak, Boris Bershadsky, and Shannon Flood."Variations on a Theme Called PACE." Journal of Gerontology, 2006a, vol. 61A, no. 7, pp. 689-693.
Meret-Hanke, Louise. "Effects of the Program of All-Inclusive Care for the Elderly on Hospital Use." The Gerontologist, 2011, vol. 51, no. 6, pp. 774-785.
Mathematica Policy Research. "Analysis for MACPAC."2012, Unpublished.
Medicare Payment Advisory Commission (MedPAC). "Care Coordination Program for Dual-Eligible Beneficiaries." Chapter 3. Report to the Congress: Medicare and the Health Care Delivery System. Washington, DC: MedPAC. June 2012. Available at: http://www.medpac.gov/documents/Jun12_EntireReport.pdf. Accessed April 30, 2012.
Mancuso, David, Greg Yamashiro, and Barbara Felver. "PACE: An Evaluation." Washington State Department of Social and Health Services Research and Data Analysis Division. Report Number 8.26, June 29, 2005.
Nadash, Pamela. "Two Models of Managed Long-Term Care: Comparing PACE with a Medicaid-Only Plan." The Gerontologist, 2004, vol. 44, no. 5, pp. 644-654.
National PACE Association. "PACE in the States."Alexandria, VA: National PACE Association. 2012. Available at: http://www.npaonline.org/website/article.asp?id=12. [List of PACE Programs by State, http://www.npaonline.org/website/navdispatch.asp?id=1741.] Accessed April 30, 2012.
Wieland, Darryl, Rebecca Boland, Judith Baskins, and Bruce Kinosian."Five-Year Survival in a Program of All-Inclusive Care For Elderly Compared With Alternative Institutional and Home- and Community-Based Care." Journal of Gerontology, 2010, vol. 65, no. 7, pp. 721-726.
Wieland, Darryl, Bruce Kinosian, Eric Stallard, and Rebecca Boland."Does Medicaid Pay More to a Program of All-Inclusive Care for the Elderly (PACE) Than for Fee-for-Service Long-term Care?" Journal of Gerontology, 2012.
Wiener, J.M., and D.G. Stevenson. "State Policy on LTC for the Elderly." Health Affairs, 1998, vol. 17, no. 3, pp. 81-100.
APPENDIX A. DESCRIPTION OF CHANGES IN MEDICARE'S CAPITATION PAYMENT CALCULATIONS FOR PACE DURING 2004-2012
Table A.1 shows the formula used by CMS for calculating the Medicare capitation payment to PACE plans. The Medicaid capitation payment to PACE plans is negotiated between the provider and the state with some federal oversight. The Medicare HCC-adjusted payment to PACE plans since 2008 has been based on the CMS-HCC model and a plan-level frailty factor. The CMS-HCC model adjusts payments for enrollees' demographic characteristics and diagnoses. The plan-level frailty factor aims to account for Medicare expenditures for a community-based, functionally impaired population that are not explained by the CMS-HCC risk adjustment model. The plan-level frailty factor is calculated by CMS, based on PACE enrollees' responses to the Health Outcomes Survey-Modified, and as shown in Table A.1, it was a blend of the pre-2008 (uniform) frailty factor and the most recently calibrated plan-specific frailty factor plan until 2012, when it transitioned to being based solely on the most recently calibrated plan-level frailty factor.
| TABLE A.1. Changes in the Calculation of Medicare's Capitation Payment for Beneficiaries Enrolled in PACE: 2004-2012 | ||
|---|---|---|
| Year | Payment Formula | Frailty Adjuster/Factor |
| 2004 | (10% of HCC-adjusted payment + 90% of the Medicare+ Choice county rate) * uniform PACE frailty adjuster | 2.39 |
| 2005 | (30% of HCC-adjusted payment + 70% of the Medicare+ Choice county rate) * uniform PACE frailty adjuster | |
| 2006 | (50% of HCC-adjusted payment + 50% of the Medicare+ Choice county rate) * uniform PACE frailty adjuster | |
| 2007 | (75% of HCC-adjusted payment + 25% of the Medicare+ Choice county rate) * uniform PACE frailty adjuster | |
| 2008 | 100% HCC-adjusted payment * plan-level frailty factor | 90% of the pre-2008 frailty factor + 10% of the 2008 frailty factor |
| 2009 | 70% of the pre-2008 frailty factor + 30% of the 2009 frailty factor | |
| 2010 | 50% of the pre-2008 frailty factor + 50% of the 2009 frailty factor | |
| 2011 | 25% of the pre-2008 frailty factor + 75% of the 2011 frailty factor | |
| 2012 | 100% of the most recently calibrated frailty factor | |
| SOURCES: National PACE Association (http://www.npaonline.org/website/article.asp?id=808); Centers for Medicare and Medicaid Services (http://www.cms.gov/Medicare/HealthPlans/MedicareAdvtgSpecRateStats/down…). | ||
APPENDIX B. TESTING THE SIGNIFICANCE OF THE EFFECT OF PACE ON EXPENDITURES
We denote the mean Medicare expenditure over a six-month period for a sample of n PACE enrollees by Ē and the estimated sample variance of E over this same period by g2. We wish to compare this mean with the mean predicted value for the same PACE enrollees had they been in the matched comparison group (HCBS enrollee or NH entrant) instead. That mean predicted value is generated using coefficients from the regression of Medicare expenditure on beneficiary characteristics for a sample of beneficiaries in the matched comparison group. We denote the mean of the predicted values as  , which emphasizes that this mean is generated via regression coefficients. We can denote its sample variance as h2. But the formula for h2 is more complicated than that of g2 because there are two sources of error in : natural sampling variation and error in estimating the regression coefficients used to compute it. Given a formula for h2, then we can form the test statistic:23
| [1] |  |
| Skipping the derivation, we present the formula for h, which leads to the t-statistic above. | |
![h superscript 2 = EstVar(y caret/overbar) = s superscript 2 [x singlequote subscript 0 (X singlequote X)superscript -1 x subscript i0 = 1/n]](/sites/default/files/private/images-reports/effect-pace-costs-nursing-home-admissions-and-mortality-2006-2011/PACEeffect-formula2.jpg) |
|
where the  are the mean values of the covariates for the PACE sample. are the mean values of the covariates for the PACE sample. |
|
![h superscript 2 = s superscript 2 divided by n [1 divided by n summation over i x singlequote subscript i0 (X singlequote X)superscript -1 x subscript i0 = 1]](/sites/default/files/private/images-reports/effect-pace-costs-nursing-home-admissions-and-mortality-2006-2011/PACEeffect-formula4.jpg) |
|
| The first term in square brackets is an addition to the usual variance estimate. It tends to inflate the t-statistic in [1]. | |
NOTES
-
Medicare-only beneficiaries can enroll in PACE and pay the Medicaid capitation out of pocket. Also, Medicaid-only beneficiaries can be permitted by states to enroll in PACE, but the states would then have to pay a higher capitation rate for them (MedPAC 2012). With about 90 percent of all PACE enrollees being dually eligible (Mathematica Policy Research analysis for MACPAC 2012), the occurrence of Medicare-only or Medicaid-only beneficiaries enrolling in PACE is relatively rare. The analysis in this paper, therefore, is restricted to PACE enrollees who are dually eligible.
-
PACE plans have the flexibility to allocate the combined pool of Medicare and Medicaid capitation payments across all health care services.In contrast, for dual eligible Special Needs Plans (SNPs), Medicare and Medicaid capitation payments cover separate services as specified in the governing contract with Medicare and Medicaid respectively. So, the Medicare and Medicaid capitation payments form separate funding pools and cover separate services for SNPs, while for PACE the capitation payments go into a single pool to cover any health care service.
-
Without the benefit of primary data collection, we are unable to confirm if the groups are comparable with respect to their functional and cognitive status or degree of informal support. Had information on certain beneficiary characteristics been available, especially those that are likely to be key determinants of enrolling in PACE or HCBS waiver services as well as of NH entry (e.g., functional and cognitive status prior to enrollment), we could have used a richer set of variables for matching the treatment and comparison group members at baseline.
-
At least two other studies have examined the effect of PACE on expenditures, but neither study established baseline equivalence between the treatment group (PACE) and the comparison group (individuals who expressed interest in PACE and had a home visit but did not enroll). White (1998) found that PACE enrollees had lower Medicare expenditures; White, Abel, and Kider (2000) reported that PACE enrollees had lower Medicare expenditures, higher Medicaid expenditures, and higher total expenditures. Apart from methodological limitations, the findings from both these studies are somewhat outdated. In a more recent study looking at South Carolina only, Wieland et al. (2012) found Medicaid expenditures to be lower for PACE enrollees than their comparison group counterparts consisting of both waiver enrollees and NH entrants. However, this study suffers from significant limitations including lack of baseline equivalence, limited one-year followup of costs, and data from a single state.
-
The Medicare managed care program changed its name from Medicare+ Choice to Medicare Advantage in 2008.
-
The Medicare Payment Advisory Commission reports that Medicare capitation payments for PACE enrollees exceed FFS payments for comparable Medicare beneficiaries by 17 percent, on average (MedPAC 2012). While the Affordable Care Act revised the county benchmarks for the Medicare Advantage payment system, PACE providers are still paid on the pre-Affordable Care Act benchmarks, which are on average 17 percent higher than FFS in the counties where PACE providers operate. Although the inclusion of dementia in the risk adjustment model for PACE enrollees and the use of a frailty adjuster could improve the accuracy of these calculations, additional analyses by MedPAC revealed that the risk adjustment model together with the frailty adjustor leads to an over-prediction of costs for certain PACE enrollees by more than 17 percent and for some others by less than 17 percent. As such, 17 percent was a reasonable estimate by which aggregate Medicare spending on PACE enrollees could likely exceed spending on comparable FFS beneficiaries.
-
As explained in greater detail below, our outcome measures for use of nursing facility services are based on the Minimum Dataset (MDS) Timeline File, and could include some nursing facility stays that begin with the use of SNF services versus starting with a long-term NH stay itself. Note that PACE enrollees are in managed care, and therefore, do not have Medicare and Medicaid claims, that is, their use of nursing facility services is not observed in Medicare or Medicaid claims data.
-
We kept waiver enrollees and NH entrants in our study sample as long as they were enrolled in FFS Medicaid and Medicare. Those enrolled in a medical or comprehensive managed care plan, or in a long-term care managed care plan, or in PACE, were excluded from followup.
-
However, we also use a separate matched comparison group composed of HCBS waiver enrollees alone in order to examine all outcomes--expenditures, mortality, and especially NH utilization.
-
For NH entrants we required the duration of the first stay to be at least 21 days to reduce the possibility of including entrants to skilled nursing facilities (SNFs) as opposed to long-term NH entrants in the study sample. Since Medicare covers the first 20 days of a SNF stay without requiring any copayment, beneficiaries are likely to transition out of SNF around that 20-day mark, switching in some cases to a long-term NH stay. Although this strategy is not perfect, and beneficiaries could switch from SNF to long-term NH even after the first 20 days, our strategy of requiring the first stay to be at least 21 days tries to minimize the possibility of the NH entrant sample being primarily composed of beneficiaries who started out as SNF entrants.
-
The value of "M" or MDS on the daily flag in the Timeline file denotes NH residence on a particular day. This value is assigned based on records of detailed assessment in the Long-Term Care Minimum Data Set (LTC-MDS). The LTC-MDS contains comprehensive assessment information for all residents (regardless of payer) of long-term care facilities that are certified to participate in Medicare or Medicaid. In contrast, the Timeline file only provides information on whether a Medicare beneficiary was in a NH, or in other acute or post-acute care facilities (hospital, SNF, home health), or in the community on each day of a calendar year, based on records of service from the LTC-MDS, the Home Health Outcomes and Assessment Information Set, and from Medicare FFS claims. The Timeline file is a simplified version of the Residential History File (created by Vince Mor and others at Brown University).
-
We calculated the sample attrition rate for surviving PACE enrollees by using information on enrollees who were alive but had missing Medicare capitation payments for PACE. Attrition (other than deaths) from the comparison sample occurred when sample members enrolled in managed care plans (resulting in loss of claims data needed for the study). Based on these calculations, about 15 percent of PACE enrollees had disenrolled by the end of three years of followup, and about 9 percent of matched comparison group members had enrolled in managed care by three years after sample entry, and were therefore, lost to followup.
-
For instance, sample members entering by December 2007 will have a minimum of 48 months of followup, with mortality data available through 2011.
-
Note that despite the restriction noted earlier to PACE sites with at least 250 enrollees, a few of the states included here have fewer sample members than that. This situation arises due to sample exclusions for factors such as being in FFS Medicare in the year prior to PACE enrollment, being age 66 or older at entry, and being enrolled in Medicaid within a month of entering PACE.
-
Although neither of these variables was used in the propensity score matching model, we did run a sensitivity test using the second variable, where we excluded PACE and HCBS waiver enrollees with NH use in the prior 90 days, as well as PACE enrollees with prior HCBS use. The results from this sensitivity test are reported in Section III.B.1.
-
Medicare expenditures are expected to be high in the first six months for the NH entrants in the matched comparison group, since many of them would be entering a NH using the Medicare SNF benefit and possibly remain on that benefit for the first 20 days of their NH stay.
-
We do not present results for the 11th interval (months 61-66) after enrollment due to the small sample sizes in both the treatment and matched comparison groups, which make the mortality estimates unreliable for this interval.
-
We do not present results for the seventh interval (months 37-42) after enrollment due to the small sample sizes in both the treatment and matched comparison groups, which make the estimates unreliable for that interval.
-
Medicare capitation payments under PACE were significantly lower than predicted expenditures in the first six months after sample entry, when we used the matched comparison group comprised of both NH entrants and HCBS enrollees. This was due to the expected high Medicare expenditures in the first six months for the NH entrants in the matched comparison group many of whom would have entered a NH using the Medicare SNF benefit and possibly remained on that benefit for the first 20 days of their NH stay. These large and significant negative differences in Medicare expenditures during the first six months were no longer observed when we used the matched comparison group comprised of HCBS waiver enrollees alone.
-
The higher-than-predicted Medicare payments for PACE in New York could be a consequence of the state linking NH payment rates to the industry's success in maximizing Medicare payments for nursing facility use, which was once common in states such as New York and Massachusetts (Wiener and Stevenson 1998). Under this strategy, for instance, NH and home care providers in New York were required to increase Medicare revenues by one percent (in aggregate) over base expenditures in 1995 and 1996 or face cuts in Medicaid payment. If this practice continued during the time period used to set Medicare capitation payment rates for 2006-2011, but did not persist during the 2006-2011followup period, the capitation rates for PACE enrollees in New York would be relatively high compared to projected FFS spending.
-
Even with the matched comparison group of HCBS waiver enrollees alone, the results for New York differ from those for California and Massachusetts. Specifically, the Medicaid spending gap for New York ranges from significantly positive in the first year to significantly negative in later followup periods, while remaining positive and significant for both California and Massachusetts. Also, unlike the other two states, actual Medicare payments were significantly higher-than-predicted expenditures in New York in several intervals, using the HCBS-only comparison group.
-
As mentioned above, about 15 percent of PACE enrollees had disenrolled by the end of three years of followup, and about 9 percent of matched comparison group members had enrolled in managed care by three years after sample entry, and were therefore, lost to followup.
-
The denominator for the t-statistic is not symmetrical in n, because the variance of Ē is known, while the variance of
is yet to be determined.