
U.S. Department of Health and Human Services
Childless Elderly Beneficiaries Use and Costs of Medicare Services: Final Report
Douglas A. WolfSyracuse University, Center for Policy Research
James N. LaditkaUniversity of South Carolina, Arnold School of Public Health
June 2006
PDF Version: http://aspe.hhs.gov/daltcp/reports/2006/childless.pdf (33 PDF pages)
This report was prepared under contract #HHS-100-97-0010 between HHSs ASPE/DALTCP, and the Urban Institute and Syracuse University. For additional information about this subject, you can visit the DALTCP home page at http://aspe.hhs.gov/_/office_specific/daltcp.cfm or contact the ASPE Project Officers, William Marton and Hakan Aykan, at HHS/ASPE/DALTCP, Room 424E, H.H. Humphrey Building, 200 Independence Avenue, S.W., Washington, D.C. 20201. Their e-mail addresses are: William.Marton@hhs.gov and Hakan.Aykan@hhs.gov.
The opinions and views expressed in this report are those of the authors. They do not necessarily reflect the views of the Department of Health and Human Services, the contractor or any other funding organization.
TABLE OF CONTENTS
- ANALYSIS
- Overview
- Data Sources
- Analysis Samples
- Variables
- RESULTS
- Descriptive Statistics
- Multivariate Analyses
- APPENDICES
- APPENDIX A: CODING OF MEDICARE SERVICE CATEGORIES
- APPENDIX B: CODING OF INCOME VARIABLES
- LIST OF FIGURES
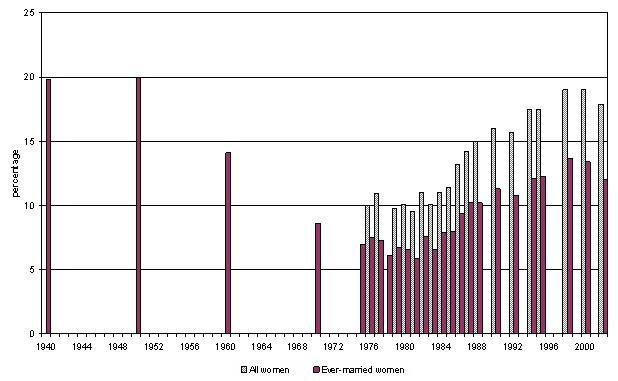
- FIGURE 1: Percentage of Women Age 40-44 Remaining Childless, by Year
- LIST OF TABLES
- TABLE 1: Summary Statistics, Dependent Variables, by Year
- TABLE 2: Descriptive Statistics, by Parent Status
- TABLE 3: Selected Results for Regressions for Total Medicare Expenditures, by Year
- TABLE 4: Indicators of Statistical Significance on Parent Variable, Basic Model
ABSTRACT
The issue of substitution between informal and formal care services, particularly personal-assistance care received by the frail elderly, concerns whether, and to what extent, the services provided through public programs will displace or crowd out the services that might otherwise be provided by family members, mainly spouses and children. Empirical studies that have addressed this issue have reached mixed conclusions. Nevertheless, there can be little doubt that childless elderly people have no opportunity to receive informal services from their children, and that--other things being equal--they are therefore likely to demand relatively higher levels of public long-term care services. In recent years, successive birth cohorts of women have exhibited progressively higher levels of childlessness, with possible implications for future claims on publicly-funded health and long-term care programs such as Medicare and Medicaid.
This study presents estimates of differential Medicare costs between older individuals with, and without, living children (or, parents and childless). Although home-based and institutional long-term care settings have received the most attention with respect to these differential usage patterns, we examine the full range of Medicare services. The possibility of substituting informal for formal services is slight, or nonexistent, for the majority of Medicare services, which tend to involve substantial inputs of professional medical personnel (e.g., surgery and outpatient services). Nevertheless, there are several reasons to suspect that Medicare service-use and cost patterns will differ between parents and the childless: children may facilitate their parents access to services; children can provide social support, which may have beneficial health consequences; and childbearing patterns may serve as a marker of differences in health status, which in turn may reflect both causal and correlational mechanisms.
Our analysis uses survey data from the National Long-Term Care Survey (NLTCS) linked to Medicare claims data. We considered annual cost and usage data for each of 17 separate categories of Medicare-reimbursed services, as well as total annual costs, as outcomes. Outcomes were coded using the claims files. Using the survey data we coded respondents as parents or childless according to the number of surviving children. We also coded a lengthy set of covariates including age, race, and other socioeconomic and demographic background factors, a measure of cognition, and indicators of several chronic conditions and acute events.
This report focuses on findings for the cost analyses that use the 1994 NLTCS as a baseline and 1995-1998 costs as outcomes. Additional findings, using other years, or usage rather than cost outcomes, were generally consistent with these basic findings. Only for 1995 did we find that total Medicare costs were lower for parents than for childless individuals. Regarding individual service categories, the majority of statistically significant results indicated that parents have lower Medicare costs than the childless; however, in only one service category--physician visits for providing long-term care services, either at home or in a nursing home--did we find a consistent pattern of significantly lower costs among parents each year.
INTRODUCTION
For many years researchers and policy analysts have addressed the issue of substitution between informal and formal care services, particularly personal-assistance and related long-term care services received by the frail elderly. The question, put simply, is whether and to what extent the services provided through public programs will displace or crowd out the services that might otherwise be provided by family members, mainly spouses and children. Empirical studies that have addressed this issue have reached mixed conclusions; some fail to find evidence of such substitution (Penning 2002), while others do (Greene 1983; Miner 1995; Van Houtven & Norton 2004; Charles & Sevak 2005).
However one views the available empirical evidence on substitution, there can be little doubt that childless elderly people have no opportunity to receive informal services from their children, and that--other things being equal--they are therefore likely to demand relatively higher levels of public long-term care services. In recent years, successive birth cohorts of women have exhibited progressively higher levels of childlessness, with possible implications for future claims on publicly-funded health and long-term care programs such as Medicare and Medicaid. Figure 1 illustrates this trend, using data taken from various years of the Current Population Survey data. The figures plotted depict the percentage of women age 40-44 in each year who have given birth to zero children; this is a very good proxy for late-life childlessness. The percent childless reached its lowest around 1980, after which it rose steadily until at least 2000. Women aged 40-44 in 1980 joined the 65-69 year group in 2005. Thus, in coming years we should see a steady increase in the percentage of older women (and men) who have no living children.
This study presents new estimates of differential service-use and cost patterns between two groups: older individuals with, and without, living children (henceforth, parents and childless). Although home-based and institutional long-term care settings have received the most attention with respect to these differential usage patterns (Aykan 2003; Charles & Sevak 2005; Freedman 1993; Miner 1995; White-Means & Rubin 2004; Wolf 1999), we examine the full range of Medicare services: clinical tests, durable medical equipment (DME) purchases, home health services, hospice care, inpatient and outpatient care, physician services and skilled nursing facilities (SNFs) services. The possibility of substituting informal for formal services is slight, or nonexistent, for the majority of Medicare services, which tend to involve substantial inputs of professional medical personnel (e.g., surgery and outpatient services). Nevertheless, there are several reasons to suspect that Medicare service-use and cost patterns will differ between parents and the childless, as detailed below.
BACKGROUND
Parenthood, Health, and Service-Use: Hypotheses and Evidence
A number of arguments can be made concerning possible associations between parent status and the use of Medicare services. These hypothetical arguments include causal pathways: having children, and for women having borne children, may influence health status after age 65, and may further influence the usage of health services given health status. The possible causal pathways can be further classified into those that posit a physiological, or biological, mechanism, and those that are more behavioral in nature. Also, health service providers and programs may treat elders with and without informal-support networks, including living children, differently. Some of the arguments imply correlational associations--for example, infertility and poor health at older ages may each the result of a pre-existing, possibly genetic, physiological condition--and may in general be thought of as various types of selectivity. The various arguments and hypotheses--whether causal or correlational in nature--can be placed in at least three analytically distinct categories: differences in costs and use might arise due to substitution of informal for formal services; there may be differences in access to services; and there may be differences in needs, reflecting underlying health conditions.
Substitution
The ability of formal and informal services to substitute for each other provides the traditional rationale for studying the association between family patterns and service-use. As mentioned earlier, the issue has arisen primarily with respect to home-based or institutional long-term care services. As noted by Bishop and Skwara (1993:100), Medicare home health services are to be provided without regard to the availability of family caregivers Although Medicare home health benefits are intended to be limited to medically-necessary services, for which informal caregivers--typically, people with no medical training--are poor substitutes, many of the tasks done by paid providers can be and are performed by family members. Therefore a post-acute SNF episode might end sooner, if the patient can be discharged to a home-care setting in which informal-supports are present. Formal home-care services may more quickly be judged to be no longer needed if informal helpers are available. Furthermore, the patient, or members of their family, may reject such services.
There is little past research that provides evidence on any of these substitution mechanisms. Several studies have demonstrated that older people with living children have slower rates of entry into nursing homes, and more rapid rates of live discharge from nursing homes, than childless elders, other things being equal (e.g., Garber and MaCurdy 1990; Freedman, 1993). These studies have not, however, examined the relationship between payment source and childlessness, so we cannot state that Medicare SNF costs differ between parents and the childless. Logan and Spitze (1994) found that community-resident elders who were actively being helped by children made less use of senior centers, Meals on Wheels, and other community-based services, but their analysis did not account for the obvious endogeneity of help from children. Nor did they consider the payment source of the community-based services studied. With respect to home-care, Picone and Wilson (1999) analyzed National Long-Term Care Survey (NLTCS) data for 1984, 1989 and 1994, linked to Medicare home health claims data, and found no consistent pattern of association between the number of living children and home-care usage and costs.
Access
Children can provide transportation to medical services, can urge their parents to seek medical attention, and can advocate on their behalf with service providers and other gatekeepers, and through these types of activities could actually increase their parents service-use and costs relative to that of the childless. In contrast, childless older individuals may be more isolated socially (Gironda, Lubben & Aichison 1999), which can serve as a barrier to service-use. Indeed, one study found that older persons living alone--the chances of which are elevated among the childless, compared to older people with living children--were at greater risk of being found in their homes incapacitated or dead; those found alive tended to require extensive hospitalization and a majority was unable to return to independent living (Gurley et al. 1996). These findings have mixed implications: to the extent that socially isolated elders (among which the childless are likely to be disproportionately represented) are more likely to die undetected--for example, after falling or suffering stroke or severe fracture--their Medicare costs will likely be lower than those of parents in otherwise similar circumstances. On the other hand, those who need extensive hospital care upon being found might have been found sooner, and might have required less care and enjoyed a greater chance of returning to self-sufficiency if they had children (or others) involved in monitoring their care.
Another mechanism through which having children may influence access is the growing number of caregiver-support programs, many of which are sponsored by local or state agencies, many with federal funding. To the extent that these caregiver-support programs increase the level of knowledge and awareness about formal support services for which care recipients might be eligible, and enhance the caregivers advocacy skills, they may lead to greater use of formal services, other things being equal. In this case, older people with living children might use more, rather than fewer, formal services including home health and DME.
Needs
The substitution and access arguments rest on other things being equal assumptions, in particular equal health status. However, for several reasons health status, and therefore service needs, may differ between parents and the childless. There are several reasons why differences in health status might exist, some of which suggest that childless Medicare beneficiaries might be more healthy than parents, and others of which suggest the opposite. Moreover, some of the hypothesized mechanisms treat health differences as a by-product of a conscious decision to remain childless, while others suggest a correlation between childlessness and health that depends on random factors, or other early-life factors unrelated to conscious fertility choices.
One set of arguments considers the role of resources and of resource allocation in the family or household context. In particular, holding lifetime income constant, more children implies fewer financial resources per capita, which might limit or dampen health care spending, on average, per family member. To the extent that parents reduce their own consumption of health services during the part of their life cycle when their children are young, the parents may experience poorer health later in life. A similar argument can be made concerning time use: parents allocate some of their time to caring for their children and to investing in their childrens human capital (one element of which is health), and the time so used reduces time available to the parents to invest in their own health. These resource arguments apply to both men and women (i.e., to fathers and to mothers), although their effects may not be the same for both sexes.
The wear and tear hypothesis is an example of a physiological mechanism whereby childbearing causes diminished health in later life. Disposable soma theory holds that organisms must allocate energy between two competing uses, self-maintenance and reproduction (see Kirkwood & Holliday 1986; Kirkwood & Rose 1991). The greater the energy allocated to reproduction, the lower the organisms ability to withstand insults, raising the risk of succumbing to morbidity and death. By implication women who have had more children should have worse health in old age, and shorter lives. A subtler version of the hypothesis might suggest that only beyond some threshold level--say three or four or even more children--does a womans reproductive behavior exact a detectable toll on her energy reserves, resulting in poorer late-life health or a shortened lifespan.
Several studies have investigated the relationship between childbearing and longevity. One study based on historical data (Lycett et al. 2000) found no main-effect relationship between childbearing and longevity, but did find an interaction effect involving reproduction and poverty; another historical study, however, found that women who had given birth to four or more children had higher mortality rates after age 50 (Dribe 2004). Both Doblhammer (2000) and Grundy and Tomassini (2005) investigated the relationship between reproductive history and mortality using the British ONS Longitudinal Study (Doblhammer also used comparable data for Austria). They found that women with no children, and women with three or more children, had higher mortality rates than women with one or two children. Friedlanders (1996) study used a sample of residents of Southern California; she found that mothers had significantly poorer survivorship than childless women, for those born 1880-1904 but not for those born 1905-1929. No such relationships were found for men. A recent comprehensive review and meta-analysis (Hurt, Ronsmans & Thomas 2006) noted that in several studies, null-parity and high-parity women exhibit higher mortality than women with two births. Yet, when the studies results were combined in a meta-analysis, no significant differences by parity were found.
Childbearing, as well as breastfeeding, may produce hormonal or other physiological changes in women that are harmful in later life. For instance, childless women, but not men, have been found to exhibit reduced incidence of Alzheimers disease (Ptok, Barkow, and Heun 2002). Another study, based on women only, found a reduced rate of cognitive decline among childless women (McLay, Maki, and Lyketsos 2003). Also, in a study of general health status, Kington, Lillard, and Rogowski (1997) found that high-parity women were disadvantaged relative to those with fewer children.
Both the wear and tear hypothesis and any possible protective effects of parenthood are clearly specific to women. Other possible causal pathways linking parenthood to later life health and service-use can, however, pertain to men as well as to women. Stress, for example, has been found to produce a number of adverse health consequences, and any stressors associated with parenting--including the caregiver stress that accompanies having a child with elevated and lifelong care needs--can accrue to fathers as well as to mothers. There may be lifestyle differences between parents and the childless that produce differential health outcomes, as well. Kravdal (1995), for instance, demonstrates similar patterns of association between parity and the instance of oral and pharyngeal cancer for men and women, and suggests that the association arises through parity-specific patterns of alcohol and tobacco use.
Several studies have found that people with greater social support resources, of which family members in general and children in particular are an important part, enjoy better health. Some of the reasons for this difference relate to differences in access to services, as discussed above. However social support may produce psychological and mental health benefits as well, which in turn promote physiological health (Berkman & Glass 2000; Bowling 1991; Eriksen 1994; Greenwood, Muir, Packham, & Madeley 1996; Knox & Uvnas-Moberg 1998). The social support hypothesis predicts that parents will be in better health, and use fewer and less costly services, than the childless.
Examples of diseases the risks of which are related to reproductive history are breast cancer (Wohlfahrt et al. 1999), and other cancers including ovarian, brain, lymphatic, and colon cancer among others (Cantor, Lynch, and Johnson 1993; Kravdal and Hansen 1993; Vachon et al. 2002). Many studies of cancer risks show that women who have borne children have lower cancer risks than those who have not. Studies have also shown that nulliparous women have elevated risks of bone loss and fracture (Melton et al. 2001), as well as of sudden coronary death (Talbott et al. 1989). To our knowledge these studies have not attempted to distinguish voluntary from unwanted or unintended childlessness.
Finally, there are a number of diseases or conditions, some of which exhibit a genetic predisposition, which contribute to both infertility and reduced late-life health status. One such condition is polycystic ovary syndrome, which contributes to infertility as well as insulin resistance, heart disease, arteriosclerosis and some cancers (e.g., Gibson 1995; Ehrmann 2005). Certain endocrine disorders also contribute to anovulation, as well as diabetes and elevated risk of endometrial cancers. Obesity is also related to both reproductive problems, and other acute and chronic conditions that are manifested in later life. The existence of common factor contributions to infertility and other adverse health conditions suggests the importance of controlling for diseases such as diabetes, as well as for factors such as obesity, in our attempts to determine the relationship between childlessness and Medicare use and costs.
Together, the preceding arguments and evidence suggest that older persons with and without children, or a history of child rearing, may differ with respect to their needs for, and their usage of, health services. Furthermore, there are several reasons to suspect that the effects of childlessness will differ between men and women, inasmuch as several of the biological mechanisms involved are uniquely applicable to women. However, for men and women alike some of the hypotheses predict that childless elders will use more services, while others predict that they will use fewer services, than will parents. Consequently, we are unable to postulate a net direction of effects for either men or women; in this situation, two-tailed tests of the null hypotheses are appropriate.
Finally, it seems that policy interest in the question of differential service-use and costs, as well as any possible justification for policy interventions, rest on the demonstration of a causal relationship between consciously chosen childlessness and later Medicare service-use. However, we will be unable to distinguish between chosen and accidental or involuntary childlessness, and to isolate the causal from the correlational differences in Medicare service-use due to childlessness, whether or not by choice.
ANALYSIS
Overview
The basic form of our analysis is that of a follow-up study. We highlight findings from an analysis in which the 1994 wave of the NLTCS serves as the baseline, and Medicare claims data for the calendar years 1995-1998 serves as the follow-up. We conducted a similar analysis using the 1999 wave of NLTCS data as baseline, but with a single follow-up year, 2000. In both cases we constructed measures of Medicare service-use and costs, by category of service as well as for all services combined, expressing all these measures in per-time-period terms for comparability purposes. Each of these dependent variables (use and cost, by service category) is specific to a calendar year. Thus the basic unit of analysis is the person-year of usage or cost. We used regression analysis to estimate the mean difference in Medicare outcome variables between parents and childless beneficiaries, while holding constant an extensive set of covariates.
Data Sources
Our analysis uses variables from several files, linked by common identification codes. These files are the 1994 NLTCS survey response file, the analytic file produced by researchers at Duke University, which contains ex-post adjusted sampling weights that reflect patterns of nonresponse, a vital statistics file produced by the Centers for Medicare and Medicaid Services (CMS) which contains dates of birth and death (from Medicare records), and a number of Medicare claims files also provided by CMS. The latter two files contain restricted-access data, and our access to the data is governed by a Data Use Agreement arranged by the funding agency (the Office of the Assistant Secretary for Planning and Evaluation) between the principal investigator and CMS.
National Long-Term Care Survey (NLTCS)
The NLTCS employs a mixed panel and longitudinal design. The first interview was conducted among a sample of Medicare enrollees age 65 and older in 1982, with follow-up interviews conducted in 1984, 1989, 1994 and 1999. In each follow-up wave, the sample of survivors from previous interviews was augmented by sampling from those newly aged-in to the 65-plus population. Data collection instruments include a brief screening interview, intended to identify those in the long-term care population (i.e., experiencing limitations with one or more activities of daily living or instrumental activities of daily living (IADLs), and having that limitation for a period lasting or expected to last three or more months). Those screening in receive a detailed follow-up interview. Beginning in 1984 institutionalized as well as community-resident respondents received detailed follow-up interviews, although the questions included differed by residence type. Particularly important for our analysis is the fact that in 1994 a small random subset of those who would otherwise have screened out was retained for the detailed follow-up interview. This group is referred to as the healthy screen-in group. This group is important because only those receiving the detailed interviews were asked about living children, as well as about other key covariates and background factors such as income, self-rated health, and other health conditions and diagnoses.
Medicare Claims File
We obtained from CMS a file of Medicare claims records for NLTCS respondents covering years 1983-2000. These files are organized by calendar year as well as by broad service type (clinical laboratory fees; DME; doctors services; inpatient and outpatient hospital services; home health; SNFs; and hospice). These files were processed into 17 distinct analytic service categories (see Appendix A), which were in turn aggregated into a total-expenditure variable.
One problem for our analysis is the fact that many Medicare beneficiaries are enrolled in health maintenance organizations (HMOs) (i.e., are receiving services for which providers receive capitated payments). The percentage of Medicare beneficiaries enrolled in such plans rose, during the years included in our study, from 8.8% in 1995 (Ways and Means 1997: 164) to 17.1% in 1998 (HCFA 2000: 266). Claims for services attributable to those beneficiaries cannot be identified. This poses a problem for us only insofar as there is selection, according to childlessness/parenthood status, into HMOs. Respondents who spent only part of a calendar year as an HMO member are used in the analysis, with their part-year observation adjusted for exposure length to represent a person-year observation. We conducted a series of supplementary analyses of selection into both part-year and full-year HMO status, to see whether HMO enrollment is correlated with parental status. Finding no evidence of this type of selectivity, we have simply discarded all the full-year HMO enrollees from the analysis (for those years in which they were full-year enrollees only).
Analysis Samples
As noted before, we use the 1994 NLTCS respondent file to produce a baseline sample. We limit our analyses to respondents with positive final detail cross-section weights as determined by analysts at Duke University. We use annualized outcome variables for 1995, 1996, 1997, and 1998. That is, if a respondent died during one of these years we annualized their part-year Medicare expenditures, in order to remove the effects of mortality from the analysis. For example, in view of the fact that end-of-life medical expenses are relatively high (Levinsky et al. 2001; Hoover et al. 2002), if childless people tended to die at younger ages than parents then a failure to annualize the cost data would lead to understatement of cost differences between parents and childless people, holding age constant. Our analysis is in effect a cohort study, tracking a sample of persons originally 65 and older as they age, year by year. The usable sample shrinks from year to year due to death among sample members.
The NLTCS employs different survey instruments for respondents living in institutions and those living in the community. However, with our follow-up design, these cross-sectional distinctions are lost, inasmuch as some of the institutionalized respondents return home, while some community-dwellers become institutionalized either temporarily or permanently. Moreover, respondents in each group are at risk of incurring usage and costs for virtually every category of services used in our analysis. Therefore, we pooled the two groups of respondents, dropping the distinction between institutionalized and noninstitutionalized respondents at time of interview. This decision also dictates that we limit our covariate set to variables for which consistent measures can be found in both groups. Among the potential covariates ruled out due to the differences in survey instruments between institutionalized and community-dwelling respondents are difficulties in IADLs and measures of social participation.
Variables
Dependent Variables
We studied two aspects of Medicare services: their usage and their costs, although in this report we present results for costs only: the cost data provide a common metric with which to measure the usage of different services, which occur in very different physical units (such as ambulance rides, surgical procedures or doctor visits) as well as a convenient basis for aggregating to a total measure. The Medicare claims records contain fields indicating the dollar amount of each identified claim. We have aggregated claims paid for services rendered in a calendar year, by service category, into variables indicating the yearly total for each service category.
Independent Variables
Parent status. The central independent variables for our analysis are those indicating the presence or absence of living children. These variables are based on data elements found in the roster section of the NLTCS Control Card. For each household member, nonresident child, or identified caregiver, the Control Card records that individuals relationship to the respondent, their residence status (in the respondents household or elsewhere), sex, age, marital status, highest grade of school attendance (and whether it was completed), and usual weekly hours of work. From these fields we derived variables indicating whether the respondent has any living children, the number of living children, and the number of living daughters and sons. Here we report on two sets of analyses, one using a simple dummy variable distinguishing parents from the childless (parent), and the other using variables indicating the number of children regardless of gender (one child, two children, and three or more children).
Covariates. Selected sociodemographic characteristics are included in our multivariate analyses. These include age (in years), dummy variables indicating sex (female), marital status (married), and race/ethnicity (minority, coded 1 for blacks and Hispanics), and a cognition measure. For the latter we grouped Mini Mental State Examination (MMSE) scores into categories, producing four distinct severity levels (not impaired; mildly impaired; moderately impaired; and severely impaired), along with an additional variable indicating those with missing MMSE score. We measured income by first fitting a curve to the categorical responses provided by respondents, then computing the average within each income category; this requires fewer degrees of freedom and handles the open-ended high-income category (for details see Appendix B). Education is represented by a dummy variable indicating the completion of 12 or more years of school. We also controlled for the spouses age and education, an indicator that self-rated health is fair, and indicators that the respondent is bedbound or uses a wheelchair. A few of the variables listed above--specifically, education and income--are frequently missing. Our analysis dummies out the missing observations (i.e., cases with missing (say) income have income coded zero), and an additional indicator variable for missing income coded one.
Additionally, we have controlled for a number of comorbidities including chronic conditions and acute events. These include binary indicators of the presence of Alzheimer Disease and other dementias, arthritis, asthma, cancer, circulation problems in the extremities, diabetes, emphysema, epilepsy, glaucoma, hypertension, acute myocardial infarction, other heart problems, paralysis, Parkinsons Disease, stroke, bronchitis, hip fracture, other fractures, influenza, and pneumonia. In the community interviews respondents were asked if they now had several of the chronic conditions in this list (rheumatism or arthritis, paralysis or other permanent numbness or stiffness, epilepsy, Parkinsons Disease, diabetes, cancer, arteriosclerosis, Alzheimers Disease or senility). For other conditions (heart attack, other heart problems, hypertension, stroke, circulation trouble in arms or legs, pneumonia, bronchitis, flu, emphysemas, asthma, hip fracture, or other fractures), respondents were asked if they had had the (condition) in the last 12 months. Other conditions about which the NLTCS inquired occurred with lower frequency, and were not usable for our analyses (e.g., multiple sclerosis or cerebral palsy).
There are two problems with the condition reports of the NLTCS that could affect our analysis. First, the NLTCS does not ask about these conditions for individuals surveyed when they reside in institutions. Second, several of these conditions are subject to respondent error, often at high rates. The variable indicating the presence of Alzheimer Disease, for example, is subject to error associated with cognitive impairment, for respondents who provide their own interview responses. Older individuals often do not know if they have hypertension. A diagnosis such as arteriosclerosis is subject to error associated with the technicality of the diagnosis and terminology. Pneumonia, bronchitis, and flu over the 12 months prior to interview are subject to recall error.
To help overcome these weaknesses of the survey design, we examined, for each NLTCS respondent in our analysis sample, all ICD-9-CM diagnosis codes associated with physician services (office visits, nursing home or home visits, and all services billed by physicians including al major and minor services, tests, and procedures). For chronic conditions from which most individuals do not recover, such as dementias, diabetes or heart disease, we examined all diagnosis codes for three years prior to the month of interview. For acute conditions that may indicate general health and current disease susceptibility, such as bronchitis, flu, or acute myocardial infarction, we examined all diagnoses for the 12 months prior to interview. ICD-9-CM codes were selected to match as closely as possible the disease categories about which the NLTCS asked respondents. Diagnosis codes indicating a history of a disease (e.g., cancer) were not included in the analysis, as the time of occurrence in these instances cannot be known; only codes indicating current diagnoses during the time period relevant to the given condition were included. A condition was assigned for an individual when it was identified during the interview by that individual or a proxy, or when it appeared among the diagnoses examined.
RESULTS
Descriptive Statistics
Table 1 presents unweighted means and standard deviations (SDs), by calendar year, for the 17 service categories as well as for total costs. Hospitalization is the most costly category, with annual average costs of around $6000--despite the fact that in all but one year the mean number of hospitalizations is less than one (in 1998 the mean is 1.01). Home health is also a relatively expensive service category, along with outpatient procedures and skilled nursing home stays. Medicare costs are quite skewed, as suggested by the fact that the SDs are considerably greater than the means (in combination with the fact that all variables have only nonnegative values). The coefficient of variation for total costs is around 3, but for individual service categories it is as high as 13.5. Table 2 presents unweighted means and SDs for the explanatory variables used in the regressions, separately for parents and for the childless, as well as for the overall sample.
Multivariate Analyses
Although we estimated regression equations for all 17 service categories in both cost and service-use units, we present only the key findings--coefficients on the parent variables--from the total cost regressions. We point out the most salient of the findings uncovered in the disaggregated outcome variables. For each service category (and for total costs), and for each calendar year, we have estimated a basic model, in which the simple parent variable appears, and an extended model in which separate effects of having one, two, or three or more children are estimated. In the following discussion, characterization of an estimate as statistically different from zero is reserved for instances of p-values of 0.05 or less, based on a two-tailed test.
As shown in Table 3, only for 1995 were total Medicare costs significantly lower for parents than for the childless. 1995 was also the year for which we found the greatest number of category-specific significant differences (summarized in Table 4): in that year, hospital visits, physician long-term care visits (whether to private houses or nursing homes), referrals to specialists, use of ambulances, hospitalization, and SNF usage were all significantly lower among parents than among the childless. Moreover, two of these categories (hospitalization and SNF stays) are among the highest-cost service categories.
The many regressions estimated (for 17 service categories in four follow-up years) provide numerous opportunities for the data to reveal significant differences in the average Medicare cost and usage patterns of parents compared to the childless. Overall, we found very few such differences, but the majority of significant differences that we did find indicated that costs are lower among parents than among the childless. Only one service category--physicians long-term care visits, either to community-dwelling or institutionalized patients--is reasonably consistent over the years we studied, producing a statistically significant difference throughout the 1995-1998 period.
We found very few instances of significantly higher costs among parents relative to the childless. Other physician services averaged about $50 higher among parents than among the childless in 1996. DME costs were significantly higher for parents in one year, but the difference (about $0.50) is trivial in magnitude.
In the extended model results, summarized in Table 3, we find significant effects of being a parent only for 1995 (as was true for the basic model). The three variables representing different family sizes--one child, two children, and three or more children--all produce statistically significant coefficients, but the coefficients are do not suggest a dosage-response effect. Rather, the largest negative effect on Medicare costs is associated with having exactly two living children. Moreover, the three regression coefficients are not significantly different from one another. Thus, we find no evidence to suggest that there are differences in Medicare costs associated with family size.
Additional Analyses
As noted earlier, we conducted a parallel analysis using the 1999 NLTCS as a baseline along with follow-up data from 2000. We found no differences in overall Medicare costs between parents and childless, but a number of significant differences for selected components of total costs, largely consistent with the 1995-1998 analysis. In the interests of space, the 1999 baseline results are not reported here.
Another set of analyses considered cost differences according to the gender composition of living children. For these regressions we pooled the 1995-1998 cost figures to produce a single summary measure of Medicare costs. The purpose of these regressions was to decompose the one child/two children/three or more children effects, found in our extended models, by gender. In particular, we distinguished persons with one son; one daughter; one son and one daughter (one each), one sons, one daughters, three or more children, at least two of which are daughters, and all other configurations of three or more children. Among the parent coefficients estimated, all but one had negative signs, indicating lower Medicare costs. However, for only the one son variable and the three children, other (i.e., three or more children, only one of which is a daughter) were the regression coefficients statistically significant. The finding for parents of a single son is somewhat unexpected, in view of the widespread evidence that daughters are more heavily involved in parent care than are sons.
Finally, for all cost analyses performed, we also conducted a parallel service-use analysis, except that it was not possible to create an overall use outcome variable because of the different units in which different services are measured. In general, the pattern of findings from the use analysis is consistent with that found in the cost analysis. Due to the impossibility of making comparisons between, or aggregating across, service categories, we have not included those results in this report.
DISCUSSION
We have found several instances of significantly different costs for Medicare services between parents and the childless, and in the great majority of these cases, costs are lower for parents, after adjusting for age, education, income, comorbidities, and other factors. However, across the 17 service categories examined, only one--physicians long-term care visits, either to community-dwelling or institutionalized patients--is reasonably consistent over the years we studied. For our overall costs regressions, however, we found a statistically significant difference between parents and childless only in 1995. The magnitudes of the parent coefficients, which vary substantially from year to year, as well as the very large standard errors associated with these coefficients, indicate that firm conclusions about these differences cannot be drawn from these findings.
It can be argued that the results from 1995 should be given more weight than those from later years, because the successively longer lags between the measurement of covariates and outcomes diminishes the explanatory power of the model. This may be true, but it cannot be verified using the data available to us.
Although we have paid primary attention to the total-cost results, it is worth noting that in some instances, differences across service categories may be offsetting. For example, we have found limited evidence of increased costs for hospice services among parents, compared to the childless. The decision to die in a hospice setting is surely not taken lightly, and may be encouraged or facilitated in situations in which close family members are available. Increased hospice costs should lead to decreases in other service categories, some of which can be quite expensive (e.g., hospitalization and SNF stays).
One of the questions addressed in this study is the effects of having no children on Medicare service utilization and costs compared to the effects of having one, versus two, or three or more, children. We do find several instances of significant differences between the cost or use patterns of parents with different numbers of children. However, we find no uniform pattern either across service categories or over time. In just a few instances, adjusted differences are statistically significant for parents overall, and for parents in each of the three family size categories.
There are a number of analytic problems that must be borne in mind when interpreting the findings of this study. For example, the NLTCS control card obtains information on living children, not children ever born. Moreover, it does not distinguish among own, adopted, and stepchildren. Thus some respondents categorized as childless were, in fact, parents at some point prior to the NLTCS interviews. Moreover, many NLTCS respondents are incapacitated or cognitively unequipped to answer survey questions, and therefore their data are provided by proxy respondents. We have controlled for the use of a proxy, but there may be differential measurement error in key variables (such as the number and characteristics of living children) between proxy and self-responding observations. Also, despite our use of an extensive set of covariates, we may have incompletely controlled for relevant acute conditions and physiological variables; we do not have a true health history, but merely an enumeration of current diagnoses and conditions. The most important limitation of the study, of course, is the fact that it is based on observational data. There could be a correlation between the variables indicating parent status and the error term in the cost regressions. We believe that our extensive controls for health conditions removes much of the potentially biasing effects of such a correlation. At any rate, there are no variables available in the NLTCS that could serve as a plausible instrument for fertility outcomes determined decades before the baseline interview.
A leading rationale for investigating differences in service-use and costs between parents and childless is the combination of a growing prevalence of childlessness and growing numbers and shares of older people in the population (Aykan 2003): any such differences would have potentially important implications for projections of the fiscal status of the Medicare trust fund. More generally, differences in usage and costs of publicly-funded services represent an example of an externality associated with a private action, in this case the decision to produce children. We have failed to find a systematic, and therefore a convincing, pattern of such differences with respect to Medicare-funded services. Nevertheless, substantial differences by parental status may exist for other programs, particularly Medicaid, which has become the major payer of nursing home costs which, in turn, are more likely to be incurred by childless elders than those with children available to serve as caregivers.
APPENDIX A: CODING OF MEDICARE SERVICE CATEGORIES
We used Medicare files to obtain information about both the frequency of claims and their costs. Each individuals costs were summed, by payment amounts for most categories, and by line item payments for physician services. Physician services were further categorized using Berenson-Eggers type of service (BETOS) codes, which identify groups of procedures based on generally agreed upon clinically meaningful groupings of procedures and services. This field is included as a line item on noninstitutional Medicare claims. However, given the many BETOS codes, it was necessary to further group these codes into a number of larger categories that would be both manageable for the analysis and likely to involve a sufficiently large number of annual cases for meaningful statistical analysis of the groups under study. Influenza immunization was retained as a separate category, as it provides adequate volume for analysis, and represents a preventive service that is relevant to the study question. The physician service categories are:
| Category | Category Includes | |
| 1. | Physician Office Visits | Office visits for new or established patients |
| 2. | Physician Hospital Visits | Hospital visits for initial, subsequent, critical or emergency care |
| 3. | Physician Long-Term Care Visits | Any physician home visit or nursing home visit |
| 4. | Specialists and Consultations | Specialist services in pathology, psychiatry, ophthalmology, or other specialties, as well as all services billed as consultations |
| 5. | Major Surgical Procedures | Major surgical procedures involving the breast; colectomy; cholecystectomy; trans-urethral resection and prostatectomy; hysterectomy; exploration/decompression/ excision of disc; the following cardiovascular procedures: CABG, cardiovascular-aneurysm repair, thromboendarterectomy, coronary angioplasty (PTCA), pacemaker insertion, and other major cardiovascular procedures; the following orthopedic procedures: hip fracture repair, hip replacement, knee replacement, and other major orthopedic procedures; and the following ophthalmic procedures: corneal transplant, cataract removal and lens insertion; retinal detachment repair, and other treatments of the eye. |
| 6. | Ambulatory Procedures, Oncology Procedures excluding major procedures, Endoscopy, and Dialysis | Ambulatory procedures included procedures involving skin, musculoskeletal system; inguinal hernia repair, lithotripsy, and other ambulatory procedures; oncology--radiation therapies and other therapies; the following endoscopic procedures: arthroscopy, upper gastrointestinal endoscopy, sigmoidoscopy, colonoscopy, cystoscopy, bronchoscopy, laparoscopic cholecystectomy, laryngoscopy, and other endoscpies; dialysis services. |
| 7. | Imaging | Standard imaging involving the chest, musculoskeletal system, breast, contrast gastronintestinal, nuclear medicine, and other standard imaging; advanced imaging including CAT scans of the head or other body parts; MRI of the brain or other body parts; echography of the eye, abdomen or pelvis, heart, carotid arteries, prostate or transrectal area, and other echography; and imaging involving procedures: of the heart, including heart cateterization, and other imaging involving procedures. |
| 8. | Tests | Lab test, including: automated general profiles, urinalysis, blood counts, glucose, bacterial cultures, and other lab tests; electrocardiograms; cardiovascular stress tests; EKG monitoring; and other tests. |
| 9. | Durable Medical Equipment (DME) and Supplies | Medical and surgical supplies; hospital bed purchases; oxygen and other supplies; wheelchair purchases; and other DME purchases; orthotic devices |
| 10. | Ambulance | Ambulance services |
| 11. | Influenza Immunization | Influenza immunization |
| 12. | All other physician services | Anesthesia, chemotherapy, chiropracty, and services designated as other, locally defined, or undefined |
In addition to these physician-related categories, our analysis uses the following additional cost categories: (1) inpatient hospitalization; (2) outpatient procedures; (3) SNFs; (4) home health services; and (5) hospice care. Thus there are a total of 17 specific medical service categories considered in our analysis.
APPENDIX B: CODING OF INCOME VARIABLES
In the 1994 NLTCS respondents (or their proxies) were asked to report total income, in a variety of ways. Institutional residents were asked about monthly income, combining the income of the respondent and his or her spouse, if any. Community respondents were asked for the annual income of the respondent plus spouse, if any. The response categories for 1994 community respondents were 0-$3000, $3000-4000, $4000-5000, $5000-6000, $6000-7000, $7000-8000, $8000-9000, $9000-10000, $10000-12000, $12000-15000, $15000-20000, $20000-25000, $25000-30000, $30000-40000, $40000-50000, $50000-60000, $60000-75000, and $75000+. For institutionalized respondents the categories were 0-$300, $300-599, , $1500-1999, $2000-2499, $2500-2999, $3000-3499, $3500-3999, $4000-4999, $5000-5999, and $6000+.
Using the income data in its original form presents several problems, including the fact that the response categories are different for community and for institutional respondents. The possibility of representing each response category by its midpoint is rendered difficult by the existence of open-ended intervals. In order to produce a quasi-continuous income variable, and hence use a single degree of freedom rather than many degrees of freedom in our regressions, we fit lognormal curves to the income data, after first re-expressing the institutional response category endpoints in annual terms.
If Y has a lognormal distribution with parameters  and
and  , then the transformed variable z = [ln(Y) - ]/ has a standard normal distribution (Johnson, Kotz, & Balakrishnan 1994). Thus, if some income response category has endpoints A and B, then the likelihood that a respondents reported income will fall into that category is Li =
  (zB) - (zA), where ( . ) represents the standard normal cumulative distribution function, and zA and zB are the transformed endpoints of the income category reported by i. Then, the likelihood over all respondents is
  I = 1,
, n ln(Li), which can be maximized to produce estimates of and .
I = 1,
, n ln(Li), which can be maximized to produce estimates of and .
Our parameter estimates are = 2.629 and = 1.071, which imply a population mean income of $21,396. Using the estimated parameters, we then calculated the implied means of income for every response category including the open-ended response categories, and assigned the appropriate within-category means to all respondents with nonmissing income data.
REFERENCES
Aykan, H. (2003). Effect of childlessness on nursing home and home care use. Journal of Aging and Social Policy 15: 33-53.
Berkman, L. & T. Glass (2000). Social integration, social networks, social support, and health. In L.F. Berkman and I. Kawachi (eds.), Social Epidemiology. New York, NY: Oxford University Press, 137-173.
Bishop, C. & K. Skwara (1993). Recent growth of Medicare home health. Health Affairs 12(3): 95-110.
Bowling, A. (1991). Social support and social networks: their relationship to the successful and unsuccessful survival of elderly people in the community. An analysis of concepts and a review of the evidence. Family Practice 8: 68-83.
Cantor, K.P., C.F. Lynch, & D. Johnson (1993). Reproductive factors and risk of brain, colon, and other malignancies in Iowa. Cancer Causes and Control 4: 505-511.
Charles, K.K & P. Sevak (2005). Can family caregiving substitute for nursing home care? Journal of Health Economics 24: 1174-1190.
Doblhammer, G. (2000). Reproductive history and mortality later in life: A comparative study of England and Wales and Austria. Population Studies 54: 169-176.
Dribe, M. (2004). Long-term effects of childbearing on mortality: Evidence from pre-industrial Sweden. Population Studies 58: 297-310.
Ehrmann, D.A. (2005). Polycystic ovary syndrome. New England Journal of Medicine 352: 1223-1236.
Ericksen, W. (1994). The role of social support in the pathogenesis of coronary heart disease. A literature review. Family Practice 11: 201-209.
Freedman, V.A. (1993). Kin and nursing home lengths of stay: A backward recurrence time approach. Journal of Health and Social Behavior 34: 138-152.
Friedlander, N.J. (1996). The relation of lifetime reproduction to survivorship in women and men: A prospective study. American Journal of Human Biology 8: 771-783.
Garber, A.M. & T. MaCurdy (1990). Predicting nursing home utilization among the high-risk elderly. In D.A. Wise (ed.), Issues in the Economics of Aging. Chicago, IL: University of Chicago Press, 173-204.
Gibson, M. (1995). Reproductive health and polycystic ovary syndrome. American Journal of Medicine 98(1A): 67S-75S.
Gironda, M., J.E. Lubben, & K.A. Aichison (1999). Social networks of elders without children. Journal of Gerontological Social Work 31: 63-84.
Greene, V.L. (1983). Substitution between formally and informally provided care for the impaired elderly in the community. Medical Care 21: 609-619.
Greenwood, D.C., K.R. Muir, C.J. Packham, & R.J. Madeley (1996). Coronary heart disease: a review of the role of psychosocial stress and social support. Journal of Public Health Medicine 18: 221-231.
Grundy, E. & C. Tomassini (2005). Fertility history and health in later life: A record linkage study. Social Science and Medicine 61: 217-28.
Gurley, R.J., N. Lum, M. Sande, B. Lo, & M.H. Katz (1996). Persons found in their homes helpless or dead. New England Journal of Medicine 334: 1710-1716.
Health Care Financing Administration, U.S. Department of Health and Human Services (2000). Health Care Financing Review: Statistical Supplement. Washington, DC: U.S. Government Printing Office.
Hoover, D.R., S. Crystal, R. Kumar, U. Sambamoorthi & J.C. Cantor (2002). Medical expenditures during the last year of life: Findings from the Medicare Current Beneficiary Survey. Health Services Research 37: 1625-42.
Hurt, L.S., C. Ronsmans, & S.L. Thomas (2006). The effect of number of births on womens mortality: Systematic review of the evidence for women who have completed their childbearing. Population Studies 60: 55-71.
Johnson, N.L., S. Kotz, & N. Balakrishnan (1994). Continuous Univariate Distributions, Vol. 1 (second edition). New York, NY: Wiley Interscience.
Kington, R., L. Lillard & J. Rogowski (1997). Reproductive history, socioeconomic status, and self-reported health status of women aged 50 years or older. American Journal of Public Health 87:33-37.
Kirkwood, T.B.L. & R. Holliday (1986). Ageing as a consequence of natural selection. Pp. 1-16 in A.H. Bittles and K.J. Collins (eds.), The biology of human ageing. Cambridge University Press.
Kirkwood, T.B.L, & M.R. Rose (1991), Evolution of senescence: late survival sacrificed for reproduction. Philosophical Transactions of the Royal Society of London, Series B 332:15-24.
Knox, S.S., & K. Uvnas-Moberg (1998). Social isolation and cardiovascular disease: an arthrosclerotic pathway? Psychoneuroendocrinology 23: 877-890.
Kravdal, Ø (1995). Is the relationship between childbearing and cancer incidence due to biology or lifestyle? Examples of the importance of using data on men. International Journal of Epidemiology 24: 477-484.
Kravdal, Ø. & S. Hansen (1993). Hodgkins disease: The protective effects of childbearing. International Journal of Cancer 55: 909-914.
Levinsky, N.G., W. Yu, A. Ash, M. Moskowitz, G. Gazelle, O. Saynina, & E.J. Emanuel (2001). Influence of age on medicare expenditures and medical care in the last year of life. Journal of the American Medical Association 286: 1349-55.
Logan, J.R., & G. Spitze (1994), Informal support and the use of formal services by older Americans. Journal of Gerontology: Social Sciences 49: S25-S34.
Lycett, J.E., R.I. Dunbar, & E. Voland (2000). Longevity and the costs of reproduction in a historical human population. Proceedings of the Royal Society of London, Series B 267: 31-35.
McLay, R.N., P.M. Maki, & C.G. Lyketsos (2003). Nulliparity and late menopause are associated with decreased cognitive decline. Journal of Neuropsychiatry and Clinical Neuroscience 15: 161-167.
Melton, L.J. 3rd, D.C. Hesdorffer, G.D. Malkasian, E.J. Atkinson, L.A. Brinton, & W.M. OFallon (2001). Long-term fracture risk among infertile women: A population-based cohort study. Journal of Womens Health and Gender-Based Medicine 10: 289-97.
Miner, S. (1995). Racial differences in family support and formal service utilization among older persons: A nonrecursive model. Journal of Gerontology: Social Sciences 50B: S143-53.
Penning, M. (2002). Hydra revisited: Substituting formal for self- and informal in-home care among older adults with disabilities. The Gerontologist 42: 4-16.
Picone, G., & R.M. Wilson (1999). Medicare home health agency utilization, 1984-1994. Inquiry (Fall 1999): 291-303.
Ptok, U., K. Barkow, & R. Heun (2002). Fertility and number of children in patients with Alzheimers disease. Archives of Womens Mental Health 5: 83-86.
Talbott, E.O., L.H. Kuller, K. Detre, K. Matthews, S. Norman, S.F. Kelsey & S. Belle (1989). Reproductive history of women dying of sudden cardiac death: A case-control study. International Journal of Epidemiology 18: 589-94.
Vachon, C.M., P.J. Mink, C.A. Janney, T.A. Sellers, J.R.Cerhan, & L. Hartmann (2002). Association of parity and ovarian cancer risk by family history of breast or ovarian cancer in a population-based study of postmenopausal women. Epidemiology 13: 66-71.
Van Houtven, C.H. & E.C. Norton (2004). Informal care and health care use of older adults. Journal of Health Economics 23: 1159-80.
Ways and Means Committee, U.S. House of Representatives (1997). Medicare and Health Care Chartbook, online at http://www.access.gpo.gov/congress/house/ways-and-means/ (accessed June 2, 2006).
White-Means, S.I., & R.M. Rubin (2004). Trade-offs between formal home health care and informal family caregiving. Journal of Family and Economic Issues 25: 335-358.
Wolf, D.A. (1999). The family as provider of long-term care: Efficiency, equity, and externalities. Journal of Aging and Health 11: 360-382.
| FIGURE 1: Percentage of Women Age 40-44 Remaining Childless, by Year |
 |
| TABLE 1: Summary Statistics, Dependent Variables, by Year | ||||||||
| Costs ($) | 1995 | 1996 | 1997 | 1998 | ||||
| Mean | SD | Mean | SD | Mean | SD | Mean | SD | |
| All Medicare Payments | 11770.08 | 35384.41 | 10821.20 | 32142.60 | 11316.62 | 29294.09 | 11601.66 | 31811.91 |
| Office Visits | 149.97 | 216.53 | 147.04 | 221.49 | 155.03 | 233.50 | 165.50 | 240.29 |
| Hospital Visits | 479.63 | 1979.22 | 377.17 | 1526.71 | 407.74 | 1581.96 | 462.44 | 1733.30 |
| Home Visits | 96.54 | 324.80 | 89.46 | 284.95 | 92.86 | 256.81 | 92.91 | 280.70 |
| Specialists | 198.30 | 656.47 | 177.26 | 560.77 | 170.06 | 463.81 | 190.75 | 609.79 |
| Major Surgery | 307.71 | 1405.07 | 284.21 | 1528.06 | 258.71 | 930.55 | 244.71 | 873.89 |
| Ambulatory Procedures | 159.62 | 614.75 | 162.17 | 605.19 | 260.14 | 959.15 | 149.65 | 554.48 |
| Imaging | 185.68 | 460.36 | 159.02 | 356.09 | 161.74 | 660.51 | 174.90 | 354.21 |
| Lab Tests | 179.89 | 326.56 | 158.35 | 322.26 | 167.61 | 687.90 | 128.98 | 240.35 |
| DME | 0.79 | 10.71 | 0.72 | 8.42 | 0.76 | 8.53 | 0.58 | 7.15 |
| Ambulance | 194.87 | 1414.74 | 206.09 | 1373.00 | 210.49 | 1474.49 | 232.76 | 1541.63 |
| Flu Shots | 2.59 | 4.18 | 2.72 | 4.42 | 2.58 | 4.17 | 2.63 | 4.23 |
| Other Physician Services | 98.10 | 534.32 | 93.86 | 465.70 | 97.79 | 494.56 | 98.73 | 515.30 |
| Inpatient Hospitalization | 6276.88 | 28596.66 | 5425.95 | 25384.81 | 5706.15 | 22599.75 | 6202.13 | 24435.91 |
| Outpatient Procedures | 694.10 | 2515.33 | 717.35 | 2437.02 | 779.00 | 2536.49 | 765.36 | 2874.41 |
| SNF | 929.90 | 4813.49 | 992.30 | 4778.97 | 1087.64 | 5236.26 | 1210.61 | 6190.18 |
| Home Health | 1533.99 | 5773.34 | 1497.86 | 5763.70 | 1495.84 | 56.72.90 | 970.27 | 4148.62 |
| Hospice | 227.35 | 23.70.15 | 278.53 | 3000.61 | 329.16 | 3230.84 | 464.82 | 5672.39 |
| TABLE 2: Descriptive Statistics, by Parent Status (unweighted) | ||||||
| Variable | Childless | Parent | All | |||
| Mean | SD | Mean | SD | Mean | SD | |
| Agea | 81.665 | (8.71) | 79.341 | (8.15) | 79.858 | (8.33) |
| Female | 0.722 | (0.45) | 0.684 | (0.47) | 0.693 | (0.46) |
| Married | 0.226 | (0.42) | 0.407 | (0.49) | 0.367 | (0.48) |
| Minority | 0.123 | (0.33) | 0.093 | (0.29) | 0.099 | (0.30) |
| Cognition Score=Not Impaired | 0.637 | (0.48) | 0.748 | (0.43) | 0.726 | (0.45) |
| Cognition Score=Mildly Impaired | 0.144 | (0.35) | 0.127 | (0.33) | 0.130 | (0.34) |
| Cognition Score=Moderately Impaired | 0.095 | (0.29) | 0.066 | (0.25) | 0.072 | (0.26) |
| Cognition Score=Severely Impaired | 0.125 | (0.33) | 0.059 | (0.24) | 0.072 | (0.26) |
| Cognitive Score Missing | 0.347 | (0.48) | 0.261 | (0.44) | 0.280 | (0.45) |
| Income ($1000s)a | 28.615 | (37.74) | 23.363 | (33.81) | 24.789 | (34.99) |
| Income Category Missing | 0.660 | (0.47) | 0.739 | (0.44) | 0.721 | (0.45) |
| Spouses Agea | 75.651 | (8.31) | 74.683 | (7.97) | 74.805 | (8.02) |
| Spouses Age Missing | 0.796 | (0.40) | 0.596 | (0.49) | 0.641 | (0.48) |
| Education=Grade 12+ | 0.505 | (0.50) | 0.489 | (0.50) | 0.492 | (0.50) |
| Education Missing | 0.185 | (0.39) | 0.073 | (0.26) | 0.098 | (0.30) |
| Spouses Education=Grade 12+ | 0.121 | (0.33) | 0.218 | (0.41) | 0.196 | (0.40) |
| Spouses Education Missing | 0.760 | (0.43) | 0.555 | (0.50) | 0.600 | (0.49) |
| Fair Self-Rated Health | 0.290 | (0.45) | 0.309 | (0.46) | 0.305 | (0.46) |
| Conditions, Health Events, or Diagnoses: | ||||||
| Alzheimers/Senilityb | 0.296 | (0.46) | 0.218 | (0.41) | 0.236 | (0.42) |
| Arthritisb | 0.632 | (0.48) | 0.709 | (0.45) | 0.692 | (0.46) |
| Asthmab | 0.081 | (0.27) | 0.099 | (0.30) | 0.095 | (0.29) |
| Circulatory Trouble, Arms/Legsb | 0.517 | (0.50) | 0.513 | (0.50) | 0.514 | (0.50) |
| Diabetesb | 0.258 | (0.44) | 0.283 | (0.45) | 0.277 | (0.45) |
| Emphysemab | 0.081 | (0.27) | 0.094 | (0.29) | 0.091 | (0.29) |
| Epilepsyb | 0.027 | (0.16) | 0.020 | (0.14) | 0.022 | (0.15) |
| Glaucomab | 0.186 | (0.39) | 0.176 | (0.38) | 0.178 | (0.38) |
| Hypertensionb | 0.643 | (0.48) | 0.695 | (0.46) | 0.683 | (0.47) |
| Acute MIc | 0.057 | (0.23) | 0.058 | (0.23) | 0.057 | (0.23) |
| Other Heart Conditionb | 0.148 | (0.36) | 0.215 | (0.41) | 0.200 | (0.40) |
| Paralysisc | 0.112 | (0.32) | 0.102 | (0.30) | 0.104 | (0.31) |
| Parkinsons Diseasec | 0.062 | (0.24) | 0.049 | (0.22) | 0.052 | (0.22) |
| Strokec | 0.104 | (0.31) | 0.130 | (0.34) | 0.124 | (0.33) |
| Bronchitisc | 0.171 | (0.38) | 0.257 | (0.44) | 0.238 | (0.43) |
| Fracture, Other than Hipc | 0.143 | (0.35) | 0.128 | (0.33) | 0.131 | (0.34) |
| Hip Fracturec | 0.074 | (0.26) | 0.049 | (0.22) | 0.055 | (0.23) |
| Influenzac | 0.094 | (0.29) | 0.120 | (0.33) | 0.114 | (0.32) |
| Pneumoniac | 0.145 | (0.35) | 0.139 | (0.35) | 0.140 | (0.35) |
| Cancerc | 0.276 | (0.45) | 0.292 | (0.46) | 0.288 | (0.45) |
| Bedbound | 0.009 | (0.09) | 0.006 | (0.08) | 0.006 | (0.08) |
| Wheelchair-bound | 0.200 | (0.40) | 0.108 | (0.31) | 0.129 | (0.34) |
| Sample Size | 1406 | 4954 | 6360 | |||
|
||||||
| TABLE 3: Selected Results for Regressions for Total Medicare Expenditures, by Year | ||||||||
| 1995 | 1996 | 1997 | 1998 | |||||
| Estimate | SE | Estimate | SE | Estimate | SE | Estimate | SE | |
| Basic Model | ||||||||
| Intercept | 3666.58 | (3706.17) | 2616.19 | (3423.21) | 6830.48 | (4266.31) | -4464.91 | (4805.33) |
| Parent | -3002.00 | (1098.88)** | -328.06 | (1181.40) | 345.77 | (1244.36) | -683.48 | (1477.44) |
| Extended Model | ||||||||
| Intercept | 3624.91 | (3691.47) | 2389.51 | (3481.62) | 6989.26 | (4438.93) | -4275.32 | (4785.42) |
| 1 Child | -2818.87 | (1208.55)* | -1493.12 | (1193.95) | 2926.43 | (3372.64) | -1480.96 | (1766.65) |
| 2 Children | -3299.09 | (1212.97)** | -486.50 | (1158.88) | -896.30 | (1125.86) | 967.78 | (1704.89) |
| 3 or More | -2909.82 | (1152.78)* | 253.81 | (1460.77) | -20.04 | (1529.84) | -1307.97 | (1576.55) |
| *p < 0.05; **p < 0.01 | ||||||||
| TABLE 4: Indicators of Statistical Significance on Parent Variable, Basic Model | ||||
| 1995 | 1996 | 1997 | 1998 | |
| All Medicare Payments | - | |||
| Office Visits | ||||
| Hospital Visits | - | |||
| LTC Visits | - | - | - | -a |
| Specialists | - | |||
| Major Surgery | ||||
| Ambulatory Procedures | ||||
| Imaging | ||||
| Lab Tests | ||||
| DME | + | +a | ||
| Ambulance | - | -a | ||
| Influenza Immunization | ||||
| Other Services | + | |||
| Hospitalization | - | |||
| Outpatient Procedures | ||||
| SNF | - | |||
| Home Health | ||||
| Hospice | + | + | ||
NOTE: Unless otherwise noted cell entries are signs on regression coefficients with significance level p < 0.05.
|
||||
To obtain a printed copy of this report, send the full report title and your mailing information to:
U.S. Department of Health and Human ServicesOffice of Disability, Aging and Long-Term Care PolicyRoom 424E, H.H. Humphrey Building200 Independence Avenue, S.W.Washington, D.C. 20201FAX: 202-401-7733Email: webmaster.DALTCP@hhs.gov
RETURN TO:
Office of Disability, Aging and Long-Term Care Policy (DALTCP) Home [http://aspe.hhs.gov/_/office_specific/daltcp.cfm]Assistant Secretary for Planning and Evaluation (ASPE) Home [http://aspe.hhs.gov]U.S. Department of Health and Human Services Home [http://www.hhs.gov]