
September 2020
Printer Friendly Version in PDF Format (32 PDF pages)
ABSTRACT
Per Section 223(d)(7)(A) of the Protecting Access to Medicare Act (PAMA) of 2014 (Public Law 113-93), the HHS Secretary must submit to Congress an annual report on the use of funds provided under all demonstration programs conducted under this subsection, not later than one year after the date on which the first state is selected for a demonstration program under this subsection, and annually thereafter. Each report shall include assessments of: (1) access to community-based mental health services; (2) the quality and scope of services provided by Certified Community Behavioral Health Clinics (CCBHCs); and (3) the impact of the demonstration programs on the federal and state costs of a full range of mental health services.
This 2019 report highlights participating states' CCBHC activities that have been associated with improving access to a comprehensive range of treatment and recovery support services. The range of services includes delivery of mental health, addiction, and either screening for general medical conditions or onsite access to primary care during the first year of the demonstration. It draws on qualitative findings gathered from interviews at the state level and data from surveys of CCBHCs. The report also details how states have been reporting and utilizing the required quality measures for quality improvement. Finally the report assesses the costs to CCBHCs for providing the required services, and compares the demonstration payment rates to actual costs.
Subsequent annual reports to Congress on this demonstration will include more details, benefitting from data pending on quality measures and cost reports now being collected by CCBHCs and by demonstration states as required. In addition, claims analyses will be conducted to answer the questions about the demonstration posed by Congress.
Excerpts of this report were derived from reports delivered under contract #HHSP233201600017I between HHS's ASPE/BHDAP and Mathematica Policy Research to conduct the national evaluation of the demonstration. For additional information about this subject, you can visit the BHDAP home page at https://aspe.hhs.gov/bhdap or contact the ASPE Project Officer, Judith Dey, at HHS/ASPE/BHDAP, Room 424E, H.H. Humphrey Building, 200 Independence Avenue, S.W., Washington, D.C. 20201. Her e-mail address is: Judith.Dey@hhs.gov.
DISCLAIMER: The opinions and views expressed in this report are those of the authors. They do not reflect the views of the Department of Health and Human Services, the contractor or any other funding organization. This report was completed and submitted on January 2020.
TABLE OF CONTENTS
DEMONSTRATION STATES AND PROSPECTIVE PAYMENT SYSTEMS MODEL SELECTED
- Access to Community-Based Mental Health Services
- The Quality and Scope of Services Provided by CCBHCs
- Impact of the CCBHC Program on Federal and State Costs
APPENDIX A: ADDITIONAL TABLES
LIST OF FIGURES
- FIGURE 1: Proportion of CCBHCs that Employed Specific Types of Staff Before Certification and in March 2018 and March 2019
- FIGURE 2: Proportion of CCBHCs that Provided Services Outside of Physical Clinic Space in the Past 12 Months
- Figure 3: Proportion of CCBHCs that Added Each Type of Service as a Result of Certification
- FIGURE 4: Proportion of CCBHCs that Provided Each Type of Service Either Directly or Through a DCO
- FIGURE 5: Proportion of CCBHCs that Provided Selected EBPs, Psychiatric Rehabilitation Services, and Other Services, Either Directly or Through a DCO
- FIGURE 6: DY1 Rates as Percent Above or Below DY1 Costs Per Visit-Day or Per Visit-Month for Clinics by State
LIST OF TABLES
- TABLE 1: Number of CCBHCs, Demonstration Start Date, and PPS
- TABLE A.1: CCBHC Staffing
- TABLE A.2: Services Added as a Result of CCBHC Certification, 2018
- TABLE A.3: Telehealth and Remote Services
- TABLE A.4: CCBHCs and DCOs Provided Required Services
ACRONYMS
The following acronyms are mentioned in this report and/or appendix.
| BH | Behavioral Health |
|---|---|
| CCBHC | Certified Community Behavioral Health Clinic |
| CMS | HHS Centers for Medicare & Medicaid Services |
| DCO | Designated Collaborating Organizations |
| DY | Demonstration Year |
| DY1 | First Demonstration Year |
| DY2 | Second Demonstration Year |
| EBP | Evidence-Based Practice |
| ED | Emergency Department |
| EHR | Electronic Health Record |
| HHS | U.S. Department of Health and Human Services |
| HIT | Health Information Technology |
| LCSW | Licensed Clinical Social Worker |
| MAT | Medication-Assisted Treatment |
| MH | Mental Health |
| PAMA | Protecting Access to Medicare Act |
| PHQ | Patient Health Questionnaire |
| PPS | Prospective Payment Systems |
| PPS-1 | PPS First Model/Methodology |
| PPS-2 | PPS Second Model/Methodology |
| QBP | Quality Bonus Payment |
| SAMHSA | HHS Substance Abuse and Mental Health Services Administration |
| SED | Serious Emotional Disturbance |
| SMI | Serious Mental Illness |
| SUD | Substance Use Disorder |
| TCM | Targeted Case Management |
| VA | U.S. Department of Veterans Affairs |
INTRODUCTION
Section 223 of the Protecting Access to Medicare Act (PAMA), enacted April 1, 2014 (Public Law 113-93), authorized the Certified Community Behavioral Health Clinic (CCBHC) demonstration to allow states to test new strategies for delivering and reimbursing ambulatory behavioral health (BH) services. The demonstration aims to improve the availability, quality, and outcomes of ambulatory behavioral health services by establishing a standard definition and criteria for CCBHCs and developing new prospective payment systems (PPS) that account for the total cost of providing comprehensive services to all individuals who seek care. The demonstration also aims to provide coordinated care that addresses both behavioral and physical health conditions. CCBHCs and demonstration states must also report a common set of quality measures and report their costs as a condition of participating in the demonstration.
Section 223(d)(7) requires annual reports on the use of funds under the demonstration.[1] To date, this requirement will result in five annual reports to Congress, which are to include the following topics:
(i) an assessment of access to community-based mental health services under the Medicaid program in the area or areas of a State targeted by a demonstration program compared to other areas of the State; (ii) an assessment of the quality and scope of services provided by certified community behavioral health clinics compared to community-based mental health services provided in States not participating in a demonstration program under this subsection and in areas of a demonstration State that are not participating in the demonstration program; and (iii) an assessment of the impact of the demonstration programs on the Federal and State costs of a full range of mental health services (including inpatient, emergency and ambulatory services).
This is the third of the five annual reports to Congress. The first two reports discussed the launch of the demonstration and early implementation findings.[2] The next report will discuss further findings on quality measures and costs of the demonstration. Section 223 also requires the Secretary, not later than December 31, 2021, to recommend whether the demonstration programs should be continued, expanded, modified, or terminated. The final report will also detail the impacts of the demonstration on federal and state costs based on a claims and encounter data analysis. Claims and encounter data, as well as quality measure data that were collected, are only beginning to become available. After each demonstration year, states have a full year to report quality measures and nine months to report cost data. Claims and encounter data, which are essential for the impact analysis, need to be adjudicated, cleaned, and made available to researchers prior to analysis. These data will allow us to measure changes in the utilization of both behavioral health care and physical health care, and are necessary to understand the extent to which the service delivery changes CCBHCs instituted resulted in changes in the cost of providing services, including emergency room department and inpatient hospital utilization. This analysis is expected to be completed in time for the 2021 report to Congress.
DEMONSTRATION STATES AND PROSPECTIVE PAYMENT SYSTEMS MODEL SELECTED
In December 2016, the U.S. Department of Health and Human Services (HHS) selected eight states to participate in the demonstration from among the 24 states that received planning grants. Consistent with PAMA requirements, HHS selected Minnesota, Missouri, Nevada, New Jersey, New York, Oklahoma, Oregon, and Pennsylvania based on the completeness of the scope of services that their CCBHCs would offer; the CCBHCs' ability to improve the availability of, access to, and engagement with a range of services (including assisted outpatient treatment); and their potential to expand mental health (MH) services without increasing federal spending. CCBHCs participating in the demonstration must provide coordinated care and make available a comprehensive range of nine types of services to all who seek help, including but not limited to those with serious mental illness (SMI), serious emotional disturbance (SED), and substance use disorder (SUD). To ensure the availability of the full scope of CCBHC services, service delivery could involve the participation of Designated Collaborating Organizations (DCOs), which are entities not under the direct supervision of a CCBHC but that are engaged in a formal, contractual relationship with a CCBHC to provide selected services. CCBHCs that engage DCOs maintain clinical and financial responsibility for services provided by a DCO to CCBHC consumers, and DCOs provide services under the same requirements as CCBHCs and are reimbursed for these services directly by the CCBHC.
In addition to providing the required scope of services, CCBHCs and participating states must be able to collect, track, and report on a wide range of encounter, outcome, cost, and quality data. States were able to choose between two PPS methodologies developed by the HHS Centers for Medicare & Medicaid Services (CMS). The first methodology (PPS-1) is similar to the PPS methodology used by Federally Qualified Health Centers--it is a cost-based reimbursement that pays a fixed daily rate for all services rendered to a Medicaid beneficiary. The PPS-1 methodology also includes a state option to provide quality bonus payments (QBPs) to CCBHCs that meet defined quality metrics. The second methodology (PPS-2) is a cost-based reimbursement that pays a standard monthly rate per Medicaid beneficiary served, with separate monthly rates that vary with beneficiaries' clinical conditions. Under the PPS-2 methodology, states reimburse participating CCBHCs at a fixed monthly rate for all services provided to a Medicaid beneficiary. The PPS-2 also includes outlier payments for costs above and beyond a specific threshold (that is, payment adjustments for extremely costly Medicaid beneficiaries). The PPS-2 methodology also requires bonus payments for clinics that meet defined quality metrics. Both PPS methodologies aim to enhance Medicaid reimbursement to CCBHCs by ensuring that reimbursement rates more closely reflect the cost of providing an enhanced scope of services. As shown in Table 1, six of the eight demonstration states (representing a total of 56 CCBHCs) selected the PPS-1 methodology and two states (representing ten CCBHCs) selected the PPS-2 methodology. As of December 20, 2019 the demonstration is scheduled to end on May 22, 2020.[3]
| TABLE 1. Number of CCBHCs, Demonstration Start Date, and PPS | |||
|---|---|---|---|
| State | Number of CCBHCs | Demonstration Start Date | PPS |
| Minnesota | 6 | July 1, 2017 | PPS-1b |
| Missouri | 15 | July 1, 2017 | PPS-1b |
| Nevada | 3a | July 1, 2017 | PPS-1b |
| New Jersey | 7 | July 1, 2017 | PPS-2 |
| New York | 13 | July 1, 2017 | PPS-1b |
| Oklahoma | 3 | April 1, 2017 | PPS-2 |
| Oregon | 12 | April 1, 2017 | PPS-1 |
| Pennsylvania | 7 | July 1, 2017 | PPS-1b |
| SOURCE: Mathematica/RAND review of CCBHC demonstration applications and telephone consultations with state officials.
NOTES: The 2-year demonstration was set to end on June 30, 2019, but through a series of temporary extensions authorized by Congress, as of December 2019, the demonstration ends in all states on May 22, 2020.
|
|||
This third report assesses findings related to CCBHCs' ability to provide access to the required coordinated care and provision of a comprehensive range of nine types of services[4] to all who seek help, including but not limited to those with SMI, SED, and SUD. Services must be person and family-centered, trauma-informed, and recovery-oriented, and the integration of physical and behavioral health care must serve the "whole person."
This report also describes the experiences of states and CCBHCs reporting the required quality measures in the first demonstration year (DY1). Given that the adoption of electronic health records (EHRs) and other health information technology (HIT) has been slower among behavioral health providers than other sectors of the health care system (in part, because these providers have not historically received the same incentives as medical providers to adopt such technologies),[5] stakeholders also have an interest in understanding how CCBHCs made changes to their EHR/HIT systems to facilitate reporting of the required quality measures. Stakeholders in the demonstration are also interested in how CCBHCs and states used performance on those measures to improve care and make QBPs to CCBHCs.
Finally, this report also describes the estimated costs of providing this full scope of services during DY1. Given the novelty of reimbursing CCBHCs through a PPS, state and federal policymakers, and other behavioral health system stakeholders, have an interest in understanding the functioning of the PPS and the extent to which PPS rates covered the full costs of care. Historically, Medicaid has reimbursed community mental health services through negotiated fee-for-service or managed care rates, and there is some evidence that these rates did not cover the full cost of these services.[6] The CCBHC demonstration addresses this problem by allowing states to develop a PPS that reimburses CCBHCs for the expected cost of providing care to their patients based on projected costs.
Aligning the payment with the estimated cost of care was intended to provide CCBHCs with the financial resources necessary to provide high-quality comprehensive care. In addition, CCBHCs receive PPS payments based on anticipated daily or monthly per-patient cost rather than the cost of specific services provided during any particular patient visit. This allows clinics flexibility in the services they provide and the staffing models they use to meet the needs of individual patients without requiring specific billable services to ensure financial sustainability. Finally, the PPS financially incentivizes the delivery of high-quality care by rewarding performance on quality measures.
The findings in this report draw on data collected from: (1) interviews with state Medicaid and behavioral health officials, as well as consumer and family organizations; (2) progress reports submitted by all 66 CCBHCs; (3) cost reports submitted by all CCBHCs; and (4) site visits to select CCBHCs. Most CCBHCs and states did not submit quality measure performance data to HHS in time for this report. As a result, information in this report regarding quality measures focuses on CCBHCs' and states' experiences reporting the quality measures and the enhancements they made to data collection and reporting systems to facilitate reporting the measures (based on interviews with state officials), CCBHC progress reports, and site visits to CCBHCs.
Future evaluation activities will include an impact analysis examining changes in service utilization and costs. Medicaid claims and encounter data are being collected from states. Future reports will examine the impacts of CCBHC services on: (1) hospitalization rates; (2) emergency department service utilization; and (3) ambulatory care relative to within-state comparison groups (Medicaid beneficiaries with similar diagnostic and demographic characteristics who did not receive care from CCBHCs). Depending on the availability of data within each state, the impact analyses will most likely use approximately four years of Medicaid claims/encounter data (up to a two-year pre-demonstration period and a two-year post-implementation period). We will report these findings in our final report in December 2021. The December 2020 report will include updated findings that draw on both years of CCBHC cost reports and quality measures.
FINDINGS
The findings in this report are organized in three sections addressing the three topics required in statute. These include topics related to: access to community-based mental health services, the quality and scope of services provided by CCBHCs, and the impact of the demonstration on federal and state costs. The timing of submission of data that is essential to fully answering questions related to these topics in some cases limits the conclusions that we are able to make in this annual report. For example, claims and encounter data related to the demonstration may be submitted up to two years after a service has been rendered. Cost reports are required to be submitted nine months after the demonstration year ends, and quality reports are to be submitted one year after the demonstration year ends. Nonetheless, findings related to how well CCBHCs were able to provide the required access and scope of services are clearly relevant to understand the scope and quality of services as well as access to these services.
Access to Community-Based Mental Health Services
During the demonstration, states and CCBHCs have focused on increasing access to care, maintaining the staffing and scope of services requirements in the certification criteria, and ensuring coordinated care for CCBHC clients. Although some CCBHCs experienced early implementation challenges related to staffing or the implementation of new services, state officials reported that the CCBHCs addressed these challenges and appear to be adhering to the certification criteria in the second demonstration year (DY2).
This third report to Congress presents findings that are related to state and CCBHC efforts to increase access to care, as well as consumer stakeholder groups' impressions as to whether these efforts have been successful. Efforts undertaken by the CCBHCs and states, such as expanded scopes of services, the provision of services outside of clinics, and the hiring of additional staff are all important measures of CCBHC progress that are likely to be related to access, but do not directly measure whether increased access has occurred. Analyses that assess the impact of the demonstration on care utilization using Medicaid claims and encounter data will be available in the fifth report to Congress in December 2021.
Most CCBHCs hired additional staff as part of the CCBHC certification process. As shown in Figure 1, and Appendix Table A.1, most CCBHCs already employed licensed clinical social workers (LCSWs), SUD specialists, nurses, a medical director, bachelor's degree-level counselors, case managers, adult psychiatrists, and peer specialists/recovery coaches before they received certification. The CCBHCs most often hired case managers, peer specialists/recovery coaches, and family support workers, perhaps reflecting the criteria's focus on enhancing care coordination and person and family-centered care. In addition, CCBHCs often hired various types of nurses and child/adolescent psychiatrists to provide the full scope of required services. Although states had the latitude to determine the specific types of staff their CCBHCs must employ, as of March 2018 (DY1), nearly all CCBHCs employed the types of staff mentioned in the CCBHC certification criteria.
CCBHCs' ability to maintain the required types of staff throughout the demonstration varied by staff type. For example, as shown in Figure 1, information from CCBHC progress reports indicate that there was no substantial difference between DY1 and DY2 in the proportion of clinics that employed the following staff types: LCSWs, nurses, associate's degree-level or non-degree counselors, case management staff, peer specialists/recovery coaches, licensed psychologists, other clinician types, mental health professionals, family support staff, and community health workers. However, the proportion of clinics that employed psychiatrists declined from DY1 to DY2. Seventy-six percent of clinics employed child psychiatrists in DY1 versus 64 percent in DY2. Likewise, 91 percent of clinics employed adult psychiatrists in DY1 versus 82 percent in DY2. There was also a 13 point decline from DY1 to DY2 in the percentage of clinics that employed interpreters or linguistic counselors. Such changes in staffing may suggest clinics are making efforts to experiment and identify ways to use staff and resources more efficiently. CCBHCs and states reported that clinics faced several ongoing challenges associated with hiring and retaining staff, including, for example, uncertainty around the future of the demonstration, retaining enough of each staff type to meet increased demand for services, and increases in caseloads and responsibilities leading to staff burnout. However, officials generally perceived that clinics effectively used strategies such as offering increased salaries and benefits to overcome challenges.
| FIGURE 1. Proportion of CCBHCs that Employed Specific Types of Staff Before Certification and in March 2018 (DY1) and March 2019 (DY2) |
|---|
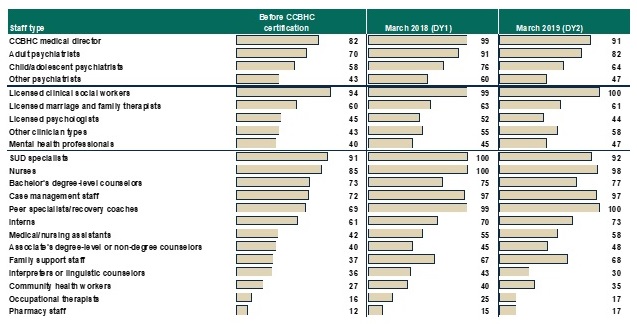 |
| SOURCE: CCBHC Annual Progress Report Demonstration Year 1 and Year 2 data collected by Mathematica and the RAND Corporation, March 2018 and March 2019. NOTES: Denominator is 67 CCBHCs for "Proportion of CCBHCs that employed staff type before certification" and March 2018 findings, and 66 CCBHCs for March 2019 findings. See Appendix Table A.1 for detailed findings and number of clinics corresponding to the percentages. Consistent with the CCBHC cost-reporting template, the mental health professional category includes only providers trained and credentialed for psychological testing. "Other clinician types" is a write-in category. |
In the second year of the demonstration, officials in all but one state cited uncertainty around the future of the demonstration as the most significant staffing challenge for clinics. During interviews, state officials reported that the uncertainty has adversely affected clinics' ability to retain staff and maintain workforce morale as the demonstration draws to a close, noting that clinics have been reluctant to add new positions or fill vacancies for fear of not being able to sustain those staff positions after the demonstration ends.
| FIGURE 2. Proportion of CCBHCs that Provided Services Outside of Physical Clinic Space in the Past 12 Months |
|---|
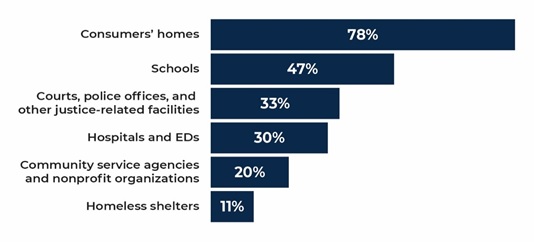 |
| SOURCE: CCBHC Annual Progress Report Demonstration Year 2 data collected by Mathematica and the RAND Corporation, March 2019. NOTES: The denominator is the number of CCBHCs that reported offering services outside of the CCBHC physical buildings in the past 12 months as of March 2019 (n = 64). See Appendix Table A.2 for 2018 findings. |
CCBHCs have worked throughout the demonstration to make services more convenient and tailored to the needs of specific populations. As reported in CCBHC-submitted progress reports, the most common strategy used by CCBHCs to increase access to care was to introduce open-access scheduling.[7] In addition, as shown in Figure 2, CCBHCs have provided coordinated care across multiple settings, including the provision of services outside of the clinic, such as consumers' homes and community service agencies like Social Security offices and community centers, in both demonstration years.[8] Clinics also have continued to make broad use of telehealth to extend the reach of CCBHC services. Clinics have used a variety of other strategies related to accessibility, such as conducting outreach to new and underserved populations, and remodeling the physical space of clinics to accommodate the delivery of new services (such as detoxification and physical health screening and monitoring). Interviews with stakeholder organizations representing consumers and their family members reported that they believe that the strategies CCBHCs have employed, such as open-access and expanded hours of service provision, have significantly improved access to care for CCBHC clients in their states.
Most CCBHCs expanded their scope of services to meet the certification requirements. Clinics most often added services within the categories of outpatient mental health and/or SUD services, psychiatric rehabilitation services, crisis services, peer support, services for members of the armed forces and veterans, and primary care screening and monitoring (Figure 3). The extent to which the CCBHCs added services to meet the certification requirements varied widely across the states depending on the service infrastructure that existed before the demonstration.
| FIGURE 3. Proportion of CCBHCS that Added Each Type a Service as a Result of Certification (as of March 2018) |
|---|
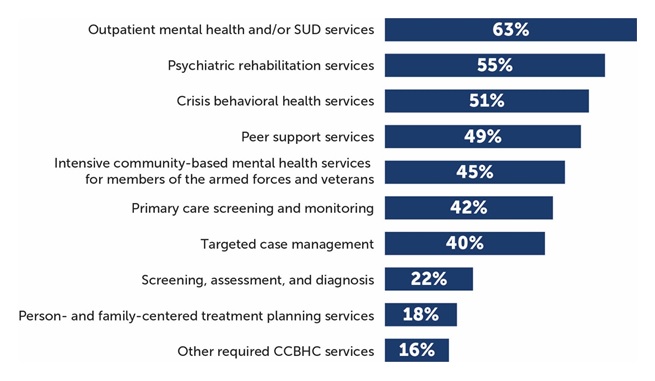 |
| SOURCE: CCBHC Annual Progress Report Demonstration Year 1 data collected by Mathematica and the RAND Corporation, March 2018. NOTES: Denominator is 67 CCBHCs. See Appendix Table A.3 for detailed findings on individual services. CCBHCs may have provided services within each of the service categories illustrated in the figure before CCBHC certification. For example, all clinics provided some type of outpatient mental health and/or SUD treatment before certification. However, 63 percent of clinics added some type of outpatient mental health and/or SUD treatment as a result of certification. The service categories illustrated in this figure correspond to the service categories described in the CCBHC certification criteria. |
Officials in all states perceived that clinics were able to sustain delivery of the nine core CCBHC services throughout the demonstration, a finding confirmed by clinics in the progress report. As shown in Figure 4, nearly all CCBHCs in both DY1 and DY2 reported that they provided the required services, with the exception of intensive community-based mental health services for members of the armed forces and veterans, which were provided by about 70 percent of clinics in both years. State officials speculated that the armed forces/veterans populations did not comprise a large percentage of CCBHC clients and that CCBHCs may have struggled to engage these populations and to develop strong referral relationships and care coordination agreements with U.S. Department of Veterans Affairs (VA) providers. Though not required by the demonstration, about half of clinics provided on-site primary care in each demonstration year.
| FIGURE 4. Proportion of CCBHCs that Provided Each Type of Service Either Directly or Through a DCO |
|---|
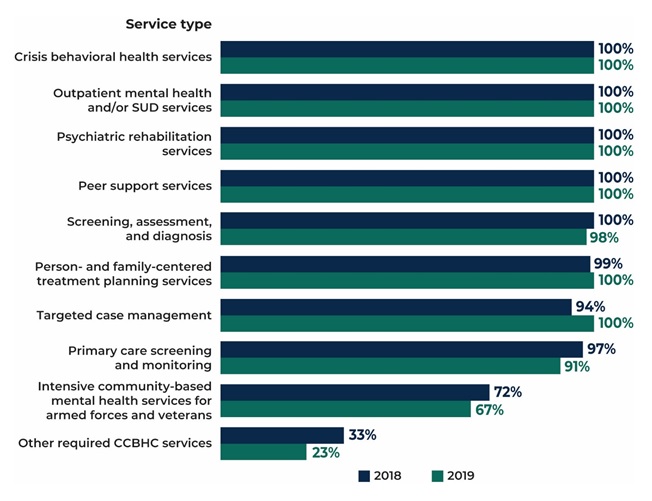 |
| SOURCE: CCBHC Annual Progress Report Demonstration Year 1 and Year 2 collected by Mathematica and the RAND Corporation, March 2018 and March 2019. NOTES: Denominator is 67 CCBHCs in 2018 (DY1) and 66 CCBHCs in 2019 (DY2). The "other required CCBHC services" category denotes additional services that do not fall within the 9 service types defined in federal criteria but that may be required by individual states. See Appendix Table A.4 for detailed findings and the number of clinics corresponding to the percentages. |
CCBHCs were able to add and sustain a range of evidence-based practices (EBPs) across demonstration years. In the first year of the demonstration, CCBHCs offered a wide range of EBPs and psychiatric rehabilitation and other services either directly or through DCOs. As shown in Figure 5, most clinics were able to sustain or provide more of these services in the second year of the demonstration. For example, 46 percent (n = 31) of clinics added medication-assisted treatment (MAT) for alcohol or opioid use as a result of certification, and 92 percent of clinics (n = 61) offered MAT in DY2 compared to 84 percent (n = 56) in DY1. Even though, early in the demonstration, CCBHCs generally addressed challenges to implementing maintaining EBPs and providing the full scope of CCBHC services, officials continued to explore ways to support clinics in offering the full range of services, such as by providing CCBHCs with increased flexibility to better tailor EBPs and other services to reflect the needs and preferences of their client populations.
| FIGURE 5. Proportion of CCBHCs that Provided Selected EBPs, Psychiatric Rehabilitation Services, and Other Services, Either Directly or Through a DCO |
|---|
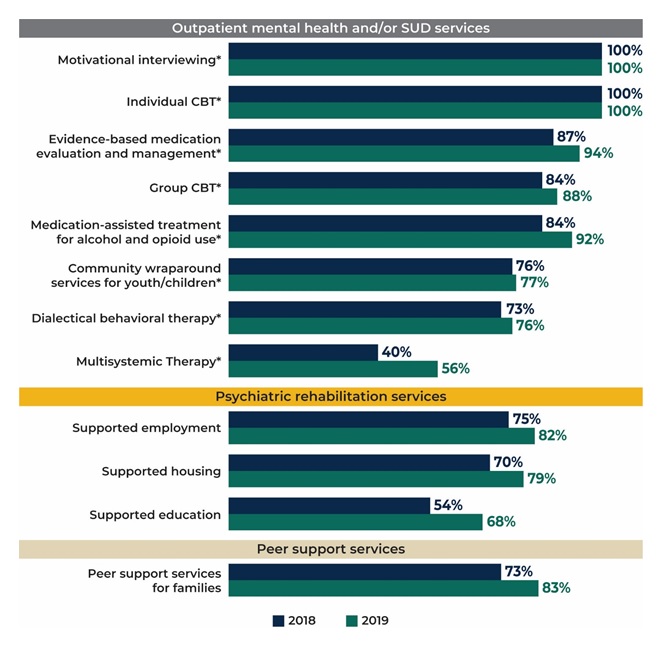 |
| SOURCE: CCBHC Annual Progress Report Demonstration Year 1 and Year 2 collected by Mathematica and the RAND Corporation, March 2018 and March 2019. NOTES: Denominator is 67 CCBHCs in 2018 and 66 CCBHCs in 2019. See Appendix Table A.4 for detailed findings and the number of clinics corresponding to the percentages. See Appendix Table A.3 for the number and percentage of clinics that added each type of service as a result of CCBHC certification. * = EBP listed in CCBHC criteria. |
CCBHCs have used a variety of strategies to improve care coordination, including adding various provider types to treatment teams and expanding targeted care coordination strategies to different populations and service lines. In the early stages of the demonstration, improvements to EHR and HIT aided clinics in their care coordination efforts, in some cases permitting CCBHCs to integrate care plans more fully, connect with external providers, and receive alerts about clients' care transitions. As the demonstration progressed, information from CBHC progress reports indicated that clinics implemented additional strategies, and initiated collaboration with various external organizations to facilitate coordinated care. For example, some clinics partnered with first responders and law enforcement officials on strategies to intervene in crisis situations and divert those in crisis from the criminal justice system.
CCBHCs, for the most part, elected to offer the full scope of CCBHCs services directly, instead of engaging DCOs to deliver required services. While the certification criteria allowed for some services to be provided by DCOs, officials suggested that CCBHCs preferred to provide services directly because they wished to embrace the model fully and were reluctant to assume oversight responsibility for another provider's services. CCBHCs did, however, continue to provide and expand services in collateral agencies such as schools and shelters and to build and sustain close formal and informal relationships with a range of external providers.
Future Reports. The fifth report to Congress, which will be submitted in December 2021 will provide a more robust analysis of the impact of the demonstration on access to care using Medicaid claims and encounter data submitted by participating states.
The Quality and Scope of Services Provided by CCBHCs
CCBHC criteria[9] require states to report 21 quality measures as part of their participation in the demonstration, including nine clinic-reported measures and 12 state-reported measures. These measures were developed or adapted specifically for the demonstration, and were primarily adapted from National Quality Forum endorsed measures.[10] Clinic-reported quality measures are primarily process measures that focus on how clinics are achieving service provision targets (for example, time to initial evaluation, whether screening and services were provided) and are based on clinical data typically derived from EHRs or other electronic administrative sources. State-reported measures focus on CCBHC consumer characteristics (for example, housing status), screening and treatment of specific conditions, follow-up and readmission, and consumer and family experiences of care.
Development of infrastructure to report measures. Nearly all clinics (97 percent) across all states made changes to their EHRs or HIT systems to meet certification criteria and support quality measure and other reporting for the CCBHC demonstration. The most commonly reported changes were modification of EHR/HIT specifications (for example, data fields; forms) to support collection and output of data required for quality measure reporting, and the addition of features to allow the electronic exchange of clinical information with DCOs and other external providers. State officials reported investing considerable resources, including extensive technical assistance in some cases, prior to and following the demonstration launch to ensure that participating clinics had appropriate data systems in place to meet the demonstration quality reporting requirements. This highlights the importance of building-out technological infrastructure for the demonstration to support data collection for mandated quality reporting.
In addition, many clinics modified approaches to screening and the use of standardized tools to assess specific indicators (for example, implementing the PHQ-9 to assess symptoms of depression for the 12-month depression remission measure). During site visits, many CCBHC staff reported that similar screening tools had been used prior to the demonstration, but virtually all sites reported implementing changes to screening protocols (for example, the frequency with which screenings were conducted) and how screening data were used in clinical practice, including how and where results were displayed in a consumer's chart. These changes were typically accompanied by extensive staff trainings and frequent data reviews to ensure provider compliance with screening and data entry procedures.
Successes and challenges reporting measures. Many clinics experienced challenges in the early stages of the demonstration with data collection and reporting the CCBHC-reported measures. In interviews with state officials during DY1, all states reported that many clinics initially experienced challenges with their EHR/HIT systems, particularly when collecting and aggregating data needed to generate quality measures (for example, querying databases to specify the correct numerators and denominators within a given timeframe). State officials most often reported challenges associated with CCBHCs' lack of familiarity with the required measure specification and difficulty obtaining certain variables, such as new service codes or new population subgroups, from clinic EHRs. Many clinic staff echoed these concerns during interviews on CCBHC site visits. In the early stages of the demonstration, many clinics relied upon ad hoc strategies to overcome these challenges and facilitate data collection and reporting. To help clinics resolve these early challenges, state officials provided ongoing technical assistance in the form of training webinars and direct support through multiple channels (phone, online, in-person) to: (1) explain the measures and the information needed from the CCBHCs to report on each of them; (2) provide examples of how to extract information and calculate measures from EHR data (for example, what queries to run; what numerators and denominators to use; etc.); and (3) explain how to complete the reporting template. By the end of DY2, officials in all states reported that the majority of issues surrounding CCBHC-reported quality measures had been resolved.
Use of quality measures to inform quality improvement. Although CCBHCs and states were not required to use quality measure data to monitor or improve the quality of care they provide, they were required to develop, implement and maintain a continuous quality improvement plan. Both state officials and clinics reported using quality measure data to support a wide range of quality improvement efforts. For example, officials in all states reported using quality measures data to support ongoing monitoring and oversight of CCBHCs (for example, to assess compliance with certification criteria). In addition, Pennsylvania utilized a "dashboard" that displayed CCBHC performance on quality measures and allowed individual CCBHCs to readily compare their performance against other CCBHCs in the state. Many clinics also reported using CCBHC quality measures to support quality improvements, although the use of individual quality measures (for example, time to initial evaluation; depression remission; suicide risk assessment) varied depending on site-specific areas of focus.
QBP programs. QBP programs were optional for states that implemented PPS-1 and required for states that implemented PPS-2. Of the 21 measures specified in the certification criteria, CMS specified six quality measures that states were required to use if they implemented a QBP program; states could choose from among an additional five measures or ask for approval for use of non-listed measures (required and optional measures are listed in Table A.2). All demonstration states except Oregon offered bonus payments based on CCBHCs' performance on quality measures. Pennsylvania, Missouri, New Jersey, and Oklahoma used only the six CMS-required measures to determine bonus payments. Minnesota, Nevada, and New York also used the CMS-optional measure for Plan All-Cause Readmission Rate in addition to the six CMS-required measures. In addition to the six required measures, Minnesota also used the CMS-optional measure Screening for Clinical Depression and Follow-Up Plan in determining QBPs, and New York added two state-specific measures based on state data regarding suicide attempts and deaths from suicide.
States varied in the criteria they used to award QBPs. In some states, CCBHCs could qualify for the QBP during DY1 simply by reporting the quality measures. Several states assessed performance on the quality measures during the first six months of the demonstration and used that information to set improvement goals for the remainder of DY1. Some states decided to weight some measures more heavily than others. As of spring 2019, Missouri and Nevada had assessed CCBHC performance relative to the QBP program standards, and, in both states, all CCBHCs met the criteria to receive the QBPs. Officials from the other five states with QBPs reported that they were still receiving or analyzing data to finalize determinations of QBPs.
Future Reports. The fourth report to Congress, which will be submitted in December 2020, will provide an analysis of all quality measurement data submitted by demonstration states, with comparisons to national and state Medicaid averages, when available.
Impact of the CCBHC Program on Federal and State Costs
Prior to DY1, states worked with clinics that were candidates for CCBHC certification to set visit-day rates for PPS-1 states or visit-month rates for PPS-2 states following CMS guidance.[11] At the end of DY1, the CCBHCs submitted detailed cost reports, which include information on total costs of clinic operations. It is important to note that the rates, which were set prior to the beginning of the demonstration, might differ from the actual costs, reported by the clinics at the end of DY1. This report summarizes the rate-setting process and the costs of providing care in the CCBHCs during DY1. We also highlight potential reasons that the rates differed from the DY1 costs, but planning period cost reports that were used to develop rates were not available for analysis.
Establishment of PPS rates. States set the PPS rates using a formula, wherein projected total allowable costs were divided by the projected number of visit-days (for PPS-1) or visit-months (for PPS-2). To set the rates, states collected data on clinics' historical operating costs and visits using a cost-report template provided by CMS. Clinics in seven of the eight participating states did not have experience in collecting and reporting their operating costs prior to the demonstration. In these states, officials reported that collecting this information for the purposes of setting rates was a major challenge for clinics. State officials also reported that they anticipated that the rates during DY1 would differ from the actual DY1 costs due to the limitations of the historical data on costs, particularly for services included in the CCBHC criteria that the clinics either did not deliver or bill separately prior to the demonstration. The lack of data was taken into consideration as part of the CMS guidance provided to states. States and CCBHCs had to project the costs and number of visits for these new services based on very limited information or uncertain assumptions. Several states provided technical support (such as funding for accounting consultations) to the clinics to improve their cost-reporting capabilities.
The average daily rate across the 56 clinics in PPS-1 states was $264 (median rate was $252, and ranged from $151 to $667). PPS-1 rates were, on average, higher in urban CCBHCs than rural CCBHCs, and in CCBHCs that served a smaller number of clients (as measured by total visit-days) versus those that served a higher number of clients. Urban CCBHCs were likely to have higher rates due to higher labor costs and larger CCBHCs were likely to have lower rates due to apportionment of fixed costs across a larger number of visit-days. PPS-1 rates were also, on average, higher among CCBHCs in which a larger share of their total full-time equivalent staff was dedicated to medical doctors. The average blended PPS-2 rate was $714 in New Jersey and $704 in Oklahoma.[12] PPS-2 rates tended to be higher in CCBHCs that served a smaller number of clients versus those that served a higher number of clients, as measured by the total visit-months.
Cost-reporting by clinics. All the CCBHCs submitted cost reports that were approved by their state governments. However, state officials and CCBHC staff reported some challenges to reporting accurate cost information. To assist CCBHCs in providing accurate cost-report information, states reported providing extensive technical assistance to clinic financial and administrative staff during DY1. Some states hired consulting firms to work directly with the CCBHCs on the reports during DY1. State officials in Pennsylvania instituted a "dry run" of the cost reports, which covered the first six months of the demonstration. Having the clinics go through the process of collecting and reporting cost information helped the state identify and address reporting challenges before the first federally mandated cost reports were due. Overall, CCBHCs were ultimately able to provide the information in the cost reports.
Total costs of CCBHC operations during DY1. Across all PPS-1 clinics, the average DY1 visit-day cost was $234 and ranged from $132 to $639. The state average visit-day cost ranged from $167 in Nevada to $336 in Minnesota. Across all PPS-2 clinics, the blended visit-month costs averaged $759 and ranged from $443 to $2,043. The state average visit-month cost was $679 in Oklahoma and $793 in New Jersey.
Direct labor costs accounted for 65 percent of the total allowable costs for all CCBHCs. This proportion is similar to the proportion reported for outpatient care centers in the Census Bureau's Service Annual Survey. According to that survey, labor costs account for 68 percent of total outpatient care center costs in 2016.[13] Indirect costs accounted for 23 percent of costs, and other direct costs accounted for 11 percent of costs. The distribution of costs across these categories was similar across states. About 1 percent of DY1 costs were payments by CCBHCs to DCOs. Although the total amount paid to DCOs was a small percentage of costs across all CCBHCs, among the 34 CCBHCs that had DCOs, the proportion of total costs paid to DCOs ranged from 0.02 percent to 14 percent and averaged 2 percent. The percentage of costs allocated to direct labor, indirect, other direct, and DCOs were similar for PPS-1 and PPS-2 states.
Rates relative to costs during DY1. In seven of the eight demonstration states, the rate per visit-day or per visit-month was higher, on average, than the cost per visit-day or per visit-month during DY1. As illustrated in Figure 6, four of the eight states had rates that, on average, were no more than 10 percent higher than costs, and four of the states had rates, on average, more than 10 percent higher than costs, ranging from 18 percent to 48 percent above cost on average. In Oregon and New Jersey, the rates were similar to costs on average, but the rate to cost ratio varied widely across clinics. In contrast, the rate to cost ratios for Missouri CCBHCs are closely grouped around the state average.
| FIGURE 6. DY1 Rates as Percent Above or Below DY1 Costs Per Visit-Day or Per Visit-Month for Clinics by State |
|---|
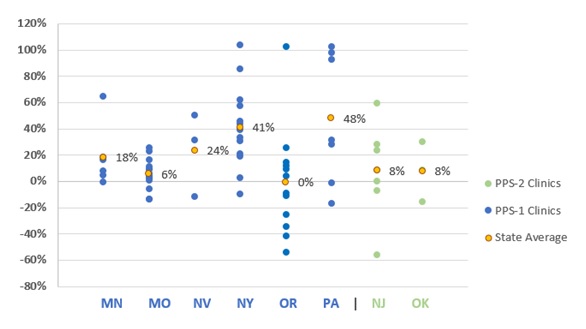 |
| SOURCE: Mathematica and the RAND Corporation analysis of DY1 CCBHC cost reports. NOTES: A positive percentage indicates how much the rate was greater than the cost and a negative percentage indicates how much the rate was less than the cost. |
There are at least two potential reasons for the tendency of the CCBHC rates to be higher than costs during DY1. Rates could be higher than costs if: (1) clinics overestimated staff costs; or (2) underestimated the number of clients served. First, as described above, state officials indicated in interviews that the rates were set under the assumption that the CCBHCs would be fully staffed throughout the demonstration project. Although state officials recognized that not all CCBHCs would be fully staffed at the outset of the demonstration, it was important to set the rates under this assumption in order to avoid constraining hiring. If staff positions went unfilled, the clinic would have lower costs than had been anticipated and their costs would be lower than their rate. Second, during site visits, several CCBHCs reported increases in the volume of consumers they see. Visit-days and visit-months would also increase if consumers were seen more frequently, on average, than the historical data on which the rates were set would suggest. If the number of consumer visits increased, while the costs were relatively constant, the actual costs per visit-day or visit-month would be lower than had been anticipated. Moreover, if the staffing costs were lower than anticipated while the number of visit-days or visit-months were greater than anticipated, the divergence between the rates and costs would be magnified.
Changes to rates for DY2. States were able to raise or lower their PPS rates for DY2 to bring rates into closer alignment with costs. The states could either re-base (that is, re-calculate the rates based on the DY1 cost reports), or inflation adjust, using the Medicare Economic Index (a measure of inflation in the health care sector). Six of the demonstration states re-based CCBHC rates: Minnesota, New Jersey, New York, Nevada, Oklahoma, and Pennsylvania. Oregon and Missouri chose to only adjust the rates between DY1 and DY2, based on the Medicare Economic Index. As state officials explained, their decision to adjust, not re-base, was related to not feeling comfortable with the demonstration length of time and the availability of cost, utilization, and staff hiring data to appropriately inform re-basing the rates.
Future Reports. In order to fully assess the impact of the demonstration on the federal and state costs of care provided under the demonstration, Medicaid claims and encounter data is required. Due to lags in the availability of this data, and the length of time it will take to create analysis files and complete analysis, the findings will not be available until 2021. The fifth report to Congress, which will be submitted in December 2021, will provide a full assessment of the costs of CCBHC services to federal and state governments, and will compare these costs to services provided in non-CCBHC settings.
CONCLUSIONS
In the demonstration's second year, CCBHCs and states built on and further refined efforts to hire and maintain staff, increase access to care, sustain the full scope of CCBHC services, and ensure coordinated care for CCBHC clients. Although some CCBHCs experienced challenges related to staffing or the implementation of new services, state officials reported that CCBHCs generally addressed these challenges and, since then, have consistently adhered to the demonstration criteria.
In the second demonstration year, CCBHCs and states continued to focus on making services more accessible and increasing consumer engagement. States reported that the most common strategy that CCBHCs used to increase service access was the introduction of open-access scheduling. CCBHCs also have continued to provide services in locations outside of the clinic and make broad use of telehealth to extend the reach of CCBHC services. Stakeholder organizations representing consumers and families reported that the strategies adopted by CCBHCs, such as open-access scheduling and expanded hours of service provision, have significantly improved access to care for CCBHC clients in their states.
Officials in all states perceived that clinics were able to sustain delivery of the nine core CCBHC services throughout the demonstration, a finding confirmed by clinics in the progress report. Nearly all CCBHCs in both DY1 and DY2 reported that they provided the required services, with the exception of intensive community-based mental health services for members of the armed forces and veterans; about 70 percent of clinics provided those services in both years. States speculated that the armed forces/veteran populations did not comprise a large percentage of CCBHC clients and that CCBHCs may have struggled to engage members of these groups and to develop strong referral relationships and care coordination agreements with VA providers. Though not required by the demonstration, a smaller number of clinics provided on-site primary care; only about half of clinics provided this service in either demonstration year.
CCBHCs were able to add and sustain a range of EBPs across demonstration years. Early in the demonstration, CCBHCs generally addressed the challenges to maintaining EBPs and providing the full scope of CCBHC services, although officials continued to explore ways to support clinics' efforts to offer the full range of services. For example, officials granted CCBHCs increased flexibility to tailor EBPs and other services more precisely to the needs and preferences of their client populations.
CCBHCs have used a variety of strategies to improve care coordination, including the addition of various provider types to treatment teams and the expansion of targeted care coordination strategies to different populations and service lines. Improvements to EHR and HIT systems in the early stages of the demonstration aided clinics' care coordination efforts, in some cases permitting CCBHCs to better-integrate care plans, create linkages with external providers, and receive alerts about clients' care transitions.
States and clinics alike described a need for flexibility within the CCBHC model to adjust requirements and practices to best suit the needs of the consumers over the course of the demonstration. For example, some states and clinics found that consumers were not availing themselves of certain required EBPs or access requirements as frequently as expected, and modified these practices to better reflect actual patterns of use. Other findings in the report may point to additional experimentation and fine-tuning of demonstration practices from DY1 to DY2. For instance, some changes in staffing or the composition of care teams may be the result of clinics identifying more efficient and effective ways of providing required CCBHC services.
Costs of treating consumers in the CCBHCs. State averages of actual CCBHC DY1 costs per visit-day in PPS-1 states ranged from $167 to $336, and the average blended costs per visit-month in PPS-2 states was $679 in one state and $793 in the other. Costs also varied widely across CCBHCs within states. Two CCBHC characteristics--rural versus urban location and clinic size--were associated with the per visit-day/visit-month costs used to establish the DY1 payment rates and, therefore, the payment rates themselves. In PPS-1, payment rates were lower for clinics in rural areas than those in urban areas. For both PPS-1 and PPS-2, payment rates were lower for clinics that served a higher number of clients versus those that served a smaller number.
The PPS rates, which reflect the anticipated costs per visit-day or visit-month, tended to be higher than the actual costs per visit-day or visit-month as reported in the DY1 cost reports. Of the 66 CCBHCs, 49 had rates that were higher than actual costs. Five CCBHCs had rates that exceeded costs by 90 percent or more. There are two likely explanations for this pattern. First, the rates assumed operational costs for fully staffed clinics, while in fact some positions went unfilled due to hiring challenges or staff turnover. Having fewer staff than anticipated would lower total operating costs. Second, states' initial PPS rate calculations may have assumed smaller caseloads, while CCBHCs increased their caseload size through efforts to increase access to care. Increasing the caseload size, the total number of visit-days or visit-months, would also lower costs relative to rates.
State officials were aware of the limitations of the data available to set rates and expected that the rates would vary from costs during the demonstration, with stabilization over time as more accurate data become available. States can use the DY1 cost reports to inform rate adjustments in DY2.
According to state officials, the CCBHCs and state agencies were successful in collecting and reporting data on the required quality measures to the HHS Substance Abuse and Mental Health Services Administration (SAMHSA) during DY1. However, this success required investments of time and resources in technical assistance and technological infrastructure, particularly at the clinic-level. In addition to technical assistance, some states established learning networks so that CCBHCs could learn from each other as they collected data for the quality measures. Quality measure reporting was the most commonly cited reason for investing in improvements to EHRs during the CCBHC certification process.
During the demonstration, some CCBHCs and states not only reported quality measurement data to SAMHSA, but also used the data to improve care in a variety of ways. Although states were not required to use quality measurement data to improve care, states were required to develop, implement, and maintain a continuous quality improvement plan. Several states reported using the required quality measurement data to support these quality improvement efforts including the creation of dashboards to report quality measurement data directly back to clinics in a timely fashion. Some dashboards also provide data showing CCBHCs how their performance compares with the performance of other CCBHCs in their state. Some CCBHCs are using quality measurement data to identify areas of low quality for targeted improvement efforts. The requirement that CCBHCs must report data on quality measures to their states encouraged some CCBHCs to introduce additional care monitoring systems to support clinic-specific quality improvement efforts.
APPENDIX A. ADDITIONAL TABLES
| TABLE A.1. CCBHC Staffing | ||||||||||
|---|---|---|---|---|---|---|---|---|---|---|
| Staff Type | Employed Before CCBHC Certification | Hired as Part of CCBHC Certification | Hired After CCBHC Certification | Employed as of March 2018a | Employed as of March 2019 | |||||
| N | % | N | % | N | % | N | % | N | % | |
| CCBHC medical director | 55 | 82 | 11 | 16 | 6 | 9 | 66 | 99 | 60 | 91 |
| Adult psychiatrists | 47 | 70 | 12 | 18 | 23 | 34 | 61 | 91 | 54 | 82 |
| Child/adolescent psychiatrists | 39 | 58 | 12 | 18 | 11 | 16 | 51 | 76 | 42 | 64 |
| Other psychiatrists | 29 | 43 | 8 | 12 | 9 | 13 | 40 | 60 | 31 | 47 |
| Nurses | 57 | 85 | 22 | 33 | 36 | 54 | 67 | 100 | 65 | 98 |
| LCSWs | 63 | 94 | 23 | 34 | 30 | 45 | 66 | 99 | 66 | 100 |
| Licensed psychologists | 30 | 45 | 7 | 10 | 9 | 13 | 35 | 52 | 29 | 44 |
| Licensed marriage and family therapists | 40 | 60 | 9 | 13 | 11 | 16 | 42 | 63 | 40 | 61 |
| Case management staff | 48 | 72 | 32 | 48 | 34 | 51 | 65 | 97 | 64 | 97 |
| Occupational therapists | 11 | 16 | 2 | 3 | 5 | 7 | 17 | 25 | 11 | 17 |
| SUD specialists | 61 | 91 | 25 | 37 | 32 | 48 | 67 | 100 | 61 | 92 |
| Bachelor's degree-level counselors | 49 | 73 | 14 | 21 | 19 | 28 | 50 | 75 | 51 | 77 |
| Associate's degree-level or non-degree counselors | 27 | 40 | 5 | 7 | 11 | 16 | 30 | 45 | 32 | 48 |
| MH professionals | 27 | 40 | 5 | 7 | 10 | 15 | 30 | 45 | 31 | 47 |
| Community health workers | 18 | 27 | 10 | 15 | 13 | 19 | 27 | 40 | 23 | 35 |
| Medical/nursing assistants | 28 | 42 | 12 | 18 | 15 | 22 | 37 | 55 | 38 | 58 |
| Pharmacy staff | 8 | 12 | 0 | 0 | 3 | 4 | 10 | 15 | 11 | 17 |
| Peer specialists/recovery coaches | 46 | 69 | 40 | 60 | 38 | 57 | 66 | 99 | 66 | 100 |
| Family support staff | 25 | 37 | 19 | 28 | 21 | 31 | 45 | 67 | 45 | 68 |
| Interpreters or linguistic counselors | 24 | 36 | 8 | 12 | 10 | 15 | 29 | 43 | 20 | 30 |
| Interns | 41 | 61 | 6 | 9 | 22 | 33 | 47 | 70 | 48 | 73 |
| Other clinician types | 29 | 43 | 17 | 25 | 22 | 33 | 37 | 55 | 38 | 58 |
| Total CCBHCs | 67 | 100 | 67 | 100 | 67 | 100 | 67 | 100 | 66 | 100 |
| SOURCE: CCBHC Annual Progress Report Demonstration Year 1 and Year 2 data collected by Mathematica and the RAND Corporation, March 2018 and March 2019. NOTES: Columns are not mutually exclusive because CCBHCs may have employed the same staff type before CCBHC certification and hired those staff as part of or after certification. Consistent with the CCBHC cost-reporting template, the mental health professional category includes only providers trained and credentialed for psychological testing. "Other clinician types" is a write-in category.
|
||||||||||
| TABLE A.2. Services Added as a Result of CCBHC Certification, 2018 | |||
|---|---|---|---|
| Service Type | Service Description | Added as a Result of CCBHC Certification | |
| N | % | ||
| Crisis BH services | 24-hour mobile crisis teams | 31 | 46 |
| Emergency crisis intervention | 21 | 31 | |
| Crisis stabilization | 21 | 31 | |
| Screening, assessment, and diagnosis | MH screening, assessment, diagnostic services | 9 | 13 |
| SUD screening, assessment, diagnostic services | 15 | 22 | |
| Person and family-centered treatment planning services | Person and family-centered treatment planning services | 12 | 18 |
| Outpatient MH and/or SUD services | Assertive community treatmenta | 4 | 6 |
| Forensic assertive community treatmenta | 2 | 3 | |
| Individual cognitive behavioral therapya | 3 | 4 | |
| Group cognitive behavioral therapya | 4 | 6 | |
| Online cognitive behavioral therapya | 0 | 0 | |
| Dialectical behavioral therapya | 5 | 7 | |
| First-episode/early intervention for psychosis | 9 | 13 | |
| Evidence-based medication evaluation and managementa | 5 | 7 | |
| MAT for alcohol and opioid usea | 31 | 46 | |
| Motivational interviewinga | 6 | 9 | |
| Multisystemic therapya | 5 | 7 | |
| Outpatient MH counseling | 4 | 6 | |
| Outpatient SUD treatment | 13 | 19 | |
| Specialty MH/SUD services for children and youth | 15 | 22 | |
| Therapeutic foster carea | 1 | 1 | |
| Community wraparound services for youth/childrena | 10 | 15 | |
| Psychiatric rehabilitation services | Community integration services | 16 | 24 |
| Financial management | 17 | 25 | |
| Illness management and recovery | 21 | 31 | |
| Medication education | 14 | 21 | |
| Psycho-education | 13 | 19 | |
| Self-management | 16 | 24 | |
| Skills training | 14 | 21 | |
| Supported housing | 8 | 12 | |
| Supported employment | 18 | 27 | |
| Supported education | 11 | 16 | |
| Wellness education services (diet, nutrition, exercise, tobacco cessation, etc.) | 24 | 36 | |
| Peer support services | Peer support services for consumers/clients | 29 | 43 |
| Peer support services for families | 23 | 34 | |
| Targeted case management | TCM | 27 | 40 |
| Primary care screening and monitoring | Primary care screening and monitoring | 28 | 42 |
| Intensive community-based MH services for armed forced and veterans | Intensive community-based mental health services for armed forces and veterans | 30 | 45 |
| SOURCE: CCBHC Annual Progress Report Demonstration Year 1 data collected by Mathematica and the RAND Corporation, March 2018. NOTES: The denominator is 67 CCBHCs.
|
|||
| TABLE A.3. Telehealth and Remote Services | ||||||
|---|---|---|---|---|---|---|
| Telehealth and Remote Services | Offered Service as of March 2018 | Offered Before CCBHC Certification, 2018 | Offered Service as of March 2019 | |||
| N | % | N | %a | N | % | |
| Offers services in locations outside of the clinicb | 62 | 93 | 53 | 85 | 64 | 97 |
| Consumers' homes | 52 | 84 | NA | NA | 50 | 78 |
| Schools | 34 | 55 | NA | NA | 30 | 47 |
| Courts, police offices, and other justice-related facilitiesc | 28 | 45 | NA | NA | 21 | 33 |
| Hospitals and EDs | 20 | 32 | NA | NA | 19 | 30 |
| Community service agencies and non-profit organizations | 17 | 27 | NA | NA | 13 | 20 |
| Homeless shelters | 6 | 10 | NA | NA | 7 | 11 |
| Offers telehealth services | 45 | 67 | 36 | 80 | 46 | 70 |
| Total CCBHCs | 67 | 100 | 67 | 100 | 66 | 100 |
| SOURCE: CCBHC Annual Progress Report Demonstration Year 1 and Year 2 data collected by Mathematica and the RAND Corporation, March 2018 and March 2019. NOTES: The two 2018 columns are not mutually exclusive.
|
||||||
| TABLE A.4. CCBHCs and DCOs Provided Required Services | ||||||||||||
|---|---|---|---|---|---|---|---|---|---|---|---|---|
| Service Type | CCBHC, 2018 | CCBHC, 2019 | DCO, 2018 | DCO, 2018 | Either CCBHC or DCO, 2018 | Either CCBHC or DCO, 2019 | ||||||
| N | % | N | % | N | % | N | % | N | % | N | % | |
| Crisis behavioral health services | ||||||||||||
| 24-hour mobile crisis teams | 49 | 73 | 53 | 80 | 23 | 34 | 19 | 29 | 65 | 97 | 65 | 98 |
| Emergency crisis intervention | 59 | 88 | 63 | 95 | 20 | 30 | 21 | 32 | 67 | 100 | 66 | 100 |
| Crisis stabilization | 60 | 90 | 59 | 89 | 14 | 21 | 18 | 27 | 66 | 99 | 64 | 97 |
| Screening, assessment, and diagnosis | ||||||||||||
| MH screening, assessment, diagnostic services | 67 | 100 | 65 | 98 | 4 | 6 | 7 | 11 | 67 | 100 | 65 | 98 |
| SUD screening, assessment, diagnostic services | 67 | 100 | 65 | 98 | 3 | 4 | 4 | 6 | 67 | 100 | 65 | 98 |
| Person and family-centered treatment planning services | 66 | 99 | 66 | 100 | 5 | 7 | 7 | 11 | 66 | 99 | 66 | 100 |
| Outpatient MH and/or SUD services | ||||||||||||
| Outpatient MH counseling | 67 | 100 | 66 | 100 | 0 | 0 | 4 | 6 | 67 | 100 | 66 | 100 |
| Outpatient SUD treatment | 67 | 100 | 66 | 100 | 0 | 0 | 2 | 3 | 67 | 100 | 66 | 100 |
| Motivational interviewinga | 67 | 100 | 66 | 100 | 2 | 3 | 4 | 6 | 67 | 100 | 66 | 100 |
| Individual cognitive behavioral therapya | 67 | 100 | 66 | 100 | 0 | 0 | 3 | 5 | 67 | 100 | 66 | 100 |
| Group cognitive behavioral therapya | 56 | 84 | 58 | 88 | 0 | 0 | 3 | 5 | 56 | 84 | 58 | 88 |
| Online cognitive behavioral therapya | 7 | 10 | 9 | 14 | 0 | 0 | 0 | 0 | 7 | 10 | 9 | 14 |
| Dialectical behavioral therapya | 49 | 73 | 49 | 74 | 0 | 0 | 1 | 2 | 49 | 73 | 50 | 76 |
| First-episode/early intervention for psychosis | 40 | 60 | 37 | 56 | 0 | 0 | 4 | 6 | 40 | 60 | 38 | 58 |
| Multisystemic therapya | 27 | 40 | 36 | 55 | 0 | 0 | 2 | 3 | 27 | 40 | 37 | 56 |
| Assertive community treatmenta | 30 | 45 | 33 | 50 | 1 | 1 | 1 | 2 | 31 | 46 | 34 | 52 |
| Forensic assertive community treatmenta | 6 | 9 | 10 | 15 | 0 | 0 | 1 | 2 | 6 | 9 | 11 | 17 |
| Evidence-based medication evaluation and managementa | 58 | 87 | 62 | 94 | 0 | 0 | 2 | 3 | 58 | 87 | 62 | 94 |
| MAT for alcohol and opioid usea | 55 | 82 | 61 | 92 | 2 | 3 | 1 | 2 | 56 | 84 | 61 | 92 |
| Therapeutic foster carea | 4 | 6 | 5 | 8 | 1 | 1 | 0 | 0 | 5 | 7 | 5 | 8 |
| Community wraparound services for youth/childrena | 50 | 75 | 49 | 74 | 2 | 3 | 2 | 3 | 51 | 76 | 51 | 77 |
| Specialty MH/SUD services for children and youth | 58 | 87 | 56 | 85 | 0 | 0 | 3 | 5 | 58 | 87 | 56 | 85 |
| Psychiatric rehabilitation services | ||||||||||||
| Medication education | 65 | 97 | 64 | 97 | 3 | 4 | 6 | 9 | 66 | 99 | 65 | 98 |
| Self-management | 63 | 94 | 64 | 97 | 5 | 7 | 6 | 9 | 65 | 97 | 65 | 98 |
| Skills training | 64 | 96 | 64 | 97 | 5 | 7 | 6 | 9 | 66 | 99 | 65 | 98 |
| Psycho-education | 64 | 96 | 65 | 98 | 5 | 7 | 5 | 8 | 66 | 99 | 66 | 100 |
| Community integration services | 61 | 91 | 62 | 94 | 4 | 6 | 6 | 9 | 64 | 96 | 63 | 95 |
| Illness management and recovery | 62 | 93 | 61 | 92 | 4 | 6 | 6 | 9 | 65 | 97 | 62 | 94 |
| Financial management | 61 | 91 | 58 | 88 | 5 | 7 | 4 | 6 | 64 | 96 | 59 | 89 |
| Wellness education services (diet, nutrition, exercise, tobacco cessation, etc.) | 65 | 97 | 64 | 97 | 6 | 9 | 5 | 8 | 67 | 100 | 65 | 98 |
| Supported housing | 43 | 64 | 50 | 76 | 5 | 7 | 6 | 9 | 47 | 70 | 52 | 79 |
| Supported employment | 45 | 67 | 49 | 74 | 5 | 7 | 8 | 12 | 50 | 75 | 54 | 82 |
| Supported education | 33 | 49 | 41 | 62 | 5 | 7 | 7 | 11 | 36 | 54 | 45 | 68 |
| Peer support services | ||||||||||||
| Peer support services for consumers/clients | 66 | 99 | 66 | 100 | 4 | 6 | 7 | 11 | 67 | 100 | 66 | 100 |
| Peer support services for families | 48 | 72 | 55 | 83 | 4 | 6 | 3 | 5 | 49 | 73 | 55 | 83 |
| TCM | 62 | 93 | 64 | 97 | 1 | 1 | 3 | 5 | 63 | 94 | 66 | 100 |
| Primary care screening and monitoring | 63 | 94 | 56 | 85 | 3 | 4 | 9 | 14 | 65 | 97 | 60 | 91 |
| Intensive community-based MH services for armed forces and veterans | 47 | 70 | 43 | 65 | 1 | 1 | 5 | 8 | 48 | 72 | 44 | 67 |
| Total CCBHCs | 67 | 100 | 66 | 100 | 67 | 100 | 66 | 100 | 67 | 100 | 66 | 100 |
| SOURCE: CCBHC Annual Progress Report Demonstration Year 1 and Year 2 data collected by Mathematica and the RAND Corporation, March 2018 and March 2019. NOTES: Columns are not mutually exclusive.
|
||||||||||||
NOTES
-
Section 223(d)(7)(A) specifies the that no later than one year after the date on which the first state is selected for the demonstration, and annually thereafter, the Secretary shall submit a report to Congress. HHS selected the states for the demonstration on December 21, 2016. See also Table 1 of this report for demonstration start dates by state.
-
The first (2017) report to Congress is available at: https://www.samhsa.gov/sites/default/files/ccbh_clinicdemonstrationprogram_071118.pdf. The second (2018) report to Congress is available at: https://aspe.hhs.gov/report/certified-community-behavioral-health-clinics-demonstration-program-report-congress-2018.
-
Public Law No: 116-94, The Further Consolidated Appropriations Act, 2020.
-
The nine types of services are: (1) crisis mental health services, including 24-hour mobile crisis teams, emergency crisis intervention services, and crisis stabilization; (2) screening, assessment, and diagnosis, including risk assessment; (3) patient-centered treatment planning or similar processes, including risk assessment and crisis planning; (4) outpatient mental health and substance use services; (5) outpatient clinic primary care screening and monitoring of key health indicators and health risk; (6) targeted case management (TCM); (7) psychiatric rehabilitation services; (8) peer support and counselor services and family supports; and (9) intensive, community-based mental health care for members of the armed forces and veterans. CCBHCs must provide the first four service types directly; a DCO may provide the other service types. In addition, crisis behavioral health services may be provided by a DCO if the DCO is an existing state-sanctioned, certified, or licensed system or network. DCOs may also provide ambulatory and medical detoxification in American Society of Addiction Medicine categories 3.2-WM and 3.7-WM.
-
Ranallo, P.A., A.M. Kilbourne, A.S. Whatley, & H.A. Pincus. (2016). "Behavioral Health Information Technology: From Chaos To Clarity." Health Affairs 35(6): 1106-1113.
-
Scharf, D.M., et al. (2015). Considerations for the Design of Payment Systems and Implementation of Certified Community Behavioral Health Centers. Santa Monica, CA: RAND.
-
Open-access (also known as same-day scheduling) is a method of scheduling in which all patients can receive an appointment slot on the day they call or visit. In DY2, officials in five states reported that most or all CCBHCs adopted open-access scheduling in an effort to increase access to care.
-
Section 223(a)(2)(C)(iii) outlines coordinated care requirements that include the development of partnerships or formal contracts with community providers including schools, child welfare and criminal justice agencies and facilities.
-
Available at https://www.samhsa.gov/sites/default/files/programs_campaigns/ccbhc-criteria.pdf.
-
Technical specifications can be found at https://www.samhsa.gov/section-223/quality-measures. States were required to submit quality measures one year after each demonstration year to SAMHSA and HHS Office of the Assistant Secretary for Planning and Evaluation.
-
Guidance provided to states is available here: https://www.samhsa.gov/sites/default/files/grants/pdf/sm-16-001.pdf#page=94. See also: https://www.medicaid.gov/medicaid/finance/223-demonstration/index.html for answers to questions.
-
The PPS-2 states established rates for the general population and rates for special populations. Average blended rates were calculated by weighting each rate by the number of visit-months in that category in DY1 according to the cost reports and then calculated the average for the clinic. The average was then across the clinics to report a state average.
-
Ashwood, J.S., K.C. Osilla, M. DeYoreo, J. Breslau, J.S. Ringel, C.K. Montemayor, N. Shahidinia, D.M. Adamson, M. Chamberlin, and M.A. Burnam. Review and Evaluation of the Substance Abuse, Mental Health, and Homelessness Grant Formulas. Santa Monica, CA: RAND Corporation, 2019. https://www.rand.org/pubs/research_reports/RR2454.html.
EVALUATION OF THE CERTIFIED COMMUNITY BEHAVIORAL HEALTH CLINIC DEMONSTRATION PROGRAM
These reports were prepared under contract #HHSP233201600017I between HHS's ASPE/BHDAP and Mathematica Policy Research to conduct the national evaluation of the demonstration. For additional information about this subject, you can visit the BHDAP home page at https://aspe.hhs.gov/bhdap or contact the ASPE Project Officer, Judith Dey, at HHS/ASPE/BHDAP, Room 424E, H.H. Humphrey Building, 200 Independence Avenue, S.W., Washington, D.C. 20201. Her e-mail address is: Judith.Dey@hhs.gov.
Reports Available
Certified Community Behavioral Health Clinics Demonstration Program: Report to Congress, 2019
- HTML version: https://aspe.hhs.gov/basic-report/certified-community-behavioral-health-clinics-demonstration-program-report-congress-2019
- PDF version: https://aspe.hhs.gov/pdf-report/certified-community-behavioral-health-clinics-demonstration-program-report-congress-2019
Implementation Findings from the National Evaluation of the Certified Community Behavioral Health Clinic Demonstration
- HTML version: https://aspe.hhs.gov/report/implementation-findings-national-evaluation-certified-community-behavioral-health-clinic-demonstration
- PDF version: https://aspe.hhs.gov/pdf-report/implementation-findings-national-evaluation-certified-community-behavioral-health-clinic-demonstration
Preliminary Cost and Quality Findings from the National Evaluation of the Certified Community Behavioral Health Clinic Demonstration
- HTML version: https://aspe.hhs.gov/basic-report/preliminary-cost-and-quality-findings-national-evaluation-certified-community-behavioral-health-clinic-demonstration
- PDF version: https://aspe.hhs.gov/pdf-report/preliminary-cost-and-quality-findings-national-evaluation-certified-community-behavioral-health-clinic-demonstration