
Donna Rabiner, PhD, Janet O'Keeffe, PhD, and David Brown, MA
RTI International
This report was prepared under contract #HHS-100-97-0014 between the U.S. Department of Health and Human Services (HHS), Office of Disability, Aging and Long-Term Care Policy (DALTCP) and and RTI International. For additional information about this subject, you can visit the DALTCP home page at http://aspe.hhs.gov/_/office_specific/daltcp.cfm or contact the office at HHS/ASPE/DALTCP, Room 424E, H.H. Humphrey Building, 200 Independence Avenue, S.W., Washington, D.C. 20201. The e-mail address is: webmaster.DALTCP@hhs.gov. The Project Officer was Andreas Frank.
"
ACKNOWLEDGMENTS
Authors Contributions: Drs. Stewart and Ireys had full access to all the data used in this study and take responsibility for its integrity and the accuracy of the data analysis.
Study conception and design: Stewart, Zickafoose, Wu, Ireys, Brown
Acquisition of data: Stewart, Wu, Ireys
Analysis and interpretation of data: Stewart, Zickafoose, Wu, Ireys, Brown
Drafting of the manuscript: Stewart, Zickafoose, Ireys
Critical revision of the manuscript for important intellectual content: Stewart, Zickafoose, Wu, Ireys, Brown
Statistical analysis: Stewart, Ireys, Brown
Obtained funding: Brown, Ireys
Administrative, technical, or material support: Wu, Brown
Study supervision: Ireys, Brown
Funding Source: The analyses on which this article is based were performed under contract HHSP23320095642WC/HHSP23337010T, funded by the Office of the Assistant Secretary for Planning and Evaluation (ASPE).
Disclaimer: The content of this article does not necessarily reflect the views or policies of ASPE. We purchased data from the National Committee for Quality Assurance (NCQA) on practices and providers who obtained NCQA patient-centered medical home recognition. NCQA did not otherwise participate in the project and did not review or approve these analyses.
ABSTRACT
Importance: Since 2008, National Committee for Quality Assurance (NCQA) has offered patient-centered medical home (PCMH) recognition to practices that meet its requirements. Few studies have assessed the relationship between such recognition and health care use among children with special health care needs (CSHCN).
Objective: To evaluate whether Medicaid-enrolled CSHCN treated by NCQA-recognized providers (the "treatment group") had better utilization-related outcomes compared to similar children seeing other providers.
Design: Cross-sectional analyses versus two comparison groups. We identified CSHCN using Medicaid eligibility and claims data. We flagged NCQA-certified providers in Medicaid claims data using National Provider Identifier numbers obtained via NCQA. We attributed children to providers based on the volume of well-child, preventive care, evaluation and management services and other services. Children attributed to providers who received NCQA-recognition between 2008 and 2010 comprised the treatment group. Children attributed to providers who received NCQA-recognition in 2011 comprised the non-matched, "late recognition" comparison group. Children not attributed to recognized providers who were exact-matched to the treatment group children on demographics, diagnoses, prescription drugs, and number of months enrolled in Medicaid comprised a matched comparison group.
Setting: Louisiana, New Hampshire and Texas Medicaid.
Participants: CSHCN ages 0-18 years in fee-for-service Medicaid in 2010.
Exposure(s): Attribution to providers who received NCQA-recognition between 2008 and 2010.
Main Outcome Measures: Well-child visits, any emergency department (ED) and avoidable ED visits, hospitalizations and ambulatory care-sensitive hospitalizations, and follow-up after ED visits and hospitalizations.
Results: In Louisiana, there were no statistically significant differences in outcomes between the treatment group showing treatment group children received better care than either of the comparison groups. Furthermore, outcomes were actually significantly worse for the treatment group than for the matched comparison group for the three measures related to ED use or follow-up. In Texas, we found substantially higher rates of well-child visits and follow-up after ED visits for treatment group children than for children in the "late recognition" comparison group, but no differences between the treatment group and the matched comparison group for any outcomes. In New Hampshire, treatment group children were more likely to have follow-up after ED visits and well-child visits than children in either the matched or late recognition comparison groups. The treatment-comparison group odds ratios for any ED visits and preventable ED visits were less than 1.0 using either comparison group in New Hampshire, but neither difference was statistically significant. However, treatment group children in New Hampshire had a significantly higher rate of hospitalizations than the late recognition comparison group.
Conclusions and Relevance: We found no evidence to suggest that Medicaid-covered CSHCN attributed to NCQA PCMH-recognized providers had more favorable hospital or ED utilization patterns than comparison groups in any of the three states. However, in two of the three states (Texas and New Hampshire) CSHCN attributed to these recognized providers did have significantly higher probabilities of well-child visits and post-ED follow-up visits than comparison groups. NCQA-recognition may not signal high-quality primary care for Medicaid-covered CSHCN in all states, based on the measures used in this study, and parents and payers may need to assess other factors to identify high-quality providers.
ACRONYMS
The following acronyms are mentioned in this report and/or appendices.
| ACS | American Community Survey |
|---|---|
| ADHD | Attention Deficit Hyperactivity Disorder |
| AHRQ | Agency for Healthcare Research and Quality |
| AIDS | Acquired Immune Deficiency Syndrome |
| ASPE | Office of the Assistant Secretary for Planning and Evaluation |
| CDPS | Chronic Illness and Disability Payment System |
| CHIPRA | Children's Health Insurance Program Reauthorization Act |
| CI | Confidence Interval |
| CMC | Comprehensive Managed Care |
| CMS | Centers for Medicare and Medicaid Services |
| CNS | Central Nervous System |
| COPD | Chronic Obstructive Pulmonary Disease |
| CPT | Current Procedural Term |
| CSHCN | Children with Special Health Care Needs |
| E&M | Evaluation and Management |
| ED | Emergency Department |
| EPSDT | Early and Periodic Screening, Diagnosis, and Treatment |
| FFS | Fee-For-Service |
| FPL | Federal Poverty Level |
| GI | Gastrointestinal |
| HEDIS | Healthcare Effectiveness Data and Information Set |
| HIV | Human Immunodeficiency Virus |
| ICD-9 | International Classification of Diseases, 9th Revision |
| ICD-9-CM | International Classification of Diseases, 9th Revision-Clinical Modification |
| ID | Identification Number |
| IP | Inpatient |
| MAX | Medicaid Analytic eXtract |
| MAXPC | Medicaid Analytic eXtract Provider Characteristics |
| MSIS | Medicaid Statistical Information System |
| NCQA | National Committee for Quality Assurance |
| NPI | National Provider Identifier |
| NPPES | National Plan and Provider Enumeration System |
| NYU | New York University |
| OT | Other Services |
| PCMH | Patient-Centered Medical Home |
| POS | Place of Service |
| PPC | Physician Practice Connections |
| PS | Person Summary |
| QI | Quality Improvement |
| SES | Socioeconomic Status |
| TOS | Type of Service |
| UB | Uniform Billing |
INTRODUCTION
Children with special health care needs (CSHCN) often require specialized care from multiple health care providers in addition to preventive and primary care services (Van Dyck et al., 2004). Lack of coordination among providers and inadequate access to a "medical home" can place these children at high risk for adverse outcomes, including duplication of services, failure to receive necessary care, and increased use of emergency and inpatient services (Strickland et al., 2009). Although any practice that provides health care to children could serve as the child's medical home, in most cases it will be the primary care practices that play this role.
Preliminary evidence suggests that pediatric practices that have implemented components of a medical home provide better care to their patients compared with those without such components, at least on some dimensions. For example, Homer et al. (2008) reviewed over 30 studies of medical homes for CSHCN with varying study designs from randomized controlled trials to cross-sectional analyses; the authors found evidence that medical homes were consistently positively associated with timeliness of care, although evidence was mixed for other outcomes, such as effectiveness, efficiency, family centeredness, and functional status. In cross-sectional analyses, Cooley et al. (2009) reported that some medical home characteristics, such as strong chronic condition management, were correlated with fewer hospitalizations and emergency department (ED) visits. Various multi-payer initiatives now provide incentives for practices to become medical homes (Takach, 2011). Since 2008, the National Committee for Quality Assurance (NCQA) has recognized practices and providers who meet its standards for patient-centered medical homes (PCMHs) and submit required documentation and fees (NCQA, 2012). Although it is not the only PCMH program available, NCQA's initiative has a high profile and is widely used in many multi-payer initiatives (Takach, 2011). The number of NCQA-certified practices and providers increased from 28 and 214, respectively, in 2008 to 1,506 and 7,676, respectively, by the end of 2010 (NCQA 2011 PCMH Overview).
While the rapid growth in NCQA-recognition reflects a promising trend in pediatric care, there has been no direct test of the relationship between NCQA-recognition and patterns of health service use for Medicaid-enrolled CSHCN. We hypothesized that compared with CSHCN treated by providers who have not received NCQA medical home recognition, CSHCN treated by NCQA-recognized providers will have more well-child visits, fewer ED visits and hospitalizations as well as more comprehensive care coordination, measured by follow-up after ED visits and hospitalizations.
METHODS
Overview
This study evaluated the association between NCQA 2008 Physician Practice Connections®-Patient-Centered Medical Home (PPC-PCMHTM) recognition and health service use among Medicaid-enrolled CSHCN in 2010 using multiple comparison group analyses in three states.
Data Sources
This study uses primary and secondary data from multiple sources. We purchased primary data on practices and providers who received NCQA 2008 PCMH-recognition between November 2008 and October 2011 from NCQA. These files contained information on certification level, date of certification, and national provider identifier (NPI) and primary specialty for individual providers within each practice. We obtained secondary data from state Medicaid Analytic eXtract (MAX) 2008 and 2010 eligibility and claims files from the Centers for Medicare and Medicaid Services (CMS). These files contained data on our study populations, including demographics, diagnoses, and health care utilization. State MAX Provider Characteristics (MAXPC) files, also obtained from CMS, contained Medicaid provider identification numbers and NPIs that allowed us to link NPIs from NCQA data file to MAX claims data. We used the American Community Survey (ACS) 2006-2011 public use data file for data on zip code-level sociodemographic characteristics, including poverty, education, employment and languages spoken at home.
State Selection
To be included in this study, states needed to meet the following criteria: (1) relatively high numbers of NCQA-recognized child-serving providers, defined as providers with primary specialty related to pediatrics, family or general medicine; and (2) low penetration of Medicaid comprehensive managed care (CMC) because quality and completeness of MAX claims data for CMC enrollees is suspect. In addition, states had to have MAX 2008 and 2010 data available for analysis to allow for measurement of service use in 2010, and adjustment and matching on baseline service use in 2008 in sensitivity analyses. While seven states met the first two criteria, only three of these -- Louisiana, New Hampshire and Texas -- had 2010 MAX data available. (See Appendix A for additional details on analyses supporting state selection.)
Study Population
The study population included CSHCN age 0-18 years who were enrolled in fee-for-service (FFS) Medicaid in all enrolled months in 2010 and who did not spend more than 90 days in a hospital or long-term care facility. We identified CSHCN using criteria related to: (1) disability status; and (2) diagnoses suggesting a chronic health care need. Children with at least one month of Medicaid eligibility due to disability during 2010 were considered CSHCN. We assumed these children were likely Supplemental Security Income recipients who automatically qualified for Medicaid due to a disability that causes severe functional limitations and can result in death or is expected to last at least one year (Social Security Administration, 2013). In addition, we applied the Chronic Illness and Disability Payment System (CDPS) diagnosis-based software to 2010 MAX claims data (Kronick et al., 2000; Kronick et al., 2009). The CDPS software assigns children to any of 22 different condition categories, and within each condition category, to expected cost categories that may range from "extra high" to "super low" or "not well-defined." For this study, CSHCN included any child flagged in a CDPS condition and cost category, provided that they were not flagged in the pregnancy or low-birth weight categories and were not classified in the "super low," "extra low," or "not well-defined" cost categories within all other condition categories, as these may indicate patients with low complexity of disease and "rule-out" diagnoses, respectively.
Treatment and Comparison Group Assignment
We attributed CSHCN in our sample to the provider in 2010 who supplied the majority of well-child services, other preventive and primary care services, evaluation and management services, and other services that are likely coordinated by a medical home (see Appendix C for a list of diagnosis and procedure codes used for attribution). If there was no majority provider, we attributed children to the provider most recently visited. Over 90 percent and 80 percent of CSHCN in Louisiana and Texas, respectively, were attributed to a provider using this method. The treatment group was comprised of CSHCN attributed to the 114, 145 and 73 providers who received NCQA PCMH-recognition between 2008 and 2010 in Louisiana, New Hampshire and Texas, respectively (N=9,761 in Louisiana, N=4,090 in New Hampshire and N=1,174 in Texas).
We then constructed multiple comparison groups. The first group was a non-matched, "late recognition" comparison group comprised of CSHCN attributed to the 27, 54 and 100 providers who received NCQA PCMH-recognition between January and October 2011 in Louisiana, New Hampshire and Texas, respectively. The rationale for this comparison group was to include children cared for by providers who lagged the treatment group providers in being recognized for meeting NCQA requirements for being a PCMH, but who may have been similarly motivated to obtain it and may be similar to treatment group providers on unobservable characteristics. In addition, we constructed a matched comparison group from Medicaid-covered CSHCN within each of the three states who were not attributed to NCQA-recognized providers. For these matched comparison groups, we conducted exact-matching on age (in years), sex, number of months enrolled in Medicaid in 2010, and disability status, CDPS condition categories, and CDPS prescription drug categories in 2010. The CDPS prescription drug algorithm assigns children to any of 45 different drug categories based on national drug codes from prescription drug claims. We excluded 16 categories from our matching algorithm that either primarily affect the elderly, such as Alzheimer's or osteoporosis/Paget's, or that do not necessarily indicate special needs, such as drug categories for prenatal care, folate deficiency, gastric acid disorder, and infections. Prescriptions filled in any of the remaining 29 drug categories were included in our matching algorithm. We took all available exact-matches within strata, and weighted the comparison children in each stratum to reflect the number of treatment children. For example if three comparison children matched to one treatment child in one stratum, each comparison child received a weight of one-third. We matched 8,414, 3,023 and 968 treatment children in Louisiana, New Hampshire and Texas, respectively, comprising 75-85 percent of the treatment group children, to at least one comparison child each. These comparison children were not linked to particular providers.
Outcome Measures
This study used seven claims-based measures of service use and two claims-based measures of care coordination derived from the initial set of Children's Health Insurance Program Reauthorization Act (CHIPRA) core measures, National Quality Forum-endorsed measures, and widely used Healthcare Effectiveness Data and Information Set (HEDIS) measures. Appendix D provides detailed descriptions of the measure specifications. The following five measures related to service use: any well-child visit, any ED use, any preventable or avoidable ED use (NYU Wagner, 2013), any hospitalizations, and any ambulatory care-sensitive hospitalizations (AHRQ, 2012). Care coordination was measured based on follow-up within 30 days of an ED visit and follow-up within 30 days of a hospitalization. All outcomes were measured in 2010.
Control Variables
Control variables comprised the same set of demographic, Medicaid enrollment, and health status variables used in exact-matching algorithms described above. However, we categorized age based on ages 0-1, 2-5, 6-12 and 13-18 years, as preliminary analyses suggested better model fit with categorical age variables. Because the reliability of race and ethnicity data are unknown in MAX (Mathematica Policy Research, 2011) and there are few other variables on the MAX files related to socioeconomic status (SES) characteristics, we developed proxy measures of SES using zip code-level data from the ACS. These included measures of zip code-level race and ethnicity (percent Hispanic/Latino, percent non-Hispanic/Latino Black, percent non-Hispanic/Latino White, and all other), percent of individuals living in poverty, education levels among women aged 25 and older (percent with less than high school degree, high school degree, some college or college graduate and higher), and employment (percent of adults working full-time versus part-time or not at all).
Statistical Analysis
Our analytic samples included all "late recognition" and matched treatment and comparison children described above with non-missing zip code-level data from the ACS (less than 1 percent of CSHCN in both states had missing zip code data). To test whether CSHCN attributed to NCQA-recognized providers had different patterns of health care utilization than children in the "late recognition," non-matched comparison group, we fit logistic regression models for all our outcome measures by state, adjusting standard errors to account for clustering of children among providers. The only difference for the matched comparison group analyses was to fit weighted logistic regression models to account for multiple comparison children per treatment child. We assessed the magnitude and direction of the coefficients on treatment status, adjusted for control variables listed above, across both "late recognition" and matched comparison group models to assess the strength and consistency of the relationship between NCQA-recognition and the outcome variables. We fit separate models by state due to varying Medicaid programs and policies that may affect provider participation and beneficiary eligibility and enrollment.
To test the robustness of our findings, we tested our models on several subgroups. In matched analyses, we first limited the matched pairs to children residing in the same county to test whether our results are sensitive to treatment-comparison area differences in market area factors that could affect utilization and outcomes. Second, in both matched and "late recognition" analyses, we limited the samples to children ages 2-18 years who were enrolled in 2008 and 2010. The rationale for this subgroup was that by the follow-up year (2010), these children and their parents will be more receptive to changes in providers' practice patterns to improve health care delivery because they will have had more time to develop a relationship with their primary care provider; for the matched analyses, we revised our matching algorithm to include any well-child visits or any ED use in 2008 for this sub-group, and in both matched and "late recognition" sub-groups, we adjusted for any well-child visits, any ED visits and any hospitalizations in 2008 in our regression models. Finally, in the matched analyses, we assessed outcomes among the sub-group residing in the same county in 2010 and who were enrolled in Medicaid in 2008, matching on and adjusting for 2008 utilization as described above.
RESULTS
Sample Characteristics
There were 241,997, 28,797, and 389,932 CSHCN in FFS Medicaid and not living in institutional settings for more than 90 days in Louisiana, New Hampshire, and Texas, respectively, in 2010. Based on our measure for special health care needs, CSHCN comprised approximately 30 percent of the base Medicaid populations in all three states. Among CSHCN (children with a disability and/or a CDPS diagnosis) the proportion that had a disability varied widely across states -- ranging from 1 percent in New Hampshire, to 18 percent in Louisiana, to 31 percent in Texas. The variation in the proportion with at least one CDPS diagnosis was much narrower (90-100 percent). Variation in the percent of children with a disability in our samples across the three states is consistent with variation observed in the percent of children with disabilities in the overall Medicaid FFS population in each state (Appendix B).
Table 1 shows demographic characteristics, months of Medicaid enrollment, health status and zip code-level SES characteristics of treatment and comparison groups in Louisiana, New Hampshire and Texas. In Louisiana and Texas in the non-matched, "late recognition" analyses, there were more treatment group children in the younger age categories and more males, whereas in New Hampshire the overall age distribution between treatment and comparison was more balanced, although there were also more males in the treatment group. Also in the "late recognition" comparison group analyses in Texas, there were fewer children with Medicaid eligibility based on disabilities in the treatment group relative to the comparison group. Health status based on CDPS condition categories was generally similar for the "late recognition" comparison group analyses in all three states. Treatment group children in "late recognition" analyses in Louisiana lived in neighborhoods with higher percentage of Hispanic/Latino, White and other race residents compared to comparison group children. Treatment group children in Louisiana also lived in neighborhoods with lower rate of poverty and higher share or residents working full-time. SES characteristics were generally balanced in New Hampshire and Texas in "late recognition" analyses, although treatment group children lived in neighborhoods with a higher share of Hispanic residents and lower share of White residents in New Hampshire and treatment children in Texas resided in neighborhoods with higher share of White residents and lower share of Hispanic residents relative to the comparison group.
By design, the matched comparison groups in the three states were balanced on all demographic and health status variables (Table 1). Across zip code-level SES-related characteristics, treatment children in matched analyses in Louisiana lived in zip codes with a smaller share of White, non-Hispanic residents and a larger share of Black, non-Hispanic residents compared to the comparison group. Treatment group children in Texas lived in neighborhoods with a smaller fraction of Hispanic residents than the comparison group. Treatment group children also lived in neighborhoods with more women with college degrees or higher compared to children in the matched comparison group.
Most treatment providers in Louisiana had Level 1 recognition (79 percent), on a scale from 1-3 where practices with Level 1 recognition had fewer characteristics of a PCMH compared to practices at Level 2 or 3. Most of the "late recognition" comparison group providers in Louisiana (i.e., recognized in 2011) had Level 3 recognition (59 percent). All NCQA-recognized treatment and "late recognition" comparison providers in New Hampshire had Level 3 recognition. In Texas, all treatment providers had Level 3 recognition, but only a bare majority (56 percent) of comparison providers did.
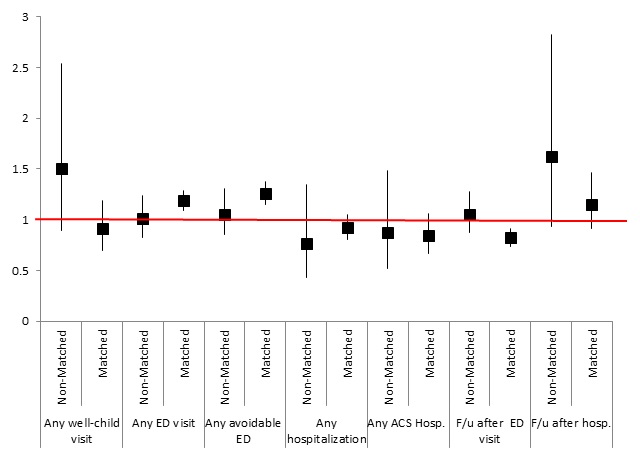
| FIGURE 1. Louisiana "Late Recognition" and Matched Comparison Group Analyses: Odds Ratios and 95% Confidence Intervals for Treatment vs. Comparison Group from Logistic Regression Models for Service Utilization and Care Coordinationa |
|---|
 |
NOTE:
|
| ALT TEXT for FIGURE 1, Scatter Chart: The x-axis of the figure displays outcome variables for both matched and non-matched analyses. Outcome variables are presented as follows from left to right across the x-axis: any well-child visit, non-matched analyses; any well-child visit, matched analyses; any ED visit, non-matched analyses; any ED visit, matched analyses; any avoidable ED visit, non-matched analyses; any avoidable ED visit, matched analyses; any ACS hospitalization, non-matched analyses; any ACS hospitalization, matched analyses; follow-up after ED visit, non-matched analyses; follow-up after ED visit, matched analyses; and follow-up after hospitalization, matched analyses. The y-axis conveys odds ratio and 95% confidence intervals; the y-axis number scale starts with zero at the intercept and 3 at the top. The figure presents odd ratios for the treatment group, defined as children attributed to NCQA recognized medical homes, versus comparison group. The odds ratios are presented as solid squares with vertical lines emanating from the squares that span the 95% confidence interval for each outcome measure. There is also a red horizontal line across the figure that corresponds to an odds ratio of one. If the odds ratio or the 95% confidence interval for any measure touches the horizontal line, then the difference in that outcome measure is not statistically significant between intervention and comparison groups. If the 95% confidence interval is above the red line, the intervention group has a statistically significant higher rate of that outcome compared with the comparison group, and if the 95% confidence interval is below the red line, the intervention group has a statistically significant lower rate of that outcome relative to the comparison group. In this figure, the 95% confidence intervals for all outcome measures touch the horizontal line, except for 2 measures whose odds ratios and confidence intervals were above the red line, indicating an odds ratio significantly greater than one. These 2 measures are "any ED visit, matched analyses," and "any avoidable ED visit, matched analyses." In addition, the odds ratio and confidence interval for "follow-up after ED visit, matched analyses" was below the red line, indicating an odds ratio significantly less than 1. Those interested in knowing the exact values of the odds ratios and 95% confidence intervals for all outcome measures may finds these values in Table 3. |
Louisiana Results
Descriptive, unadjusted analyses (Table 2) found several expected and unexpected differences between treatment and control groups in Louisiana. For example, relative to the "late recognition" comparison group, treatment group CSHCN had higher rates of any well-child visits (61 percent vs. 48 percent, p=0.02) and treatment group children with hospitalizations had higher rates of follow-up within 30 days (73 percent vs. 61 percent; p=0.03); however, in matched comparison group analyses, a greater percentage of the treatment group had any avoidable ED visit relative to the comparison group (40 percent vs. 35 percent; p<0.01), any ED visit (48 percent vs. 44 percent; p<0.01) and treatment group children with ED visits had lower rates of follow-up within 30 days (42 percent vs. 48 percent; p<0.01).
In multivariable regression results, few outcomes showed significant differences between the treatment group and both comparison groups (Figure 1), and all of them showed the treatment group to have worse outcomes than the comparison groups. In "late recognition" comparison group analyses, there were no treatment-comparison differences in any ED or any avoidable ED visits, but in matched comparison group analyses, treatment children were significantly more likely to have ED and avoidable ED visits (OR=1.19, 95% CI=(1.09, 1.29) and OR=1.26, CI=(1.15, 1.38), respectively). Treatment-comparison differences in outcomes related to care coordination suggested no statistically significant difference in follow-up within 30 days of an ED visit and follow-up within 30 days of hospitalization in "late recognition" analyses. Matched comparison group analyses suggested significantly lower odds of follow-up after ED visit (OR=0.82, 95% CI=(0.74, 0.91)) and no significant difference in follow-up after hospitalization.
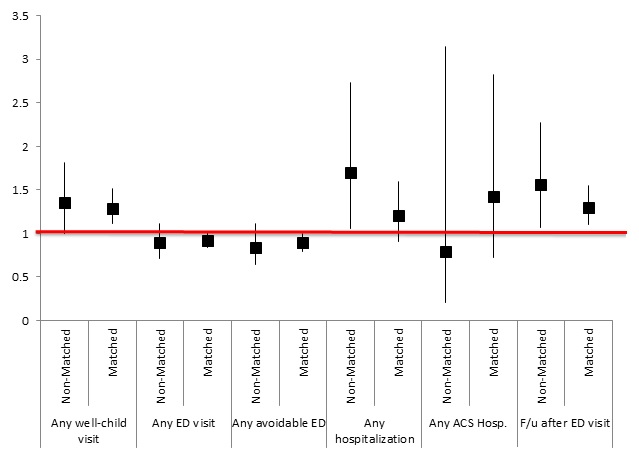
New Hampshire Results
Descriptive analyses in Table 2 show that relative to the "late recognition" comparison group, the treatment group was more likely to have a follow-up visit within 30 days of an ED visit (60 percent vs. 49 percent; p=0.01). In matched comparison group analyses, the treatment group was more likely than the comparison group to have a well-child visit (81 percent vs. 76 percent; p<0.01), less likely to experience any avoidable ED visit (28 percent vs. 30 percent; p=0.04) and more likely to receive follow-up after an ED visit (58 percent vs. 52 percent; p<0.01).
The regression analyses showed that treatment group children were significantly more likely than the "late recognition" comparison group to have a follow-up office visit after ED visits (OR=1.56, 95% CI=(1.07, 2.27)). The association between treatment group status and any well-child visits also suggested better outcomes for the treatment group, although the difference was borderline-significant in these analyses (OR=1.35, 95% CI=(1.00, 1.81)). However, the analysis also found the treatment group to be more likely to have an inpatient admission (OR=1.70, 95% CI=(1.06, 2.73)). The regression analysis comparing treatment group children to the matched comparison group supported the favorable findings on any well-child visits (OR=1.29, 95% CI=(1.11, 1.51) and follow-up within 30 days of ED visit (OR=1.30, 95% CI=(1.10, 1.55)) (Figure 2).
| FIGURE 2. New Hampshire "Late Recognition" and Matched Comparison Group Analyses: Odds Ratios and 95% Confidence Intervals for Treatment vs. Comparison Group from Logistic Regression Models for Service Utilization and Care Coordinationa |
|---|
 |
NOTE:
|
| ALT TEXT for FIGURE 2, Scatter Chart: The x-axis of the figure displays outcome variables for both matched and non-matched analyses. Outcome variables are presented as follows from left to right across the x-axis: any well-child visit, non-matched analyses; any well-child visit, matched analyses; any ED visit, non-matched analyses; any ED visit, matched analyses; any avoidable ED visit, non-matched analyses; any avoidable ED visit, matched analyses; any ACS hospitalization, non-matched analyses; any ACS hospitalization, matched analyses; follow-up after ED visit, non-matched analyses; and follow-up after ED visit, matched analyses. The y-axis conveys odds ratio and 95% confidence intervals; the y-axis number scale starts with zero at the intercept and 3.5 at the top. The figure presents odd ratios for the treatment group, defined as children attributed to NCQA recognized medical homes, versus comparison group. The odds ratios are presented as solid squares with vertical lines emanating from the squares that span the 95% confidence interval for each outcome measure. There is also a red horizontal line across the figure that corresponds to an odds ratio of 1. If the odds ratio or the 95% confidence interval for any measure touches the horizontal line, then the difference in that outcome measure is not statistically significant between intervention and comparison groups. If the 95% confidence interval is above the red line, the intervention group has a statistically significant higher rate of that outcome compared with the comparison group, and if the 95% confidence interval is below the red line, the intervention group has a statistically significant lower rate of that outcome relative to the comparison group. In this figure, the 95% confidence intervals for all outcome measures touch the horizontal line, except for three outcome measures, whose 95% confidence intervals are above the horizontal red line, indicating odds ratios significantly greater than 1. These 3 measures are "any well-child visit, matched analyses," "any hospitalization, non-matched analyses," and "follow-up after ED visit, non-matched and matched analyses." Those interested in knowing the exact values of the odds ratios and 95% confidence intervals for all outcome measures may finds these values in Table 4. |
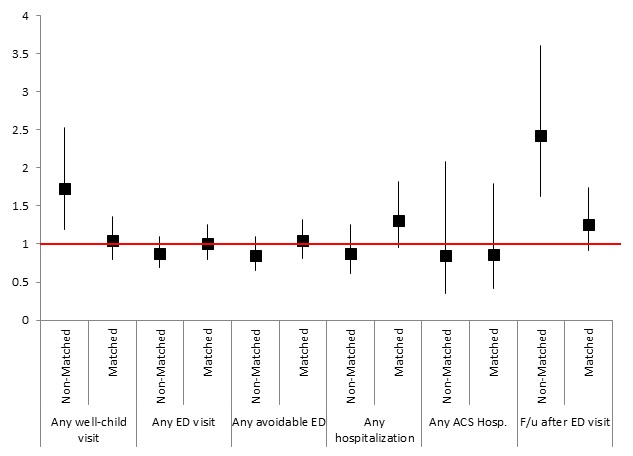
Texas Results
Descriptive, unadjusted results in Texas suggested that relative to the "late recognition" comparison group, treatment group children were more likely to have well-child visits (78 percent vs. 59 percent; p<0.01) and more likely to receive follow-up within 30 days of an ED visit (55 percent vs. 38 percent; p<0.01). There were no significant differences for any outcomes between treatment and comparison groups in matched analyses (Table 2).
In multivariable regression analyses, there were few statistically significant treatment-comparison differences in outcome measures (Figure 3). The treatment group had significantly higher odds of any well-child visit (1.73 (1.19, 2.53)) and follow-up after ED visit (2.42 (1.63, 3.61)) when compared to the "late recognition" comparison group, but these differences were not significant in the matched comparison group analyses.
| FIGURE 3. Texas "Late Recognition" and Matched Comparison Group Analyses: Odds Ratios and 95% Confidence Intervals for Treatment vs. Comparison Group from Logistic Regression Models for Service Utilization and Care Coordinationa |
|---|
 |
NOTE:
|
| ALT TEXT for FIGURE 3, Scatter Chart: The x-axis of the figure displays outcome variables for both matched and non-matched analyses. Outcome variables are presented as follows from left to right across the x-axis: any well-child visit, non-matched analyses; any well-child visit, matched analyses; any ED visit, non-matched analyses; any ED visit, matched analyses; any avoidable ED visit, non-matched analyses; any avoidable ED visit, matched analyses; any ACS hospitalization, non-matched analyses; any ACS hospitalization, matched analyses; follow-up after ED visit, non-matched analyses; and follow-up after ED visit, matched analyses. The y-axis conveys odds ratio and 95% confidence intervals; the y-axis number scale starts with zero at the intercept and 4 at the top. The figure presents odd ratios for the treatment group, defined as children attributed to NCQA recognized medical homes, versus comparison group. The odds ratios are presented as solid squares with vertical lines emanating from the squares that span the 95% confidence interval for each outcome measure. There is also a red horizontal line across the figure that corresponds to an odds ratio of one. If the odds ratio or the 95% confidence interval for any measure touches the horizontal line, then the difference in that outcome measure is not statistically significant between intervention and comparison groups. If the 95% confidence interval is above the red line, the intervention group has a statistically significant higher rate of that outcome compared with the comparison group, and if the 95% confidence interval is below the red line, the intervention group has a statistically significant lower rate of that outcome relative to the comparison group. In this figure, the 95% confidence intervals for all outcome measures touch the horizontal line, except for 2 measures, whose 95% confidence intervals are above the horizontal red line, indicating odds ratios significantly greater than one. These two measures are "any well-child visit, non-matched analyses" and "follow-up after ED visit, non-matched analyses." Those interested in knowing the exact values of the odds ratios and 95% confidence intervals for all outcome measures may finds these values in Table 5. |
Sensitivity Analyses
None of the sensitivity analyses changed our results in any meaningful way that would suggest either of the comparison approaches we used was biased. In sensitivity analyses in Louisiana, the direction and magnitude of coefficients on treatment status was similar to those from the basic model in both sensitivity analyses on the "late recognition" and matched comparison group analyses (Table 3). Specifically, there were no significant differences between treatment and comparison groups for any outcome measures in "late recognition" analyses, and in both base case and sensitivity analyses using matched samples, treatment children were significantly more likely to have any ED visit, any avoidable ED visit and less likely to have follow-up post-ED visit in almost all models. In matched sub-group analyses that included county as a matching variable, treatment children were significantly less likely to have any well-child visit. Sensitivity analyses in New Hampshire generally result in coefficients with similar magnitude and direction compared to the base case analyses, although there are fewer statistically significant findings in sub-group analyses, likely due to reduced power in the sub-group analyses (Table 4). Sub-group analyses in Texas generally result in similar findings as base case analyses, with the exception of the sensitivity analysis on matched comparison group where we matched on county of residence in 2010 (Table 5). In this sensitivity analysis, treatment group children become significantly less likely to have a well-child visit relative to comparison group children (0.66 (0.44, 0.99)), whereas in the basic model there was no significant treatment-comparison difference in any well-child visit.
| TABLE 1. Characteristics of Children with Disabilities and Special Health Care Needs Attributed to NCQA-Recognized and Comparison Providers, by State and Comparison Group | ||||||||||||
|---|---|---|---|---|---|---|---|---|---|---|---|---|
| Non-Matched, "Late Recognition" Comparison Group Analyses | Matched Comparison Group Analyses | |||||||||||
| Louisiana | New Hampshire | Texas | Louisiana | New Hampshire | Texas | |||||||
| Treatment Group 1a | Comparison Group 1b | Treatment Group 1a | Comparison Group 1b | Treatment Group 1a | Comparison Group 1b | Treatment Group 2c | Comparison Group 2d | Treatment Group 2c | Comparison Group 2d | Treatment Group 2c | Comparison Group 2d | |
| Providers (N) | 114 | 27 | 145 | 54 | 73 | 100 | 111 | 2,856 | 141 | 1,180 | 57 | 5,568 |
| Children (N) | 9,761 | 1,343 | 4,090 | 777 | 1,174 | 1,006 | 8,412 | 126,856 | 2,937 | 10,574 | 968 | 59,622 |
| Weighted Children (N) | N/A | N/A | N/A | N/A | N/A | N/A | 8,412 | 8,336 | 2,937 | 2,929 | 968 | 961 |
| Demographic Characteristics | ||||||||||||
| Age (%) | ||||||||||||
| 0-1 year | 17 | 11 | 13 | 16 | 15 | 11 | 17 | 18 | 12 | 12 | 16 | 16 |
| 2-5 years | 22 | 19 | 18 | 15 | 26 | 17 | 23 | 23 | 19 | 18 | 26 | 27 |
| 6-12 years | 37 | 34 | 39 | 36 | 41 | 42 | 37 | 37 | 41 | 42 | 42 | 42 |
| 13-18 years | 24 | 35 | 30 | 32 | 18 | 30 | 22 | 22 | 28 | 28 | 16 | 16 |
| Male (%) | 57 | 54 | 60 | 54 | 59 | 57 | 57 | 57 | 60 | 60 | 59 | 60 |
| Months Enrolled (mean) | 11.4 | 11.5 | 11.1 | 11.0 | 10.5 | 10.5 | 11.5 | 11.5 | 11.5 | 11.5 | 10.6 | 10.6 |
| Medicaid Eligibility based on Disability (%) | 19 | 20 | <1 | <1 | 25 | 48 | 16 | 16 | <1 | <1 | 21 | 21 |
| Health Status | ||||||||||||
| CDPS Condition Categories (%) | ||||||||||||
| Cardiovascular | 6 | 6 | 4 | 5 | 8 | 5 | 4 | 4 | 3 | 3 | 6 | 5 |
| Psychiatric | 33 | 33 | 56 | 50 | 34 | 35 | 33 | 32 | 59 | 60 | 35 | 34 |
| Skeletal | 8 | 9 | 10 | 10 | 9 | 9 | 7 | 7 | 7 | 7 | 7 | 7 |
| CNS | 6 | 6 | 6 | 4 | 9 | 12 | 4 | 4 | 3 | 3 | 5 | 5 |
| Pulmonary | 41 | 38 | 27 | 32 | 41 | 33 | 41 | 42 | 26 | 26 | 41 | 41 |
| GI | 13 | 11 | 10 | 12 | 11 | 13 | 12 | 12 | 8 | 8 | 8 | 8 |
| Diabetes | 1 | 2 | 1 | 2 | 1 | 1 | <1 | 1 | <1 | <1 | <1 | <1 |
| Renal | <1 | <1 | <1 | <1 | <1 | <1 | <1 | <1 | <1 | <1 | <1 | <1 |
| Substance Abuse | <1 | 1 | 1 | 2 | <1 | <1 | <1 | <1 | <1 | <1 | <1 | <1 |
| Cancer | <1 | <1 | <1 | <1 | 1 | <1 | <1 | <1 | <1 | <1 | <1 | <1 |
| Developmental Disability | 2 | 2 | 2 | 2 | 3 | 5 | <1 | <1 | <1 | <1 | 1 | 1 |
| Metabolic | 2 | <1 | 2 | 1 | 2 | 2 | 1 | 1 | <1 | <1 | 1 | 1 |
| Cerebrovascular | <1 | <1 | <1 | <1 | 1 | 1 | <1 | <1 | <1 | <1 | <1 | <1 |
| Hematological | 3 | 2 | 1 | 2 | 3 | 1 | 2 | 2 | <1 | <1 | 1 | 1 |
| Infectious/ AIDS | 6 | 3 | 3 | 4 | 4 | 4 | 6 | 6 | 2 | 2 | 3 | 3 |
| Zip-Code Level Socioeconomic Characteristics (mean) | ||||||||||||
| Hispanic/Latino | 5 | 2 | 4 | 2 | 20 | 30 | 5 | 4 | 4 | 4 | 20 | 46 |
| White, Non-Hispanic/Latino | 48 | 45 | 90 | 95 | 58 | 49 | 48 | 56 | 90 | 91 | 58 | 41 |
| Black, Non-Hispanic/Latino | 42 | 50 | 2 | 1 | 19 | 18 | 42 | 37 | 2 | 1 | 19 | 11 |
| All Other, Non-Hispanic/Latino | 4 | 2 | 4 | 3 | 3 | 3 | 4 | 3 | 4 | 4 | 3 | 3 |
| Poverty: Household income <100% FPL | 22 | 26 | 10 | 10 | 17 | 19 | 22 | 21 | 10 | 10 | 17 | 23 |
| Women with Less than High School Education | 18 | 20 | 10 | 11 | 17 | 22 | 18 | 19 | 10 | 10 | 17 | 27 |
| Women with High School Graduate | 33 | 36 | 31 | 32 | 29 | 29 | 33 | 36 | 32 | 32 | 29 | 29 |
| Women with Some College | 22 | 21 | 20 | 20 | 25 | 24 | 22 | 21 | 20 | 20 | 25 | 22 |
| Women with College Degree or Higher | 27 | 23 | 39 | 38 | 28 | 25 | 27 | 24 | 39 | 38 | 28 | 22 |
| Worked full-time, year round | 45 | 41 | 51 | 50 | 47 | 47 | 45 | 45 | 51 | 51 | 47 | 44 |
| SOURCE: Mathematica Policy Research analyses of 2010 MAX data linked to NCQA data on recognized medical home providers and ACS files for zip code-level characteristics. NOTES: Demographic and health status characteristics of children were measured in 2010. Zip code-level characteristics were obtained from the ACS 2007-2011 public use files. Available at: http://www.census.gov/acs/www/. Accessed March 28, 2013.
| ||||||||||||
| TABLE 2. Unadjusted Rates of Service Utilization and Care Coordination of Children Attributed to NCQA-Recognized and Comparison Providers (%) | ||||||||||||
|---|---|---|---|---|---|---|---|---|---|---|---|---|
| Non-Matched, "Late Recognition" Comparison Group Analyses | Matched Comparison Group Analyses | |||||||||||
| Louisiana | New Hampshire | Texas | Louisiana | New Hampshire | Texas | |||||||
| Treatment Group 1a | Comparison Group 1b | Treatment Group 1a | Comparison Group 1b | Treatment Group 1a | Comparison Group 1b | Treatment Group 2c | Comparison Group 2d | Treatment Group 2c | Comparison Group 2d | Treatment Group 2c | Comparison Group 2d | |
| Service Utilization | ||||||||||||
| Any well-child visit | 61 | 48 | 80 | 76 | 78 | 59 | 61 | 63 | 81 | 76 | 78 | 79 |
| Any ED visits | 49 | 48 | 40 | 45 | 43 | 44 | 48 | 44 | 38 | 40 | 42 | 37 |
| Any avoidable ED visits | 41 | 39 | 30 | 35 | 35 | 34 | 40 | 35 | 28 | 30 | 34 | 29 |
| Any inpatient admission | 8 | 9 | 5 | 4 | 10 | 9 | 7 | 7 | 3 | 3 | 7 | 6 |
| Any ambulatory care-sensitive admissions | 1 | 1 | <1 | <1 | 1 | 1 | 1 | 1 | <1 | <1 | 1 | 1 |
| Care Coordination | ||||||||||||
| Follow-up ambulatory visit within 30 days of ED visit | 44 | 40 | 60 | 49 | 55 | 38 | 42 | 48 | 58 | 52 | 52 | 51 |
| Follow-up ambulatory visit within 30 days of inpatient admission | 73 | 61 | 87 | 79 | ---e | ---e | 72 | 69 | 84 | 77 | ---e | ---e |
| SOURCE: Mathematica Policy Research analyses of 2010 MAX data linked to NCQA data on recognized medical home providers and ACS files for zip code-level characteristics. NOTES: Outcomes were measured in 2010.
Significantly different from comparison group in unadjusted models that account for clustering of children among providers at the 0.01 level, two-tailed test. | ||||||||||||
| TABLE 3. Louisiana Sensitivity Analyses: Odds Ratios and 95% Confidence Intervals for Treatment vs. Comparison Group from Logistic Regression Models for Service Utilization and Care Coordination Compared to Base Case | |||||||
|---|---|---|---|---|---|---|---|
| Logistic Model 1: Any Well-Child Visitsa | Logistic Model 2: Any ED Visitsa | Logistic Model 3: Any Avoidable ED Visitsa | Logistic Model 4: Any Inpatient Admissionsa | Logistic Model 5: Any ACS Admissionsa | Logistic Model 6: Any Follow-Up Within 30 Days of ED Visita | Logistic Model 7: Any Follow-Up Within 30 Days of Hospitalizationa | |
| Non-Matched, "Late Recognition" Comparison Group Analyses | |||||||
| Base Caseb | 1.50 (0.89, 2.54) | 1.01 (0.82, 1.24) | 1.05 (0.85, 1.31) | 0.76 (0.43, 1.35) | 0.87 (0.52, 1.48) | 1.05 (0.87, 1.28) | 1.62 (0.93, 2.83) |
| Sensitivity Analysis #1: Limit to children age 2-18 enrolled in Medicaid in 2008. Adjusted for 2008 utilization (any ED visits, hospitalizations, and well-child visits) in all models | 1.25 (0.78, 2.02) | 0.91 (0.76, 1.09) | 0.95 (0.79, 1.15) | 0.69 (0.43, 1.12) | 0.70 (0.36, 1.34) | 0.96 (0.78, 1.18) | 1.45 (0.76, 2.73) |
| Matched Comparison Group Analysis: Odds Ratio for Treatment vs. Comparison | |||||||
| Base Caseb | 0.91 (0.70, 1.19) | 1.19 (1.09, 1.29) | 1.26 (1.15, 1.38) | 0.92 (0.80, 1.05) | 0.84 (0.67, 1.06) | 0.82 (0.74, 0.91) | 1.15 (0.91, 1.46) |
| Sensitivity Analysis #1: Matched on county | 0.73 (0.57, 0.93) | 1.18 (1.07, 1.30) | 1.23 (1.11, 1.36) | 1.10 (0.93, 1.29) | 1.18 (0.88, 1.57) | 0.80 (0.71, 0.90) | 1.19 (0.86, 1.75) |
| Sensitivity Analysis #2: Limited to children ages 2-18, adding any ED visits and well-child visits in 2008 to matching algorithm. Adjusted for 2008 utilization (any ED visits, hospitalizations, and well-child visits) in all models | 0.90 (0.69, 1.18) | 1.12 (1.02, 1.24) | 1.17 (1.06, 1.29) | 0.82 (0.67, 0.99) | 0.89 (0.66, 1.21) | 0.83 (0.73, 0.94) | 1.16 (0.78, 1.70) |
| Sensitivity Analysis #3: Limited to children ages 2-18, adding any ED visits and well-child visits in 2008 to matching algorithm. Also added county of residence in 2010 to matching algorithm. Adjusted for 2008 utilization (any ED visits, hospitalizations and well-child visits) in all models | 0.72 (0.56, 0.92) | 1.09 (0.96, 1.22) | 1.14 (1.01, 1.29) | 0.93 (0.72, 1.20) | 1.04 (0.66, 1.65) | 0.96 (0.83, 1.12) | 0.71 (0.39, 1.28) |
NOTES:
| |||||||
| TABLE 4. New Hampshire Sensitivity Analyses: Odds Ratios and 95% Confidence Intervals for Treatment vs. Comparison Group from Logistic Regression Models for Service Utilization and Care Coordination Compared to Base Case | ||||||
|---|---|---|---|---|---|---|
| Logistic Model 1: Any Well-Child Visitsa | Logistic Model 2: Any ED Visitsa | Logistic Model 3: Any Avoidable ED Visitsa | Logistic Model 4: Any Inpatient Admissionsa | Logistic Model 5: Any ACS Admissionsa | Logistic Model 6: Any Follow-Up Within 30 Days of ED Visita | |
| Non-Matched, "Late Recognition" Comparison Group Analyses | ||||||
| Base Caseb | 1.35 (1.00, 1.81) | 0.89 (0.71, 1.11) | 0.84 (0.64, 1.11) | 1.70 (1.06, 2.73) | 0.79 (0.20, 3.15) | 1.56 (1.07, 2.27) |
| Sensitivity Analysis #1: Limit to children age 2-18 enrolled in Medicaid in 2008. Adjusted for 2008 utilization (any ED visits, hospitalizations, and well-child visits) in all models | 1.25 (0.88, 1.77) | 0.94 (0,72, 1.22) | 0.90 (0.66, 1.21) | 1.40 (0.71, 2.76) | --- | 1.48 (0.93, 2.36) |
| Matched Comparison Group Analysis: Odds Ratio for Treatment vs. Comparison | ||||||
| Base Caseb | 1.29 (1.11, 1.51) | 0.92 (0.84, 1.02) | 0.89 (0.79, 1.00) | 1.21 (0.91, 1.60) | 1.42 (0.72, 2.82) | 1.30 (1.10, 1.55) |
| Sensitivity Analysis #1: Matched on county | 1.20 (1.01, 1.42) | 0.94 (0.83, 1.06) | 0.91 (0.78, 1.05) | 0.85 (0.60, 1.22) | 1.31 (0.64, 2.71) | 1.31 (0.19, 9.02) |
| Sensitivity Analysis #2: Limited to children ages 2-18, adding any ED visits and well-child visits in 2008 to matching algorithm. Adjusted for 2008 utilization (any ED visits, hospitalizations, and well-child visits) in all models | 1.27 (1.08, 1.49) | 0.94 (0.84, 1.05) | 0.89 (0.79, 1.01) | 1.27 (0.93, 1.75) | --- | 1.10 (0.93, 1.31) |
| Sensitivity Analysis #3: Limited to children ages 2-18, adding any ED visits and well-child visits in 2008 to matching algorithm. Also added county of residence in 2010 to matching algorithm. Adjusted for 2008 utilization (any ED visits, hospitalizations and well-child visits) in all models | 1.15 (0.96, 1.37) | 0.97 (0.85, 1.11) | 0.93 (0.80, 1.08) | 0.93 (0.61, 1.40) | --- | 1.09 (0.90, 1.32) |
NOTES:
| ||||||
| TABLE 5. Texas Sensitivity Analyses: Odds Ratios and 95% Confidence Intervals for Treatment vs. Comparison Group from Logistic Regression Models for Service Utilization and Care Coordination Compared to Base Case | ||||||
|---|---|---|---|---|---|---|
| Logistic Model 1: Any Well-Child Visitsa | Logistic Model 2: Any ED Visitsa | Logistic Model 3: Any Avoidable ED Visitsa | Logistic Model 4: Any Inpatient Admissionsa | Logistic Model 5: Any ACS Admissionsa | Logistic Model 6: Any Follow-Up Within 30 Days of ED Visita | |
| Non-Matched, "Late Recognition" Comparison Group Analyses | ||||||
| Base Caseb | 1.73 (1.19, 2.53) | 0.87 (0.69, 1.10) | 0.85 (0.65, 1.10) | 0.88 (0.61, 1.26) | 0.85 (0.35, 2.08) | 2.42 (1.63, 3.61) |
| Sensitivity Analysis #1: Limit to children age 2-18 enrolled in Medicaid in 2008. Adjusted for 2008 utilization (any ED visits, hospitalizations and well-child visits) in all models | 1.87 (1.22, 2.88) | 0.89 (0.69, 1.15) | 0.86 (0.62, 1.19) | 0.91 (0.59, 1.40) | --- | 2.41 (1.52, 3.83) |
| Matched Comparison Group Analysis: Odds Ratio for Treatment vs. Comparison | ||||||
| Base Caseb | 1.04 (0.79, 1.36) | 1.00 (0.80, 1.25) | 1.04 (0.81, 1.32) | 1.31 (0.95, 1.82) | 0.86 (0.41, 1.80) | 1.26 (0.91, 1.74) |
| Sensitivity Analysis #1: Matched on county | 0.68 (0.46, 0.98) | 0.82 (0.64, 1.05) | 0.83 (0.63, 1.11) | 1.55 (1.00, 2.41) | --- | 1.77 (1.13, 2.79) |
| Sensitivity Analysis #2: Limited to children ages 2-18, adding any ED visits and well-child visits in 2008 to matching algorithm. Adjusted for any ED, any hospitalization, and any well-child visits in 2008 in all models | 1.13 (0.83, 1.54) | 1.06 (0.83, 1.36) | 1.08 (0.83, 1.41) | 1.70 (1.09, 2.66) | --- | 1.36 (0.99, 1.87) |
NOTES:
| ||||||
COMMENT
We found little evidence to suggest that Medicaid-covered CSHCN attributed to NCQA PCMH-recognized providers had utilization patterns consistently suggestive of higher quality care in Louisiana or Texas. In Louisiana, there were a few statistically significant differences between treatment and comparison groups in "late recognition" non-matched comparison group analyses. In matched comparison group analyses in Louisiana, findings typically suggested worse outcomes for the treatment group. In Texas, we found evidence of better outcomes related to well-child visits and follow-up after ED visits for treatment group children when compared to the "late recognition" comparison group, but comparisons of the treatment group to the matched comparison group showed no treatment-comparison differences for any outcomes. Findings in New Hampshire appeared more favorable for CSHCN attributed to NCQA-recognized providers for several measures. In "late recognition" and matched analyses, treatment group children were more likely to have follow-up after ED visits. Treatment group CSHCN were significantly more likely to receive any well-child visits in matched analyses; the magnitude and direction of the well-child visit odds ratio was similar, although only borderline-significant in "late recognition" analyses. In both sets of analyses, the odds ratios for ED visits and potentially avoidable ED visits for treatment group were less than one in all base case and sensitivity analyses, although not statistically significant. However, treatment children in New Hampshire were more likely to have any inpatient admissions in "late recognition" analyses.
The lack of consistent positive findings across all three states -- and especially the few significant adverse findings in Louisiana -- was unexpected, based on literature that suggests positive impacts of medical homes for pediatric patients in general (Aysola, 2012; Arauz Boudreau, 2012; Romaire, 2012a) and CSHCN specifically (Homer, 2008; Arauz Boudreau, 2012; Hamilton, 2012). Similar to our findings, one recent study found few meaningful differences in health services utilization when comparing CSHCN with and without a medical home (Romaire, 2012b). However, these studies measure the medical home based on parent-reported survey measures, which differs fundamentally from the NCQA practice recognition measure used in this study. Little is known about the relationship between parent-reported survey measures of the medical home and practice-based PCMH-recognition. Given that practice-based PCMH-recognition, especially the NCQA program, is currently the predominant approach used in programs and policies promoting the medical home model, it is important to begin linking such recognition to objective outcome measures.
There may be multiple explanations for our findings. In New Orleans, efforts to rebuild the primary care infrastructure after Hurricane Katrina included financial incentives for practices to transform into PCMHs and bonus payments for obtaining NCQA PCMH-recognition. However, a recent study found that practice-reported performance on various medical home processes declined as grant funding dried up in 2010 (Rittenhouse et al., 2012). The decline in performance among NCQA-recognized safety-net providers in New Orleans could explain our negative findings in Louisiana. In contrast, approximately two-thirds of treatment group providers in New Hampshire were affiliated with Dartmouth-Hitchcock medical center, a major medical center that has resources to invest in its primary care clinics. Primary care providers affiliated or owned by major medical centers may also have more opportunity to learn from each other through system-wide quality-improvement efforts. The affiliation with a major medical center may also explain the increased likelihood of hospitalization among treatment children in New Hampshire.
Another potential explanation for our lack of consistent findings across states is that NCQA-recognized providers might implement practice services that are more likely to be effective for the commercially-insured or relatively healthy pediatric patients that make up the majority of children in most primary care practices, and that similar analyses on commercially-insured populations in all three states might find consistently positive results. This phenomenon would suggest providers may need to improve activities surrounding patient-engagement and activation among Medicaid CSHCN populations and better understand family-related barriers to improved health care utilization and outcomes (Zickafoose, 2011; Coker, 2009). A related explanation for more positive findings in New Hampshire may be a function of the relative homogeneity of the population in terms of race and ethnicity, whereby NCQA-recognized providers are not hampered by lack of cultural competency that might be present in practices that serve more heterogeneous populations (Betancourt et al., 2003; Brach & Fraserirector, 2000). It also is possible that practices seeking NCQA-recognition do so because they are aware of deficiencies in their internal practices or especially challenging patient populations that lead to poor outcomes and can use the recognition process as an external impetus to improve the quality of care delivered to their patients. Our analyses also relied on 2010 data, and providers in our treatment group included those obtaining recognition during 2010. It may be that NCQA-recognized providers need more time to demonstrate improvements. However, a companion study of providers at NCQA-recognized practices found recognition was formal acknowledgement of most processes that were already in place (Petersen et al., 2013).
Lastly, it is possible that NCQA PCMH-recognition is an inadequate indicator for primary care practices with the services and processes that might be effective in improving care, as measured by the outcomes used in this study, for CSHCN in Medicaid programs. The companion study of NCQA-recognized providers noted that CSHCN are a diverse population with varying needs that may not conform to standard protocols (Petersen et al., 2013). Another qualitative study of an early NCQA-recognized PCMH practice found that transformation into a patient-centered practice and NCQA PCMH-recognition were distinct concepts (Dohan et al., 2013).
There are some important limitations to our study. NCQA-recognition is based on a wide range of practice services and processes, and we had no data on the relative strengths and weaknesses of the providers in NCQA-recognized practices on the specific NCQA dimensions. For example, children attributed to providers in recognized practices that scored highly on after-hours access might have different health care utilization patterns compared to children attributed to providers whose medical homes focused more on implementation of electronic health records. However, most providers in NCQA-recognized practices in Louisiana had Level 1 recognition compared to providers in New Hampshire and Texas who primarily had Level 3 recognition, yet we better outcomes in New Hampshire, but not Texas.
We measured only a few claims-based outcomes related to PCMHs. It is possible that NCQA-recognized providers score higher on other outcomes measures, including those related to patient satisfaction and experience and other measures of clinical quality of care. In both "late recognition" and matched comparison group analyses in Louisiana and Texas, it is possible that there are unobserved differences, or selection bias, between treatment and comparison groups that drive our results. For example, we had no reliable data on race and ethnicity and previous studies show racial differences in ED use and other services (Flores, 2010; Raphael, 2001; Stewart et al., 2010). The relatively small number of providers in NCQA-recognized practices in the states reduced our power to detect effects, particularly in Texas. It also is unclear how generalizable these findings are to other states. Additional studies evaluating the association between NCQA-recognition and outcomes are warranted.
This study used both program eligibility criteria and the CDPS to identify CSHCN. Studies that used other methods might have different results. The CDPS casts a wide net of conditions, but may include children who might not be classified as having special health care needs with other methods. This may also explain the higher rate of CSHCN in our study compared to recent survey-based estimates (Bethell et al., 2008). For example, it may include children who receive a rule-out diagnosis. Finally, we wanted to evaluate the association between NCQA-recognition and outcomes among the subset of CSHCN with disabilities (Davis & Brosco, 2007), but these analyses would likely be underpowered.
This is the first study we are aware of to evaluate the association between NCQA-recognition and health care utilization among Medicaid-covered CSHCN. Within-state findings were generally robust to the use of two types of comparison groups and multiple sensitivity analyses. Our findings suggest that NCQA-recognition does not uniformly indicate higher quality for CSHCN covered by Medicaid. It is likely that other state-specific and provider-specific factors, such as payment rates, quality-improvement activities, and the socioeconomic composition of practice panels, are important determinants of quality, as measured in this study.
REFERENCES
Agency for Healthcare Research and Quality. "AHRQ Quality Indicators: Quality Indicator User Guide: Pediatric Quality Indicators (PDI) Composite Measures, Version 4.4." Prepared by Battelle, March 2012. Available at: http://www.qualityindicators.ahrq.gov/Downloads/Modules/PDI/V44/Composi…. Accessed April 25, 2013.
Arauz Boudreau A.D., Van Cleave J.M., Gnanasekaran S.K., Kurowski D.S., Kuhlthau K.A. "The Medical Home: Relationships with Family Functioning for Children with and without Special Health Care Needs." Academic Pediatrics, 2012; 12(5):391-8.
Aysola J., Bitton A., Zaslavsky A.M, Ayanian J.Z. "Quality and Equity of Primary Care with Patient Centered Medical Homes: Results from a National Survey." Medical Care, 2013; 51(1): 68-77.
Betancourt J.R., Green A.R., Carillo J.E., Ananeh-Firempong O. "Defining Cultural Competence: A Practical Framework for Addressing Racial/Ethnic Disparities in Health and Health Care." Public Health Reports, 2003; 118(4): 293-302.
Bethell C.D., Read D., Blumberg S.J., Newacheck P.W. "What is the Prevalence of Children with Special Health Care Needs? Toward an Understanding of Variations in Findings and Methods across Three National Surveys." Maternal and Child Health Journal, 2008; 12(1): 1-14.
Brach C., Fraserirector I. "Can Cultural Competency Reduce Racial and Ethnic Health Disparities? A Review and Conceptual Model." Medical Care Research and Review, 2000; 57(Supplement 1): 181-217.
Coker T.R., Chung P.J., Cowgill B.O., Chen L., Rodriguez M.A. "Low-Income Parents' Views on the Redesign of Well-Child Care." Pediatrics, 2009; 124(1): 194-2014.
Cooley W.C., McAllister J.W., Sherrieb K., Kuhlthau K. "Improved Outcomes Associated with Medical Home Implementation in Pediatric Primary Care." Pediatrics, 2009; 124(1): 358-364.
Davis M.M., Brosco J.P. "Being Specific about Being Special: Defining Children's Conditions and Special Health Care Needs." Archives Pediatrics & Adolescent Medicine, 2007; 161(10): 1003-5.
Dohan D., McCuistion M.H., Frosch D.L., Hung D.Y., Tai-Seale M. "Recognition as a Patient-Centered Home: Fundamental or Incidental?" Annals of Family Medicine, 2013; 11: S14-S18.
Flores G., Committee on Pediatric Research. "Racial and Ethnic Disparities in the Health and Health Care of Children." Pediatrics, 2010; 125(4): e979-e1020.
Hamilton L.J., Lerner C.F., Presson A.P., Klitzner T.S. "Effects of a Medical Home Program for Children with Special Health Care Needs on Parental Perceptions of Care in an Ethnically Diverse Patient Population." Maternal and Child Health Journal, 2012; 17(3): 463-9.
Homer C.J., Klatka K., Romm D., Kuhltau K., Bloom S., Newaheck P., Van Cleave J., Perrin J.M. "A Review of the Evidence for the Medical Home for Children with Special Health Care Needs."Pediatrics, 2008; 122(4): e922-e937.
Kronick R., Bella M., Gilmer T.P. "The Faces of Medicaid III: Refining the Portrait of People with Multiple Chronic Conditions." Center for Health Care Strategies, Inc. Available at: http://www.chcs.org/publications3960/publications_show.htm?doc_id=10584…. Accessed April 25, 2013.
Kronick R., Gilmer T., Dreyfus T., Lee L. "Improving Health-based Payments for Medicaid Beneficiaries: CDPS." Health Care Financing and Review, 2000; 21(3): 29-64.
Mathematica Policy Research. "Medicaid Analytic Extract (MAX) Person Summary (PS) Record Layout and Description, 2008." Submitted to the CMS, October 21, 2011. Available at: http://www.cms.gov/Research-Statistics-Data-and-Systems/Computer-Data-and-Systems/MedicaidDataSourcesGenInfo/MAXGeneralInformation.html. Accessed April 17, 2013.
NCQA's 2008 PPC®-PCMHTMprogram includes nine standards: (1) Access and Communication; (2) Patient Tracking and Registry Functions; (3) Care Management; (4) Patient Self-Management Support; (5) Electronic Prescribing; (6) Test Tracking; (7) Referral Tracking; (8) Performance Reporting and Improvement; and (9) Advanced Electronic Communications. Level 1 certification requires a minimum score on five of ten "must-pass" elements within standards 1-4 and 6-8. Levels 2 and 3 certification require minimum scores on all ten of ten "must-pass" elements in addition to scoring points on other PCMH factors within the various standards (Level 3 requires more points on other factors than Level 2). NCQA has since updated its standards for the 2011 PCMH program to include six standards and six "must-pass" elements. However, all providers and practices in the current study received 2008 certification. Additional detail can be found on the NCQA website, available at http://www.ncqa.org/tabid/631/Default.aspx. Accessed June 25, 2012.
"NCQA 2011 PCMH Overview." Available at http://www.ncqa.org/tabid/631/default.aspx. Accessed May 30, 2012
New York University, Wagner. "Background/Introduction on Algorithm to Help Classify ED Utilization." 2013. Available at: http://wagner.nyu.edu/faculty/billings/nyued-background.php. Accessed April 25, 2013.
Petersen D., Zickafoose J., Hossain M., Ireys H. "Physician Perspectives on the Influence of Medical Home Recognition on Practice Transformation and Care Quality of Children with Special Health Care Needs." Draft Manuscript, 2013.
Porterfield S.L., DeRigne L. "Medical Home and Out-of-Pocket Costs for Children with Special Health Care Needs." Pediatrics, 2011; 128(5): 892-900.
Raphael J.L., Zhang Y., Liu, H., Tapia C.D., Giardino A.P. "Association of Medical Home Care and Disparities in Emergency Care Utilization among Children with Special Health Care Needs." Academic Pediatrics, 2009; 9(4): 242-8.
Rittenhouse D.R., Schmidt L.A., Wu K.J., Wiley J. "The Post-Katrina Conversion of Clinics in New Orleans to Medical Homes Shows Change is Possible, but Hard to Sustain." Health Affairs, 2012; 31(8): 1729-37.
Romaire M.A., Bell J.F., Grossman D.C. "Health Care Use and Expenditures Associated with Access to the Medical Home for Children and Youth." Medical Care, 2012; 50(3): 262-9.
Romaire M.A., Bell J.F., Grossman D.C. "Medical Home Access and Health Care Use and Expenditures among Children with Special Health Care Needs." Archives of Pediatrics and Adolescent Medicine, 2012; 166(4): 323-330.
Stewart K.A., Higgins P.C., McLaughlin C.G., Williams T.V., Granger E., Croghan T.W. "Differences in Prevalence, Treatment and Outcomes of Asthma among a Diverse Population of Children with Equal Access to Care: Findings from a Study in the Military Health System." Archives of Pediatrics and Adolescent Medicine, 2010: 164(8): 720-726.
Strickland B.B., Singh G.K., Kogan M.D., Mann M.Y., van Dyck P.C., Newacheck, P.W. "Access to Medical Home: New Findings from the 2005-2006 National Survey of Children with Special Needs." Pediatrics, 2009, 123(6): 996-1004
Takach M. "Reinventing Medicaid: State Innovations to Qualify and Pay for Patient-Centered Medical Homes Show Promising Results." Health Affairs, 2011; 7: 1325-1334.
U.S. Social Security Administration. "Supplemental Security Income Eligibility Requirements." Available at: http://www.ssa.gov/ssi/text-eligibility-ussi.htm. Accessed April 4, 2013.
Van Dyck P.C., Kongan M.D., McPherson M., Weissman G, Newacheck P.W. "Prevalence and Characteristics of Children with Special Health Care Needs." Archives of Pediatric and Adolescent Medicine, 2004, 158(4): 884-890
Zickafoose J.S., Gebremariam A., Clark S.J., Davis M.M. "Medical Home Disparities Between Children With Public and Private Insurance." Academic Pediatrics, 2011; 11(4): 305-310.
NOTES
-
See http://wagner.nyu.edu/faculty/billings/nyued-background.php . Accessed April 16, 2013.
APPENDIX A: State Selection
We first assessed the number of NCQA-recognized child-serving pediatric practices and providers in each state. To identify child-serving providers, we merged the NCQA provider-level data, by NPI, to CMS' National Plan and Provider Enumeration System (NPPES) file. The NCQA file contained data on the specialty of most providers in the data set, but data were missing for approximately 20 percent of the sample. We compared the specialty as provided by NCQA with the primary specialty as reported in the NPPES file, and flagged those NCQA-recognized providers as serving children if either NCQA or NPPES primary specialty variables included the term "pediatric" in the specialty field, or if both variables reported any of the following: "general/family practice," "family medicine," or "general practice." We considered the top 15 states with the greatest number of NCQA-recognized child-serving providers as candidate states for these analyses. To help reduce the number of states for the feasibility analysis, we also assessed the penetration of CMC among Medicaid enrollees. Because beneficiaries enrolled in CMC may not have their complete claims data included in the Medicaid Statistical Information System (MSIS) and MAX files, our feasibility analysis and the full study will include only FFS enrollees.
Appendix Table A.1 lists the states in order by the number of NCQA-recognized providers. The top 15 states included New York, Pennsylvania, North Carolina, Texas, Wisconsin, Washington, Colorado, Michigan, Maine, Connecticut, New Hampshire, Ohio, Massachusetts, Rhode Island, and Louisiana. We initially excluded New York, Pennsylvania, Washington, Ohio, Michigan, Connecticut, Massachusetts and Rhode Island from consideration because too many children were enrolled in CMC. We excluded North Carolina, as we learned the servicing provider ID field on Medicaid claims data did not identify all services provided by individual providers and we would not be able to identify most NCQA-recognized providers in the data. We also excluded states that did not have 2010 MAX data available, including Wisconsin, Colorado, New Hampshire, Maine, Massachusetts, Rhode Island, and Michigan.
| TABLE A.1. Number of Child-Serving Providers and Practices in All States | ||||
|---|---|---|---|---|
| Child-Serving Providers (N) |
Child-Serving Practices (N) |
Comprehensive Managed Care Programs in Candidate States |
Reason for Exclusion from Study |
|
| Candidate States: Top 15 States with NCQA-Certified Providers | ||||
| New York | 1,711 | 513 | Approximately 60% of disabled children and 86% of non-disabled children in managed carea | High penetration of managed care |
| Pennsylvania | 733 | 202 | Approximately 70% of disabled and non-disabled children in managed carea | High penetration of managed care |
| North Carolina | 588 | 148 | No children enrolled in managed carea | Data problems with Medicaid servicing provider ID |
| Texas | 431 | 110 | Approximately 50% non-disabled children in CMCa | |
| Wisconsin | 422 | 113 | Approximately 54% all Medicaid beneficiaries (children and adults) in CMCb | 2010 MAX data unavailable |
| Washington | 368 | 44 | Approximately 87% of non-disabled children in managed carea | High penetration of managed care |
| Colorado | 330 | 51 | Approximately 9% of disabled children, 13% of non-disabled, and 5% of foster care children in managed carea | 2010 MAX data unavailable |
| Michigan | 300 | 99 | Approximately 68% of Medicaid beneficiaries enrolled in CMCb | High penetration of managed care and 2010 MAX data unavailable |
| Maine | 239 | 72 | No children enrolled in CMCa | 2010 MAX data unavailable |
| Connecticut | 233 | 71 | Approximately 58% of all Medicaid beneficiaries (children and adults) inCMCb | High penetration of managed care |
| New Hampshire | 206 | 40 | No children enrolled in CMCa | |
| Ohio | 188 | 52 | Approximately 86% of all Medicaid beneficiaries (children and adults) in CMCb | High penetration of managed care |
| Massachusetts | 159 | 29 | Approximately 64% of all Medicaid beneficiaries (children and adults) in CMCb | High penetration of managed care and 2010 MAX data unavailable |
| Rhode Island | 143 | 34 | Approximately 70% of disabled children and 87% of non-disabled children in CMCa | High penetration of managed care and 2010 MAX data unavailable |
| Louisiana | 132 | 48 | No children enrolled in CMCa | |
| Non-Candidate States (Too Few NCQA-Certified Providers and Practices) | ||||
| Vermont | 129 | 37 | N/R | |
| Virginia | 128 | 28 | N/R | |
| California | 110 | 16 | N/R | |
| Minnesota | 107 | 21 | N/R | |
| Missouri | 107 | 25 | N/R | |
| South Carolina | 106 | 26 | N/R | |
| New Jersey | 105 | 36 | N/R | |
| Arizona | 104 | 32 | N/R | |
| Tennessee | 104 | 39 | N/R | |
| Hawaii | 100 | 22 | N/R | |
| Florida | 88 | 50 | N/R | |
| New Mexico | 75 | 13 | N/R | |
| Maryland | 69 | 19 | N/R | |
| West Virginia | 56 | 20 | N/R | |
| Illinois | 51 | 17 | N/R | |
| Arkansas | 44 | 2 | N/R | |
| Nevada | 42 | 11 | N/R | |
| District of Columbia | 36 | 7 | N/R | |
| Alabama | 34 | 10 | N/R | |
| Oregon | 27 | 6 | N/R | |
| Montana | 26 | 4 | N/R | |
| Georgia | 23 | 1 | N/R | |
| Indiana | 21 | 6 | N/R | |
| Nebraska | 13 | 4 | N/R | |
| Kansas | 10 | 3 | N/R | |
| Iowa | 10 | 2 | N/R | |
| Arkansas | 9 | 2 | N/R | |
| Delaware | 7 | 2 | N/R | |
| Kentucky | 4 | 2 | N/R | |
| Mississippi | 4 | 1 | N/R | |
| Idaho | 2 | 1 | N/R | |
NOTES:
|
||||
APPENDIX B: Prevalence of Children with Special Health Care Needs in Louisiana, New Hampshire and Texas Fee-For-Service Medicaid Populations, 2010
| Louisiana | New Hampshire | Texas | ||||
|---|---|---|---|---|---|---|
| N | % | N | % | N | % | |
| All FFS Kids age 0-18 not residing in long-term care and/or IP facility for 90+ days | 767,530 | 100.0% | 95,909 | 100.0% | 1,299,210 | 100.0% |
| Disabled | 42,881 | 5.6% | 201 | 0.2% | 119,706 | 9.2% |
| CDPS Condition Categories (includes children with disabilities) | ||||||
| In at least one CDPS condition category | 225,921 | 29.4% | 28,749 | 30.0% | 350,080 | 26.9% |
| No CDPS condition category | 541,609 | 70.6% | 67,160 | 70.0% | 949,130 | 73.1% |
| Disabled and CDPS status | ||||||
| Disabled + CDPS condition category | 26,805 | 3.5% | 153 | 0.2% | 79,854 | 6.1% |
| Disabled + no CDPS condition | 16,076 | 2.1% | 48 | 0.1% | 39,852 | 3.1% |
| Non-disabled + CDPS condition category | 199,116 | 25.9% | 28,596 | 29.8% | 270,226 | 20.8% |
| Non-disabled + no CDPS condition | 525,533 | 68.5% | 67,112 | 70.0% | 909,278 | 70.0% |
| CSHCN: disabled and/or in at least one CDPS condition category | 241,997 | 31.5% | 28,797 | 30.0% | 389,932 | 30.0% |
APPENDIX C: CPT and ICD-9-CM Codes Used in Attribution Algorithms
| CPT Code | Definition |
|---|---|
| Well-Child Visits | |
| Procedure Codes | 99381-99385, 99391-99395, 99432, 99461 |
| ICD-9-CM Diagnosis Codes | V20.2, V20.3, V70.0, V70.3, V70.5, V70.6, V70.8, V70.9 |
| Other Preventive and Primary Care Services | |
| Procedure Codes | 99401-99404, 99411, 99412, 99420, 99429, 99406-99409, 96110, 96111, 99441-99444, 99339, 99340, 99173, 99174, 92551, 92552, 92567, 90460, 90461, 90471-90474 |
| ICD-9-CM Diagnosis Codes | V64.00, V64.01, V64.02, V64.03, V64.04, V64.05, V64.06, V64.08 |
| Evaluation and Management Services | |
| Procedure Codes | 99201-99205, 99211-99215, 99341-99345, 99347-99350, T1015 |
| Other Services Likely Coordinated by Medical Home | |
| Procedure Codes | 95115, 95117, 99366, 99367, 94005, 99600-99602, 92506, 98966-98969, 99502 |
APPENDIX D: Specifications for Outcome Measures
1. Preventive Care Measures: Wellness Visits
Inclusion Criteria: For children under a year old at the end of the measurement year, all those continuously enrolled since 31 days after birth with no more than one gap in enrollment of 45 days or less. For children between the ages of one and 18 at the end of the measurement year, all those continuously enrolled for the full year with no more than one gap in enrollment of 45 days or less.
Exclusion Criteria: In MAX OT claims files, exclude lines with a CPT code between 70000 and 89999 (lab and imaging claims).
| TABLE D.1. Number of Expected EPSDT Wellness Visits During Year, by Child Age | |
|---|---|
| Age at End of Measurement Year | Number of Expected Visits |
| 1 month | Excluded |
| 2 - 3 months | 1 visit |
| 4 - 5 months | 2 visits |
| 6 - 8 months | 3 visits |
| 9 - 11 months | 4 visits |
| 12 - 13 months | 5 visits |
| 14 months | 4 visits |
| 15 months | 5 visits |
| 16 - 20 months | 4 visits |
| 21 - 26 months | 3 visits |
| 27 - 35 months | 2 visits |
| 36 months - 18 years | 1 visit |
| SOURCE: Bright Futures Periodicity Schedule for EPSDT Visits. | |
For all children, assess whether they had at least one well-child visit during the year. For children ages 0-35 months, calculate the share of expected wellness visits that occurred in the past year. If the number of well-child visits exceeds the expected number of well-child visits, as identified in Table D.1 for any given child, replace proportion with 100 percent.
| TABLE D.2. CPT and ICD-9 Diagnosis Codes for Well-Baby, Well-Child, and Well-Adolescent Visitsa | ||
|---|---|---|
| CPT Codes (OT file) |
ICD-9 Diagnosis Codes (OT file) |
|
| Well-Baby Visits | 99381, 99382, 99391, 99392, 99432, 99461 | V20.2, V20.3, V70.0, V70.3, V70.5, V70.6, V70.8, V70.9 |
| Well-Child Visits | 99382, 99383, 99392, 99393 | V20.2, V70.0, V70.3, V70.5, V70.6, V70.8, V70.9 |
| Well-Adolescent Visits | 99383-99385, 99393-99395 | V20.2, V70.0, V70.3, V70.5, V70.6, V70.8, V70.9 |
| SOURCE: CHIPRA Core Measures 10, 11, and 12. Note that lab and imaging claims (based on procedure codes) and types of service that indicate a non-professional claim are NOT considered in identifying well-baby, well-child, or well-adolescent visits. NOTE:
|
||
2. Any Emergency Department Visits
This measure counts all ED visits, except those for mental health or substance abuse treatment. It also eliminates double-counting by only counting only one ED claim per child per day, regardless of the number of claims that the visit generated. Note that any claim meeting an exclusion criteria means the entire ED visit for that day should be excluded, even if other claims for that child on that day meet the inclusion criteria without meeting any of the exclusion criteria.
| TABLE D.3. Identifying ED Visits in MAX IP and OT Claims Files | ||
|---|---|---|
| Inclusions | Exclusions | |
| CPT code | 99281-99285 | 90801-90899 |
| UB revenue code | 045x, 0981 | |
| CPT code AND POS | (CPT code 10040-69979) AND POS of 23 | |
| Principal diagnosis code | 290-316, 960-979 | |
| Secondary diagnosis code | 291-292, 303-305 | |
| ICD-9 procedure code | 94.26, 94.27, 94.6 | |
| Other | Do not count more than 1 visit per child per day, regardless of the number of claims | |
| SOURCE: CHIPRA Core Measure 18. | ||
3. Any Preventable or Avoidable ED Visits
Using the NYU Algorithm,1 count any ED visit (identified using the inclusion and exclusion criteria in Table III.7) where the diagnosis code has a 70 percent or greater chance of being: (1) non-emergent; (2) emergent but primary care treatable; or (3) emergent but preventable or avoidable. These are cases where NE+EPCT+EDCNPA>0.7 in the algorithm output. Additionally, count any ED visit where the primary diagnosis matches one of the diagnosis codes in Table D.4, even if it is not preventable in the NYU algorithm. If there are multiple claims for an ED visits in a single day (for example, both professional and facility claims relating to the same visit), then use the diagnosis codes on the facility claim (TOS=11) to determine whether the visit was preventable. (However, if only professional claims are available for the visit on that day, use the diagnosis codes on those claims.) Only one claim per ED visit should be evaluated in determining whether the visit was preventable.
| TABLE D.4. Pediatric Diagnoses Indicating Potential Avoidable ED Visit | |
|---|---|
| Condition | ICD-9-CM Diagnosis Code |
| Asthma | 493 (include all 493.xx) |
| Influenza, other viral symptoms | 079, 480, 487, 780 |
| Otitis media | 381, 382, 384, 385 |
| Allergic symptoms (including skin) | 471, 472, 477, 690, 691, 692, 693, 695 |
| Minor muscular/skeletal or sports injury | 840, 841, 842, 843, 844, 845, 846, 847, 848, 910, 911, 913, 914, 915, 916, 917, 918, 919, 923, 924, 955, 956 |
| Preventive, immunization, or well-child care | V03, V04, V05, V06, V07, V20, V67, V68, V69, V70 |
| SOURCE: Eyal Ben-Isaac, Sheree Schrager, Matthew Keef, and Alex Chen. "National Profile of Non-emergent Pediatric Emergency Department Visits." Pediatrics, 2010, 125: 454. | |
4. Any Inpatient Admissions
Using MAX IP file, de-duplicate interim claims with the same admission date, provider ID, and child ID (the end of service date may vary). Create flag for any inpatient admission. Exclude all stays for newborn infants and all mental health and substance abuse stays, identified using the diagnosis codes in Table D.5.
| TABLE D.5. Exclusions for Inpatient Stay Counts | ||
|---|---|---|
| Condition | ICD-9-CM Diagnosis Code | Diagnosis Position |
| Liveborn infants | V30-V39 | Primary diagnosis |
| Health status codes | V87-V91 | Primary diagnosis |
| Mental health condition | 290-316 | Primary diagnosis |
| Poisoning/overdose with alcohol or drug dependence or abuse | 960-979 (primary) with 291-292 or 303-305 (secondary) | Primary diagnosis with secondary diagnosis |
| SOURCE: HEDIS 2010 Inpatient Utilization measure. | ||
5. Number of Ambulatory Care-Sensitive Inpatient Admissions
Inclusion Criteria: All children aged 3 months or older.
Using MAX IP file, de-duplicate interim claims with the same admission date, provider ID, and child ID (the end of service date may vary). Exclude all stays for newborn infants and all mental health and substance abuse stays, identified using the diagnosis codes in Table D.5. Create flag for ambulatory care-sensitive inpatient admissions where inpatient claims meet the inclusion and exclusion criteria in Table D.6. Evaluate each claim for each of the four types of admissions separately; an exclusion diagnosis or procedure means that claim should not be count towards the specific type of admission in the row but does not mean the claim might not count towards a different type of ambulatory care-sensitive admission. The inclusion and exclusion diagnoses refer to primary diagnoses except where otherwise noted. The child must be at least as old as the minimum age specified at the time of the claim in order for that claim to be counted.
| TABLE D.6. Inclusion and Exclusion Criteria for Ambulatory Care-Sensitive Inpatient Admissions | ||||
|---|---|---|---|---|
| Type of Admission | Inclusion Diagnoses | Exclusion Diagnoses | Exclusion Procedure Codes | Minimum Age at Time of Claim |
| Asthma admissions | 493.00-493.02, 493.10-493.12, 493.20-493.22, 493.81, 493.82, 493.90-493.92 | 277.00-277.09, 516.61-516.69, 747.21, 748.3, 748.4, 748.5, 748.6, 748.8, 748.9, 750.3, 759.3, 770.7 | 2 years | |
| Diabetes short-term complication admissions | 250.10-250.13, 250.20-250.23, 250.30-250.33 | 5 years | ||
| Urinary tract infection admission | 590.1, 590.11, 590.2, 590.3, 590.8, 590.81, 590.9, 595.0, 599.0 | 593.70-593.73, 753.0, 753.10-753.17, 753.19, 753.20-753.23, 753.29, 753.3, 753.4, 753.5, 753.6, 753.8, 753.9, (any diagnosis of 571.2 or 571.5 or 571.6 AND any diagnosis of 572.2 or 572.4) | 335, 336, 375, 410, 505.1, 505.9, 528.0-528.3, 528.5, 528.6, 556.9 | 3 months |
| Gastroenteritis admissions | 008.61-008.69, 008.8, 009.0-009.3, 558.9 as primary diagnosis OR (276.50-276.52 as primary diagnosis AND 008.61-008.69, 008.8, 009.0-009.3, 558.9 as secondary diagnosis) | 535.70, 535.71, 538, 555.0-555.9, 556.0-556.9, 558.1-558.3, 558.41, 558.42, 579.0-579.9, 003.0, 004.0-004.3, 004.8, 004.9, 005.0-005.4, 005.8, 005.81, 005.89, 005.9, 006.0- 006.2, 007.0-007.5, 007.8, 007.9, 008.00-008.04, 008.09, 008.1-008.4, 008.41-008.47, 008.49, 008.5, 112.85 | 3 months | |
| SOURCE: AHRQ QI, Pediatric Quality Indicators Overall Composite #90. | ||||
6. Follow-Up Ambulatory Visit within 30 Days of ED Visit
For all kids with at least one ED visit between January and November, count the number of ED visits where the child was still enrolled in Medicaid in the next month. Note that the denominator is the number of ED visits in the first 11 months of the year and not the number of children. Count the number of ED visits in the denominator that were followed within 30 days by a non-inpatient visit to any provider in the OT file, identified in one of two ways: (1) using both the type of service (TOS) and place of service (POS) as shown in Table D.7. To be included, a claim must match to at least one of the TOS values AND one of the POS values. Exclude lab/imaging claims (CPT codes 70000-89999). Or (2) using procedure codes that represent ambulatory E&M visits and POS as shown in Table D.7a. To be included, a claim must match to at least one procedure code AND one of the POS values. Exclude lab/imaging claims.
| TABLE D.7. Inclusions for Follow-Up Visit | ||
|---|---|---|
| Type of Service | AND ANY: | Place of Service |
| 08 (physician services) | 05-08 (Indian Health Service or tribal facilities) | |
| 10 (other licensed practitioners) | 11 (office) | |
| 12 (clinic services) | 12 (home) | |
| 13 (home health services) | 22 (outpatient hospital) | |
| 33 (rehabilitative services) | 26 (military treatment facility) | |
| 34 (physical or occupational therapy) | 34 (hospice) | |
| 35 (hospice services) | 49 (independent clinic) | |
| 36 (nurse midwife) | 50 (federally-qualified health center) | |
| 37 (nurse practitioner) | 72 (rural health clinic) | |
7. Follow-Up Ambulatory Care Visit within 30 Days of Inpatient Admission
For all kids with at least one inpatient hospital visit between January and November, count the number of visits where: (1) the child was still enrolled in Medicaid in the next month; (2) the child was discharged home (exclude transfers); and (3) there is not another inpatient admission within 30 days of discharge. Count the number of inpatient stays in the denominator that were followed within 30 days by a non-inpatient visit to any provider in the OT file, identified using both the TOS and POS as shown in Table D.7 and Table D.7a. To be included, a claim must match to at least one of the values AND one of the POS values.
| TABLE D.7a. Inclusions for Follow-Up Visit | ||
|---|---|---|
| CPT Code | AND ANY: | Place of Service |
| 99201-99215 | 05-08 (Indian Health Service or tribal facilities) | |
| 99241-99245 | 11 (office) | |
| 99341-99350 | 12 (home) | |
| 99381-99429 | 22 (outpatient hospital) | |
| 90281-99091 | 26 (military treatment facility) | |
| 99500-99607 | 34 (hospice) | |
| 49 (independent clinic) | ||
| 50 (federally-qualified health center) | ||
| 72 (rural health clinic) | ||