
U.S. Department of Health and Human Services
Assessing the Appeal of the Cash and Counseling Demonstration in Arkansas, New Jersey and Florida
Stacy Dale, Randall Brown, and Rachel Shapiro
Mathematica Policy Research, Inc.
July 2005
PDF Version (56 PDF pages)
This report was prepared under contract #HHS-100-95-0046 between the U.S. Department of Health and Human Services (HHS), Office of Disability, Aging and Long-Term Care Policy (DALTCP) and the University of Maryland. For additional information about the study, you may visit the DALTCP home page at http://aspe.hhs.gov/_/office_specific/daltcp.cfm or contact the ASPE Project Officer, Pamela Doty, at HHS/ASPE/DALTCP, Room 424E, H.H. Humphrey Building, 200 Independence Avenue, SW, Washington, DC 20201. Her e-mail address is: Pamela.Doty@hhs.gov.
TABLE OF CONTENTS
Covered Services
Target Populations and Eligibility
Outreach and Enrollment
Research Hypotheses and Rationale
Methods
Results
Discussion
REASONS BENEFICIARIES AGREED OR DECLINED TO PARTICIPATE
Research Hypotheses and Rationale
Methods
Results
Discussion
DEMONSTRATION EFFECTS ON THE NUMBER OF NEW SERVICE USERS
Research Hypotheses and Rationale
Methods
Results
Discussion
APPENDICES
APPENDIX A: Additional Results
APPENDIX B: Sample Copy of the Participation Questionnaire
LIST OF FIGURES AND TABLES
FIGURE 1: Cumulative Enrollment in the Cash and Counseling Demonstration and Evaluation, by Month
FIGURE 2: Ratios of New PCS Users to All PCS Users, by Month: Arkansas
FIGURE 3: Ratios of New PCS Users to All PCS Users, by Month: New Jersey
FIGURE 4a: Ratios of New HCBS Users to All HCBS Users, by Month: Florida Children
FIGURE 4b: Ratios of New HCBS Users to All HCBS Users, by Month: Florida Nonelderly Adults
FIGURE 4c: Ratios of New HCBS Users to All HCBS Users, by Month: Florida Elderly Adults
TABLE 1: Claims-Based Variables Constructed for the Participation Analysis
TABLE 2: Percent of Medicaid Beneficiaries Who Participated in Cash and Counseling, Among Known Eligibles
TABLE 3: Estimated Effects of Observable Characteristics on Whether Eligible Medicaid Beneficiaries Participated in the Cash and Counseling Demonstration, by State
TABLE 4: Main Reasons for Agreeing to Participate, by State
TABLE 4a: Main Reasons for Agreeing to Participate, by Age and PCS Tenure: Arkansas
TABLE 4b: Main Reasons for Agreeing to Participate, by Age and HCBS Tenure: Florida
TABLE 4c: Main Reasons for Agreeing to Participate, by Age and PCS Tenure: New Jersey
TABLE 5: Main Reasons for Declining to Participate, by State
TABLE 5a: Main Reasons for Declining to Participate, by Age and PCS Tenure: Arkansas
TABLE 5b: Main Reasons for Declining to Participate, by Age and HCBS Tenure: Florida
TABLE 5c: Main Reasons for Declining to Participate, by Age and PCS Tenure: New Jersey
TABLE A.1: Characteristics of Cash and Counseling Participants and Nonparticipants, by State
TABLE A.1a: Characteristics of Cash and Counseling Participants and Nonparticipants, by Age Group: Florida
TABLE A.2: Item Response in the Participation Questionnaire, by Whether Participated and State
TABLE A.3: Characteristics of Questionnaire Respondents, by Whether Participated and State
TABLE A.4: Participation Decision Makers, by Whether Participated and State
TABLE A.5: How Respondents Learned About the Demonstration, by Whether Participated and State
TABLE A.6: Number of New Users and All Users of PCS or HCBS Services, by State
ACKNOWLEDGMENTS
This report has benefited greatly from the thoughtful comments and suggestions of several people. In particular, we appreciate input from external reviewers Francis Caro (Gerontology Institute, University of Massachusetts) and Jane Tilly (The Alzheimer's Association). Several members of the Cash and Counseling Demonstration and Evaluation management team--Kevin Mahoney, Lori Simon-Rusinowitz, Marie Squillace, and members of the staff of the Centers for Medicare & Medicaid Services (CMS)--provided useful comments. We also appreciate comments from the Florida Agency for Persons with Disabilities and the Consumer Directed Care Plus program in the Florida Department of Elder Affairs.
Several colleagues at Mathematica Policy Research, Inc. made the report possible. Kate Scheppke and Amy Zambrowski programmed the analysis, and Valerie Cheh provided comments on an earlier draft. The report was produced by Jill Miller.
The opinions presented here are those of the authors and do not necessarily reflect those of the funders (the Robert Wood Johnson Foundation and the U.S. Department of Health and Human Services, Office of the Assistant Secretary for Planning and Evaluation), the Cash and Counseling National Program Office, CMS, or the demonstration states.
EXECUTIVE SUMMARY
The Introduction of a New Model of Medicaid Supportive Services
Medicaid beneficiaries who have disabilities and qualify for assistance with such basic activities as eating, bathing, dressing, and fixing meals typically receive these supportive services through a Medicaid state plan, as personal care services (PCS), or through a Medicaid waiver program, as home- and community-based services (HCBS). By contrast, the Cash and Counseling Demonstration and Evaluation, implemented in Arkansas, Florida, and New Jersey, offered eligible Medicaid beneficiaries the opportunity to receive a monthly allowance to purchase supportive services as they saw fit. Cash and Counseling is intended improve beneficiaries' satisfaction and quality of life by increasing their control over supportive services.
When Arkansas, New Jersey, and Florida began implementing their five-year demonstration programs, in 1998, 1999, and 2000, respectively, they attempted to inform all eligible beneficiaries of the opportunity to participate through some combination of direct mailings, telephone calls, and home visits. The states' enrollment policies helped avert the enrollment of beneficiaries who wished to receive the monthly allowance but would not otherwise use PCS or HCBS (despite being eligible). Florida and New Jersey restricted enrollment to beneficiaries who were already using demonstration-covered services or, in New Jersey's case, had at least been assessed for such services. Although Arkansas enrolled beneficiaries not already using PCS, it required such beneficiaries to agree to pursue PCS from an agency in the event they were randomly assigned to the demonstration control group. In addition, the terms and conditions of the demonstration specified that ratios of new to continuing service users among demonstration participants were not to exceed historic benchmark ratios.
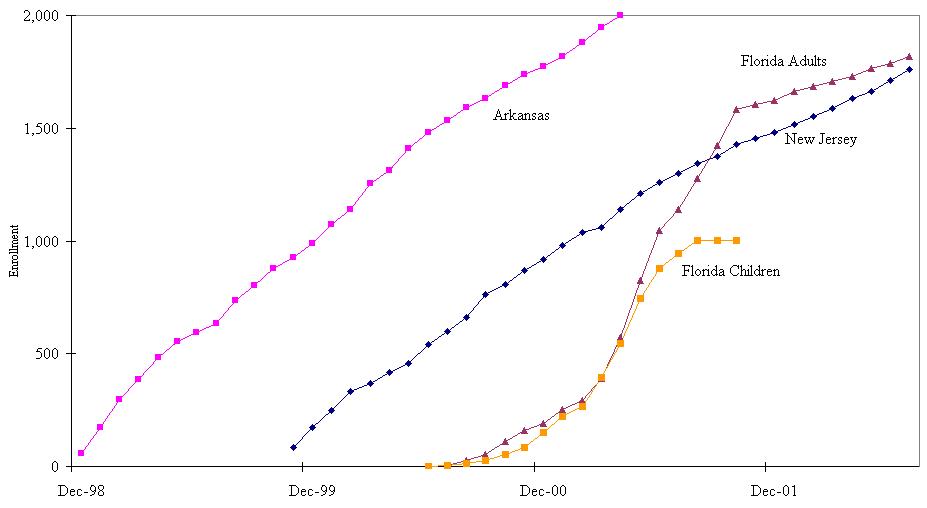
The evaluation set enrollment sample-size targets of 2,000 adults in each state (revised from 3,100) and of 1,000 children in Florida (revised from 1,550), which states expected to meet in about 12 months' time. Although the states eventually met or nearly met the sample-size targets, they took much longer than expected to do so. Arkansas ultimately enrolled 2,008 beneficiaries for the evaluation between December 1998 and April 2001 (29 months). New Jersey enrolled 1,755 beneficiaries between November 1999 and July 2002 (33 months). Florida enrolled 2,820 beneficiaries between June 2000 and July 2002 (26 months, although it met its target of 1,000 children in only 15 months).
Other states considering a Cash and Counseling program are likely to be interested in the number and types of eligible beneficiaries such a program would attract, factors that might deter some interested beneficiaries from participating, and whether offering the program might increase the total number of beneficiaries receiving the Medicaid PCS or HCBS benefit.
Purpose of This Report
This report assesses the appeal of the Cash and Counseling demonstration by: (1) estimating the proportions of eligible beneficiaries that participated and comparing the characteristics of participants and nonparticipants; (2) describing beneficiaries' most common reasons for agreeing or declining to participate; and (3) examining whether the demonstration affected the number of beneficiaries accessing PCS or HCBS over time (that is, program flow).
Data and Methods
Data from Medicaid claims for PCS in Arkansas and New Jersey and for HCBS in Florida were used to assess participation and program flow. Claims data were available for the 24 months before and after the first month of evaluation intake--December 1998 in Arkansas, November 1999 in New Jersey, and June 2000 in Florida. Participation and program flow were observed for all 24 intake months or, in the case of Florida, until the evaluation sample-size target was met for a particular age group.
In the participation analysis, beneficiaries were considered eligible for the demonstration if they had a claim for demonstration-covered services during the state's evaluation intake period, met age requirements in their state, and lived in a designated catchment area, if any was used. Beneficiaries were considered to be demonstration participants if they completed a baseline evaluation interview, regardless of random-assignment status. Participants and nonparticipants were compared on age distribution, race, sex, area of residence, mortality, mean monthly costs for PCS or HCBS, and whether they were using services when evaluation intake began. Logistic regression models were used to estimate the odds that beneficiaries participated in the demonstration as a function of their characteristics and PCS or HCBS costs.
In the program flow analysis, monthly ratios of new users of PCS or HCBS to all users were compared before and during evaluation intake. For each month, the denominator of the ratio was the number of beneficiaries who used PCS or HCBS and were old enough to enroll in the demonstration that month. The numerator was the subset of these beneficiaries who had no claims in any of the three preceding months.
Data from anonymous, pre-coded questionnaires were used to assess beneficiaries' reasons for agreeing or declining to participate in the demonstration. For participants, pre-coded reasons pertained to having flexibility and control over services. For nonparticipants, they pertained mostly to the responsibilities associated with consumer direction and satisfaction with current arrangements. Questionnaires were administered after beneficiaries spoke with an outreach worker about the demonstration by telephone or during a home visit, when the decision to participate, or not, was made. Questionnaires were completed by beneficiaries, family members, or outreach workers. States returned hard-copy questionnaires or electronic data files to Mathematica Policy Research, Inc. for analysis. We received questionnaires or data for 1,538 respondents in Arkansas, 4,669 in Florida, and 2,685 in New Jersey. We examined reasons for agreeing or declining to participate for each state, by age group and service use tenure.
Findings
Participation. The participants in our analysis samples represented fairly small proportions of the states' known eligibles. During evaluation intake periods of up to 24 months, participants represented 7.8 percent of all known eligibles in Arkansas, 8.2 percent of all known eligibles in Florida, and 6.3 percent of all known eligibles in New Jersey. The participation rate was notably highest among eligible Florida children, at 16.0 percent, and was achieved in 15 months. In Arkansas and New Jersey, somewhat larger proportions of nonelderly than elderly beneficiaries participated, whereas the reverse was true in Florida. The models used to predict the odds of participation suggested that, across states, the variables consistently associated with participation included service use tenure (beneficiaries not using PCS or HCBS when intake began were less likely than others to participate); mean monthly costs for PCS or HCBS (beneficiaries with monthly costs under $300 were less likely than others to participate); and mortality during the intake period (beneficiaries in their last year or two of life were less likely than others to enroll in the demonstration).
Reasons for Agreeing or Declining to Participate. Given a list of nine possible reasons for agreeing to participate in the demonstration, most respondents chose four or five. In all three states the four most common reasons for participating were to have greater control over the hiring of caregivers (selected by 66-88 percent of respondents, depending on the state), paying family members or friends (52-80 percent), obtaining care at more convenient times (63-75 percent), and receiving better or more care (68-74 percent).
Beneficiaries who declined to participate in the demonstration typically cited only one reason for their decision. In Arkansas the most commonly cited reasons were satisfaction with current care arrangements (cited by 46 percent of nonparticipants) and concern that the monthly allowance would not cover needed care (22 percent). Roughly eight in ten nonparticipants in Florida said that they were satisfied with their current arrangements. Substantial proportions of nonparticipants also indicated that they did not want to hire or fire workers (30 percent) or file payroll taxes or track expenses (32 percent). New Jersey nonparticipants overwhelmingly said that they did not participate because they were satisfied with their current arrangements (85 percent), and very few chose other reasons.
Beneficiaries' reasons for agreeing or declining to participate in the demonstration generally differed only slightly by age group or service use tenure.
Program Flow. In Arkansas and New Jersey program flow was quite stable during the 24 months before and after the first month of evaluation intake. Monthly ratios of new PCS users to all PCS users dipped and rose from month to month rather than climbing during the intake period, as would be expected if the demonstration had substantially contributed to the inflow of new users. However, the Arkansas program did temporarily suspend the enrollment of new users because it surpassed the historic benchmark ratio it used to monitor inflow. In Florida many beneficiaries not previously using HCBS began using services for the first time during the year before evaluation intake. Ratios of new service users to all users climbed during that period but then fell during most of the evaluation intake period.
The analysis of program flow was limited in two ways. We could not disentangle the effects of external events on aggregate program flow from the effects of Cash and Counseling. This was particularly limiting in Florida, where a class action lawsuit prompted the state to dramatically increase the supply of HCBS for beneficiaries with developmental disabilities during the year before evaluation intake. We also lacked information about why some demonstration participants who were randomly assigned to the control group did not receive Medicaid PCS during the observation period. This was a limitation particularly in Arkansas, whose target population included eligible beneficiaries who had difficulty accessing traditional services. However, given that states had difficulty meeting their enrollment targets and new service users were less likely than continuing users to participate in the demonstration, we conclude that the Cash and Counseling Demonstration had little effect on program flow during the observed periods in the three states.
Conclusions
The promise of Cash and Counseling--more choice and more control--is simple and compelling. Although the promise resonated clearly with many beneficiaries, it did not attract the participation of large percentages of those known to be eligible. Despite limitations in interpreting program flow trends, the demonstration also did not seem to attract many beneficiaries who were interested in the program allowance but would not use traditional PCS or HCBS.
The fairly low levels of participation may have resulted from challenges states faced in conducting outreach and enrollment activities, from beneficiaries being satisfied with their existing care arrangements or disinclined to assume new responsibilities, or simply from the programs' being new. To varying extents across states, barriers to participation seemed to include concerns about the adequacy of the program allowance, and reluctance to hire and fire workers and handle fiscal responsibilities. States might overcome such barriers in part by ensuring that beneficiaries are aware of the availability of counseling and fiscal services, and by fostering peer-support networks between active and prospective participants.
INTRODUCTION
Each year in the United States about 1.4 million people who have disabilities and live at home receive Medicaid-funded assistance with basic activities such as eating, bathing, dressing, and fixing meals (Harrington and Kitchener 2003). States typically offer these supportive services through a Medicaid state plan, as personal care services (PCS), or through a waiver program, as home and community-based services (HCBS). However, states cover services in limited amounts and select the providers or vendors who supply them. Case managers or support coordinators often decide which supportive services beneficiaries need, while nurses supervise personal care workers. This system of service delivery has been criticized for being too inflexible to meet individual needs (Stone 2000; Eustis 2000).
In contrast to traditional PCS and HCBS, Cash and Counseling programs offer Medicaid beneficiaries the opportunity to receive a monthly allowance to purchase and manage supportive services as they see fit. Cash and Counseling programs potentially could improve beneficiaries' satisfaction and quality of life by increasing their control over their supportive services. Arkansas, New Jersey, and Florida each have tested the Cash and Counseling model in their Medicaid systems as part of a three-state, randomized demonstration.1 The states began program implementation in 1998, 1999, and 2000, respectively. Although the states' demonstration periods ended after five years, each continues to offer its Cash and Counseling program under Section 1115 authority of the Social Security Act.
The demonstration programs were designed and implemented with the aid of preference studies and focus groups (see for example, Mahoney et al. 2004 and Zacharias 2001a, 2001b, and 2000). Nonetheless, it was impossible to know in advance exactly who would choose to participate and why. To enhance understanding of these issues, this report assesses aspects of the demonstration's appeal to eligible beneficiaries. Specifically, it addresses three questions:
- What types of eligible beneficiaries were most likely to participate in the demonstration?
- Why did beneficiaries choose to participate, and what deterred others?
- Did the demonstration lead some eligible beneficiaries to use PCS or HCBS who otherwise would not have?
Because they required different data sources or methodologies, each of these questions is addressed in a separate section of this report. Each section, in turn, consists of subsections on research hypotheses, methods, results, and discussion. The report begins with an overview of the demonstration and ends with a cross-topic conclusion.
THE DEMONSTRATION IN BRIEF
As noted, Cash and Counseling offers beneficiaries a monthly allowance to hire workers and purchase services and goods (within state guidelines) as service "consumers." It allows consumers to designate a representative, such as a relative or friend, to help them make decisions about managing their care. It also offers counseling and fiscal services to help consumers and representatives handle their program responsibilities. These tenets of Cash and Counseling--a flexible allowance, use of representatives, and availability of counseling and fiscal services--are meant to make the model adaptable to consumers of all ages and abilities. The three demonstration programs adhered to these principles, although they differed somewhat in covered services, target populations, and the way they approached outreach and enrollment.2
Covered Services
The demonstration programs in Arkansas and New Jersey offered an allowance instead of the PCS, such as help with eating, bathing, housekeeping, and shopping, that beneficiaries otherwise would have received through the Medicaid state plan. Florida's program offered an allowance instead of the benefits usually provided through an HCBS waiver program, such as in-home nursing, professional therapies, care-related supplies and equipment, caregiver respite, and PCS.
Target Populations and Eligibility
In Arkansas, the demonstration was open to adults who were eligible for, but not necessarily receiving, Medicaid state plan PCS. Beneficiaries who were participating in either of two HCBS waiver programs--ElderChoices or Alternatives--could also participate in the demonstration. Their waiver benefits were delivered as usual during the demonstration and were not "cashed out" as part of the Cash and Counseling allowance.3
In Florida, the demonstration was open to Medicaid beneficiaries who were receiving HCBS under the state's Developmental Disabilities (DD) Waiver or Aged/Disabled Adult (ADA) Waiver and living in selected areas of the state.4 Together, these waivers serve children and adults with developmental disabilities, frail elderly adults, and adults with physical disabilities. For children, the demonstration catchment area was the entire state. For adults with developmental disabilities, it was the entire state except several northern counties where a state-funded consumer-directed program was being piloted. For elderly adults and those with physical disabilities, the catchment area consisted of 19 counties, including most of the state's major metropolitan areas.
In New Jersey, the demonstration was open to adult Medicaid beneficiaries who: (1) were using PCS or had been assessed as eligible for it, (2) were not also participating in HCBS waiver programs or a state-funded consumer-directed program, and (3) were expected to require PCS for at least six months. The state program office excluded PCS recipients who also used HCBS because authorization procedures differed for those services and beneficiaries would have received assistance from Cash and Counseling consultants and HCBS case managers, which the program feared would cause confusion. It decided to include only beneficiaries who were expected to require PCS for at least six months because consumers would need several months to develop and implement a plan for spending the program allowance.
All beneficiaries who met states' eligibility criteria were allowed to enroll in the demonstration if they or their representative believed they could manage their responsibilities as consumers. States did not screen beneficiaries or representatives for the ability to assume the responsibilities of consumer-directed care. Beneficiaries randomly assigned to the treatment group were allowed to disenroll from the consumer-directed program at any time and revert to traditional services, generally by the first day of the following month.
Outreach and Enrollment
The demonstration states were responsible for informing eligible beneficiaries about the opportunity to participate in the demonstration and for enrolling those who agreed to do so. Demonstration program staff conducted community outreach activities to garner backing for the demonstration from the supportive services industry and advocacy organizations. Later, when the programs were poised for implementation, they used some combination of direct mailings, telephone calls, and home visits to reach eligible beneficiaries and explain the demonstration in detail to those who were interested. Direct mailings were the programs' key means of introducing the demonstration to eligible beneficiaries. The Arkansas and Florida programs both found that introductory letters from the governor's office generated considerable initial interest, and all three programs provided tear-out reply postcards or toll-free telephone numbers for beneficiaries who wished to request more information.5 The New Jersey program, in addition to sending introductory mailings to eligible beneficiaries, wrote to directors of Medicaid personal care agencies and urged them to refer clients they found difficult to serve (for example, because the clients lived in rural areas or were perpetually dissatisfied with agency services). Providers did refer many clients in response.
For the more resource-intensive outreach activities--telephone calls and home visits--all three programs relied on workers whose time was dedicated to outreach and enrollment. Arkansas relied on four nurses who were employed by the state. Florida initially relied on the case managers and support coordinators who worked in its DD and ADA waiver programs, but then changed course and hired temporary state employees. New Jersey initially contracted with a human services organization to conduct outreach and enrollment activities, but it, too, later hired temporary state employees.
States confronted at least one of four obstacles during their enrollment efforts. These were: (1) resistance to the demonstration by the supportive services industry; (2) preconceptions about elderly beneficiaries' capacity for consumer direction among some outreach workers; (3) competing demands for outreach workers' time; and (4) language diversity in the target populations. Industry resistance stemmed from providers fearing they would lose market share or workers to consumer direction, and from concern over consumer safety. Resistance was apparent at the policy level--the personal care industry in Arkansas lobbied the state legislature to withdraw the state from the demonstration--and at the individual level--some personal care aides in Arkansas and New Jersey tried to dissuade beneficiaries from participating in the demonstration. In Florida industry resistance combined with negative preconceptions about elderly beneficiaries' capacity for consumer direction. Some case managers in Florida's ADA waiver program, despite their dual functions as outreach workers for the demonstration, disparaged the demonstration during visits with elderly beneficiaries.6 Not being able to devote enough time to outreach and enrollment tasks was a problem mostly in Florida--where support coordinators in the DD waiver program were responding to a sudden influx of HCBS beneficiaries. (The influx was not related to the Cash and Counseling demonstration but to a lawsuit described later in this report.) Language diversity was an issue in New Jersey and Florida. The programs in those states had to secure enrollment specialists who were fluent in Spanish, translate marketing materials into common languages, and rely on beneficiaries' family members to translate.
Enrollment progressed unexpectedly slowly in part as a result of such obstacles. Sample-size targets set by the evaluation were reduced, from 3,100 to 2,000 adults in each state and from 1,550 to 1,000 children in Florida. In addition, although enrollment initially was expected to take only about 12 months, it remained open until sample-size targets were met or until July 2002, at the latest. Arkansas ultimately enrolled 556 nonelderly adults and 1,452 elderly adults between December 1998 and April 2001 (29 months) (Figure 1). New Jersey enrolled 817 nonelderly adults and 938 elderly adults between November 1999 and July 2002 (33 months). Florida enrolled 1,002 children between June 2000 and August 2001 (15 months), 914 nonelderly adults between June 2000 and November 2001 (18 months), and 904 elderly adults between June 2000 and July 2002 (26 months).7, 8 All the Florida children and nine in ten nonelderly adults had primarily developmental disabilities. Elderly adults in Florida and all adults in Arkansas and New Jersey, by contrast, had primarily physical disabilities.
| FIGURE 1: Cumulative Enrollment in the Cash and Counseling Demonstration and Evaluation, by Month |
 |
ANALYSIS OF PARTICIPATION
Assuming eligible beneficiaries were aware of the Cash and Counseling demonstration in their state, their voluntary participation is an important indicator of the model's appeal. We used the information available in Medicaid enrollment files and claims for Medicaid PCS or HCBS to identify the types of beneficiaries who chose to participate in the demonstration and compare their characteristics with those of nonparticipants.
Research Hypotheses and Rationale
Cash and Counseling may be more appealing to some types of beneficiaries than others. Mahoney et al. (2004) found that interest in Cash and Counseling varied among subgroups of Medicaid beneficiaries in Arkansas, Florida, New Jersey, and New York, during preference studies to aid demonstration design. (New York later withdrew from the demonstration.) In particular, interest was positively associated with having hiring and supervisory experience, relatively severe levels of disability, having a live-in caregiver, and minority status.
One could also hypothesize about the association between beneficiary characteristics and participation in the demonstration. For example, compared with elderly adults, nonelderly adults may find it more appealing to develop a budget and manage an allowance. The ability to choose caregivers may be more important to beneficiaries in racial minorities than to White beneficiaries or more desirable to newly eligible beneficiaries who, unlike longtime users, may not have established relationships with personal care workers. The ability to pay family and friends for caregiving may be especially important to beneficiaries who live in hard-to-serve areas, such as those with poor public transportation or crime problems. Assuming responsibility for one's supportive services may appeal most to beneficiaries who qualify for a moderate level of services, neither so low that managing an allowance based on the expected costs of those services would not be worth the bother nor so high that managing the allowance would be a great burden. Finally, enrolling in a new program would likely appeal more to beneficiaries who expect to live long enough to make enrollment worthwhile than it would to other beneficiaries.
Methods
We used data from PCS and HCBS claims and Medicaid enrollment files to: (1) approximate the population of beneficiaries who were eligible to participate in the Cash and Counseling demonstration, by state; (2) compare the characteristics of participants and nonparticipants that were observable through claims and enrollment data; and (3) estimate the odds of participation for various types of beneficiaries. For each state, claims were available for the 24 months before and after the first month of evaluation intake, a total of 48 months.
| TABLE 1: Claims-Based Variables Constructed for the Participation Analysis | |
|---|---|
| Variable | Description |
| Age | For participants, age was calculated as of the actual date of intake. For nonparticipants, age was calculated as of the state's first intake month if the beneficiary had a Medicaid claim that month or earlier for services covered by the Cash and Counseling allowance; otherwise, age was calculated as of the month of the beneficiary's first such claim. |
| Race | Each beneficiary's race was classified as White, Black, Hispanic, or other, as indicated in Medicaid enrollment data. (Hispanic ethnicity was not indicated separately from race.) Race data were missing for 9 percent of beneficiaries in Arkansas. |
| Area of Residence | Each beneficiary's area of residence was classified according to the county name indicated in Medicaid enrollment data. For Arkansas and Florida, we constructed a variable to indicate whether or not the county was located in a Metropolitan Statistical Area (MSA), as defined by the U.S. Office of Management and Budget. For New Jersey, where all counties are located in MSAs, we constructed a variable to indicate whether the county was in the northeast, northwest, central, or southern part of the state. |
| Costs for PCS or HCBS | For participants, costs were calculated as the mean of costs observed in the actual month of intake and up to two preceding months (excluding months with no costs). For nonparticipants, costs were calculated as of a participation "decision month," which we assigned in the following manner. For nonparticipants with claims in the state's first intake month or earlier, decision months were randomly assigned to reflect the proportional distribution, throughout the intake period, of participants with claims in the state's first intake month or earlier.a For nonparticipants whose first claim was observed after the state's first intake month, the decision month was the month of the first claim. Costs for all nonparticipants were then calculated as the mean of costs observed in the decision month and up to two subsequent months (excluding months with no claims). Beneficiaries who did not have claims during the portion of the research sample intake period observed through claims or who died during that period were excluded from the calculation of costs. (We excluded beneficiaries who died, to avoid randomly assigning posthumous decision months to nonparticipants.) |
| |
Sample Selection. The analysis sample for each state included all known eligibles. Known eligibles are beneficiaries with claims for demonstration-covered services (PCS in Arkansas and New Jersey and HCBS in Florida) during the first 24 months of a state's evaluation intake period or, in the case of Florida, until the state met the evaluation sample-size target for beneficiaries in a certain age group, whichever came first. In Florida known eligibles were also selected by catchment area. Beneficiaries were considered to be demonstration participants if they completed a baseline evaluation interview, regardless of random-assignment status.
Variable Construction. As noted, Medicaid enrollment and claims data were available to characterize participants and nonparticipants by age group, race, sex, area of residence, mortality during the intake period, and mean monthly costs for PCS or HCBS. Claims data were also used to distinguish between those beneficiaries who were already using PCS or HCBS when the evaluation began and those who started using services while intake was in progress. Variables requiring explanation are described in Table 1.
Analysis. Chi-square or t-tests were used to compare the proportions of participants and nonparticipants with observed characteristics or to compare the groups' mean monthly costs for PCS or HCBS. Logistic regression models were used to estimate the odds that beneficiaries participated in the demonstration as a function of their characteristics and costs for PCS or HCBS. The models' dependent variable indicated whether beneficiaries enrolled in the demonstration during the first 24 months of intake (or until evaluation intake ceased for a particular age group in Florida). For Florida, we calculated statistics and odds ratios for the overall sample and for the three age groups served by the DD and ADA waivers. For Arkansas and New Jersey, we calculated statistics and odds ratios only for the overall samples, because all sample members in those states received state plan PCS.
Results
The participants in our analysis sample represented fairly small proportions of states' known eligibles (Table 2). During a period of 24 months, participants represented 7.8 percent of all known eligibles in Arkansas and 6.3 percent of all known eligibles in New Jersey. In Florida, where intake periods varied by age group, participants represented 16 percent of children known to be eligible during a period of 15 months, 5.6 percent of nonelderly adults known to be eligible during period of 18 months, and 7.6 percent of elderly adults known to be eligible during a period of 24 months.9
The models that predicted the odds of participation as a function of beneficiaries' characteristics yielded some cross-state patterns.10 Overall, the variables most consistently associated with participation status were whether the beneficiary was receiving PCS or HCBS when evaluation intake began, costs for PCS or HCBS, and mortality during the intake period (Table 3). All else being equal, beneficiaries whose monthly costs for PCS or HCBS were under $300 were less likely to participate than beneficiaries with higher costs. Beneficiaries who first used PCS or HCBS during the intake period were less likely to participate than beneficiaries who were using PCS or HCBS when intake began. (Florida children were the only exception; no relationship was seen in that group.) Finally, beneficiaries who died during the intake period were less likely to enroll in the demonstration than beneficiaries who lived longer. (Florida nonelderly adults were an exception; no relationship was seen.) That is to say, beneficiaries in their last year or two of life were less likely than other--perhaps healthier--beneficiaries to participate.
| TABLE 2: Percent of Medicaid Beneficiaries Who Participated in Cash and Counseling, Among Known Eligibles | ||||||
|---|---|---|---|---|---|---|
| Arkansas | Florida | New Jersey | ||||
| Percent Participated | Number of Intake Months Observed | Percent Participated | Number of Intake Months Observed | Percent Participated | Number of Intake Months Observed | |
| OVERALL | 7.8 | 24 | 8.2 | 15-24 | 6.3 | 24 |
| AGE GROUP | ||||||
| 3-17 | n.a. | n.a. | 16.0 | 15 | n.a. | n.a. |
| 18-64 (18-59 in Florida) | 8.3 | 24 | 5.6 | 18 | 8.1 | 24 |
| 65 or older (60 or older in Florida) | 7.6 | 24 | 7.6 | 24 | 5.3 | 24 |
| WHETHER USING PCS OR HCBS WHEN INTAKE BEGAN | ||||||
| Yes | 7.7 | 24 | 8.2 | 15-24 | 7.0 | 24 |
| No | 8.0 | 24 | 7.9 | 15-24 | 5.4 | 24 |
| NUMBER OF KNOW ELIGIBLESa | 21,891 | 34,119 | 24,736 | |||
SOURCE: Program records from each demonstration state and claims for PCS or HCBS. Claims were observed for 24 months before and after the first month of intake in each state: From January 1997 through December 2000 for Arkansas, from July 1998 through June 2002 for Florida, and from December 1997 through November 2001 for New Jersey.
n.a. = not applicable | ||||||
| TABLE 3: Estimated Effects of Observable Characteristics on Whether Eligible Medicaid Beneficiaries Participated in the Cash and Counseling Demonstration, by State(Omitted Categories in Parentheses) | ||||||||||
|---|---|---|---|---|---|---|---|---|---|---|
| Arkansas | Florida | New Jersey | ||||||||
| All Ages(n = 19,869) | 3-17 Years(n = 6,122) | 18-59 Years(n = 15,831) | 60 or Older(n = 11,055) | All Ages(n = 23,124) | ||||||
| Odds Ratio | p-value | Odds Ratio | p-value | Odds Ratio | p-value | Odds Ratio | p-value | Odds Ratio | p-value | |
| YEARS OF AGEa | ||||||||||
| (3-12) | n.a. | n.a. | n.a. | n.a. | n.a. | n.a. | n.a. | n.a. | ||
| 13-17 | n.a. | n.a. | 0.59*** | 0.000 | n.a. | n.a. | n.a. | n.a. | n.a. | n.a. |
| (18-39) | n.a. | n.a. | n.a. | n.a. | ||||||
| 40-64; 40-59 in Florida | 1.19 | 0.161 | n.a. | n.a. | 0.60*** | 0.000 | n.a. | n.a. | 0.82** | 0.046 |
| 65-79; (60-79 in Florida) | 1.12 | 0.359 | n.a. | n.a. | n.a. | n.a. | 0.60*** | 0.000 | ||
| 80 or older | 1.00 | 0.991 | n.a. | n.a. | n.a. | n.a. | 1.00 | 0.972 | 0.61*** | 0.000 |
| FEMALE | 1.16** | 0.045 | 0.93 | 0.318 | 1.03 | 0.718 | 1.19* | 0.058 | 1.03 | 0.666 |
| RACE | ||||||||||
| (White) | ||||||||||
| Minority | 0.97 | 0.614 | 0.53*** | 0.000 | 0.90* | 0.129 | 1.22*** | 0.006 | 1.57*** | 0.000 |
| Missing | 1.05 | 0.582 | n.a. | n.a. | n.a. | n.a. | n.a. | n.a. | n.a. | n.a. |
| RESIDES IN: | ||||||||||
| An MSA | 1.41*** | 0.000 | 0.66*** | 0.001 | 2.09*** | 0.000 | n.a. | n.a. | n.c. | n.c. |
| (Northeast New Jersey) | ||||||||||
| Northwest New Jersey | n.a. | n.a. | n.a. | n.a. | n.a. | n.a. | n.a. | n.a. | 1.62*** | 0.006 |
| Central New Jersey | n.a. | n.a. | n.a. | n.a. | n.a. | n.a. | n.a. | n.a. | 1.54*** | 0.000 |
| Southern New Jersey | n.a. | n.a. | n.a. | n.a. | n.a. | n.a. | n.a. | n.a. | 1.81*** | 0.000 |
| CLAIMS RELATIVE TO INTAKE PERIOD | ||||||||||
| (Before and during) | ||||||||||
| Only during | 0.81*** | 0.000 | 1.01 | 0.335 | 0.91 | 0.288 | 0.60*** | 0.000 | 0.61*** | 0.000 |
| MEAN MONTHLY COSTS FOR PCS OR HCBSb | ||||||||||
| (Less than $300) | ||||||||||
| $300-$749 or $300 or more | 1.12* | 0.070 | 1.92*** | 0.000 | 1.25** | 0.045 | 1.54*** | 0.000 | 1.10 | 0.431 |
| $750-$1,249 | n.a. | n.a. | 2.38*** | 0.000 | 1.34** | 0.016 | 2.03*** | 0.000 | 1.46*** | 0.002 |
| $1,250 or more | n.a. | n.a. | 1.73*** | 0.000 | 1.03 | 0.824 | 2.75*** | 0.000 | 1.79*** | 0.000 |
| DECEASED | 0.71*** | 0.000 | 0.45** | 0.045 | 0.73 | 0.290 | 0.74** | 0.025 | 0.61*** | 0.001 |
SOURCE: Program records from each demonstration state and claims for PCS or HCBS. Claims were observed for 24 months before and after the first month of intake in each state: From January 1997 through December 2000 for Arkansas, from July 1998 through June 2002 for Florida, and from December 1997 through November 2001 for New Jersey. NOTE: Odds ratios were estimated with logit models. The dependent variable was a binary indicator of whether or not the beneficiary enrolled in the demonstration during the first 24 months of intake (or before evaluation-intake ceased for children and nonelderly adults in Florida). Beneficiaries who did not have claims during that period also were excluded from the analysis.
n.a. = not applicable; n.c. = not calculated because no variation (that is, all New Jersey counties are in MSAs) *Significantly different from one at the .10 level, two-tailed test. **Significantly different from one at the .05 level, two-tailed test. ***Significantly different from one at the .01 level, two-tailed test. | ||||||||||
By state, some variables were more strongly related to participation than others (Table 3). In Arkansas area of residence and mortality during the intake period were most strongly related to participation. Compared with Arkansans who did not live in metropolitan statistical areas (MSAs), those in metropolitan areas were 1.4 times as likely to participate. Compared with Arkansans who lived throughout the first 24 months of intake, those who died during that time were 0.71 times as likely to participate.
In Florida, monthly HCBS costs were fairly strong predictors of participation for all age groups but especially for elderly beneficiaries (Table 3). Compared with elderly Floridians whose monthly costs were less than $300, elderly Floridians were 1.5 times as likely to participate if their monthly costs were $300-$749, 2.0 times as likely if their monthly costs were $750-$1,249, and 2.8 times as likely if their monthly costs were $1,250 or more.
In New Jersey, the variable most strongly related to participation was age (Table 3). Compared with beneficiaries aged 18-39, beneficiaries in two elderly age groups (65-79 and 80 or older) were less likely to participate in the demonstration (the odds ratio was 0.6 for each elderly age group). In addition, beneficiaries outside the state's most urban region (the northeast) were more likely than beneficiaries in that region to participate, nonWhite beneficiaries were more likely than White beneficiaries to participate, and beneficiaries with relatively high PCS costs were more likely than beneficiaries in the lowest cost category to participate.
Discussion
The positive association between participation and mean monthly costs for PCS or HCBS was perhaps the most compelling finding from the analysis. To the extent that costs reflect the degree of need and the approximate value of a Cash and Counseling allowance, the association suggests that beneficiaries with relatively low needs for PCS or HCBS were less likely than other beneficiaries to find the demonstration appealing.
Other results suggest that Cash and Counseling was more appealing to some types of beneficiaries than others; however, the findings also might reflect the outreach and enrollment practices that states used. For example, in New Jersey, where age was associated with participation, it could be that younger beneficiaries were more attracted to consumer direction than older ones, as hypothesized, because they felt more confident in their ability to manage an allowance. However, it could also be true that outreach workers promoted the demonstration more aggressively or persuasively to younger beneficiaries as a result of their own preconceptions.
Likewise, the odds of participation may have been greater for beneficiaries who were already using PCS or HCBS when intake began than for other beneficiaries because taste for consumer direction increases with service use tenure, or because states focused outreach activities most intently on their original cohort of known eligibles. Finally, the observed association between area of residence and participation may reflect regional differences in outreach. In Arkansas, for example, outreach workers may have been able to conduct more home visits per day in metropolitan areas than in rural ones, which could explain the higher likelihood of participation among beneficiaries in metropolitan areas.
REASONS BENEFICIARIES AGREED OR DECLINED TO PARTICIPATE
Compared with Medicaid beneficiaries who rely on traditional PCS or HCBS, those who direct their own supportive services have greater flexibility and greater responsibility. When eligible beneficiaries learned about the Cash and Counseling demonstration, their assessment of these trade-offs probably influenced their decision about whether to participate. We used questionnaire data to assess which aspects of flexibility and responsibility played a role in beneficiaries' decisions.
Research Hypotheses and Rationale
Beneficiaries who rely on home care agencies for supportive services have little or no control over the "who, what, when, and how" of their services. Those who agreed to participate in the demonstration may have done so in order to have control over whom, if anyone, to hire, and the quality, quantity, or timing of the assistance. Beneficiaries may have wished to pay family members or friends for providing assistance. They may have wanted to buy assistive equipment, care supplies, and community services that were not part of their Medicaid care plans, or they may have wanted to buy them in different amounts or from different vendors. Finally, beneficiaries frustrated by having a case manager or assessment worker make decisions about their supportive services might have preferred to make decisions themselves, with the option to consult program counselors and fiscal agents for advice.
Medicaid beneficiaries who declined to participate in the demonstration may have decided that Cash and Counseling was not worth the effort required. These nonparticipants may have been satisfied with their existing care arrangements, concerned the proposed allowance would not cover their needs, or loath to assume certain responsibilities. For example, they may have been reluctant to hire and possibly fire workers or bear responsibility for care quality.
Methods
Throughout the evaluation intake period, the outreach and enrollment workers in each demonstration state administered an anonymous hard-copy questionnaire requesting information about beneficiaries' reasons for agreeing or declining to participate. Workers administered the questionnaire following informational telephone calls or home visits, depending on when the beneficiary decided whether or not to participate. Workers could complete the questionnaire themselves, based on their knowledge of the reasons for the participation decision, or they could ask the beneficiary or a family member to do so. (Data on respondent type were not collected.)
The number of questionnaires returned to MPR for analysis are shown in the table below.11
| QUESTIONNAIRE RESPONDENTS, BY PARTICIPATION DECISION AND STATE | ||||||
|---|---|---|---|---|---|---|
| Arkansas | Florida | New Jersey | ||||
| Agreed | Declined | Agreed | Declined | Agreed | Declined | |
| Number of Respondents | 953 | 585 | 1,877 | 2,792 | 950 | 1,735 |
In addition to collecting data on the participation decision, the questionnaire included questions about the beneficiary's age, sex, race, and county of residence, how the demonstration was explained (in person or by telephone), who made the participation decision (the beneficiary alone or with others), whether the decision maker had ever supervised someone else, and how long the beneficiary had been receiving PCS or HCBS. Table A.2 shows the number of people, by state and participation status, responding to specific questionnaire items. Item nonresponse was high for New Jersey nonparticipants, but low for other groups. Appendix B includes a sample instrument.
Although rather small proportions of demonstration participants responded to the questionnaire (47 percent in Arkansas, 67 percent in Florida, and 54 percent in New Jersey), the responding participants seemed to represent all participants fairly well in terms of age, sex, and area of residence (compare Table A.1 and Table A.3).12 It is not possible to calculate a questionnaire completion rate for nonparticipants, because the number of nonparticipants who met or spoke with outreach workers is not known. However, responding nonparticipants also seemed fairly representative of all nonparticipants in terms of age, sex, and area of residence.
Results
Reasons for Agreeing to Participate. Given a list of nine reasons they might have had for agreeing to participate in the demonstration, most respondents cited four or five (Table 4).14 In all three states the four most common reasons for participation pertained to human assistance. They were: to have more control over whom to hire, to pay family members or friends, to obtain care at more convenient times, and to get better or more care. Each was chosen by at least 52 percent of respondents. The remaining reasons appealed to notable proportions of respondents in at least two states. In Arkansas and Florida, approximately three respondents in ten cited the opportunity to get advice from program counselors or bookkeepers as a reason to participate, and two in ten (Arkansas) or five in ten (Florida) cited the opportunity to purchase equipment or supplies. In Florida and New Jersey, at least two in ten respondents agreed to participate in order to pay personal care workers more or provide them with fringe benefits, to purchase home or car modifications, and to purchase community services not covered by Medicaid. In contrast, few Arkansas respondents cited these reasons, likely because average monthly allowances were relatively small in that state.
| TABLE 4: Main Reasons for Agreeing to Participate, by State(Percentages) | |||
|---|---|---|---|
| Reasons | Arkansas | Florida | New Jersey |
| Have More Control Over Whom to Hire | 87.6 | 83.3 | 65.5 |
| Pay Family Members or Friends | 80.0 | 60.6 | 52.3 |
| Get Care at More Convenient Times | 74.8 | 62.5 | 65.6 |
| Get Better or More Care | 67.5 | 73.7 | 73.8 |
| Get Advice from Program Counselors or Bookkeepers | 31.5 | 30.2 | 19.5 |
| Purchase Equipment or Supplies | 20.9 | 50.8 | n.a. |
| Pay Personal Care Workers More or Provide Benefits | 5.4 | 35.2 | 24.2 |
| Purchase Home or Car Modifications | 3.0 | 23.1 | 26.8 |
| Purchase Community Services Not Covered by Medicaid | 1.6 | 49.8 | 21.9 |
| None of the Above | 0.3 | 1.2 | 1.2 |
| NUMBER OF RESPONDENTS WHO AGREED TO PARTICIPATE | 953 | 1,877 | 950 |
| SOURCE: MPR's participation questionnaire, administered by demonstration outreach and enrollment workers in each state. NOTE: Columns sum to more than 100 percent because respondents were asked to mark all applicable reasons from the list shown in this table. n.a. = not asked. | |||
Although a few differences emerged across age groups, they were not great in any state. In Arkansas respondents in the eldest age group (65 or older) were more likely than those in the youngest age group (18-39 years old) to participate in order to pay family members or friends (82 percent versus 72 percent) (Table 4a). Respondents in the middle age group (40-64 years old) were somewhat less likely than others to indicate that obtaining care at more convenient times, or getting more or better care, were reasons to participate. Members of this group were more likely than others to report that purchasing equipment or supplies was a reason to participate (29 percent versus roughly 19 percent).
| TABLE 4a: Main Reasons for Agreeing to Participate, by Age and PCS Tenure: Arkansas(Percentages) | ||||||
|---|---|---|---|---|---|---|
| Reasons | Age in Yearsa | How Long Using Medicaid PCSb | ||||
| 18-39 | 40-64 | 65 or Older | Longer than One Year | One Year or Less | No Services Yet | |
| Have More Control Over Whom to Hire | 88.0 | 91.6 | 86.5 | 88.1 | 81.0 | 81.7 |
| Pay Family Members or Friends | 71.7 | 78.7 | 81.8 | 76.9 | 81.9 | 86.5 |
| Get Care at More Convenient Times | 75.0 | 66.3 | 77.6 | 69.9 | 80.2 | 77.9 |
| Get Better or More Care | 66.3 | 57.4 | 71.1 | 61.8 | 66.4 | 80.8 |
| Get Advice from Program Counselors or Bookkeepers | 27.2 | 27.7 | 33.5 | 20.8 | 24.1 | 54.8 |
| Purchase Equipment or Supplies | 19.6 | 28.7 | 18.7 | 22.2 | 16.4 | 11.5 |
| Pay Personal Care Workers More or Provide Benefits | 9.8 | 6.9 | 4.3 | 6.5 | 5.2 | 1.0 |
| Purchase Home or Car Modifications | 6.5 | 2.0 | 2.9 | 1.9 | 1.7 | 0.0 |
| Purchase Community Services Not Covered by Medicaid | 0.0 | 2.5 | 1.4 | 1.7 | 1.7 | 0.0 |
| None of the Above | 0.0 | 0.5 | 0.1 | 0.3 | 0.0 | 1.0 |
| NUMBER OF RESPONDENTS WHO AGREED TO PARTICIPATE | 92 | 202 | 653 | 631 | 116 | 104 |
SOURCE: MPR's participation questionnaire, administered by demonstration outreach and enrollment workers in each state. NOTE: Columns sum to more than 100 percent because respondents were asked to mark all applicable reasons from the list shown in this table.
| ||||||
In Florida, 81-86 percent of beneficiaries in four age groups, one for children and three for adults, agreed to participate in order to have more control over hiring (Table 4b). Getting more care or better care was a close second choice for elderly beneficiaries (60 or older). In addition, elderly beneficiaries were less likely than those in other age groups to participate in order to buy equipment or supplies, or to buy community services not covered by Medicaid. Although elderly beneficiaries wanted hiring control, this group cited the desire to pay family members or friends as a reason to enroll in the demonstration somewhat less commonly than the other groups. Finally, respondents for children (3-17 years old) were somewhat less likely than adult beneficiaries to participate in order to get care at more convenient times.
Differences across age groups varied very little in New Jersey (Table 4c). Beneficiaries who were 18-39 years old were somewhat less likely than others to participate in order to pay family members or friends (48 percent of 18-39 year olds versus 60 percent of 40-64 year olds, and 53 percent of beneficiaries 65 or older). Otherwise, the proportions of beneficiaries choosing the remaining reasons were similar across age groups.
| TABLE 4b: Main Reasons for Agreeing to Participate, by Age and HCBS Tenure: Florida(Percentages) | ||||||
|---|---|---|---|---|---|---|
| Reasons | Age in Yearsa | How Long Using Medicaid HCBSb | ||||
| 3-17 | 18-39 | 40-59 | 60 or Older | Longer than One Year | One Year or Less | |
| Have More Control Over Whom to Hire | 80.5 | 86.4 | 85.8 | 82.2 | 82.7 | 83.8 |
| Pay Family Members or Friends | 59.8 | 64.6 | 62.0 | 54.8 | 60.1 | 60.4 |
| Get Care at More Convenient Times | 57.1 | 61.4 | 67.6 | 67.3 | 62.6 | 63.6 |
| Get Better or More Care | 69.8 | 73.8 | 75.7 | 78.2 | 73.3 | 74.2 |
| Get Advice from Program Counselors or Bookkeepers | 28.0 | 28.4 | 28.5 | 35.5 | 29.9 | 29.3 |
| Purchase Equipment or Supplies | 57.3 | 47.3 | 53.1 | 42.6 | 49.4 | 54.6 |
| Pay Personal Care Workers More or Provide Benefits | 37.5 | 35.9 | 32.4 | 31.2 | 34.8 | 35.5 |
| Purchase Home or Car Modifications | 23.3 | 20.9 | 22.4 | 23.6 | 22.3 | 22.1 |
| Purchase Community Services Not Covered by Medicaid | 51.9 | 48.8 | 55.3 | 42.1 | 47.2 | 54.6 |
| None of the Above | 0.9 | 1.0 | 1.4 | 1.0 | 1.3 | 0.5 |
| NUMBER OF RESPONDENTS WHO AGREED TO PARTICIPATE | 632 | 412 | 358 | 394 | 1,138 | 566 |
SOURCE: MPR's participation questionnaire, administered by demonstration outreach and enrollment workers in each state. NOTE: Columns sum to more than 100 percent because respondents were asked to mark all applicable reasons from the list shown in this table.
| ||||||
Reasons for agreeing to participate differed with how long beneficiaries had been using demonstration-covered services in Arkansas and New Jersey, but not in Florida. Among Arkansas beneficiaries who had been using Medicaid PCS for longer than a year when they responded to the questionnaire, the desire to have more control over hiring was by far the most common reason for participating (listed by 88 percent of beneficiaries in this group) (Table 4a). In contrast, many newer users and many who were not yet using services selected this reason and several others. For example, respondents in these groups were more likely than longtime users to say getting care at more convenient times was a reason to participate. Respondents who were not yet using PCS were much more likely than others to participate because they wanted better care or more care, and advice from counselors and bookkeepers. In contrast, the desire to purchase equipment or supplies seemed to increase with service use tenure.
In New Jersey, beneficiaries using Medicaid PCS for longer than a year were less likely than others to cite the wish to pay family members or friends as a reason to participate (50 percent versus 64 percent) and more likely to participate in order to pay their personal care workers more or to provide them benefits (28 percent versus 17 percent) (Table 4c). These longtime users were also more likely than others to participate in order to purchase home or car modifications (33 percent versus 15 percent).
| TABLE 4c: Main Reasons for Agreeing to Participate, by Age and PCS Tenure: New Jersey(Percentages) | |||||
|---|---|---|---|---|---|
| Reasons | Age in Yearsa | How Long Using Medicaid PCS Servicesb | |||
| 18-39 | 40-64 | 65 or Older | Longer than One Year | One Year or Less | |
| Have More Control Over Whom to Hire | 67.7 | 72.4 | 63.3 | 67.6 | 65.1 |
| Pay Family Members or Friends | 47.9 | 59.6 | 52.7 | 49.7 | 63.8 |
| Get Care at More Convenient Times | 68.8 | 71.8 | 64.0 | 66.7 | 65.5 |
| Get Better or More Care | 76.0 | 75.7 | 74.7 | 73.6 | 77.0 |
| Get Advice from Program Counselors or Bookkeepers | 24.0 | 22.9 | 17.9 | 22.2 | 14.0 |
| Purchase Equipment or Supplies | n.a. | n.a. | n.a. | n.a. | n.a. |
| Pay Personal Care Workers More or Provide Benefits | 26.0 | 27.6 | 23.4 | 27.8 | 16.6 |
| Purchase Home or Car Modifications | 31.3 | 31.2 | 24.8 | 32.4 | 14.5 |
| Purchase Community Services Not Covered by Medicaid | 26.0 | 24.9 | 20.3 | 24.7 | 16.6 |
| None of the Above | 1.0 | 0.6 | 1.4 | 0.9 | 0.9 |
| NUMBER OF RESPONDENTS WHO AGREED TO PARTICIPATE | 96 | 337 | 419 | 652 | 235 |
SOURCE: MPR's participation questionnaire, administered by demonstration outreach and enrollment workers in each state. NOTE: Columns sum to more than 100 percent because respondents were asked to mark all applicable reasons from the list shown in this table.
n.a. = not asked | |||||
Reasons for Declining to Participate. Beneficiaries who declined to participate in the demonstration were asked to indicate all applicable reasons from a list of nine. In contrast to the large proportions of beneficiaries who cited several reasons for agreeing to participate, those who declined were more likely to select only one (Table 5).
In Arkansas, the most commonly selected reasons were satisfaction with current care arrangements (cited by 46 percent of all nonparticipants) and concern that the cash allowance would not cover needed care (22 percent) (Table 5). However, 31 percent of respondents indicated that none of the listed reasons reflected their own motives for not participating.15
| TABLE 5: Main Reasons for Declining to Participate, by State(Percentages) | |||
|---|---|---|---|
| Reasons | Arkansas | Florida | New Jersey |
| Satisfied with Current Arrangements | 45.8 | 81.3 | 85.4 |
| Concerned Cash Benefit Care Would Not Cover Needed Care | 22.2 | 9.3 | 2.8 |
| Do Not Want to Hire and Possibly Fire Workers | 7.5 | 30.2 | 2.5 |
| Afraid Change Might Upset Family or Friends | 7.5 | 6.6 | 1.2 |
| Do Not Like Chance of Not Getting Cash, or Do Not Like that Program Is Temporary | 7.2 | 5.1 | 0.8 |
| Concerned About Quality of Care or Personal Safety if Hired Own Workers | 1.7 | 14.5 | 3.3 |
| Do Not Want to File Payroll Taxes for Workers or Track Program Expenses | 1.0 | 31.6 | 3.4 |
| Afraid Family or Friends Might Misuse Cash | 1.0 | 1.7 | 0.4 |
| Do Not Think Providing Cash Is a Good Idea | 0.5 | 7.3 | 1.4 |
| None of the Above | 31.3 | 8.7 | 9.5 |
| NUMBER OF RESPONDENTS WHO DECLINED TO PARTICIPATE | 585 | 2,792 | 1,735 |
| SOURCE: MPR's participation questionnaire, administered by demonstration outreach and enrollment workers in each state. NOTE: Columns sum to more than 100 percent because respondents were asked to mark all applicable reasons from the list shown in this table. | |||
Across age groups, elderly beneficiaries were much more likely than other beneficiaries to cite the first two of these three reasons, and nonelderly adults were more likely to indicate that none of the reasons listed in the questionnaire applied to them (Table 5a). Compared with beneficiaries who were using PCS when they declined to participate, about three times as many respondents who were not yet using PCS were deterred by the fact that the demonstration itself was temporary or used random-assignment. Beneficiaries who had used PCS were more likely than those who had not to believe that the proposed allowance would not cover the care they needed. Beneficiaries who had used PCS for one year or less were more much likely than those in the other two groups (18 percent versus roughly 5 percent) to decline to participate because they did not want to hire or possibly fire workers.
According to questionnaire responses, roughly eight in ten Florida beneficiaries who declined to participate did so because they were satisfied with their current care arrangements (Table 5). Roughly 30 percent of beneficiaries did not want to hire and possibly fire workers. A similar proportion did not want to file payroll taxes or track project expenses. In addition, a nontrivial proportion of Florida respondents (15 percent) cited concern over quality of care or safety as a reason for not participating. Across age groups, adults 18-59 years old were more likely than elderly adults or respondents for children to indicate that they did not participate because they were satisfied with their current care arrangements (Table 5b). Compared with nonparticipants in the other three age groups, those who were 60 or older were more likely to be concerned that the proposed allowance would not cover the care they needed (indicated by 20 percent of the eldest nonparticipants). Reasons for declining to participate did not vary much by how long beneficiaries had been using Medicaid HCBS when they made their decision.
| TABLE 5a: Main Reasons for Declining to Participate, by Age and PCS Tenure: Arkansas(Percentages) | ||||||
|---|---|---|---|---|---|---|
| Reasons | Age in Yearsa | How Long Using Medicaid PCSb | ||||
| 18-39 | 40-64 | 65 or Older | Longer than One Year | One Year or Less | No Services Yet | |
| Satisfied with Current Arrangements | 31.0 | 37.5 | 51.0 | 47.5 | 55.9 | 20.6 |
| Concerned Cash Benefit Care Would Not Cover Needed Care | 10.3 | 12.5 | 27.2 | 23.8 | 20.3 | 14.7 |
| Do Not Want to Hire and Possibly Fire Workers | 3.5 | 6.3 | 8.6 | 5.3 | 17.8 | 4.4 |
| Afraid Change Might Upset Family or Friends | 5.2 | 7.0 | 7.6 | 6.9 | 8.5 | 5.9 |
| Do Not Like Chance of Not Getting Cash, or Do Not Like that Program Is Temporary | 10.3 | 7.0 | 6.6 | 5.8 | 5.9 | 17.7 |
| Concerned About Quality of Care or Personal Safety if Hired Own Workers | 0.0 | 2.3 | 1.8 | 1.9 | 1.7 | 1.5 |
| Do Not Want to File Payroll Taxes for Workers or Track Program Expenses | 3.5 | 0.0 | 1.0 | 1.1 | 0.0 | 0.0 |
| Afraid Family or Friends Might Misuse Cash | 0.0 | 0.8 | 1.3 | 1.1 | 0.9 | 1.5 |
| Do Not Think Providing Cash Is a Good Idea | 0.0 | 0.0 | 0.8 | 0.3 | 1.7 | 0.0 |
| None of the Above | 50.0 | 45.3 | 23.9 | 28.5 | 27.7 | 51.5 |
| NUMBER OF RESPONDENTS WHO DECLINED TO PARTICIPATE | 58 | 128 | 394 | 379 | 118 | 68 |
SOURCE: MPR's participation questionnaire, administered by demonstration outreach and enrollment workers in each state. NOTE: Columns sum to more than 100 percent because respondents were asked to mark all applicable reasons from the list shown in this table.
| ||||||
New Jersey respondents overwhelmingly reported that the beneficiary did not participate because they were satisfied with their current arrangements (indicated by 85 percent of all nonparticipants), and very few chose other reasons (Table 5). Among the 307 nonparticipants who reported their age, nonelderly adults were more likely than elderly ones to decline participation because they were concerned that the proposed allowance would not cover the care they needed (21 percent versus 6 percent) (Table 5c). Among beneficiaries who reported how long they had been using PCS, the group that had been using it for a year or less was too small to support valid comparisons.
| TABLE 5b: Main Reasons for Declining to Participate, by Age and HCBS Tenure: Florida(Percentages) | ||||||
|---|---|---|---|---|---|---|
| Reasons | Age in Yearsa | How Long Using Medicaid HCBSb | ||||
| 3-17 | 18-39 | 40-59 | 60 or Older | Longer than One Year | One Year or Less | |
| Satisfied with Current Arrangements | 75.7 | 84.3 | 89.0 | 72.9 | 82.6 | 79.6 |
| Concerned Cash Benefit Care Would Not Cover Needed Care | 9.8 | 5.8 | 5.6 | 20.4 | 10.8 | 6.5 |
| Do Not Want to Hire and Possibly Fire Workers | 32.9 | 29.0 | 29.5 | 37.6 | 32.0 | 27.8 |
| Afraid Change Might Upset Family or Friends | 6.6 | 4.8 | 7.5 | 8.6 | 7.8 | 4.0 |
| Do Not Like Chance of Not Getting Cash, or Do Not Like that Program Is Temporary | 7.5 | 5.3 | 5.0 | 2.1 | 5.9 | 3.2 |
| Concerned About Quality of Care or Personal Safety if Hired Own Workers | 14.4 | 14.3 | 13.5 | 19.5 | 15.7 | 12.5 |
| Do Not Want to File Payroll Taxes for Workers or Track Program Expenses | 34.5 | 32.5 | 29.9 | 32.4 | 32.4 | 31.5 |
| Afraid Family or Friends Might Misuse Cash | 2.7 | 2.1 | 0.8 | 0.4 | 1.6 | 1.5 |
| Do Not Think Providing Cash Is a Good Idea | 5.3 | 6.2 | 11.2 | 9.2 | 8.5 | 4.6 |
| None of the Above | 12.2 | 9.2 | 7.5 | 5.5 | 6.5 | 12.7 |
| NUMBER OF RESPONDENTS WHO DECLINED TO PARTICIPATE | 589 | 951 | 481 | 524 | 1,782 | 755 |
SOURCE: MPR's participation questionnaire, administered by demonstration outreach and enrollment workers in each state.NOTE: Columns sum to more than 100 percent because respondents were asked to mark all applicable reasons from the list shown in this table.
| ||||||
Discussion
The questionnaire responses of participants confirm that the promise of the Cash and Counseling model--more choice and more control--resonates strongly with interested Medicaid beneficiaries and their families. Of nine specific ways that Cash and Counseling could improve participants' situations, four were cited by most respondents in each of the states and the other reasons were cited by sizable minorities in at least two states.
The questionnaire responses of nonparticipants suggest that gaining choice and control may not be sufficient to draw beneficiaries away from traditional PCS or HCBS if those services are satisfactory. However, some respondents perceived barriers to consumer direction that states might be able to reduce. Apart from satisfaction with current care arrangements, the most common reasons for not participating in the demonstration were concern that the allowance would not cover needs and a disinclination to hire and fire workers. For some respondents who listed these reasons, consumer control might never be desirable or suitable. For others, the decision not to participate might be reversible. For example, consumer direction might be more attractive if worker registries were available, especially for beneficiaries needing to hire nonrelatives or workers with specific skills. Peer-support networks between participants, or between participants and prospective participants, might be appealing forums for sharing practical advice, including ways to stretch allowance dollars as far as possible.
| TABLE 5c: Main Reasons for Declining to Participate, by Age and PCS Tenure: New Jersey(Percentages) | ||||
|---|---|---|---|---|
| Reasons | Age in Yearsa | How Long Using Medicaid PCSb | ||
| 18-64 | 65 or Older | Longer than One Year | One Year or Less | |
| Satisfied with Current Arrangements | 81.6 | 80.4 | 82.7 | 74.0 |
| Concerned Cash Benefit Care Would Not Cover Needed Care | 21.4 | 6.2 | 12.4 | 6.0 |
| Do Not Want to Hire and Possibly Fire Workers | 8.2 | 8.6 | 9.4 | 4.0 |
| Afraid Change Might Upset Family or Friends | 4.1 | 5.7 | 6.0 | 2.0 |
| Do Not Like Chance of Not Getting Cash, or Do Not Like that Program Is Temporary | 4.1 | 3.4 | 4.1 | 0.0 |
| Concerned About Quality of Care or Personal Safety if Hired Own Workers | 12.2 | 14.4 | 16.5 | 4.0 |
| Do Not Want to File Payroll Taxes for Workers or Track Program Expenses | 7.1 | 11.5 | 10.2 | 10.0 |
| Afraid Family or Friends Might Misuse Cash | 1.0 | 1.0 | 1.1 | 0.0 |
| Do Not Think Providing Cash Is a Good Idea | 41.0 | 4.3 | 4.1 | 4.0 |
| None of the Above | 51.0 | 7.2 | 5.3 | 12.0 |
| NUMBER OF RESPONDENTS WHO DECLINED TO PARTICIPATE | 98 | 209 | 266 | 50 |
SOURCE: MPR's participation questionnaire, administered by demonstration outreach and enrollment workers in each state.NOTE: Columns sum to more than 100 percent because respondents were asked to mark all applicable reasons from the list shown in this table.
| ||||
The finding that a third of nonparticipants in Florida cited not wanting to file payroll taxes for workers or track project expenses as a reason not to participate seems to suggest some beneficiaries require a more thorough explanation of the counseling and fiscal services available through Cash and Counseling programs. Although Cash and Counseling participants could choose to have the program fiscal agent file payroll taxes for them, some nonparticipants may not have understood this program feature when responding to the questionnaire.16 A forthcoming study of Cash and Counseling nonparticipation, funded by ASPE and designed and conducted by MPR, will measure beneficiaries' awareness and understanding of various program features, including the availability of counseling and fiscal services.
Finally, it is notable that beneficiaries' reasons for agreeing or declining to participate in the demonstration generally differed only slightly by age group and service use tenure. The few discernible variations were limited to participants. Elderly participants in Arkansas and New Jersey were more likely than others to say they participated in order to pay family members or friends. Compared with younger participants, elderly ones may have been more reluctant to have strangers in their homes, or they may have wished to avoid supervising and training workers, which perhaps is less necessary for relatives and friends than for other paid workers. The preference for hiring family did not differ by age group in Florida, where retirees from other states may have had fewer relatives nearby, and thus less intention of hiring relatives under Cash and Counseling. Also in Arkansas and New Jersey, longtime users of PCS were more likely than newer users to say that they agreed to participate in order to purchase equipment or supplies or modifications as opposed to human assistance. Perhaps longtime users thought more imaginatively about ways to increase their independence without relying on others. In Florida HCBS benefits often include equipment, supplies, and modifications, so preference for such benefits may not vary over time.
DEMONSTRATION EFFECTS ON THE NUMBER OF NEW SERVICE USERS
While the Cash and Counseling Demonstration and Evaluation was being planned, one concern was that giving Medicaid beneficiaries the opportunity to receive a monthly allowance in lieu of traditional PCS or HCBS might lead some eligible beneficiaries to enroll in the demonstration who otherwise would not have used benefits, thereby increasing public costs. We examined trends in the number of beneficiaries using PCS or HCBS for the first time before and during demonstration intake for indirect evidence that the demonstration affected program flow.
Research Hypothesis and Rationale
With the benefit of hindsight, there are several reasons to hypothesize that program flow did not greatly increase as a result of the demonstration. First, the states' enrollment polices helped avert increased inflow. Florida restricted enrollment to beneficiaries who were already receiving HCBS. New Jersey restricted enrollment to beneficiaries who were receiving PCS or had been assessed for PCS by a personal care agency. Arkansas, whose target population included beneficiaries who would be using PCS for the first time or for the first time in awhile, required prospective enrollees to agree to pursue and use agency services if they were assigned to the demonstration control group. (The state could not enforce the agreement, however, if control group members opted not pursue agency services after all.) In addition, the terms and conditions of the demonstration specified that ratios of new to continuing service users among demonstration participants were not to exceed historic benchmark ratios. Arkansas did briefly close enrollment to beneficiaries who were not already using PCS because it reached its benchmark ratio of 0.41. Finally, regardless of states' enrollment policies, their actual enrollment experiences alleviate concerns about increased inflow. As noted, all three states took much longer than expected to meet enrollment targets required for the evaluation. Given that enrollment generally progressed more slowly than anticipated, it would be surprising to find that many beneficiaries accessed PCS or HCBS for the first time as a result of the demonstration.
Methods
We examined trends in PCS and HCBS program flow by comparing monthly ratios of new service users to all users over time. If the demonstration affected the number of people using services for the first time, we would expect ratios to have increased during states' intake periods or shortly before, when community outreach was under way.
Data were drawn from claims for PCS in Arkansas and New Jersey, and for HCBS in Florida. We examined claims during the 24 months before and after the first month of evaluation intake in each state or, in the case of Florida, until age-specific sample-size targets were met. For each of the observed months, we counted the number of beneficiaries who used PCS or HCBS and were old enough to enroll in the demonstration that month. That is, we counted beneficiaries who had a claim of some nonzero amount and were 18 or older in Arkansas and New Jersey, and 3 or older in Florida. These service users comprised the denominators of the monthly ratios. We then classified users as new in a given month if they had no claims in any of the three preceding months. These new services users comprised the numerators in the monthly ratios. Monthly numerators and denominators for each state are shown in Table A.6.
| FIGURE 2: Ratios of New PCS Users to All PCS Users, by Month: Arkansas |
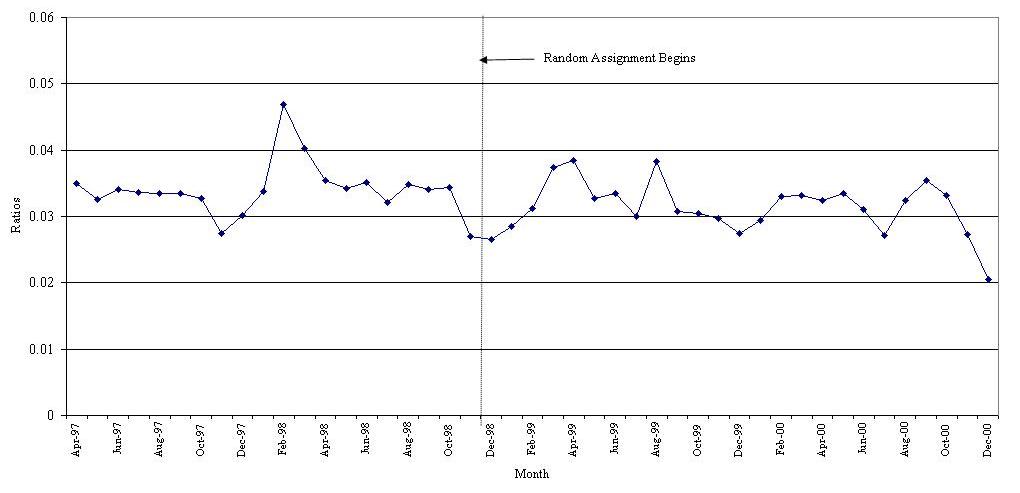 |
| SOURCE: Medicaid PCS claims, January 1997 to December 2000. NOTE: In a given month, new users are those with claims for the first time or for the first time in three months. |
Results
Program flow in Arkansas was quite stable throughout the observation period, April 1997 to December 2000. Monthly ratios of new PCS users to all services users ranged from 0.027 to 0.047 (Figure 2). They dipped and rose from month to month rather than climbing over time, as would be expected if the demonstration had increased the inflow of new users. The mean ratios were 0.034 during the pre-period and 0.031 during demonstration intake.17
| FIGURE 3: Ratios of New PCS Users to All PCS Users, by Month: New Jersey |
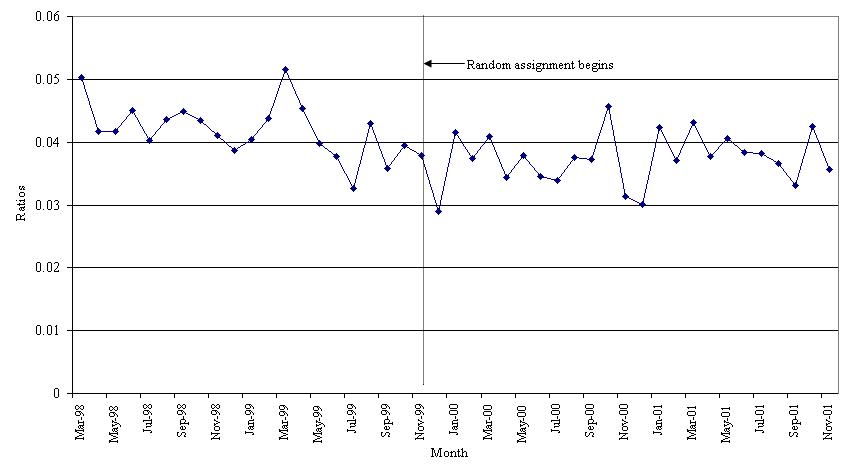 |
| SOURCE: Medicaid PCS claims, December 1997 to November 2001. NOTE: In a given month, new users are those with claims for the first time or for the first time in three months. |
Program flow in New Jersey was also quite stable throughout the observation period, March 1998 to November 2001. Monthly ratios of new service users to all users fluctuated from 0.033 to 0.052 during the pre-period and from 0.029 to 0.046 during intake (Figure 3). The mean ratios were 0.042 during the pre-period and 0.037 during intake.
Markedly different patterns of program flow occurred in Florida. In all three age groups, many beneficiaries incurred claims for HCBS for the first time, or for the first time in three months, during the year before demonstration intake commenced, in June 2000. Pre-period ratios climbed from 0.040 to 0.126 among children, from 0.013 to 0.036 among nonelderly adults, and from 0.043 to 0.055 among elderly adults (Figure 4a, Figure 4b, and Figure 4c). During intake, ratios fell for all three groups, although they rose for elderly users in July 2001 and remained quite high for several months.
| FIGURE 4a: Ratios of New PCS Users to All PCS Users, by Month: Florida Children |
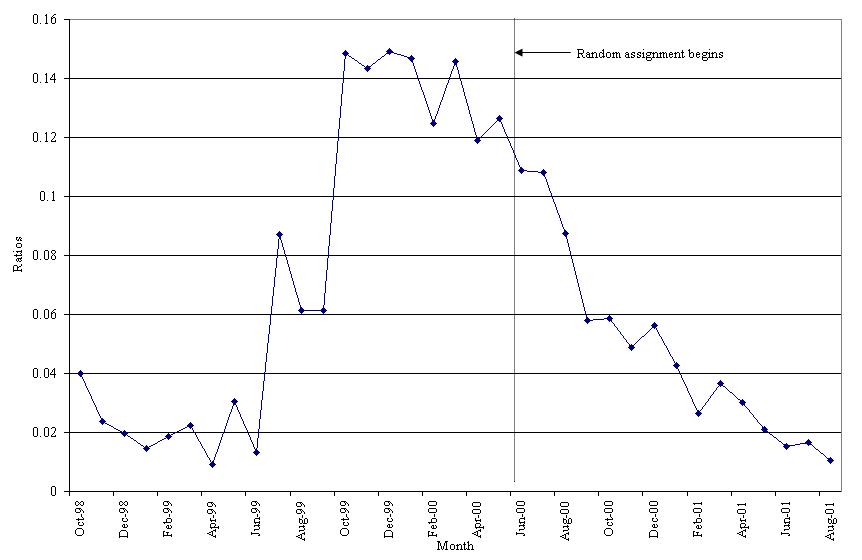 |
| SOURCE: Medicaid HCBS claims, July 1998 to August 2001. NOTE: In a given month, new users are those with claims for the first time or for the first time in three months. |
Discussion
The results support limited conclusions. Measuring trends in program flow is straightforward, but it is difficult to attribute changes to the introduction of the demonstration. Without information about trends outside the demonstration, we cannot disentangle the effects of those trends on aggregate program flow from the effects of Cash and Counseling. Conversely, without information about why some demonstration enrollees did not receive Medicaid PCS or HCBS after being randomly assigned to the demonstration control group, we cannot know the extent to which new service users were: (1) exclusively interested in the program allowance and thus did not use traditional PCS or HCBS, or (2) unable to access services from personal care agencies, because of labor shortages, for example.
The problem of wrongly attributing program flow trends to the Cash and Counseling demonstration is illustrated by the experience in Florida, where program flow increased sharply in the year before evaluation intake. Although the pattern could suggest that the demonstration affected program flow, an alternative explanation is more convincing: Florida's Cash and Counseling demonstration happened to follow a dramatic increase in the supply of HCBS for Floridians with developmental disabilities. The 1998 class action lawsuit Doe v. Chiles prompted Florida to begin serving people who had been on a waiting list for HCBS and to increase services for program participants with unmet needs. Between July 1998 and June 2000, Florida began serving 17,000 people who had been on waiting lists and increased funding for HCBS from $196 million to $501 million (Florida Department of Health and Human Services 2005; The Able Trust 2002). In light of these developments and the difficulty Florida had in meeting its evaluation enrollment targets for adults, it seems highly unlikely that the Cash and Counseling demonstration contributed much to the program flow trend. Even if none of the beneficiaries who enrolled in the Florida demonstration would have used HCBS in the absence of the demonstration, they would not account for the increase in the ratios of new users to all users observed in the pre-period. The increased inflow began, moreover, many months before beneficiaries were likely to be aware of the coming demonstration.
| FIGURE 4b: Ratios of New PCS Users to All PCS Users, by Month: Florida Nonelderly Adults |
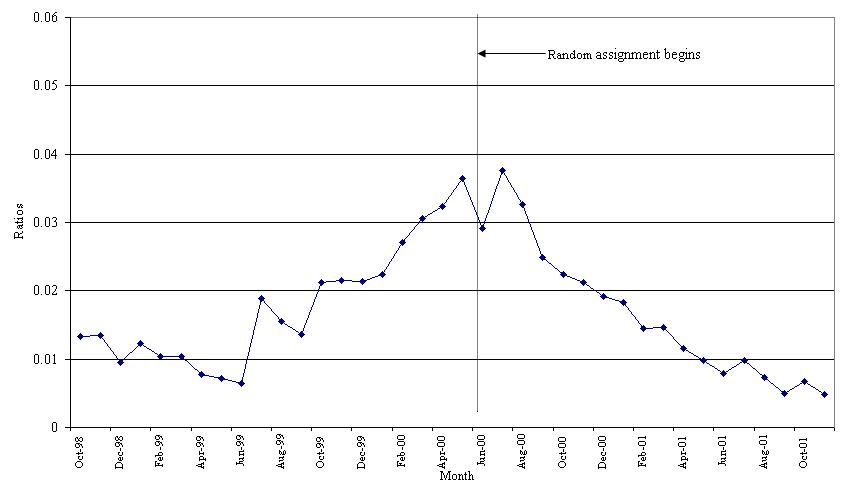 |
| SOURCE: Medicaid HCBS claims, July 1998 to November 2001. NOTE: In a given month, new users are those with claims for the first time or for the first time in three months. |
In Arkansas, despite similar ratios before and during intake, the demonstration may have contributed to increased program flow. This claims-based analysis is limited in that fails to account for any beneficiaries who might have enrolled in the demonstration in order to receive the program allowance but were randomly assigned to the control group and did not use PCS thereafter. Had all demonstration enrollees been able to participate in Cash and Counseling--instead of only those who were randomly assigned to the treatment group--then some of these control group members would presumably have gone on to receive a Cash and Counseling allowance, and thus incur Medicaid PCS claims. In a companion report from the Cash and Counseling evaluation, Dale et al. (2004) found that 66 percent of control group members who had not used PCS in the year before their random-assignment also did not use it in the following year. The authors surmised that some of these control group members probably were interested in a program allowance exclusively, but they could not ascertain exact proportions.
| FIGURE 4c: Ratios of New PCS Users to All PCS Users, by Month: Florida Elderly Adults |
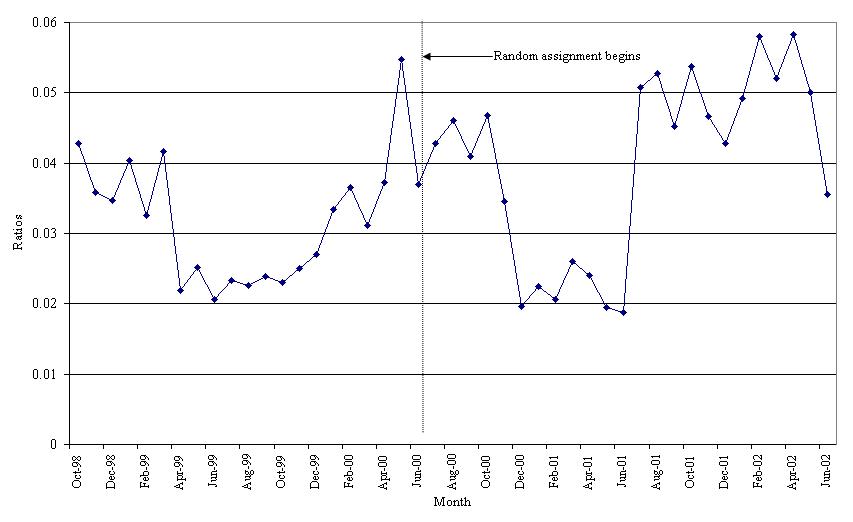 |
| SOURCE: Medicaid HCBS claims, July 1998 to June 2002. NOTE: In a given month, new users are those with claims for the first time or for the first time in three months. |
The lack of PCS use by some Arkansas control group members seems to reflect both demonstration-induced change in program flow and problems in accessing care that the demonstration was meant to address. Survey data from a small sample of control group members who were not using PCS nine months after random-assignment suggested that most (30 of 47) had not tried to access agency services. At the same time, however, Arkansas personal care agencies reported that labor shortages undoubtedly contributed to the low levels of service receipt in the control group. In sensitivity tests we estimated that the number of beneficiaries using PCS during the 24-month intake period might have been 0.9 percent to 1.8 percent larger than what would have occurred had Cash and Counseling not been offered.18
New Jersey exhibited stable program flow before and during demonstration intake and, unlike Arkansas, did not enroll brand new PCS users into the demonstration. Anyone seeking PCS benefits only in the form of a cash allowance had at least to undergo an assessment by a personal care agency before enrolling in the demonstration for a chance to receive the allowance. This requirement might not have entirely averted an inflow of new users, but New Jersey had such difficulty meeting its enrollment targets that large increases in inflow seem highly implausible. Moreover, that beneficiaries in New Jersey and the other states who began using PCS during the demonstration intake period were significantly less likely than continuing users to enroll in the demonstration (Table 3) suggests that some enrollees may have been solely interested in the monthly allowance but most were not.
CONCLUSIONS
Arkansas, Florida, and New Jersey each tested the Cash and Counseling model of consumer-directed supportive services in their Medicaid programs for beneficiaries with disabilities. This assessment of the appeal of the demonstration raises several considerations for other states. Overall, the three-state demonstration attracted fairly small proportions (5-10 percent) of eligible beneficiaries. It is difficult to say whether other states should expect similar results. On the one hand, the participation rates achieved in Arkansas, Florida, and New Jersey might be higher than an ongoing program would achieve because they resulted from outreach efforts of an intensity that may not be attained outside a demonstration. On the other hand, it is plausible that participation rates would increase with time, as states refine their outreach strategies and favorable word of mouth raises awareness of the programs. Thus, demonstration participation could be viewed as lower than would be expected in a mature program.
Second, beneficiaries and their families were attracted to the Cash and Counseling demonstration primarily because of the ability to control hiring, to get care at more convenient times, to get better or more care, and to pay family and friends for caregiving. The ability to use a program allowance to buy care supplies and equipment did not seem to be of great importance to most beneficiaries. However, this too may change over time, as suggested by the finding that, in Arkansas, longtime PCS users were more likely than others to say they participated in the demonstration in order to make such purchases.
Third, most beneficiaries who declined to participate in Cash and Counseling programs said they did so because they were sufficiently satisfied with the care they had. This finding reinforces the hypothesis that, for most people, gaining control over one's care is not incentive enough to assume the responsibilities that would be an inherent part of that control. It is also possible, however, that some of these satisfied respondents chose not to participate in the demonstration because they feared it would jeopardize the benefits they already had. This concern was expressed by Florida beneficiaries who participated in focus group discussions and had recently had their HCBS benefits increased as a result of Doe v. Chiles (Zacharias 2001b). Thus, training outreach workers to reassure prospective participants that their benefit levels are not at risk may be advisable.
States wishing to minimize other barriers to consumer direction may want to focus on demonstrating how the program allowance could be allocated to adequately cover the beneficiary's care needs, and on increasing beneficiary awareness of counseling and fiscal services. States might also do well by explaining the ways in which family caregivers could benefit from Cash and Counseling.
Finally, the demonstration states did not find that adding a Cash and Counseling option to their Medicaid systems led large numbers of Medicaid beneficiaries to use PCS or HCBS if they otherwise would not have. Other states should consider that, although requiring beneficiaries to use traditional PCS or HCBS before enrolling in Cash and Counseling will decrease the incidence of program-inspired service use, it will also eliminate the possibility of serving eligible beneficiaries who cannot readily access traditional services because of labor shortages or geographic isolation. Our analysis of Arkansas program flow suggested that the number of eligible beneficiaries who would elect to participate in Cash and Counseling, but who would not use traditional PCS or HCBS, is quite limited--in Arkansas's case it was probably not more than 1.8 percent of all users.
Although this report has looked back on the early stages of the implementation of the Cash and Counseling Demonstration and Evaluation and the initial behavior and reactions of eligible beneficiaries, much has been learned since about how the demonstration programs affected participants, their caregivers, and public costs. (See the list of Companion Reports following the References.) As noted, Arkansas, Florida, and New Jersey continue to operate their Cash and Counseling programs under Section 1115 authority of the Social Security Act. Moreover, RWJF, ASPE, and the Administration on Aging have awarded 3 year grants to allow 11 more states to introduce Cash and Counseling programs into their Medicaid systems.
REFERENCES
The Able Trust. "Governor Bush Calls for Expansion of Test Accommodations for Students with Disabilities." Press release, April 3, 2002. Tallahassee, FL: The Able Trust, 2002. Available at [http://www.abletrust.org/news/press_release/20020403.shtml]. Accessed March 8, 2005.
Dale, Stacy, Randall Brown, and Barbara Phillips. "Does Arkansas's Cash and Counseling Affect Service Use and Public Costs?" Princeton, NJ: Mathematica Policy Research, Inc., June 2004. [http://aspe.hhs.gov/daltcp/reports/ARsupc.htm]
Eustis, Nancy N. "Consumer-Directed Long-Term Care Services: Evolving Perspectives and Alliances." Generations, vol. 20, no. 3, 2000, pp. 10-15.
Florida Department of Health and Human Services. "Increased Support for Persons with Developmental Disabilities." Florida's e-Budget 2005-2006. Available at [http://www.ebudget.state.fl.us/Highlights/health/develop_services.asp]. Accessed March 23, 2005.
Harrington, Charlene, and Martin Kitchener. "Medicaid Long-Term Care: Changes, Innovations, and Cost Containment." San Francisco, CA: University of California, San Francisco, July 2003. Available at [http://www.ncsl.org/programs/health/harrington]. Accessed March 18, 2004.
Mahoney, Kevin, Lori Simon-Rusinowitz, Dawn Loughlin, Sharon Desmond, and Marie Squillace. "Determining Personal Care Consumers' Preferences for a Consumer-Directed Cash and Counseling Option: Survey Results from Arkansas, Florida, New Jersey, and New York Elders and Adults with Physical Disabilities." Health Services Research, vol. 39, no. 3, June 2004, pp. 643-663.
Phillips, Barbara, and Barbara Schneider. "Changing to Consumer-Directed Care: The Implementation of the Cash and Counseling Demonstration in Florida." Princeton, NJ: Mathematica Policy Research, Inc., July 2004. [http://aspe.hhs.gov/daltcp/reports/FLchange.htm]
Phillips, Barbara, and Barbara Schneider. "Enabling Personal Preference: The Implementation of the Cash and Counseling Demonstration in New Jersey." Princeton, NJ: Mathematica Policy Research, Inc., March 2003. [http://aspe.hhs.gov/daltcp/reports/enablepp.htm]
Phillips, Barbara, and Barbara Schneider. "Moving to IndependentChoices: The Implementation of the Cash and Counseling Demonstration in Arkansas." Princeton, NJ: Mathematica Policy Research, Inc., May 2002. [http://aspe.hhs.gov/daltcp/reports/movingic.htm]
Stone, Robyn. "Consumer Direction in Long-Term Care." Generations, vol. 20, no. 3, fall 2000, pp. 5-9.
Zacharias, B. Lee. "Cash and Counseling Demonstration: Next Steps." Report on Arkansas Non-Participant Focus Groups. Portland, ME: The Zacharias Group, August 2004.
Zacharias, B. Lee. "Consumer Directed Care: Report on Florida Elder Affairs Focus Groups." College Park, MD: University of Maryland Center on Aging, May 2001a. Available at [http://www.cashandcounseling.org/downloads/zachelders.doc].
Zacharias, B. Lee. "Consumer Directed Care: Florida Department of Children and Families, Developmental Services Program, Report on Focus Groups." College Park, MD: University of Maryland Center on Aging, August 2001b. Available at [http://www.cashandcounseling.org/downloads/zachchild.doc].
Zacharias, B. Lee. "IndependentChoices: Report on Arkansas Focus Groups." College Park, MD: University of Maryland Center on Aging, June 2000. Available at [http://www.cashandcounseling.org/downloads/zacharias_ar_report_jun2000.doc].
COMPANION REPORTS
Impacts on Quality of Care and Use of Personal Care
These reports compare treatment and control group members, using data from telephone interviews describing, among other outcomes measured nine months after random-assignment: satisfaction, unmet need, disability-related health, and hours and types of personal care received.
Carlson, Barbara Lepidus, Stacy Dale, Leslie Foster, Randall Brown, Barbara Phillips, and Jennifer Schore. "Effect of Consumer Direction on Adults' Personal Care and Well-Being in Arkansas, New Jersey, and Florida." Princeton, NJ: Mathematica Policy Research, Inc., May 2005. [http://aspe.hhs.gov/daltcp/reports/adultpcw.htm]
Foster, Leslie, Randall Brown, Barbara Phillips, Jennifer Schore, and Barbara Lepidus Carlson. "Does Consumer Direction Affect the Quality of Medicaid Personal Assistance in Arkansas?" Princeton, NJ: Mathematica Policy Research, Inc., March 2003. [http://aspe.hhs.gov/daltcp/reports/arqual.htm]
Also see published version of this report: Foster et al. "Improving the Quality of Medicaid Personal Care Through Consumer Direction." Health Affairs Web exclusive W3, March 26, 2003, pp. 162-175.
Dale, Stacy, Randall Brown, Barbara Phillips, Jennifer Schore, and Barbara Lepidus Carlson. "The Effect of Consumer Direction on Personal Assistance Received in Arkansas." Princeton, NJ: Mathematica Policy Research, Inc., May 2004. [http://aspe.hhs.gov/daltcp/reports/Arkpa.htm]
Also see published version of this report: Dale et al. "The Effects of Cash and Counseling on Personal Care Services and Medicaid Costs in Arkansas." Health Affairs Web exclusive W3, November 19, 2003, pp. 566-575.
Foster, Leslie, Stacy Dale, Randall Brown, Barbara Phillips, Jennifer Schore, and Barbara Lepidus Carlson. "Do Consumer-Directed Supportive Services Work for Children with Developmental Disabilities?" Princeton, NJ: Mathematica Policy Research, Inc., September 2004. [http://aspe.hhs.gov/daltcp/reports/ddkidsMss.htm]
Impacts on the Cost of Medicaid and Medicare Services
These reports compare treatment and control group members, using Medicaid and Medicare data describing the cost of personal care and other covered services measured during the year after random-assignment, as well as presenting information about Cash and Counseling program costs.
Dale, Stacy, Randall Brown, and Barbara Phillips. "Does Arkansas' Cash and Counseling Affect Service Use and Public Costs?" Princeton, NJ: Mathematica Policy Research, Inc., June 2004. [http://aspe.hhs.gov/daltcp/reports/ARsupc.htm]
Dale, Stacy, Randall Brown, and Barbara Phillips. "Medicaid Costs Under Consumer Direction for Florida Children with Developmental Disabilities." Princeton, NJ: Mathematica Policy Research, Inc., December 2004. [http://aspe.hhs.gov/daltcp/reports/FLddkids.htm]
Dale, Stacy, and Randall Brown. "The Effect of Cash and Counseling on Medicaid and Medicare Costs: Findings for Adults in Three States." Princeton, NJ: Mathematica Policy Research, Inc., May 2005. [http://aspe.hhs.gov/daltcp/reports/3stcost.htm]
Impacts on Informal Caregiving
These reports compare the experiences of primary informal caregivers of treatment and control group members (identified at the time of random-assignment), using data from telephone interviews describing caregiver burden and well-being nine months after random-assignment.
Foster, Leslie, Randall Brown, Barbara Phillips, and Barbara Lepidus Carlson. "Easing the Burden of Caregiving: The Effect of Consumer Direction on Primary Informal Caregivers in Arkansas" Princeton, NJ: Mathematica Policy Research, Inc., August 2003. [http://aspe.hhs.gov/daltcp/reports/easing.htm]
Foster, Leslie, Randall Brown, Barbara Phillips, and Barbara Lepidus Carlson. "The Effects of Cash and Counseling on the Primary Informal Caregivers of Children with Developmental Disabilities." Princeton, NJ: Mathematica Policy Research, Inc., April 2005. [http://aspe.hhs.gov/daltcp/reports/ddkidpic.htm]
Foster, Leslie, Randall Brown, Barbara Phillips, and Barbara Lepidus Carlson. "How Cash and Counseling Affects Informal Caregivers: Findings from Arkansas, Florida, and New Jersey." Princeton, NJ: Mathematica Policy Research, Inc., July 2005. [http://aspe.hhs.gov/daltcp/reports/ICaffect.htm]
Experiences of Paid Workers
These reports compare the experiences of primary paid workers of treatment and control group members (identified nine months after random-assignment), using data from telephone interviews describing working conditions, burden, and well-being 10 months after random-assignment. The Arkansas report is listed below; a report on workers in all three demonstration states is forthcoming.
Dale, Stacy, Randall Brown, Barbara Phillips, and Barbara Lepidus Carlson. "The Experiences of Workers Hired Under Consumer Direction in Arkansas." Princeton, NJ: Mathematica Policy Research, Inc., June 2003. [http://aspe.hhs.gov/daltcp/reports/ARhired.htm]
Program Implementation
These reports describe program goals, features, and procedures in detail based on in-person interviews with program staff. There is one report for each state program and a fourth report presenting implementation lessons drawn across the three programs.
Phillips, Barbara, and Barbara Schneider. "Moving to IndependentChoices: The Implementation of the Cash and Counseling Demonstration in Arkansas." Princeton, NJ: Mathematica Policy Research, Inc., May 2002. [http://aspe.hhs.gov/daltcp/reports/movingic.htm]
Phillips, Barbara, and Barbara Schneider. "Enabling Personal Preference: The Implementation of the Cash and Counseling Demonstration in New Jersey." Princeton, NJ: Mathematica Policy Research, Inc., March 2003. [http://aspe.hhs.gov/daltcp/reports/enablepp.htm]
Phillips, Barbara, and Barbara Schneider. "Changing to Consumer-Directed Care: The Implementation of the Cash and Counseling Demonstration in Florida." Princeton, NJ: Mathematica Policy Research, Inc., July 2004. [http://aspe.hhs.gov/daltcp/reports/FLchange.htm]
Phillips, Barbara, Kevin Mahoney, Lori Simon-Rusinowitz, Jennifer Schore, Sandra Barrett, William Ditto, Tom Reimers, and Pamela Doty. "Lessons from the Implementation of Cash and Counseling in Arkansas, Florida, and New Jersey." Princeton, NJ: Mathematica Policy Research, Inc., June 2003. [http://aspe.hhs.gov/daltcp/reports/cclesson.htm]
These reports provide an overview of program implementation by distilling information from the site visit reports noted above and synthesizing this information with data from a mail survey of counselors and telephone interviews with consumers in the program treatment groups.
Schore, Jennifer, and Barbara Phillips. "Consumer and Counselor Experiences in the Arkansas IndependentChoices Program." Princeton, NJ: Mathematica Policy Research, Inc., January 2004. [http://aspe.hhs.gov/daltcp/reports/arkexp.htm]
Foster, Leslie, Barbara Phillips, and Jennifer Schore. "Consumer and Consultant Experiences in the Florida Consumer Directed Care Program." Princeton, NJ: Mathematica Policy Research, Inc., June 2005. [http://aspe.hhs.gov/daltcp/reports/FLcdcp.htm]
Foster, Leslie, Barbara Phillips, and Jennifer Schore. "Consumer and Consultant Experiences in the New Jersey Personal Preference Program." Princeton, NJ: Mathematica Policy Research, Inc., July 2005. [http://aspe.hhs.gov/daltcp/reports/NJppp.htm]
Final Evaluation Report
This report summarizes the findings from five years of research by Mathematica Policy Research, Inc. on how each of the three demonstration states implemented its program, and on how the programs have affected the consumers who participated, the consumers' paid and unpaid caregivers, and the costs to Medicaid.
Brown, Randall, Barbara Lepidus Carlson, Stacy Dale, Leslie Foster, Barbara Phillips, and Jennifer Schore. "Cash and Counseling: Improving the Lives of Medicaid Beneficiaries Who Need Personal Care or Home- and Community-Based Services." Draft report. Princeton, NJ: Mathematica Policy Research, Inc., July 2005.
APPENDIX A: ADDITIONAL RESULTS
| TABLE A.1: Characteristics of Cash and Counseling Participants and Nonparticipants, by State | |||||||||
|---|---|---|---|---|---|---|---|---|---|
| Arkansas | Florida | New Jersey | |||||||
| Part.(n = 1,710) | Nonpart.(n = 20,181) | Diff. | Part.(n = 2,797) | Nonpart.(n = 31,322) | Diff. | Part.(n = 1,567) | Nonpart.(n = 23,169) | Diff. | |
| YEARS OF AGEa | |||||||||
| ** | *** | *** | |||||||
| 3-12 | n.a. | n.a. | n.a. | 25.3 | 10.2 | 15.1 | n.a. | n.a. | n.a. |
| 13-17 | n.a. | n.a. | n.a. | 10.4 | 6.5 | 4.0 | n.a. | n.a. | n.a. |
| 18-39 | 6.5 | 6.8 | -0.3 | 24.4 | 31.4 | -7.0 | 14.7 | 9.0 | 5.7 |
| 40-64 (or 40-59) | 19.7 | 17.6 | 2.2 | 7.9 | 17.3 | -9.3 | 31.3 | 26.2 | 5.1 |
| 65-79 (or 60-79) | 36.8 | 35.4 | 1.3 | 16.8 | 18.0 | -1.2 | 32.0 | 38.0 | -6.0 |
| 80 or older | 37.0 | 40.2 | -3.2 | 15.1 | 16.6 | -1.5 | 22.0 | 26.8 | -4.8 |
| FEMALE | 78.5 | 75.6 | 2.9*** | 53.3 | 55.2 | -1.9** | 73.3 | 74.3 | -1.0 |
| RACE | |||||||||
| *** | *** | ||||||||
| White | 60.6 | 62.0 | -1.3 | 56.8 | 57.5 | -0.7 | 34.8 | 42.0 | -7.2 |
| Black | 29.8 | 29.0 | 0.8 | 16.1 | 20.3 | -4.3 | 29.4 | 25.6 | 3.8 |
| Hispanic | n.a. | n.a. | n.a. | 5.3 | 5.0 | 0.3 | 7.9 | 8.1 | -0.2 |
| Other | 0.5 | 0.3 | 0.2 | 21.8 | 17.2 | 4.7 | 27.9 | 24.3 | 3.6 |
| Missing | 9.1 | 8.8 | 0.3 | n.a. | n.a. | n.a. | n.a. | n.a. | n.a. |
| RESIDES IN: | |||||||||
| An MSA | 35.0 | 26.9 | 8.1*** | 94.6 | 93.1 | 1.5*** | n.c. | n.c. | *** |
| Northwest NJ | n.a. | n.a. | n.a. | n.a. | n.a. | n.a. | 3.1 | 2.6 | 0.6 |
| Northeast NJ | n.a. | n.a. | n.a. | n.a. | n.a. | n.a. | 65.7 | 72.5 | -6.8 |
| Central NJ | n.a. | n.a. | n.a. | n.a. | n.a. | n.a. | 15.1 | 12.7 | 2.5 |
| South NJ | n.a. | n.a. | n.a. | n.a. | n.a. | n.a. | 16.0 | 12.3 | 3.7 |
| CLAIMS RELATIVE TO INTAKE PERIOD | |||||||||
| *** | |||||||||
| Before and during | 63.8 | 64.7 | -0.9 | 62.6 | 62.9 | 0.3 | 65.0 | 58.6 | 6.4 |
| Only during | 36.2 | 35.3 | 0.9 | 37.4 | 37.1 | -0.3 | 35.0 | 41.4 | -6.4 |
| DIED DURING INTAKE PERIOD | 11.9 | 17.0 | -5.1*** | 4.7 | 9.0 | -4.3*** | 6.4 | 15.7 | -9.2*** |
| MONTHLY COSTS FOR PCS OR HCBSb | |||||||||
| Mean dollars | 331.4 | 322.5 | 8.9 | 1,022.9 | 1,244.3 | -221.5*** | 1,043.4 | 902.0 | 141.5*** |
| Percent distribution | *** | *** | *** | ||||||
| Less than $150 | 22.5 | 20.4 | 2.1 | 8.8 | 14.4 | -5.5 | 1.7 | 4.0 | -2.4 |
| $150-$299 | 28.7 | 34.3 | -5.7 | 15.4 | 14.1 | 1.3 | 6.6 | 7.3 | -0.7 |
| $300-$499 | 29.0 | 25.3 | 3.7 | 16.2 | 13.7 | 2.5 | 10.3 | 13.0 | -2.7 |
| $500-$749 | 21.2 | 17.9 | -1.5 | 13.7 | 13.3 | 0.3 | 14.7 | 19.1 | -4.4 |
| $750-$999 | 2.5 | 1.8 | 0.7 | 11.2 | 10.2 | 1.0 | 18.0 | 18.8 | -0.8 |
| $1,000-$1,249 | 0.4 | 0.1 | 0.3 | 8.1 | 6.8 | 1.3 | 15.7 | 14.1 | 1.6 |
| $1,250-$1,499 | 0.1 | 0.1 | 0.0 | 6.7 | 4.1 | 2.6 | 12.8 | 10.6 | 2.2 |
| $1,500 or more | 0.5 | 0.1 | 0.4 | 19.9 | 23.5 | -3.6 | 20.2 | 13.1 | 7.1 |
SOURCE: Program records from each demonstration state and claims for PCS or HCBS: From January 1997 through December 2000 for Arkansas, from July 1998 through June 2002 for Florida, and from December 1997 through November 2001 for New Jersey. Claims were observed for 24 months before and after the first month of intake in each state or until the state met its evaluation enrollment target for an age group, whichever came first. NOTE: Beneficiaries were excluded from the analysis if they did not have a claim during the portion of the intake period observed through claims.
*Significantly different from zero at the .10 level, using a chi-square or t-test. **Significantly different from zero at the .05 level, using a chi-square or t-test. ***Significantly different from zero at the .01 level, using a chi-square or t-test. n.a. = not applicable; n.c. = not calculated because on variation (all New Jersey counties are in MSAs) | |||||||||
| TABLE A.1a: Characteristics of Cash and Counseling Participants and Nonparticipants, by Age Group: Florida | |||||||||
|---|---|---|---|---|---|---|---|---|---|
| 3-17 | 18-59 | 60 or Older | |||||||
| Part.(n = 1,000) | Nonpart.(n = 5,237) | Diff. | Part.(n = 905) | Nonpart.(n = 15,255) | Diff. | Part.(n = 892) | Nonpart.(n = 10,830) | Diff. | |
| YEARS OF AGEa | |||||||||
| *** | *** | ||||||||
| 3-12 | 70.8 | 61.2 | 9.6 | n.a. | n.a. | n.a. | n.a. | n.a. | n.a. |
| 13-17 | 29.2 | 38.8 | -9.6 | n.a. | n.a. | n.a. | n.a. | n.a. | n.a. |
| 18-39 | n.a. | n.a. | n.a. | 75.5 | 64.5 | 10.9 | n.a. | n.a. | n.a. |
| 40-59 | n.a. | n.a. | n.a. | 24.5 | 35.5 | -10.9 | n.a. | n.a. | n.a. |
| 60-79 | n.a. | n.a. | n.a. | n.a. | n.a. | n.a. | 52.7 | 52.1 | 0.6 |
| 80 or older | n.a. | n.a. | n.a. | n.a. | n.a. | n.a. | 47.3 | 47.9 | -0.6 |
| FEMALE | 37.1 | 39.3 | -2.2 | 45.4 | 45.3 | 0.2 | 79.5 | 77.0 | 2.5* |
| RACE | |||||||||
| *** | *** | ||||||||
| White | 57.1 | 42.9 | 14.2 | 65.4 | 64.8 | 0.6 | 47.8 | 54.3 | -6.5 |
| Black | 9.6 | 21.2 | -11.6 | 15.4 | 20.9 | -5.6 | 24.0 | 19.1 | 4.9 |
| Hispanic | 3.9 | 3.4 | 0.5 | 2.5 | 2.0 | 0.5 | 9.6 | 9.9 | -0.3 |
| Other | 29.4 | 32.5 | -3.1 | 16.7 | 12.3 | 4.4 | 18.6 | 16.7 | 1.9 |
| RESIDES IN AN MSA | 90.3 | 93.4 | -3.1*** | 94.0 | 88.1 | 5.9*** | 100.0 | 100.0 | 0.0 |
| CLAIMS RELATIVE TO INTAKE PERIOD | |||||||||
| Before and during | 53.9 | 52.8 | 1.1 | 76.6 | 76.0 | 0.6 | 58.1 | 49.2 | 8.8*** |
| Only during | 46.1 | 47.2 | -1.1 | 23.4 | 24.0 | -0.6 | 41.9 | 50.8 | -8.8 |
| DIED DURING INTAKE PERIOD | 0.7 | 2.1 | -1.4*** | 1.4 | 2.5 | -1.0** | 12.6 | 21.6 | -9.0*** |
| MONTHLY COSTS FOR HCBSb | |||||||||
| Mean dollars | 877.0 | 1,102.5 | -225.5*** | 1,385.4 | 1,635.2 | -249.8*** | 782.2 | 611.6 | 170.6 |
| Percent distribution | *** | *** | *** | ||||||
| Less than $150 | 12.2 | 24.3 | -12.0 | 7.8 | 11.2 | -3.4 | 5.5 | 13.9 | -8.4 |
| $150-$299 | 22.8 | 25.4 | -2.6 | 9.3 | 8.3 | 1.1 | 12.6 | 17.7 | -5.1 |
| $300-$499 | 17.8 | 14.0 | 3.8 | 10.3 | 8.9 | 1.4 | 21.2 | 22.4 | -1.1 |
| $500-$749 | 9.6 | 5.9 | 3.8 | 14.1 | 13.2 | 0.9 | 18.7 | 18.4 | 0.3 |
| $750-$999 | 7.3 | 3.8 | 3.3 | 13.8 | 11.7 | 2.1 | 13.3 | 11.3 | 1.9 |
| $1,000-$1,249 | 4.5 | 3.3 | 1.3 | 9.0 | 7.7 | 1.3 | 11.8 | 7.2 | 4.6 |
| $1,250-$1,499 | 6.4 | 2.4 | 3.9 | 6.3 | 4.9 | 1.4 | 7.6 | 3.6 | 4.0 |
| $1,500 or more | 19.4 | 20.9 | -1.6 | 29.4 | 34.1 | -4.8 | 9.3 | 5.5 | 3.9 |
SOURCE: Program records and claims for HCBS, July 1998 to June 2002. Claims were observed for 24 months before and after the first month of intake or until the state met its evaluation enrollment target for an age group, whichever came first.NOTE: Cases were excluded from the analysis if they did not have a claim during the portion of the intake period observed through claims.
*Significantly different from zero at the .10 level, using a chi-square or t-test. **Significantly different from zero at the .05 level, using a chi-square or t-test. ***Significantly different from zero at the .01 level, using a chi-square or t-test. n.a. = not applicable | |||||||||
| TABLE A.2: Item Response in the Participation Questionnaire, by Whether Participated and State | ||||||
|---|---|---|---|---|---|---|
| Arkansas | Florida | New Jersey | ||||
| Agreed to Participate | Declined to Participate | Agreed to Participate | Declined to Participate | Agreed to Participate | Declined to Participate | |
| NUMBER OF RESPONDENTS | 953 | 585 | 1,877 | 2,792 | 950 | 1,735 |
| NUMBER (PERCENT) REPORTING: | ||||||
| Reason(s) for decision and people involved | 950 (100) | 585 (100) | 1,877 (100) | 2,792 (100) | 950 (100) | 1,735 (100) |
| Whether decision maker(s) ever supervised another person | 940 (99) | 460 (79) | 1,816 (97) | 2,676 (96) | 868 (91) | 263 (15) |
| How demonstration was explained to decision maker(s) | 947 (99) | 578 (99) | 1,819 (97) | 2,573 (92) | 921 (97) | 305 (18) |
| Whether decision maker(s) received informational video or manual | 945 (99) | 462 (79) | 1,827 (97) | 2,715 (97) | 879 (93) | 278 (16) |
| Beneficiary's characteristics | ||||||
| Age | 947 (100) | 580 (99) | 1,796 (96) | 2,545 (91) | 852 (90) | 305 (18) |
| Sex | 941 (99) | 575 (98) | 1,836 (98) | 2,685 (96) | 936 (99) | 336 (19) |
| Hispanic ethnicity | 953 (100) | 585 (99) | 1,877 (100) | 2,792 (100) | 866 (91) | 314 (18) |
| Race | 945 (99) | 582 (99) | 1,759 (94) | 2,630 (94) | 830 (87) | 242 (14) |
| County of residence | 864 (91) | 552 (94) | 1,535 (82) | 2,292 (100) | 909 (96) | 332 (19) |
| How long receiving PCS or HCBS | 851 (89) | 565 (97) | 1,724 (92) | 2,550 (91) | 887 (93) | 316 (18) |
| SOURCE: MPR's Participation Questionnaire, administered by demonstration outreach and enrollment workers in each state. | ||||||
| TABLE A.3: Characteristics of Questionnaire Respondents, by Whether Participated and State(Percentages) | |||||||||
|---|---|---|---|---|---|---|---|---|---|
| Characteristic | Arkansas | Florida | New Jersey | ||||||
| Agreed to Participate | Declined to Participate | Diff. | Agreed to Participate | Declined to Participate | Diff. | Agreed to Participate | Declined to Participate | Diff. | |
| AGE IN YEARS | |||||||||
| *** | *** | ||||||||
| 3-17 | n.a. | n.a. | n.a. | 35.2 | 23.1 | 12.1 | n.a. | n.a. | n.a. |
| 18-39 | 9.7 | 10.0 | -0.3 | 22.9 | 37.4 | -14.5 | 11.3 | 4.6 | 6.7 |
| 40-64 | 21.3 | 22.1 | -0.8 | 19.9 | 18.9 | 1.0 | 39.6 | 26.9 | 12.7 |
| 65-79 | 34.5 | 35.0 | -0.5 | 11.7 | 10.4 | 1.3 | 33.0 | 42.6 | -9.6 |
| 80 or older | 34.4 | 32.9 | 1.5 | 10.2 | 10.2 | 0.0 | 16.2 | 25.9 | -9.7 |
| FEMALE | 74.9 | 73.7 | 1.2 | 55.9 | 53.9 | 2.0 | 74.4 | 79.5 | -5.1* |
| OF HISPANIC OR LATINO ORIGIN | 0.7 | 0.2 | 0.5 | 20.8 | 16.4 | 4.4*** | 40.0 | 48.7 | -8.7*** |
| RACE | |||||||||
| ** | *** | * | |||||||
| White | 68.0 | 73.0 | -5.0 | 76.0 | 75.7 | 0.3 | 31.9 | 26.0 | 5.9 |
| Black | 31.4 | 26.8 | 4.6 | 20.2 | 22.6 | -2.4 | 36.1 | 43.8 | -7.7 |
| Other | 0.5 | 0.2 | 0.3 | 3.8 | 1.8 | 2.0 | 31.9 | 30.2 | 1.7 |
| RESIDES IN: | |||||||||
| An MSA | 40.9 | 43.1 | -2.2 | 93.7 | 94.3 | -0.6 | 100.0 | 100.0 | 0.0 |
| Northwest New Jersey | n.a. | n.a. | n.a. | n.a. | n.a. | n.a. | 1.7 | 2.1 | -0.3 |
| Northeast New Jersey | n.a. | n.a. | n.a. | n.a. | n.a. | n.a. | 67.1 | 71.8 | -4.7 |
| Central New Jersey | n.a. | n.a. | n.a. | n.a. | n.a. | n.a. | 13.7 | 14.4 | -0.8 |
| Southern New Jersey | n.a. | n.a. | n.a. | n.a. | n.a. | n.a. | 17.5 | 11.8 | 5.8 |
| LENGTH OF TIME RECEIVING PCS OR HCBS | |||||||||
| *** | *** | *** | |||||||
| No services yet | 12.2 | 12.0 | 0.2 | 1.2 | 0.5 | 0.7 | 0.0 | 0.0 | 0.0 |
| One year or less | 13.6 | 20.9 | -7.3 | 32.8 | 29.7 | 3.1 | 26.5 | 15.8 | 10.7 |
| Longer than one year | 74.2 | 67.1 | 7.1 | 66.0 | 69.9 | -3.9 | 73.5 | 84.2 | -10.7 |
| SOURCE: MPR's Participation Questionnaire, administered by demonstration outreach and enrollment workers in each state. NOTE: Sample sizes vary considerably from measure to measure because of item nonresponse (see Table A.2). *Significantly different from zero at the .10 level, using a chi-square or t-test. **Significantly different from zero at the .05 level, using a chi-square or t-test. ***Significantly different from zero at the .01 level, using a chi-square or t-test. n.a. = not applicable | |||||||||
| TABLE A.4: Participation Decision Makers, by Whether Participated and State(Percentages) | |||||||||
|---|---|---|---|---|---|---|---|---|---|
| Who Decided Whether or Not to Participate | Arkansas | Florida | New Jersey | ||||||
| Agreed to Participate | Declined to Participate | Diff. | Agreed to Participate | Declined to Participate | Diff. | Agreed to Participate | Declined to Participate | Diff. | |
| Beneficiary Alone | 50.0 | 50.6 | -0.6 | 25.1 | 32.3 | -7.2 | 84.8 | 97.6 | -12.8 |
| Beneficiary with Others | 23.1 | 5.7 | 17.4 | 4.4 | 4.1 | 0.3 | 15.3 | 2.3 | 13.0 |
| Others (Without Beneficiary) | 26.9 | 43.8 | -16.9 | 70.6 | 63.7 | 6.9 | 0.0 | 0.0 | 0.0 |
| NUMBER OF RESPONDENTS | 953 | 585 | 1,877 | 2,792 | 950 | 1,735 | |||
| SOURCE: MPR's Participation Questionnaire, administered by demonstration outreach and enrollment workers in each state. | |||||||||
| TABLE A.5: How Respondents Learned About the Demonstration, by Whether Participated and State(Percentages) | |||||||||
|---|---|---|---|---|---|---|---|---|---|
| Arkansas | Florida | New Jersey | |||||||
| Agreed to Participate | Declined to Participate | Diff. | Agreed to Participate | Declined to Participate | Diff. | Agreed to Participate | Declined to Participate | Diff. | |
| DEMONSTRATION WAS EXPLAINED: | |||||||||
| *** | *** | *** | |||||||
| In person and over the telephone | 98.7 | 33.0 | 65.7 | 96.7 | 82.4 | 14.3 | 90.8 | 83.9 | 6.9 |
| Over telephone only | 1.3 | 67.0 | -65.7 | 3.3 | 17.6 | -14.3 | 9.2 | 16.1 | -6.9 |
| USEFULNESS OF EXPLANATION, AMONG RECIPIENTS | |||||||||
| *** | *** | *** | |||||||
| Very useful | 98.6 | 81.6 | 17.0 | 92.7 | 63.8 | 28.9 | 93.9 | 68.6 | 25.3 |
| Somewhat useful | 1.4 | 17.9 | -16.5 | 6.9 | 29.1 | -22.2 | 5.9 | 21.4 | -15.5 |
| Not useful | 0.0 | 0.5 | -0.5 | 0.4 | 7.1 | -6.7 | 0.3 | 10.0 | -9.7 |
| RESPONDENT RECEIVED A VIDEO OR MANUAL ABOUT THE PROGRAM | 78.3 | 78.4 | -0.1 | 65.9 | 68.5 | -2.6* | 75.5 | 63.3 | 12.2*** |
| USEFULNESS OF VIDEO OR MANUAL, AMONG RECIPIENTS | |||||||||
| *** | *** | *** | |||||||
| Very useful | 61.7 | 18.8 | 42.9 | 68.5 | 42.3 | 26.2 | 74.5 | 37.4 | 37.1 |
| Somewhat useful | 38.1 | 72.3 | -34.2 | 27.2 | 45.3 | -18.1 | 23.2 | 49.0 | -25.8 |
| Not useful | 0.3 | 8.9 | -8.6 | 4.4 | 12.4 | -8.0 | 2.3 | 13.6 | -11.3 |
| SOURCE: MPR's Participation Questionnaire, administered by demonstration outreach and enrollment workers in each state. NOTE: Sample sizes vary considerably from measure to measure because of item nonresponse (see Table A.2). *Significantly different from zero at the .10 level, using a chi-square or t-test. **Significantly different from zero at the .05 level, using a chi-square or t-test. ***Significantly different from zero at the .01 level, using a chi-square or t-test. | |||||||||
| TABLE A.6: Number of New Users and All Users of PCS or HCBS Services, by State | ||||||
|---|---|---|---|---|---|---|
| Month of Observation | Arkansas | Florida | New Jersey | |||
| New Users | All Users | New Users | All Users | New Users | All Users | |
| 1 | --- | --- | --- | --- | --- | --- |
| 2 | --- | --- | --- | --- | --- | --- |
| 3 | --- | --- | --- | --- | --- | --- |
| 4 | 466 | 13,312 | 592 | 22,242 | 603 | 11,994 |
| 5 | 433 | 13,296 | 518 | 22,411 | 505 | 12,094 |
| 6 | 456 | 13,356 | 457 | 22,517 | 508 | 12,188 |
| 7 | 449 | 13,351 | 544 | 22,687 | 554 | 12,321 |
| 8 | 446 | 13,347 | 449 | 22,677 | 498 | 12,390 |
| 9 | 447 | 13,371 | 545 | 22,860 | 541 | 12,387 |
| 10 | 438 | 13,385 | 311 | 22,753 | 559 | 12,477 |
| 11 | 362 | 13,227 | 351 | 22,671 | 550 | 12,638 |
| 12 | 397 | 13,171 | 281 | 22,580 | 520 | 12,672 |
| 13 | 445 | 13,202 | 540 | 22,747 | 492 | 12,709 |
| 14 | 628 | 13,382 | 469 | 22,822 | 516 | 12,741 |
| 15 | 540 | 13,440 | 459 | 22,952 | 565 | 12,899 |
| 16 | 476 | 13,436 | 677 | 23,273 | 680 | 13,189 |
| 17 | 456 | 13,300 | 720 | 23,523 | 602 | 13,292 |
| 18 | 467 | 13,322 | 786 | 23,955 | 531 | 13,328 |
| 19 | 423 | 13,196 | 896 | 24,501 | 505 | 13,410 |
| 20 | 458 | 13,150 | 984 | 25,080 | 437 | 13,376 |
| 21 | 450 | 13,222 | 1,090 | 25,774 | 575 | 13,363 |
| 22 | 457 | 13,287 | 1,148 | 26,459 | 482 | 13,472 |
| 23 | 358 | 13,233 | 1,463 | 27,539 | 536 | 13,597 |
| Random-Assignment Begins | 349 | 13,137 | 1,176 | 28,198 | 516 | 13,642 |
| 25 | 373 | 13,080 | 1,410 | 29,074 | 392 | 13,549 |
| 26 | 407 | 13,023 | 1,339 | 30,084 | 565 | 13,611 |
| 27 | 489 | 13,079 | 1,059 | 30,619 | 510 | 13,618 |
| 28 | 504 | 13,124 | 1,106 | 31,367 | 563 | 13,781 |
| 29 | 427 | 13,070 | 935 | 31,815 | 472 | 13,735 |
| 30 | 437 | 13,081 | 800 | 32,118 | 524 | 13,846 |
| 31 | 390 | 13,025 | 757 | 32,460 | 480 | 13,868 |
| 32 | 502 | 13,124 | 590 | 32,527 | 468 | 13,776 |
| 33 | 404 | 13,127 | 703 | 32,834 | 521 | 13,885 |
| 34 | 400 | 13,129 | 597 | 32,870 | 518 | 13,889 |
| 35 | 390 | 13,128 | 470 | 32,813 | 642 | 14,054 |
| 36 | 359 | 13,065 | 397 | 32,710 | 439 | 14,017 |
| 37 | 382 | 12,983 | 745 | 32,849 | 419 | 13,895 |
| 38 | 429 | 13,005 | 706 | 33,259a | 592 | 14,006 |
| 39 | 432 | 13,030 | 539 | 28,190 | 521 | 14,064 |
| 40 | 421 | 13,008 | 672 | 28,587 | 613 | 14,235 |
| 41 | 438 | 13,084 | 572 | 28,735b | 539 | 14,266 |
| 42 | 405 | 13,061 | 452 | 10,561 | 583 | 14,379 |
| 43 | 351 | 12,958 | 531 | 10,780 | 554 | 14,425 |
| 44 | 422 | 13,044 | 644 | 11,107 | 552 | 14,431 |
| 45 | 463 | 13,062 | 589 | 11,330 | 529 | 14,458 |
| 46 | 433 | 13,080 | 682 | 11,702 | 478 | 14,409 |
| 47 | 356 | 13,022 | 597 | 11,933 | 622 | 14,612 |
| 48 | 262 | 12,765 | 426 | 11,978 | 522 | 14,631 |
SOURCE: Medicaid PCS or HCBS claims, observed from January 1997 to December in Arkansas; from July 1998 to June 2002 in Florida; and from December 1997 to November 2001 in New Jersey.
| ||||||
APPENDIX B: SAMPLE COPY OF THE PARTICIPATION QUESTIONNAIRE
The participation questionnaire is available from the authors upon request at:
Mathematica Policy Research, Inc. P.O. Box 2393 Princeton, New Jersey 08543-2393 Telephone: (609) 799-3535 Facsimile: (609) 799-0005
The participation questionnaire is also available in PDF form on the Internet at:
http://aspe.hhs.gov/daltcp/instruments/DecideFm.pdf
[This file is in the Portable Document Format (PDF). You will need a copy of the Acrobat Reader in order to view it.]
NOTES
-
The Cash and Counseling Demonstration and Evaluation was funded by the Robert Wood Johnson Foundation (RWJF) and the Office of the Assistant Secretary for Planning and Evaluation (ASPE) of the U.S. Department of Health and Human Services. The Centers for Medicare and Medicaid Services approved the demonstration programs under Section 1115 authority of the Social Security Act. The National Program Office for the demonstration, at Boston College and the University of Maryland, coordinated the overall demonstration, provided technical assistance to the states, and oversaw the evaluation. Mathematica Policy Research, Inc. (MPR) is the demonstration evaluator.
-
For more information about demonstration implementation and program operations in Arkansas, New Jersey, and Florida, see Phillips and Schneider 2002, 2003, and 2004, and respectively.
-
ElderChoices provides nurse-supervised homemaker, chore, and respite services to elderly adults who qualify to be in a nursing home. Alternatives provides attendant care and environmental modifications for nonelderly adults and allows them to choose and supervise paid caregivers.
-
Florida's initial demonstration design included beneficiaries in the state's Brain and Spinal Cord Injury Program (BSCIP). The participation of BSCIP was delayed, however, so BSCIP beneficiaries were excluded from the MPR evaluation.
-
Arkansas's first governor's letter was mailed in December 1998, when the state launched its outreach and enrollment effort. Florida's first governor's letter, to DD waiver recipients, was mailed in October 2000, following several months of sluggish enrollment. Its letter to ADA waiver recipients was mailed several months later.
-
To understand the sluggish enrollment of elderly beneficiaries, RWJF funded four focus group discussions in October 2000 with Florida case managers who were trained as outreach workers and consultants for the consumer-directed program. The focus group moderator observed that the case managers were "very skeptical of the ability of their elderly clients to participate in CDC. They believe the clients are too frail, too sick, and with a much too limited support system to be able to participate. The belief [is that] the program is too complex, too confusing, and too burdensome for these frail elders." (Zacharias 2001a)
-
If states continued to enroll people into the demonstration after the dates given in this paragraph, those enrollees were not included in the evaluation.
-
When beneficiaries agreed to enroll in the demonstration, the state collected written informed consent and basic intake data, such as contact information. MPR was responsible for conducting baseline telephone interviews with enrollees and randomly assigning them to participate in a Cash and Counseling program (the treatment group) or rely on PCS or HCBS as usual (the control group).
-
We also calculated participation rates among Medicaid beneficiaries with claims for PCS or HCBS during the first month of demonstration intake. The percentages were similar to those reported.
-
Readers who prefer to examine the proportional distribution of characteristics by participation status are referred to Appendix Table A.1 and Table A.1a.
-
Arkansas and Florida returned hard-copy questionnaires to MPR for analysis. New Jersey entered questionnaire responses into its own computerized outreach data base and forwarded monthly data files to MPR.
-
It is difficult to assess how well the samples represented the populations from which they were drawn in terms of race and ethnicity. Whereas the participation questionnaire measured Hispanic as an ethnicity separate from race, states' Medicaid enrollment files measure Hispanic as a race.
-
Table A.3, Table A.4 and Table A.5 present additional results from the questionnaire.
-
The New Jersey questionnaire included eight reasons; it did not include being able to purchase equipment or supplies as a reason to participate.
-
Respondents choosing "none of the above" were not asked to write in other reasons. However, Arkansas nonparticipants who took part in focus group discussions cited several other reasons for their decisions, including not wanting to jeopardize other public benefits, not wanting to be responsible for finding back-up assistance, and not being allowed to pay a spouse for caregiving (Zacharias 2004).
-
Likewise, Florida nonparticipants who took part in focus group discussions in fall 2003 generally seemed unaware of the counseling and fiscal services available through Cash and Counseling programs. The Zacharias Group conducted the discussions.
-
During the first 12 months of demonstration intake in Arkansas, the average monthly ratio of new PCS users to all PCS users among demonstration enrollees was 0.040 (not shown). This was slightly higher than the comparable pre-intake average of 0.035 and corroborates Arkansas's own monitoring system and its temporary suspension of enrolling new PCS users. During the second 12 months of demonstration intake, the average monthly ratio of new PCS users to all PCS users among demonstration enrollees was 0.031.
-
The upper bound of the estimate is calculated as yP/[B - (yP/2)], where y is the proportion of control group cases with no PCS claims 12 months before or after random assignment (newly eligibles who enrolled in the demonstration and never used services); P is the number of treatment and control cases with no PCS claims before random assignment (newly eligibles who enrolled in the demonstration); and B is the number of Arkansas Medicaid beneficiaries who used PCS during the 24-month intake period. The numerator of this ratio is the estimated maximum number of new eligibles who enrolled in Cash and Counseling but would not have sought agency services. The denominator is the estimated number of beneficiaries who would have used PCS had Cash and Counseling not been implemented. The upper bound assumes that all newly eligible controls who never used PCS were interested only in the monthly allowance, whereas the lower bound assumed that half the newly eligible controls were exclusively interested in the cash allowance.