
Issue Papers on Foster Care and Adoption
Adoption Dynamics: Comparative Results for Subpopulations
by Fred H. Wulczyn Chapin Hall Center for Children at the University of Chicago November 2002
This paper is available on the Internet at:http://aspe.hhs.gov/hsp/fostercare-issues02/dynamics2/
Contents
- Introduction
- Results in Brief
- Results in Detail
- Summary and Discussion
- References
- Appendix I: Multivariate Results
- Endnotes
Introduction
Results presented in a previous briefing paper revealed that the pace of adoption quickened during the 1990s. Specifically, when children who were admitted to foster care between 1991 and 1997 are compared with children admitted in 1990, the unit time likelihood of adoption (that is, the conditional probability of adoption given that the child had not yet left foster care) increased markedly.(1) The goal of this paper is to expand on that finding by examining whether certain sub-populations of children experienced changes in the conditional probability of adoption that stand apart from those observed for the population as a whole. The interest in subgroups reflects a desire to better understand differences that define the experiences of children within the foster care system.
As before, the data analyzed come from the Multistate Foster Care Data Archive.(2) The specific focus is on children placed in foster care for the first time between 1990 and 1997. Population-specific changes in the likelihood of adoption per unit time are examined for children using the following characteristics to differentiate subpopulations: age at first admission, race, placement type, and residence (primary urban areas vs. all other areas). These data are used to divide children into subpopulations (strata) that were then studied separately to determine whether changes in the unit time likelihood of adoption followed the general pattern of increase.
Proportional hazards models were used to study the different strata. Proportional hazards models produce estimates for the effects of independent variables on duration in the form of relative "risk ratios" or "hazard rates." These estimated coefficients indicate how the timing of an event is linked to the variable in question, independent of the other variables in the model. For each independent variable in the model, one category is designated as the standard against which the risk ratios for other categories are compared. The category designated as the standard has a risk ratio of 1.
Results in Brief
Results from the study support three main conclusions:
- All subgroups reflected an increased likelihood of adoption per unit time.
The data show that although the degree of increase differs, all of the subgroups experienced an increased likelihood of adoption per unit time during the 1990s.
- Certain subgroups experienced greater increases in the likelihood of adoption per unit time.
Children from urban areas, African-American children, and children who were placed in kinship homes stood out as children for whom the likelihood of adoption increased most significantly. The data show that in each of these subgroups the trend became increasingly pronounced with each subsequent entry cohort. Children between the ages of 1 and 12 showed increased likelihood of adoption as well, although these results were not as pronounced as those from the other sub-groups.
- African-American children from urban areas placed in kinship homes showed the most significant change, although these children continue to move more slowly to adoption than other children.
The results from multivariate models indicate that the unit time likelihood of adoption among African American children from urban areas who were placed in kinship homes in 1995 was nearly 7 times greater when the compared with similar children from the 1990 admission group. Although the number of adoptions from kinship homes is small, and relatively few adoptions have been reported for children admitted in 1997, the trend nevertheless appears to have continued. However, the improvement observed for African American children was not sufficient to overcome the historical difference in the likelihood of adoption per unit time.
Results in Detail
Primary Urban Areas and Balance of State
In order to compare the experiences for children from urban areas with similar children placed in other parts of the Archive states, children were split into two separate groups (stratified) based on their residence. Then separate proportional hazard models were tested. The models were set up so that changes in the unit time likelihood of adoption for the 1991 through 1997 admission cohort could be compared with the children admitted in 1990 (holding other attributes of the children constant). The results from these models indicate whether the level of improvement in the time to adoption depends on whether the child was from an urban area.
The results for the first set of stratified models are displayed in Figure 1. The height of each bar corresponds to the observed risk ratio associated with each cohort relative to 1990. Coefficients greater than one imply faster exits to adoption; coefficients below one imply slow movement relative to the comparison group (1990 admission cohort). The figure allows for a side-by-side visual comparison of the time trend for populations with each subpopulation.(3)
The data show that the changes in the relative likelihood of adoption over time did depend on whether a child resided in an urban area. Overall, members of both subpopulations experienced a greater likelihood of adoption (per unit time) toward the end of the decade. However, children from urban areas experienced a more pronounced change. For example, among all children admitted in 1995, children from urban areas were about 2.5 times more likely to exit to adoption than were similar children admitted in 1990. For children from the balance of the states, the increase was about 10 percent.
Figure 1 Hazard Rates for Exit to Adoption by Year of Admission and Residence (AL, IL, MD, MI, MO, NJ, NY, OH, and WI)
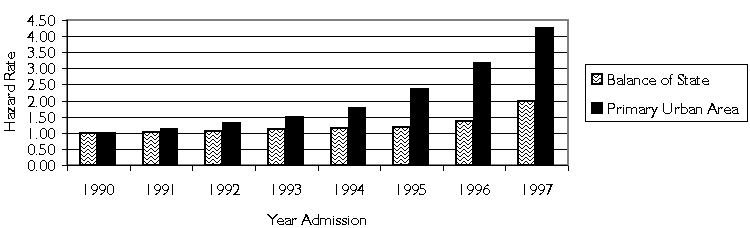
All hazard rates significant at .005 except for 1991 balance of State.
Age at Placement
Figure 2 shows the results from proportional hazards models based on a split of the population into four age groups. The age groups are: children placed as babies, children from 1 to 5 at placement, children from ages 6 to 12, and children from ages 13 to 17. As in Figure 1, the data displayed are the coefficients for the year of entry for the stratified models.
The analysis shows that the unit time likelihood of adoption reported for children ages 1 to 12 changed more dramatically than it did for children under 1. In particular, children between the ages of 1 and 5 at the time of placement experienced the most persistent change in the time to adoption. Data in Figure 2 suggest that by 1995, the conditional probability of adoption among children who were between the ages of 1 and 5 at the time of their admission in 1995 was about 1.7 times greater than it was in 1990. Older children experienced gains that were more modest, but still statistically significant.(4)
Figure 2 Hazard Rates for Exit to Adoption by Year of Admission and Age (AL, IL, MD, MI, MO, NJ, NY, OH, and WI)
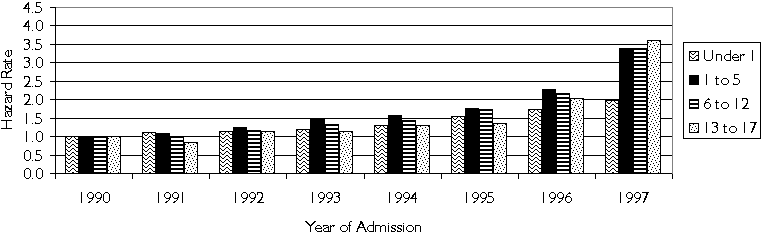
All hazard rates significant at .005 except for 1991 for 6-12 and 1991-1994 for 13-17
Race/Ethnicity
In Figure 3, the coefficients associated with the year of entry are presented for the population of children separated into groups based on race and ethnicity. As before, the results for each of the subpopulations reflect an increasing unit time likelihood of discharge to adoption. Furthermore, the unit time increase in the likelihood of exit to adoption was greatest for African American children. Hispanic children experienced the next largest increase. For white children, although the likelihood of exit increased, it increased at a lower rate than either of the other groups.
Figure 3 Hazard Rates for Exit to Adoption by Year of Admission and Race/Ethnicity (AL, IL, MD, MI, MO, NJ, NY, OH, and WI)
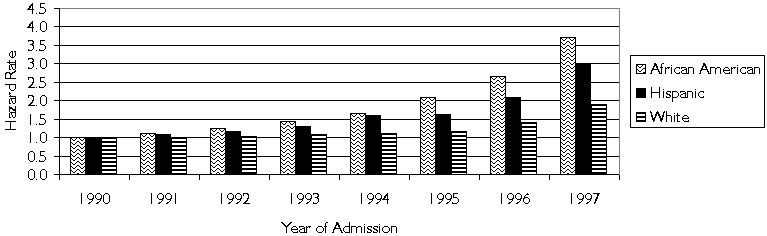
All hazard rates significant at .005 except for 1991 for Hispanic, and 1992-3 for white
Placement Type
Figure 4 displays the results for a model based on a population stratified by placement type. Children placed in kinship homes later in the decade, when compared to children placed in kinship homes in 1990, had an increasing likelihood of exit to adoption per unit time throughout the decade. For children who were placed with relatives in 1995, the likelihood of exit to adoption per unit time was four times greater than it was for similar children who entered in 1990.(5) Children placed in foster boarding homes also experienced an increased likelihood of discharge to adoption per unit time, though the change was significantly less pronounced.
Figure 4 Hazard Rates for Exit to Adoption by Year of Admission and Placement Type (AL, IL, MD, MI, MO, NJ, NY, OH, and WI)
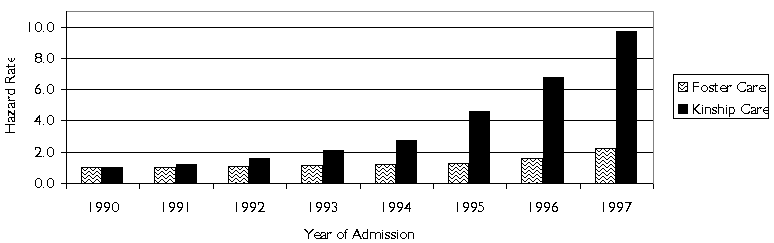
All hazard rates significant at .005
African American Children from Urban Areas Placed in Kinship Homes
In the final model, we grouped children into populations based on the three characteristics shown to have the strongest association with an increased likelihood of adoption: African American children from urban areas placed in kinship homes.(6)Figure 5 displays the coefficients associated with the year of entry. The results indicate that there was a significant three-way interaction. That is, the likelihood of adoption per unit time increased steadily for each entry cohort during the 1990s if the children belonged to the population of children who were African American, from urban areas, and placed in a kinship home. For the 1995 cohort, the probability of discharge to adoption per unit time was nearly 7 times what it was for the 1990 cohort. Figure 5 also shows that the likelihood of exit per unit time still increased during the decade for children who were not African American children from urban areas placed in kinship homes. However, the magnitude of the change was considerably smaller.
Figure 5 Hazard Rates for Exit to Adoption by Year and Combined Strata (IL, MD, MI, MO, NY, and WI)
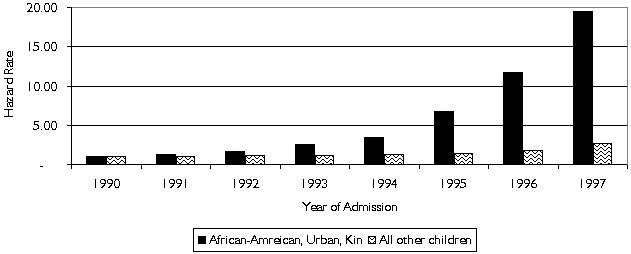
All hazard rates significant at .005
Summary and Discussion
Contrary to the conventional wisdom, adoptions during the mid-1990s were not slowing down. Findings from the Multistate Foster Care Data Archive indicate that the unit time likelihood of adoption increased steadily from 1991 through at least 1997. Moreover, as the results presented in this study suggest, the tendency toward faster adoptions was especially pronounced among selected subpopulations of children. Children from urban areas, African American children, and children who were placed in kinship homes all experienced faster adoptions (measured as a conditional probability). If these trends continue into the future, then there will have important changes in outcomes for children placed in foster care.
Although it is difficult to pinpoint specific changes to policy and practice that may have affected the timing of adoptions, the general improvements are consistent with attempts by policy-makers to improve outcomes for children in foster care. At the federal level, these efforts include: the federal child welfare demonstration waiver program that offered new ways to redirect federal foster care payments;(7) the Multi-Ethnic Placement Act of 1994 and its subsequent revision; and the Adoption and Safe Families Act (ASFA) in 1998. At the state level, states have actively developed policies and programs designed to affect permanency. Among the states in the Archive, guardianship is increasingly used to promote permanency. All title IV-E guardianship demonstrations were required to rule out adoption as an option for the child before initiating guardianship agreements. In doing so, these demonstrations often ended up encouraging kinship adoption. In addition, states initiated programs to increase adoptions. For example, New York State together with New York City implemented major adoption reforms in the mid-1990s to alleviate the large number of children waiting for adoption.
The positive evidence that suggests improvements were made has to be qualified to a degree. Specifically, it is important to remember that overall rates of adoption among African American children from urban areas are still slower than adoptions involving all other children. That is, while there have been significant gains, the fact remains that it takes African American children longer to be adopted than Caucasian children. Whether the improvements documented in this paper have reduced the gap is the subject of follow-up research now underway.
References
Barth, Richard P. (1997). Effects of age and race on the odds of adoption versus remaining in long-term out-of-home care. Child Welfare, 76, 285-308.
Barth, R.P., Berrick, M., Needell, B. & Jonson-Reid, M. (1997). Group care and young children. Social Service Review, 71. 257-73.
Benedict, M. I., & White, R. B. (1991). Factors associated with foster care length of stay. Child Welfare, 70, 4558.
Courtney, M. (1994). Factors Associated with the reunification of foster children with their families. Social Service Review, March 1994, 81-108.
Courtney, M. E., & Wong, Y. L. (1996). Comparing the timing of exits from substitute care. Children and Youth Services Review, 18, 307334.
Kemp, S. & Bodonyi, J.M. (2000). Infants who stay in foster care: Child characteristics and permanency outcomes of legally free children first placed as infants. Child and Family Social Work, 5. 95-106
McMurtry, S. L., & Lie, G. (1992). Differential exits of minority children in foster care. Social Work Research and Abstract, 28, 4248.
Wulczyn. F.H., & Hislop, K.B. (2002) Paper 2 in this series, Urbanicity
Wulczyn. F.H. (2002) Paper 3 in this series, Adoption
Wulczyn, F.H. (1996). A Statistical and Methodological Framework for Analyzing the Experiences of Foster Children. Social Services Review, June 1996.
Wulczyn, F. H., Hislop, K.B.., & George, R. M. (1997). An update from the multi-state foster care data archive: foster care dynamics 19831999 Alabama, California, Illinois, Iowa, Michigan, Missouri, New Jersey, New York, North Carolina, Ohio and Wisconsin. Chicago, IL: Chapin Hall Center for Children, University of Chicago.
APPENDIX 1: MULTIVARIATE RESULTS
| Balance of State | Primary Urban | |
| Year of Entry | ||
| 1990 | 1.00 | 1.00 |
| 1991 | 1.02 | 1.11* |
| 1992 | 1.07* | 1.29* |
| 1993 | 1.13* | 1.49* |
| 1994 | 1.14* | 1.77* |
| 1995 | 1.19* | 2.36* |
| 1996 | 1.36* | 3.16* |
| 1997 | 1.97* | 4.27* |
| Race/Ethnicity | ||
| White | 1.00 | 1.00 |
| African American | 0.64* | 0.56* |
| Hispanic | 0.70* | 0.60* |
| Other/Unknown | 0.85* | 0.59* |
| Spell Sequence | ||
| First Spell | 1.00 | 1.00 |
| Subsequent Spell | 0.98 | 1.12* |
| Urbanicity | ||
| Balance of State | ||
| Primary Urban Region | ||
| Age at Entry | ||
| Less than 1 year | 1.00 | 1.00 |
| 1 to 5 years | 0.53* | 0.50* |
| 6 to 12 years | 0.24* | 0.29* |
| 13 to 17 years | 0.06* | 0.09* |
| Primary Care Type | ||
| Foster Care | 1.00 | 1.00 |
| Kinship Care | 0.73* | 0.71* |
| Congregate Care | 0.21* | 0.15* |
| Mixed Care | 0.22* | 0.23* |
| * Indicates p-value .05 | ||
| Under One | Ages 1 to 5 | Ages 6 to 12 | Ages 13 to 17 | |
| Year of Entry | ||||
| 1990 | 1.00 | 1.00 | 1.00 | 1.00 |
| 1991 | 1.10* | 1.09* | 1.00 | 0.85 |
| 1992 | 1.14* | 1.26* | 1.17* | 1.14 |
| 1993 | 1.18* | 1.47* | 1.34* | 1.14 |
| 1994 | 1.31* | 1.57* | 1.45* | 1.30 |
| 1995 | 1.54* | 1.77* | 1.75* | 1.35* |
| 1996 | 1.74* | 2.28* | 2.18* | 2.04* |
| 1997 | 1.99* | 3.38* | 3.40* | 3.61* |
| Race/Ethnicity | ||||
| White | 1.00 | 1.00 | 1.00 | 1.00 |
| African American | 0.64* | 0.57* | 0.67* | 0.76* |
| Hispanic | 0.68* | 0.67* | 0.80* | 0.81 |
| Other/Unknown | 0.72* | 0.74* | 0.82* | 0.85 |
| Spell Sequence | ||||
| First Spell | 1.00 | 1.00 | 1.00 | 1.00 |
| Subsequent Spell | 0.95* | 1.29* | 0.91* | 0.62* |
| Urbanicity | ||||
| Balance of State | 1.00 | 1.00 | 1.00 | 1.00 |
| Primary Urban Region | 0.65* | 0.59* | 0.72* | 1.04 |
| Age at Entry | ||||
| Less than 1 year | ||||
| 1 to 5 years | ||||
| 6 to 12 years | ||||
| 13 to 17 years | ||||
| Primary Care Type | ||||
| Foster Care | 1.00 | 1.00 | 1.00 | 1.00 |
| Kinship Care | 0.56* | 0.90* | 1.02* | 0.83 |
| Congregate Care | 0.76* | 0.28* | 0.09* | 0.09* |
| Mixed Care | 0.52* | 0.27* | 0.10* | 0.08* |
| * Indicates p-value .05 | ||||
| African American | Hispanic | White | |
| Year of Entry | |||
| 1990 | 1.00 | 1.00 | 1.00 |
| 1991 | 1.12* | 1.08 | 0.99 |
| 1992 | 1.26* | 1.16* | 1.04 |
| 1993 | 1.44* | 1.31* | 1.08* |
| 1994 | 1.65* | 1.60* | 1.11* |
| 1995 | 2.09* | 1.62* | 1.16* |
| 1996 | 2.66* | 2.09* | 1.40* |
| 1997 | 3.73* | 2.99* | 1.90* |
| Race/Ethnicity | |||
| White | |||
| African American | |||
| Hispanic | |||
| Other/Unknown | |||
| Spell Sequence | |||
| First Spell | 1.00 | 1.00 | 1.00 |
| Subsequent Spell | 1.03 | 1.10 | 1.03 |
| Urbanicity | |||
| Balance of State | 1.00 | 1.00 | 1.00 |
| Primary Urban Region | 0.63* | 0.71* | 0.71* |
| Age at Entry | |||
| Less than 1 year | 1.00 | 1.00 | 1.00 |
| 1 to 5 years | 0.49* | 0.49* | 0.55* |
| 6 to 12 years | 0.27* | 0.30* | 0.25* |
| 13 to 17 years | 0.08* | 0.08* | 0.07* |
| Primary Care Type | |||
| Foster Care | 1.00 | 1.00 | 1.00 |
| Kinship Care | 0.74* | 0.77* | 0.72* |
| Congregate Care | 0.19* | 0.13* | 0.17* |
| Mixed Care | 0.25* | 0.28* | 0.18* |
| * Indicates p-value .05 | |||
| Congregate Care | Foster Care | Kinship Care | |
| Year of Entry | |||
| 1990 | 1.00 | 1.00 | 1.00 |
| 1991 | 1.02 | 1.03* | 1.22* |
| 1992 | 0.87 | 1.10* | 1.59* |
| 1993 | 1.15 | 1.16* | 2.10* |
| 1994 | 1.23 | 1.21* | 2.77* |
| 1995 | 1.09 | 1.31 | 4.59* |
| 1996 | 1.53* | 1.58* | 6.76* |
| 1997 | 1.27 | 2.21 | 9.71* |
| Race/Ethnicity | |||
| White | 1.00 | 1.00 | 1.00 |
| African American | 0.65* | 0.63* | 0.59* |
| Hispanic | 0.61 | 0.67* | 0.72* |
| Other/Unknown | 0.63* | 0.76* | 0.64* |
| Spell Sequence | |||
| First Spell | 1.00 | 1.00 | 1.00 |
| Subsequent Spell | 0.71* | 0.98 | 1.79* |
| Urbanicity | |||
| Balance of State | 1.00 | 1.00 | 1.00 |
| Primary Urban Region | 0.46* | 0.64* | 0.65* |
| Age at Entry | |||
| Less than 1 year | 1.00 | 1.00 | 1.00 |
| 1 to 5 years | 0.21* | 0.48* | 0.69* |
| 6 to 12 years | 0.03* | 0.23* | 0.42* |
| 13 to 17 years | 0.01* | 0.07* | 0.10* |
| Primary Care Type | |||
| Foster Care | |||
| Kinship Care | |||
| Congregate Care | |||
| Mixed Care | |||
| * Indicates p-value .05 | |||
| Urban Area African American Kinship Care | |
| Year of Entry | |
| 1990 | 1.00 |
| 1991 | 1.26* |
| 1992 | 1.68* |
| 1993 | 2.50* |
| 1994 | 3.50* |
| 1995 | 6.79* |
| 1996 | 11.75* |
| 1997 | 19.43* |
| Race/Ethnicity | |
| White | |
| African American | |
| Hispanic | |
| Other/Unknown | |
| Spell Sequence | |
| First Spell | 1.00 |
| Subsequent Spell | 1.82* |
| Urbanicity | |
| Balance of State | |
| Primary Urban Region | |
| Age at Entry | |
| Less than 1 year | 1.00 |
| 1 to 5 years | 0.70* |
| 6 to 12 years | 0.42* |
| 13 to 17 years | 0.10* |
| Primary Care Type | |
| Foster Care | |
| Kinship Care | |
| Congregate Care | |
| Mixed Care | |
| * Indicates p-value .05 | |
Endnotes
1. Throughout this paper we use the terms unit time likelihood of adoption, relative likelihood of adoption, and conditional probability of adoption. The terms, used interchangeably, refer to the likelihood a child will be adopted in the next unit of time (in this case one year) given that the child started the year still in care. The unit time probability of adoption is different than the probability of adoption.
2. Data for the following States are used in this paper: Alabama, Illinois, Maryland, Michigan, Missouri, New Jersey, New York, Ohio, and Wisconsin. These states were selected because of the Archive participants, only these states had available the information required for these analyses. Overall, the children included in this study represent about 30 percent of the national caseload at any given time.
3. It is important to note here that the results displayed do not refer to within year differences between the given strata. Rather, the differences are within strata over time. Thus, the data indicate whether adoptions are speeding up for the different groups at different rates. In statistical terms, the models test for an interaction effect. The specific findings from proportional hazard models, including the coefficients for the other, measured characteristics are included as part of the Appendix. Since the same logic describes the other models tested, this footnote applies to the other results presented.
4. Baseline adoption rates do influence the findings. Because the likelihood of adoption for older children is low, small changes are associated with big effects. Therefore, it is not surprising that the rates for older children are more changeable.
5. With the available data, it is not possible to determine whether the adoptive parents also served as the relative foster parents.
6. In this model, we only included those states that distinguish kinship placements from regular foster boarding home placements (IL, MD, MI, MO, NY, WI).
7. Illinois, Maryland, Michigan, New York and Ohio all have approved Title IV-E demonstration waivers for programs whose core mission is to reduce the time in foster care. See http://www.acf.dhhs.gov/programs/cb/initiatives/cwwaiver.htm for more information about Title IV-E demonstration waivers.