
The brief summarizes findings from the Census Bureau’s Supplemental Poverty Measure report for 2013. The brief highlights SPM levels for the most recent year, changes from the previous year and historical trends. SPM estimates are compared to estimates of the official poverty measure. The brief also presents the anti-poverty effects of select social safety net programs and includes technical details on the calculation of the SPM.
The Census Bureau published poverty estimates for 2013 using the recently developed Research Supplemental Poverty Measure (SPM). The SPM adds greater refinement and thus differs from the official measure in both the measurement of needs1 and the resources2 available to meet those needs. This brief summarizes key findings from the 2013 SPM release.
- Census Bureau data indicates that 15.5 percent of the U.S. population or 48.7 million individuals in 2013 were poor based on the Supplemental Poverty Measure (SPM). This compares to 14.6 percent of the U.S. population or 45.7 million individuals, under the official measure.3
- The SPM poverty rate of 15.5 percent in 2013 was 0.5 percentage points lower than the SPM poverty rate in 2012 (16.0 percent) resulting in 1.1 million fewer people in poverty in 2013.
- For children under 18, poverty in 2013 was lower when measured using the SPM (16.4 percent) compared to the official measure (20.4 percent), largely due to the receipt of federal in-kind program benefits and federal tax credits among families with children.
- Among those ages 65 and older, SPM poverty was higher (14.6 percent) than official poverty (9.5 percent) due in part to medical out-of-pocket expenses which reduced available resources.
- Aside from Social Security, which is targeted primarily to the elderly population, refundable tax credits and the Supplemental Nutrition Assistance Program (SNAP) had the largest poverty-reduction effects of all tax and transfer programs included in the SPM, reducing poverty by 2.9 and 1.6 percentage points in 2013, respectively.
- In 2013, refundable tax credits reduced the child poverty rate by 6.4 percentage points and SNAP benefits reduced the child poverty rate by 2.9 percentage points.
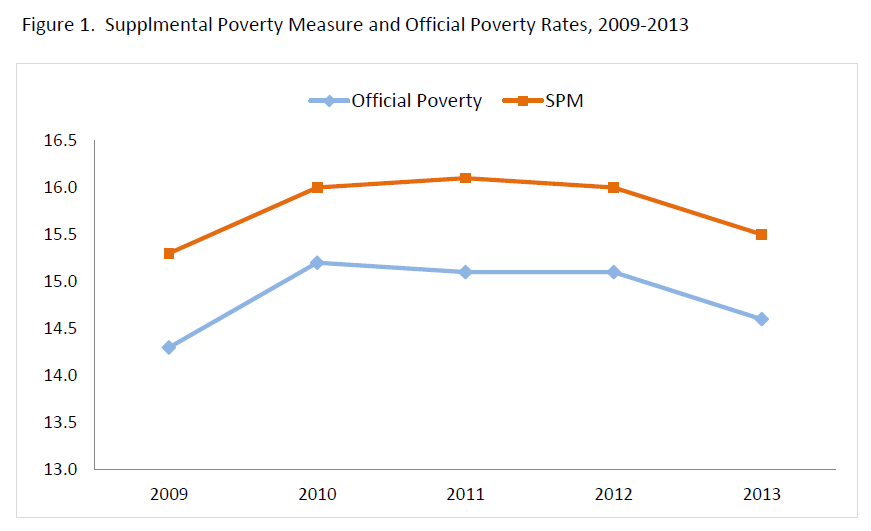
- Figure 1 shows poverty rates for the total population from 2009 to 2013. The official measure and the SPM track closely, with the SPM higher than the official measure by about 1 percentage point. This translates into a difference of about 3 million more people counted as poor under the SPM relative to the official measure.
- After increasing between 2009 and 2010, poverty rates remained steady through 2012 then decreased between 2012 and 2013. For the SPM the decrease was 0.5 percentage points, from 16.0 to 15.5, resulting in 1.1 million fewer people in poverty under the SPM in 2013 compared to 2012.
- Figure 2 shows that child poverty rates are lower under the SPM than under the official measure, while poverty rates for working-age adults and adults over age 65 are both higher under the SPM. The poverty rate for children under the official measure was 20.4 percent in 2013, while under the SPM the poverty rate for children was 16.4 percent. That child poverty is lower under the SPM is largely due to the inclusion of resources coming from the tax system (e.g., the Earned Income Tax Credit and the Child Tax Credit) and resources coming from in-kind or near-cash sources (e.g., SNAP benefits or government housing assistance).
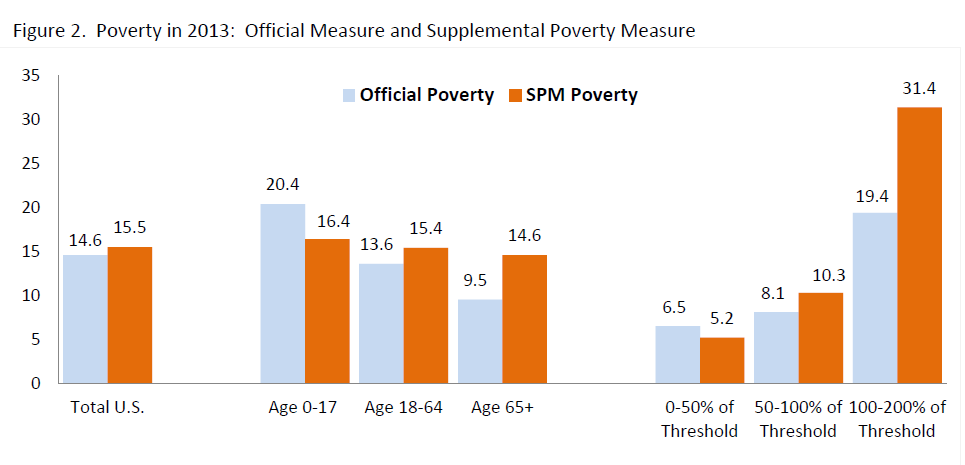
- For adults ages 65 and older, the SPM poverty rate is considerably higher than the official measure. In 2013, the SPM poverty rate for older adults was 14.6 percent, as compared to 9.5 percent for official poverty. This difference is largely attributable to the SPM’s subtraction of medical out-of-pocket expenditures from families’ resources, given that the elderly on average have considerably higher medical expenses than other groups.
- Figure 2 also shows how moving from the official measure to the SPM alters the picture of the overall income distribution. Under the official measure, 6.5 percent of people fell below 50 percent of the poverty threshold, often used as a measure of “deep poverty.” Under the SPM, the percentage falls to 5.2 percent. The inclusion of tax credits and in-kind benefits is related to the overall lower deep poverty rate under the SPM.
- In contrast, a larger proportion of the population is below two times the poverty threshold under the SPM compared to official poverty. For example, 19.4 percent of Americans fell between one and two times the poverty threshold under the official measure, as compared to 31.4 percent under the SPM.
- Under the SPM, the subtraction of non-discretionary expenses like transportation to work, child care, and medical expenses raises the fraction of Americans who fall below twice the poverty threshold, often used as a measure of low-income (an overall total of 34.0 percent for official poverty compared to 46.9 percent for the SPM).
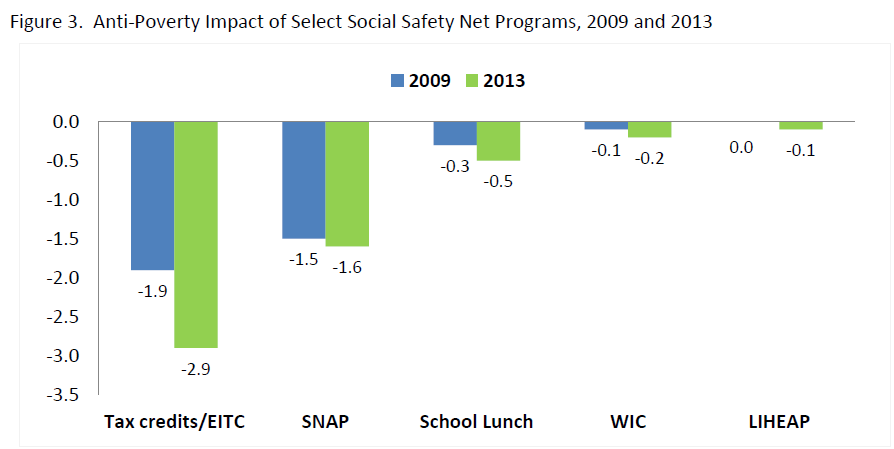
- Figure 3 shows the overall impact of social safety net programs based on the SPM. With the exception of Social Security (not shown), refundable tax credits and the Supplemental Nutrition Assistance Program (SNAP) had the largest poverty-reduction effects of all tax and transfer programs included in the SPM, reducing overall poverty by 2.9 and 1.6 percentage points, respectively, in 2013.
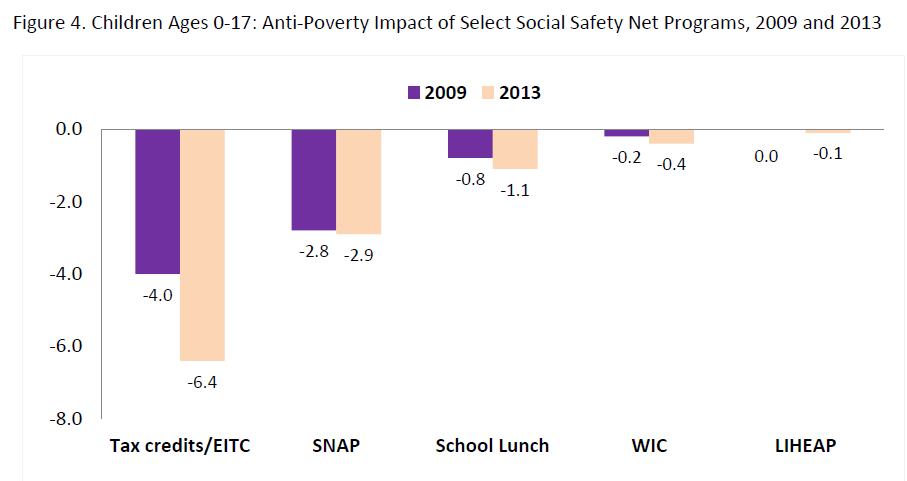
- Figure 4 shows that poverty reductions associated with social safety net programs were even greater for children than for all persons. In 2013, refundable tax credits (alone) reduced the child poverty rate by 6.4 percentage points and SNAP benefits (alone) reduced the child poverty rate by 2.9 percentage points.
- Including the value of School Lunch reduced poverty for children by 1.1 percentage points in 2013. The poverty reduction effects for the WIC program (alone) and LIHEAP (alone) were much smaller.
Background
The Census Bureau, in cooperation with the Bureau of Labor Statistics (BLS), developed the SPM after years of research and collaboration. The SPM is based on the 2010 recommendations of an Interagency Technical Working Group, which included representatives from the Census Bureau, the Bureau of Labor Statistics, the U.S. Department of Commerce, the Council of Economic Advisors, the U.S. Department of Health and Human Services, and the Office of Management and Budget. The Working Group’s suggestions drew on the recommendations of a 1995 National Academy of Sciences report and the extensive research on poverty measurement conducted over the past 15 years.
The SPM makes changes to how income is measured. Compared to the official measure, where only gross before-tax income is included, the SPM:
- Counts the value of federal in-kind benefits that are available to satisfy basic food, clothing, shelter, and utility (FCSU) needs, including nutritional assistance from the Supplemental Nutrition Assistance Program (SNAP) and school meals.
- Subtracts income and payroll taxes paid and adds refundable tax credits received.
- Subtracts from income other necessary expenses such as the cost of child care, other work expenses, child support payments, and out-of-pocket medical expenditures.
The SPM makes changes to the poverty thresholds. Compared to the official poverty threshold, which is set at three times the cost of the minimum food diet in 1963 and updated annually for inflation using the Consumer Price Index (all items), the SPM poverty threshold incorporates the following changes:
- The SPM poverty threshold is the 33rd percentile of out-of-pocket FCSU expenditures of consumer units with two children multiplied by 1.2.
- The SPM threshold varies based on the shelter and utility expenses of three groups: home owners with mortgages, home owners without mortgages, and renters.
- The SPM threshold is adjusted for geographic differences in housing costs to account for regional cost of living differences.
- The SPM uses the five-year moving average of FCSU expenditures to account for inflation. Five years are data have the effect of “smoothing” the effects of the business cycle.