
By Jared Bernstein and Heidi Hartmann #
"Introduction
Reform of the nation's welfare system, particularly its welfare-to-work component, has focused the attention of policy makers, advocates, and the poor themselves on the low-wage labor market. Indeed, the success of welfare reform is largely dependent on moving recipients off the welfare rolls and into market work, which, given the education and skill levels of the typical welfare recipients, will be work at low wages.1 This focus requires a realistic understanding of the low-wage sector: Can it successfully absorb those coming off the welfare rolls? What are their hours of work and earnings likely to be? What impact will welfare-to-work have on the living standards of former welfare recipients? What will be the impact on their children?
These questions can only be addressed, however, when the low-wage labor market has been adequately defined, a task that depends on the answers to a different set of questions: How does the low-wage sector differ from the rest of the labor market? Who works there? What is the industry/occupation structure of this sector? Are these characteristics changing? Is it becoming more or less likely that someone will be a low-wage worker? What policy initiatives might help low-wage workers? This paper defines and characterizes the low-wage labor market by addressing such questions.
The main findings of the paper are:
- Definitions of the low-wage labor market fall into two basic groups. Job-based definitions identify a set of jobs characterized by low wages, few benefits, and little upward mobility. Worker-based definitions are typically based on a worker's absolute or relative hourly wage, earnings (wages times hours worked), or educational level. Job-based definitions provide the theoretical foundation and worker-based definitions, the empirical basis for study of the low-wage labor market.
- Irrespective of definition, there is a strong empirical consensus that there has been a long-term decline in the real earnings of low-wage workers and/or an increase in their numbers as a share of the workforce.
- Low-wage workers are disproportionately female, minority, noncollege-educated, nonunion, and concentrated in retail trade.
- These characteristics notwithstanding, the low-wage workforce is becoming more male and more highly educated, which is to be expected given widespread educational upgrading and the long-term wage decline among noncollege graduates.
- The likelihood of being a low-wage worker has increased, even when the wage impacts of changes in education, experience, occupation, and industry are taken into account.
- Rising education and experience levels and occupational upgrading have combined to prevent the share of female workers in low-wage jobs from rising. This has not been the case for men, even though their total share of the low-wage workforce is still below that of women.
- Supply-side interventions, such as worker training, are clearly important. Increasing labor demand through policies that keep aggregate unemployment low — combined with policies that shore up labor market institutions such as the minimum wage and labor unions — can also help improve the economic prospects of those in the low-wage sector.
Defining the Low-Wage Labor Market
In the most basic economic model of the labor market, there are no identifiable characteristics that separate the low-wage sector from the rest of the market. The labor market is one in which a worker's wage is determined solely by the value of that worker's marginal product — that is, how much his or her labor adds to the total product of the firm. Consequently workers with lower productivity are paid less than those who contribute more to the firm's output. However, more nuanced treatments of the labor market have evolved over time that provide both a theoretical justification and an empirical basis for studies focusing specifically on the low-wage sector of the market. These can be grouped into two major categories: job-based and worker-based (see table 1).
| Job-Based | Worker-Based |
|---|---|
| Segmented Labor Markets | Wages |
|
|
| Wage Contours | Employment |
|
|
| Education level | |
|
Job-Based Definitions: A Strong Theoretical Foundation
Job-based definitions focus on a set of jobs with characteristics that lead both to working poverty and reducing upward wage and income mobility. There are two major variants of this definitional approach: segmented labor markets and wage contours.
Segmented Labor Markets. The fundamental insight of this branch of analysis is that jobs are organized into two separate segments and that there is more labor mobility within each segment than between them.2 Jobs in the primary segment are core jobs. These pay higher wages and are more likely to provide fringe benefits (such as health insurance and paid vacations) than jobs in the secondary segment. They also have ladders upward (often within the same firm), whereby workers can steadily improve their earnings and living standards over time. Jobs in the secondary segment, on the other hand, are peripheral jobs. They pay low wages, offer few benefits, tend to be nonunion, and generally have worse working conditions than core jobs in the primary sector. They are also less stable than core jobs, with high job turnover and much churning but little upward mobility. Race- and gender-based discrimination are also more common in the secondary than in the primary segment.
Wage Contours.3 The primary insights here are (1) that there are groups of jobs that share characteristics that together lead to wage levels within an identifiable range, and (2) that wages in these groups of jobs move, over time, in a related manner. The group of jobs on a contour defined by the minimum wage provides a good example.4 These jobs tend to be in low-wage industries like retail trade and personal services and in occupations like low-end sales, administrative support, and other service occupations. Workers on the minimum wage contour tend to be the traditional victims of labor market discrimination and have suffered most from declining real wages over the past 15 years.
Job-based definitions provide a compelling conceptual structure within which to understand the low-wage labor market. They offer a rich model of the determinants of wages and employment, which, unlike traditional labor market theory, can incorporate the role of labor market institutions (such as unions, minimum wage legislation, and international trading regimes), along with established power dynamics (such as race- and gender-based discrimination).
Their very richness, however, makes them difficult to use in empirical analysis. Few available data sets have the level of job-based information needed for such analysis. Since worker-based definitions are more empirically tractable, and since the job-based approach yields empirical results that mirror those based directly on a worker-wage definition (discussed below), the greatest contribution of the job-based approach is the solid and innovative theoretical grounding it provides for the empirical work on the low-wage labor market as defined by worker characteristics.
Worker-Based Definitions: The Primary Basis for Empirical Work
The set of definitions more typically seen in contemporary research on the low-wage labor market focuses on the characteristics of workers (or potential workers) themselves — such as wage level, earnings and hours worked, or skill level.
Wage Level. Defining the low-wage labor market by the wages of its workers is clearly tautological. Even so, it is certainly reasonable to define, or at least discuss, the low-wage labor market by referring to the wage level itself. After all, the definition one chooses will correlate strongly with low levels of compensation if it is to be useful. And looking at the other characteristics of persons who work for low wages can tell us quite a bit about who the low-wage worker is likely to be.
The disadvantage of a simple wage-based approach is that it treats all workers who happen to be receiving low wages at a given point in time as similar, which covers up the important issue of differential labor mobility. A college student in a low-wage job, for example, is typically of much less policy concern than a single mother stuck indefinitely in a dead-end job.
This is a less-severe problem than it first appears, however, and can be alleviated by taking snapshots of the wage distribution at different points in time. Such snapshots allow comparisons of the different characteristics of workers at different wage levels. Unless the rate of mobility (that is, the speed with which workers move up the wage distribution) changes, comparing snapshots over time presents a useful description of the conditions of the low-wage sector and the characteristics of those who work there. For example, as discussed further below, declining real wages in the low-wage sector have led to increasing shares of the workforce being in low-wage jobs over time, and these workers are older and more highly educated than their predecessors. Unless older, better-educated workers that start out earning low wages are jumping ahead more quickly than in the past — and there is actually evidence to the contrary — these findings imply that the low-wage sector has truly expanded and includes older and better-educated workers.
The Absolute Wage Approach. The easiest wage-based definition to understand and interpret is an absolute measure. Analysts look at the share of the workforce in the same real wage range in different years and observe both the characteristics of workers and the proportions of workers within those ranges at particular points in time. A common way of determining such wage ranges is to use the U.S. standard poverty level as a reference and dividing the wage distribution by multiples of the wage rate derived from that level. Table 2, for example, divides the poverty level for a family of four ($16,400 in 1997) by 2,080 hours (52 weeks of work at 40 hours a week) to derive an absolute wage-level cutoff for the low-wage sector of $7.89 an hour. Using the poverty level for a family of three would yield a correspondingly lower wage-level cutoff for that sector.5 The table then shows comparisons between that sector and two higher wage ranges defined, respectively, as wage levels between the poverty-level wage and twice that level, and wage levels above twice the poverty-level wage.
Besides being easy to interpret, the absolute measure has the advantage of facilitating comparisons of absolute living standards (that is, real consumption opportunities) between low-wage and other sectors. It is, of course, sensitive to how price changes over time are measured. Any bias in the Consumer Price Index, for example, will be reflected in a corresponding bias in absolute wage rate comparisons. Any absolute measure is also unavoidably arbitrary. This weakness can be alleviated by doing sensitivity tests. These tests, by replicating the calculation for wage levels around the central choice, show how sensitive the results are to the particular wage level chosen.
The Relative Wage Approach. The danger of bias from measured prices failing to accurately reflect changes in real living standards is removed if the wage-based definition uses a relative approach, for example, by referring to the bottom 20 percent of the wage distribution. This definition has intuitive appeal because all would agree the bottom 20 percent are worse off relative to the top 20 percent, for example. The downside of relative measures is that they are not as rigorously tied to changes in living standards as absolute measures. Thus, the living standards of relatively low-wage workers — those in the bottom 20 percent, say — could rise markedly if real wages rose throughout the distribution, yet they would still be classified as low-wage workers. In other words, this approach allows for no change in the proportion of the workforce that is defined as low wage.
| 1. Wages | Average wage | Low | Middle | High | Total |
|---|---|---|---|---|---|
| All | $5.92 | $11.20 | $25.03 | $13.51 | |
| Men | 6.01 | 11.36 | 25.82 | 15.11 | |
| Women | 5.86 | 11.02 | 23.57 | 11.76 | |
| Share of Total | |||||
| All | 28.6% | 43.7% | 27.7% | 100.0% | |
| Men | 22.5 | 43.2 | 34.3 | 100.0 | |
| Women | 35.3 | 44.3 | 20.4 | 100.0 | |
| 2. Gender | |||||
| Men | 41.2% | 51.7% | 64.8% | 52.3% | |
| Women | 58.8 | 48.3 | 35.2 | 47.7 | |
| 100.0 | 100.0 | 100.0 | 100.0 | ||
| 3. Race/Ethnicity | |||||
| White | 63.0% | 74.5% | 83.2% | 73.6% | |
| Black | 15.4 | 11.9 | 6.9 | 11.5 | |
| Hispanic | 17.2 | 9.6 | 5.1 | 10.5 | |
| Other | 4.4 | 3.9 | 4.7 | 4.3 | |
| 100.0 | 100.0 | 100.0 | 100.0 | ||
| 4. Age | |||||
| 18-25 | 36.4% | 13.7% | 2.5% | 17.1% | |
| 26-35 | 24.3 | 31.6 | 23.8 | 27.3 | |
| 35+ | 39.3 | 54.8 | 73.7 | 55.6 | |
| 100.0 | 100.0 | 100.0 | 100.0 | ||
| 5. Education | |||||
| Less than high school | 22.9% | 9.1% | 2.2% | 11.1% | |
| High school | 39.3 | 37.8 | 19.6 | 33.2 | |
| Some college | 24.0 | 22.5 | 15.7 | 21.0 | |
| Associate degree | 5.5 | 9.6 | 9.8 | 8.5 | |
| College or more | 8.3 | 21.1 | 52.7 | 26.2 | |
| 100.0 | 100.0 | 100.0 | 100.0 | ||
| 6. Industry | |||||
| Agriculture and forestry | 3.2% | 1.1% | 0.4% | 1.5% | |
| Mining and construct | 3.7 | 7.3 | 6.7 | 6.1 | |
| Manufacturing | 12.9 | 20.1 | 20.1 | 18.0 | |
| Wholesale trade | 2.8 | 4.4 | 3.9 | 3.8 | |
| Retail trade | 31.7 | 12.0 | 5.5 | 15.8 | |
| Finance | 4.0 | 7.2 | 7.8 | 6.5 | |
| Transportation and utilities | 3.9 | 8.2 | 10.8 | 7.7 | |
| Business services | 6.4 | 5.8 | 5.4 | 5.9 | |
| Personal and entertainment | 8.9 | 3.7 | 1.9 | 4.7 | |
| Medical Services | 8.0 | 10.3 | 10.4 | 9.7 | |
| Education and social servs | 10.1 | 10.6 | 12.8 | 11.1 | |
| Professional services | 2.3 | 4.0 | 6.2 | 4.1 | |
| Public administration | 1.9 | 5.4 | 8.0 | 5.1 | |
| 100.0 | 100.0 | 100.0 | 100.0 | ||
| 7. Occupation | |||||
| Managers and professionals | 9.4% | 23.8% | 55.9% | 28.6% | |
| Sales | 16.2 | 8.9 | 8.8 | 11.0 | |
| Technical | 1.4 | 4.4 | 5.0 | 3.7 | |
| Clerical | 15.0 | 20.9 | 7.5 | 15.5 | |
| Private household services | 1.6 | 0.0 | 0.1 | 0.6 | |
| Protective services | 1.7 | 2.1 | 2.1 | 1.9 | |
| Other services | 25.5 | 7.2 | 1.3 | 10.8 | |
| Operators and transportation | 25.6 | 31.3 | 19.1 | 26.3 | |
| Farming | 3.6 | 1.0 | 0.3 | 1.6 | |
| 100.0 | 100.0 | 100.0 | 100.0 | ||
| 8. Union Status** | |||||
| Union | 5.7% | 15.1% | 22.7% | 14.5% | |
| Nonunion | 94.3 | 84.9 | 77.3 | 85.5 | |
| 100.0 | 100.0 | 100.0 | 100.0 | ||
|
* Wage ranges are multiples of the poverty level for a family of four divided by full-time, full-year work (see text). Source: 1997 CPS ORG |
|||||
One way to solve this problem within the relative framework is to define low earnings as a fraction of the median wage.6 This measure will move with the median (a relative measure), but it allows the share of workers who fall into the low-wage category to vary over time. Again, however, an increasing median (implying increasing multiples of the median) would mean that at least some in the low-wage category will increase their standards of living over time.
Another limitation of the hourly wage level definition is that it fails to account for the possibility that workers may not work enough hours to meet their families' economic needs. Even if the wage structure were to rise high enough for workers at all wage levels to be able to support their families if they worked full-time/full-year, there is still the issue of whether enough hours of work are available in the low-wage sector.
Earnings/Hours Worked/Time Employed. The problem of work availability is very real for the low-wage sector. There is considerable evidence that disadvantaged workers (for example, workers whose personal characteristics are correlated with low earnings or incomes) experience higher levels of unemployment or underemployment than those with characteristics associated with higher earnings, even when the economy is strong. Furthermore, the share of persons with low-wage characteristics (such as young, less-educated minorities) who fail to participate in the labor market has increased over time.
To take this factor into account, analysts use definitions based on a variety of measures of time working. Blank (1994), for example, looks at the unemployment of family heads and finds that in 1991 (a business cycle trough), 40 percent of the reported weeks of unemployment by family heads occurred in the bottom 20 percent of the income distribution. Another approach looks at weeks unemployed and weeks out of the labor market altogether.7 This approach has found that between the late 1960s and the late 1980s, the largest deterioration occurred among workers in the bottom 10 percent of the wage distribution. Yet another variant looks at employment, unemployment, and underemployment.8 This approach reveals, for example, that in 1996-97, when the national unemployment rate was 5.2 percent, it was 19.7 percent for young (ages 16 to 25) African American women with a high school degree.
Results like these imply that, even in periods when wage levels are rising, low-wage workers will often not be able to work enough hours to fully meet their economic needs. Furthermore, they suggest that comparisons of the share of the workforce that is in the low-wage sector over time will progressively underestimate the size of the low-wage workforce. This is because the share of the potential low-wage workforce that is out of the labor market is not counted in the comparison because they earn no wage at all.
Education. A measure of the low-wage sector that does not depend on actual wage or earnings levels, although highly correlated with them, is education level. Low-wage workers are often those with a high school degree or less.
This approach has some intuitive appeal, particularly since the wages of those with college degrees increased sharply over the 1980s9 while the wages of those with a high school degree or less fell steeply. But it has two limitations. First, as of 1997, the "high school or less" definition included 44.3 percent of the workforce.10 Even avid critics of the U.S. labor market might be hard pressed to argue that such a large share of the workforce was "low-wage" or "low-skilled." Second, as with the relative wage approach, the sector of workers defined as low wage by the education approach will not change, even if rising real-wage levels in fact increase their standards of living.
Thus, there is a range of worker-based definitions of the low-wage labor market, each with its own strengths and limitations. Together they provide a portrait of the low-wage labor market and the workers in it, from which potentially useful policy conclusions can be drawn. The next section of the paper lays out the characteristics of low-wage workers, defined as workers who earn poverty-level hourly wages or less. This is followed by a discussion of how the low-wage labor market sector, variously defined, has been changing and the factors that have led to these changes.
Characteristics of Low-Wage Workers
A useful way to begin a statistical description of low-wage workers is with the poverty-level wage approach described in the previous section.
Table 2 shows the characteristics of U.S. workers in 1997 by wage range. The low-wage sector (column 1) is defined as those who earn $7.89 an hour or less — $7.89 being the hourly wage of someone who, if they worked 40 hours a week, 52 weeks a year, would have annual earnings equal to the 1997 poverty line for a family of four. The medium-wage sector (column 2) is defined as those who command wage rates that would put them between the poverty line and twice the poverty line if they worked full-time/full-year in 1997 ($7.90 - $15.78). The high-wage sector ($15.79 and above) is defined as those who command wage rates that would put their annual income above twice the poverty line if they worked full-time/full-year in 1997.
Table 2 holds no real surprises. Compared to the overall workforce, low-wage workers are more likely to be women, minority, noncollege-educated, nonunion, in the retail trade industry, and in low-end sales and service occupations.
The top panels in this table (1A and 1B) present average wages and the share of workers in each wage sector, by gender. For workers in the low-wage sector, the average hourly wage in 1997 was $5.92, about 44 percent of the average wage of the workforce as a whole. For women, the low-wage share of the workforce was 35.3 percent, about 12.8 percentage points higher than the low-wage share for men and about the same as the high-wage share for men. Clearly, by this definition, the low-wage sector consists of a nontrivial share of workers.
The rest of the table shows the shares of workers with particular characteristics within each wage range. Panel 2 shows that the majority of low-wage workers (58.8 percent) are women. Comparing the shares of the sexes in the different wage sectors with those in the total column reveals the extent to which workers in different wage sectors are disproportionately represented in the total labor force. Women, for example, constituting 47.7 percent of the total, are over represented in the low-wage sector. Minorities are also over represented in that sector. The share of Hispanics, for example, is 17.2 percent, compared with their 10.5 percent share of the labor market overall. Whites are the only racial group under represented in the low-wage category (63.0 percent versus 73.6 percent overall).
With respect to age (panel 4), workers in the low-wage sector are younger on average than in the more highly paid sectors. Just over 60 percent of low-wage workers average 35 years of age or less, compared with about 40 percent of the high-wage workers.
Education levels (panel 5) are relatively low for the low-wage sector. Nearly two-thirds have a high school degree or less, compared with under one-half of the medium-wage group and about one-fifth of the high-wage group. Virtually no high-wage workers have less than a high school degree. Figure 1 highlights the same information for the low-wage and high-wage groups. Over half of the high-wage group have a college degree or more, for example, compared with less than one-tenth of the low-wage group. Almost four-fifths of the high-wage group have at least some college, compared with just over one-fifth for the low-wage group.
Figure 1. Education Shares, Low- and High-Wage Workers, 1997
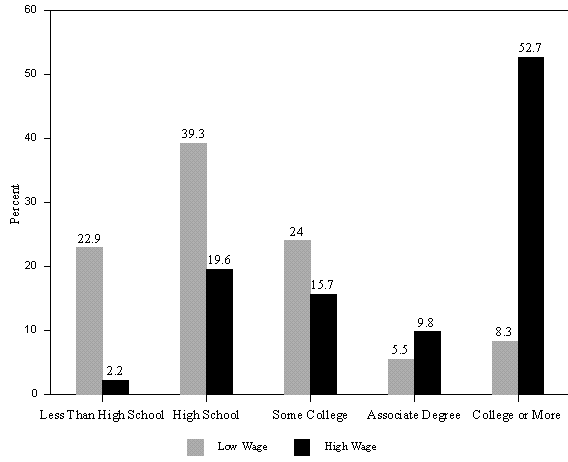
Source: Table 2.
By far the most populated industrial category for low-wage workers is retail trade, accounting for almost one-third of the low-wage workforce. Low-wage workers, in contrast, are under represented in the industries typically associated with higher-quality jobs for noncollege-educated workers, such as manufacturing, mining and construction, and transportation and utilities.
For occupational categories, low-wage workers are disproportionately represented in low-end services occupations ("other" services include such occupations as food and cleaning services) and sales (such as cashiers and other sales jobs in retail). Finally, low-wage workers are much less likely to be members of unions than their higher-wage counterparts. Only 5.7 percent of the low-wage group are in unions, for example, compared with 15 percent in the medium-wage group, 22.7 percent in the high-wage group, and 14.5 percent in the workforce as a whole.
A limitation of the definitional approach to the low-wage labor market taken in table 2, as noted, is that it compares workers as if they all worked full-time/full-year, which ignores that fact that many in low-wage jobs do not work as many hours as they would like. Figure 2 shows the share of poor families with children that have at least one full-time/full-year worker. In 1997, less than one-quarter of poor families had such a worker, a slightly higher proportion than in previous decades.
Figure 2. Percent of Poor families with Children with at Least One Full-Time/Full-Year Worker.
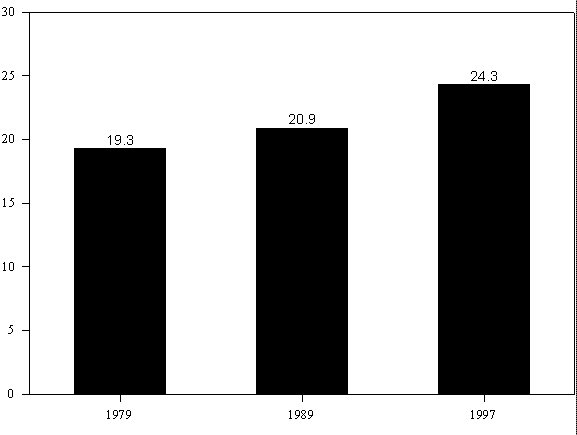
Source: Authors' analysis of March CPS data.
Another potential limitation of table 2's approach is that it shows pre-tax, pre-transfer income, which is different from the amount of disposable income available to such a family. At the average wage rate for women in the low-wage labor market of $5.86 an hour in 1997, for example, a woman who worked full-time/full-year would have had a pre-tax income of $12,200. When the Earned Income Tax Credit, the cash value of food stamps, federal and state tax payments, and uncompensated work expenses (including child care) are incorporated into the calculation, this woman's family would end up with a slightly higher ($13,231) income to spend.11
Changes in the Low-Wage Labor Market over Time
To put the 1997 picture of the low-wage labor market into a broader perspective, figures 3 through 6 look at trends over the 1973-97 period from a variety of perspectives. Whichever perspective is taken, the story is essentially the same. Real wages have fallen for the low-wage sector of the labor force.
Wage-Rate Perspective. Figure 3 shows the share of workers earning poverty-level wages or less, by gender (the 1997 figures are the same as those in table 2, panel B, column 1). The middle line shows a rising trend for all workers, from 23.7 percent of the workforce in 1973 to 28.6 percent in 1997. This trend, as discussed in more detail below, has been driven exclusively by men. Women workers are still more likely to be in the low-wage sector than men, but their probability of being there has actually declined slightly over the last 25 years.
Figure 3. Percentage of the Workforce Earning Low Wages, 1973-97, by Gender
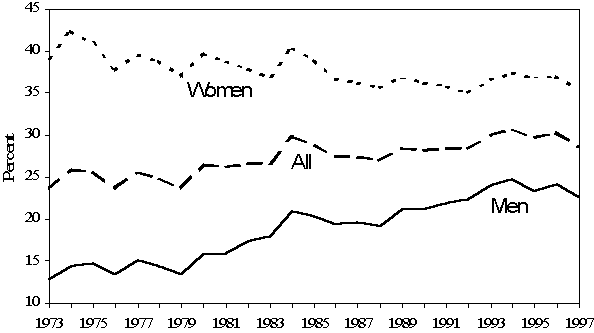
Source: Michel, Berstain, and Schmitt (1999a).
Employment/Hours Perspective. Figure 4 shows the trend in the proportions of persons, in families with children, who worked full-time/full-year and still had annual earnings below the poverty line for a family of four. Their share increased about 4 percentage points between 1979 and 1989. This is consistent with the trend in figure 2, which shows an increase since 1979 in the share of poor families with children that have at least one full-time/full-year worker. A greater share of female-headed than male-headed poor families with children had at least one full-time worker throughout this period. This share fell during the 1970s, grew 4 percentage points in the 1980s, and has been flat in the 1990s. By 1997, one-quarter of female-headed families with children had a full-time worker with poverty-level earnings.
Figure 4. Persons in Families with Children, Who Work Full-Time/Year-Round and
Have Annual Earnings at or below the Poverty Level, 1969-97.
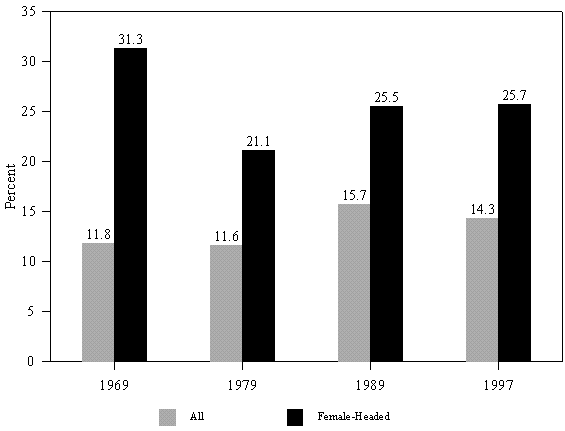
Source: U.S. Bureau of the Census (1992) and unpublished data.
Education Perspective. Figure 5 shows the trend in real hourly wages for workers with a high school education or less by gender for the 1973-97 period. The real hourly wages for men and women with less than a high school degree fell by 30 percent and 16 percent, respectively, over this period. For high school graduates, real hourly wages fell by 17 percent for men, but by only about 3 percent for women.
Figure 5. Average Real Hourly Wages of Men and Women with a High School Degree or Less, 1973-97, Indexed to 1979
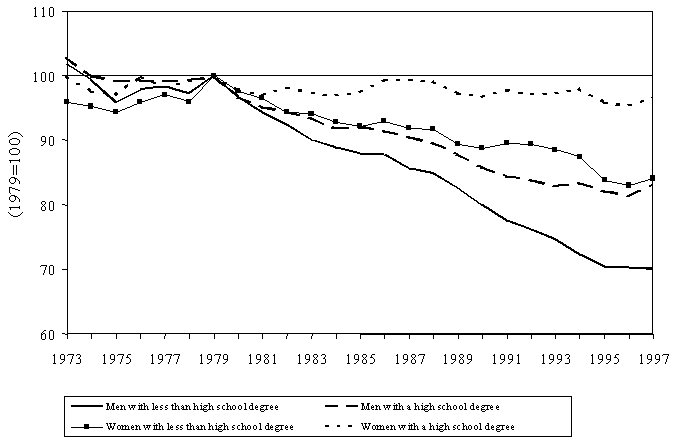
Source: Mishel, Bemstein, Schmitt, 1999b.
Relative Wage Perspective. Figure 6 shows real hourly wages for both men and women in the 10th and 20th percentiles of the wage distribution. For men and women in the 10th percentile, and for men in the 20th percentile, real wages fell by 16 to 18 percent. For women in the 20th percentile from the bottom, the picture was somewhat less discouraging. They suffered a real wage drop of only 7.6 percent.
Figure 6. Real Wages for Men and Women in the 10th and 20th Percentile of the Wage Distribution, 1973-97, Indexed to 1979
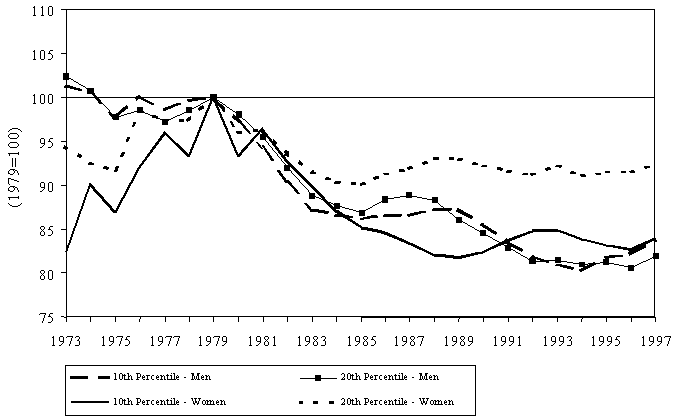
Source: Mishel, Bemstein, Schmitt, 1999b.
Shifts in Worker Characteristics over Time. Table 3, which takes the same measurement approach as table 2, examines changes in the characteristics of low-wage workers. Over the roughly 25-year period, the average real wage of the workforce as a whole remained virtually unchanged. Within this overall wage stability, however, there were substantial differences by wage sector and sex.
| Low-Wage Workers |
Mid-Wage Workers |
High-Wage Workers |
Total | |
|---|---|---|---|---|
| Average Wage (Percent Change) |
||||
| All | -7.3% | -1.3% | 9.4% | -0.5% |
| Men | -6.6 | -3.5 | 11.0 | -5.6 |
| Women | -8.0 | 1.3 | 12.1 | 12.9 |
| Distribution Across Wage Groups (Percentage Point Change) |
||||
| All | 4.9 | -3.0 | -1.9 | 0.0 |
| Men | 9.1 | -0.3 | -8.8 | 0.0 |
| Women | -1.8 | -6.6 | 8.5 | 0.0 |
| Change in Characteristics Within Wage Group (Percentage Point Change) |
||||
| Women | -9.0 | -1.0 | 17.7 | 4.3 |
| White | -12.7 | -7.3 | -4.5 | -8.5 |
| High school or less | -13.5 | -17.6 | -26.0 | -17.9 |
| Ages 18 - 25 | -7.6 | -13.4 | -6.3 | -8.6 |
| Manufacturing | -3.5 | -8.1 | -10.6 | -8.1 |
| Retail trade | 1.8 | 0.0 | -0.5 | 1.4 |
| Business services | 2.7 | 2.6 | 2.8 | 2.7 |
| Sales occupations | 7.6 | -4.4 | 3.6 | 5.3 |
| Clerical occupations | 8.4 | -3.7 | -2.5 | -4.5 |
| Union ** | -0.2 | -9.6 | -17.9 | -10.1 |
| * Wage ranges are multiples of the poverty level for a family of four divided by ull-time, full-year work (see text). ** Since the 1979 CPS does not carry the variables necessary to determine union membership, the trends in union membership shown here are for 1978-97. |
||||
The low-wage sector lost substantial ground (real wages falling by over 7 percent). The middle-wage sector lost only slightly more than the workforce as a whole. The high-wage sector gained considerably (9.4 percent increase over the period). Wage growth was strongest for women, with real wage rates growing by almost 13 percent over the period. Within this overall average, however, women in the low-wage sector lost ground (with their average wage rate dropping by 8 percent). Men lost ground overall, as did men in low-wage and middle-wage sectors. But the high-wage men gained almost as much as the high-wage women.
With respect to workforce, employment in the low-wage sector grew by 4.9 percentage points. Within this average, the share of men that are in the low-wage sector grew by over 9 percentage points while the share of women that are low-wage remained virtually unchanged.
The rest of table 3 shows the changing characteristics of workers within each wage group overtime. Like the rest of the workforce, the low-wage sector included more minorities and became older, more highly educated, and less likely to work in the manufacturing industry. Unlike the rest of the workforce, however, the low-wage sector included less women. Women made up an additional 4.3 percentage points of the total workforce, while their share in the low-wage group fell 9 percentage points. The "high school or less education" category declined by 13.5 percent.12 It may seem surprising that, in a period when the economic returns to education were rising (particularly over the 1980s), a larger share of those earning low wages were better educated at the end of the period than at the beginning. But this is the unavoidable outcome of long-term educational upgrading combined with long-term wage decline. Between 1979 and 1997, for example, the share of the workforce with less than a high school degree fell from 20.1 to 11.1 percent. In the absence of this educational upgrading, even larger shares of men and women would have been in the low-wage sector in 1997.
By industry, low-wage workers became less likely to work in manufacturing and more likely to work in low-wage services like retail trade and "temporary" office services. The occupational shifts within the low-wage sector were primarily a 7.6 percentage point increase in the share of the low-wage sector employed in sales and an 8.4 percentage point drop in the share employed in clerical jobs (compared with an overall drop of 4.5 percentage points in the share employed in clerical occupations).
Explaining the Growth in the Low-Wage Labor Market
The discussion so far makes it clear that the probability of being a low-wage worker has increased, an increase that has been driven by an increasing share of men in the low-wage sector. In addition, the low-wage workforce has become more highly educated but has seen falling real wages. This section addresses some of the reasons behind these changes. The findings discussed are based on a statistical technique called regression analysis, which allows the contribution of different causal factors to be distinguished from one another.13 Thus, the impact of changes in the economic returns to education, experience, occupation and industry can be separated from the impact of changes in the characteristics of the workforce, and from the impact of the changes in the likelihood of being in the low-wage market.14
Disentangling Impacts. Using education as an example helps to explain why it is important to disentangle the contributions of these three separate sets of factors, all of which have caused the low-wage sector of the labor market to grow. If the likelihood of being a low-wage worker falls over time, it might be because the education premium increases (that is, the extra earnings that come with additional education, say, being a high school graduate rather than a high school dropout, increase). In this case, the share of low-wage workers would fall even if the educational characteristics of the low-wage workforce remained unchanged. But what if the economic returns to education remained the same but the characteristics of the workforce improved (that is, a larger share of the workforce went to college)? In this case, the low-wage share of the workforce would also fall, but the cause would be different. It is also possible for the low-wage share to fall, even if the returns to education and the characteristics of the workforce remained unchanged, because of structural changes in the economy and/or institutional changes in the labor market. The next section discusses the relative importance of changes in the economic returns to work, in the characteristics of the workforce, and in the structural and institutional factors in explaining trends in the low-wage labor market over the past 25 years.
The Findings. Changing returns to work, other things equal, have lowered the probability of being in the low-wage sectorfor both men and women. Worker characteristics — educational and experience upgrading for men and women and occupational upgrading for women generally — have also lowered the probability of low-wage work, other things equal. Yet, the probability of low-wage work increased for the overall workforce. How can we explain this apparent riddle?
The answer is that the probability of low-wage work increased within groups of workers narrowly defined by age, race, education, occupation, and industry.15 Even after controlling for changes in all of these characteristics and their returns, we are still left with the secular increase in the probability of low-wage work.
What would have happened if there had been no changes in the economic returns to work or workforce characteristics? The probability of being in the low-wage sector would still have increased for both sexes, but the increase would have been much larger for men than for women.16
Various changes in the structure of the U.S. economy and labor market account for the increased probability of a worker being in the low-wage sector, irrespective of changes in the economic returns to work and the characteristics of the workforce. Explanations fall into two general camps: (1) a shift in labor demand against low-wage workers, driven by globalization and technological change, and (2) erosion of the institutions that used to bolster the economic conditions of the low-wage sector.17
Labor Demand Shift. The demand-shift argument interprets the sharp increase in educational returns over the 1980s as evidence that the demand for labor has shifted against the low-skilled worker. This shift, in turn, is due to an increasing mismatch between the skills these workers bring to the labor market and the skills employers seek, according to this argument. There is some evidence to support the demand-shift argument, particularly for workers at the very lowest skill level.18 But this cannot be the complete explanation, for several reasons. First, it fails to account for the increasing share of the workforce in the low-wage sector, irrespective of educational change. Second, wages have fallen for some groups of workers at all levels of education (even though the fall has been sharpest for the least educated).19 Third, if a labor demand shift were the complete explanation, one would expect to find persistent increases in the returns to education combined with declining employment opportunities for low-wage workers. But neither is true in the current economic recovery. Returns to education have significantly slowed for both men and women. Furthermore, low-wage employment, particularly at the low end of the service sector, has been growing quickly over this economic recovery, and the Bureau of Labor Statistics projects that some of the largest sources of future job growth will be in the low-wage categories (such as cashiers, retail sales workers, and low-wage clerical workers).20
Eroded Labor Market Institutions. This argument holds that a set of labor market institutions that have historically bolstered the wages of those in the low-wage sector have weakened in their protective role. Such institutions include minimum wage laws, unions, monetary policy, and trading regimes that protected jobs in favored industries. The real value of the minimum wage has fallen. Unbalanced trade in manufactured goods has expanded. The Federal Reserve has kept the unemployment rate at specific targets set to keep inflation down rather than employment up. All these factors have, indeed, reduced the ability of low-wage workers to keep their wages ahead of inflation.
Policy Options to Help Low-Income Workers
So, low-wage workers are being hurt in the current economy not only by weak labor demand for the least skilled, but also by the eroding of institutions that have historically protected them. In the current debate, however, the weak demand explanation has received most of the attention. The eroding institutions argument has received short shrift given its importance.
Workers with higher skills are always less likely to be low-wage workers and, in this regard, policies that stress skill upgrading are sure to be helpful. But the findings reported here show that the low-wage share has become better educated over time — and that this educational upgrading has failed to lower the share of low-wage workers because of real-wage declines even within education categories. Thus, skill improvements alone will not solve the problem of the increasing share of the workforce in the low-wage sector, particularly in the short and medium term. The steady increase in the likelihood of low-wage work — irrespective of changes in the economic returns to work and the characteristics of the labor force — makes a powerful case for policies that improve the demand side of the labor market, address the erosion of labor market institutions, and supplement the earnings low-wage workers can command with wage and income supports.
Increasing Labor Demand. The post-1996 period of the current economic recovery provides excellent evidence that increasing the demand for low-wage workers can play an important (and underappreciated) role in raising the wage levels and employment opportunities of low-wage workers. Persistently low unemployment rates have led to dramatic real wage gains for low-wage workers.21 And the tight labor market has led to historically large declines in the unemployment rates of disadvantaged workers who have been left behind in prior economic recoveries. Between 1996 and the first half of 1998, for example, the overall unemployment rate declined by 0.9 of a percentage point, to 4.5 percent. But the unemployment rates for workers traditionally lower down in the hiring queue declined more than the average — a 1.5 percentage point drop for African Americans, a 2.0 point drop for Hispanics, and a startling 3.5 point drop for young (ages 18 to 35) minority high school graduates (a particularly disadvantaged group).
This suggests the need to rethink the question of when wage growth threatens to become inflationary, in the sense of triggering ever-increasing price growth. Conventional wisdom held that inflation would begin to spiral upwards with the unemployment rate pegged at 6.0-6.5 percent. This parameter guided Federal Reserve monetary policy through much of the 1980s and 1990s, with low-wage workers suffering as a result. But the recent sharp decline in the unemployment rate to 4.5 percent — with no accompanying acceleration of inflation (indeed, inflation is also at a historic low) — has taken the unemployment rate as a key indicator into uncharted territory. The evidence is quite clear about the distributional consequences of the unemployment/inflation tradeoff. Declines in unemployment are more beneficial to lower-income families, whose wages are more sensitive to labor market tightening. Inflation at modest levels does more damage to those at the top of the income scale. (Spiraling inflation, obviously, hurts everyone).22
Strengthening Labor Market Institutions. Minimum wage law and union membership are the major factors at issue here. The general consensus is that the declines in the real minimum wage and in union membership explain up to two-fifths of the increase in wage inequality since the 1970s.23
The minimum wage has played an important historical role by providing a wage floor below which employers could not set wage rates. This floor is particularly important for female workers who, as already noted, represent close to 60 percent of minimum wage workers. In recent years, the 10th percentile of the female wage distribution has, for all practical purposes, been set by the legal minimum. Thus, the fall in the minimum wage of 30 percent in real terms over the 1980s played a major role in both the expansion of low-wage work and the increase in wage inequality, particularly among women. Here again, the conventional wisdom among economists has changed. It was generally held that increases in the minimum wage led to job loss among the low-wage workers it was supposed to protect. But now a growing body of empirical research has shown that this is not true, at least for increases of the magnitude implemented in the United States. The most recent 90-cent increase, for example, lifted the earnings of low-wage workers without leading to job losses.24
Unions have also played a historical role in the labor market, increasing the bargaining power and compensation both of their members and of workers outside the unionized sector. As with the decline in the minimum wage, empirical research has identified the decline in union membership among the workforce as an important contributor to the increase in wage inequality. As noted earlier, low-wage workers have historically been under represented by labor unions. However, recent efforts to organize low-wage service workers do look promising.
Wage and Income Supports. A stated goal of welfare reform is to make work pay.25 One policy that has been implemented to increase the wages of low-wage workers beyond what they command in the market is employer-based wage subsidies. The problem with this approach is that, as the minimum wage literature has pointed out, the demand for low-wage labor is relatively insensitive to changes in its price — implying that large employer-based wage subsidies will be required to generate the desired increase in employment, and that the negative trends over the past few decades have made such an approach ever more expensive. Nevertheless, certain approaches have had some success, particularly those that are combined with training and job development.26
An employee-based wage subsidy — such as the Earned Income Tax Credit — is generally considered a more effective way to subsidize work. Transportation and child care subsidies will also help, by directly raising the spendable incomes of low-wage working families.
Conclusion
The advent of welfare reform, with its emphasis on welfare to work, has led to an increased interest in the low-wage labor market. Such interest is well-served by examining the ways in which labor market analysts have defined the low-wage labor market in prior literature. A typology has been applied in the previous sections, drawing both on the early work of segmented labor market theorists as well as that of more contemporary empirical analysts.
Then some of the wage-based definitions were applied, which showed that under each definition wages and earnings have fallen for these workers. Examining the characteristics of low-wage workers (defined using absolute wage levels) reveals few surprises: such workers are disproportionately female, minority, with at most a high school degree. Over time, the share of women in the low-wage workforce has declined, and low-wage workers are better educated now than in the past. In addition, the likelihood of low-wage work has increased over time, driven by an increase in the number of men in this segment of the workforce. The low-wage share of female workers would have grown significantly had women not upgraded their education, experience, and occupations. However, even after controlling for changes in both returns and characteristics, there has been a large, secular increase in the likelihood of work at low wages.
Explanations for the increase in low-wage work stress both a shift in labor demand against low-wage workers and the erosion of labor market institutions which, in prior years, served to increase the earnings of such workers, both in relative and absolute terms. Both of these explanations have some validity, but concerns regarding eroding institutions get too little attention relative to the demand-shift arguments. Policies can be designed to both increase demand for low-wage workers and reinvigorate key institutions.
References
Bernstein, Jared. 1998. "Living Wage Campaigns: A Step in the Right Direction." The Task Force on Reconstructing America's Labor Market Institutions. Task Force Working Paper No. WP01. Cambridge, Mass.: MIT Sloan School of Management.
Bernstein, Jared. 1997. "Low-Wage Labor Market Indicators by City and State: The Constraints Facing Welfare Reform." Economic Policy Institute Working Paper No. 118. Washington, D.C., October.
Bernstein, Jared, and John Schmitt. 1998. Making Work Pay: The Impact of the 1996-97 Minimum Wage Increase. Washington, D.C.: Economic Policy Institute.
Blank, Rebecca M. 1994. "Outlook for the U.S. Labor Market and Prospects for Low-Wage Entry Jobs." Paper presented at the Urban Institute conference, "Self-Sufficiency and the Low-Wage Labor Market: A Reality Check for Welfare Reform," Washington, D.C.
Blank, Rebecca M., and Alan S. Blinder. 1986. "Macroeconomics, Income Distribution, and Poverty." In Fighting Poverty: What Works and What Doesn't, edited by Sheldon Danziger and Daniel Weinberg. Cambridge, Mass.: Harvard University Press.
Blank, Rebecca M., and David Card. 1993. "Poverty, Income Distribution, and Growth: Are They Still Connected?" Brookings Papers on Economic Activity, No. 2. Washington, D.C.: Brookings Institution.
Currie, Janet, and Aaron Yelowitz. 1998. "Health Insurance and Less-Skilled Workers." Paper presented at the Labor Markets and Less-Skilled Workers conference, Washington, D.C.
Dunlop, John. 1979. "Wage Contours." In Unemployment and Inflation: Institutionalist and Structuralist Views, edited by Michael Piore. Armonk, N.Y.: M.E. Sharpe.
Fortin, Nicole M., and Thomas Lemieux. 1997. "Institutional Changes and Rising Wage Inequality: Is There a Linkage?" Journal of Economic Perspectives 11 (Spring): 75-96.
Gordon, David M. 1972. Theories of Poverty and Unemployment. Lexington, Mass.: D.C. Heath and Company.
Harrison, Bennett, and Andrew Sum. 1979. "The Theory of 'Dual' or Segmented Labor Markets." Journal of Economic Issues XIII (3): 687-706.
Holzer, Harry J. 1996. What Employers Want: Job Prospects for Less-Educated Workers. New York: Russell Sage Foundation.
Howell, David R. 1997. "Institutional Failure and the American Worker: The Collapse of Low-Skill Wages." The Jerome Levy Economics Institute of Bard College, Public Policy Brief No. 29. Annandale-on-Hudson, NY: Bard Publications Office.
Johnson, George E. 1997. Changes in Earnings Inequality: The Role of Demand Shifts. Journal of Economic Perspectives 11 (Spring): 41-54.
Katz, Lawrence F. 1998. "Wage Subsidies for the Disadvantaged." In Generating Jobs: How to Increase Demand for Less-Skilled Workers, edited by Richard B. Freeman and Peter Gottschalk. New York: Russell Sage Foundation.
Mishel, Lawrence, Jared Bernstein, and John Schmitt. 1999a. The State of Working America, 1998-1999. Economic Policy Institute Series. Ithaca, N.Y.: Cornell University Press.
____. 1999b. Wages in the 1990s: Measurement and Trends. Presented at the ASSA Annual Conference, New York City, 1999. Forthcoming, Economic Policy Institute Technical Paper.
Organization for Economic Cooperation and Development. 1997. "Earnings Mobility: Taking a Longer-Run View." Employment Outlook. Paris: OECD.
Piore, Michael. 1975. "Fragments of a Sociological Theory of Wages." Proceedings of the 25th Annual Meeting of the Industrial Relations Research Association, Madison.
Silvestri, George T. 1997. "Occupational Employment Projections to 2006." Monthly Labor Review (November).
Spriggs, William, and Bruce Klein. 1994. Raising the Floor: The Effects of the Minimum Wage on Low-Wage Workers. Washington, D.C.: Economic Policy Institute.
Spriggs, William, and John Schmitt. 1996. "The Minimum Wage: Blocking the Low-Wage Path." In Reclaiming Prosperity: A Blueprint for Progressive Economic Reform, edited by Todd Schafer and Jeff Faux. Armonk, N.Y.: M.E. Sharpe.
Topel, Robert. 1993. "What Have We Learned from Empirical Studies of Unemployment and Turnover?" Paper presented at the 105th Annual Meeting of the American Economic Association, Anaheim, Calif., January 5-7.
U.S. Department of Commerce, Bureau of the Census. 1992. Workers with Low Earnings: 1964 to 1990. Series P-60, No. 178. Washington, D.C.: U.S. Government Printing Office. Unpublished updates provided by Jack McNeil of the Census Bureau.
Appendix
Data and Methods
Wage Data: The wage data for tables 2, 3, and A1 come from the Outgoing Rotation Group (ORG) files of the Current Population Survey (CPS) for 1979-97. The sample includes all wage and salary workers, ages 18 to 64, with positive hourly wages between $0.50 and $100 in 1989 dollars. For hourly paid workers, the reported hourly wage is used; for weekly workers, the hourly wage is constructed by dividing usual weekly earnings by usual weekly hours. Top-coded weekly earnings were replaced with the estimated value of the mean weekly salary above the top code, using the assumption that the upper "tail" of the distribution follows a Pareto format. Quantile estimates, such as those shown in figure 6, use a smoothing procedure to accommodate "clumps" in the reported distribution of earnings. The construction of this wage series is discussed in greater detail in Webster (1999).
Table A1, Oaxaca decomposition: The wage data for this table also come from the CPS ORG, as described above. We use the following equation to decompose the changes in characteristics (Xs) and returns (Bs):
where p is the change in the probability of low-wage work (in our case, the change in the likelihood of earning less than $7.90 in 1997 dollars), B bar is the average of the returns between the two time periods, X bar the average of characteristics between the two time periods, a the intercept term, and I indexes the independent variables, 1 through k. Variables in the regression include education, potential experience (age-education-6), industry, occupation, race, region, and marital status. The regressions use the CPS ORG population weights, and separate equations were estimated for men and women.
Thus, the first term represents that part of the change attributable to changing characteristics, the second term represents that part of the change attributable to shifts in returns, and the third term captures the change in the intercept.27
| Men | 1979-89 | 1989-97 | 1979-97 | |||
|---|---|---|---|---|---|---|
| Total Change | 0.078 | 0.013 | 0.091 | |||
| Characteristics | Returns | Characteristic | Returns | Characteristics | Returns | |
| Education | -0.010 | -0.008 | -0.007 | 0.014 | -0.017 | 0.006 |
| Industry | 0.008 | -0.043 | 0.004 | 0.027 | 0.011 | -0.014 |
| Occupation | 0.007 | 0.021 | 0.000 | -0.019 | 0.007 | 0.001 |
| Experience | -0.009 | -0.059 | -0.012 | -0.021 | -0.020 | -0.080 |
| Race | 0.003 | -0.017 | 0.004 | -0.016 | 0.006 | -0.033 |
| Marital | 0.007 | -0.022 | 0.001 | 0.020 | 0.008 | -0.002 |
| Intercept | na | 0.200 | na | 0.018 | na | 0.218 |
| Sum | 0.007 | 0.071 | -0.010 | 0.022 | -0.005 | 0.095 |
|
|
||||||
| Women | 1979-89 | 1989-97 | 1979-97 | |||
| Total Change | -0.002 | -0.017 | -0.018 | |||
| Education | -0.019 | -0.015 | -0.016 | 0.011 | -0.033 | -0.006 |
| Industry | 0.003 | 0.001 | 0.003 | 0.027 | 0.006 | 0.027 |
| Occupation | -0.013 | 0.044 | -0.008 | 0.005 | -0.022 | 0.050 |
| Experience | -0.012 | -0.016 | -0.012 | -0.022 | -0.024 | -0.038 |
| Race | 0.001 | -0.024 | 0.002 | -0.002 | 0.003 | -0.025 |
| Marital | 0.001 | -0.046 | 0.001 | 0.011 | 0.002 | -0.035 |
| Intercept | na | 0.092 | na | -0.015 | na | 0.076 |
| Sum | -0.038 | 0.036 | -0.031 | 0.014 | -0.068 | 0.049 |
| Source: CPS ORG data. Dependent variable is the probability of low-wage work, measured using wage categories from table 2 (multiple of poverty line, or less than $7.90 in 1997). Oaxaca decomposition uses linear probability model, with CPS population weights. See data appendix for details. | ||||||
Footnotes
# The authors thank Danielle Gao and Ryan Helwig for research assistance, and Felicity Skidmore for editing.
1 Workfare (publicly subsidized work) is supposed to be a stopgap for those unable to find private-sector work in the short term.
2 See Harrison and Sum (1979), Gordon (1972), Piore (1975), and Howell (1997).
3 This concept was introduced by former Labor Secretary John Dunlop (1979).
4 See Spriggs and Klein (1994) and Spriggs and Schmitt (1996).
5 All the poverty-level wage calculations in this paper refer to the poverty-level wage for a family of four. Using the poverty-level wage for a family of three does not change the qualitative or quantitative results.
6 Organization for Economic Cooperation and Development (OECD) (1997) defined the low-wage cutoff as two-thirds of the median wage. Interestingly, the OECD finds no evidence of higher mobility among low earners in the less-regulated United Kingdom and United States compared to other countries in its study.
7 See Topel (1993).
8 See Bernstein (1997).
9 This trend has since slowed.
10 See Mishel et al. (1999a), table 3.21.
11 This family would have been ineligible for health coverage under Medicaid in 1997. Subsequent program changes have now made the children in such a family eligible for Medicaid coverage, raising the family's living standard a bit higher (Currie and Yelowitz 1998).
12 This comparison involves crossing the coding change in the Current Population Survey (CPS) education variable. The education category that changed the most was "some college." Those who had completed 13 to 15 years of schooling in pre-1992 files were labeled "some college." The new coding differentiates between those with associate degrees and those with some college. Since these are percentages that together cover everyone, the coding change only introduces error to the extent that those with high school or less would have been classified differently under the two coding schemes. Evidence from the 1990 CPS, which includes both coding formats, suggests a coding-induced shift from high school to some college — making the changes shown in table 3 overestimates of the educational upgrading that took place over the period.
13 See appendix at the end of this chapter.
14 The economic returns and the workforce characteristics may in fact affect each other to some degree, but not enough to change the nature of the broad trends discussed in this paper.
15 Evidence for this is seen in the increase in the intercept term shown in appendix, table A1.
16 The combination of the findings for women are particularly worth noting. The net effect of declining economic returns to work and the negative structural factors would have led to a 4.9 percent increase in the share of the female workforce in the low-wage sector between 1979 and 1997. But their actual share in the low-wage sector fell over the period, by 1.8 percent. Thus, improvements made by women in education, occupation, and experience more than reversed the impact of the negative factors.
17 A recent example of the demand-shift argument was made by Johnson (1997). Institutional arguments can be found in Fortin and Lemieux (1997), Howell (1997), and Mishel et al. (1999a).
18 See Holzer (1996).
19 For example, the real wages of entry-level (one to five years' experience), college-educated workers fell by about 7 percent for both men and women during the 1989-97 period (Mishel et al. 1999a).
20 Of the 10 occupations projected to add the most jobs over the 1996-2006 period, 7 call for high school or less in terms of skill demands, and 5 are in the lowest pay category (Silvestri 1997, table 4).
21 See Mishel et al. (1999a).
22 See Blank and Blinder (1986) and Blank and Card (1993).
23 See Fortin and Lemieux (1997).
24 See Bernstein and Schmitt (1998). A policy related to the minimum wage is the living wage movement, which has been successfully passed in ordinances in numerous cities enforcing pay levels above the minimum for workers in firms with city contracts (Bernstein 1998).
25 As with immigration, various analysts have argued that the welfare-to-work component of welfare reform has the potential to further increase the supply of low-wage workers.
26 See Katz (1998).
27 Danziger and Acs (1997) do a similar decomposition.