
Foreword
The Welfare Indicators Act of 1994 requires the Department of Health and Human Services to prepare annual reports to Congress on indicators and predictors of welfare dependence. This first Annual Report on Welfare Indicators was developed with the advice and recommendations of the bipartisan Advisory Board on Welfare Indicators and the assistance of the U.S. Department of Agriculture, the Social Security Administration and the U.S. Bureau of the Census. This report marks a significant step toward achieving the stated purpose of the law -- "to provide the public with generally accepted measures of welfare receipt so that it can track such receipt over time and determine whether progress is being made in reducing the rate at which and, to the extent feasible, the degree to which, families depend on income from welfare programs and the duration of welfare receipt.
This report is the direct result of the foresight and leadership of Senator Daniel Patrick Moynihan. He sponsored the Welfare Indicators Act of 1994 to make it clear that reduction in welfare dependence is a national goal, and that regular measurement and assessment of progress toward that goal is necessary. The act calls for such measures, just as, for example, the Employment Act of 1946 called for regular measures that led to a better understanding of the critical problem of unemployment in this country. In introducing the bill, Senator Moynihan declared that the policy and responsibility of the Federal Government must be to strengthen families and promote their self-sufficiency. This report is a first step in documenting our progress toward that goal.
We recognize that it is difficult to develop consensus around a single measure of welfare dependence. Nevertheless, in an effort to be responsive to the intent of the Welfare Indicators Act, this report proposes for discussion and debate a definition of welfare dependence that was developed by the Advisory Board:
A family is dependent on welfare if more than 50 percent of its total income in a one-year period comes from AFDC/TANF, Food Stamps and/or SSI, and this welfare income is not associated with work activities. Welfare dependence is the proportion of all families who are dependent on welfare.
The Advisory Board's recommended definition is consistent with the working definition of "dependence" we adopted in last year's Interim Report that incorporated elements of degree and duration of receipt and behavior of the recipient. It takes a comprehensive view of dependence -- one that considers the range as well as the depth of dependence through indicators that measure how much and how long assistance is received, as well as whether the assistance supplements or supplants earnings. The recommended definition would count as work activities only unsubsidized and subsidized employment and work required to obtain benefits.
The proposed definition, unfortunately, cannot be measured precisely at this time with currently available data. Two data issues present potential problems. First, current data do not distinguish between cash benefits where work is required and cash benefits that are paid without any work effort. Thus, while income from private employment can be excluded in calculating welfare benefits, it is not currently possible to exclude work that is required to obtain benefits. Second, this report uses data from the Survey of Income and Program Participation (SIPP) to obtain measures of the proposed definition. The SIPP, like all large-scale surveys, has a significant time lag. For example, the most recent SIPP data currently available are for 1993. In spite of these relatively minor measurement problems, however, we believe this proposed definition of welfare dependence marks an important development, and we welcome further discussion of it.
In addition to discussing the proposed definition of dependence, this report highlights a few specific indicators of dependence that were recommended for consideration by the Advisory Board at their most recent meeting. It also presents for consideration a broader set of indicators of welfare recipiency and dependence, as well as a wide-ranging collection of predictors, or risk factors associated with welfare receipt. The Advisory Board was in agreement that, since the causes of welfare receipt and dependence are not clearly known, the report should include a larger set of risk factors associated with welfare receipt. Nonetheless, the report reduces the overall number of predictors and risk factors by about 20 percent from the number included in last year's Interim Report. Indicators of deprivation supplement the dependence indicators to ensure that dependence measures are not assessed in isolation.
Finally, we would note that the annual Indicators reports should be viewed in the context of the wide array of research and evaluation efforts supported and carried out by this Department, other Federal agencies, and the broader research community regarding the effects of the PRWORA and state and local welfare reform efforts on dependency and deprivation. Together, these research efforts should provide us with a rich array of information which no one approach could generate alone. We hope the Indicators report will focus and enrich these efforts and carry out Senator Moynihan's vision, by focusing researchers on the critical issue of dependency and shining a spotlight on national trends.
We are grateful to the members of the Advisory Board on Welfare Indicators for their hard work and wise counsel on this important and difficult issue.
Donna E. Shalala
Secretary
U.S. Department of Health and Human Services
Acknowledgments
This first annual report on Indicators of Welfare Dependence benefits from the contributions of many people and could not have been completed without their efforts. The Advisory Board on Welfare Indicators, established by the Welfare Indicators Act of 1994, and appointed by the House of Representatives, the Senate, and the President, provided critical direction and wise counsel throughout the development of this report. Members of the Advisory Board include:
Eloise Anderson, Director, California Department of Social Services
Jo Anne B. Barnhart
Paul E. Barton, Director, Policy Information Center, Educational Testing Service
Martin H. Gerry, Director, Center for Study of Family, Neighborhood, and Community Policy, University of Kansas
Judith M. Gueron, President, Manpower Demonstration Research Corporation
Robert Greenstein, Executive Director, Center on Budget and Policy Priorities
Wade Horn, Director, National Fatherhood Initiative
Marvin H. Kosters, Resident Scholar and Director of Economic Policy Studies, American Enterprise Institute
Gerald H. Miller, Senior Vice President and Managing Director - Welfare Reform, Lockheed Martin IMS
Kristin A. Moore, Executive Director, Child Trends, Inc.
Joan M. Reeves, Commissioner, Philadelphia Department of Human Services
Gary J. Stangler, Director, Missouri Department of Social Services
Staff from the U.S. Department of Agriculture, Food and Consumer Service, and the Social Security Administration, Office of Research, Evaluation and Statistics, and the U.S. Bureau of the Census, Housing and Household Economic Statistics Division made valuable contributions to the report and were extremely helpful in gathering and providing data for use throughout the report.
Finally, vital assistance was provided by Greg Duncan of the Northwestern University Institute for Policy Research and Johanne Boisjoly of the Universite du Quebec a Rimouski, Departement des Sciences Humaines. They gathered and provided data on proposed indicators and assisted in drafting and producing the Interim Report.
"
Executive Summary
The Welfare Indicators Act of 1994 (part of Public Law 103-432) directed the Secretary of Health and Human Services to study the most useful statistics for tracking and predicting dependence on three means-tested cash and nutritional assistance programs: Aid to Families with Dependent Children (AFDC), Food Stamps, and Supplemental Security Income (SSI). It also required the submission of annual reports on welfare receipt in the United States that track key indicators and predictors of welfare dependence. An Interim Report to Congress addressing the development of welfare indicators and predictors and assessing the data needed to report annually on the indicators and predictors was submitted a year ago. This report is the first of the annual reports required under the law.
Barely two months before the Interim Report was due, the Personal Responsibility and Work Opportunity Reconciliation Act of 1996 (PRWORA) was signed into law on August 22, 1996, transforming large parts of the nation's welfare system. In addition to changes with far-reaching implications for the Food Stamp Program and the Supplemental Security Income (SSI) program for children, PRWORA established block grants for states to provide cash and other benefits to help needy families support their children while simultaneously requiring those families to make verifiable efforts to leave welfare for work.
The Interim Report
The bipartisan Advisory Board on Welfare Indicators established by the Welfare Indicators Act observed that the PRWORA's Temporary Assistance for Needy Families (TANF) program fundamentally changed the meaning of "dependence" by changing the framework for welfare policy and by providing states with the flexibility to define caseloads and benefits in extremely varied ways. In response, the Interim Report addressed the changing, but still evolving and uncertain, welfare environment in a number of ways.
- The Interim Report adopted a working definition of dependence as a continuum, incorporating elements of the degree of reliance on means-tested benefits, the duration of receipt, and the behavior of the recipient. The dependence/self-sufficiency continuum ranges from: i) long-term receipt of income from welfare with no significant labor market involvement or training; to: ii) participation in workfare or work-related activities and/or combining income from public assistance with earnings; to iii) short-term episodes of receipt of means-tested assistance programs; to: iv) long-term independence from receipt of means-tested assistance programs.
- To account for the varying degrees of dependence and different dimensions of a dependent family's condition, the report included an extensive list of indicators from a wide range of fields in an effort to present an accurate picture of the range of both dependence and the risk of dependence -- work and job readiness, poverty and deprivation, family structure, and parenting, as well as indicators of child achievement and health.
- The Interim Report suggested that the correlation between welfare caseloads and changes in dependence would likely become less close over time as states implement the wide range of policy choices permitted under PRWORA. The report recognized that caseload increases and decreases are the result of some combination of social, economic, demographic, and policy factors, and as such, it noted that dependence is a multi-dimensional measure of how much and how long assistance is received, as well as whether the assistance supplements or supplants earnings.
At the time the Interim Report was prepared, the impacts of the PRWORA were still unknown, although no one doubted that changes in "welfare receipt" (as defined by the Welfare Indicators Act for purposes of the annual welfare indicators reports) would occur. States face a dramatically different set of choices, rules and incentives under the PRWORA, and while TANF caseloads may vary in size as a result of changes in the number of people who are employed, they could also vary because states choose to serve families with state funds, to provide services instead of cash, or to expand benefits to working families (thus expanding caseloads without expanding dependence). Care must be taken not to view welfare caseloads as a proxy for welfare dependence. The increased number of possible policy variants under the new welfare law highlights the need to present an accurate and dynamic picture of dependence.
Plan for the First Annual Report
This year's first annual report differs from the Interim Report in several important ways. While the Interim Report provided a wide-ranging list of indicators, this report highlights a few measures of dependence that were recommended for consideration by the Advisory Board. Although recognizing the difficulties inherent in defining and measuring dependence, the Advisory Board proposed the following definition that could be tracked over time:
A family is dependent on welfare if more than 50 percent of its total income in a one-year period comes from AFDC/TANF, Food Stamps and/or SSI, and this welfare income is not associated with work activities. Welfare dependence is the proportion of all families who are dependent on welfare.
The Advisory Board's recommended definition would count as work activities only unsubsidized and subsidized employment and work required to obtain benefits. This concept and measures of this definition, as well as a duration of receipt measure, are presented and discussed in Chapter I. A discussion of measures of deprivation is also included in Chapter I to ensure that dependence measures are not assessed in isolation.
Chapter II includes indicators of income and food assistance program participation and program-related measures of dependence. These indicators focus on recipients of cash and nutrition assistance, and reflect both the range and depth of dependence. Data relating recipients' level of welfare income, amount of earnings, duration of receipt, participation in the labor force while receiving assistance, and multiple program receipt are included, along with information on events associated with beginning and ending receipt of means-tested assistance. Trend data on these indicators are provided where available.
Data on risk factors that have been identified as associated with welfare utilization and dependence are provided in Chapter III. While the Advisory Board was in agreement that a smaller set of dependence indicators should be highlighted, they were also in agreement that, since the causes of welfare receipt and dependence are not clearly known, the report should include a larger set of risk factors associated with welfare receipt. Still this report reduces the overall number of predictors and risk factors by about 20 percent from the number included in the Interim Report. Most of the deleted indicators are measures of well-being, particularly child well-being, that are tracked in other publications of the Department of Health and Human Services. The risk factors in Chapter III are loosely organized into three categories: economic security measures, measures related to employment and barriers to employment, and measures of teen behavior, including nonmarital childbearing.
Chapter IV addresses some of the complexities of data reporting and collection under the Temporary Assistance for Needy Family (TANF) block grants. Since the 1996 welfare law fundamentally changed the nation's cash assistance programs, it is important to understand the policy and program context that may surround changes in welfare dependence over time. It is crucial to collect a sufficient level of detailed administrative data about the TANF program and its recipients and benefits to permit tracking trends in dependence and deprivation over time. The quality and level of detail of TANF administrative data takes on even greater importance in the context of this report's proposed primary indicator of welfare dependence. In addition, despite the fact that most national survey data are not representative at the state level, they are critical for capturing indicators of adult labor force participation, earnings, program participation, fertility and child well-being, as well as complementing caseload data for tracking changes in dependence.
Because welfare programs have changed substantially in the recent past and are continuing to change rapidly, Appendix A is included to give basic data on each of the three main welfare programs and their recipients over the past several years. Appendix A briefly describes the three programs covered by the Welfare Indicators Act and highlights some of the recent legislative changes that will affect participation and/or expenditures in those programs. It also includes information on the population and characteristics of individuals and families receiving AFDC/TANF, Food Stamps and SSI, and national and state data on program participation and expenditures trends.
Other Appendices provide more detailed information on several related subjects. Appendix B consists of a series of tables on poverty issues. Appendix C includes a comparison between the indicators and predictors included in this Annual Report and those recommended in the Interim Report. Additional data on nonmarital childbearing is included in Appendix D.
Chapter I. Introduction
The Welfare Indicators Act of 1994 (Pub. L. 103-432) directed the Secretary of Health and Human Services to develop indicators of the extent to which American families depend upon income from welfare programs. Welfare programs, as defined under the Act, include the Aid to Families with Dependent Children (AFDC) program, the Supplemental Security Income (SSI) program, and the Food Stamp Program (FSP). Under the Welfare Indicators Act, annual reports are to be made concerning:
- The rate at which families depend on income from these welfare programs;
- The degree and duration of welfare recipiency and dependence;
- Predictors of welfare dependence; and
- Additional data needed to assess issues relating to welfare dependence.
An Advisory Board on Welfare Indicators also was established under the Act to assist the Secretary in defining welfare dependence and in choosing appropriate data for inclusion in the annual reports. The Board consisted of a bipartisan group of experts appointed by the Senate, the House of Representatives and the President. The Board oversaw the production of the Interim Report to Congress, published last October, and they played a major role in shaping this report, which is the first of the annual reports to Congress required under the law.
This report addresses the requirements of the Welfare Indicators Act in several ways. In this first chapter, the specific summary measures of welfare dependence proposed by the Advisory Board are presented and discussed. These measures attempt to provide a small set of indicators that can be tracked routinely to monitor progress in reducing welfare dependence. It is anticipated that they will be published on an annual basis in much the same way that poverty measures, for example, are published. At this point the measures are still somewhat experimental and further comments and discussion are invited.
The second chapter of this report presents a broader group of indicators of welfare recipiency and dependence. These indicators include measures of the extent of recipiency for each of the three programs considered separately, as well as information on income from all three programs in combination. Interaction of AFDC, SSI and FSP benefits with periods of employment and with benefits from other programs are also shown. The chapter also includes data on movements onto and off welfare programs, and on the extent to which welfare recipiency in adolescence is correlated with later adult recipiency.
The Board expressed a strong view that dependence measures could not be assessed in isolation, since changes in these measures could result either from increases in work activity and other factors that would raise family incomes, or from sanctions in welfare programs that would reduce welfare program participation but might not improve the material circumstances of these families. Accordingly, they recommended that measures of deprivation such as poverty rates, with and without the inclusion of welfare benefits, be presented together with the dependence measures. This chapter follows that recommendation and presents data on several measures of deprivation over time periods corresponding to those shown for the recommended measures of dependence.
Chapter III focuses on "predictors" of welfare dependence -- risk factors believed to be associated with welfare receipt in some way. These predictors are shown in three different groups: those that concern families' degree of economic security, those that are related to the work status of adult family members, and those that relate to teen behaviors.1 Economic security -- including measures of poverty, receipt of child support, health care coverage, and so forth -- is important in predicting dependence in the sense that families with fewer economic resources are more likely to rely on welfare programs for their support. Factors related to work status are also important, because families must generally receive an adequate income from employment in order to avoid dependence without severe deprivation. And finally, teen behaviors are very important since a high proportion of long-term welfare recipients became parents as teens, often outside of marriage. Starting a family in these circumstances may lead to dependence because teens generally lack adequate skills, preparation and resources to support a child.
Chapter IV addresses the final goal set out above by discussing additional data that might be needed to construct better indicators and predictors. Although the measures included in this report are the best that could be constructed with currently available data, additional data would potentially provide greater insights into the problems associated with welfare dependence.
Further, data needs are likely to change over time as welfare programs change. Since the passage of the Welfare Indicators Act, significant changes have been made in the federal system of providing means-tested assistance to families. The Personal Responsibility and Work Opportunity Reconciliation Act (PRWORA) (Pub. L. 104-193), enacted in 1996, increased state flexibility and gave states considerably more freedom to operate their own assistance programs. These changes mean that variations across welfare programs are likely to increase greatly, and our measures may need to be revised substantially to reflect the many different things that states may do to assist needy families. Chapter IV discusses this problem in greater detail.
Welfare recipiency is a necessary pre-condition for welfare dependence, although the Advisory Board cautioned that the two are not the same thing. As discussed above, welfare programs have changed substantially in the recent past, and are continuing to change rapidly. Appendix A has therefore been included to give basic data on each of the three main welfare programs and their recipients over the past several years.
1 Because there are so many potential predictors and not all possibilities can be included here, additional details on potential risk factors and associated indicators are provided in Appendix B.
Measuring Welfare Dependence
Measuring welfare dependence is not a simple problem. How much income must be received from welfare programs before a family is considered "dependent?" Does dependence relate to the length of time that the family has received benefits, or only to the amount or proportion of income from welfare? Are families with some income from work dependent if they also receive welfare income? These are among the questions that the Advisory Board considered in attempting to define and measure welfare dependence.
This report retains the concept underlying the Interim Report -- that dependence is a continuum, with variations in degree and in duration. Families could be more or less dependent if larger or smaller shares of their total resources were derived from welfare programs. Further, the Advisory Board recommended that a family receiving one welfare check probably should not be classified as dependent, even if that check accounted for all of their income for the month in question. Dependence, in other words, has some inherent concept of recipiency in more than the very short term. Finally, the Board believed that income associated with work, even if it was ultimately provided by the public, should not be counted as assistance in estimating dependence.
Although many different measures of dependence could be constructed that would follow these guidelines, the Board recognized the need for a summary measure that could be tracked over time to give some broad indication of changes in the overall degree of welfare dependence in American society. They developed a particular definition of welfare dependence that fulfilled that need. For this purpose, they proposed that the following definition be put forward for discussion and debate:
A family is dependent on welfare if more than 50 percent of its total income in a one-year period comes from AFDC/TANF, Food Stamps and/or SSI, and this welfare income is not associated with work activities. Welfare dependence is the proportion of all families who are dependent on welfare.
This measure is not without its limitations. The Advisory Board recognized that no single measure could fully capture all aspects of dependence and that their proposed measure should be examined in concert with other key indicators of dependence and deprivation. In addition, while the proposed definition would count unsubsidized and subsidized employment and work required to obtain benefits as work activities, currently available data do not permit distinguishing between welfare income associated with work activities and non-work-related welfare benefits. As a result, the data shown in this report overstate the incidence of dependence (as defined above) because work required to obtain benefits is classified as welfare and not income from work. Neither does this proposed definition capture all aspects of dependence. In particular it represents an essentially arbitrary choice of a percentage (50 percent) of income from welfare beyond which families will be considered dependent. However, it is relatively easy to measure and to track over time, and is likely to be associated with any very large changes in total dependence, however defined. For example, as the recent changes in welfare law move more recipients into employment or work-related activities, dependence under this definition should be expected to decline.
Unfortunately, any such declines cannot yet be observed using currently available data. The most accurate data on sources and amounts of income across the population as a whole are from the Survey of Income and Program Participation (SIPP).2 Because the SIPP is a large longitudinal survey of households it takes longer to collect and process than do program case records, and therefore representative data on all families appear somewhat later than do case record data.
Table SUM 1 shows the percentages of families who receive any welfare benefits and the percentage who would be considered welfare dependent under the above definition for the most recent years for which data are available.3 There is little trend discernable in these data. While there have been small year to year changes in both recipiency and dependence, the changes seen in the data available so far are not large enough to be statistically significant even in a survey as large as the SIPP.4 Overall, between four and five percent of all individuals would be considered welfare-dependent based on these data. These families represent about one-third of those who receive any benefits in each year.
Table SUM 1. Percent of the Total Population with More than 50 Percent of Income from Means-Tested Assistance Programs
| 1987 | 1990 | 1992 | 1993 | |||||
|---|---|---|---|---|---|---|---|---|
| Any Receipt of Assistance | More than 50% of Income | Any Receipt of Assistance | More than 50% of Income | Any Receipt of Assistance | More than 50% of Income | Any Receipt of Assistance | More than 50% of Income | |
| All Persons | 14.9 | 4.7 | 14.1 | 4.2 | 16.9 | 4.9 | 17.0 | 4.8 |
| Racial | ||||||||
| Non-Hispanic White | 9.3 | 2.2 | 8.9 | 2.1 | 11.0 | 2.4 | 10.9 | 2.3 |
| Non-Hispanic Black | 40.9 | 15.7 | 36.6 | 14.6 | 41.0 | 15.9 | 41.8 | 16.3 |
| Hispanic | 28.3 | 10.9 | 29.5 | 8.3 | 33.3 | 10.5 | 33.9 | 10.3 |
| Age | ||||||||
| Children 0-5 | 24.5 | 10.0 | 24.0 | 10.3 | 28.9 | 12.2 | 29.0 | 11.6 |
| Children 6-10 | 23.2 | 10.1 | 20.2 | 8.5 | 23.8 | 9.5 | 24.0 | 9.2 |
| Children 11-15 | 19.8 | 8.0 | 18.8 | 6.4 | 23.2 | 7.5 | 22.6 | 7.3 |
| Women 16-64 | 14.4 | 4.6 | 14.1 | 4.6 | 17.0 | 5.0 | 17.3 | 5.0 |
| Men 16-64 | 10.1 | 2.0 | 9.5 | 1.5 | 11.8 | 1.9 | 12.0 | 2.1 |
| Adults 65+ | 13.6 | 2.6 | 12.1 | 1.9 | 12.6 | 2.0 | 12.2 | 2.0 |
Note: Means-tested assistance includes AFDC, SSI and Food Stamps. While only affecting a small number of cases, general assistance income is included under AFDC.
Source: Unpublished data from the SIPP, 1987, 1990 and 1992 panels.
In considering the proposed definition of welfare dependence, the Advisory Board viewed SSI recipiency, which is generally related to either disability or old age, as somewhat different from AFDC and Food Stamp recipiency, because SSI recipients may be substantially less likely to be able to earn a significant amount. Table SUM 2 therefore presents data on the dependence indicator calculated three different ways: including income from all three programs, including AFDC and Food Stamp benefits only, and including SSI only. That table shows that in general most families who are dependent based on income from all three programs are also dependent under a definition that considers AFDC and Food Stamps alone. As might be expected, the only exception involves adults aged 65 and over, who are much more likely to be dependent on SSI than on the other two programs. Even so, however, only about two percent of elderly recipients are dependent under any definition. Non-whites and the very young are particularly likely to be dependent, and they are primarily dependent on AFDC and Food Stamps. Even in these populations, however, the vast majority of families do not meet the criteria for dependence.
Table SUM 2. Percent of the Total Population with More than 50 Percent of Income from Various Means-Tested Assistance Programs, 1992
| AFDC, SSI and Food Stamps | AFDC and Food Stamps | SSI Only | |
|---|---|---|---|
| All Persons | 4.9 | 3.8 | 0.7 |
| Racial Categories | |||
| Non-Hispanic White | 2.4 | 1.8 | 0.4 |
| Non-Hispanic Black | 15.9 | 12.3 | 2.1 |
| Hispanic | 10.5 | 8.9 | 1.2 |
| Age Categories | |||
| Children Age 0 - 5 | 12.2 | 11.4 | 0.3 |
| Children Age 6 - 10 | 9.5 | 8.6 | 0.3 |
| Children Age 11 - 15 | 7.5 | 6.2 | 0.5 |
| Women Age 16 - 64 | 5.0 | 3.8 | 0.8 |
| Men Age 16 - 64 | 1.9 | 1.1 | 0.6 |
| Adults Age 65 and over | 2.0 | 0.3 | 1.4 |
Note: While only affecting a small number of cases, general assistance income is included under AFDC.
Source: Unpublished data from the SIPP, 1992 panel.
The Advisory Board's discussion also focused on the need for some measure of dependence that included the concept of recipiency over an extended period of time. Accordingly, they recommended the inclusion of an additional measure that considered what proportion of the population participating in welfare programs over various periods of time met the dependence criteria. Table SUM 3 summarizes that measure for two different time periods, 1972-1981 and 1982-1991.
Table SUM 3. AFDC Receipt and Percentage of Recipients with More than 50 Percent of Income from AFDC and Food Stamps by Number of Years
| All Recipients 1972 - 1981 | All Recipients 1982 - 1991 | |||
|---|---|---|---|---|
| Any AFDC | AFDC & Food Stamps | Any AFDC | AFDC & Food Stamps | |
| Years | Receipt | >50% of Income | Receipt | >50% of Income |
| 0 Years | -- | 55 | -- | 50 |
| 1 - 2 Years | 49 | 22 | 47 | 23 |
| 3 - 5 Years | 28 | 14 | 28 | 15 |
| 6 - 8 Years | 13 | 5 | 15 | 9 |
| 9 - 10 Years | 11 | 4 | 11 | 4 |
| 100% | 100% | 100% | 100% | |
| Children 0 - 5 in 1972: 1972 - 1981 | Children 0 - 5 in 1982: 1982 - 1991 | |||
|---|---|---|---|---|
| Any AFDC | AFDC & Food Stamps | Any AFDC | AFDC & Food Stamps | |
| Years | Receipt | >50% of Income | Receipt | >50% of Income |
| 0 Years | -- | 39 | -- | 34 |
| 1 - 2 Years | 37 | 25 | 34 | 28 |
| 3 - 5 Years | 29 | 21 | 29 | 16 |
| 6 - 8 Years | 15 | 6 | 17 | 13 |
| 9 - 10 Years | 19 | 9 | 20 | 8 |
| 100% | 100% | 100% | 100% | |
Note: "AFDC Receipt" is defined as whether the person received AFDC at any time during the year. "AFDC & Food Stamps >50% of Income" is defined as whether the person's AFDC and Food Stamps benefit was more than 50% of their yearly income. "0 Years" means that while the person received means-tested assistance, their benefits were 50% of their income for zero years during the time period. For example, a person listed as receiving AFDC for 6 - 8 years ("Any AFDC Receipt") may never have received benefits greater than 50% of their income (0 years, AFDC and Food Stamps >50% of Income).
Source: Unpublished data from the PSID, 1972 - 1991.
Even among families who were recipients, the majority were dependent on AFDC and Food Stamps for less than one year in total over each of these 10 year periods. For example, 11 percent of people who received welfare at all received it for 9 to 10 years, but only 4 percent of those who were dependent on welfare at any point were dependent for 9 to 10 years. As the spell of recipiency lengthened, it appears that recipients were more likely to supplement welfare with income from other sources such as earnings. There is a small tendency for the proportion of spells of welfare dependence that are longer to grow over this period, but the change is not large enough to be statistically significant.5
2 While the number of families dependent on welfare from a particular program could potentially be calculated using program data alone, the proportion of the total population who are welfare dependent could not be seen, because families may receive income from more than one program and it is not always possible to match records across programs to avoid double-counting such families. Additionally, studies have shown that reports of total income to household surveys such as the SIPP are typically more detailed and accurate than are reports to welfare program administrators. Finally, the definition of a "welfare unit" for program purposes does not always include all family members living in the same household.
3 While more recent data from the SIPP have been collected, due to a number of technical issues, they were not available for analysis at the time this report was drafted.
4 Standard errors can be calculated using the formula published in the Survey of Income and Program Participation Users' Guide.
5 For further discussion of standard errors for PSID estimates, see The Panel Study of Income Dynamics, A User's Guide.
Measuring Deprivation
Measures of dependence may change for a number of different reasons, both positive and negative. As discussed earlier, the Advisory Board cautioned that measures of dependence should be presented in context -- that is, with some measure of the impacts of dependence changes on deprivation. Many different measures could again be used for that purpose.
One measure of deprivation is to look at changes in the level of need over time. Elsewhere in this document, for example, measures of the "poverty gap" (see Appendix B) -- the amount of income that would be needed to bring all of those below poverty to the poverty line -- and of food insecurity are presented (see Chapter III). Both of these give some indication of changes in the level of need over time. Further, both focus on changes that affect the resources of the part of the population that is already classified as poor. This is appropriate in considering effects of changes in welfare programs, because most welfare recipients have below-poverty incomes even including their cash welfare benefits.
In this chapter, however, the deprivation measure presented focuses directly on changes in the anti-poverty effectiveness of welfare and related programs. Tables SUM 4 and SUM 5 (and their associated figures) show how much welfare programs have reduced poverty rates over the period since 1979, first for all persons and second for persons in families with related children under age 18.
These tables show that many more families would be poor if they did not receive welfare benefits. Counting only cash income (excluding welfare), the poverty rate would generally be four to five percentage points higher than it is calculated to be when means-tested cash benefits, food and housing benefits, and taxes (including refunds through the Earned Income Tax Credit (EITC)) are all counted. This final poverty rate -- taking into account all sources of support -- is a more complete measure of deprivation than is the official poverty rate or other measures that exclude some types of support. Breaking it down in this fashion allows the relative contribution of different sources -- including cash welfare and relatively fungible in-kind welfare benefits -- to the alleviation of poverty to be observed.
Poverty rates of all types began to increase in 1990 as the economy went into a recession, reaching a peak in 1993. As economic conditions have started to improve rates have come down, both before and after means-tested assistance. Poverty rates for families with children remain substantially higher than those for all families, however. The gap between poverty rates before and after public assistance has increased slightly over time, particularly in the last few years as the size of the EITC has grown. The EITC is a work-related benefit, however, and is not included as assistance in estimating dependence. Through 1995 the contribution of means-tested welfare programs to the reduction in poverty has remained roughly constant at about four percentage points, although during the recession of the early 1980s these programs did somewhat less to reduce total poverty. Current poverty-reduction rates for assistance programs are about the same as in 1979, although a bit more of the reduction comes in the form of non-cash benefits.
The relatively small changes in the level of overall deprivation since the late 1980s is consistent with the small changes in the dependence rate seen earlier. As larger changes in dependence occur under PRWORA, it will be both necessary and interesting to track changes in these deprivation rates as well. If this legislation succeeds in its aims, dependence should fall noticeably while deprivation measures remain largely unchanged.
Figure SUM4. Trends in Poverty with and without Means-Tested Benefits for All Persons, 1979-1995
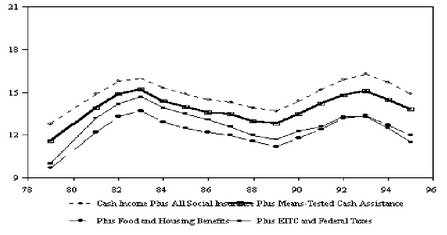
Table SUM 4. Trends in Poverty with and without Means-Tested Benefits for All Persons, 1979 - 1995
| 1979 | 1982 | 1985 | 1988 | 1991 | 1992 | 1993 | 1994 | 1995 | |
|---|---|---|---|---|---|---|---|---|---|
| Cash Income plus all social insurance | 12.8 | 15.8 | 14.9 | 13.9 | 15.2 | 15.9 | 16.3 | 15.7 | 14.9 |
| Plus Means-tested Cash Assistance | 11.6 | 14.9 | 14.0 | 13.0 | 14.2 | 14.8 | 15.1 | 14.5 | 13.8 |
| Plus Food and Housing Assistance | 9.7 | 13.3 | 12.5 | 11.6 | 12.4 | 13.2 | 13.4 | 12.7 | 12.0 |
| Plus EITC and Federal Taxes | 10.0 | 14.2 | 13.5 | 12.0 | 12.6 | 13.3 | 13.3 | 12.5 | 11.5 |
| Reduction in Poverty Rate | 2.8 | 1.6 | 1.4 | 1.9 | 2.6 | 2.6 | 3.0 | 3.2 | 3.4 |
Note: The first measure of poverty, labeled cash income plus all social insurance, includes social security but not means-tested cash transfers. Adding means-tested cash transfers yields the official census definition of poverty, the second line in the table. Food and housing benefits may be received either as cash or (more generally) as in-kind benefits in which case the market value of food and housing benefits is added. EITC refers to the refundable Earned Income Tax Credit which is always positive whereas Federal payroll and income taxes are a negative adjustment. The fungible value of Medicare and Medicaid is not included.
Source: Congressional Budget Office tabulations. Additional calculations by DHHS.
Figure SUM 5. Trends in Poverty with and without Means-Tested Benefits for All Persons in Families with Related Children Under Age 18, 1979-1995
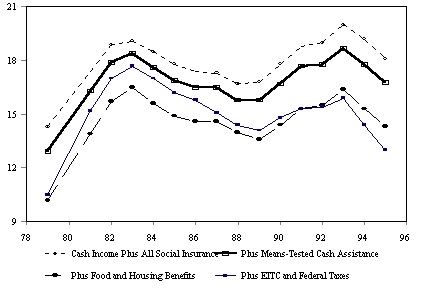
Table SUM 5. Trends in Poverty with and without Means-Tested Benefits for All Persons in Families with Related Children Under Age 18, 1979-1995
| 1979 | 1982 | 1985 | 1988 | 1991 | 1992 | 1993 | 1994 | 1995 | |
|---|---|---|---|---|---|---|---|---|---|
| Cash Income Plus All Social Insurance | 14.3 | 18.9 | 17.8 | 16.7 | 18.8 | 19.1 | 20.0 | 19.2 | 18.1 |
| Plus Means-tested Cash Assistance | 12.9 | 17.9 | 16.9 | 15.8 | 17.7 | 17.9 | 18.7 | 17.8 | 16.8 |
| Plus Food and Housing Benefits | 10.2 | 15.7 | 14.9 | 14.0 | 15.3 | 15.6 | 16.4 | 15.3 | 14.3 |
| Plus EITC and Federal Taxes | 10.5 | 17.0 | 16.2 | 14.4 | 15.3 | 15.5 | 15.9 | 14.4 | 13.0 |
| Reduction in Poverty Rate | 3.8 | 1.9 | 1.6 | 2.3 | 3.5 | 3.6 | 4.1 | 4.8 | 5.1 |
Note: The first measure of poverty, labeled cash income plus all social insurance, includes social security but not means-tested cash transfers. Adding means-tested cash transfers yields the official census definition of poverty, the second line in the table. Food and housing benefits may be received either as cash or (more generally) as in-kind benefits in which case the market value of food and housing benefits is added. EITC refers to the refundable Earned Income Tax Credit which is always positive whereas Federal payroll and income taxes are a negative adjustment. The fungible value of Medicare and Medicaid is not included.
Source: Congressional Budget Office tabulations. Additional calculations by DHHS.
Chapter II. Indicators of Dependence
Last year's Interim Report to Congress recommended consideration of an extensive list of dependence indicators from a wide range of fields in an effort to examine the range of dependence from complete long-term dependence to total self-sufficiency. No attempt was made to prioritize among them, nor to distinguish between indicators of dependence and the risk factors associated with welfare receipt. In contrast, this first Annual Report attempts to narrow the focus and progress toward the charge of the Welfare Indicators Act.
Chapter I proposes that the multiple dimensions of dependence be assessed with a few key measures and includes for discussion a small set of indicators that, if determined to be useful in tracking welfare dependence, could be analyzed on a regular basis to help address the goal of reducing welfare dependence among families with children. As a starting point for discussion, the Advisory Board on Welfare Indicators suggested consideration of the following proposed definition of dependence. Some summary data on the proposed measures is also included.
A family is dependent on welfare if more than 50 percent of its total income in a one-year period comes from AFDC/TANF, Food Stamps and/or SSI, and this welfare income is not associated with work activities. Welfare dependency is the proportion of all families who are dependent on welfare.
The task of defining welfare dependence for the purpose of tracking it over time is a difficult one. In proposing a definition, the Advisory Board grappled with any number of issues. Acknowledging that simple recipiency is not a good measure of dependence, that dependence is not a single point but a continuum, that its multiple dimensions preclude a single measure of dependence, and that people dependent on private transfers are not at issue, the Advisory Board recommended that some arbitrary choices be made to advance the discussion.
The proposed definition is not without its limitations, if for no other reason than the complexity of the task. Many difficulties with the proposal revolve around data availability issues, which are discussed in Chapter IV. The seriousness of the issue is complicated by the challenge to identify a small set of indicators. This report recognizes that the definition is, at this point, only a proposal for discussion. For that reason, this chapter includes a broader set of program-related indicators of recipiency and dependence.
Indicators in this chapter focus exclusively on recipients of cash and nutrition assistance. They reflect both the range and depth of dependence through data relating recipients' level of welfare income, amount of earnings, duration of receipt, participation in other assistance programs, and participation in the labor force. A brief description of each indicator is included, along with trend data where available and a graphical illustration.
Indicator 1. Degree of Dependence
This indicator captures the degree of dependence by examining total family income and the percentage of total family income from means-tested assistance programs.
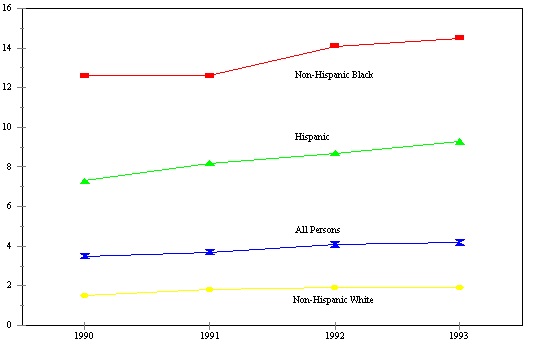
Figure IND 1a. Percent of Total Income from Means-Tested Assistance Programs for the Total Population, 1993
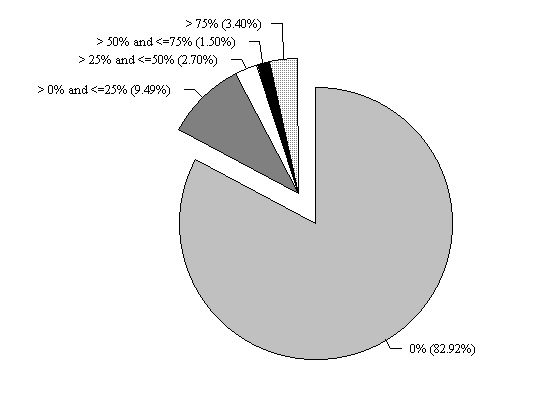
- Eighty-three percent of the total population received no means-tested assistance in 1993. Table IND 1a reveals a similar pattern for 1992 (83 percent), 1990 (86 percent) and 1987 (85 percent).
- For all persons who received some assistance, most received 25 percent or less of their total family income from AFDC, Food Stamps and SSI (9 percent). Table IND 1a shows similar percentages for other years (9 percent in 1992, 8 percent in 1990, 8 percent in 1987).
- Table IND 1a shows that a larger percentage of non-Hispanic blacks received more than 50 percent of their income from means-tested assistance than Hispanics or non-Hispanic whites in all four years.
- As further shown in Table IND 1a, somewhat larger percentages of children age 0 to 5, compared to children of other ages, lived in families that received more than 50 percent of their total income from means-tested assistance programs.
Table IND 1a. Percent of Total Income from Means-Tested Assistance Programs for the Total Population, Selected Years
| 0% | > 0% and | > 25% and | Total | > 50% and | Total | |
|---|---|---|---|---|---|---|
| <= 25% | <= 50% | > 50% | <= 75% | > 75% | ||
| 1993 | ||||||
| All Persons | 83.0 | 9.5 | 2.7 | 4.8 | 1.5 | 3.4 |
| Non-Hispanic White | 89.1 | 7.0 | 1.6 | 2.3 | 0.9 | 1.4 |
| Non-Hispanic Black | 58.2 | 18.4 | 7.1 | 16.3 | 4.3 | 12.0 |
| Hispanic | 66.1 | 17.6 | 6.1 | 10.3 | 2.9 | 7.4 |
| Children Age 0 - 5 | 71.0 | 12.8 | 4.6 | 11.6 | 3.1 | 8.5 |
| Children Age 6 - 10 | 76.0 | 11.0 | 3.9 | 9.2 | 2.1 | 7.1 |
| Children Age 11 - 15 | 77.4 | 11.1 | 4.3 | 7.3 | 2.0 | 5.2 |
| Women Age 16 - 64 | 82.7 | 9.6 | 2.7 | 5.0 | 1.5 | 3.5 |
| Men Age 16 - 64 | 88.0 | 8.4 | 1.4 | 2.1 | 0.9 | 1.2 |
| Adults Age 65 and over | 87.8 | 7.6 | 2.6 | 2.0 | 0.9 | 1.2 |
| 1992 | ||||||
| All Persons | 83.1 | 9.3 | 2.7 | 4.9 | 1.4 | 3.5 |
| Non-Hispanic White | 89.0 | 6.8 | 1.8 | 2.4 | 0.8 | 1.6 |
| Non-Hispanic Black | 59.0 | 18.3 | 6.9 | 15.9 | 4.1 | 11.7 |
| Hispanic | 66.7 | 17.6 | 5.1 | 10.5 | 2.5 | 8.0 |
| Children Age 0 - 5 | 71.1 | 12.1 | 4.6 | 12.2 | 3.0 | 9.3 |
| Children Age 6 - 10 | 76.2 | 10.7 | 3.6 | 9.5 | 2.6 | 6.9 |
| Children Age 11 - 15 | 76.8 | 11.9 | 3.8 | 7.5 | 2.1 | 5.4 |
| Women Age 16 - 64 | 83.0 | 9.2 | 2.8 | 5.0 | 1.3 | 3.7 |
| Men Age 16 - 64 | 88.2 | 8.2 | 1.6 | 1.9 | 0.7 | 1.3 |
| Adults Age 65 and over | 87.4 | 8.0 | 2.5 | 2.0 | 1.0 | 1.1 |
| 1990 | ||||||
| All Persons | 85.9 | 7.9 | 2.0 | 4.2 | 1.2 | 3.0 |
| Non-Hispanic White | 91.1 | 5.7 | 1.1 | 2.1 | 0.6 | 1.5 |
| Non-Hispanic Black | 63.4 | 16.0 | 6.0 | 14.6 | 5.2 | 9.3 |
| Hispanic | 70.5 | 16.8 | 4.4 | 8.3 | 2.1 | 6.2 |
| Children Age 0 - 5 | 76.0 | 11.0 | 2.8 | 10.3 | 2.4 | 7.9 |
| Children Age 6 - 10 | 79.8 | 9.2 | 2.6 | 8.5 | 2.4 | 6.0 |
| Children Age 11 - 15 | 81.2 | 9.6 | 2.8 | 6.4 | 1.8 | 4.5 |
| Women Age 16 - 64 | 85.9 | 7.7 | 1.8 | 4.6 | 1.3 | 3.2 |
| Men Age 16 - 64 | 90.5 | 6.7 | 1.3 | 1.5 | 0.5 | 1.0 |
| Adults Age 65 and over | 87.9 | 7.4 | 2.8 | 1.9 | 1.0 | 0.9 |
| 1987 | ||||||
| All Persons | 85.1 | 8.2 | 2.1 | 4.7 | 1.3 | 3.3 |
| Non-Hispanic White | 90.7 | 5.8 | 1.3 | 2.2 | 0.9 | 1.3 |
| Non-Hispanic Black | 59.1 | 18.7 | 6.5 | 15.7 | 3.9 | 11.8 |
| Hispanic | 71.7 | 13.6 | 3.8 | 10.9 | 2.2 | 8.7 |
| Children Age 0 - 5 | 75.5 | 10.9 | 3.7 | 10.0 | 2.7 | 7.3 |
| Children Age 6 - 10 | 76.8 | 10.5 | 2.6 | 10.1 | 2.8 | 7.3 |
| Children Age 11 - 15 | 80.2 | 9.2 | 2.6 | 8.0 | 1.6 | 6.4 |
| Women Age 16 - 64 | 85.6 | 7.9 | 1.9 | 4.6 | 1.1 | 3.5 |
| Men Age 16 - 64 | 89.9 | 6.8 | 1.4 | 2.0 | 0.8 | 1.2 |
| Adults Age 65 and over | 86.4 | 8.6 | 2.5 | 2.6 | 1.4 | 1.2 |
Note: Means-tested assistance includes AFDC, SSI and Food Stamps. While only affecting a small number of cases, general assistance income is included under AFDC. Total > 50% includes all persons with more than 50 percent of their income from these means-tested programs.
Source: Unpublished data from the SIPP, 1987, 1990 and 1992 panels.
Figure IND 1b. Percent of Recipients with More than 50 Percent of Income from AFDC and Food Stamps by Number of Years
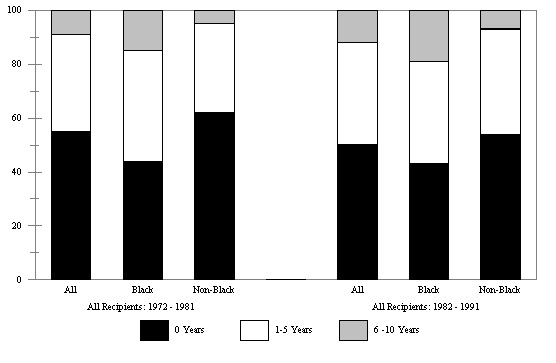
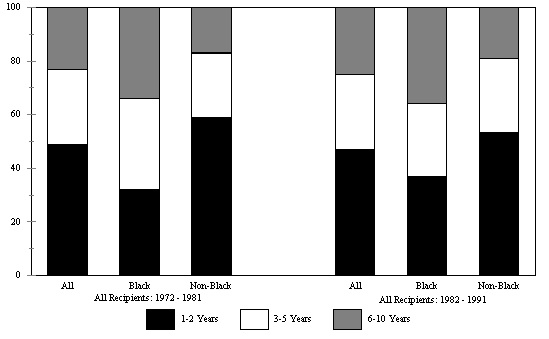
For half of all recipients, AFDC and Food Stamps did not comprise more than 50 percent of total income at any time between 1982 and 1991. This was true for 55 percent of all recipients between 1972 and 1981.
The percentages of recipients who received more than 50 percent of total income from AFDC and Food Stamps for 6 to10 years are considerably smaller for all groups than the percentages for 1 to 5 years.
As shown in Table IND 1b, of child recipients, the percentage of black children in families who did not receive more than 50 percent of their income from AFDC and Food Stamps in any year increased across the two time periods (24 to 31 percent). In comparison, the same percentages for non-black children decreased substantially across the two time periods (50 to 37 percent).
Table IND 1b. Percent of Recipients with More than 50 Percent of Income from AFDC and Food Stamps by Number of Years
| All Recipients: 1972 - 1981 | All Recipients: 1982 - 1991 | |||||
|---|---|---|---|---|---|---|
| Years | All Recipients | Black | Non-Black | All Recipients | Black | Non-Black |
| 0 Years | 55 | 44 | 62 | 50 | 43 | 54 |
| 1 - 2 Years | 22 | 22 | 22 | 23 | 21 | 25 |
| 3 - 5 Years | 14 | 19 | 11 | 15 | 17 | 14 |
| 6 - 8 Years | 5 | 9 | 3 | 9 | 12 | 6 |
| 9 - 10 Years | 4 | 7 | 2 | 4 | 7 | 2 |
| 100% | 100% | 100% | 100% | 100% | 100% | |
| Children 0 - 5 in 1972: 1972 - 1981 | Children 0 - 5 in 1982: 1982 - 1991 | |||||
|---|---|---|---|---|---|---|
| Years | All Child Recipients | Black | Non-Black | All Child Recipients | Black | Non-Black |
| 0 Years | 39 | 24 | 50 | 34 | 31 | 37 |
| 1 - 2 Years | 25 | 27 | 23 | 28 | 19 | 35 |
| 3 - 5 Years | 21 | 27 | 17 | 16 | 18 | 15 |
| 6 - 8 Years | 6 | 9 | 4 | 13 | 19 | 9 |
| 9 - 10 Years | 9 | 12 | 6 | 8 | 14 | 4 |
| 100% | 100% | 100% | 100% | 100% | 100% | |
Source: Unpublished data from the PSID, 1972 - 1991.
Figure IND 1c. Percent of Total Income from Various Sources by Poverty Status, 1992
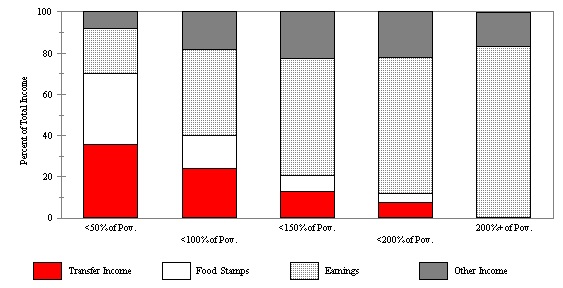
- Not surprisingly, poorer families received a larger percentage of their income from transfer programs and Food Stamps while wealthier families received a larger percentage of their income from earnings.
- Poor individuals (less than 100 percent of poverty) received 41 percent of their total family income from means-tested assistance programs (transfer income and Food Stamps). In contrast, the percentage for those who are at least 200 percent above the poverty line is much lower (less than one percent).
- Those living in deep poverty (total family income less than 50 percent of the poverty line) relied heavily on transfer income from AFDC and SSI (36 percent of total family income) as well as Food Stamps (35 percent of total family income).
- The composition of income for all poor persons (less than 100 percent of poverty) is significantly different than that for those living in deep poverty (less than 50 percent of poverty). For example, the percentage of income from earnings for all poor individuals is nearly twice the percentage for those in deep poverty. The percentage of income from transfer programs is about two-thirds and the percentage of income from Food Stamps is less than half the percentage for the very poor.
Table IND 1c. Percent of Total Income from Various Sources by Poverty Status, 1992
| <50% of Poverty | <100% of Poverty | <150% of Poverty | <200% of Poverty | 200%+ of Poverty | |
|---|---|---|---|---|---|
| All Persons | |||||
| Transfer Income | 35.5 | 23.9 | 12.7 | 7.5 | 0.2 |
| Food Stamps | 34.6 | 16.6 | 7.9 | 4.4 | 0.0 |
| Earnings | 21.8 | 41.4 | 56.9 | 65.9 | 83.2 |
| Other Income | 8.1 | 18.2 | 22.5 | 22.2 | 16.5 |
| Average Income | $6,269 | $9,694 | $12,796 | $16,113 | $54,915 |
| Racial Categories | |||||
| Non-Hispanic White | |||||
| Transfer Income | 28.0 | 17.9 | 9.0 | 4.8 | 0.2 |
| Food Stamps | 31.6 | 13.5 | 5.8 | 2.8 | 0.0 |
| Earnings | 32.9 | 46.0 | 56.6 | 65.4 | 82.4 |
| Other Income | 7.5 | 22.6 | 28.6 | 27.0 | 17.4 |
| Average Income | $4,957 | $8,731 | $12,133 | $15,935 | $55,769 |
| Non-Hispanic Black | |||||
| Transfer Income | 40.2 | 31.8 | 20.6 | 14.1 | 0.7 |
| Food Stamps | 39.8 | 22.6 | 13.0 | 8.6 | 0.1 |
| Earnings | 11.2 | 29.5 | 47.6 | 58.5 | 89.1 |
| Other Income | 8.8 | 16.1 | 18.7 | 18.8 | 10.1 |
| Average Income | $7,254 | $10,475 | $12,859 | $15,707 | $46,183 |
| Hispanic | |||||
| Transfer Income | 39.2 | 23.3 | 12.6 | 8.8 | 1.0 |
| Food Stamps | 32.8 | 14.8 | 7.8 | 5.2 | 0.1 |
| Earnings | 21.4 | 48.4 | 66.2 | 73.1 | 88.9 |
| Other Income | 6.6 | 13.5 | 13.5 | 12.8 | 10.4 |
| Average Income | $7,236 | $10,970 | $14,511 | $17,157 | $46,749 |
| Age Categories | |||||
| Children Age 0 - 5 | |||||
| Transfer Income | 39.1 | 30.0 | 17.4 | 10.5 | 0.2 |
| Food Stamps | 37.4 | 21.4 | 11.9 | 7.0 | 0.1 |
| Earnings | 17.2 | 38.7 | 59.2 | 71.9 | 91.7 |
| Other Income | 6.3 | 10.0 | 11.5 | 10.5 | 8.0 |
| Average Income | $7,298 | $10,932 | $14,149 | $17,841 | $57,627 |
| Children Age 6 - 10 | |||||
| Transfer Income | 35.5 | 27.5 | 14.5 | 8.4 | 0.2 |
| Food Stamps | 36.9 | 20.6 | 10.4 | 5.8 | 0.0 |
| Earnings | 16.4 | 37.7 | 60.0 | 72.6 | 90.7 |
| Other Income | 11.1 | 14.3 | 15.1 | 13.2 | 9.1 |
| Average Income | $8,484 | $11,684 | $15,329 | $19,196 | $60,301 |
| Children Age 11 - 15 | |||||
| Transfer Income | 38.3 | 24.1 | 12.9 | 7.8 | 0.2 |
| Food Stamps | 35.6 | 17.9 | 9.2 | 5.4 | 0.0 |
| Earnings | 15.7 | 42.4 | 61.9 | 70.7 | 91.5 |
| Other Income | 10.3 | 15.5 | 15.9 | 16.1 | 8.4 |
| Average Income | $7,647 | $11,711 | $15,499 | $19,347 | $61,133 |
| Women Age 16 - 64 | |||||
| Transfer Income | 35.9 | 24.9 | 13.6 | 8.2 | 0.2 |
| Food Stamps | 33.7 | 16.5 | 8.1 | 4.6 | 0.0 |
| Earnings | 22.6 | 42.3 | 59.0 | 68.1 | 86.7 |
| Other Income | 7.8 | 16.3 | 19.2 | 19.1 | 13.1 |
| Average Income | $5,573 | $9,148 | $12,332 | $15,573 | $55,057 |
| Men Age 16 - 64 | |||||
| Transfer Income | 24.0 | 15.3 | 8.1 | 4.7 | 0.2 |
| Food Stamps | 27.4 | 11.4 | 5.1 | 2.7 | 0.0 |
| Earnings | 46.5 | 56.1 | 66.9 | 74.9 | 88.0 |
| Other Income | 2.2 | 17.3 | 19.8 | 17.7 | 11.7 |
| Average Income | $4,006 | $8,815 | $12,679 | $16,412 | $56,796 |
| Adults Age 65 and over | |||||
| Transfer Income | 12.2 | 16.5 | 9.1 | 5.9 | 0.4 |
| Food Stamps | 3.1 | 3.8 | 1.5 | 0.8 | 0.0 |
| Earnings | 13.5 | 3.0 | 5.9 | 7.9 | 25.1 |
| Other Income | 71.2 | 76.7 | 83.4 | 85.4 | 74.5 |
| Average Income | $2,912 | $6,168 | $8,404 | $10,570 | $40,077 |
Note: Transfer income is defined as AFDC and SSI. While only affecting a small number of cases, general assistance income is included under AFDC. Other income is non-transfer, non-earnings income such as child support, alimony, pensions, survivor benefits, interest and dividends. Poverty status categories are not mutually exclusive. Source: Unpublished data from the SIPP, 1992 panel.
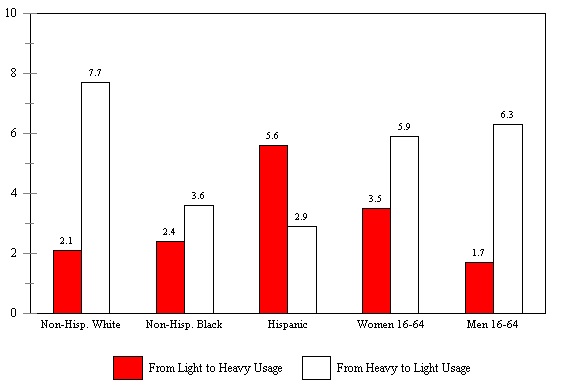
Indicator 2. Dependence Transitions
Whereas other indicators (Indicator 1a) illustrate the depth of dependence in a single year, this indicator reflects changes in the level of dependence over two years.
Figure IND 2. Changes in the Percent of Income from Means-Tested Assistance from 1992 to 1993
- Forty percent of first AFDC spells with no employment lasted a total of 1 to 3 months.
- Over two-thirds (70 percent) of first AFDC spells with no employment ended within a year.
- Sixteen percent of first AFDC spells with no employment lasted 20 or more months.
Table IND 2. Changes in the Percent of Income from Means-Tested Assistance from 1992 to 1993
| From Light to Heavy Usage | From Heavy to Light Usage | |
|---|---|---|
| All Recipients | 2.9 | 5.5 |
| Racial Categories | ||
| Non-Hispanic White | 2.1 | 7.7 |
| Non-Hispanic Black | 2.4 | 3.6 |
| Hispanic | 5.6 | 2.9 |
| Age Categories | ||
| Children Age 0 - 5 | 5.4 | 6.2 |
| Children Age 6 - 10 | 3.3 | 5.0 |
| Children Age 11 - 15 | 3.5 | 4.2 |
| Women Age 16 - 64 | 3.5 | 5.9 |
| Men Age 16 - 64 | 1.7 | 6.3 |
| Adults Age 65 and over | 0.3 | 2.2 |
Note: Light usage is some receipt up to 25 percent (but greater than 0 percent) of total income from means-tested assistance in a year and heavy usage is greater than 50 percent of total income from means-tested assistance in a year. Means-tested assistance includes AFDC, Food Stamps and SSI. While only affecting a small number of cases, general assistance income is included under AFDC.
Source: Unpublished data from the SIPP, 1992 panel.
Indicator 3. Dependence Spell Duration
In contrast to the indicator on duration of spells of means-tested assistance (Indicator 5), this indicator of dependence spell duration combines information on spells of receipt of means-tested assistance and paid employment.
Figure IND 3. Duration of First Spells that Combine AFDC Receipt and no Employment, 1983-1989
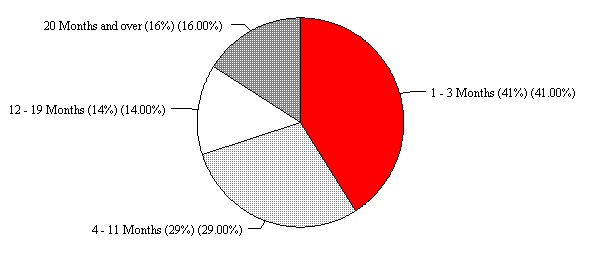
Table IND 3. Duration of First Spells that Combine AFDC Receipt and No Employment, 1983 - 1989
| Percent with Spells that Lasted | |
|---|---|
| 1 - 3 Months | 41% |
| 4 - 11 Months | 29% |
| 12 - 19 Months | 14% |
| 20 or More Months | 16% |
| 100% | |
Note: Household heads and wives only.
Source: Unpublished data from the PSID, 1984 - 1992.
Indicator 4. Receipt of Means-tested Assistance and Labor Force Attachment
This indicator illustrates one aspect of the range of dependence by combining information on receipt of means-tested assistance and hours of employment.
Figure IND 4. Percentage of Recipients in Families with Labor Force Participants, 1993
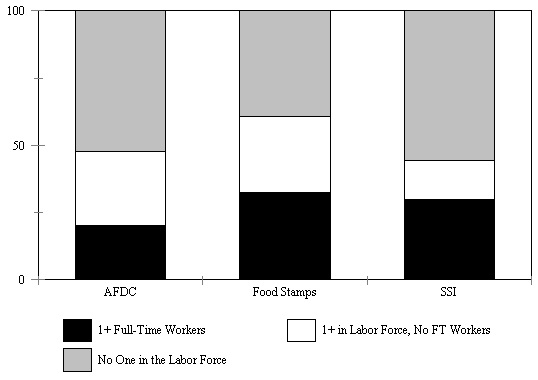
- In 1993, 44 percent of individuals who received AFDC, 56 percent of individuals who received Food Stamps, and 37 percent of individuals who received SSI were in families with at least one person in the labor force.
- A much smaller percentage of individuals who received AFDC, compared to Food Stamps and SSI, were in families with at least one full-time worker.
- As shown in Table IND 4, much smaller percentages of adults age 65 and over were in families with at least one full-time worker for all receipt categories.
- Table IND 4 shows for all recipient groups, a somewhat larger percentage of Hispanics relative to non-Hispanic blacks were in families with at least one full-time worker.
Table IND 4. Percentage of Recipients in Families with Labor Force Participants, 1993
|
No One in Labor Force |
At Least One Person in the Labor Force (no one full time) | At Least One Full-Time Person in the Labor Force | ||
|---|---|---|---|---|
| AFDC: | All Recipients | 55.6 | 25.9 | 18.5 |
| Non-Hispanic White | 49.8 | 26.9 | 23.3 | |
| Non-Hispanic Black | 56.3 | 28.0 | 15.7 | |
| Hispanic | 62.4 | 20.6 | 17.0 | |
| Children Age 0 - 5 | 56.3 | 22.6 | 21.1 | |
| Children Age 6 - 10 | 59.1 | 25.8 | 15.2 | |
| Children Age 11 - 15 | 59.7 | 28.1 | 12.1 | |
| Women Age 16 - 64 | 54.2 | 25.8 | 20.0 | |
| Men Age 16 - 64 | 41.1 | 37.9 | 20.9 | |
| Adults Age 65 and over | 69.5 | 23.8 | 6.7 | |
| FS: | All Recipients | 43.6 | 26.1 | 30.3 |
| Non-Hispanic White | 40.1 | 26.2 | 33.7 | |
| Non-Hispanic Black | 47.1 | 28.5 | 24.4 | |
| Hispanic | 44.4 | 22.9 | 32.7 | |
| Children Age 0 - 5 | 43.1 | 24.2 | 32.7 | |
| Children Age 6 - 10 | 46.3 | 26.1 | 27.6 | |
| Children Age 11 - 15 | 41.5 | 28.8 | 29.7 | |
| Women Age 16 - 64 | 43.5 | 27.1 | 29.4 | |
| Men Age 16 - 64 | 29.0 | 31.8 | 39.2 | |
| Adults Age 65 and over | 83.7 | 6.4 | 10.0 | |
| SSI: | All Recipients | 63.1 | 11.0 | 25.9 |
| Non-Hispanic White | 60.6 | 12.6 | 26.8 | |
| Non-Hispanic Black | 65.2 | 12.1 | 22.7 | |
| Hispanic | 67.5 | 6.5 | 26.0 | |
| Women Age 16 - 64 | 53.9 | 15.7 | 30.4 | |
| Men Age 16 - 64 | 57.7 | 13.4 | 28.9 | |
| Adults Age 65 and over | 76.8 | 4.4 | 18.8 | |
Note: Full-time labor force participants are defined as those who usually work 35 or more hours per week. Data on SSI recipiency for children is not available.
Source: Unpublished data from the SIPP, 1992 panel.
Indicator 5. Program Spell Duration
One critical aspect of dependence is how long individuals receive means-tested assistance. This indicator provides information on the length of individual spells.
Figure IND 5. Percent of All AFDC, Food Stamp and SSI Recipients with Various Spell Lengths, 1992 SIPP Panel
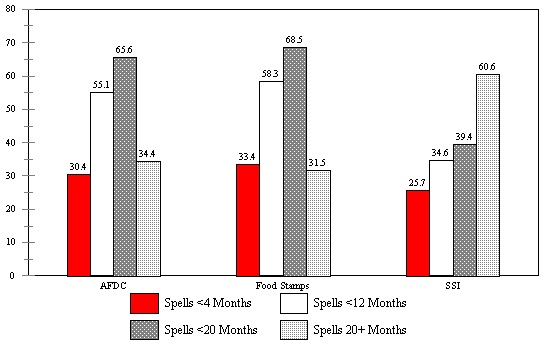
- Over one-quarter of AFDC (30 percent), Food Stamp (33 percent), and SSI spells (26 percent) were short spells lasting less than 4 months.
- Over one-half of all AFDC (55 percent) and Food Stamp spells (58 percent) lasted less than one year. In contrast, only 35 percent of SSI spells ended within one year. The percentage of SSI spells that lasted 20 or more months is almost twice the percentage of AFDC and Food Stamps spells that lasted this long. As noted earlier, compared to AFDC and Food Stamps, SSI is designed to provide longer-term assistance.
- As shown in Table IND 5, for AFDC and Food Stamp spells, non-Hispanic whites have larger percentages of short spells lasting less than 4 months and smaller percentages of longer spells lasting 20 or more months, compared to non-Hispanic blacks and Hispanics.
- Table IND 5 also shows that compared to adults age 16 to 64, children age 0 to 15 have a larger percentage of AFDC and Food Stamp spells lasting 20 or more months.
Table IND 5. Percent of All AFDC, Food Stamp and SSI Recipients with Various Spell Lengths, 1992 SIPP Panel
| Spells <4 Months | Spells <12 Months | Spells <20 Months | Spells 20+ Months | |
|---|---|---|---|---|
| AFDC | ||||
| All Recipients | 30.4 | 55.1 | 65.6 | 34.4 |
| Racial Categories | ||||
| Non-Hispanic White | 32.1 | 60.0 | 69.3 | 30.7 |
| Non-Hispanic Black | 22.5 | 45.7 | 58.2 | 41.8 |
| Hispanic | 38.6 | 56.8 | NA | NA |
| Age Categories | ||||
| Children Age 0 - 15 | 30.0 | 53.4 | 63.0 | 37.0 |
| Adults Age 16 - 64 | 31.0 | 57.6 | 69.2 | 30.8 |
| Food Stamps | ||||
| All Recipients | 33.4 | 58.3 | 68.5 | 31.5 |
| Racial Categories | ||||
| Non-Hispanic White | 36.7 | 64.2 | 73.6 | 26.4 |
| Non-Hispanic Black | 28.0 | 47.8 | 59.7 | 40.3 |
| Hispanic | 31.6 | 54.3 | 65.5 | 34.6 |
| Age Categories | ||||
| Children Age 0 - 15 | 29.6 | 55.1 | 66.0 | 34.0 |
| Adults Age 16 - 64 | 36.4 | 61.7 | 71.6 | 28.4 |
| Adults Age 65 and over | 21.4 | 31.4 | NA | NA |
| SSI | ||||
| All Recipients | 25.7 | 34.6 | 39.4 | 60.6 |
| Racial Categories | ||||
| Non-Hispanic White | 27.7 | 38.4 | NA | NA |
| Non-Hispanic Black | 19.4 | 23.0 | NA | NA |
| Hispanic | 20.4 | NA | NA | NA |
| Age Categories | ||||
| Adults Age 16 - 64 | 26.0 | 35.0 | 40.6 | 59.4 |
| Adults Age 65 and over | 25.6 | 32.9 | NA | NA |
Note: Spell length categories are not mutually exclusive. Spells separated by only 1 month are not considered separate spells. Due to the length of the observation period, actual spell lengths for spells that lasted more than 20 months cannot be observed. Data on SSI recipiency for children is not available.
Source: Unpublished data from the SIPP, 1992 Panel.
Indicator 6. Long-term Receipt
Lifetime welfare receipt often occurs in more than one episode. Indicators that measure the duration of receipt over a lifetime further reflect the depth of dependence.
Figure IND 6. Percentage of AFDC Recipients with Long-Term Receipt
- In both nine-year time periods, almost half of all recipients received AFDC in only one or two years.
- Compared to non-black recipients, smaller percentages of black recipients experienced AFDC receipt of 1 to 2 years while larger percentages experienced longer-term AFDC receipt of 6 to 10 years in both nine-year time periods.
- Table IND 6 shows that child recipients have smaller percentages of short-term and larger percentages of long-term receipt in both time periods relative to the percentages for all recipients.
Table IND 6. Percentage of AFDC Recipients with Long-Term Receipt
| Years | All Recipients: 1972 - 1981 | All Recipients: 1982 - 1991 | ||||
|---|---|---|---|---|---|---|
| All Recipients | Black | Non-Black | All Recipients | Black | Non-Black | |
| 1 - 2 Years | 49 | 32 | 59 | 47 | 37 | 53 |
| 3 - 5 Years | 28 | 34 | 25 | 28 | 27 | 28 |
| 6 - 8 Years | 13 | 19 | 9 | 15 | 19 | 12 |
| 9 - 10 Years | 11 | 15 | 8 | 11 | 17 | 6 |
| 100% | 100% | 100% | 100% | 100% | 100% | |
| Years | Children 0 - 5 in 1972: 1972-1981 | Children 0 - 5 in 1982: 1982-1991 | ||||
|---|---|---|---|---|---|---|
| All Child Recipients | Black Children | Non-Black Children | All Child Recipients | Black Children | Non-Black Children | |
| 1 - 2 Years | 37 | 24 | 46 | 34 | 28 | 39 |
| 3 - 5 Years | 29 | 31 | 27 | 29 | 28 | 30 |
| 6 - 8 Years | 15 | 23 | 10 | 17 | 16 | 19 |
| 9 - 10 Years | 19 | 23 | 17 | 20 | 29 | 13 |
| 100% | 100% | 100% | 100% | 100% | 100% | |
Source: Unpublished data from the PSID, 1972 - 1991.
Indicator 7. Multiple Program Receipt
Data on multiple program receipt illustrates the nature of means-tested assistance "packages" and one aspect of the depth of dependence.
Figure IND 7. Percent of the Total Population Receiving AFDC and Food Stamps
- The percentage of the total population that received both AFDC and Food Stamps increased from 3.5 percent in 1990 to 4.2 percent in 1993.
- Much smaller percentages of non-Hispanic whites received AFDC and Food Stamps in all four years relative to non-Hispanic blacks and Hispanics.
- As shown in Table IND 7, higher percentages of children under age 11, relative to those age 11 to 15, received both AFDC and Food Stamps. Percentages are especially high for children under age 6.
- Table IND 7 shows higher percentages of women relative to men, received income from multiple transfer programs, especially the combination of AFDC receipt and Food Stamps.
Table IND 7. Percent of the Total Population Receiving Assistance from Multiple Programs
| AFDC and SSI | Food Stamps and AFDC | SSI and Food Stamps | AFDC, SSI and Food Stamps | |||||||||||||
|---|---|---|---|---|---|---|---|---|---|---|---|---|---|---|---|---|
| 1990 | 1991 | 1992 | 1993 | 1990 | 1991 | 1992 | 1993 | 1990 | 1991 | 1992 | 1993 | 1990 | 1991 | 1992 | 1993 | |
| All Persons | 0.1 | 0.1 | 0.1 | 0.1 | 3.5 | 3.7 | 4.1 | 4.2 | 0.6 | 0.6 | 0.7 | 0.8 | 0.1 | 0.1 | 0.1 | 0.1 |
| Racial Categories | ||||||||||||||||
| Non-Hispanic White | 0.0 | 0.0 | 0.1 | 0.1 | 1.5 | 1.8 | 1.9 | 1.9 | 0.4 | 0.4 | 0.5 | 0.5 | 0.0 | 0.0 | 0.1 | 0.1 |
| Non-Hispanic Black | 0.3 | 0.4 | 0.5 | 0.5 | 12.6 | 12.6 | 14.1 | 14.5 | 1.7 | 1.9 | 1.9 | 2.0 | 0.2 | 0.3 | 0.4 | 0.5 |
| Hispanic | 0.1 | 0.1 | 0.2 | 0.2 | 7.3 | 8.2 | 8.7 | 9.3 | 1.0 | 1.1 | 1.1 | 1.4 | 0.1 | 0.1 | 0.1 | 0.2 |
| Age Categories | ||||||||||||||||
| Children Age 0 - 5 | 0.0 | 0.0 | 0.0 | 0.0 | 10.8 | 11.7 | 13.0 | 13.1 | 0.0 | 0.0 | 0.0 | 0.0 | 0.0 | 0.0 | 0.0 | 0.0 |
| Children Age 6 - 10 | 0.0 | 0.0 | 0.0 | 0.0 | 8.8 | 9.5 | 9.6 | 10.0 | 0.0 | 0.0 | 0.0 | 0.0 | 0.0 | 0.0 | 0.0 | 0.0 |
| Children Age 11 - 15 | 0.0 | 0.0 | 0.0 | 0.0 | 6.2 | 6.7 | 7.4 | 7.7 | 0.0 | 0.0 | 0.0 | 0.0 | 0.0 | 0.0 | 0.0 | 0.0 |
| Women Age 16 - 64 | 0.2 | 0.2 | 0.3 | 0.4 | 3.6 | 3.9 | 4.1 | 4.3 | 0.7 | 0.7 | 1.0 | 1.1 | 0.2 | 0.2 | 0.2 | 0.2 |
| Men Age 16 - 64 | 0.0 | 0.0 | 0.1 | 0.1 | 0.6 | 0.6 | 0.8 | 0.8 | 0.3 | 0.4 | 0.4 | 0.4 | 0.0 | 0.0 | 0.0 | 0.0 |
Source: Unpublished data from the SIPP, 1990 and 1992 panels.
Indicator 8. Events Associated with the Beginning and Ending of Receipt of Means-tested Assistance
The circumstances which are associated with beginnings or endings of receipt of assistance. reveal an important aspect of dependence that provides critical guidance for policy makers.
Table IND 8a. Percent of First AFDC Episode Beginnings Associated with Specific Events
| Spell Began 1973 - 1979 |
Spell Began 1980 - 1985 |
Spell Began 1986 - 1991 |
|
|---|---|---|---|
| First birth to an unmarried, non-cohabiting mother | 27.9 | 20.9 | 22.2 |
| First birth to a married and/or cohabitating mother | 13.3 | 17.4 | 11.3 |
| Second (or higher order) birth | 19.9 | 18.2 | 15.2 |
| Divorce/separation | 19.7 | 28.1 | 17.3 |
| Mother's work hours decreased by more than 500 hours | 26.3 | 18.8 | 26.2 |
| Other adults' work hours decreased by more than 500 hours, but no change in family structure | 34.8 | 27.9 | 21.6 |
| Other adults' work hours decreased by more than 500 hours, and a change in family structure | 4.7 | 7.9 | 11.4 |
| Householder acquired work limitation | 18.1 | 15.6 | 23.5 |
| Other transfer income dropped by $1,000 or more (in 1996$) | 4.5 | 6.5 | 4.1 |
| Changed state of residence | 4.5 | 10.6 | 5.4 |
Note: Events are defined to be neither mutually exclusive nor exhaustive. Work limitation is defined as a self-reported physical or nervous condition that limits the type of work or the amount of work the respondent can do.
Source: Unpublished data from the PSID, 1968 - 1992.
- Nearly one-quarter (24 percent) of first AFDC spells that began between 1986 and 1991 were associated with the householder acquiring a work limitation. This is higher than the percentages for earlier spells in 1973 - 1979 (18 percent) and in 1980 - 1985 (16 percent).
- The percentage of first AFDC spells associated with a first birth to an unmarried, non-cohabiting mother is similar for spells beginning in 1980 - 1985 (21 percent) and for spells beginning in 1986-1991 (22 percent). The corresponding percentage for first spells beginning in 1973 - 1979 is much higher (28 percent).
- The percentage of first AFDC spell beginnings associated with a 500 hour or more decrease in the work hours of one or more other adults (not the mother) decreased between 1973 - 1979 (35 percent) and 1986 - 1991 (22 percent).
Table IND 8b. Percent of First AFDC Episode Endings Associated with Specific Events
| Spell Ended 1973 - 1979 |
Spell Ended 1980 - 1985 |
Spell Ended 1986 - 1991 |
|
|---|---|---|---|
| Mother married or acquired cohabitor | 16.1 | 17.1 | 21.7 |
| Children under 18 no longer present | 4.4 | 4.1 | 4.8 |
| Mother's work hours increased by more than 500 hours | 15.4 | 25.0 | 27.1 |
| Other adults' work hours increased by more than 500 hours, but no change in family structure | 21.8 | 16.8 | 16.7 |
| Other adults' work hours increased by more than 500 hours, and a change in family structure | 6.5 | 10.3 | 5.8 |
| Householder no longer reports work limitation | 13.0 | 19.2 | 15.8 |
| Other transfer income increased by $1,000 or more (in 1996$) | 5.0 | 5.5 | 5.8 |
| Changed state of residence | 5.9 | 11.0 | 5.9 |
Note: Events are defined to be neither mutually exclusive nor exhaustive. Work limitation is defined as a self-reported physical or nervous condition that limits the type of work or the amount of work the respondent can do.
Source: Unpublished data from the PSID, 1968 - 1992.
- In the 1973 - 1979 period, a greater percentage of spell endings were associated with an increase in work hours for other adults (22 percent) as compared to mothers (15 percent). In the more recent time period (1986 - 1991) a greater percentage of spell endings were associated with an increase in mother's work hours (27 percent) compared to other adults (17 percent).
- For spells beginning in the 1986 - 1991 period, the percentage of spell beginnings associated with acquiring a work limitation (24 percent, as shown in Table IND 8a) is much higher than the percentage of spell endings associated with no longer reporting a work limitation (16 percent, see above).
Indicator 9. Percent of the Population Receiving Means-tested Assistance
he rate of receipt reflects an important aspect of dependence by measuring the extent to which various population subgroups rely on the major means-tested programs.
Figure IND 9a. AFDC Recipients as a Percent of the Population
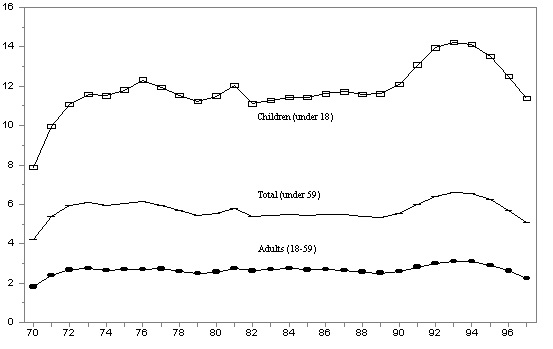
- In all years between 1970 and 1996, the percentage of all children who received AFDC is much larger than that for adults age 18 to 59.
- Participation for children under age 18 increased substantially between 1970 and 1976. While remaining relatively stable through most of the 1980s, the trend again increased dramatically from 1990 to 1994 before declining to its current level.
- Table IND 9a shows that between 1994 and 1996 the percentage of all children who received AFDC decreased almost one and a half percentage points (from 14.1 percent to 12.5 percent).
Table IND 9a. AFDC Recipients as a Percent of the Population, Selected Years
| Ages | 1970 | 1974 | 1978 | 1982 | 1986 | 1990 | 1992 | 1994 | 1995 | 1996 |
|---|---|---|---|---|---|---|---|---|---|---|
| All (under 59) | 4.2 | 6.0 | 5.7 | 5.4 | 5.5 | 5.5 | 6.4 | 6.6 | 6.2 | 5.7 |
| Adults (18 to 59) | 1.8 | 2.7 | 2.6 | 2.6 | 2.7 | 2.6 | 3.0 | 3.1 | 2.9 | 2.6 |
| Children (under 18) | 7.9 | 11.5 | 11.5 | 11.1 | 11.6 | 12.1 | 13.9 | 14.1 | 13.5 | 12.5 |
Note: Only selected years of data presented in Figure IND 9a are included in the table.
Source: U.S. Department of Health and Human Services, Administration for Children and Families, Office of Planning, Research, and Evaluation, Characteristics and Financial Circumstances of AFDC Recipients: Fiscal Year 1995 and earlier years, (Current data available online at http://www.acf.dhhs.gov/programs/ofa/content.htm).
Figure IND 9b. Food Stamp Recipients as a Percent of Population
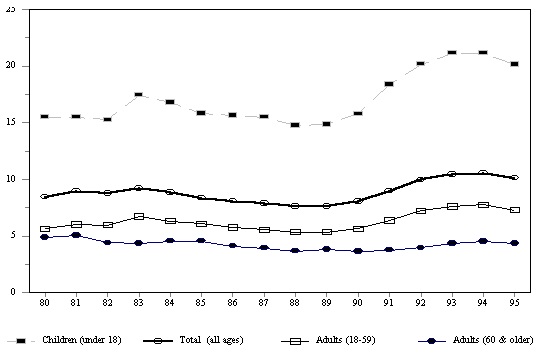
- In all years between 1980 and 1995, the percentage of all children who received Food Stamps is much larger than that for all adults.
- Similar trends existed for each age group: children under 18, adults age 18 to 59 and adults 60 and older. The percentages for each group declined between 1984 and 1988, each peaked in 1994 and declined thereafter.
Table IND 9b. Food Stamp Recipients as a Percent of the Population, Selected Years
| Ages | 1980 | 1982 | 1984 | 1986 | 1988 | 1990 | 1992 | 1994 | 1995 |
|---|---|---|---|---|---|---|---|---|---|
| Total (all ages) | 8.4 | 8.8 | 8.8 | 8.1 | 7.6 | 8.0 | 9.9 | 10.5 | 10.1 |
| Adults (60 and over) | 4.9 | 4.4 | 4.5 | 4.1 | 3.7 | 3.6 | 4.0 | 4.5 | 4.4 |
| Adults (18 to 59) | 5.6 | 6.0 | 6.3 | 5.7 | 5.3 | 5.6 | 7.2 | 7.7 | 7.3 |
| Children (under 18) | 15.5 | 15.3 | 16.8 | 15.7 | 14.8 | 15.8 | 20.2 | 21.2 | 20.2 |
Note: Only selected years of data presented in Figure IND 9b are included in the table.
Source: U.S. Department of Agriculture, Food and Consumer Service, Office of Analysis and Evaluation, Characteristics of Food Stamp Households: Fiscal Year 1995 and earlier years.
Figure IND 9c. SSI Recipients as a Percent of the Population
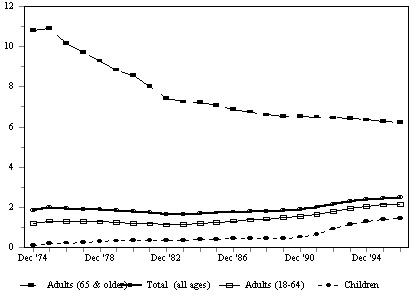
- In all years between 1974 and 1996, the percentage of adults 65 and older who received SSI is much larger than that for all other age groups.
- Trends are similar for all persons under age 64 generally increasing between 1974 and 1996. For those 65 and older, the trend moves in the opposite direction decreasing dramatically from nearly 11 percent in 1974 to 6 percent in 1996.
Table IND 9c. SSI Recipients as a Percent of the Population, Selected Years
| Ages | 1974 | 1978 | 1982 | 1986 | 1990 | 1992 | 1993 | 1994 | 1995 | 1996 |
|---|---|---|---|---|---|---|---|---|---|---|
| Total (all ages) | 1.9 | 1.9 | 1.7 | 1.8 | 1.9 | 2.2 | 2.3 | 2.4 | 2.5 | 2.5 |
| Adults (65 and over) | 10.8 | 9.3 | 7.4 | 6.9 | 6.5 | 6.5 | 6.4 | 6.4 | 6.3 | 6.2 |
| Adults (18 to 64) | 1.2 | 1.3 | 1.1 | 1.3 | 1.6 | 1.8 | 2.0 | 2.1 | 2.1 | 2.2 |
| Children | 0.1 | 0.3 | 0.4 | 0.4 | 0.5 | 0.9 | 1.1 | 1.3 | 1.4 | 1.5 |
Note: Children includes some recipients 18 and older who are students. Only selected years of data presented in Figure IND 9c are included in the table.
Source: Social Security Administration, Office of Research, Evaluation, and Statistics, Social Security Bulletin, Annual Statistical Supplement, various years,(Data available online at http://www.ssa.gov/statistics/ores_home.html).
Indicator 10. Rates of Participation in Means-tested Assistance Programs
Not all eligible households participate in means-tested programs. This indicator reflects "take- up rates" - the number of families that actually participate in the program as a percent of those who are eligible.
Figure IND 10a. AFDC Caseload as a Percent of Eligible Families
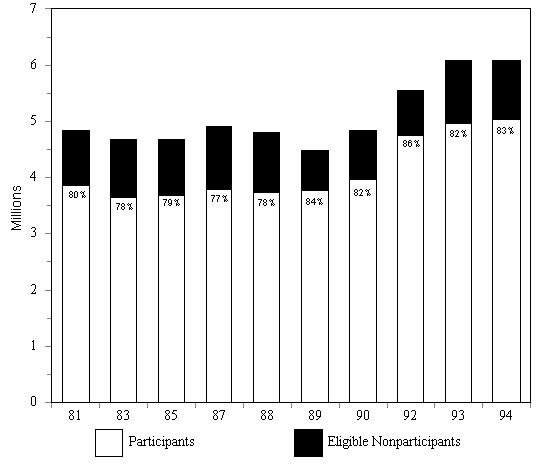
- The percentage of all eligible families who participated in AFDC declined 3 percentage points (from 80 percent to 77 percent) between 1981 and 1987. Between 1987 and 1989, the percentage of eligible families participating in AFDC increased substantially, from 77 percent to 84 percent. After reaching a peak of 86 percent in 1992, the percentage declined in 1993 and remained stable in 1994.
Table IND 10a. AFDC Caseload as a Percent of Eligible Families
| 1981 | 1983 | 1985 | 1987 | 1988 | 1989 | 1990 | 1992 | 1993 | 1994 | |
|---|---|---|---|---|---|---|---|---|---|---|
| Average Monthly
Eligibles |
3,097 | 2,848 | 2,917 | 2,914 | 2,923 | 3,168 | 3,259 | 4,101 | 4,085 | 4,188 |
| Average Caseload | 3,871 | 3,651 | 3,692 | 3,784 | 3,748 | 3,771 | 3,974 | 4,768 | 4,981 | 5,046 |
| Participation Rate | 80 | 78 | 79 | 77 | 78 | 84 | 82 | 86 | 82 | 83 |
Source: Number of eligibles estimated by the Urban Institute using TRIM model simulations. Caseload based on data from U.S. Department of Health and Human Services, Administration for Children and Families.
Figure IND 10b. Food Stamp Households as a Percent of Eligible Households
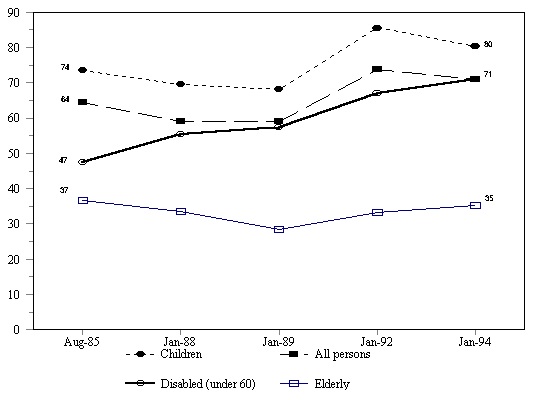
- In all years, larger percentages of children in eligible households received Food Stamps compared to other age groups, and smaller percentages of the elderly in eligible households received Food Stamps compared to other adults and children.
- For disabled persons under age 60, the percentage in eligible households who received Food Stamps increased substantially between 1985 and 1994, from 47 percent in 1985 to 71 percent in 1994.
Table IND 10b. Food Stamp Households as a Percent of Eligible Households
|
Persons |
Households |
Elderly |
Children |
Disabled Under 60 |
Adults 18 - 59 |
|
|---|---|---|---|---|---|---|
| August 1985 | 64 | 59 | 37 | 74 | 47 | 65 |
| January 1988 | 59 | 56 | 34 | 70 | 55 | 66 |
| January 1989 | 59 | 56 | 29 | 68 | 57 | 60 |
| January 1992 | 74 | 69 | 33 | 86 | 67 | 77 |
| January 1994 | 71 | 69 | 35 | 80 | 71 | 73 |
Source: U.S. Department of Agriculture, Food and Consumer Service, Trends in Food Stamp Program Participation Rates, various years.
Figure IND 10c. SSI Adult Recipients of Eligible Adults
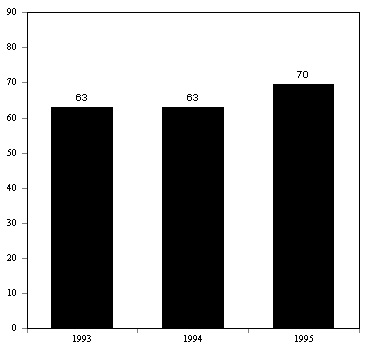
- For all adults, the percentage of those eligible who received SSI remained constant between 1993 and 1994 (63 percent) and increased substantially in 1995 (from 63 percent to 70 percent).
- For all adults in 1995, a larger percentage of eligible disabled adults in one-person units participated in the SSI program (74 percent) compared to both eligible aged adults in one-person units (65 percent) and adults in married-couple units (52 percent).
Table IND 10c. SSI Adult Recipients by Type as a Percent of Eligible Group
| 1993 | 1994 | 1995 | |
|---|---|---|---|
| All Adults | 63 | 63 | 70 |
| One-Person Units - Aged | NA | NA | 65 |
| One-Person Units - Disabled | NA | NA | 74 |
| Married-Couple Units | NA | NA | 52 |
Note: The figure for married-couple units is based on very small sample sizes-married couple units were only about 5 percent of the adult units in the average month of 1995.
Source: Number of eligibles estimated by the Urban Institute using TRIM model simulations.
Indicator 11. Means-tested Assistance Program Transition Rates
This indicator shows how many people have moved onto means-tested assistance programs and how many recipients have moved off means-tested assistance programs over time.
Figure IND 11. Percent of Non-Recipients Moving onto Assistance and Percent of Recipients Moving off Assistance from 1992 to 1993
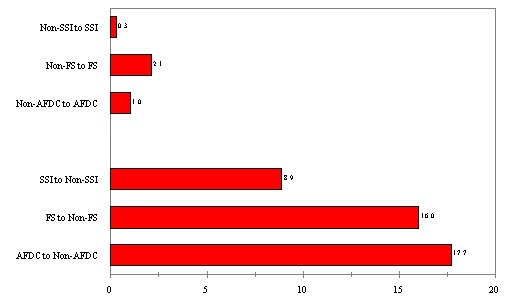
- Figure IND 11 shows the percentage of non-recipients that moved onto assistance. It also shows the percentage of recipients that transferred off assistance. Because there are many more non-recipients than recipients, it is not surprising that transition rates off assistance are significantly higher than those moving onto assistance.
- More AFDC recipients moved off the program than recipients of Food Stamps or SSI. One would expect SSI to have a lower transition rate than the other programs because the program is designed in part to provide longer-term assistance to the elderly.
- More non-recipients moved onto Food Stamps than any other program.
Table IND 11. Percent of Non-Recipients Moving onto Means-Tested Assistance and Percent of Recipients Moving off Means-Tested Assistance from 1992 to 1993
| Percentage of Recipients Moving off Assistance | Percent of the Total Population Moving onto Assistance | |||||
|---|---|---|---|---|---|---|
| AFDC to Non-AFDC | FS to Non-FS | SSI to Non-SSI | Non-AFDC to AFDC | Non-FS toFS | Non-SSI toSSI | |
| All Persons | 17.7 | 16.0 | 8.9 | 1.0 | 2.1 | 0.3 |
| Racial Categories | ||||||
| Non-Hispanic White | 21.8 | 21.3 | 11.0 | 0.6 | 1.5 | 0.3 |
| Non-Hispanic Black | 13.0 | 10.2 | 6.4 | 3.0 | 4.9 | 0.6 |
| Hispanic | 19.8 | 13.9 | 4.7 | 2.7 | 5.3 | 0.6 |
| Age Categories | ||||||
| Children Age 0 - 5 | 14.9 | 11.2 | 0.0 | 2.8 | 4.3 | 0.0 |
| Children Age 6 - 10 | 14.6 | 13.3 | 0.0 | 1.8 | 3.1 | 0.0 |
| Children Age 11 - 15 | 18.0 | 15.4 | 0.0 | 1.8 | 3.2 | 0.1 |
| Women Age 16 - 64 | 17.4 | 17.3 | 11.6 | 1.3 | 2.2 | 0.6 |
| Men Age 16 - 64 | 33.6 | 24.0 | 10.0 | 0.3 | 1.5 | 0.2 |
| Adults Age 65 and over | 17.8 | 6.4 | 5.0 | 0.0 | 0.6 | 0.4 |
Note: Receipt is measured by at least one month of receipt in a given year and non-receipt is measured as no months of receipt in a given year.
Source: Unpublished data from the SIPP, 1992 panel.
- As shown in Table IND 11, a slightly larger percentage of female recipients than male recipients moved off SSI. In contrast to the SSI program, much smaller percentages of female recipients than male recipients moved off the AFDC program and the Food Stamp program.
- Table IND 11 shows that a larger percentage of non-Hispanic white recipients moved off assistance than other racial groups receiving assistance. Similarly, non-Hispanic white non-recipients were less likely to move onto assistance than non-recipients of other racial groups.
Indicator 12. Intergenerational Dependence
Another key aspect of dependence is the extent to which parental receipt of means-tested assistance is associated with receipt by their children when the children become adults.
Figure IND 12a. Percent of Females who did NOT Receive AFDC or Food Stamps Between the Ages of 14 and 16 but Received Benefits Between the Ages of 25 and 27
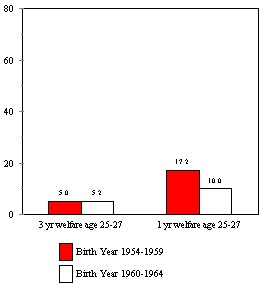
Figure IND 12b. Percent of Females Received AFDC or Food Stamps ALL THREE YEARS Between the Ages of 14 and 16 who also Received Benefits Between the Ages of 25 and 27
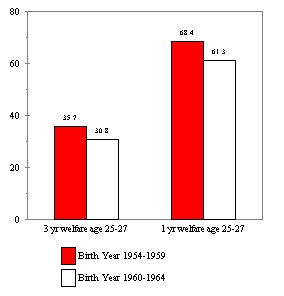
- These figures show the percent of women who did or did not receive AFDC or Food Stamps (any amount for any month within each year) as children age 14 to 16 and who later received AFDC or Food Stamps as adults age 25 to 27 for one or three years.
- Children who received AFDC or Food Stamps were more likely to receive as an adult than children who did not receive AFDC or Food Stamps. Children who received AFDC or Food Stamps also were more likely to receive AFDC or Food Stamps for one rather than three years as an adult.
- A smaller percentage of children born between 1960 - 1964 who received AFDC or Food Stamps between the ages of 14 and 16, received AFDC or Food Stamps as adults compared to children born between 1954 - 1959.
- Table IND 12 shows that smaller percentages of male than female children who received AFDC or Food Stamps between the ages of 14 and 16 also received AFDC or Food Stamps as adults for both birth-year cohorts.
Table IND 12. Association of Benefit Receipt Between Parents and their Sons and Daughters
| Birth Year: Females | Birth Year: Males | |||
|---|---|---|---|---|
| 1954 - 1959 | 1960 - 1964 | 1954 - 1959 | 1960 - 1964 | |
| Percent who did not receive AFDC or Food Stamps between the ages of 14 and 16 who received AFDC or Food Stamps in all 3 years from age 25 to 27. | 5.0 | 5.2 | 2.5 | 2.3 |
| Percent who did notreceive AFDC or Food Stampsbetween the ages of 14 and 16 who received AFDC or Food Stamps in at least 1 year from age 25 to 27. | 17.2 | 10.0 | 12.2 | 8.5 |
| Percent who received AFDC or Food Stamps for all 3 years between the ages of 14 and 16who also received AFDC or Food Stamps in all 3 years from age 25 to 27. | 35.7 | 30.8 | 13.8 | 13.5 |
| Percent who received AFDC or Food Stamps for all 3 years between the ages of 14 and 16 who received AFDC or Food Stamps in at least 1 year from age 25 to 27. | 68.4 | 61.3 | 40.8 | 31.8 |
Note: Receipt of AFDC or Food Stamps in a year refers to any amount at any point during the year.
Source: Unpublished data from the PSID, 1968 - 1992.
Chapter III. Predictors and Risk Factors Associated with Welfare Receipt
The Welfare Indicators Act challenges the Department of Health and Human Services, and indirectly the Advisory Board on Welfare Indicators, to identify and set forth not only indicators of the rate and degree welfare dependence and duration of welfare receipt, but also predictors of welfare receipt and causes of welfare receipt. The state of welfare research is such that definitive causes of welfare dependence have not been clearly established. However, research has identified a number of risk factors associated with welfare utilization. For purposes of this report, the terms predictors and risk factors are used somewhat interchangeably, although the differences between them are acknowledged.
Where the Advisory Board recommended narrowing the focus of dependence indicators, it recommended an expansive view toward predictors and risk factors. The range of possible predictors is extremely wide, and until they are measured and analyzed over time as the PRWORA changes are implemented, their value will not be known. Some of the "predictors" included in this chapter may turn out to be simply correlates of welfare receipt, some may have a causal relationship, some may be consequences, and some may have predictive value.
For purposes of this report, the predictors/risk factors included in this chapter are loosely grouped into three categories. The first group includes measures associated with economic security. This group encompasses poverty measures (including poverty trends, child poverty trends, and pre- and post-cash transfers poverty rates for children and all individuals), receipt of child support, incidence of food insecurity, health care coverage, and housing and adult incarceration measures. For ease of presentation, the tables and figures illustrating measures of economic security are labeled with the prefix ECON throughout this chapter.
The second grouping (labeled with the WORK prefix) includes factors related to employment and barriers to employment. Data on labor force attachment and labor force attachment and earnings for low-skilled workers are included, as are data on barriers to work. The latter category includes incidence of adult disabilities and children with chronic health conditions, adult substance abuse, levels of educational attainment and school drop-out rates, and child care costs.
The final group addresses behavioral issues primarily affecting teenagers. This category includes out-of-wedlock childbearing data, onset of sexual activity, teen substance abuse and arrest data, and information on teens who are neither in school nor working. The tables and figures in this subsection are labeled with the TEEN prefix.
Several of the measures associated with child well-being that were included in last year's Interim Report have been deleted from this annual report. In all cases, those measures are either included in other Departmental publications (principally Trends In The Well-Being of America's Children and Youth) or they were determined not to be highly correlated with welfare receipt or dependence. A table listing the indicators and predictors contained in the Interim Report and their disposition in this report is included as Appendix C.
As noted above, the predictors/risk factors included in this chapter do not represent an exhaustive list of measures. They are, in fact, a sampling of available data that address in some way a family's circumstances on the deprivation/well-being scale. These are necessary to the dependence discussion since changes in the dependence measures can result from the elimination of assistance due either to increased work activity (which should improve the material circumstances of a family) or to time limits or sanctions (which may reduce the family's material circumstances).
Economic Security Risk Factor 1. Poverty Rates
Poverty rates illustrate the economic condition of families and, as such, a key risk factor of dependence.
Figure ECON 1. Percent in Poverty
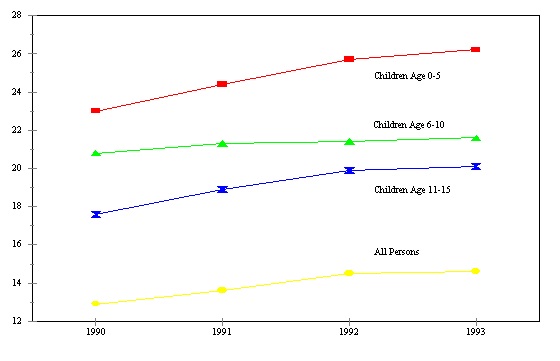
- The percentage of people living below the poverty line increased between 1990 and 1992 but remained stable from 1992 to 1993.
- The percentages of children living in poverty increased for all age groups between 1990 and 1993, most notably for children age 0 to 5. In contrast, Table ECON 1 shows that the percentage of adults age 65 and over in poverty decreased over the same time period.
- Table ECON 1 also shows that in 1993 approximately 32 percent of non-Hispanic blacks lived below the poverty level. By comparison, approximately 29 percent of Hispanics lived below the poverty line in 1993 and 10 percent of non-Hispanic whites were poor in both years.
Table ECON 1. Percent in Poverty
| 1990 | 1991 | 1992 | 1993 | |
|---|---|---|---|---|
| All Persons | 12.9 | 13.6 | 14.5 | 14.6 |
| Racial Categories | ||||
| Non-Hispanic White | 8.8 | 9.2 | 9.9 | 9.9 |
| Non-Hispanic Black | 30.1 | 30.6 | 30.8 | 31.6 |
| Hispanic | 26.1 | 28.3 | 29.5 | 29.0 |
| Age Categories | ||||
| Children Age 0 - 5 | 23.0 | 24.4 | 25.7 | 26.2 |
| Children Age 6 - 10 | 20.8 | 21.3 | 21.4 | 21.6 |
| Children Age 11 - 15 | 17.6 | 18.9 | 19.9 | 20.1 |
| Women Age 16 - 64 | 12.7 | 13.2 | 14.3 | 14.2 |
| Men Age 16 - 64 | 8.5 | 9.4 | 10.4 | 10.3 |
| Adults Age 65 and over | 9.7 | 10.2 | 9.4 | 9.2 |
Source: Unpublished data from the SIPP, 1990 and 1992 panels.
Economic Security Risk Factor 2. Poverty Transition Rates
Data on poverty transitions show the extent of new entries into and exits from poverty.
Figure ECON 2. Percent of Individuals Moving into and out of Poverty Between 1992 and 1993
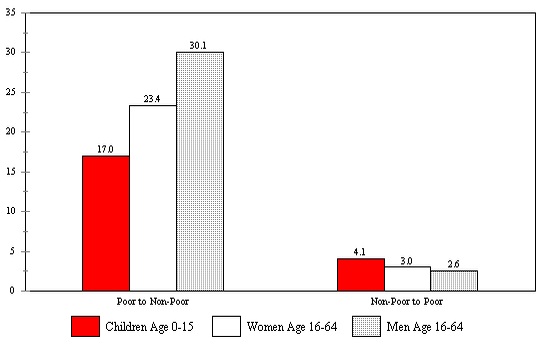
- While Table ECON 1 shows the percentage of people living in poverty, this measure shows both the percentage of non-poor people that moved into poverty and the percentage of poor people that moved out of poverty during the given time period.
- In 1993, 30 percent of men age 16 to 64 moved out of poverty, compared to only 23 percent of women age 16 to 64 and 17 percent of children under 15.
- Four percent of children who were not poor in 1992 moved into poverty in 1993, while 17 percent of children who were poor in 1992 moved out of poverty in 1993.
ECON 2. Percent of Individuals Moving into and out of Poverty Between 1992 and 1993
| Poor to Non-Poor |
Non-Poor to Poor |
|
|---|---|---|
| All Persons | 21.6 | 3.0 |
| Racial Categories | ||
| Non-Hispanic White | 27.5 | 2.0 |
| Non-Hispanic Black | 13.9 | 6.7 |
| Hispanic | 18.4 | 8.6 |
| Age Categories | ||
| Children Age 0 - 5 | 15.3 | 5.2 |
| Children Age 6 - 10 | 16.3 | 3.2 |
| Children Age 11 - 15 | 20.2 | 3.9 |
| Children Age 0 - 15 | 17.0 | 4.1 |
| Women Age 16 - 64 | 23.4 | 3.0 |
| Men Age 16 - 64 | 30.1 | 2.6 |
| Adults Age 65 and over | 15.0 | 2.2 |
Source: Unpublished data from the SIPP, 1992 panel.
- Table ECON 2 shows that adults age 65 or older were less likely to exit poverty than either women or men age 16 to 64. Fifteen percent of the elderly poor population exited poverty between 1992 and 1993, compared to 23 percent of non-elderly adult women and 30 percent of non-elderly adult men.
- As shown in Table ECON 2, compared to other racial groups, non-Hispanic blacks had the lowest percentage of people moving out of poverty. Fourteen percent of poor non-Hispanic blacks moved out of poverty from 1992 to 1993 compared to 28 percent of poor non-Hispanic whites and 18 percent of poor Hispanics.
- Higher percentages of Hispanics entered poverty in 1993 (nearly 9 percent), compared to non-Hispanic whites (2 percent) and non-Hispanic blacks (7 percent).
Economic Security Risk Factor 3. Poverty Spells
The length of a poverty episode illustrates one aspect of the risk of dependence.
Figure ECON 3. Percent of Individuals in Poverty by Spell Length, 1992 SIPP Panel
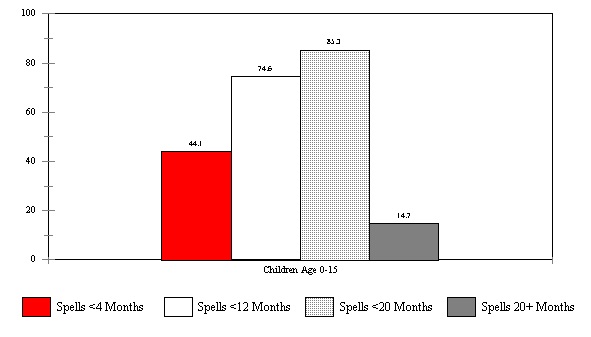
- Forty-four percent of children age 0 to 15 experienced short poverty spells of less than 4 months and three-quarters of children age 0 to 15 experienced poverty spells of less than one year.
- As shown in Table ECON 3, compared to non-Hispanic whites, non-Hispanic blacks and Hispanics have larger percentages of poverty spells that lasted 20 or more months (19 percent) and lower percentages of poverty spells that lasted less than 4 months (around 40 percent).
- Table ECON 3 shows that adults age 65 and over had longer poverty spells than did other age groups; 35 percent had poverty spells that lasted 20 or more months.
- As shown in Table ECON 3, a smaller percentage of men than women experienced poverty spells lasting 20 or more months.
Table ECON 3. Percent of Individuals in Poverty by Spell Length, 1992 SIPP Panel
| Spells <4 Months |
Spells <12 Months |
Spells <20 Months |
Spells 20 + Months |
|
|---|---|---|---|---|
| All Persons | 45.5 | 75.5 | 84.5 | 15.5 |
| Racial Categories | ||||
| Non-Hispanic White | 48.1 | 77.4 | 86.0 | 14.0 |
| Non-Hispanic Black | 39.7 | 68.8 | 81.0 | 19.0 |
| Hispanic | 41.9 | 75.3 | 80.7 | 19.3 |
| Age Categories | ||||
| Children Age 0 - 15 | 44.1 | 74.6 | 85.3 | 14.7 |
| Women Age 16 - 64 | 45.0 | 74.9 | 83.9 | 16.1 |
| Men Age 16 - 64 | 48.2 | 80.2 | 88.4 | 11.6 |
| Adults Age 65 and over | 42.2 | 60.6 | 65.1 | 34.9 |
Note: Spell length categories are not mutually exclusive. Spells separated by only 1 month are not considered separate spells. Due to the length of the observation period, actual spell lengths for spells that lasted more than 20 months cannot be observed.
Source: Unpublished data from the SIPP, 1992 panel.
Economic Security Risk Factor 4. Long-term Poverty
As with welfare, poverty experiences often occur in a number of discrete episodes. Measures that illustrate the total length of poverty episodes reveal an important aspect of the severity of the risk of dependence.
Figure ECON 4. Percent of Children Age 0 to 5 in 1972 or 1982 Living in Poverty by Number of Years in Poverty
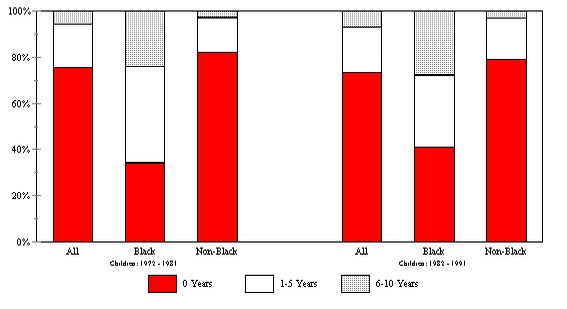
- In both time periods, approximately 75 percent of children never lived in poverty.
- The percentage of black children age 0 to 5 who experienced longer-term poverty of 6 to 10 years was much higher than the corresponding percentages for non-black children in both time periods.
- Table ECON 4 shows that for those individuals who were ever poor during the time period, a larger percentage were poor for only one to two years than were poor for a longer period of time.
- Table ECON 4 also shows a higher percentage of children compared to total persons experienced long-term poverty in both time periods, especially long-term poverty of 9 to 10 years.
- As shown in Table ECON 4, in both time periods, compared to non-black individuals and children, a much lower percentage of black individuals were never poor. Also, a much higher percentage of black individuals, relative to non-black individuals, experienced poverty for 3 to 10 years during both time periods.
Table ECON 4. Percent of Individuals Living in Poverty by Number of Years in Poverty
| Years in Poverty |
All Persons: 1972 - 1981 | All Persons: 1982 - 1991 | ||||
|---|---|---|---|---|---|---|
| All Persons |
Black | Non-Black | All Persons |
Black | Non-Black | |
| 100% | 100% | 100% | 100% | 100% | 100% | |
| 0 Years | 79.2 | 45.6 | 83.7 | 78.8 | 50.6 | 82.9 |
| 1 - 2 Years | 12.3 | 20.0 | 11.3 | 11.3 | 14.9 | 10.7 |
| 3 - 5 Years | 4.6 | 16.6 | 3.1 | 5.3 | 14.4 | 4.0 |
| 6 - 8 Years | 2.5 | 10.4 | 1.5 | 2.8 | 11.2 | 2.0 |
| 9 - 10 Years | 1.2 | 7.5 | 0.4 | 1.8 | 8.9 | 0.7 |
| Years in Poverty |
Children 0 - 5 in 1972: 1972-1981 | Children 0 - 5 in 1982: 1982-1991 | ||||
|---|---|---|---|---|---|---|
| All Children |
Black Children |
Non-Black Children |
All Children |
Black Children |
Non-Black Children |
|
| 100% | 100% | 100% | 100% | 100% | 100% | |
| 0 Years | 75.6 | 34.1 | 82.3 | 73.3 | 40.9 | 79.2 |
| 1 - 2 Years | 13.1 | 21.7 | 11.7 | 12.3 | 16.5 | 11.6 |
| 3 - 5 Years | 5.6 | 20.5 | 3.2 | 7.5 | 14.8 | 6.1 |
| 6 - 8 Years | 3.2 | 11.1 | 1.9 | 3.2 | 11.1 | 1.7 |
| 9 - 10 Years | 2.5 | 12.8 | 0.9 | 3.8 | 16.8 | 1.4 |
Source: Unpublished data from the PSID, 1972 - 1991.
Economic Security Risk Factor 5. Events Associated with the Beginning and Ending of a Poverty Episode
Events that trigger the beginning or ending of a poverty episode indicate an increased or decreased likelihood of future dependence.
Table ECON 5a. Percent of First Poverty Episode Beginnings Associated with Specific Events
| Spell Began 1973 - 1979 |
Spell Began 1980 - 1985 |
Spell Began 1986 - 1991 |
|
|---|---|---|---|
|
First birth to an unmarried, non-cohabitating mother |
4.2 | 5.8 | 7.3 |
| First birth to other circumstances |
2.3 |
4.5 |
2.3 |
| Second (or higher order) birth | 9.2 | 10.2 | 17.9 |
| Divorce/separation | 10.9 | 16.2 | 14.6 |
| Mother's work hours decreased by more than 500 hours | 12.5 | 21.4 | 28.6 |
| Other adults' work hours decreased by more than 500 hours, but no change in family structure | 29.0 | 27.6 | 27.7 |
| Other adults' work hours decreased by more than 500 hours, and a change in family structure | 24.6 | 22.9 | 16.3 |
| Householder acquired work limitation | 13.9 | 17.2 | 23.7 |
| Other transfer income dropped by $1,000 or more (in 1996$) | 5.9 | 3.5 | 2.9 |
| Changed state of residence | 7.5 | 10.0 | 8.0 |
Note: Events are defined to be neither mutually exclusive nor exhaustive. Work limitation is defined as a self-reported physical or nervous condition that limits the type of work or the amount of work the respondent can do.
Source: Unpublished data from the PSID, 1968 - 1992.
- Second or higher order births were more often associated with the beginning of first poverty episodes than first births. This was especially true for spells beginning between 1986 and 1991, during which time 18 percent of first poverty episodes were associated with second or higher level births.
- The percentages of first poverty spell beginnings associated with decreases in mothers' work hours rose dramatically over time, from 13 percent in the earliest period to 29 percent in the most recent period.
- The percentages of first poverty episodes associated with the householder acquiring a work limitation increased over time to nearly one-quarter of all first spells beginning between 1986 and 1991.
Table ECON 5b. Percent of First Poverty Episode Endings Associated with Specific Events
| Spell Ended 1973 - 1979 |
Spell Ended 1980 - 1985 |
Spell Ended 1986 - 1991 |
|
|---|---|---|---|
| Mother married or acquired cohabitor | 14.2 | 14.0 | 11.5 |
| Children under 18 no longer present | 2.0 | 1.3 | 4.3 |
| Mother's work hours increased by more than 500 hours | 19.8 | 22.5 | 21.1 |
| Other adults' work hours increased by more than 500 hours, but no change in family structure | 23.7 | 29.5 | 22.5 |
| Other adults' work hours increased by more than 500 hours, and a change in family structure | 12.1 | 8.5 | 8.1 |
| Householder no longer reports work limitation | 14.3 | 19.1 | 20.1 |
| Other transfer income increased by $1,000 or more (in 1996$) | 4.2 | 5.3 | 3.8 |
| Changed state of residence | 8.9 | 14.0 | 9.5 |
Note: Events are defined to be neither mutually exclusive nor exhaustive. Work limitation is defined as a self-reported physical or nervous condition that limits the type of work or the amount of work the respondent can do.
Source: Unpublished data from the PSID, 1968 - 1992.
- While the percentages of poverty episode endings associated with increases in mothers' work hours remained relatively stable across the three time periods (around 21 percent), the percentage of poverty spell endings associated with marriage or cohabitation decreased somewhat in the more recent time period (from 14 to 12 percent).
- The percentages of poverty spell endings associated with increases in transfer income remained relatively stable over the three time periods (around 4 to 5 percent).
- The percentages of spell endings associated with a householder no longer reporting a work limitation increased between the first two time periods and remained stable in the last time period.
Economic Security Risk Factor 6. Intergenerational Poverty
The extent to which parental poverty is associated with poverty of their children as adults illustrates a significant risk to current and future dependence.
Figure ECON 6. Poverty Transitions Between Childhood and Adulthood
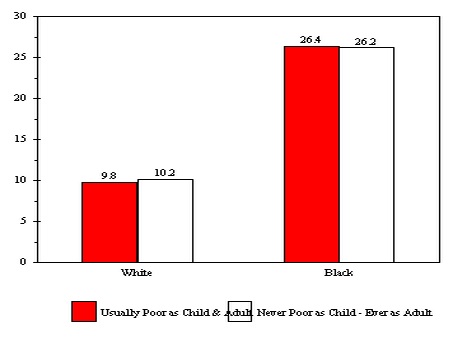
- Whereas only 10 percent of white children who were usually poor in childhood were usually poor in adulthood, 26 percent of black children who were usually poor in childhood were also usually poor in adulthood.
- Similarly, 10 percent of white children who were never poor as children experienced some poverty as adults. In contrast, 26 percent of black children who were never poor as children experienced some poverty as adults.
Table ECON 6. Poverty Transitions Between Childhood and Adulthood
| Usually Poor as Child and Usually Poor as Adult | Never Poor as Child and Ever Poor as Adult | |
|---|---|---|
| White | 9.8 | 10.2 |
| Black | 26.4 | 26.2 |
Note: "Usually Poor as Child and Usually Poor as Adult" measures the percent of children who were poor 51-100 percent of childhood who were also poor 51-100 percent of adulthood. "Never Poor as Child and Ever Poor as Adult" measures the percent of children who were never poor during childhood who were ever poor during adulthood. The table reads 9.8 percent of children who were usually poor during childhood (51-100 percent) were themselves usually poor during their observed adult years. Numbers are calculated for adults age 27 to 35 years in the 1988 PSID.
Source: Corcoran, M., "Rags to Rags: Poverty and Mobility in the United States," Annual Review of Sociology, 21:237-6, 1995.
Economic Security Risk Factor 7. Pre-transfer and Post-transfer Poverty Rates
Trends in the pre- and post-transfer rates of poverty show the anti-poverty effectiveness of social security and the major means-tested assistance program benefits.
Figure ECON 7. Poverty Rate of All Persons in Families with Related Children Under 18 Using Alternative Definition of Income, 1979-1995
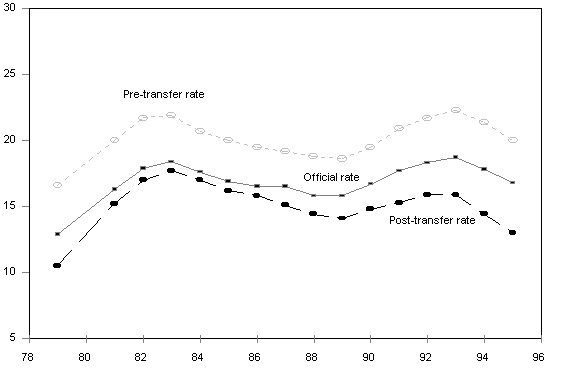
Note: The pre-transfer rate measures poverty in terms of cash income (only) before all transfers. The official rate measures it in terms of cash income plus social security and means-tested cash transfers. The post-transfer rate measures poverty after adding not only social security and means-tested cash transfers but also the market value of food and housing benefits plus taxes (including the refundable EITC as well as Federal payroll and income taxes); it does not include the fungible value of Medicare and Medicaid.
- In all years reported, the pre-transfer poverty rate for families with related children under age 18 was much higher than both the official poverty rate and the post-transfer poverty rate.
- Table ECON 7 shows that the total reduction in the poverty rate from transfers declined from 6 percent in 1979 to 4 percent in 1983. By 1993, the total reduction in the poverty rate again reached 6 percent and increased to 7 percent in 1994 and 1995.
Table ECON 7. Antipoverty Effectiveness of Cash and Near-Cash Transfers for All Persons in Families with Related Children Under 18, Selected Fiscal Years
| 1979 | 1983 | 1989 | 1993 | 1994 | 1995 | |
|---|---|---|---|---|---|---|
| Total Reduction in Poverty Rate | 6.1 | 4.2 | 4.5 | 6.4 | 7.0 | 7.0 |
| Total Population (in thousands) | 133,435 | 132,123 | 135,430 | 144,551 | 145,814 | 146,227 |
| Percent of Persons Removed from Poverty Due to: | ||||||
| Social Insurance (other than Social Security) | 4.4 | 6.9 | 3.4 | 4.2 | 3.8 | 3.5 |
| Social Security | 9.1 | 5.9 | 6.5 | 6.3 | 6.6 | 6.1 |
| Means-Tested Cash | 8.2 | 3.5 | 5.1 | 5.8 | 6.5 | 6.6 |
| Food and Housing Benefits | 16.5 | 8.7 | 11.7 | 10.2 | 11.6 | 12.5 |
| EITC and Fed. Payroll and Income Taxes | -1.7 | -5.8 | -2.8 | 2.3 | 4.1 | 6.6 |
| Total Percent of Pre-Transfer Poor Removed from Poverty by All Transfers | 36.6 | 19.1 | 23.9 | 28.9 | 32.6 | 35.2 |
| Poverty Rate (in percent): | ||||||
| Cash Income Before Transfers (pre-transfer) | 16.6 | 21.9 | 18.6 | 22.3 | 21.4 | 20.0 |
| Plus Social Ins. (other than Social Security) | 15.8 | 20.4 | 18.0 | 21.4 | 20.6 | 19.3 |
| Plus Social Security | 14.3 | 19.1 | 16.8 | 20.0 | 19.2 | 18.1 |
| Plus Means-Tested Cash Transfers (official poverty rate) | 12.9 | 18.4 | 15.8 | 18.7 | 17.8 | 16.8 |
| Plus Food and Housing Benefits | 10.2 | 16.5 | 13.6 | 16.4 | 15.3 | 14.3 |
| Plus EITC, less Fed. Payroll & Income Taxes (post-trans.) | 10.5 | 17.7 | 14.1 | 15.9 | 14.4 | 13.0 |
Note: EITC = Earned Income Tax Credit
Source: Congressional Budget Office tabulations. Additional calculations by DHHS.
- Table ECON 7 shows that a substantial percent of the poor population was removed from poverty by transfers in all years shown. After declining from 37 percent in 1979 to 19 percent in 1983, the percent of persons removed from poverty due to transfers consistently increased in the years reported. In 1995, 35 percent of all poor persons were removed from poverty due to transfers.
- Table ECON 7 shows that the percent of the poor population removed from poverty due to food and housing benefits is much larger in all reported years than the percent removed due to other transfers. In 1995, 13 percent of the poor population was removed from poverty due to food and housing benefits.
- Table ECON 7 also shows that whereas the EITC and Federal payroll and income taxes did not remove any poor individuals from poverty in 1979, 1983 and 1989, the trend reversed in 1993. By 1995, the EITC and Federal payroll and income taxes removed 7 percent of the poor population from poverty.
Economic Security Risk Factor 8. Child SUPPORT
Child Support provides critical income to families with children and reduces the likelihood of dependence. These child support risk factors reflect the presence and magnitude of child support payments made by noncustodial parents for families receiving services from the Child Support Enforcement Program.
Figure ECON 8a. Total Non-AFDC and AFDC Title IV-D Child Support Collections, 1978 - 1996 (In billions)
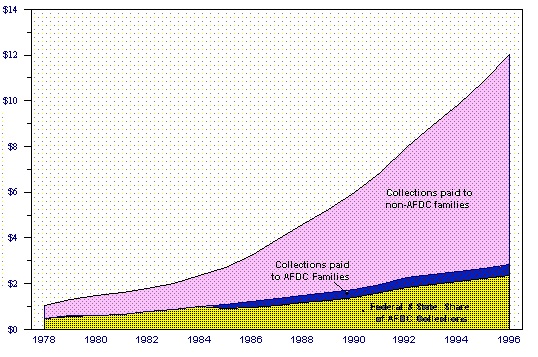
- Total collections paid through the Child Support Enforcement system (Title IV-D of the Social Security Act) increased at an annual rate of 14.5 percent (current dollars) from FY 1977 to FY 1996. The average increase was higher for collections on behalf of non-AFDC families (16.6 percent) than for collection on behalf of AFDC families (10.5 percent). This increase was attributable to both increases in the number of non-custodial parents paying child support and increases in the amount of child support paid per case.
Table ECON 8a. Total Non-AFDC and AFDC Title IV-D Child Support Collections, 1978 - 1996 (In millions)
| Fiscal Year | Total Collections | ||||||
|---|---|---|---|---|---|---|---|
| Total |
AFDC Collections |
Non--AFDC Collections | Total IV-D Administrative Expenditures | ||||
| Current Dollars | Constant '96 Dollars | Total | Payments to AFDC Families | Federal & StateShare of Collections | |||
| 1978 | $1,047 | $2,461 | $472 | $13 | $459 | $575 | $312 |
| 1979 | 1,333 | 2,876 | 597 | 12 | 584 | 736 | 383 |
| 1980 | 1,478 | 2,860 | 603 | 10 | 593 | 874 | 466 |
| 1981 | 1,629 | 2,870 | 671 | 12 | 659 | 958 | 526 |
| 1982 | 1,771 | 2,913 | 786 | 15 | 771 | 985 | 612 |
| 1983 | 2,024 | 3,198 | 880 | 15 | 865 | 1,144 | 691 |
| 1984 | 2,378 | 3,599 | 1,000 | 17 | 983 | 1,378 | 723 |
| 1985 | 2,694 | 3,932 | 1,090 | 189 | 901 | 1,604 | 814 |
| 1986 | 3,249 | 4,625 | 1,225 | 275 | 955 | 2,019 | 941 |
| 1987 | 3,917 | 5,423 | 1,349 | 278 | 1,070 | 2,569 | 1,066 |
| 1988 | 4,605 | 6,124 | 1,486 | 289 | 1,188 | 3,128 | 1,171 |
| 1989 | 5,241 | 6,651 | 1,593 | 307 | 1,286 | 3,648 | 1,363 |
| 1990 | 6,010 | 7,266 | 1,750 | 334 | 1,416 | 4,260 | 1,606 |
| 1991 | 6,886 | 7,925 | 1,984 | 381 | 1,603 | 4,902 | 1,804 |
| 1992 | 7,964 | 8,896 | 2,259 | 435 | 1,824 | 5,705 | 1,995 |
| 1993 | 8,907 | 9,658 | 2,416 | 446 | 1,971 | 6,491 | 2,241 |
| 1994 | 9,850 | 10,405 | 2,550 | 457 | 2,093 | 7,300 | 2,556 |
| 1995 | 10,827 | 11,128 | 2,689 | 474 | 2,215 | 8,138 | 3,012 |
| 1996 | 12,018 | 12,018 | 2,854 | 480 | 2,374 | 9,163 | 3,048 |
Note: Not all states report current child support collections in all years.
Source: U.S. Department of Health and Human Services, Administration for Children and Families, Office of Child Support Enforcement, Preliminary Child Support Enforcement FY 1996 Data Report, 1997, and Twentieth Annual Report to Congress, for the period ending September 30, 1995 and earlier years.
- From FY 1984 through FY 1996, the first $50 dollars of each month's child support collection was passed-through to families that were receiving AFDC benefits. The "Collections Paid to Families" shown in Figure ECON 8a reflects the $50 pass-through and other benefit adjustments. Because the pass-through payment was capped at $50, the increase in payments was mostly attributable to increases in the number of families receiving collections and not to increases in the amount of child support passed-through to individual families.
- Over 80 percent of AFDC collections (collections on behalf of AFDC recipients and for past due support assigned to the state by former AFDC recipients) was retained to reimburse the state and federal government for the cost of welfare benefits paid to the family.
Figure ECON 8b. Average Annual Child Support Enforcement Paymentsfor Current Support by Noncustodial Parents with an Obligation and Payment,1986 - 1996
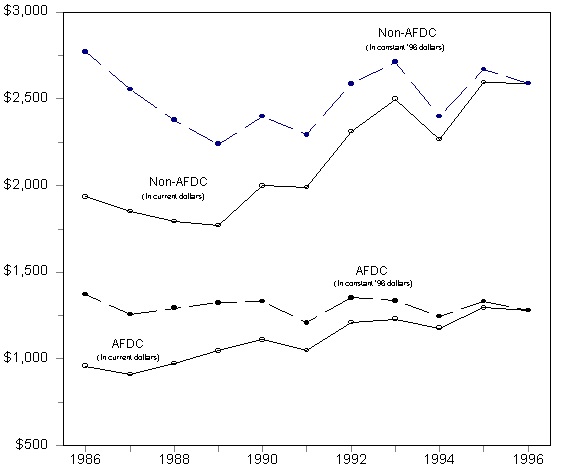
- Figure ECON 8a represents the average annual payment of current support by non-custodial parents for families receiving services through the child support enforcement system. Payments on behalf of families not receiving AFDC were about twice as large as those payments for families receiving AFDC. (Note that many families not on AFDC may have received AFDC sometime in the past.)
- Annual payments on behalf of AFDC and non-AFDC families have increased by about 33 percent in current dollars between FY 1986 and FY 1996. However, when converted to constant dollars, per capita payments have not quite kept pace with inflation (ECON 8a).
- In FY 1996 collections were received from about 60 percent of the cases with orders and those collections represented about 52 percent of the current child support due (Table ECON 8b2). About 32 percent of the current support due on behalf of AFDC families was collected, compared to 60 percent collected on behalf of non-AFDC families.
Table ECON 8b1. Average Annual Child Support Enforcement Paymentsfor Current Support by Noncustodial Parents with an Obligation and Payment,1986 - 1996
| Current Dollars | Constant '96 Dollars | Current Dollars | Constant '96 Dollars | Current Dollars | Constant '96 Dollars | CPI-U | |
|---|---|---|---|---|---|---|---|
| 1986-96 | |||||||
| $ Change |
$321 |
-$93 | $655 | -$181 | $719 | $101 | 47.3 |
| As Percent | 33.5% | -6.8% | 33.8% | -6.5% | 50.2% | 4.9% | 43.2% |
| 1986 | $959 | 1,373 | $1,936 | 2,772 | $1,433 | 2,051 | 109.6 |
| 1987 | 910 | 1,257 | 1,851 | 2,557 | 1,416 | 1,956 | 113.6 |
| 1988 | 975 | 1,293 | 1,793 | 2,378 | 1,468 | 1,947 | 118.3 |
| 1989 | 1,046 | 1,324 | 1,770 | 2,240 | 1,457 | 1,844 | 124.0 |
| 1990 | 1,110 | 1,333 | 1,998 | 2,399 | 1,672 | 2,007 | 130.7 |
| 1991 | 1,049 | 1,208 | 1,989 | 2,291 | 1,711 | 1,971 | 136.2 |
| 1992 | 1,210 | 1,353 | 2,314 | 2,588 | 1,919 | 2,146 | 140.3 |
| 1993 | 1,230 | 1,336 | 2,498 | 2,712 | 1,990 | 2,161 | 144.5 |
| 1994 | 1,178 | 1,247 | 2,266 | 2,399 | 1,889 | 2,000 | 148.2 |
| 1995 | 1,294 | 1,332 | 2,595 | 2,672 | 2,167 | 2,231 | 152.4 |
| 1996 | 1,280 | 1,280 | 2,591 | 2,591 | 2,152 | 2,152 | 156.9 |
Source: U.S. Department of Health and Human Services, Administration for Children and Families, Office of Child Support Enforcement, Preliminary Child Support Enforcement FY 1996 Data Report, 1997, and Twentieth Annual Report to Congress, for the period ending September 30, 1995 and earlier years.
Table ECON 8b2. Proportion of IV-D Cases with Orders and Collections and Proportion of Amount Paid to Amount Due, FY 1996
|
AFDC Cases |
Non-AFDC Cases |
Total Cases |
|
|---|---|---|---|
| Number of Cases with Orders
(Current Support) |
2.44 | 4.13 | 6.57 |
| Number of Cases with Collections
(Current Support) |
1.20 | 2.76 | 3.96 |
| Percent of Cases with Collection
(Current Support) |
49% | 67% | 60% |
| Amount of Current Support Due | $4,795 | $11,971 | $16,766 |
| Amount of Current Support Paid | $1,535 | $ 7,150 | $ 8,684 |
| Percent Paid | 32% | 60% | 52% |
Source: U.S. Department of Health and Human Services, Administration for Children and Families, Office of Child Support Enforcement, Preliminary Child Support Enforcement FY 1996 Data Report, and unpublished data.
Figure ECON 8c. Percent of Single Mothers Receiving Child Support and Alimony by Marital Status and Receipt of Income Assistance, 1978 - 1996
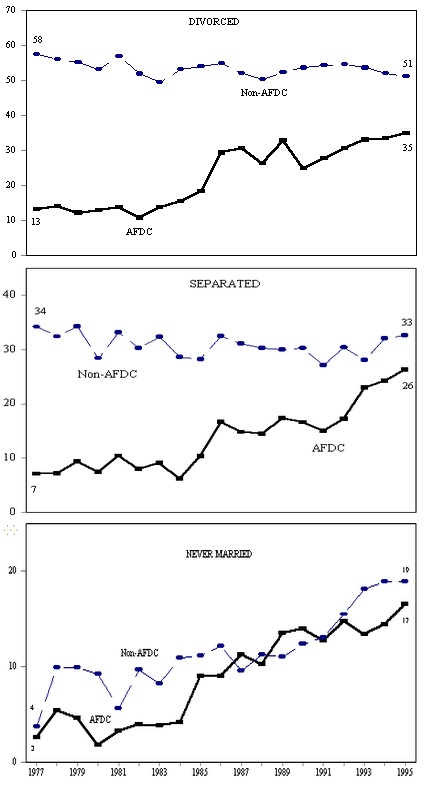
Table ECON 8c. Percent of Single Mothers Receiving Child Support and Alimony by Marital Status and Receipt of Income Assistance, 1978 - 1995
|
Divorced |
Separated |
Never Married |
||||
|---|---|---|---|---|---|---|
| AFDC | Non-AFDC | AFDC | Non-AFDC | AFDC | Non-AFDC | |
| 1977-95 - Change |
21.8 |
-6.2 | 19.2 | -1.6 | 14.0 | 15.2 |
| 1977 | 13.2 | 57.5 | 7.1 | 34.2 | 2.6 | 3.7 |
| 1978 | 14.0 | 56.1 | 7.2 | 32.4 | 5.4 | 9.9 |
| 1979 | 12.2 | 55.2 | 9.3 | 34.3 | 4.6 | 9.9 |
| 1980 | 13.0 | 53.3 | 7.4 | 28.4 | 1.8 | 9.2 |
| 1981 | 13.9 | 56.9 | 10.4 | 33.2 | 3.3 | 5.6 |
| 1982 | 10.8 | 52.0 | 8.0 | 30.3 | 4.0 | 9.7 |
| 1983 | 13.8 | 49.5 | 9.1 | 32.3 | 3.9 | 8.2 |
| 1984 | 15.6 | 53.3 | 6.2 | 28.6 | 4.2 | 10.9 |
| 1985 | 18.3 | 54.1 | 10.3 | 28.2 | 9.0 | 11.2 |
| 1986 | 29.4 | 55.0 | 16.7 | 32.5 | 9.0 | 12.2 |
| 1987 | 30.6 | 52.2 | 14.8 | 31.1 | 11.3 | 9.6 |
| 1988 | 26.5 | 50.3 | 14.4 | 30.3 | 10.3 | 11.3 |
| 1989 | 32.9 | 52.4 | 17.3 | 30.0 | 13.5 | 11.1 |
| 1990 | 25.0 | 53.7 | 16.6 | 30.3 | 14.0 | 12.4 |
| 1991 | 27.9 | 54.5 | 15.0 | 27.1 | 12.7 | 13.1 |
| 1992 | 30.6 | 54.6 | 17.2 | 30.4 | 14.8 | 15.5 |
| 1993 | 33.1 | 53.7 | 23.0 | 28.1 | 13.4 | 18.1 |
| 1994 | 33.6 | 52.1 | 24.2 | 32.1 | 14.4 | 18.9 |
| 1995 | 35.0 | 51.3 | 26.3 | 32.6 | 16.6 | 18.9 |
Note: Married women also receive child support, but the proportion of eligible married women cannot be identified on the March CPS file. Child support and alimony were not collected as separate items prior to 1988. They are left combined for all years to ensure comparability across years.
Source: Elaine Sorensen, the Urban Institute, unpublished data from the March Current Population Survey Public Use Files, 1978 - 1996.
- Figure ECON 8c reflects the proportion of single-parent female-headed families receiving child support by marital status. Divorced and separated women are more likely to receive child support than are never-married women.
- Since the Child Support Enforcement Program was authorized in the mid 1970s the proportion of divorced, separated, and never-married AFDC recipients families receiving child support has been increasing.
- The proportion of never-married women receiving child support but not AFDC payments is very similar to the proportion of never-married AFDC recipients receiving child support. Both trend lines reflect the paternity establishment activities of the Child Support Enforcement Program, as very few paternities are established outside of the CSE system.
- The proportion of divorced and separated women receiving child support but not AFDC payments has remained relatively constant.
Figure ECON 8d. Children Under 18 Born Outside of Marriage with Paternity Established
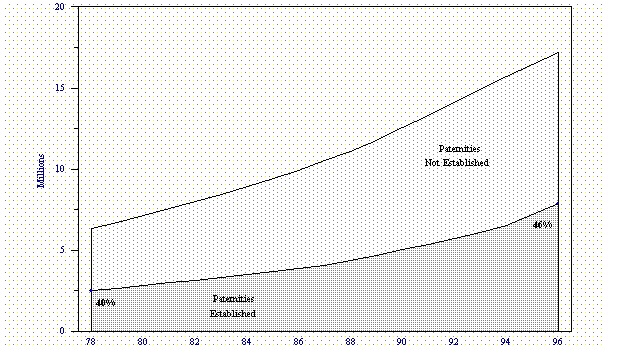
- Due to the increasing numbers of children born outside of marriage, each year the cumulative number of children needing paternity to be established has risen steadily over the last two decades. As shown in Figure ECON 8d the cumulative total of children born outside of marriage as of 1996 was about 17.6 million and more than half of these children did not have a legally identified father.
Table ECON 8d. Children Under 18 Born Outside of Marriage with Paternity Established (In thousands)
| 1978 | 1980 | 1982 | 1984 | 1986 | 1988 | 1990 | 1992 | 1994 | 1995 | 1996 | |
|---|---|---|---|---|---|---|---|---|---|---|---|
| Children Under 18 Born Outside of Marriage | 6,361 | 7,130 | 7,992 | 8,900 | 9,939 | 11,106 | 12,539 | 14,130 | 15,723 | 16,452 | 17,167 |
| Paternity Not Established | 3,847 | 4,314 | 4,849 | 5,409 | 6,090 | 6,758 | 7,500 | 8,402 | 9,191 | 9,267 | 9,298 |
| Paternity Established | 2,514 | 2,817 | 3,143 | 3,491 | 3,849 | 4,348 | 5,039 | 5,728 | 6,532 | 7,185 | 7,870 |
| Percent of Children | 39.5% | 39.5% | 39.3% | 39.2% | 38.7% | 39.2% | 40.2% | 40.5% | 41.5% | 43.7% | 45.8% |
| Paternities Established for Non-Marital Births in a Year: | |||||||||||
| Paternity Not Established | 544 | 666 | 715 | 770 | 878 | 1,005 | 1,165 | 1,225 | 1,290 | 1,254 | 1,267 |
| Paternities Established | 111 | 144 | 173 | 219 | 245 | 307 | 393 | 512 | 676 | 931 | 1,002 |
| Percent of Children | 20.4% | 21.6% | 24.2% | 28.4% | 27.9% | 30.5% | 33.7% | 41.8% | 52.5% | 74.2% | 79.1% |
Note: Total children under 18 years of age who were born outside of marriage is the cumulative total of nonmarital births less deaths; paternities established is the cumulative total of voluntary and C.S.E. paternity establishment as well as estimated births legitimized by marriage and adoption. An unknown number of children born outside of marriage are living with step-fathers who may have assumed paternal responsibility without legal adoption.
Source: National Center for Health Statistics, Vital Statistics of the United States, annual and Monthly Vital Statistics Report, Vol. 46, No. 1, Supplement 2, September 11, 1997 and U.S. Department of Health and Human Services, Administration for Children and Families, Office of Child Support Enforcement, Preliminary Child Support Enforcement FY 1996 Data Report, 1997, and Twentieth Annual Report to Congress, for the period ending September 30, 1995 and earlier years.
- As shown in Table ECON 8d the number of paternities established each year as a percent of the number of children born outside of marriage each year has more than tripled between 1978 and 1996. This increasing rate of paternity establishment kept the overall proportion of children with paternity established at 40 percent even though the number of children born outside of marriage was increasing over time.
- The proportion of all children under age 18 with paternities established has increased slightly over the past three years, increasing to nearly 46 percent by 1996. This increase reflects the additional paternities now being established in the hospitals at the time of the birth of the child.
- Reporting of in-hospital paternity establishments is voluntary and reflects reports from only 32 states, therefore the rate of increase in paternity establishments over the past three years may be underestimated.
Economic Security Risk Factor 9. Food Insecurity
Household food insecurity, including (at a severe level) direct hunger among children in the household, is related to general income poverty and is expected to affect children's health, cognitive and social development, and general school success.
Figure ECON 9. Percentage of Households Classified as Food Insecure, 1995
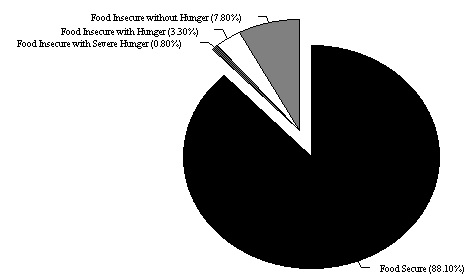
- A large majority (88 percent) of American households were food secure in the year ending April 1995.
- About 11.9 million (of approximately 100 million) households experienced food insecurity -- not being able to afford enough food -- at some level during 1995. Most of the food insecure households were "food insecure without hunger," meaning that although food insecurity was evident in their concerns and in adjustments to household food management, including reduced quality of diets, little or no reduction in food intake was reported.
- About 4 percent of the 100 million households were classified as food insecure with hunger. Thus, one or more adult members of some 4.2 million households were estimated to have experienced reduced food intake and hunger as a result of financial constraints in the year ending April 1995.
- About 800,000 households were classified as "food insecure with severe hunger," meaning that children, as well as adults, experienced reduced food intake and hunger.
Table ECON 9. Percentage of Households Classified as Food Insecure, 1995
| Food Secure | Food Insecure | Food Insecure | Food Insecure | |
|---|---|---|---|---|
| No Hunger | Moderate Hunger | Severe Hunger | ||
| All Households | 88.1 | 7.8 | 3.3 | 0.8 |
| Households with Children Under 6, by Race | ||||
| White | 82.6 | 13.1 | 3.6 | 0.6 |
| Black | 70.1 | 19.7 | 8.8 | 1.4 |
| Hispanic | 66.8 | 23.6 | 7.9 | 1.7 |
| Other | 79.4 | 14.1 | 4.0 | 2.6 |
| Households with Children Under 18, by Race | ||||
| White | 84.6 | 11.1 | 3.6 | 0.7 |
| Black | 71.8 | 18.1 | 8.5 | 1.6 |
| Hispanic | 69.6 | 21.6 | 7.5 | 1.3 |
| Other | 81.1 | 12.6 | 4.7 | 1.6 |
| Households with Elderly but no Children, by Race | ||||
| White | 95.3 | 3.2 | 1.3 | 0.2 |
| Black | 81.7 | 12.6 | 4.3 | 1.4 |
| Hispanic | 79.1 | 15.2 | 4.0 | 1.7 |
| Other | 87.7 | 7.8 | 3.6 | 0.9 |
| Household Income-to-Poverty Ratio (all races and household types) | ||||
| Under 0.50 | 58.4 | 24.6 | 12.1 | 4.9 |
| Under 1.00 | 64.7 | 22.1 | 10.0 | 3.1 |
| Under 1.30 | 68.1 | 20.0 | 9.3 | 2.6 |
| Under 1.85 | 73.8 | 17.0 | 7.3 | 1.9 |
| 1.85 and over | 95.8 | 2.8 | 1.2 | 0.2 |
| Households with Children under 18 (all races) | ||||
| Married-Couple Families | 88.5 | 8.8 | 2.3 | 0.5 |
| Female Head, No Spouse | 64.7 | 22.9 | 10.3 | 2.0 |
| Male Head, No Spouse | 81.4 | 12.0 | 5.6 | 1.0 |
Note: Persons of Hispanic ethnicity can be any race
Source: U.S. Department of Agriculture, Food and Consumer Service, Office of Analysis and Evaluation, Household Food Security in the United States in 1995.
- Table ECON 9 shows that white households with children had the lowest prevalence of food insecurity of any racial group and female-headed households with children under 18 had a higher prevalence of food insecurity compared to male-headed or married-couple families.
- Although there were higher prevalences of food security as the household income-to-poverty ratio increased, Table ECON 9 shows that significant increases only occurred when income levels exceeded 185 percent of poverty.
Economic Security Risk Factor 10. Health Insurance
A lack of health insurance may be the precursor to future health problems and as such a risk-factor of dependence.
Figure ECON 10. Percent of Persons Without Health Insurance by Age, 1996
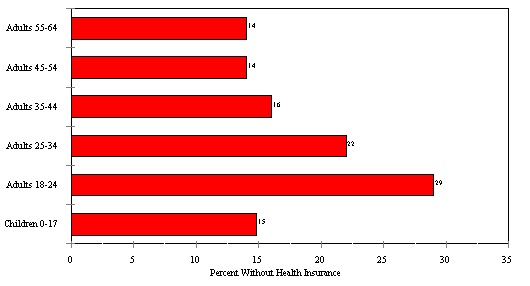
- Among all age categories, young adults age 18 to 24 were the most likely to be without health insurance in 1996 (29 percent).
- Sixteen percent of the population was without health insurance in 1996 as shown in Table ECON 10.
- Table ECON 10 also shows that among racial groups, a much larger percentage of Hispanics were without health insurance (34 percent) than non-Hispanic whites (12 percent) or non-Hispanic blacks (22 percent).
Table ECON 10. Percent of Persons Without Health Insurance by Age, 1996
| Category | Percent |
|---|---|
| All Persons | 16 |
| Non-Hispanic White | 12 |
| Non-Hispanic Black | 22 |
| Hispanic | 34 |
| Other | 21 |
| Children 0 - 5 | 14 |
| Children 6 - 8 | 14 |
| Children 9 - 11 | 15 |
| Children 12 - 14 | 16 |
| Children 15 - 17 | 17 |
| Total 0 - 17 | 15 |
| Adults 18 - 24 | 29 |
| Adults 25 - 34 | 22 |
| Adults 35 - 44 | 16 |
| Adults 45 - 54 | 14 |
| Adults 55 - 64 | 14 |
| Women Age 18 - 64 | 14 |
| Men Age 18 - 64 | 18 |
| Adults Age 65 and over | 1 |
Source: U.S. Bureau of the Census, March Current Population Survey, 1997.
Economic Security Risk Factor11. Percent Residing in High-Poverty Neighborhoods
High poverty neighborhoods are often associated with relatively lower quality services (e.g., education, medical) that can have a negative effect on development and increase the risk of dependence.
Figure ECON 11. Percent of Children Residing in High-Povetry Neighborhoods, 1990
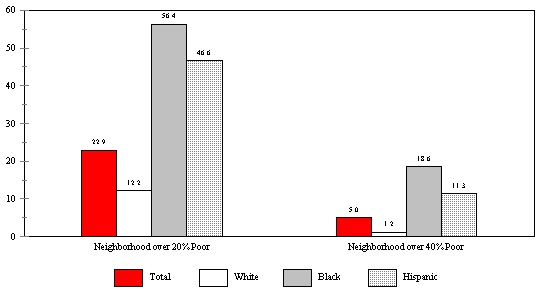
- Nearly a quarter of all children resided in neighborhoods where over 20 percent of the residents were poor and 5 percent of children resided in neighborhoods where over 40 percent of residents were poor.
- Black children and Hispanic children were disproportionately represented in these poor neighborhoods, with a slightly higher percentage of black children living in poor neighborhoods than Hispanic children.
Table ECON 11. Percent of Children Residing in High-Poverty Neighborhoods, 1990
| Total | White | Black | Hispanic | |
|---|---|---|---|---|
| Neighborhood over 20% Poor | 22.9 | 12.2 | 56.4 | 46.6 |
| Neighborhood over 40% Poor | 5.0 | 1.2 | 18.6 | 11.3 |
Note: Neighborhoods are defined as census tracts and block-numbering areas. Both metropolitan and nonmetropolitan areas are included. The poverty rate is the percent of all persons in the neighborhood living in families below the poverty line in 1990.
Source: U.S. Department of Health and Human Services, Office of the Assistant Secretary for Planning and Evaluation, Trends in the Well-Being of America's Children and Youth: 1997. Table PF 3.2.
Economic Security Risk Factor 12. Residential Mobility
Frequent changes of residence are disruptive events for children and may increase the risk of dependence.
Figure ECON 12. Percent of Individuals and Families who Moved in a Given One-Year Period
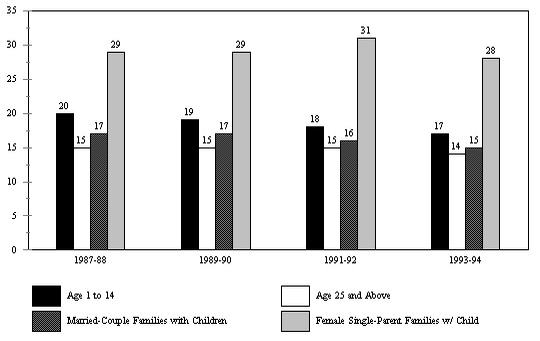
- Female-headed families with children were much more likely to move in a year than married-couple families with children, in each of the one-year periods shown.
- Residential mobility decreased one percentage point every two years for children age 1 to 14 from 1987 - 1988 to 1993 - 1994.
- Residential mobility for adults age 25 and above remained essentially unchanged, dropping only one percentage point over this period.
Table ECON 12. Percent of Individuals and Families who Movedin a Given One-Year Period
| 1987 - 88 | 1989 - 90 | 1991 - 92 | 1993 - 94 | |
|---|---|---|---|---|
| Age 1 to 14 | 20 | 19 | 18 | 17 |
| Age 25 and Above | 15 | 15 | 15 | 14 |
| Married-Couple Families with Children | 17 | 17 | 16 | 15 |
| Female Single-Parent Families with Children | 29 | 29 | 31 | 28 |
Note: Residential mobility measures the percent of individuals over age 1 who changed houses between March of the first year and March of the next year. The mobility of married-couple and female single-parent families is the percent of householders age 15 to 54 with own children under 18 who changed houses.
Source: U.S. Bureau of the Census, "Geographical Mobility," Current Population Reports, Series P20-456, 473 and 485, various years.
Economic Security Risk Factor 13. Adult Incarceration
This risk factor tracks trends in the extent to which adults are living apart from their children because they are incarcerated. An incarcerated parent leaves his/her family at increased risk of dependence.
Figure ECON 13. Estimated Number of Sentenced Male Prisoners Under State or Federal Jurisdiction per 100,000 Resident Population
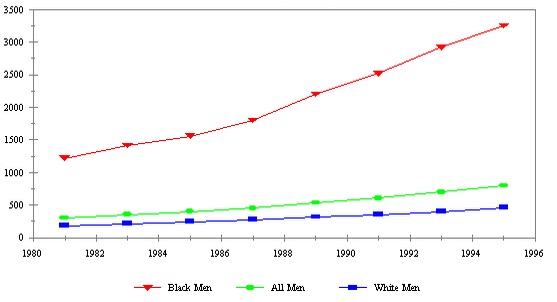
- The number of black men incarcerated per 100,000 population increased 167 percent from 1981 to 1995, while the number of white men incarcerated increased 148 percent in the same period.
- Table ECON 13 shows that the number of women incarcerated, while still very small relative to men, rose 300 percent from 1981 to 1995, with white female incarceration increasing 314 percent and black female incarceration increasing 256 percent.
- Table ECON 13 also shows that black men and black women were more likely to be incarcerated than white men and white women in 1995.
Table ECON 13. Estimated Number of Sentenced Prisoners Under State or Federal Jurisdiction per 100,000 Resident Population
| Total Men and Women | All Men | White Men | Black Men | All Women | White Women | Black Women | |
|---|---|---|---|---|---|---|---|
| 1981 | 154 | 304 | 186 | 1217 | 12 | 7 | 50 |
| 1983 | 179 | 354 | 217 | 1412 | 15 | 9 | 58 |
| 1985 | 202 | 397 | 246 | 1559 | 17 | 10 | 68 |
| 1987 | 231 | 453 | 277 | 1800 | 22 | 13 | 82 |
| 1989 | 276 | 535 | 317 | 2200 | 29 | 17 | 115 |
| 1991 | 313 | 606 | 352 | 2523 | 34 | 19 | 135 |
| 1993 | 359 | 698 | 398 | 2920 | 41 | 23 | 165 |
| 1995 | 411 | 796 | 461 | 3250 | 48 | 29 | 178 |
Note: Sentenced prisoners are those with a sentence of more than 1 year. Rates are based on U.S. resident population on July 1 of each year.
Source: U.S. Department of Justice, Correctional Populations in the United States, 1993.
Employment and Work-related Risk Factor 1. Labor Force Attachment
This risk factor focuses exclusively on the participation of an adult in the labor market, without regard to whether means-tested assistance was received concurrently. Measuring labor force attachment reflects a critical aspect of the risk of dependence.
Figure WORK 1. Percent of All Individual in Families with One or More Workers, 1993
- Most individuals, regardless of race, lived in families with at least one person working full-time.
- Non-Hispanic blacks were more likely than Hispanics or non-Hispanic whites to live in families where no one was in the labor force. Non-Hispanic blacks were more likely than those in other racial groups to live in families in which there were no full-time workers.
- As shown in Table WORK 1, younger children were slightly more likely than older children to live in families with no one in the labor force.
- Table WORK 1 shows that working-age women were more likely than working-age men to live in families with no one in the labor force, and slightly more likely to live in families where the all labor force participants worked less than full-time.
Table WORK 1. Percent of All Individuals in Families with One or More Workers, 1993
| No One in Labor Force | At Least One Person in the Labor Force (no one full-time) | At Least One Full-Time Person in the Labor force | |
|---|---|---|---|
| All Persons | 16.3 | 9.5 | 74.2 |
| Racial Categories | |||
| Non-Hispanic White | 15.9 | 8.5 | 75.5 |
| Non-Hispanic Black | 21.6 | 14 | 64.4 |
| Hispanic | 15.1 | 11.6 | 73.3 |
| Age Categories | |||
| Children Age 0 - 5 | 11.3 | 9.5 | 79.2 |
| Children Age 6 - 10 | 10.2 | 9.2 | 80.6 |
| Children Age 11 - 15 | 8.6 | 10 | 81.4 |
| Women Age 16 - 64 | 10.2 | 9.7 | 80.1 |
| Men Age 16 - 64 | 6.2 | 8.7 | 85.1 |
Note: Full-time labor force participants are defined as those who usually work 35 or more hours per week.
Source: Unpublished data from the SIPP, 1993.
Employment and Work-related Risk Factor 2. Employment Among the Low-skilled
This risk factor tracks trends in the percentage of men and women with 12 years of schooling or less who are engaged in paid employment. These trends illustrate a key risk of dependence.
Figure WORK 2. Percent of All Men and Women Age 18 to 65 with no more than a High School Education who are Employed
- In 1994, 57 percent of black men with a maximum of twelve years of schooling were working compared to 75 and 74 percent, respectively, of similarly educated white and Hispanic men.
- The percentage of low-skilled men who were employed dropped drastically from the early 1970s to early 1980s for all racial groups, although most dramatically for black men. From 1970 to 1983 the percentage of low-skilled black men who were employed dropped 23 percentage points; for white men during the same period the percentage dropped 16 points. The percentage for Hispanic men fell 9 percentage points in the three years between 1980 and 1983.
- Since 1983, the percentage of low-skilled white men working increased three percentage points while the percentage for black men increased one percentage point.
- Conversely, the percentages of low-skilled female workers have increased since 1970. For white women, the percentage increased 13 points up to 57 percent; the percentage for black women increased 5 percent up to 54 percent in 1994.
- In all years, smaller percentages of low-skilled Hispanic women worked compared to other groups.
Table WORK 2. Percent of All Men and Women Age 18 to 65 with no more than a High School Education who are Employed
| White Men | Black Men | Hispanic Men | White Women | Black Women | Hispanic Women | |
|---|---|---|---|---|---|---|
| 1970 | 88 | 81 | NA | 44 | 49 | NA |
| 1980 | 79 | 65 | 81 | 50 | 46 | 42 |
| 1983 | 72 | 56 | 72 | 49 | 43 | 39 |
| 1993 | 75 | 57 | 73 | 57 | 53 | 45 |
| 1994 | 75 | 57 | 74 | 57 | 54 | 44 |
Note: These data have been weighted to create an average for all men and women with no more than a high school diploma using population numbers from U.S. Bureau of the Census, Current Population Reports, Series P20. The population weights were calculated for 1970, 1980, and 1990 and the other weights were calculated using linear extrapolation.
Source: Blank, R., It Takes a Nation,1997.
Employment and Work-related Risk Factor 3. Earnings of Low-skilled Workers
The economic condition of the low-skill labor market is key to the ability of young adult men and women to support families without receiving means-tested assistance. This measure tracks trends in the earnings of low-skilled workers.
Figure WORK 3. Mean Weekly Wages of Men Working Full-Time, Full-Year with no more than a High School Education, 1995 Dollars
- Men's mean weekly wages for full-time work have decreased in real terms over the past quarter of a century. In 1970 the mean weekly wage for a full-time working man was $593 (in 1995 dollars), the comparable wage in 1994 was $523, representing a decrease of 12 percent.
- A large gap exists between the mean weekly wages for white and black men, although it has been narrowing over time. In 1970 the mean weekly wage for white men working full-time was the equivalent of $615 in 1995 dollars, $183 higher than the average for blacks, $432. In 1994 the difference was $93, with white men receiving a mean wage of $539 and black men $446. In 1994 full-time working black men received 82 percent of the weekly wages of white men; in 1970 they received only 70 percent of the wages. The narrowing of this gap is predominantly a result of the declining value of white men's mean wages.
Table WORK 3. Mean Weekly Wages of Men Working Full-Time, Full-Year with no more than a High School Education, 1995 Dollars
| 1970 | 1975 | 1980 | 1985 | 1990 | 1994 | |
|---|---|---|---|---|---|---|
| All Men | $593 | $580 | $584 | $555 | $531 | $523 |
| Black Men | $432 | $460 | $448 | $440 | $442 | $446 |
| White Men | $615 | $597 | $603 | $572 | $545 | $539 |
Note: Full-time, full-year workers work at least 48 weeks per year and 35 hours per week. These data have been weighted to create an average for all men with no more than a high school diploma using population numbers from U.S. Bureau of the Census, Current Population Reports, Series P-20. The population weights were calculated for 1970, 1980, and 1990 and the other year weights were calculated using linear extrapolation.
Source: Blank, R., It Takes a Nation,1997.
Employment and Work-related Risk Factor 4. Adult/Child Disability
Health conditions that limit parents' ability to work are important predictors of family economic problems and future dependence.
Figure WORK 4. Percent Reporting a Fuctional Disability, 1994
- In 1994, adults were more likely to have a functional disability than school-age children, and school-age children were in turn more likely to have a functional disability than younger children.
- As shown in Table WORK 4, the percentage of non-Hispanic blacks who reported a functional disability was larger than the percentages for non-Hispanic whites and Hispanics.
Table WORK 4. Percent of the Total Population Reporting a Disability , 1994
| Functional Disability | |
|---|---|
| All Persons |
18.3 |
| Racial Categories | |
| Non-Hispanic White | 8.7 |
| Non-Hispanic Black | 11.0 |
| Hispanic | 7.7 |
| Age Categories | |
| Children Age 0 - 5 | 7.2 |
| Children Age 6 - 17 | 9.5 |
| Adults Age 18 - 64 | 16.2 |
| Functional, Work, Perceived or Program Disability | |
|---|---|
| Age 0 - 17 | |
| Functional Disability | 8.7 |
| Work Disability | NA |
| Perceived Disability | 2.8 |
| Disability Program Recipient | 6.7 |
| Age 18 - 64 | |
| Functional Disability | 16.2 |
| Work Disability | 10.7 |
| Perceived Disability | 7.0 |
| Disability Program Recipient | 5.7 |
Note: Functional disability only includes those disabilities expected to last at least 12 months. Functional disabilities were defined as either: (1) limitations in or inability to perform a variety of physical activities (i.e. walking, lifting, reaching); (2) serious sensory impairments (i.e. inability to read newsprint even with glasses or contact lenses); (3) serious symptoms of mental illness (i.e. frequent depression or anxiety; frequent confusion, disorientation, or difficulty remembering) which has seriously interfered with life for the last year; (4) use of selected assistive devices (i.e. wheelchairs, scooter, walkers); (5) developmental delays for children identified by a physician (i.e. physical, learning); (6) for children under 5, inability to perform age-appropriate functions (i.e. sitting up, walking); and, (7) long-term care needs. Work disability is defined as limitations in or the inability to work as a result of a physical, mental or emotional health condition. Perceived disability is a new disability measure based on the Americans with Disabilities Act (ADA) and includes individuals who were perceived by themselves or others as having a disability. Disability program recipients include persons covered by Supplemental Security Income (SSI), Social Security Disability Insurance (SSDI), Special Education Services, Early Intervention Services, and/or disability pensions.
Source: Unpublished data from the 1994 National Health Interview Survey on Disability, Phase I; 1994 NHIS, and 1994 Family Resources Supplement.
Employment and Work-Related Risk Factor 5. Adult Alcohol and Substance Abuse
Adult alcohol and substance abuse is a risk factor for dependence.
Figure WORK 5. Percent of Adults who used Cocaine Marijuana or Alchohol, 1996
- As shown in Table WORK 5, among adults age 18 to 34 cocaine use declined steadily from 1985 to 1994 but rose slightly from 1994 to 1996.
- Table WORK 5 shows that in every age group since 1985 the percentages of persons reporting binge alcohol use were larger than the percentages for all other reported behaviors.
- As shown in Table WORK 5, for the first time since 1988, marijuana use in 1996 was slightly more prevalent than heavy alcohol use among adults age 18 to 25. This was due to both increasing marijuana use and decreasing heavy alcohol use since 1992, a reversal of the prior trend.
Table WORK 5. Percent of Adults who used Cocaine, Marijuana or Alcohol, Selected Years
| 1979 | 1982 | 1985 | 1988 | 1990 | 1992 | 1994 | 1996 | |
|---|---|---|---|---|---|---|---|---|
| Cocaine | ||||||||
| Age 18 - 25 | 9.9 | 7.0 | 8.1 | 4.8 | 2.3 | 2.0 | 1.2 | 2.0 |
| Age 26 - 34 | 3.0 | 3.5 | 6.3 | 2.8 | 1.9 | 1.5 | 1.3 | 1.5 |
| Age 35 and Above | 0.2 | 0.5 | 0.5 | 0.4 | 0.2 | 0.2 | 0.4 | 0.4 |
| Marijuana | ||||||||
| Age 18 - 25 | 35.6 | 27.2 | 21.7 | 15.3 | 12.7 | 10.9 | 12.1 | 13.2 |
| Age 26 - 34 | 19.7 | 19.0 | 19.0 | 12.3 | 9.5 | 9.3 | 6.9 | 6.3 |
| Age 35 and Above | 2.9 | 3.9 | 2.6 | 1.8 | 2.4 | 2.0 | 2.3 | 2.0 |
| Binge Alcohol Use | ||||||||
| Age 18 - 25 | NA | NA | 34.4 | 28.2 | 29.5 | 29.9 | 33.6 | 32.0 |
| Age 26 - 34 | NA | NA | 27.5 | 19.7 | 21.1 | 22.8 | 24.0 | 22.8 |
| Age 35 and Above | NA | NA | 12.9 | 9.7 | 8.0 | 9.0 | 11.8 | 11.3 |
| Heavy Alcohol Use | ||||||||
| Age 18 - 25 | NA | NA | 13.8 | 12.0 | 14.9 | 15.1 | 13.2 | 12.9 |
| Age 26 - 34 | NA | NA | 11.5 | 7.1 | 8.2 | 8.5 | 8.0 | 7.1 |
| Age 35 and Above | NA | NA | 5.2 | 4.0 | 3.7 | 3.9 | 4.8 | 3.8 |
Note: Cocaine and marijuana use is defined as use during the past month. "Binge" Alcohol Use is defined as drinking five or more drinks on the same occasion on at least one day in the past 30 days. "Occasion" means at the same time or within a couple hours of each other. Heavy Alcohol Use is defined as drinking five or more drinks on the same occasion on each of five or more days in the past 30 days; all Heavy Alcohol Users are also "Binge" Alcohol Users. Data for 1996 are preliminary.
Source: U.S. Department of Health and Human Services, Substance Abuse and Mental Health Services Administration, 1996 National Household Survey on Drug Abuse: Preliminary Estimates, 1997.
Employment and Work-Related Risk Factor 6. Children's Health Conditions
Table WORK 6. Selected Chronic Health Conditions per 1,000 Children Age 0 to 17, 1984 - 1994
| 1984 | 1987 | 1990 | 1992 | 1993 | 1994 | |
|---|---|---|---|---|---|---|
| Respiratory Conditions | ||||||
| Chronic Bronchitis | 50 | 62 | 53 | 54 | 59 | 55 |
| Chronic Sinusitis | 47 | 58 | 57 | 69 | 80 | 65 |
| Asthma | 43 | 53 | 58 | 63 | 72 | 69 |
| Chronic Diseases of Tonsils or Adenoids | 34 | 30 | 23 | 28 | 26 | 23 |
| Impairments | ||||||
| Deformity or Orthopedic Impairment | 35 | 36 | 29 | 33 | 29 | 28 |
| Speech Impairment | 16 | 19 | 14 | 21 | 20 | 21 |
| Hearing Impairment | 24 | 16 | 21 | 15 | 17 | 18 |
| Visual Impairment | 9 | 10 | 9 | 10 | 7 | 9 |
| Other Conditions | ||||||
| Heart Disease | 23 | 22 | 29 | 29 | 20 | 18 |
| Anemia | 11 | 8 | 10 | 11 | 9 | 12 |
| Epilepsy | 7 | 4 | 4 | 3 | 5 | 5 |
Source: U.S. Department of Health and Human Services, Office of the Assistant Secretary for Planning and Evaluation, Trends in the Well-Being of America's Children and Youth: 1997. Table HC 2.4.
- Respiratory conditions were the most prevalent chronic health conditions experienced by children age 0 to 17 throughout the time period, especially asthma. In 1994, 69 children per thousand had asthma. This is up from 43 children per thousand in 1984.
- Fewer children age 0 to 17 had a visual impairment compared to other impairments in each year.
- In 1994, 18 children per thousand had heart disease. This is down from 29 children per thousand in 1990 and 1992.
Employment and Work-Related Risk Factor 7. Child Care Expenditures
Proportion of total family income spent on child care in families with employed mothers is an important dimension of the risk of dependency.
Figure WORK 7. Percent of Monthly Income Spent on Child Care for Preschoolers by Families with Employed Mothers, 1993
- Poor families with employed mothers of preschoolers spent a much larger percentage of their monthly family income on child care, relative to non-poor families with employed mothers (18 percent compared to 7 percent).
- As shown in Table WORK 7, employed single mothers (no husband present) spent a larger percentage of their monthly family income on child care expenses than did employed married mothers.
- Table WORK 7 shows that employed mothers who received assistance from AFDC, WIC or Food Stamps spent a larger percentage of their total monthly family income on child care relative to non-recipients (13 percent compared to 7 percent). Of recipients, those that received AFDC spent the largest percent of their monthly family income on child care.
Table WORK 7. Percent of Monthly Income Spent on Child Care for Preschoolers by Families with Employed Mothers, 1993
| Category | Percent |
|---|---|
| All Families | 7.6 |
| Racial Categories | |
| Non-Hispanic White | 7.4 |
| Non-Hispanic Black | 8.5 |
| Hispanic | 9.0 |
| Marital Status | |
| Married, Husband Present | 7.0 |
| Widowed, Separated, Divorced | 12.3 |
| Never Married | 12.5 |
| Poverty Status | |
| Poor | 17.7 |
| Non-Poor | 7.3 |
| Program Participation | |
| Recipient | 12.8 |
| AFDC | 17.1 |
| WIC | 12.3 |
| Food Stamps | 14.6 |
| Non-Recipient | 7.3 |
Note: Non-recipients are those in families not receiving AFDC, general assistance, Food Stamps or WIC.
Source: U.S. Bureau of the Census, "What Does It Cost to Mind Our Preschoolers," Current Population Reports, Series P70-52, 1995.
Employment and Work-related Risk Factor 8. Educational Attainment
Completed schooling is one measure of job-skill level. Individuals with no more than a high school education have the lowest amount of human capital and are at the greatest risk of becoming poor despite their work effort. This risk factor tracks the trend in educational attainment.
Figure WORK 8. Percent of Adults Age 25 and over by Level of Educational Attainment
- Since 1970 there has been a marked decline in the percentage of the population with less than a high school education, dropping from 45 percent in 1970 to 20 percent in 1993.
- The percentage of the population completing four or more years of college doubled from 1970 to 1993, rising steadily from 11 to 22 percent.
- The percentage of the population receiving a high school education but with no subsequent college fluctuated only slightly from 1970 until 1993.
- Since 1970 there has been a consistent increase in the percentage of the population with one to three years of college rising from 11 to 18 percent.
Table WORK 8. Percent of Adults Age 25 and over by Level of Educational Attainment
| 1970 | 1975 | 1980 | 1985 | 1990 | 1991 | 1992 | 1993 | |
|---|---|---|---|---|---|---|---|---|
| Less than High School | 45 | 37 | 31 | 26 | 22 | 22 | 21 | 20 |
| Finished High School, No College | 34 | 36 | 37 | 38 | 38 | 39 | 36 | 35 |
| One to Three Years of College | 10 | 12 | 15 | 16 | 18 | 18 | 22 | 23 |
| Four or More Years of College | 11 | 14 | 17 | 19 | 21 | 21 | 21 | 22 |
Note: Completing the GED is not considered completing high school within this table. Beginning with data for 1992, a new question results in different categories than for earlier years. Data shown as 'High School, 4 years' is now collected by the category 'High School Graduate.' Data shown as 'College 1 to 3 years,' is now collected by 'Some College;' and two 'Associate Degree' categories. Data shown as 'College 4 years or more,' is now collected by the categories, 'Bachelor's Degree; Master's Degree;' 'Doctorate Degree;' 'Professional Degree.'
Source: U.S. Bureau of the Census, "Educational Attainment in the United States: March 1993 and 1992," Current Population Reports, Series P20-476, 1994.
Employment and Work-Related Risk Factor 9. High-School Dropout Rates
Although some teens who drop out of high school eventually graduate or obtain GEDS, dropout rates are reliable risk factors associated with teen problem behavior and future economic problems.
Figure WORK 9. Percent of Students Enrolled in Grades 10 to 12 in the Previous Year who were not Enrolled and had not Graduated in the Survey Year
- Drop-out rates peaked in 1980 but declined over the next decade. After 1990, trends for white teens and all teens increased slightly, while trends for Hispanic and black teens increased more unevenly.
- The high school drop-out rate was highest for Hispanic teens. White teens had a much lower drop-out rate.
Table WORK 9. Percent of Students Enrolled in Grades 10 to 12 in the Previous Year who were not Enrolled and had not Graduated in the Survey Year
| 1975 | 1980 | 1985 | 1990 | 1991 | 1992 | 1993 | 1994 | |
|---|---|---|---|---|---|---|---|---|
| Total | 5.8 | 6.1 | 5.2 | 4.0 | 4.0 | 4.4 | 4.5 | 5.3 |
| White | 5.0 | 5.2 | 4.3 | 3.3 | 3.2 | 3.7 | 3.9 | 4.2 |
| Black | 8.7 | 8.2 | 7.8 | 5.0 | 6.0 | 5.0 | 5.8 | 6.6 |
| Hispanic | 10.9 | 11.7 | 9.8 | 7.9 | 7.3 | 8.2 | 6.7 | 10.0 |
Source: U.S. Department of Health and Human Services, Office of the Assistant Secretary for Planning and Evaluation, Trends in the Well-Being of America's Children and Youth: 1997. Table EA 1.4.
Teen Behavior Risk Factor 1. Percent of Births to Unmarried Women Within Age Groups
This risk factor shows the percent of all births, within each age group, that are to unmarried women.
Figure Teen 1. Percent of Births that are to Unmaried Women Within Age Groups
- The percent of children born outside of marriage is affected by several factors: the rate at which women marry, the rate at which unmarried women have children, and the rate at which married women have children.
- While the percent of births within each age group that are to unmarried women has been increasing for many years, it has recently leveled off. Although the percent of births within each group that are to unmarried women decreased in 1995 and then increased in 1996, these changes were small. This is true for both adult and teen women, as well as for black and white women. See Appendix D for data on the percent of births within each age group that are to unmarried women by race.
- As Table TEEN 1 shows, the percent of children born outside of marriage remains relatively high. Among teens, over three-quarters of children were born outside of marriage in 1996, compared to just over one-tenth in 1940. Among all women, nearly one-third of children were born outside of marriage, compared to 4 percent in 1940.
Table TEEN 1. Percent of Births that are to Unmarried Women Within Age Groups
| Year | Under 15 | 15-17 Yrs | 18-19 Yrs | All Teens | All Women |
|---|---|---|---|---|---|
| 1940 | 64.5 | NA | NA | 14.0 | 3.8 |
| 1941 | 64.1 | NA | NA | 14.2 | 3.8 |
| 1942 | 64.5 | NA | NA | 13.2 | 3.4 |
| 1943 | 64.2 | NA | NA | 13.4 | 3.3 |
| 1944 | 64.5 | NA | NA | 15.7 | 3.8 |
| 1945 | 70.0 | NA | NA | 18.2 | 4.3 |
| 1946 | 66.4 | NA | NA | 15.7 | 3.8 |
| 1947 | 65.1 | NA | NA | 13.0 | 3.6 |
| 1948 | 61.4 | 20.8 | 8.5 | 12.7 | 3.7 |
| 1949 | 61.8 | 21.1 | 8.6 | 12.9 | 3.7 |
| 1950 | 63.7 | 22.6 | 9.4 | 13.9 | 4.0 |
| 1951 | 62.9 | 21.8 | 9.1 | 13.5 | 3.9 |
| 1952 | 63.6 | 22.8 | 9.2 | 14.0 | 3.9 |
| 1953 | 64.0 | 22.3 | 9.6 | 14.1 | 4.1 |
| 1954 | 64.4 | 23.2 | 10.1 | 14.7 | 4.4 |
| 1955 | 66.3 | 23.2 | 10.3 | 14.9 | 4.5 |
| 1956 | 66.1 | 23.0 | 10.0 | 14.6 | 4.6 |
| 1957 | 66.1 | 23.1 | 9.8 | 14.5 | 4.7 |
| 1958 | 66.2 | 23.3 | 10.3 | 14.9 | 5.0 |
| 1959 | 67.9 | 24.2 | 10.6 | 15.4 | 5.2 |
| 1960 | 67.8 | 24.0 | 10.7 | 15.4 | 5.3 |
| 1961 | 69.7 | 25.3 | 11.3 | 16.2 | 5.6 |
| 1962 | 69.5 | 26.7 | 11.3 | 16.4 | 5.9 |
| 1963 | 71.1 | 28.2 | 12.5 | 18.0 | 6.3 |
| 1964 | 74.2 | 29.9 | 13.5 | 19.7 | 6.8 |
| 1965 | 78.5 | 32.8 | 15.3 | 21.6 | 7.7 |
| 1966 | 76.3 | 35.3 | 16.1 | 22.6 | 8.4 |
| 1967 | 80.3 | 37.7 | 18.0 | 25.0 | 9.0 |
| 1968 | 81.0 | 40.4 | 20.1 | 27.6 | 9.7 |
| 1969 | 79.3 | 41.3 | 21.1 | 28.7 | 10.0 |
| 1970 | 80.8 | 43.0 | 22.4 | 30.5 | 10.7 |
| 1971 | 82.1 | 44.5 | 23.2 | 31.8 | 11.3 |
| 1972 | 81.9 | 45.9 | 24.7 | 33.8 | 12.4 |
| 1973 | 84.8 | 46.7 | 25.6 | 35.0 | 13.0 |
| 1974 | 84.6 | 48.3 | 27.0 | 36.4 | 13.2 |
| 1975 | 87.0 | 51.4 | 29.8 | 39.3 | 14.2 |
| 1976 | 86.4 | 54.0 | 31.6 | 41.2 | 14.8 |
| 1977 | 88.2 | 56.6 | 34.4 | 43.8 | 15.5 |
| 1978 | 87.3 | 57.5 | 36.2 | 44.9 | 16.3 |
| 1979 | 88.8 | 60.0 | 38.1 | 46.9 | 17.1 |
| 1980 | 88.7 | 61.5 | 39.8 | 48.3 | 18.4 |
| 1981 | 89.2 | 63.3 | 41.4 | 49.9 | 18.9 |
| 1982 | 89.2 | 65.0 | 43.0 | 51.4 | 19.4 |
| 1983 | 90.4 | 67.5 | 45.7 | 54.1 | 20.3 |
| 1984 | 91.1 | 69.2 | 48.1 | 56.3 | 21.0 |
| 1985 | 91.8 | 70.9 | 50.7 | 58.7 | 22.0 |
| 1986 | 92.5 | 73.3 | 53.6 | 61.5 | 23.4 |
| 1987 | 92.9 | 75.8 | 56.0 | 64.0 | 24.5 |
| 1988 | 93.6 | 77.1 | 58.5 | 65.9 | 25.7 |
| 1989 | 92.4 | 77.7 | 60.4 | 67.2 | 27.1 |
| 1990 | 91.6 | 77.7 | 61.3 | 67.6 | 28.0 |
| 1991 | 91.3 | 78.7 | 63.2 | 69.3 | 29.5 |
| 1992 | 91.3 | 79.2 | 64.6 | 70.5 | 30.1 |
| 1993 | 91.3 | 79.9 | 66.1 | 71.8 | 31.0 |
| 1994 | 94.5 | 84.1 | 70.0 | 75.9 | 32.6 |
| 1995 | 93.5 | 83.7 | 69.8 | 75.6 | 32.2 |
| 1996 | 94.0 | 84.5 | 70.9 | 76.4 | 32.4 |
Notes: Births to unmarried women in the United States for 1940 - 1979 are estimated from data for registration areas in which marital status of the mother was reported; see sources below. Beginning in 1980, births to unmarried women in the United States are based on data from states reporting marital status directly and data from nonreporting states for which marital status was inferred from other information on the birth certificate; see sources below. Data for 1996 are preliminary.
Sources: U. S. Department of Health and Human Services, National Center for Health Statistics, "Births to Unmarried Mothers: United States, 1980 - 1992," Vital and Health Statistics, Series 21, No. 53, 1995 and U.S. Department of Health and Human Services, National Center for Health Statistics, "Report of Final Natality Statistics, 1995," Monthly Vital Statistics Report, Vol. 45, No. 11, Supplement, 1997.
Teen Behavior Risk Factor 2. Percent of All Births to Unmarried Teens
This risk factor shows the percent of total births that are to unmarried teen mothers each year.
Figure TEEN 2. Percent of All Births that are to Unmarried Teens Age 15 to 19
- The percent of all births that are to unmarried teens is affected by several different factors: the age distribution of the population, the marriage rate among teens, the birth rate among unmarried teens, and the birth rate among all other women.
- The percent of all births that were to unmarried teens leveled off over the last three years for both white and black women.
- Between 1970 and 1994, the percent of all births that were to unmarried teens had been increasing steadily among white women.
- Among black women, the percent of all births that were to unmarried teens varied greatly during the same period, peaking in 1975, then falling until the early 1990s. The sharp increase in the percent for black women in the early 1970s reflects a rise in nonmarital teen births concurrent with a decline in total black births.
Table TEEN 2. Percent of All Births that are to Unmarried Teens Age 15 to 19
| Year | All Races | White | Black |
|---|---|---|---|
| 1940 | 1.7 | 0.8 | NA |
| 1941 | 1.7 | 0.7 | NA |
| 1942 | 1.5 | 0.7 | NA |
| 1943 | 1.5 | 0.6 | NA |
| 1944 | 1.6 | 0.8 | NA |
| 1945 | 1.8 | 0.8 | NA |
| 1946 | 1.5 | 0.7 | NA |
| 1947 | 1.4 | 0.7 | NA |
| 1948 | 1.5 | 0.7 | NA |
| 1949 | 1.5 | 0.6 | NA |
| 1950 | 1.6 | 0.6 | NA |
| 1951 | 1.5 | 0.6 | NA |
| 1952 | 1.5 | 0.6 | NA |
| 1953 | 1.6 | 0.6 | NA |
| 1954 | 1.7 | 0.7 | NA |
| 1955 | 1.7 | 0.7 | NA |
| 1956 | 1.7 | 0.7 | NA |
| 1957 | 1.8 | 0.7 | NA |
| 1958 | 1.9 | 0.8 | NA |
| 1959 | 2.0 | 0.9 | NA |
| 1960 | 2.0 | 0.9 | NA |
| 1961 | 2.2 | 1.0 | NA |
| 1962 | 2.3 | 1.1 | NA |
| 1963 | 2.5 | 1.2 | NA |
| 1964 | 2.8 | 1.3 | NA |
| 1965 | 3.3 | 1.6 | NA |
| 1966 | 3.8 | 1.9 | NA |
| 1967 | 4.1 | 2.1 | NA |
| 1968 | 4.5 | 2.3 | NA |
| 1969 | 4.7 | 2.4 | 17.5 |
| 1970 | 5.1 | 2.6 | 18.8 |
| 1971 | 5.5 | 2.6 | 20.3 |
| 1972 | 6.2 | 3.0 | 22.6 |
| 1973 | 6.5 | 3.2 | 23.4 |
| 1974 | 6.7 | 3.3 | 23.9 |
| 1975 | 7.1 | 3.7 | 24.2 |
| 1976 | 7.1 | 3.8 | 23.8 |
| 1977 | 7.2 | 4.0 | 23.4 |
| 1978 | 7.2 | 4.0 | 22.7 |
| 1979 | 7.2 | 4.1 | 22.5 |
| 1980 | 7.3 | 4.4 | 22.2 |
| 1981 | 7.1 | 4.5 | 21.5 |
| 1982 | 7.1 | 4.5 | 21.2 |
| 1983 | 7.2 | 4.6 | 21.2 |
| 1984 | 7.1 | 4.6 | 20.7 |
| 1985 | 7.2 | 4.8 | 20.3 |
| 1986 | 7.5 | 5.1 | 20.1 |
| 1987 | 7.7 | 5.3 | 20.0 |
| 1988 | 8.0 | 5.6 | 20.3 |
| 1989 | 8.3 | 5.9 | 18.6 |
| 1990 | 8.4 | 6.1 | 18.3 |
| 1991 | 8.7 | 6.4 | 18.1 |
| 1992 | 8.7 | 6.5 | 20.2 |
| 1993 | 8.9 | 6.8 | 20.2 |
| 1994 | 9.7 | 7.5 | 21.1 |
| 1995 | 9.6 | 7.6 | 21.1 |
| 1996 | 9.6 | 7.7 | 21.0 |
Notes: Births to unmarried women in the United States for 1940 - 1979 are estimated from data for registration areas in which marital status of the mother was reported; see sources below. Beginning in 1980, births to unmarried women in the United States are based on data from states reporting marital status directly and data from nonreporting states for which marital status was inferred from other information on the birth certificate; see sources below. Beginning in 1980, data are tabulated by race of the mother. Prior to 1980, data are tabulated by race of the child; see sources below. Data for 1996 are preliminary.
Sources: U. S. Department of Health and Human Services, National Center for Health Statistics, "Births to Unmarried Mothers: United States, 1980 - 1992," Vital and Health Statistics, Series 21, No. 53, 1995 and U.S. Department of Health and Human Services, National Center for Health Statistics, "Report of Final Natality Statistics, 1995," Monthly Vital Statistics Report, Vol. 45, No. 11, Supplement, 1997.
Teen Behavior Risk Factor 3. Unmarried Teen Birth Rates Within Age Groups
This indicator tracks trends in the number of births per 1,000 unmarried teen women within specific age groups.
Figure TEEN 3a. Births per 1,000 Unmarried Teens Age 15 to 17
Figure TEEN 3b. Births per 1,000 Unmarried Teens Age 18 to 19
- The birth rate per 1,000 single teens fell between 1994 and 1995 for both black and white teens in the 15 to 17 and 18 to 19 age groups, with the largest relative decline among black teens age 15 to 17.
- Prior to 1994, birth rates among single white teens in both age groups rose steadily for nearly three decades.
- Among single black teens in both age groups, birth rates varied greatly over the period, peaking in 1991, and falling thereafter. Rates for both age groups were lower in 1995 than in 1970.
Table TEEN 3. Births per 1,000 Unmarried Teen Women Within Age Groups
| Total Age 15 - 17 |
White Age 15 - 17 |
Black Age 15 - 17 |
Total Age 18 - 19 |
White Age 18 - 19 |
Black Age 18 - 19 |
|
|---|---|---|---|---|---|---|
| 1966 | 13.1 | 5.4 | NA | 25.6 | 14.1 | NA |
| 1967 | 13.8 | 5.6 | NA | 27.6 | 15.3 | NA |
| 1968 | 14.7 | 6.2 | NA | 29.6 | 16.6 | NA |
| 1969 | 15.2 | 6.6 | 72.0 | 30.8 | 16.6 | 128.4 |
| 1970 | 17.1 | 7.5 | 77.9 | 32.9 | 17.6 | 136.4 |
| 1971 | 17.5 | 7.4 | 80.7 | 31.7 | 15.8 | 135.2 |
| 1972 | 18.5 | 8.0 | 82.8 | 30.9 | 15.1 | 128.2 |
| 1973 | 18.7 | 8.4 | 81.2 | 30.4 | 14.9 | 120.5 |
| 1974 | 18.8 | 8.8 | 78.6 | 31.2 | 15.3 | 122.2 |
| 1975 | 19.3 | 9.6 | 76.8 | 32.5 | 16.5 | 123.8 |
| 1976 | 19.0 | 9.7 | 73.5 | 32.1 | 16.9 | 117.9 |
| 1977 | 19.8 | 10.5 | 73.0 | 34.6 | 18.7 | 121.7 |
| 1978 | 19.1 | 10.3 | 68.8 | 35.1 | 19.3 | 119.6 |
| 1979 | 19.9 | 10.8 | 71.0 | 37.2 | 21.0 | 123.3 |
| 1980 | 20.6 | 12.0 | 68.8 | 39.0 | 24.1 | 118.2 |
| 1981 | 20.9 | 12.6 | 65.9 | 39.0 | 24.6 | 114.2 |
| 1982 | 21.5 | 13.1 | 66.3 | 39.6 | 25.3 | 112.7 |
| 1983 | 22.0 | 13.6 | 66.8 | 40.7 | 26.4 | 111.9 |
| 1984 | 21.9 | 13.7 | 66.5 | 42.5 | 27.9 | 113.6 |
| 1985 | 22.4 | 14.5 | 66.8 | 45.9 | 31.2 | 117.9 |
| 1986 | 22.8 | 14.9 | 67.0 | 48.0 | 33.5 | 121.1 |
| 1987 | 24.5 | 16.2 | 69.9 | 48.9 | 34.5 | 123.0 |
| 1988 | 26.4 | 17.6 | 73.5 | 51.5 | 36.8 | 130.5 |
| 1989 | 28.7 | 19.3 | 78.9 | 56.0 | 40.2 | 140.9 |
| 1990 | 29.6 | 20.4 | 78.8 | 60.7 | 44.9 | 143.7 |
| 1991 | 30.9 | 21.8 | 80.4 | 65.7 | 49.6 | 148.7 |
| 1992 | 30.4 | 21.6 | 78.0 | 67.3 | 51.5 | 147.8 |
| 1993 | 30.6 | 22.1 | 76.8 | 66.9 | 52.4 | 141.6 |
| 1994 | 32.0 | 24.1 | 75.1 | 70.1 | 56.4 | 141.6 |
| 1995 | 30.5 | 23.6 | 68.6 | 67.6 | 55.4 | 131.2 |
Note: Rates are per 1,000 unmarried women in specified group; rates prior to 1980 are estimated. Births to unmarried women in the United States for 1940 - 1979 are estimated from data for registration areas in which marital status of the mother was reported; see sources below. Beginning in 1980, births to unmarried women in the United States are based on data from states reporting marital status directly and data from nonreporting states for which marital status was inferred from other information on the birth certificate; see sources below. Beginning in 1980, data are tabulated by race of the mother. Prior to 1980, data are tabulated by the race of the child; see sources below. Rates for 1981 - 1989 have been revised and differ, therefore, from rates published in Vital Statistics in the United States,Vol. 1, Natality, for 1991 and earlier years.
Sources: U. S. Department of Health and Human Services, National Center for Health Statistics, "Births to Unmarried Mothers: United States, 1980 - 1992," Vital and Health Statistics, Series 21, No. 53, 1995 and U.S. Department of Health and Human Services, National Center for Health Statistics, "Report of Final Natality Statistics, 1995," Monthly Vital Statistics Report, Vol. 45, No. 11, Supplement, 1997.
Teen Behavior Risk Factor 4. Early Sexual Intercourse
Early sexual intercourse is a strong predictor of subsequent childbearing at an early age which increases the risk of dependence.
Figure TEEN 4. Percentage of High School Students Grade 9 to 12 who Reported Ever Having Sexual Intercourse by Grade, 1995

- The percentage of high school students who reported ever having sexual intercourse increased with each grade, reaching about two-thirds for 12th grade students.
- There is little difference between the percentages for males and females, particularly after grade 9.
- Table TEEN 4 shows that approximately half of all high school students reported ever having sexual intercourse.
- As shown in Table TEEN 4, in 1995, non-Hispanic black high school students (73 percent) were more likely to have ever had sexual intercourse than non-Hispanic white students (49 percent) or Hispanic students (58 percent).
Table TEEN 4. Percentage of High School Students Grades 9 to 12 who Reported Ever Having Sexual Intercourse by Gender, Grade and Race, 1995
| Total | Male | Female | |
|---|---|---|---|
| Total | 53 | 54 | 52 |
| Grade | |||
| 9 | 37 | 41 | 32 |
| 10 | 48 | 50 | 46 |
| 11 | 59 | 57 | 60 |
| 12 | 66 | 67 | 66 |
| Racial Categories | |||
| Non-Hispanic White | 49 | 49 | 49 |
| Non-Hispanic Black | 73 | 81 | 67 |
| Hispanic | 58 | 62 | 53 |
Source: U.S. Department of Health and Human Services, Office of the Assistant Secretary for Planning and Evaluation, Trends in the Well-Being of America's Children and Youth: 1997. Table SD 4.1.A.
Teen Behavior Risk Factor 5. Never-married Family Status
This measure complements the measures of nonmarital births by showing the "stock" of children living with never-married women. Children living with never-married women are at increased risk of dependence.
- The percent of children living with never-married women increased from 1984 to 1995 for all race groups. A larger percentage of black children lived in families headed by never-married women compared to other groups; the percentage for black children was almost three times higher than that for Hispanic children in 1995.
- As shown in Table TEEN 5, the percentage of black and Hispanic children living in families headed by never-married women rose by about 50 percent from 1984 to 1995. Although the percentage of white children living in families headed by never-married women more than doubled (from 2 to 4 percent) over the same time period, the percentage for white children was significantly lower than for children in other racial groups.
Table TEEN 5. Percent of All Children Living in Families Headed by Never-Married Women
| Year | All | White | Black | Hispanic |
|---|---|---|---|---|
| 1984 | 5.2 | 1.9 | 23.9 | 6.5 |
| 1986 | 5.9 | 2.4 | 26.6 | 7.2 |
| 1988 | 7.0 | 3.0 | 30.4 | 9.2 |
| 1990 | 7.0 | 3.0 | 29.6 | 8.7 |
| 1992 | 8.4 | 3.9 | 33.1 | 10.3 |
| 1994 | 9.0 | 4.5 | 32.9 | 12.0 |
| 1995 | 8.7 | 4.3 | 32.3 | 10.8 |
Note: Data are for all children under 18 who are not family heads.
Source: U.S. Bureau of the Census, "Marital Status and Living Arrangements," Current Population Reports, Series P20-399, 418, 433, 450, 468, 484 and 491, various years.
Teen Behavior Risk Factor 6. Detached Youth
Teens who are neither in school nor working are likely to be at significant risk of dependence.
Table TEEN 6. Percentage of Youth Age 16 to 19 who are Neither in School nor Working
| 1975 | 1980 | 1985 | 1990 | 1991 | 1992 | 1993 | 1994 | |
|---|---|---|---|---|---|---|---|---|
| Percent Age 16 - 19 Not in School and Not Working | 12 | 11 | 11 | 10 | 10 | 10 | 9 | 10 |
Source: U.S. Department of Health and Human Services, Office of the Assistant Secretary for Planning and Evaluation, Trends in the Well-Being of America's Children and Youth: 1997. Table ES 3.6.
- In 1975, 12 percent of youth age 16 to 19 were not in school and not working. This percentage gradually declined from 1975 (12 percent) to 1990 (10 percent) and remained fairly stable between 1990 to 1994.
Teen Behavior Risk Factor 7. Teen Alcohol and Suns Tance Abuse
Teen alcohol and substance abuse are important examples of teen problem behavior and may increase the risk of dependence.
Figure TEEN 7. Percent of Teens Age 12 to 17 who used Cocaine, Marijuana or Alcohol
- Both binge and heavy alcohol use declined throughout most of the period, with binge use declining from 22 percent in 1985 to 7 percent in 1996.
- As shown in Figure TEEN 7, marijuana use among teens declined fairly continuously from 1979 to 1992, then rose sharply from 1993 to 1995, before declining slightly in 1996.
- As shown in Table TEEN 7, Cocaine use, though still only half of the lowest level in the 1980s, doubled from 1994 to 1996.
Table TEEN 7. Percent of Teens Age 12 to 17 who used Cocaine, Marijuana or Alcohol, Selected Years
| 1979 | 1982 | 1985 | 1988 | 1990 | 1992 | 1994 | 1996 | |
|---|---|---|---|---|---|---|---|---|
| Cocaine | 1.5 | 1.9 | 1.5 | 1.2 | 0.6 | 0.3 | 0.3 | 0.6 |
| Marijuana | 14.2 | 9.9 | 10.2 | 5.4 | 4.4 | 3.4 | 6.0 | 7.1 |
| Binge | NA | NA | 21.9 | 15.1 | 15.4 | 10.0 | 8.3 | 7.2 |
| Heavy | NA | NA | 9.5 | 4.0 | 4.4 | 3.4 | 2.5 | 2.9 |
Note: Cocaine and marijuana use is defined as use during the past month. "Binge" Alcohol Use is defined as drinking five or more drinks on the same occasion on at least one day in the past 30 days. "Occasion" means at the same time or within a couple hours of each other. Heavy Alcohol Use is defined as drinking five or more drinks on the same occasion on each of five or more days in the past 30 days; all Heavy Alcohol Users are also "Binge" Alcohol Users. Figure TEEN 7 contains data for all years between 1979 and 1996 though only selected years are shown in the table.
Source: U.S. Department of Health and Human Services, Substance Abuse and Mental Health Services Administration, 1996 National Household Survey on Drug Abuse: Preliminary Estimates, 1997.
Teen Behavior 8. Teen Violent Crime Arrests
Teen crime data indicate serious adolescent problem behavior and may predict future dependence.
Figure TEEN 8. Arrest Rates for Violent Crime for Youth Age 15 to 18, 1965 - 1994 (per 100,000 Teens)
- Violent crime arrest rates for youth age 15 were lower than the rates for older teens and this differential was much larger in 1994 than it was in 1965.
- As shown in Table TEEN 8, arrest rates for violent crime for all youth age 10 to 18 increased substantially from 1965 to 1980 (from 58 to 163 per 100,000 teens). The arrest rate dropped to 139 per 100,000 teens in 1985 and rose again to 195 per 100,000 teens in 1991. After declining somewhat in 1992, the arrest rate again increased to 231 arrests per 100,000 teens in 1994.
- Table TEEN 8 shows that violent crime arrest rates increased for both white and non-white youth during this period, however, the arrest rates for non-white youth fluctuated more over the time period and were substantially higher in all years.
- Table TEEN 8 also shows that, as expected, violent crime arrest rates were consistently much higher among males than among females for all ages over the time period.
Table TEEN 8. Arrest Rates for Violent Crime for Youth Age 10 to 18, 1965 - 1994 (per 100,000 Teens)
| 1965 | 1970 | 1975 | 1980 | 1985 | 1990 | 1991 | 1992 | 1993 | 1994 | |
|---|---|---|---|---|---|---|---|---|---|---|
| All Persons | 58 | 101 | 136 | 163 | 139 | 184 | 195 | 188 | 220 | 231 |
| Racial Categories | ||||||||||
| White | 24 | 42 | 79 | 92 | 77 | 108 | 121 | 126 | 130 | 138 |
| Non-White | 259 | 436 | 431 | 492 | 400 | 488 | 486 | 534 | 568 | 584 |
| Age Categories | ||||||||||
| Age 10 - 12 | NA | NA | NA | 47 | 56 | 71 | 77 | 81 | 86 | 92 |
| Age 13 - 14 | 139 | 207 | 250 | 262 | 252 | 369 | 397 | 420 | 461 | 493 |
| Age 15 | 245 | 364 | 483 | 505 | 446 | 670 | 720 | 725 | 829 | 858 |
| Age 16 | 304 | 459 | 616 | 638 | 568 | 879 | 925 | 940 | 1031 | 1058 |
| Age 17 | 305 | 519 | 663 | 739 | 662 | 986 | 1041 | 1001 | 1115 | 1119 |
| Age 18 | 338 | 571 | 713 | 746 | 661 | 1023 | 1108 | 1092 | 1149 | 1167 |
| Male | ||||||||||
| Age 10 - 12 | NA | NA | NA | 82 | 99 | 119 | 130 | 137 | 144 | 153 |
| Age 13 - 14 | 242 | 351 | 420 | 446 | 424 | 602 | 652 | 681 | 740 | 788 |
| Age 15 | 442 | 644 | 832 | 877 | 769 | 1137 | 1222 | 1210 | 1379 | 2414 |
| Age 16 | 564 | 838 | 1102 | 1130 | 999 | 1525 | 1604 | 1621 | 1764 | 1798 |
| Age 17 | 572 | 957 | 1201 | 1322 | 1180 | 1745 | 1841 | 1757 | 1944 | 1939 |
| Age 18 | 638 | 1065 | 1299 | 1350 | 1194 | 1840 | 1996 | 1944 | 2038 | 2042 |
| Female | ||||||||||
| Age 10 - 12 | NA | NA | NA | 10 | 12 | 19 | 20 | 23 | 25 | 27 |
| Age 13 - 14 | 32 | 57 | 72 | 70 | 71 | 123 | 130 | 145 | 167 | 183 |
| Age 15 | 40 | 73 | 119 | 117 | 108 | 177 | 192 | 214 | 249 | 272 |
| Age 16 | 36 | 67 | 114 | 125 | 118 | 193 | 204 | 217 | 253 | 275 |
| Age 17 | 30 | 66 | 105 | 130 | 118 | 179 | 188 | 195 | 233 | 247 |
| Age 18 | 37 | 72 | 113 | 125 | 114 | 164 | 176 | 197 | 214 | 249 |
Note: Violent crime is the sum of murder, forcible rape, robbery and aggravated assault. Rates refer to the number of arrests made per 100,000 inhabitants belonging to the prescribed age group.
Source: U.S. Department of Health and Human Services, Office of the Assistant Secretary for Planning and Evaluation, Trends in the Well-Being of America's Children and Youth: 1997. Table SD 1.6.
Chapter IV. Data Needs
The Welfare Indicators Act of 1994 declared that its purpose was "to provide the public with generally accepted measures of welfare receipt so that it can track such receipt over time and determine whether progress is being made in reducing the rate at which and, to the extent feasible, the degree to which, families depend on income from welfare programs and the duration of welfare receipt." One of the tasks assigned to the Department of Health and Human Services in carrying out this requirement was to assess the data needed to report annually on welfare indicators and predictors and the ability of existing data collection efforts to provide such data. With the one exception noted below, whether existing data collection efforts would have been able to provide such data for the AFDC program was made a moot point by enactment of the Personal Responsibility and Work Opportunity Reconciliation Act of 1996.
Chapter I presented the Advisory Board's proposal for a definition of dependence which is used throughout this report. The proposed definition would include work required to obtain benefits under the category of work activities, and would consider recipients who work to obtain their benefits through either subsidized or unsubsidized work as less "dependent" than recipients who do not work at all. Unfortunately, current data does not permit making this distinction. With the increased emphasis on work under the PRWORA, it will become increasingly important to be able to identify the extent to which welfare benefits are associated with public or private sector work.
More generally, in creating the Temporary Assistance for Needy Families (TANF) block grants, the PRWORA significantly changed the landscape against which the viability of existing data collection efforts is evaluated. The indicators of dependence and predictors or risk factors associated with welfare receipt that are presented in the previous chapters rely on national survey data collected primarily by government agencies and on administrative data collected and reported by state and local administering agencies (except for SSI program data, which is collected by the Social Security Administration). Although existing sources of data on the AFDC, Food Stamp and SSI programs are not without their limitations, the advent of the TANF block grant1 will make the existing data collection efforts that provide the data needed for the Department of Health and Human Services to report annually on the indicators and predictors more difficult and potentially less reliable.
1 Although titles II, IV and VIII of the Personal Responsibility and Work Opportunity Reconciliation Act contain a number of major revisions to the Food Stamp and Supplemental Security Income programs (several of which are highlighted in Appendix A), those changes did not include modification of the funding structure to a block grant or changes in the data collection and reporting requirements.
Administrative Data Issues
Although the abundance of program options presents a challenge to any data collection system, it is clear that the collection and reporting of state data on the nature and amount of assistance provided to eligible families under TANF will be much more valuable and descriptive of welfare receipt than national survey data alone2. The administrative data that is required to be reported on federal TANF assistance is substantial and will be extremely useful in providing information on families who receive TANF assistance. However, it will not be a complete representation of the multi-faceted TANF program that can be meaningfully compared to the AFDC program it replaced.
One of the biggest causes of uncertainty about the viability of data collection efforts to capture TANF program information is the change that took place in the nature of the program. While the AFDC program had always allowed states the flexibility to set eligibility rules, passage of the PRWORA dramatically increased states' ability to create assistance programs designed to meet each state's unique needs. Under TANF, federal block grants are provided to states for use "in any manner reasonably calculated to accomplish the purpose" of the law. Federal TANF funds cannot be used for assistance to families without minor children, to individuals who fail to cooperate in establishing paternity and collecting child support, to families who do not assign child support rights to the state, to teenage parents who do not attend high school or training and live in adult-supervised settings, or for assistance to adults for more than five years. Federal TANF funds can be used for virtually any other purpose that would accomplish the objectives of the block grant.
Under TANF, states are required to maintain a certain level of historic state expenditures, but they are not bound by the same requirements as federal TANF funds as long as the federal and state funds are not co-mingled. Some states may utilize the flexibility provided within TANF to separate the federal TANF dollars from the state maintenance-of-effort (MOE) funds, and operate separate programs with each funding stream. In order to accurately measure dependence, it is critical that future indicators include data that describes both federally-funded TANF assistance and assistance provided with state MOE funds.3
Also, the flexibility provided by TANF will almost certainly increase the variation in the type of assistance received. Assistance to needy families can be provided in cash or through in-kind services such as wage supplements to employers, child care, one-time heating or cooling assistance, individual development accounts, and assistance for qualified aliens. Moreover, as time goes on TANF assistance will likely become more and more associated with performance of some kind of work activity, from work required to obtain benefits to training to subsidized employment and may be provided by the welfare office or an employer. The Advisory Board's proposed definition of dependence discussed in Chapter 1 calls for future reports to distinguish between assistance provided in relation to work and assistance provided unrelated to work. As states more fully develop their TANF programs it will become increasingly important to understand what types of assistance are provided and by whom.
Finally, TANF program parameters and operating rules vary across states, and sometimes within states. These variations are likely to increase as states have an opportunity to further utilize the flexibility provided under TANF. The development of data sources that can illustrate these indicators at the state level will become even more important as the "national" data provided by national surveys further mask the differences across states and present an incomplete picture of welfare receipt in the United States.
It is generally desirable to capture a sufficient level of detailed data about the TANF program and its recipients and benefits to permit the development of AFDC/TANF time series data for tracking several of the indicators and risk factors associated with welfare receipt. In addition to the general desirability, however, the quality and level of detail of TANF data takes on even greater importance in the context of this report's proposed primary indicator of welfare dependence. For purposes of discussion, this report proposes the following definition of the primary indicator of dependence:
A family is dependent on welfare if more than 50 percent of its total income in a one-year period comes from AFDC/TANF, Food Stamps and/or SSI, and this welfare income is not associated with work activities. Welfare dependency is the proportion of all families who are dependent on welfare.
Public debate on any number of fine points of the merits of this definition of welfare dependence will be influenced by the availability of TANF data. Several questions about the proposed definition come immediately to mind:
- What should be considered "income?" Cash or near cash (like food stamps) benefits only? Should the value of services provided to employed recipients and in-kind benefits be counted? Should one-time emergency assistance provided in lieu of a determination of on-going TANF eligibility be counted?
- What work-related activities should be considered? Should working to obtain benefits count as work? Should job skills training be counted? What about education directly related to employment? Should state-funded payments to employers for the purpose of supplementing the wages of employed recipients be counted, or only federally-funded payments?
Regardless of the choices made for this report or whether this proposed definition is ultimately determined to be a useful indicator of welfare dependence, the quality of the public debate will be influenced by the quantity and quality of the available data. Questions about TANF receipt and the proposed dependence definition abound. For instance, who will be considered TANF "recipients?" Will they include families who receive cash benefits only, or will families who receive some cash and some services also be counted? What about families who receive only services? Will "recipients" include only those families who receive federal TANF-funded benefits? If the definition includes families who receive benefits under state-funded programs that count toward the state's TANF MOE requirement, will data on those families also be collected and reported by states? Will TANF data be available to extend the time series on the proposed definition? Will the TANF data distinguish between cash and in-kind benefits? Will the data identify whether work was required to obtain cash benefits? Will the data on participation in work-related activities differentiate between work and training?
These data reporting questions and others like them are being debated for many reasons unrelated to this report. Certainly, the federal government's role in requiring states to collect and report such data in the context of block grants is a major consideration. However, the Welfare Indicators Act was not repealed by the PRWORA, and while it is neither the purpose nor intent of the annual Indicators reports to evaluate the outcomes of welfare reform, these reports continue to be potentially useful tools in tracking the impacts of the PRWORA on AFDC/TANF, Food Stamps, and SSI recipients, and in tracking trends in predictors or risk factors associated with welfare receipt.
2 Most national surveys are not currently designed to provide reliable estimates of state-level data. Those that are representative at the state level can currently only provide reliable estimates for the largest states.
3 Some examples of assistance states are considering providing to eligible families with state funds that qualify as TANF MOE expenditures include: benefits to families after time limits expire, benefits to individuals who are enrolled in 2- or 4-year college education programs, and state-funded food stamp benefits to legal immigrants who are ineligible to participate in the Food Stamp Program as a result of PRWORA.
National Survey Data Issues
It is of critical importance to understand the policy and program context that may surround changes in welfare dependence over time. As noted throughout this report, between-state, within-state and across-time variations are already happening as a result of the PRWORA provisions and are anticipated to become more diverse. Changes are expected in eligibility requirements (both income-and non-income-related), benefit levels and benefit types, work requirements and sanction policies, time limits, family caps and other areas. Within national surveys, reliable indicators of dependence must capture the realities of individual experiences with welfare receipt. While survey data complement administrative data in several ways, surveys present two main drawbacks: (1) most survey data are not currently representative at the state level, and (2) survey data have a significant time lag between the collection of data and the availability of data for analysis. Nonetheless, national survey data are critical for capturing indicators of adult labor force participation, earnings, program participation, fertility and child well-being, as well as complementing caseload data for tracking changes in dependence.
The PRWORA makes it critical that national surveys accurately measure welfare receipt. Under TANF, as discussed above, welfare receipt can take on many forms of assistance, including child care, wage supplements, and vouchers for services. National surveys are neither currently designed to capture this broader range of cash and non-cash assistance nor to estimate the value of noncash services. In addition, the TANF assistance programs replacing AFDC are taking on a proliferation of names across the states and are increasingly being administered by non-government organizations both of which make the measurement of welfare receipt more difficult. Finally, measuring welfare receipt is further complicated by the potential existence of state-funded assistance programs, as discussed above, that are separate from federally-funded state TANF programs.
For purposes of this report, the Survey of Income and Program Participation (SIPP) has been used the most extensively and is considered the most useful survey. Some of its characteristics which make it most useful are its longitudinal design, system of monthly accounting, and detail concerning employment, income and participation in federal income-support and related programs. These features make the SIPP particularly effective for capturing the complexities of program dynamics and many of the indicators and predictors, or risk factors, associated with welfare receipt. Planning is underway for the seven-year extension of the 1992-1993 SIPP panels, or the Survey of Program Dynamics, provided for by the PRWORA.
The Panel Study of Income Dynamics (PSID) is also used in this report, as are the National Longitudinal Survey of Youth (NLSY) and the Current Population Survey (CPS). The CPS measures income and poverty over a single annual accounting period, and provides important information regarding childhood poverty. Both the PSID and NLSY are longer-run surveys that provide vital data for indicators of intra-and inter-generational dependence and deprivation. The PSID and NLSY collect annual income data, including transfer income, that yields inter-generational indicators. While the PSID and the NLSY are critical for obtaining measures of long-term welfare receipt and inter-generational receipt, both surveys have currently moved to biannual data collection which may reduce their usefulness.
As with administrative caseload data, the SIPP and other national surveys could enhance their value for developing indicators of dependence and deprivation in several ways. As discussed above, national survey data must be able to accurately measure both cash and non-cash assistance as well as assistance under both state-funded programs and federally-funded state TANF programs. National surveys are not currently designed to accurately capture this information. Also, the proposed definition of dependence discussed in this report requires data that would distinguish welfare benefits received in conjunction with work from benefits received without work. As current survey data do not include this information, this report was not able to fully illustrate the recommended definition. Surveys must collect such information if future reports are to utilize the proposed definition of dependence.
The value of national survey data would also be improved by gathering more complete and comprehensive retrospective information regarding previous welfare spells. Realistically, surveys cannot completely account for welfare dynamics --no matter how long the observation window or the accounting period, there will always be welfare spells that occurred before the survey began and continue after the survey ended. This makes it all the more important that surveys take precautions to reduce the risk of providing an incomplete picture of lifetime welfare receipt. Retrospective questions regarding prior welfare receipt will help address this concern.
In addition, the PRWORA makes it even more important that national surveys contain questions to determine the factors involved in the ending of a spell during the observation period. As noted above, it is expected that the PRWORA will result in more diversity in the causes of caseload terminations. Cases may be closed due to increased work effort or as a result of sanctions or time limits. Information regarding the precise event that began or ended a welfare spell can provide critical guidance to policy makers in their efforts to reduce dependence and deprivation. Discussions should continue around ways to ensure that information regarding events that begin or end welfare episodes is not lost if the event occurs outside of the observation period.
Despite the need to collect state-level data in order to fully capture information on the dependence status of recipients of means-tested assistance and the current limitations of national surveys to provide reliable state-level estimates, national survey data are of critical importance in efforts to measure and track changes in dependence. Even when the administrative data collection questions discussed earlier in this chapter are resolved, some state data systems have limited capacity for modification and may be unable to provide the necessary data. Unfortunately, current resources for the SIPP and other national surveys may not be sufficient to fill in the existing gaps in administrative data or to compensate for any lacking state data.
Potential Risk Factors for Which Data Do Not Exist
As noted in Chapter III, the predictors/risk factors included in that chapter do not represent an exhaustive list. Rather, they are a sampling of available data that address in some way a family's circumstances on the deprivation/well-being scale. The range of possible risk factors is extremely wide, and until they are measured and analyzed over time, their predictive value will not be known. As the PRWORA changes are implemented, some of the risk factors may turn out to be simply correlates of welfare receipt, some may have a causal relationship, some may be consequences, and some may, in fact, have predictive value.
While the Advisory Board recommended that this first annual report focus on a smaller set of dependence indicators, it also recommended that the report take an expansive view toward predictors and risk factors. Two domains, in particular, were identified as potential risk factors that should be included, but for which data do not exist.
Adult literacy is related to success in the labor market. A risk factor on literacy would illustrate the risk of welfare dependence. Barton and Jenkins (1995) report that a large proportion of the welfare population have weak literacy skills. Unfortunately, a comprehensive survey of adult literacy was conducted in 1992 but has not been repeated since. It would be desirable, although expensive, to measure literacy on a more routine basis.
The physical and mental effects of domestic violence put the victims at serious risk of dependence. The Department of Justice collects data on domestic violence in its Crime Victim Survey, but it is widely believed that this data severely underreports the incidence of domestic violence. Four recent research studies compiled by The Taylor Institute found large and consistently high percentages of women on AFDC currently abused by partners. Although these studies range in methodological rigor, taken together they can begin to assist in better understanding the role that domestic violence plays in poor women's ability to become self-sufficient. The Balanced Budget Act of 1997 requires the General Accounting Office to conduct a study of the effect of family violence on the use of public assistance programs, and in particular the extent to which family violence prolongs or increases the need for public assistance. It would be desirable to collect high quality data on domestic violence on a more routine basis.
Appendix C. Comparison Between 1996 and 1997 Indicators and Predictors
Comparison of Interim Report Indicators and Annual Report Indicators and Risk Factors
Note that the numbers in the first column are the indicators numbers used in the Interim Report.
|
Interim # |
Interim Title |
New # |
New Title |
|---|---|---|---|
|
A.1 |
Percent of the population receiving means-tested assistance |
INDICATOR 9 |
Percent of the Population Receiving Means-Tested Assistance |
|
A.2 |
Caseload characteristics |
Table A-6 and Figure A-4 Table A-16 and Figure A-5 Figures A-6 and A-7 |
AFDC Caseload Characteristics Food Stamp Caseload Characteristics SSI Recipient Characteristics |
|
A.3 |
Rates of participation in means-tested assistance programs |
INDICATOR 10 |
Rates of Participation in Means-Tested Assistance Programs |
|
A.4 |
Multiple program receipt |
INDICATOR 7 |
Multiple Program Receipt |
|
A.5 |
Means-tested assistance program transition rates |
INDICATOR 11 |
Means-Tested Assistance Program Transition Rates |
|
A.6 |
Events associated with the beginning and ending of receipt of means-tested assistance |
INDICATOR 8 |
Events Associated with the Beginning and Ending of Receipt of Means-Tested Assistance |
|
A.7 |
Degree of dependence |
INDICATOR 1 |
Degree of Dependence |
|
A.8 |
The degree of household income derived from means-tested assistance programs |
INDICATOR 2 |
Dependence Transitions |
|
A.9 |
Spell duration |
INDICATOR 5 |
Program Spell Duration |
|
A.10 |
Long-term receipt |
INDICATOR 6 |
Long-Term Receipt |
|
A.11 |
Intergenerational dependence |
INDICATOR 12 |
Intergenerational Dependence |
|
A.12 |
Receipt of means-tested assistance and hours of employment |
INDICATOR 4 |
Receipt of Means-Tested Assistance and Labor Force Attachment |
|
A.13 |
Dependence-spell duration |
INDICATOR 3 |
Dependence Spell Duration |
|
A.14 |
Labor-force attachment |
EMPLOYMENT AND WORK-RELATED RISK FACTOR 1 |
Labor Force Attachment |
|
A.15 |
Educational attainment |
EMPLOYMENT AND WORK-RELATED RISK FACTOR 8 |
Educational Attainment |
|
A.16 |
Low earnings |
EMPLOYMENT AND WORK-RELATED RISK FACTOR 3 |
Earnings of Low-Skilled Workers |
|
A.17 |
Employment |
EMPLOYMENT AND WORK-RELATED RISK FACTOR 2 |
Employment Among the Low-Skilled |
|
A.18 |
Adult/parent disability |
EMPLOYMENT AND WORK-RELATED RISK FACTOR 4 |
Adult/Child Disability |
|
A.19 |
Adult/parent incarceration |
ECONOMIC SECURITY RISK FACTOR 13 |
Adult Incarceration |
|
A.20 |
Adult/parent alcohol and substance abuse |
EMPLOYMENT AND WORK-RELATED RISK FACTOR 5 |
Adult Alcohol and Substance Abuse |
|
A.21 |
Poverty rates |
ECONOMIC SECURITY RISK FACTOR 1 |
Poverty Rates |
|
A.22 |
Anti-poverty effectiveness of transfer programs |
ECONOMIC SECURITY RISK FACTOR 7 |
Pre-Transfer and Post-Transfer Poverty Rates |
|
A.23 |
Poverty spells |
ECONOMIC SECURITY RISK FACTOR 3 |
Poverty Spells |
|
A.24 |
Poverty transition rates |
ECONOMIC SECURITY RISK FACTOR 2 |
Poverty Transition Rates |
|
A.25 |
Events associated with the beginning or ending of a poverty episode |
ECONOMIC SECURITY RISK FACTOR 5 |
Events Associated with the Beginning and Ending of a Poverty Episode |
|
A.26 |
Income changes due to events associated with the beginning or ending of a poverty episode |
dropped |
|
|
A.27 |
Long-term poverty |
ECONOMIC SECURITY RISK FACTOR 4 |
Long-Term Poverty |
|
A.28 |
Intergenerational poverty |
ECONOMIC SECURITY RISK FACTOR 6 |
Intergenerational Poverty |
|
A.29 |
Food sufficiency and hunger |
ECONOMIC SECURITY RISK FACTOR 9 |
Food Insecurity |
|
A.30 |
Health insurance |
ECONOMIC SECURITY RISK FACTOR 10 |
Health Insurance |
|
A.31 |
Substandard housing conditions |
dropped |
Included in Trends in the Well-Being of America’s Children and Youth: 1997 |
|
A.32 |
Crowded housing |
dropped |
|
|
A.33 |
Percent residing in high-poverty neighborhoods |
ECONOMIC SECURITY RISK FACTOR 11 |
Percent Residing in High-Poverty Neighborhoods |
|
A.34 |
Residential mobility |
ECONOMIC SECURITY RISK FACTOR 12 |
Residential Mobility |
|
A.35 |
Nonmarital births |
TEEN BEHAVIOR RISK FACTOR 2 |
Percent of All Births to Unmarried Teens |
|
A.36 |
Prenatal care |
dropped |
Included in Trends in the Well-Being of America’s Children and Youth: 1997 |
|
A.37 |
Percent of children living in various household arrangements |
dropped |
Included in Trends in the Well-Being of America’s Children and Youth: 1997 |
|
A.38 |
Percent of children living with relatives or other families |
dropped |
Included in Trends in the Well-Being of America’s Children and Youth: 1996 |
|
A.39 |
Never married family status |
TEEN BEHAVIOR RISK FACTOR 5 |
Never-Married Family Status |
|
A.40 |
Child abuse and neglect |
dropped |
Included in Trends in the Well-Being of America’s Children and Youth: 1997 |
|
A.41 |
Child support |
ECONOMIC SECURITY RISK FACTOR 8 |
Child Support |
|
A.42 |
Early childhood reading exposure |
dropped |
Included in Trends in the Well-Being of America’s Children and Youth: 1997 |
|
A.43 |
Child care arrangements |
EMPLOYMENT AND WORK-RELATED RISK FACTOR 7 |
Child Care Expenditures |
|
TEEN BEHAVIOR RISK FACTOR 1 |
Percent of Births to Unmarried Women Within Age Groups |
||
|
B.1 |
Infant mortality |
dropped |
Included in Trends in the Well-Being of America’s Children and Youth: 1997 |
|
B.2 |
Low birth weight |
dropped |
Included in Trends in the Well-Being of America’s Children and Youth: 1997 |
|
B.3 |
Child mortality |
dropped |
Included in Trends in the Well-Being of America’s Children and Youth: 1997 |
|
B.4 |
Percent of children limited in major activities due to chronic health conditions |
EMPLOYMENT AND WORK-RELATED RISK FACTOR 6 |
Children’s Health Conditions |
|
B.5 |
Teen births |
TEEN BEHAVIOR RISK FACTOR 3 |
Unmarried Teen Birth Rates Within Age Groups |
|
B.6 |
Teen violent crime arrests |
TEEN BEHAVIOR RISK FACTOR 8 |
Teen Violent Crime Arrests |
|
B.7 |
Youth incarceration |
dropped |
|
|
B.8 |
Teen alcohol and substance abuse |
TEEN BEHAVIOR RISK FACTOR 7 |
Teen Alcohol and Substance Abuse |
|
B.9 |
Early sexual intercourse |
TEEN BEHAVIOR RISK FACTOR 4 |
Early Sexual Intercourse |
|
B.10 |
High-school dropout |
EMPLOYMENT AND WORK-RELATED RISK FACTOR 9 |
High-School Dropout Rates |
|
B.11 |
Math and reading proficiency |
dropped |
Included in Trends in the Well-Being of America’s Children and Youth: 1997 |
|
B.12 |
Enrollment in pre-school |
dropped |
Included in Trends in the Well-Being of America’s Children and Youth: 1997 |
|
TEEN BEHAVIOR RISK FACTOR 6 |
Detached Youth |