
By:
Lashawn Richburg-Hayes and Stephen Freedman
MDRC
April 2004
Submitted to:
U.S. Department of Health and Human Services
Office of the Assistant Secretary for Planning and Evaluation
Introduction
Since the passage of the federal Personal Responsibility and Work Opportunity Reconciliation Act of 1996 (PRWORA), there has been a growing amount of research on welfare exiting and recidivism. The "leavers" studies sponsored by the Department of Health and Human Services (HHS), for example, have provided important information on how leavers are faring economically, such as how many are working, their incomes, and their receipt of other benefits. These studies also calculate the percentage of leavers who return to welfare within a year after their exit and compare their characteristics (personal and family) to those leavers who do not return.
What about the families that "cycle" that is, return to welfare repeatedly? There has been much less research on this segment of the welfare caseload, even though cyclers are a potentially important and sizeable segment of the welfare caseload and one that may have different needs than other recipients.
The goals of this report are to understand the incidence of cycling and the types of families who cycle on and off the rolls, and, if possible, to shed light onto why they repeatedly return to assistance. For this analysis, "cycling" will be defined as receipt of welfare benefits during three or more discrete spells during a four-year "observation" period. (See Sections III.C.5 and III.E. for more details on how welfare spells and cycling are measured.)
Key questions addressed by this report include:
- What percentage of welfare recipients cycle on and off of welfare?
- Does the incidence of welfare cycling vary in different localities?
- What are the characteristics and circumstances of welfare cyclers and their families? To what extent to do they differ from those of welfare recipients who have fewer spells on cash assistance?
- Are cyclers' welfare spells relatively short-lived or longer term?
- What are cyclers' employment patterns? Do welfare cyclers tend to leave employment quickly? Do they eventually find stable and well-paying jobs?
- To what extent do cyclers combine employment and receipt of welfare benefits?
- Did the changes to the federal welfare system that accompanied passage of PRWORA affect the incidence of welfare cycling?
Answers to these questions can help inform program administrators' and policy makers' decisions about the level of services and financial supports that cyclers and their families receive. For instance, cyclers may use the welfare system as policy makers intended to support their families during temporary periods of joblessness and may achieve stable employment over time. Alternatively, cyclers may lack the skills and credentials needed to achieve stable employment. They may return to assistance repeatedly for relatively long spells, following short spells of employment, and never manage to advance in the labor market. In this way, cyclers may more closely resemble long-term welfare recipients who rarely, if ever, find work. Under this view, cyclers may require more intensive and extended pre- and post-employment services and supports for work - especially now that most recipients face time limits on the receipt of welfare benefits and would eventually use up their eligibility if they continued to cycle.
The report is organized as follows. First, we provide background information on what we know about cyclers from studies of leavers and recidivists, since cyclers are a subset of these groups. Second, we describe the various samples and datasets used in this report and the methods employed to analyze them. Next, we describe the families and individuals who cycle on and off of welfare, calculate the incidence of cycling among members of the research sample, and compare the characteristics, employment outcomes, and family circumstances of cyclers to other recipient types. Then, we explore the effect of the PRWORA on cycling. Finally, we conclude with a discussion of our results.
What do we currently know about families who cycle on and off welfare?
The dramatic caseload decline since the mid-1990s has heightened interest in understanding the circumstances of families who have left welfare. Much of the research on this issue comes from the HHS-sponsored "leavers" studies, which tracked the status of leavers in 11 states and three counties (see Acs and Loprest, 2001, for a review). Other research has also compared leavers with other groups in the caseload, particularly people who did not leave welfare. The existing research on leavers is relevant since cyclers are a subset of groups who leave welfare and groups who return to welfare (recidivists).
Leavers
The weight of the evidence indicates, not surprisingly, that people who leave welfare are less disadvantaged and face fewer employment barriers than people who do not leave (Sandefur and Cook, 1998; Ver Pole, 2002; Miller, 2002). For example, Gleason et al. (1998) using data from Camden, Newark, and the South Side of Chicago - found that mothers with less education and lower skill levels were slower to leave welfare than other mothers.
A key goal of the leavers' studies is to assess how people fare once they leave welfare. A summary of the studies by Acs and Loprest (2001) indicates that most leavers are working after they leave welfare. In both the first and fourth quarters after exit, for example, the median rate of employment across all state studies was 57 percent. However, the studies also show a fair amount of employment instability the median proportion of people employed in all four post-exit quarters was 37 percent. Thus, job loss among welfare leavers may give rise to cycling back to welfare.
Another factor that may affect the number of families who eventually return to welfare is the receipt of non-welfare work supports. The existing studies show that only a slight majority of leavers receive non-welfare benefits in the quarters after exit (Acs and Loprest, 2001; Miller, 2002). Acs and Loprest (2001) find median rates of food stamp receipt in the four quarters after exit ranging from 40 percent to 50 percent. The corresponding rates of Medicaid receipt ranged from 45 percent to 57 percent. The authors also find that the proportion of leavers who receive these benefits at some point in the year after exit is much higher than the proportion who receive them in any given quarter, suggesting a fair amount of cycling into and out of these programs.
The evidence is mixed in terms of whether leavers are worse off economically, compared with before they left welfare. In examining material hardship, for example, some state leavers studies found that leavers were better off than before they exited welfare, while others found that leavers were worse off (Acs and Loprest, 2001).
Finally, the status of leavers may differ depending on why they left welfare. Bloom et al. (2002), using data from all the states and several welfare time limit evaluations, found that people who left welfare because they reached their time limit were struggling financially but were not experiencing more hardships than other leavers. On the other hand, people who left welfare because of sanctions appear to be worse off than other leavers (Loprest, 2002).
Recidivism
One of the key outcomes examined for leavers is how many eventually return to welfare. People who return to welfare are not necessarily cyclers, since they may only return once. However, cyclers are a subset of this group of returners. The research on recidivists addresses three broad questions:
- How many leavers return to welfare?
- How quickly do they return?
- What are the characteristics and circumstances of people who return compared with people who do not return?
An important finding from the research on leavers is that most of them do not return to welfare (Rickman et al., 2001; Bruce et al., 2001; Acs and Loprest, 2001). Acs and Loprest (2001), for example, report that across the range of leavers' studies, a median of 27 percent of leavers returned to welfare at some point within the first year after exit (this number ranged from 17 percent to 38 percent across the sites). Loprest (2002), using data from the National Survey of America's Families (NSAF), found that a little over 20 percent of leavers had returned to welfare by the time of the follow-up survey, which ranged from one month to two years after their exit. Also, most of the individuals at risk of re-entry have been found to do so relatively soon after they exit welfare, such as within 6 months to a year (Julnes et al., 2000; Bruce et al., 2002; and Harris, 1996). The findings from this research suggest that the incidence of cycling is likely to be fairly low since cyclers, by definition, return to welfare numerous times.
The existing research shows that people who return to welfare are more disadvantaged and less employable than people who do not return. For example, people who return tend to have lower education levels, more children, and less work experience than people who do not return (e.g., Julnes et al., 2000; Rickman et al., 2001; Bruce et al., 2002; Harris, 1996). Other family circumstances, such as whether the family receives non-welfare supports, also predict who returns to welfare. For example, staying off of welfare is associated with the receipt of childcare subsidies, health insurance, food stamps, and help with family expenses (Loprest, 2002).
Thus, cycling on and off of welfare is likely to be related to personal and family circumstances, an individual's skill level, her work experience and employment patterns, and her receipt of supports.
Cyclers
While limited, the current research on cyclers addresses the following questions: 1) What is the incidence of cycling among the caseload? 2) What are the characteristics and circumstances of cyclers? 3) Does cycling lead to longer or shorter stays on welfare? Researchers have also considered whether cyclers resemble other welfare populations (such as shorter- or longer-term recipients) in their background characteristics and employment and welfare behavior - or whether they should best be considered as a unique population.
Researchers have defined cycling quite differently. (See Table 1 for a summary of these definitions.) Nonetheless, the existing research indicates that cyclers make up a relatively small fraction of the caseload. Moffitt (2002), for example, defined cyclers as those with three or more welfare spells within a ten-year period. Using this definition and data from the National Longitudinal Survey of Youth (NLSY) from 1979 to 1996, he found that 20 percent of individuals who had ever been on welfare were cyclers. Ver Ploeg (2002) defined cyclers as recipients with three or more welfare spells within a nine-year period. Using data from a sample of adults in Wisconsin who received Aid to Families with Dependent Children (AFDC) in July 1995, she found that cyclers represented about 14 percent of the sample. Miller (2002) defined cyclers as individuals with only one short spell on welfare or those with two or more spells, who spent less than half of the observation period (three to five years) on welfare. Using this definition and data from several welfare waiver evaluations, Miller (2002) found that about 20 percent of a sample of new applicants and ongoing recipients were cyclers. Finally, Zedlewski and Alderson (2001) use data from the National Survey of America's Families (NSAF) and define cyclers as those who first received welfare more than two years prior to each survey (in 1997 and 1999) and who received welfare only intermittently in the two years prior to the survey. Using this definition, they find that cyclers were 20 percent of the caseload in 1997 and 23 percent in 1999, where the caseload includes all adults receiving benefits at the time of the survey.
The different ways in which researchers have defined cycling have affected their other findings on cycling, such as cyclers' background characteristics, typical length of welfare receipt, and relative disadvantage in the labor market. For instance, Moffitt (2002) finds that cyclers tend to have medium-length spells (of between 7 and 30 months), rather than short or long spells, suggesting that cyclers are a fairly welfare-dependent group. Similarly, Zedlewski and Alderson (2001) find that cyclers looked more like ongoing recipients than new entrants, in terms of employment rates and education levels.
Both Ver Ploeg (2002) and Moffitt (2002) concluded that over 80 percent of cyclers spent more than two years of the observation period on welfare, although the two researchers did not agree about whether cyclers experience very long spells of assistance. Moffitt (2002) found that 45 percent of them had a total time on welfare of more than five years, compared with only 18 percent found by Ver Ploeg (2002).(1) In contrast, Miller (2002) concluded that cyclers tended to be short-termers, receiving welfare benefits for less than two years during the observation period for her study. However, it should be noted that, for the larger purposes of her research, Miller (2002) intentionally sought to distinguish cyclers from long-term recipients.
This variation in findings across studies underscores the importance of comparing patterns of cycling in additional sites and additional welfare populations. This report helps meet this need. The report also provides more information about whether cycling is higher or lower since the implementation of PRWORA and also whether the incidence of cycling varies according to labor market conditions, welfare grant levels, and other site-related factors.
| Research Study | Cycler Definition | Sample | Data Sources | Cycler Estimate |
|---|---|---|---|---|
| Miller (2002) | Individuals who had only one spell on welfare that was six months or less or who had multiple spells but spent less than half of the observation period (three to five years) on welfare | A total of 36,449 new applicants and ongoing recipients from several welfare-to-work evaluation studies | Administrative Records | 20% |
| Moffitt (2002) | Individuals with three or more welfare spells within a ten-year period | A total of 514 women that received at least one month of AFDC from ages 20-29. | National Longitudinal Survey of Youth from 1979-1996 | 20% |
| Ver Ploeg (2002) | Individuals with three or more welfare spells within a nine-year period | A total of 48,216 single parent women that received welfare in July 1995 in the state of Wisconsin. | Administrative Records | 14% |
| Zedlewski and Alderson (2001) | Individuals who received welfare intermittently in two years prior to being surveyed and who first received welfare more than two years prior to being surveyed | 1,831 adults receiving TANF in 1997 and 850 families receiving TANF in 1999. | 1997 and 1999 National Survey of America's Families | 20% in 1997 and 23% in 1999 |
| Sources: See References for full citation. | ||||
(1) As Moffitt, 2002, notes, there is a potentially important difference between his study and Ver Ploeg's. The base sample for his study is all people who ever received welfare at some point during a 10-year period, while Ver Ploeg uses all people who were on welfare at a point in time. The latter method will miss spells not in progress at the point in which the sample was drawn.
Data, Samples, and Methods
Background
The data used in the report come from five MDRC evaluations of welfare reform initiatives, including two non-experimental analyses. Three experimental (random assignment) evaluations tested several key policies that are now part of the states' Temporary Assistance for Needy Families (TANF) programs. In these evaluations, ongoing recipients or new applicants to welfare were assigned to either a program group that received the new services or financial incentives or were subject to new regulation on eligibility for welfare benefits or to a control group that was subject to the existing welfare system in the state at the time of the evaluation. New applicants for welfare were randomly assigned at the time they were applying for welfare, while ongoing recipients were randomly assigned at their eligibility re-determination interviews.
The two non-experimental analyses studied the effect of welfare reform on caseloads and recipient behavior as part of MDRC's Project on Devolution and Urban Change (hereinafter, Urban Change). These analyses utilized data on the universe of recipients who received welfare benefits at any time during the early- to late-1990s.
A brief description of the five evaluations and a summary of key findings follow below:
Connecticut's Jobs First Program
The Connecticut's Jobs First Program implemented a 21-month time limit on welfare receipt. The program also included very generous financial incentives to encourage work - all of the recipient's earnings were disregarded when calculating her welfare and food stamps benefits until her earnings reached the poverty line. The evaluation tested the effects of Jobs First among new applicants for assistance and ongoing recipients in the offices of Manchester and New Haven (although the program was run statewide).
Jobs First increased the employment and earnings of program group members above control group levels throughout the evaluation's four-year follow-up period. During the early part of the follow-up period, before recipients began reaching time limits, the program also increased welfare receipt and, because of the generous disregards, increased incomes. About half of the recipients in the program group reached the time limit during the period, and two-thirds of them subsequently received a 6-month extension. Those who left welfare because of a time limit had higher earnings than those who left earlier, most likely because of the extension policy. See Bloom et al. (2002) for more information.
Florida's Family Transition Program (FTP)
The Florida's Family Transition Program imposed a 24-month time limit in any 60-month time period for most recipients and a 36-month time limit in any 72-month period for the least job-ready. The program offered financial incentives as well as enhanced services designed to help recipients find jobs. FTP operated as a pilot program in Escambia County (which includes the City of Pensicola) from 1994 to 1999. Many of FTP's features were then incorporated into Florida's statewide TANF program. There were important differences, however, between the two programs. For example, FTP did not have full-family sanctions, whereas Florida's statewide TANF program did. The FTP evaluation tested the program's effects among single-parent applicants for welfare and ongoing recipients. FTP increased program group members' employment and earnings and reduced their welfare receipt, compared with the control group. The majority of those in the program group left welfare before reaching their time limit. Most of the recipients who did reach a time limit were not given extensions: about 40 percent had adequate earnings levels that did not warrant an extension, while most of the rest were deemed non-compliant. The group that reached a time limit and had benefits cancelled was somewhat more disadvantaged than other leavers, but they did not, on average, experience more hardship, partly because they relied more on other sources of support. See Bloom et al. (2000) for the final report on the program's effects.
Vermont's Welfare Restructuring Project (WRP)
Vermont's Welfare Restructuring program implemented a 30-month work trigger that required most single parents to work once they had received welfare for 30 cumulative months. The program also included financial incentives in the form of an enhanced earned income disregard that was somewhat more generous than under Vermont's old AFDC program. WRP operated statewide from July 1994 through June 2001.
The evaluation tested the effects of WRP in six welfare districts. The research sample included single parents and adult members of two-parent families who were applying for welfare benefits or were ongoing recipients at their time of random assignment. The evaluation used a three-group research design, in which one program group received the enhanced financial incentives with the work trigger and a second program group received just the incentives. This design tested the effects of incentives alone compared with the effects of incentives combined with the work trigger.
The full WRP program produced modest increases in employment and earnings and decreased welfare payments over a six-year follow-up period, although WRP had little effect on welfare receipt prior to the 30-month point when families were subject to the work requirement. The WRP Incentives Only program had little impact on employment rates and welfare payments, indicating that the program's work requirements were needed. See Bloom et al. (2002) for more detail on the program's effects.
Urban Change
The Project on Devolution and Urban Change (Urban Change, hereafter) is a five-year, non-experimental multi-component study of PRWORA's implementation and of its effects on poor families with children, the communities in which they live, and the institutions that assist them. The study takes place in and around four major urban centers: Cleveland, Los Angeles, Miami, and Philadelphia.(2)
a. Urban Change - Cleveland (Cuyahoga County)
Cuyahoga County remade its welfare system in response to TANF by shifting to a neighborhood-based delivery system and dramatically increased the percentage of recipients who participated in work activities. It also launched a major initiative to divert families from going on welfare. The county firmly enforced the statewide 36-month time limits, starting in October 2000, but it ensured that families were aware of their cutoff date, and it offered short-term extensions and transitional jobs to recipients who had employment barriers or no other income.
The Cleveland sample includes 536,256 recipients, the universe of all people (adults and children) who ever received Medicaid or food stamps from July 1992 through December 2000. The study found that between 1992 and 2000, welfare receipt declined in the county, and employment among welfare recipients increased. A longitudinal survey of former and ongoing welfare mothers in Cleveland's poorest neighborhoods showed substantial increases in the percentage that were working and had "good" jobs between 1998 and 2001.
The study's findings counter the notion that welfare reform would lead to service retrenchment and a worsening of conditions for families and neighborhoods. To the contrary, there were many improvements in Cleveland - though the favorable economy played a major role, and time limits had just been implemented when the study ended. See Brock et al. (2002) for more information.
b. Urban Change - Philadelphia County
The Urban Change Philadelphia project evaluated the effect of Pennsylvania's welfare reform on welfare receipt, employment, material hardship, and neighborhoods. The state focused its welfare-to-work program on employment, expanded and simplified the provisions that allowed welfare recipients to keep part of their welfare checks if they worked, and instituted two time limits: a 24-month limit that requires recipients to work or participate in a work activity for 20 hours per week and a 60-month lifetime limit on welfare receipt. In Philadelphia (3), implementation of the law was lenient in some respects. During the first two years on welfare, recipients were asked to conduct an eight-week job search but otherwise were not held to a strict work requirement. At the 24-month limit, many parents who were not working were placed in subsidized jobs. In addition, families received extensions to the lifetime limit if they participated in assigned activities.
The Philadelphia sample includes 778,510 recipients, all people who received cash assistance, food stamps, or Medicaid between January 1993 and July 1999. In Philadelphia, welfare receipt declined and employment increased between 1992 and 2000. TANF seems to have encouraged long-term recipients to leave the rolls faster, to have increased employment (but mostly unstable employment), and to have raised the likelihood that some families would return quickly to welfare.
This study's findings are consistent with the above Urban Change report on Cleveland, again countering the notion that welfare reform leads to service retrenchment and a worsening of conditions for families and neighborhoods. See Michalopoulos et al. (2003) for more information.
Data
Each evaluation provides three data sources for this report. First, demographic data, including age, race, and number and ages of children, were collected for all sample members at the point of random assignment, or baseline.(4) Second, state and county administrative records provide information on sample members' quarterly earnings, monthly welfare receipt, and monthly food stamps receipt. The earnings data come from each state's Unemployment Insurance (UI) system, to which most employers must report employee earnings. Earnings from self-employment, informal or "off-the-books" jobs, or employment from the federal government or the military are not reported, however. The welfare and food stamps data come from each state's automated benefit payment system. One limitation of these statewide administrative data is that they do not capture earnings or benefit receipt for sample members who have moved out of state.(5) Third, each study administered a survey to a subset of the sample about three to five years after sample entry. The surveys capture employment and earnings not reported to the UI system, and they also provide more detailed information on family well-being, including household composition, income and income sources, material hardship, and barriers to employment.
Research Samples
Table 2 presents for each site the sample size and the "sample intake period" - that is, the dates from which the samples were drawn. The sample intake period for the three evaluation sites consists of the months in which welfare applicants and recipients were randomly assigned to program and control groups. We selected intake periods for the Urban Change sites to mirror those from the random assignment evaluations in order to make the analyses across these disparate samples more comparable. That is, for the Urban Change sites, the sample intake months correspond roughly to the months of random assignment for the three evaluation sites. In these sites, the month of sample intake is the first month within the designated intake period in which the individual received a welfare payment.
The analyses focus on a large subgroup of the five evaluation samples. Specifically, the sample for this report includes single parents (usually, mothers) aged 18 to 59 at sample intake who received at least one welfare payment during or after their month of sample intake. Welfare recipients excluded from this analysis include: (1) single parents younger than 18 or older than 59 years of age at sample intake; (2) members of two-parent welfare cases; and (3) adult caretakers of Child-Only or Foster Care assistance cases.(6) Together, these excluded groups made up between 20 and 30 percent of the welfare caseload in these sites.(7)
In the two Urban Change sites, Cleveland and Philadelphia, all welfare recipients who met the criteria listed above were included in the research samples. In contrast, the samples in the three evaluation sites are somewhat less representative of their respective caseloads in that they also exclude welfare recipients who were determined by welfare agency staff members to be exempt from their welfare program's requirement to participate in pre-employment activities. Exempted single parents included (1) incapacitated or disabled adults; (2) parents of a child under the age of one year (6 months of age in Florida FTP); and (3) adults caring for a disabled child or other dependent relative. These groups represent another 12 to 20 percent of the caseload.(8) Finally, most analyses in this report exclude sample members randomly assigned to the control group, which made up a quarter of the sample in Vermont WRP and half in Connecticut Jobs First and Florida FTP.(9)
| Sites | Sample Site | ||||
|---|---|---|---|---|---|
| Location | Full Sample | Five-Year Follow-Up Sample | Survey Sample | Sample for Testing Effects of PRWORA | |
| Evaluation sites | |||||
| Connecticut Jobs First | Manchester and New Haven | ||||
| Sample intake period | 1/96 - 2/97 | -- | 4/96 - 1/97 | -- | |
| Sample size | 2,184 | -- | 1,157 | -- | |
| Florida FTP | Escambia County | ||||
| Sample intake period | 5/94 -2/95 | 5/94 -09/94 | 8/94 - 2/95 | -- | |
| Sample size | 1,150 | 535 | 711 | -- | |
| Vermont WRP | State-wide | ||||
| Sample intake period | 7/94 -6/95 | 7/94 -6/95 | 10/94 - 6/95 | -- | |
| Sample size | 4,051 | 4,051 | 781 | -- | |
| Urban Change sites | |||||
| Cleveland | Cuyahoga County | ||||
| Sample intake period | 7/94 - 12/96 | 7/94-01/96 | 7/94 - 10/95 | 1/93-12/96 | |
| Sample size | 55,764 | 50,217 | 887 | 26,365 | |
| Philadelphia | Philadelphia County | ||||
| Sample intake period | 1/94 - 12/97 | 1/94-12/96 | 1/94 - 7/95 | 1/93-12/97 | |
| Sample size | 97,858 | 91,348 | 749 | 49,067 | |
| Total sample size | 161,007 | 146,151 | 4,285 | 75,432 | |
| Sources: MDRC calculations from state and county administrative records, Background Information Forms, and survey responses. Notes: Sample sizes for the evaluation sites include program group members only. Control group members number: Connecticut Jobs First: 2,102; Florida FTP: 1,124; and Vermont WRP: 1,004. Control group members are excluded from all calculations except those displayed on Table 12. The study sample is limited to single-parent adults, ages 18 to 59, meeting study criteria. | |||||
Table 2 shows reasonable sample sizes for the random assignment evaluations and large sample sizes for the non-experimental Urban Change sites. Sample intake took place during 1994 through 1997 and varied in duration from 10 months in Vermont WRP to 48 months in Philadelphia.
As shown in Table 2, the report calculates the incidence of cycling and other outcomes for several different subsamples. The largest sample, called the full sample, is used for most analyses in this report. The full sample includes 161,007 members from the five sites who met the sample selection criteria described above. Each member of the full sample has employment and welfare data, collected from administrative records, from two years before through at least four years after her month of sample intake.
The five-year follow-up sample includes the 146,151 members (about 91 percent) of the full sample who have employment and welfare data for at least five years following their month of sample intake. This sample is used for the analyses of employment and welfare outcomes in year 5 after sample intake.(10) Table 2 shows that all members of the full sample in Vermont WRP have administrative data for five years after sample intake, as do more than 90 percent of the full sample from Cleveland and Philadelphia. In contrast, the five-year follow-up sample includes only 535 full sample members (about 47 percent) from Florida FTP and no full sample members from Connecticut Jobs First.
The survey sample consists of the 4,285 members of the full sample who completed survey interviews between 36 and 60 months after their date of sample intake. The survey sample includes respondents from all five sites and is used for analyses of outcomes such as household income, household composition, job characteristics, and material hardships, which were unavailable from administrative data.
The strategies for fielding a survey sample varied somewhat in the three evaluation sites.(11) However, in each evaluation site, survey respondents were chosen from nearly all months of sample intake. This strategy increased the likelihood that results for survey respondents could be generalized to the full samples in these sites.
In contrast, for the Urban Change sites, a more specialized sampling design was followed in which respondents were selected from among all recipients of welfare or food stamps benefits in each site during a single month, May 1995. In both Cleveland and Philadelphia, this month falls toward the beginning of the sample intake period for this report. By definition, this sampling strategy excludes members of the full sample who did not receive welfare or food stamps benefits in May 1995 - either because they had already left assistance by that date or because they had not yet applied. As a result, the survey samples in Cleveland and Philadelphia are somewhat less representative of the full samples, compared with the samples in the three evaluation sites.
Finally, we use a special sample from the Urban Change sites to evaluate the effects of PRWORA on the likelihood of becoming a cycler.(12) This sample for testing the effects of PRWORA includes full sample members who had received their first welfare payment between January 1993 (the first month of available data)(13) and their month of sample intake. That is, they were either first-time applicants for welfare benefits at their time of sample intake or they had received welfare for the first time between January 1993 and their sample intake date. This sample for testing the effects of PRWORA also includes recipients not in the full sample. This additional "early cohort" was included to better detect the effect of welfare regulations on cycling during the years before PRWORA. The members of this early cohort first received welfare benefits on or after January 1993, but before the first month of sample intake for the full sample. For example, the early cohort includes those recipients who received their first welfare benefit between January 1993 and January 1994(14), but did not receive welfare benefits during the sample intake period. These samples are used since the longitudinal nature of the samples allows a quasi-experimental estimate of the effect of welfare reform. The early cohort members are not part of the full sample and are excluded from all other analyses in this report.
We analyze the effect of PRWORA separately in each Urban Change site. Table 2 shows that there are 26,365 and 49,067 members of this special sample in the Cleveland and Philadelphia, studies respectively.
Pooling the research samples
For the majority of the analyses in this report, sample members from all five sites are combined into a single "pooled" sample weighted equally by site. This means that even though Philadelphia represents nearly 61 percent of recipients in the unweighted sample, they represent only 20 percent of the weighted sample. Other times, we present results separately for each site.
Characteristics of the full sample
Appendix Table 1 displays the characteristics of sample members from each site, as well as for the pooled sample, equally weighted. As can be seen from the Full Sample column, the sample includes primarily females, around 30 years of age, with one or two children. Most sample members had at least one child under the age of 6. The sample was relatively evenly divided among whites and African Americans. Hispanic sample members comprised less than 10 percent of the sample. About 60 percent of sample members were ongoing recipients at their time of sample intake. A similar percentage worked for pay during the two years prior to sample intake, but their work history was limited. This subgroup of sample members with prior employment averaged about one year (4 quarters) of employment (2.2 quarters divided by 0.555) in the two years before sample intake.
Comparison to the national welfare caseload
The five welfare samples in this report do not represent a random sample of the national caseload. Most notably, all sites are located in the eastern half of the nation. In other ways, however, the sites encompass much of the variation of welfare populations across the U.S. The full sample includes welfare recipients from one of the nation's largest urban centers (Philadelphia), several medium-sized cities (and surrounding suburbs), and some rural areas (especially, Vermont). Sample members also come from states with relatively high welfare grants (Connecticut and Vermont), low welfare grants (Florida and Ohio), and grants near the national average (Pennsylvania).
To measure the representativeness of the full sample, we compare the background characteristics of the full samples to published data on the characteristics of single adult welfare recipients in the national caseload. For this comparison, we use data from FY 1996 (15), which falls within the sample intake period in three sites and begins shortly after the last month of intake in the other two. Members of the full sample closely resemble adults in the national caseload in sample members' gender, age, and average number of children, but had a somewhat higher percentage of children below the age of six. The full sample contains a larger percentage of whites and African-Americans and a smaller percentage of Hispanics than adults in the national caseload. Finally, members of the full sample were much more likely to be new recipients and to have entered assistance with a recent work history compared with adults in the national caseload. These similarities and differences should be kept in mind when making generalizations of the findings of this report.
Observation and follow-up periods
For most analyses in this report, we track sample members' welfare and other outcomes from their month of sample intake through the end of year 4. These 48 months are referred to as the observation period. The fifth-year follow-up period includes months 49 through 60, following the month of sample intake and is used to measure outcomes for the five-year follow-up sample. In contrast, the period for tracking survey outcomes is less exact. It ranges from 36 to 60 months after sample intake and reflects differences among the five studies in when interviews were scheduled. Thus, some members of the survey sample reported outcomes that occurred during years 3 or 4 of the observation period, whereas others reported outcomes that took place during the fifth-year follow-up period.
Measuring welfare spells
For this report, we define a welfare spell as a series of consecutive months of welfare receipt. In keeping with previous research, we allow for interruptions of one month when measuring the length of welfare spells, but end welfare spells after two consecutive months without a payment. For this analysis, we focus only upon welfare spells that include the sample member's month of sample intake or began later during the observation period.
New recipients and ongoing recipients
For several analyses, we will present findings separately for sample members who were just starting a welfare spell around their time of sample intake (hereafter referred to as new recipients) and sample members who had been receiving benefits for some time before the sample intake period (hereafter referred to as ongoing recipients). More specifically, a new recipient is either (1) a sample member who received welfare during her month of sample intake and began her welfare spell no earlier than 3 months prior to sample intake; or (2) a sample member who received no payment during her month of sample intake but started a welfare spell within the next 1 or 2 months. (16) New recipients who entered the research sample during the same month of sample intake may be thought of as entry cohorts. (See Tables 4 and 12 and Figures 3 through 6 for results for this subgroup.) Ongoing recipients were receiving welfare during their month of sample intake and began their welfare spell at least four months prior to sample intake.
New recipients are of particular interest for the study of cycling because we can accurately measure the duration of their first spell on welfare. For this reason, the sample for testing the effects of PRWORA is comprised solely of new recipients. In contrast, some ongoing recipients have welfare spells that began before the data collection period for this report, and estimates of their total number of months on assistance are necessarily truncated. Still, ongoing recipients represent a large portion of the welfare caseload - between 55 percent and 66 percent of the sample members in each site. Their outcomes, when combined with those of new recipients, make the findings on welfare cycling more representative of the welfare recipients in the sites included in this study.
Program environments
It is important to get an idea of the economic environment present over time in each site, as this may affect the outcomes of cyclers. Table 3 shows selected environmental statistics for each site over an eight-year period. In general, employment growth over the years of 1994 to 2001 ranged from around 2 to 3 percent in four sites and by more than 9 percent in Vermont. Growth in employment was greatest in Vermont and slowest in Cleveland.
The table also shows that unemployment rates generally declined over the period of 1994 to 2000. This decline was largest in Connecticut, where the unemployment rate decreased by 3.6 percentage points over the period. In 1994, Connecticut, Cleveland, and Philadelphia experienced the highest levels of unemployment, an average rate of 6.6 percent across these sites. However, by 2001, unemployment in Connecticut declined to levels comparable to Florida and Vermont.
Consistent with national trends, welfare caseloads declined dramatically (between 44 and 77 percent) in all sites, with the greatest decrease occurring in Florida, followed by Cleveland. (17) This large change in Florida may be explained by the extraordinary changes in both the state and federal welfare policy during the implementation years. For example, in addition to the Florida legislature voting to expand FTP from one county to several other Florida counties, it then passed the state's welfare reform act in May 1996, and the federal welfare reform act was passed just 3 months later. All of these changes were widely publicized. Another possible explanation for Florida's relatively large caseload decline may be its very high caseload level in the early 1990s. Perhaps because the state's caseload was so high, the rate of decline since that time has been much greater in Florida than most other states (the national caseload declined by 49 percent during the same period). From the Urban Change report, we know that the dramatic decline in caseloads in Cleveland occurred prior to the implementation of welfare reform and may be partially due to the strong economy or other factors.
| Characteristic | Evaluation Sites | Vermont WRP | Urban Change Sites | ||
|---|---|---|---|---|---|
| Connecticut Jobs First | Florida FTP | Cleveland | Philadelphia | ||
| Total employed (a) | |||||
| 1994 | 306,110 | 115,294 | 42,674 | 632,589 | 604,573 |
| 1995 | 301,037 | 114,850 | 43,556 | 639,911 | 594,381 |
| 1996 | 302,451 | 114,327 | 44,273 | 641,649 | 596,100 |
| 1997 | 305,349 | 114,448 | 45,091 | 648,191 | 597,975 |
| 1998 | 309,957 | 115,464 | 46,007 | 643,281 | 593,325 |
| 1999 | 309,826 | 115,612 | 46,873 | 645,339 | 592,102 |
| 2000 | 320,244 | 114,813 | 46,425 | 646,281 | 623,460 |
| 2001 | 317,015 | 119,104 | 47,449 | 643,402 | 625,031 |
| Employment growth, 1994 - 2001(%) | 3.4 | 3.3 | 9.5 | 1.7 | 3.4 |
| Unemployment rate (%)(b) | |||||
| 1994 | 6.0 | 4.7 | 4.8 | 6.0 | 8.0 |
| 1995 | 5.8 | 4.3 | 4.3 | 5.0 | 7.7 |
| 1996 | 6.1 | 4.1 | 4.7 | 5.1 | 7.1 |
| 1997 | 5.4 | 4.2 | 4.1 | 4.9 | 7.0 |
| 1998 | 3.5 | 3.9 | 3.5 | 4.5 | 6.2 |
| 1999 | 3.3 | 3.6 | 3.1 | 4.6 | 6.1 |
| 2000 | 2.4 | 4.0 | 3.0 | 4.6 | 6.1 |
| 2001 | 3.6 | 5.0 | 3.7 | 4.6 | 6.4 |
| Welfare caseload (c) | |||||
| 1994 | 59,200 | 254,032 | 9,917 | 251,037 | 208,260 |
| 1995 | 61,000 | 241,193 | 9,789 | 232,574 | 208,899 |
| 1996 | 58,124 | 215,512 | 9,210 | 209,830 | 192,952 |
| 1997 | 56,095 | 182,075 | 8,451 | 192,747 | 170,831 |
| 1998 | 51,132 | 121,006 | 7,591 | 147,093 | 140,446 |
| 1999 | 35,481 | 89,674 | 6,717 | 121,142 | 110,567 |
| 2000 | 28,095 | 67,355 | 6,043 | 97,969 | 89,899 |
| 2001 | 25,650 | 58,849 | 5,524 | 85,005 | 82,644 |
| Change in welfare caseload, 1994 - 2001 (%) | -56.7 | -76.8 | -44.3 | -66.1 | -60.3 |
| Maximum welfare grant for a family of 3 during first month of sample intake($) | 636 | 303 | 638 | 341 | 403 |
| First month of sample intake | 1/96 | 5/94 | 7/94 | 7/94 | 1/94 |
| Sources: MDRC calculations from data collected from U.S. Department of Labor, Bureau of Labor Statistics website; U.S. Department of Health and Human Services, Administration for Children and Families website; and U.S. House of Representatives, Committee on Ways and Means, Green Books,1994-2000. Notes: (a): Employment totals are monthly averages, not seasonally adjusted. (b): Unemployment rates are monthly averages, not seasonally adjusted. (c): Welfare caseloads totals are state monthly averages. | |||||
The bottom of Table 3 reports the maximum welfare grant for a family of three in 1994. Connecticut is the most generous state, while Florida is the least generous with a maximum benefit of just $303 for a family of three.(18)
How do we define cyclers relative to other recipients?
Defining cyclers, short-term, and long-term welfare recipients
For most analyses in this report, we divide the samples into three key outcome groups, based on each sample member's pattern of welfare receipt: cyclers, short-term recipients, and long-term recipients, this grouping reflects definitions used in the literature (e.g., Ver Ploeg, 2002), combined with an examination of the full sample. In this report we define a cycler as someone who had 3 or more spells of welfare receipt during the 4-year observation period. (19) A short-term recipient is defined as someone who had 1 or 2 spells and a total of up to 24 months of welfare receipt during the observation period. Long-term recipients are defined as sample members with 1 or 2 spells and a total of 25 to 48 months of welfare receipt during the observation period.
What is the incidence of cycling?
Table 4 presents the percentage of cyclers, short-term recipients, and long-term recipients by site for the full sample (top panel) and for new recipients (bottom panel). The table shows results for each site as well as pooled (5-site) averages.
| Welfare Outcome(%) | Evaluation Sites | Vermont WRP | Urban Change Sites | Total | ||
|---|---|---|---|---|---|---|
| Connecticut Jobs First | Florida FTP | Cleveland | Philadelphia | |||
| A. Full Sample | ||||||
| Cyclers | 4.5 | 13.7 | 9.4 | 10.8 | 3.8 | 8.5 |
| Short-term recipient | 52.1 | 59.2 | 42.4 | 45.0 | 34.5 | 46.6 |
| Long-term recipient | 43.4 | 27.0 | 48.2 | 44.1 | 61.7 | 44.9 |
| Sample size | 2,184 | 1,150 | 4,051 | 55,764 | 97,858 | 161,007 |
| B. New Recipients | ||||||
| Cyclers | 6.1 | 11.7 | 11.4 | 11.6 | 4.9 | 9.1 |
| Short-term recipient | 60.7 | 76.0 | 56.5 | 59.0 | 49.6 | 60.3 |
| Long-term recipient | 33.3 | 12.4 | 32.2 | 29.4 | 45.5 | 30.5 |
| Sample size | 860 | 420 | 1,383 | 23,657 | 44,164 | 70,484 |
| Sources: MDRC calculations from state and county administrative records. Notes: The samples were weighted equally by site when calculating percentages for the Full Sample and for New Recipients. The Full Sample includes 6.5 percent cyclers, 38.7 percent short-term recipients, and 54.8 percent long-term recipients, when samples are pooled without weighting. The corresponding percentages among New Recipients are: cyclers: 7.4 percent; short-term recipients: 53.4 percent: and long-term recipients: 39.2 percent. | ||||||
For the full sample, rates of cycling range from a low of 3.8 percent in Philadelphia to 13.7 percent for Florida FTP. Differences in maximum grant levels, earnings disregards, and the imposition of time limits on eligibility to receive welfare benefits are potential reasons for the variation across sites in the incidence of cycling. Connecticut, for example, has much higher benefit levels and more generous earnings disregards than Florida, which may explain its lower rate of cycling. However, Vermont's benefit levels and earnings disregards are similar to Connecticut's, but the WRP's rate of cycling is twice at high (9.4 percent), which may be due to the strong economy in Vermont during this time period. Still, it is apparent that cyclers represent a small fraction of the full samples in each site. In Connecticut Jobs First and Florida FTP short-term recipients comprised the largest portion of the sample, whereas in Vermont WRP and, especially, Philadelphia, long-term recipients predominated. In Cleveland, about the same percentage of sample members were short-term and long-term recipients.
The bottom panel shows the same results for new recipients. For this subgroup, rates of cycling were roughly similar to those for the full sample, ranging from 4.9 percent in Philadelphia to 11.7 percent in Florida FTP. In four sites, the incidence of cycling among new recipients exceeded the rate for the full sample by about 1 to 2 percentage points. The exception was Florida FTP, where the incidence of cycling was 2 percentage pointers lower. New recipients differed more dramatically from the full sample in their relative proportions of short-term- and long-term recipients. In all sites except Philadelphia, a large majority of new recipients became short-term recipients during the four-year observation period - especially in Florida FTP (76 percent). Furthermore, even in Philadelphia, short-term recipients comprised the largest group.(20)
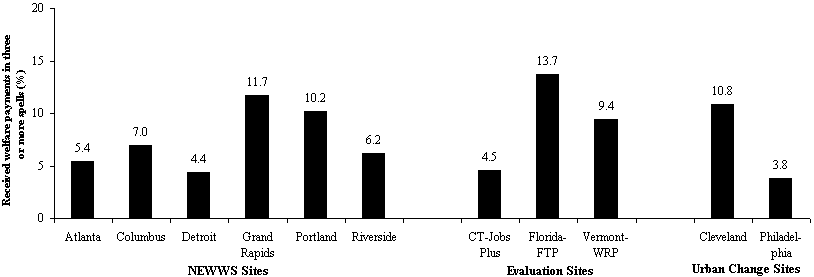
To place the results for full sample is broader context, we also calculated the incidence of cycling over four years among program group members in six of the seven sites evaluated in the National Evaluation of Welfare-to-Work Strategies (NEWWS) project. (21) We compare the sites in this report to the NEWWS sites because NEWWS employed a random assignment design and tracked sample members' welfare and employment outcomes over a similar observation period.(22) Figure 1 shows that the rates of cycling in the NEWWS sites ranged from 4.4 percent in Detroit to 11.7 percent in Grand Rapids, similar to results for the five sites in this study (also shown in the figure).
The incidence of cycling in the sites in Figure 1 is lower than the rates calculated in other studies that defined cycling as receipt of welfare during multiple spells. For instance, Moffitt (2002) found that 20 percent of individuals who had ever been on welfare were cyclers. Ver Ploeg (2002) found that cyclers represented about 14 percent of the sample. Moffit and Ver Ploeg examined cyclers over ten and nine year periods, respectively.
The four-year follow-up period for this study accounts for at least part of this difference in measured rates of cycling. Figure 2 shows cycling rates over this period compared with a longer follow-up period. When measured over five years (for the five-year follow-up sample), the incidence of cycling increased by 2 to 4 percentage points. Around 15 percent of sample members in Florida FTP, Vermont WRP, and Urban Change-Cleveland became cyclers by the end of year 5, compared with fewer than 6 percent for Urban Change-Philadelphia. (23)
Sources: MDRC calculations from state and county administrative records.
Notes: Calculations for National Evaluation of Welfare-to-Work Strategies (NEWWS) sites and for Evaluation sites are for program group members only. A single (combined) program group was created in sites that randomly assigned individuals to two or more program groups.
Figure 2.
Percentage of Sample Members Who Became Cyclers by Site
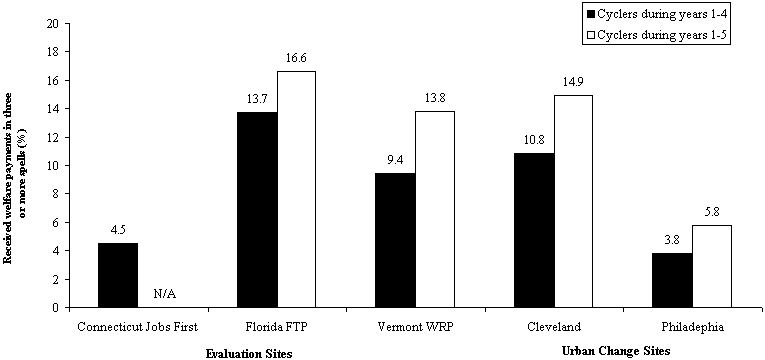
Sources: MDRC calculations from state and county administrative records.
Notes: The full sample was included in the calculations for years 1-4, where as the five-year follow-up sample was used in the calculations for years 1-5. The Connecticut Jobs First sample lacked five years of follow-up data and was excluded from the calculations for years 1-5. See table 2 for the sample sizes and intake dates for each sit.
The percentage of cyclers during years 1-4 for the 5-year follow-up is as follows: 13.8: Florida FTP; 9.4: Vermont WRP; 10.9: Cleveland; and 3.6 Philadelphia.
A single (combined) program group was created in sites that randomly assigned individuals to two or more programs groups.
(2) The Los Angeles and Miami sites were excluded from this report because the administrative data for these sites were not available at the time of this analysis.
(3) Philadelphia County is coterminous with the city of Philadelphia and therefore the terms are used inter-changeably throughout this report.
(4) Education information is also available, but only for the random assignment evaluation sites.
(5) The Vermont WRP evaluation collected UI Wage records from neighboring New Hampshire.
(6) In contrast to single-parent TANF recipients, the welfare grants only covered the financial needs of the children. Therefore, these adults are considered to be administrators of the grant, but not welfare recipients.
(7) This finding is based on published data for the five states in U.S. Department of Health and Human Services, Administration for Children and Families 1996, Tables 8 and 11.
(8) U.S. Department of Health and Human Services, Administration for Children and Families, 1996, Tables 11 and 15.
(9) The exception occurs in Table 12, in which we analyze the program impacts (the difference between program group outcomes and control group outcomes) on the percentage of recipients who became cyclers. It should be noted that the exclusion of control group members does not affect the generalizability of the findings, because sample members were assigned to program and control groups at random.
(10) For the evaluation sites, year 5 after sample intake represents five years after random assignment.
(11) For additional details on selection of the survey samples in the three evaluation sites, see Bloom et al., 2002, pp. 24-27 (Connecticut Jobs First); Bloom et al., 2000, pp. 20-21 (Florida FTP); and Bloom et al., 2002, pp. 9-12 (Vermont WRP).
(12) See Michalopoulos et al., 2000, for a detailed discussion and evaluation of this method, which is called "multiple cohort design."
(13) In Philadelphia, the administrative records data extend back to January 1992. However, to lower the possibility of mislabeling recipients in a current spell of welfare receipt as a new recipient, we drop those recipients who received a payment in 1992. In Cleveland, the first month of available data is July 1992. Again, to lower the chances of including ongoing recipients, we drop the recipients who received any payments during July 1992 to December 1992 and begin analyzing welfare receipt in January 1993.
(14) The start of the sample intake period for Cleveland is July 1994.
(15) U.S. Department of Health and Human Services, Administration for Children and Families 1996, Tables 2, 8, 11, 12, 22, 23, 25, 26.
(16) New recipients may have received welfare payments during one or more previous spells. For the Urban Change sites these respondents received welfare benefits for the first time since July 1992 and January 1992 in Cleveland and Philadelphia, respectively.
(17) Note that the samples are drawn during a general downturn in the welfare caseloads of each site. However, the intake dates are sufficiently early such that the samples should be fairly representative of the average caseload and not overly representative of those with the most barriers to leaving welfare.
(18) For Connecticut, the grant level in 1996 is given since this is the earliest year for which we use data. Nevertheless, Connecticut's maximum grant level in 1994 was $680, substantially greater than the remaining sites.
(19) Recall that in this report, we consider a welfare spell to have ended after two consecutive months without a payment.
(20) Not shown, the rate of cycling among ongoing recipients is slightly lower than the full sample rates in all sites except Florida FTP.
(21) NEWWS examined the long-term effects on welfare recipients and their children of 11 mandatory welfare-to-work programs, operated in seven sites that took different approaches to helping welfare re-cipients find jobs, advance in the labor market, and leave public assistance. The effects of the NEWWS programs were estimated based on a wealth of data on more than 40,000 single-parent families, making NEWWS the largest study of welfare-to-work programs ever conducted. Parents and their children were tracked over a five-year follow-up period, which, depending on the site, spanned different parts of the 1990s. In the study's innovative and rigorous research design, each parent was randomly assigned to a program group (in some sites, there were two program groups), whose members were eligible for pro-gram services and subject to the mandate, or a control group, whose members were not. See Hamilton, 2002, for more information. MDRC collected fewer than four years of welfare payments records for the seventh site, Oklahoma City, and therefore that site is not included in Figure 1.
(22) The NEWWS samples are not used in this report because too little of the observation period occurred after the signing of PRWORA.
(23) Not shown, for the five-year follow-up sample, the incidence of cycling over four years was nearly identical to the rate for the full sample, ranging from 3.6 percent in Philadelphia to 13.8 percent in Florida. Thus, the additional incidence of cycling in year 5 represents a real increase over time and does not result from dif-ferences in sample composition. Furthermore, we observed a similar increase for the NEWWS sites-not shown.
Who are the families and individuals who cycle on and off of welfare?
What are the demographic characteristics of cyclers?
Table 5 presents the characteristics of cyclers, short-term recipients, long-term recipients, and the full sample measured at their time of sample intake. Of particular interest are sample members' pre-intake histories of employment and welfare receipt.(24) The table shows that the recipient groups differ in several ways. For example, the average age of cyclers at sample intake is 28 years slightly more than two years younger than the average age of short-term and long-term recipients. The distribution of ages among each outcome group reveals that cyclers are more likely to be younger than 25 years old and less likely to be older than 35 years of age, compared with short-term and long-term recipients. On average, cyclers also tended to start having children about a year to a year and a half earlier in their lives, compared with short-term and long-term recipients. Moreover, 53 percent of cyclers were between the ages of 13 and 18 at the birth of their first child, a far higher percentage than short-term recipients (40 percent) and higher as well than long-term recipients (46 percent). Finally, cyclers had the highest percentage of families with very young children under two years of age as well as the highest percentage whose youngest child was under the age of six. All but the last of these differences among the three groups are statistically significant, as indicated by the stars in the last column. (25)
In terms of welfare usage, cyclers appear to lie between short-term recipients and long-term recipients. For instance, 58 percent of cyclers were ongoing recipients at their time of sample intake, compared with 49 percent for short-term recipients and 73 percent for long-term recipients. Cyclers averaged slightly more than 13 months of welfare receipt in the two years prior to sample intake. This lies between the average of 11 months for short-term recipients and 16 months for long-term recipients, indicating that cyclers tend to stay on welfare longer than short-term recipients. This pattern also holds for food stamps receipt, indicating that cyclers may be more disadvantaged than short-term recipients, but less disadvantaged than long-term recipients.
Cyclers' background characteristics suggest compelling reasons for their subsequent pattern of welfare receipt. Prior research suggests that young, single parents with young children often have a hard time holding steady employment. In fact, more than two-thirds of cyclers worked for at least one quarter during the two years prior to sample intake, although cyclers averaged fewer than 3 quarters of employment. (Cyclers with employment histories worked during four out of the eight quarters before sample intake not shown. This average was slightly below the mean for short-term recipients with work histories and exceeded the mean for long-term recipients.) Such individuals may have difficulties sustaining employment given their family responsibilities, such as childcare.
| Characteristic | Cyclers | Short-Term Recipients | Long-Term Recipients | Full Sample |
|---|---|---|---|---|
| Female (%) | 96.8 | 94.2 | 96.8 | 95.6 ** |
| Age (%) | ||||
| 18-24 | 41.6 | 28.3 | 31.9 | 31.0 ** |
| 25-34 | 41.7 | 42.6 | 41.2 | 41.9 ** |
| 35-44 | 14.7 | 23.7 | 21.7 | 22.0 ** |
| 45 or older | 2.0 | 5.5 | 5.2 | 5.1 ** |
| Average age (years) | 27.8 | 30.7 | 30.1 | 30.2 ** |
| Ethnicity (%) | ||||
| White | 43.9 | 48.5 | 38.5 | 43.6 ** |
| Black | 50.4 | 41.2 | 51.0 | 46.4 ** |
| Hispanic | 4.5 | 8.5 | 8.8 | 8.3 ** |
| Other | 1.2 | 1.8 | 1.7 | 1.7 ** |
| Number of children (%) | ||||
| 1 | 43.0 | 50.9 | 35.2 | 43.2 ** |
| 2 | 32.3 | 28.2 | 29.7 | 29.3 ** |
| 3 | 16.0 | 13.8 | 18.9 | 16.3 ** |
| 4 or more | 8.6 | 7.1 | 16.2 | 11.3 ** |
| Average number of children | 2.0 | 1.8 | 2.3 | 2.0 ** |
| Age of youngest child (%) | ||||
| 2 or under | 54.7 | 42.8 | 52.9 | 48.4 ** |
| 3 to 5 | 20.9 | 21.2 | 19.5 | 20.4 ** |
| 6 to 12 | 20.2 | 24.2 | 22.2 | 23.0 ** |
| 13 to 18 | 4.2 | 11.7 | 5.3 | 8.2 ** |
| Average age at birth of oldest child | 20.6 | 22.2 | 21.7 | 21.9 ** |
| Had a child as a teenager (%) | 52.8 | 40.2 | 45.9 | 43.8 ** |
| Welfare status (%) | ||||
| New recipient | 41.7 | 50.7 | 27.4 | 39.5 ** |
| Ongoing recipient | 58.3 | 49.3 | 72.6 | 60.5 ** |
| Average number of months of welfare receipt during two years prior to month of sample intake | 13.4 | 10.9 | 16.4 | 13.6 ** |
| Average number of months of food stamp receipt during two years prior to month of sample intake | 16.0 | 13.0 | 17.7 | 15.4 ** |
| Any earnings in two years prior to quarter of sample intake (%) | 67.7 | 61.6 | 46.9 | 55.5 ** |
| Average number of quarters of employment in two years prior to quarter of sample intake | 2.7 | 2.6 | 1.6 | 2.2 ** |
| Sample size | 10,393 | 62,388 | 88,226 | 161,007 |
| Sources: MDRC calculations from state and county administrative records and Background Information Forms. Notes: The samples were weighted equally by site. F-tests were used to assess differences across the main comparison groups. "**" indicates statistical significance at the 0.05 level or smaller. Additional F-tests were applied to differences between cyclers and short-term recipients and between cyclers and long-term recipients. For each comparision, differences on all measures were statistically significant at the 0.05 level or smaller, except: Cyclers and short-term recipients: (1) New recipient; (2) Ongoing recipient; (3) Average number of months of welfare receipt during two years prior to month of sample intake; and (4) Average number of months of food stamp receipt during two years prior to month of sample intake. Cyclers and long-term recipients: (1) Ages 25-34; and (2) Age of youngest child, 3 to 5 years. | ||||
Who is more likely to be a cycler?
| Characteristic or Environmental Condition | Odds Ratios and Statistical Significance | |
|---|---|---|
| For Becoming a Cycler Versus Becoming a Short-Term Recipient | For Becoming a Cycler Versus Becoming a Long-Term Recipient | |
| Ongoing recipient at sample intake | 0.962 | 0.853 ** |
| Total months of welfare receipt during two years prior to sample intake | 1.014 ** | 0.991 ** |
| Average monthly welfare grant during year prior to sample intake | 0.946 ** | 0.945 ** |
| Total months of food stamp receipt during two years prior to sample intake | 1.027 ** | 0.996 ** |
| Youngest child is less than 6 years old | 1.285 ** | 1.009 |
| Had a child as a teenager | 1.026 | 1.293 ** |
| Number of children | 1.173 ** | 0.881 ** |
| Female | 1.218 ** | 0.801 ** |
| Age 18 to 24 years | 3.320 ** | 1.961 ** |
| Age 25 to 34 | 2.028 ** | 1.902 ** |
| Age 35 to 44 years | 1.469 ** | 1.366 ** |
| Black | 1.642 ** | 0.901 ** |
| Hispanic(a) | 1.059 | 0.954 |
| Other(b) | 0.807 ** | 0.960 |
| No high school diploma or GED(c) | 1.375 ** | 0.848 ** |
| Missing high school diploma or GED variable | 1.134 | 1.276 ** |
| Total employment in county or region during month of sample intake (in 10,000's) | 1.088 ** | 1.186 ** |
| Total earnings during year prior to sample intake (in $1,000's) | 0.998 | 1.032 ** |
| Average unemployment rate during year 1 | 0.970 | 0.935 ** |
| Percentage change in unemployment rate from month of sample intake to month 48 | 1.001 | 1.001 |
| Welfare caseload in year 1 (in 10,000's) | 1.069 | 0.974 |
| Percentage change in welfare caseload from year 1 to year 4 | 1.012 | 1.010 |
| Total employment in county or region during month of sample intake | 0.990 ** | 0.983 ** |
| Percentage change in number employed from month of sample intake to month 48 | 1.001 | 1.004 |
| In the Connecticut Jobs First study | 2.008 | 0.101 ** |
| In the Vermont WRP study | 5.948 | 0.124 ** |
| In the UC-Cleveland study | 1.626 ** | 0.725 ** |
| In the UC-Philadelphia study | 1.048 | 0.196 ** |
| Randomly assigned in quarter 2, 1994 | 0.936 | 0.702 ** |
| Randomly assigned in quarter 3, 1994 | 1.052 | 1.249 ** |
| Randomly assigned in quarter 4, 1994 | 0.989 | 1.120 |
| Randomly assigned in quarter 1, 1995 | 1.180 | 1.326 ** |
| Randomly assigned in quarter 2, 1995 | 1.071 | 1.113 |
| Randomly assigned in quarter 3, 1995 | 1.058 | 1.188 |
| Randomly assigned in quarter 4, 1995 | 1.009 | 1.268 |
| Randomly assigned in quarter 1, 1996 | 1.114 | 1.531 ** |
| Randomly assigned in quarter 2, 1996 | 1.115 | 1.436 ** |
| Randomly assigned in quarter 3, 1996 | 1.482 ** | 2.376 ** |
| Randomly assigned in quarter 4, 1996 | 1.051 | 1.458 ** |
| Randomly assigned in quarter 1, 1997 | 1.543 | 1.686 ** |
| Randomly assigned in quarter 2, 1997 | 1.680 ** | 1.985 ** |
| Randomly assigned in quarter 3, 1997 | 2.191 ** | 2.689 ** |
| Randomly assigned in quarter 4, 1997 | 2.293 ** | 2.783 ** |
| Sources: MDRC calculations from state and county administrative records and Background Information Forms. Notes: The full sample includes 10,393 cyclers, 62,388 short-term recipients, and 88,226 long-term recipients. Effects were estimated with logistic regression with "Cycler" as the dependent variable. Separate regressions were run for samples of cyclers and short-term recipients and for samples of cyclers and long-term recipients. The samples were equally weighted by site. "**" indicates statistical significance at the 0.05 level or smaller. (a): Estimation of the effect is unreliable because fewer than 5 sample members in Florida FTP and Vermont WRP are cyclers and Hispanic. (b): Estimation of the effect is unreliable because fewer than 10 sample members in Connecticut Jobs First, Florida FTP, and Vermont WRP are cyclers and belong to the "other" ethnicity category. (c): Calculations are for sample members in Connecticut Jobs First, Florida FTP, and Vermont WRP evaluations only. | ||
Key Terms and Sample Definitions Used in This ReportPRWORA. The 1996 federal Personal Responsibility and Work Opportunity Reconciliation Act, which re-placed Aid to Families with Dependent Children (AFDC) with a flexible, state-directed block grant pro-gram, Temporary Assistance for Needy Families (TANF); set lifetime limits on eligibility to receive TANF payments; and created financial incentives for states to run mandatory work-focused welfare-to-work pro-grams. Evaluation Sites. Connecticut Jobs First, Florida FTP, and Vermont WRP. In these localities, MDRC con-ducted an experimental study of a welfare reform initiative, based on random assignment of sample mem-bers to program and control groups. Urban Change Sites. Cleveland (Cuyahoga County) and Philadelphia (Philadelphia County). These locali-ties are included in MDRC's ongoing Project on Devolution and Urban Change, a non-experimental analy-sis of the effects of PRWORA on welfare caseloads and recipient behavior in four major urban centers. Welfare Payment. An AFDC or TANF payment. Sample Intake Period. For evaluation sites, the months during which sample members were randomly as-signed to a program or control group. For Urban Change sites, a designated range of months, during which each sample member's first welfare payment was recorded. Month of Sample Intake. Varies by sample member. For evaluation sites, a sample member's month of random assignment. For Urban Change sites, a sample member's first month of welfare receipt during the sample intake period. Welfare Spell. A series of months of welfare payments-consecutive, or with interruptions that lasted for only one month. A new welfare spell was recorded when a sample member began receiving welfare after at least two consecutive months with no payments. First Welfare Spell. The welfare spell that included the month of sample intake, or which began one or two months later. Individuals with no welfare payments or whose first welfare spell began during a later month were excluded from the sample for this report. Observation Period. A four-year (48 month) period that began with each sample member's month of sam-ple intake, during which her welfare spells and other outcomes were recorded. The observation period in-cludes different calendar months for each sample member. Fifth-Year Follow-Up Period. Months 49 through 60, following each sample member's month of sample intake. Data on welfare receipt and other outcomes were available for most, but not all, sample members during these months. Cyclers. Sample members with three or more welfare spells during the (four-year) observation period. Short-Term Recipients. Sample members with one or two welfare spells and a total of 1 to 24 months of welfare receipt during the (four-year) observation period. Long-Term Recipients. Sample members with one or two welfare spells and a total of 25 to 48 months of welfare receipt during the (four-year) observation period. Ongoing Recipients. Sample members whose first welfare spell began at least four months prior to their month of sample intake. New Recipients. Sample members whose first welfare spell began no earlier than three months prior to their month of sample intake. |
We conducted a multivariate analysis of the probability of becoming a cycler to better understand the factors that affect cycling. Table 6 presents the results from this analysis. The first column of the table provides the odds ratios of the likelihood that a recipient becomes a cycler within the four-year observation period as opposed to becoming a short-term recipient.(26) To interpret the odds rations, note that ratios greater than 1 indicate a positive effect on cycling, and ratios less than one indicate a negative effect. For example, the 1.014 in column one indicates that each additional month of welfare receipt during the two years prior to sample intake increases the likelihood that a respondent will be a cycler as opposed to a short-term recipient by 1.4 percent. In contrast, the 0.946 coefficient in column one indicates that as the average monthly welfare grant increases by one dollar, the likelihood that a respondent will be a cycler as opposed to a short-term recipient decreases by 5.4 percent. Several other variables are significant in predicting the likelihood of cycling. In addition to prior welfare receipt, the number of children, being female, and the lack of a high-school diploma or GED(27) are all positively related to a recipient cycling on and off of welfare during the observation period as opposed to becoming a short-term recipient. In addition, younger recipients are significantly more likely to become cyclers than recipients older than age 45 at sample intake and black recipients are more likely to become cyclers than their white, non-Hispanic counterparts.
The second column of Table 6 shows the multivariate results for the probability of a recipient becoming a cycler as opposed to becoming a long-term recipient within the four-year observation period.(28) The factors that affect the likelihood of cycling versus short-term recipiency are the same factors that affect the likelihood of cycling versus long-term receipt. That is, many of the variables in the second column are statistically significant, although the implication differs. For example, the number of months of welfare receipt during the two years prior to sample intake is a negative predictor of cycling versus long-term receipt. Specifically, the likelihood of cycling decreases by about 1 percent for each additional month of welfare receipt. This is in contrast to the findings reported above, in which the likelihood of cycling increased about 1.4 percent for each additional month of welfare receipt when the likelihood of cycling was compared with short-term welfare receipt. Similarly, as the number of children increases, a respondent is less likely to be a cycler and more likely to be a long-term recipient.
The differences in the predictors of cycling are interesting and noteworthy. Being on welfare during sample intake is a predictor of cycling as compared with long-term recipiency, but this factor does not matter in determining the likelihood of cycling versus becoming a short-term recipient. In other words, past welfare receipt is a better predictor of whether a recipient is likely to cycle versus become a persistent user of welfare, but is not particularly helpful in distinguishing a potential cycler from a short-term recipient. Also, the results suggest that having a child less than 6 years old increases the likelihood of cycling versus short-term recipiency (by 28.5 percent), but the presence of such a young child does not affect the likelihood of cycling versus long-term recipiency. This indicates that there may be different barriers that affect cyclers and short-term recipients.
What are the patterns of welfare receipt and employment among cyclers?
The characteristics presented in Table 5 represented the pre-sample intake period. Table 7 shows welfare receipt and employment patterns during the four-year observation period. Based on the results of Table 5, which revealed that cyclers have characteristics that lie between those of long- term and short-term recipients, we would expect cyclers to fare somewhat better in terms of employment and welfare receipt than long-term recipients, but perhaps not quite as well as short-term recipients. Table 7 confirms this. The table shows that cyclers, on average, received 27 months of cash assistance within the four-year observation period, compared with 12 months for short-term recipients and 40 months for long-term recipients. The distribution of months of welfare receipt reveals that the largest percentage of cyclers (39 percent) had between 25 and 36 months of cash assistance receipt. In contrast, most short-term recipients (53 percent) received welfare for 12 months or less; and a large majority of long-term recipients remained on assistance for more than 36 months or three-quarters of the observation period.
The analysis of spell lengths also confirms the placement of cyclers between short-term and long-term recipients. The average length of the first spell for cyclers and short-term recipients was nearly identical (at 11 months each, respectively), while the first spell for long-term recipients lasted considerably longer (36 months).
Notably, nearly all sample members found employment at some point during the observation period; and employment levels were high among all three groups. On average, cyclers experienced greater success in the labor market than long-term recipients, but did not fare as well as short-term recipients. For example, over 90 percent of cyclers worked for pay during the four-year observation period, compared with 76 percent of long-term recipients and 82 percent for short-term recipients.(29)
Over four years, both cyclers and short-term recipients averaged between 8 and 9 quarters of employment. These averages may also be expressed as average quarterly employment rates. These indicators show that both cyclers and short-term recipients worked for pay during a little over half of the four-year (or 16-quarter) observation period.(30) The typical long-term recipient was employed during only 5.5 quarters, or about one-third of the quarters in the observation period.
| Outcome | Cyclers | Short-Term Recipients | Long-term Recipients | Full Sample |
|---|---|---|---|---|
| Welfare receipt | ||||
| Average total months of welfare receipt | 26.9 | 12.3 | 39.6 ** | 25.8 |
| Months of welfare receipt (%) | ||||
| 1-12 | 7.5 | 52.5 | 0.0 ** | 25.2 |
| 13-24 | 34.3 | 47.5 | 0.0 ** | 25.0 |
| 25-36 | 39.1 | 0.0 | 38.3 ** | 20.5 |
| 37-48 | 19.1 | 0.0 | 61.7 ** | 29.3 |
| Average number of welfare spells | 3.3 | 1.2 | 1.3 ** | 1.4 |
| Number of welfare spells (%) | ||||
| 1 | n/a | 76.8 | 71.8 ** | 68.1 |
| 2 | n/a | 23.2 | 28.2 ** | 23.5 |
| 3 or more | 100.0 | n/a | n/a | 8.5 |
| Average number of months of welfare receipt per spell | ||||
| Spell 1 | 11.0 | 10.8 | 35.6 ** | 22.0 |
| Spell 2(a) | 7.8 | 6.5 | 14.2 ** | 9.9 |
| Spell 3 | 6.8 | n/a | n/a | 6.8 |
| Received welfare (%) | ||||
| During last month of year 2 | 49.5 | 8.3 | 92.6 ** | 49.6 |
| During last month of year 4 | 39.6 | 2.7 | 46.1 ** | 25.3 |
| Average monthly welfare receipt (%) | 54.6 | 25.4 | 81.6 ** | 53.1 |
| Total welfare payments ($) | 9,323 | 4,667 | 16,755 ** | 10,487 |
| Employment | ||||
| Ever employed (%) | 91.1 | 81.6 | 76.0 ** | 79.9 |
| Average quarterly employment (%) | 54.5 | 52.0 | 34.2 ** | 44.2 |
| Average total quarters of employment | 8.7 | 8.3 | 5.5 ** | 7.1 |
| Quarters of employment (%) | ||||
| 0 | 8.9 | 18.4 | 24.0 ** | 20.1 |
| 1 to 4 | 15.2 | 16.3 | 25.2 ** | 20.2 |
| 5 to 8 | 21.9 | 12.0 | 23.3 ** | 17.9 |
| 9 to 12 | 25.7 | 17.8 | 15.2 ** | 17.3 |
| 13 to 16 | 28.3 | 35.5 | 12.3 ** | 24.5 |
| Total earnings ($) | 16,885 | 24,974 | 10,022 ** | 17,577 |
| If ever employed: | ||||
| Average quarterly employment (%) | 59.8 | 63.7 | 44.9 ** | 55.3 |
| Total earnings ($) | 18,537 | 30,619 | 13,180 ** | 22,003 |
| Average earnings per quarter employed ($) | 1,938 | 3,002 | 1,833 | 2,486 |
| Percentage of quarters in employment and welfare status (%) | ||||
| Employed and did not receive welfare | 20.2 | 37.9 | 8.6 ** | 23.3 |
| Employed and received welfare | 34.2 | 14.1 | 25.5 ** | 20.9 |
| Not employed and received welfare | 33.5 | 16.3 | 60.1 ** | 37.4 |
| Not employed and did not receive welfare | 12.0 | 31.7 | 5.8 ** | 18.4 |
| Food stamp receipt | ||||
| Average total months of food stamp receipt | 33.9 | 19.2 | 40.7 ** | 30.1 |
| Months of food stamp receipt (%) | ||||
| 0-12 | 2.6 | 38.0 | 2.5 ** | 19.1 |
| 13-24 | 17.7 | 32.4 | 2.3 ** | 17.7 |
| 25-36 | 33.2 | 15.0 | 20.3 ** | 18.9 |
| 37-48 | 46.6 | 14.5 | 74.9 ** | 44.3 |
| Average monthly food stamp receipt (%) | 70.6 | 40.0 | 84.8 ** | 62.7 |
| Total food stamp payments ($) | 8,036 | 4,140 | 10,381 ** | 7,271 |
| Total measured income ($)(b) | 34,244 | 33,781 | 37,157 ** | 35,336 |
| Sample size | 10,393 | 62,388 | 88,226 | 161,007 |
| Sources: MDRC calculations from state and county administrative records. Notes: The samples were equally weighted by site. F-tests were used to assess differences across the main comparison groups. "**" indicates statistical significance at the 0.05 level or smaller. "n/a" indicates "not applicable." By definition, cyclers are the only group with three or more welfare spells. (a): Calculations are for sample members with a second welfare spell. (b): This measure represents the sum of before-tax UI earnings, TANF, and food stamps. It excludes Earned Income Tax Credits, earnings from other adults in the family, and other unearned income (e.g., child support and Supplemental Security Income benefits). | ||||
Less positively, cyclers experienced less stable employment, than short-term recipients. About 28 percent of cyclers worked for pay during 13 or more quarters, or 75 percent of the 4-year (16-quarter) observation period. In contrast, more than 35 percent of short-term recipients worked for 13 or more quarters. Furthermore, among sample members who worked for pay during the observation period, short-term recipients worked a larger percentage of quarters compared with cyclers 63.7 percent versus 59.8 percent. (See the average quarterly employment rate for "ever employed.") As expected, a very small minority, 12.3 percent, of long-term recipients experienced stable employment, defined as working for 13 or more quarters, during the observation period.
On average, cyclers earned considerably less during the observation period than short-term recipients. The typical cycler earned a total of $16,885 over four years, over $8,000, or 33 percent, below the total for short-term recipients. Averages for each group include $0s for sample members with no recorded earnings after sample intake.
It is somewhat surprising that cyclers earned so much less than short-term recipients during the observation period, because a larger proportion of cyclers ever worked for pay: 91.1 percent versus 81.6 percent. Short-term recipients' greater employment stability and higher earnings on the job explain the disparity in total earnings. These findings are illustrated by comparing employment and earnings outcomes for each group, when only employed sample members are considered. First, as noted above, short-term recipients remained employed during a larger portion of the observation period than cyclers: 63.7 percent of quarters versus 59.8 percent. Second, short-term recipients earned, on average, $3,002 during each quarter of employment, more than $1,000 (or 55 percent) above the average for cyclers. This difference in average quarterly earnings suggests that short-term recipients worked at better jobs with more hours of work and higher pay compared with cyclers. This issue is addressed more directly in Section IV.D., which reports findings on job characteristics for the three groups, based on survey responses.
Once again, long-term recipients experienced the least success among the three groups. The typical long-term recipient earned a total of $10,022 during the four-year observation period, less than half of the average for short-term recipients and nearly $7,000 less than the mean for cyclers. Among the three groups, long-term recipients who worked for pay remained employed for the smallest percentage of quarters (44.9), but earned about the same per quarter of employment ($1,833). It should be noted, however, that cyclers did not fare much better than long-term recipients in this last measure, averaging only about 6 percent more in earnings per quarter employed. This finding underscores the difficulty that many cyclers may have encountered in advancing to well-paying jobs.
The last panel of indicators in the Employment section shows the percentage of quarters in the observation period in which sample members spent in one of the four welfare and employment statuses: (1) employment and no receipt of welfare benefits; (2) employment and receipt of welfare benefits; (3) no employment and receipt of welfare benefits; and (4) no recorded income from either employment or welfare. The first of these statuses may be viewed as the most self-sufficient. Although many welfare programs presently encourage recipients to combine work and welfare through such policies as expanded earned income disregards, quarters with both earnings and welfare benefits represent a more ambiguous status. While they may occur because the sample member received earnings and welfare simultaneously, a quarter with earnings and welfare could indicate a transition from welfare to employment, or less positive, a loss of employment and return to welfare. Quarters of welfare receipt and no employment represent the least beneficial outcome.
Finally, receipt of no measured income from earnings or welfare represents a particularly difficult status to interpret. Individuals in this status may have left welfare without employment and lived without a reliable source of income. However, this status may not indicate a lack of funds flowing into the household. For example, sample members in this status could actually be working out of state or in a job that is not reported to their state's unemployment insurance system. Alternatively, they could have exited welfare without employment because of marriage to or cohabitation with a person whose income was sufficient to support the family.
The percentages presented in this panel of Table 7 may be considered in two ways. First, one can directly compare the three groups' results for each status. Second, one can focus only on the portion of the observation period in which group members were employed that measure is displayed as the average quarterly employment rate within the Employment section. For this second comparison, one would ask: In what proportion of their quarters of employment did sample members rely solely on earnings? In what proportion of their employed quarters did they combine work and welfare?
Cyclers' patterns of work and welfare indicate somewhat greater self-sufficiency than long-term recipients but considerably less than short-term recipients. Cyclers averaged relatively few quarters in the most self-sufficient status, employment without welfare. For cyclers, these quarters account for about one-fifth of the observation period and about 37 percent of the quarters in which they worked. (The latter percentage is calculated by dividing cyclers' percentage of quarters in which they were employed and received welfare benefits, 20.2 percent, by their average quarterly employment rate, 54.5 percent.) Long-term recipients worked without welfare for even less of the observation period, 8.6 percent and 25 percent of the quarters in which they worked for pay. Short-term recipients, on the other hand, typically received no welfare benefits during quarters in which they worked. On average, they spent about 38 percent of the observation period employed and without welfare, as well as more than 70 percent of their quarters of employment.
Cyclers also differed from short-term and long-term recipients in the extent to which they combined work and welfare. Cyclers received both earnings and welfare benefits during 34 percent of the quarters in the observation period and in more than 60 percent of the quarters in which they worked. These averages are much higher compared with both short-term and long-term recipients. Long-term recipients combined employment and welfare in 25.5 percent of the quarters, and short-term recipients combined work and welfare far less frequently, in only 14.1 percent of quarters in the observation period.
The remaining portion of the observation period consisted of quarters in which sample members experienced the most dependent status, jobless and receiving welfare benefits, and quarters in which they were in the more ambiguous status of receiving no income from earnings or welfare. As expected, long-term recipients spent the largest portion of the observation period on assistance and with no employment (60.1 percent) and short-term recipients recorded the smallest percentage (16.3 percent). The average for cyclers fell somewhere in between (33.5 percent). Short-term recipients were, by far, the group most likely to receive neither earnings nor welfare benefits (31.7 percent).
Table 7 also shows that cyclers remained more dependent on food stamps than short-term recipients. For example, cyclers averaged 34 months of foods stamps receipt, compared with just 19 months of receipt for short-term recipients. In fact, the receipt of food stamps among cyclers is closer to that among long-term recipients, who received 41 months of food stamps benefits on average. Furthermore, slightly less than half of all cyclers received food stamps over three-fourths or more of the observation period, that is, for 37 to 48 months. In contrast, the greatest proportion of short-term recipients (38 percent) received food stamps for 12 months or less.
Finally, Table 7 presents the averages for the three groups in total measured income from individual earnings, welfare, and food stamps during the observation period.(31) Note that earnings from other family members are not included, nor are Earned Income Tax Credits (EITC) that can supplement personal earnings. The totals for the three groups are fairly similar with cyclers receiving about 1 percent more in measured personal income than short-term recipients and about 9 percent less than long-term recipients. The primary difference is in sources of their income. As discussed above, short-term recipients received most of their income from employment (74 percent, not shown), compared with about one-half for cyclers and a little more than one-quarter of their measured income for long-term recipients. The similarity of income levels among the three groups underscores the difficulty that many members of each group experienced in finding jobs that paid more than welfare and food stamps.
In summary, cyclers tended to have short spells of welfare receipt, similar to short-term recipients, but they are more attached to the welfare system, similar to long-term recipients. Most cyclers worked for 9 or more quarters, the majority of the observation period, similar to short-term recipients. However, their level of earnings more closely resembled that of long-term recipients. Cyclers also were more likely than short- and long-term recipients to combine work and welfare. The difference between cyclers and short-term recipients appears to be that cyclers keep returning to welfare, somehow unable to sustain their families with employment alone as do short-term recipients.
Do these differences persist when we control for variation in sample members' background characteristics?
As discussed in Section A, cyclers, short-term, and long-term recipients differ in several background characteristics, such as age, number of children, and prior work history. Previous research on welfare populations has shown that these characteristics often affect individuals' patterns of employment and welfare receipt after sample intake.(32) For example, long-term recipients had the highest proportion of sample members with no prior work history; therefore, we would expect that this group would show the lowest incidence of employment among the three groups after sample intake. One way to address this issue is by calculating adjusted means that is, means and proportions in outcome measures that control for differences in background characteristics among the groups being compared. Table 8 displays the adjusted means (and differences) for cyclers, short-term recipients, and long-term recipients for the outcome measures shown in Table 7. Adjusted means were calculated with OLS regression, controlling for the same characteristics as displayed in Table 6 and weighting equally by site. (See Appendix for details of the calculations.)
When comparing adjusted means for cyclers, short-term recipients and long-term recipients, one asks whether employment and welfare outcomes for these groups would still be different if the background characteristics were taken into account. If differences in outcomes persist, one can, with greater confidence, assert that cyclers, short-term recipients, and long-term recipients experienced different levels of success in finding and keeping jobs and in attaining self-sufficiency.
| Outcome | Cyclers | Short-Term Recipients | Difference | Cyclers | Long-term Recipients | Difference |
|---|---|---|---|---|---|---|
| Welfare receipt | ||||||
| Average total months of welfare receipt | 27.3 | 13.2 | 14.1** | 27.3 | 38.6 | -11.3 ** |
| Months of welfare receipt (%) | ||||||
| 1-12 | 6.9 | 50.8 | -43.9 ** | 6.9 | n/a | n/a |
| 13-24 | 34.8 | 48.7 | -13.9 ** | 34.8 | n/a | n/a |
| 25-36 | 37.1 | n/a | n/a | 37.1 | 41.4 | -4.3 ** |
| 37-48 | 21.2 | n/a | n/a | 21.2 | 58.1 | -36.8 ** |
| Average number of welfare spells | 3.2 | 1.2 | 2.0 ** | 3.2 | 1.3 | 1.9 ** |
| Average number of months of welfare receipt per spell | ||||||
| Spell 1 | 11.8 | 11.8 | 0.0 | 11.8 | 34.5 | -22.7 ** |
| Spell 2(a) | 7.6 | 6.5 | 1.2 ** | 7.6 | 13.8 | -6.2 ** |
| Spell 3 | 6.8 | n/a | n/a | 6.8 | n/a | n/a |
| Received welfare (%) | ||||||
| During last month of year 2 | 49.7 | 8.8 | 40.9 ** | 49.7 | 92.1 | -42.3 ** |
| During last month of year 4 | 41.9 | 5.9 | 36.1 ** | 41.9 | 42.3 | -0.4 ** |
| Average monthly welfare receipt (%) | 55.8 | 27.2 | 28.6 ** | 55.8 | 79.4 | -23.6 ** |
| Total welfare payments ($) | 10,274 | 5,531 | 4,742 ** | 10,274 | 15677 | -5,404 ** |
| Employment | ||||||
| Ever employed (%) | 86.0 | 79.7 | 6.3 ** | 86.0 | 78.9 | 7.1 ** |
| Average quarterly employment (%) | 50.4 | 50.0 | 0.4 | 50.4 | 37.0 | 13.4 |
| Average total quarters of employment | 8.1 | 8.0 | 0.1 | 8.1 | 5.9 | 2.1 ** |
| Quarters of employment (%) | ||||||
| 0 | 14.0 | 20.3 | -6.3 ** | 14.0 | 21.1 | -7.1 ** |
| 1 to 4 | 15.5 | 16.9 | -1.3 ** | 15.5 | 24.5 | -9.0 ** |
| 5 to 8 | 20.6 | 11.7 | 8.9 ** | 20.6 | 23.9 | -3.3 ** |
| 9 to 12 | 24.4 | 17.5 | 6.9 ** | 24.4 | 15.8 | 8.6 ** |
| 13 to 16 | 25.5 | 33.7 | -8.2 ** | 25.5 | 14.7 | 10.8 ** |
| Total earnings ($) | 16,489 | 23,781 | -7,293 ** | 16,489 | 11,335 | 5,153 ** |
| If ever employed: | ||||||
| Average quarterly employment (%) | 59.3 | 62.7 | -3.5 ** | 59.3 | 46.9 | 12.4 |
| Total earnings ($) | 19,902 | 29,763 | -9,862 ** | 19,902 | 14,334 | 5,568 ** |
| Average earnings per quarter employed ($) | 2,099 | 2,965 | -866 ** | 2,099 | 1,911 | 188 ** |
| Percentage of quarters in employment and welfare status (%) | ||||||
| Employed and did not receive welfare | 18.3 | 36.8 | -18.5 ** | 18.3 | 10.1 | 8.2 |
| Employed and received welfare | 32.0 | 13.2 | 18.9 ** | 32.0 | 26.9 | 5.1 ** |
| Not employed and received welfare | 36.4 | 18.8 | 17.6 ** | 36.4 | 56.9 | -20.5 ** |
| Not employed and did not receive welfare | 13.2 | 31.2 | -18.0 ** | 13.2 | 6.0 | 7.2 ** |
| Food stamp receipt | ||||||
| Average total months of food stamp receipt | 33.9 | 20.5 | 13.3 ** | 33.9 | 39.3 | -5.4 ** |
| Months of food stamp receipt (%) | ||||||
| 0-12 | 3.4 | 35.3 | -31.9 ** | 3.4 | 5.1 | -1.6 ** |
| 13-24 | 17.7 | 32.3 | -14.6 ** | 17.7 | 2.5 | 15.2 ** |
| 25-36 | 32.0 | 13.9 | 18.1 ** | 32.0 | 21.8 | 10.2 ** |
| 37-48 | 46.9 | 18.5 | 28.4 ** | 46.9 | 70.7 | -23.7 ** |
| Average monthly food stamp receipt (%) | 70.6 | 42.8 | 27.8 ** | 70.6 | 81.8 | -11.3 ** |
| Total food stamp payments ($) | 8,005 | 4,743 | 3,262 ** | 8,005 | 9,760 | -1,755 ** |
| Total measured income ($)(b) | 34,767 | 34,056 | 711 ** | 34,767 | 36,773 | -2,006 ** |
| Sample size | 10,393 | 62,388 | 10,393 | 88,226 | ||
| Sources: MDRC calculations from state and county administrative records. Notes: Estimates are regression-adjusted using ordinary least squares, controlling for sample member characteristics and environmental conditions. The samples were equally weighted by site. Results from logistic regressions performed on binary outcomes were consistent with the above results. "**" indicates statistical significance at the 0.05 level or smaller. "n/a" indicates "not applicable." By definition, cyclers are the only group with three or more welfare spells. See Table 6 for characteristics and conditions used as controls. (a): Calculations are for sample members with a second welfare spell. (b): This measure represents the sum of before-tax UI earnings, TANF, and food stamps. It excludes Earned Income Tax Credits, earnings from other adults in the family, and other unearned income (e.g., child support and Supplemental Security Income benefits). |
||||||
Column 3 and column 6 of Table 8 present the differences between cyclers and short-term- and long-term recipients, respectively, after adjusting for the sample member characteristics presented in Table 6. The results confirm the patterns from Table 7 discussed above. For example, even when we control for differences in sample members' background characteristics, cyclers still averaged twice the number of months of welfare receipt over four years than short-term recipients and nearly 30 percent fewer months of welfare receipt than long-term recipients. The employment patterns for the three groups also resemble those seen in Table 7. Despite their higher incidence of employment, cyclers earned on average nearly $7,300 less over four years than short-term recipients, but about $5,100 more than long-term recipients. In addition, rather than falling between short- and long-term recipients, cyclers continued to have the highest percentage of quarters with both employment and welfare receipt compared with both groups of recipients. Cyclers were also much less likely than short-term recipients to be working and receiving no welfare benefits. Finally, long-term recipients continued to receive the highest (and short-term recipients the lowest) combined income from personal earnings, welfare, and food stamps.(33) However, the range in income among the three groups was smaller (about $2,700 or $675 per year) when differences in sample members' background characteristics were controlled for.
Overall, Table 8 shows that, after controlling for a number of factors that predict cycling, there remain significant differences between cyclers and short-term recipients. Cyclers have more work exposure and stronger attachment to the welfare system, but lower earnings and less employment stability. On the other hand, cyclers continued to show greater success in the labor market and less dependency on welfare than long-term recipients.
What are the employment and job characteristics of cyclers?
Survey responses provide additional information on labor market outcomes for cyclers, short-term recipients, and long-term recipients. (34) Table 9 presents outcomes on employment. Among respondents, cyclers experienced less stable employment and worked at lower quality jobs compared with short-term recipients. They fared only somewhat better in the labor market than long-term recipients. These results are consistent with findings calculated from administrative records for the full sample.
| Outcome | Cyclers | Short-Term Recipients | Long-term Recipients | Full Sample |
|---|---|---|---|---|
| Ever employed (%) | 93.0 | 90.7 | 86.1 ** | 88.3 |
| No longer employed at interview | 39.3 | 19.2 | 38.8 ** | 31.9 |
| Employed at interview | 53.8 | 71.5 | 47.4 ** | 56.5 |
| Employed part-time at interview | 8.2 | 12.2 | 13.6 ** | 12.6 |
| Employed full-time at interview | 44.5 | 58.0 | 31.5 ** | 42.1 |
| Employed with medical coverage at interview | ||||
| Offered | 22.9 | 40.2 | 18.3 ** | 26.5 |
| Enrolled | 11.4 | 26.6 | 8.2 ** | 15.0 |
| Average hourly wage, if employed at interview ($) | 7.53 | 8.24 | 7.38 ** | 7.78 |
| Sample size | 348 | 1,550 | 2,387 | 4,285 |
| Sources: MDRC calculations from survey responses. Notes: Sample members were interviewed between 36 and 60 months after sample intake. The samples were equally weighted by site. F-tests were used to assess differences across the main comparison groups. "**" indicates statistical significance at the 0.05 level or smaller. | ||||
As shown in Table 9, nearly all respondents in each group reported working for pay during at least part of the observation period. However, cyclers were twice as likely as short-term recipients to be jobless at the time of their interview (39.3 percent versus 19.2 percent). In fact, cyclers' rate of job loss more closely resembled the level for long-term recipients (38.8 percent). Similarly, compared with short-term recipients, a smaller percentage of cyclers worked at jobs that provided full-time employment - that is, for thirty or more hours per week at the time of their interview. Cyclers also reported a lower incidence of working at jobs that offered medical coverage, about 17 percentage points below the level of 40.2 percent for short-term recipients. A similar difference was found on rates of enrollment in employer-provided medical plans.(35) Levels of coverage for cyclers exceeded the rates for long-term recipients, but by less than 5 percentage points. Finally, among respondents who were working at the time of their interview, cyclers averaged about $0.71 less per hour of work, compared with short-term recipients, and earned only slightly more per hour than long-term recipients.
What are the living arrangements and conditions of cyclers?
Table 10 shows data on respondents' living arrangements and material conditions, calculated from survey responses. On average, cyclers had less access to support (financial and otherwise) from other adults and lived under more tenuous circumstances compared with short-term recipients. These findings may help explain why the members of this group return to welfare. About one-fifth of cyclers reported that they were living with a spouse or partner at the time of their interview, compared with one-third of short-term recipients. Cyclers' lower marriage rate (of 9.3 percent, compared with 20.1 percent for short-term recipients) accounts for nearly all of this difference. Cyclers were similarly less likely than short-term recipients to be living with another wage earner at the time of their interview. Finally, a higher percentage of cyclers reported that they gave birth to or adopted another child after sample intake. Most likely, the birth of a child caused disruptions to the employment situation of cyclers and increased their need for financial support, compared with short-term recipients.
Results for cyclers on these measures of household membership and support more closely resembled those for long-term recipients. As with cyclers, about one-fifth of long-term recipients were married or cohabiting at the time of their interview, although, compared with cyclers, a somewhat lower percentage of long-term recipients reported living with another wage-earner (19.1 percent versus 22.6 percent). On the other hand, a slightly smaller percentage of long-term recipients (28 percent) reported that they had given birth to or adopted another child since sample intake about three percentage points below the level for cyclers.
The next panel of Table 10 presents patterns of medical coverage. All TANF recipients are eligible for medical coverage under Medicaid. However, many TANF leavers do not replace their publicly-funded coverage with coverage from employers or other private providers. Results for cyclers, short-term recipients, and long-term recipients were consistent with these findings. Long-term recipients reported the highest rates of coverage from any source (86.0 percent) among the three groups, followed by cyclers (78.3 percent) and short-term recipients (69.2 percent). Not surprisingly, given their higher incidence of welfare receipt, cyclers and, especially, long-term recipients reported much higher rates of coverage from Medicaid and other publicly-funded plans, compared with short-term recipients, and much lower rates of coverage from employers and private plans.
| Outcome(%) | Cyclers | Short-Term Recipients | Long-term Recipients | Full Sample |
|---|---|---|---|---|
| Household membership | ||||
| Lives with spouse or partner | 19.9 | 33.3 | 18.7 ** | 24.0 |
| Lives with spouse | 9.3 | 20.1 | 6.9 ** | 11.8 |
| Lives with partner | 10.9 | 13.5 | 11.9 | 12.4 |
| Gave birth to or adopted a child since sample intake | 31.1 | 18.8 | 28.2 ** | 25.1 |
| At least one other household member employed | 22.6 | 34.8 | 19.1 ** | 25.0 |
| Medical coverage for respondent | ||||
| Any coverage | 78.3 | 69.2 | 86.0 ** | 79.4 |
| Medicaid or other publicly-funded coverage | 64.2 | 37.1 | 73.8 ** | 59.9 |
| Employer- or other privately-funded coverage | 19.8 | 36.0 | 15.1 ** | 22.9 |
| Material hardship | ||||
| Experienced at least one material hardship | 68.0 | 55.3 | 78.7 ** | 69.6 |
| Experienced three or more material hardships | 18.4 | 18.1 | 28.4 ** | 23.9 |
| Food insecurity | ||||
| Experienced food insecurity | 30.8 | 21.2 | 35.3 ** | 29.9 |
| Experienced food insecurity with hunger | 15.7 | 15.5 | 14.9 | 15.2 |
| Sample size | 348 | 1,550 | 2,387 | 4,285 |
| Sources: MDRC calculations from survey responses. Notes: Sample members were interviewed between 36 and 60 months after sample intake. The samples were equally weighted by site. F-tests were used to assess differences across the main comparison groups. "**" indicates statistical significance at the 0.05 level or smaller. Material hardships include (1) could not pay full amount of rent or mortgage; (2) evicted for non-payment of rent or mortgage; (3) could not pay full amount of utility bills; (4) had electricity or gas turned off; (5) had telephone disconnected; (6) had unmet medical needs; and (7) had unment dental needs. Respondents in Vermont WRP were not asked about material hardships and were not included in the calculations of these measures. Levels of food insecurity are measured from responses to a subset of the questions in the Household Food Security Scale that is administered by the Census Bureau in the Current Population Survey. | ||||
As shown in the second to last panel of Table 10, a majority of respondents in all three groups reported that they experienced at least one material hardship after sample intake. As noted above, cyclers, as a group, had less partner support and more births and interruptions to work than short-term recipients. Perhaps related to these issues, cyclers also reported a higher incidence of experiencing at least one material hardship after sample intake compared with short-term recipients (68 percent versus 55.3 percent). By a similar margin, a higher percentage of cyclers than short-term recipients reported experiencing food insecurity (Table 10, bottom panel). However, these differences did not extend to more extreme forms of hardship and food insecurity. Cyclers and short-term recipients showed no significant difference in either experiencing three or more material hardships or in food insecurity with hunger.
Results for cyclers were more positive than for long-term recipients. The proportion of long-term recipients who reported experiencing at least one material hardship exceeded that rate for cyclers by about 11 percentage points. A similar difference was found for the incidence of experiencing three or more hardships. Long-term recipients were also more likely than cyclers, by 4.5 percentage points, to have experienced food insecurity.
What are the employment and welfare outcomes after cycling?
As noted in the Introduction, cyclers may eventually attain stable employment without welfare, similar to welfare leavers who did not cycle. To explore this view further, we compare employment and welfare outcomes of cyclers, short-term recipients, and long-term recipients in the five-year follow-up sample during the year following the observation period.
Table 11 presents adjusted means of employment and welfare outcomes for the fifth year after sample intake. These calculations were performed for the five-year follow-up sample.(36) As with the findings in Table 8, the comparisons of employment and welfare outcomes control for differences among the three groups in background characteristics (displayed in Table 6,) that could affect sample members' patterns of work and welfare after sample intake.
| Outcome(%) | Cyclers | Short-Term Recipients | Difference | Cyclers | Long-term Recipients | Difference |
|---|---|---|---|---|---|---|
| Ever employed in year 5 | 65.9 | 59.5 | 6.4 ** | 65.9 | 60.6 | 5.3 ** |
| Employed during all four quarters of year 5 | 28.1 | 31.1 | -3.0 ** | 28.1 | 25.8 | 2.2 ** |
| If employed in year 5 | 42.9 | 52.3 | -9.3 ** | 42.9 | 42.2 | 0.7 |
| Employed in the last quarter of year 5 | 41.3 | 39.5 | 1.9 ** | 41.3 | 39.0 | 2.3 ** |
| If employed in year 5 | 63.2 | 66.7 | -3.6 ** | 63.2 | 63.7 | -0.6 |
| Received welfare in the last month of year 5 | 25.0 | 7.4 | 17.5 ** | 25.0 | 33.5 | -8.6 ** |
| Employment and welfare status in the last quarter of year 5 | ||||||
| Employed and did not receive welfare | 29.6 | 36.6 | -7.0 ** | 29.6 | 25.4 | 4.2 ** |
| Employed and received welfare | 11.8 | 2.9 | 8.9 ** | 11.8 | 13.6 | -1.9 ** |
| Not employed and received welfare | 18.9 | 5.0 | 13.9 ** | 18.9 | 23.7 | -4.7 ** |
| Not employed and did not receive welfare | 39.7 | 55.5 | -15.8 ** | 39.7 | 37.3 | 2.4 ** |
| Sample size | 9,195 | 53,237 | 9,195 | 83,719 | ||
| Sources: MDRC calculations from state and county administrative records. Notes: Calculations were performed for sample members with five years of follow-up data. The samples were equally weighted by site. The Connecticut Jobs First sample lacked five years of follow-up data and was excluded from the calculations. Estimates are regression-adjusted using ordinary least squares, controlling for sample member characteristics and environmental conditions. Results from logistic regressions performed on binary outcomes were consistent with the above results. "**" indicates statistical significance at the 0.05 level or smaller. | ||||||
The results in Table 11 point to several positive longer-term trends. First, employment levels for each group converged: Between 60 and 66 percent of members of the five-year follow-up sample worked for pay during year 5 and about 40 percent of each group were still employed during the last quarter of the year. In addition, the large majority of sample members even long-term recipients were no longer receiving welfare benefits at the end of year 5. Finally, each group demonstrated greater self-sufficiency during year 5 compared with the observation period. More specifically, it may be recalled that a larger percentage of cyclers who found employment during the observation period received earnings and welfare benefits during the same quarter than relied on earnings alone. This pattern was reversed by the end of year 5, when 29.6 percent of cyclers were employed without welfare, in contrast to only 11.8 percent who received both earnings and welfare benefits. A similar reversal occurred among long-term recipients.
Less positively, the table also shows that joblessness and unstable employment remained a problem for all three groups. About 35 to 41 percent of sample members never worked for pay during year 5. Furthermore, one-third or more of sample members ever employed during year 5 were no longer working during the last quarter.
Cyclers continued to show a higher incidence of employment than either short-term or long-term recipients in year 5. However, employment among cyclers was not as stable as that among short-term recipients. Specifically, 28.1 percent of cyclers were employed during all four quarters of year 5, compared with 31.1 percent of short-term recipients. This result continues to hold among those employed in year 5. Among employed sample members, the proportion of cyclers who worked for pay during all four quarters of year 5 (42.9 percent) was more than 9 percentage points below the level for short-term recipients. While cyclers had more stable employment compared with long-term recipients (cyclers are employed 2 percentage points more than long-term recipients during all four quarters), among those employed, there was no difference in employment stability in year 5.
Again, cyclers exhibited stronger attachment to the welfare system than short-term recipients, but less attachment than long-term recipients, as represented by the percentage that received TANF benefits in the last month of year 5. In this month, cyclers were 17.5 percentage points more likely than short-term recipients to be receiving cash assistance, but 8.6 percentage points less likely than long-term recipients.
As noted above, nearly 30 percent of cyclers worked for pay at the end of year 5 and did not receive welfare benefits. This average exceeded the level for long-term recipients by 4 percentage points but was 7 percentage points below the level for short-term recipients. Cyclers were also about four times more likely than short-term recipients to combine work and welfare (11.8 percent to 2.9 percent) and did so only slightly less often than long-term recipients. In other words, fewer cyclers than short-term recipients were able to sustain themselves with employment alone.(37)
Thus, by the end of year 5, cyclers did not "catch up" to short-term recipients in key measures of employment stability and self-sufficiency, although they continued to fare better than long-term recipients.
In summary, cyclers were shown to be a group in the middle less disadvantaged in the labor market than long-term recipients, but less able than short-term recipients to attain stable employment and work without welfare. Furthermore, cyclers were the most likely to be parents of toddlers and preschoolers and therefore had the greatest need for reliable child care while employed. However, compared with short-term recipients, cyclers had less access to financial and other support from a spouse or partner.
(24) Appendix Table 1 presents the characteristics of sample members by site.
(25) In other words, the significance test measures that there is a difference between at least two of the groups, but does not indicate whether cyclers are significantly different from both short-term and long-term recipients. See NOTES in Table 5 for results of tests of differences between cyclers and short-term recipients and between cyclers and long-term recipients. A statistical test was not performed on differences in the percentage of families whose youngest child was aged less than six years.
(26) See Appendix Table 2A for the corresponding analysis by site.
(27) This finding pertains only to members of the three evaluation sites. Data on educational attainment were unavailable for the Cleveland and Philadelphia samples.
(28) See Appendix Table 2B for the corresponding analysis by site.
(29) Possibly, employment levels for short-term recipients were most subject to underreporting because of movement out of state.
(30) The average quarterly employment rate shows the percentage of quarters employed. The rate is calculated as total quarters employed divided by 16 (the number of quarters in the observation period), expressed as a percentage.
(31) See also Ver Ploeg, 2002, Table 13-15 and pp. 445-446; and Miller, 2002, Figure 1C and pp. 24, 27. Ver Ploeg found that long-term recipients averaged more than both short-term recipients and cyclers in income from personal earnings, welfare, and food stamps, measured with administrative data. Miller, using survey data on total household income (which includes earnings of other household members) found that welfare leavers in Connecticut Jobs First, Florida FTP, and Vermont WRP averaged higher incomes than longer-term stayers.
(32) See, for example, Hamilton et al., 2001, Appendix Tables F.1-F.3, pp. 392-395.
(33) Earnings from other family members are not included, nor are Earned Income Tax Credits (EITC) that can supplement personal earnings.
(34) See Table 2 for information on intake dates and sample sizes for survey respondents. Responses were pooled and weighted equally by site. Within each site, the number of cyclers is relatively small. Therefore, simple means and percentages are shown in Table 9. These measures were not adjusted for differences in respondents' characteristics, nor for site differences in labor market and other environmental conditions.
(35) These differences are not solely the result of higher employment levels for short-term recipients at the time of interview. When only respondents who were working at interview are considered, about 56 percent of short-term recipients, 43 percent of cyclers, and 39 percent of long-term recipients reported working for an employer who offered medical coverage.
(36) Note that this subsample does not include the Connecticut Jobs First program. See Table 2 for the composition of the sample.
(37) It is also worth noting that short-term recipients had, by far, the highest percentage of sample members who did not work for pay and did not receive welfare. Prior research has shown that some people in this status are actually working out of state or in jobs not covered by the Unemployment Insurance system, whereas others are truly unemployed. Most likely, the group without employment or welfare benefits included sample members who were living with a spouse, partner, or other adult who was employed and providing financial support to the sample member and her children. However, others may have had no steady source of income and were living in extreme hardship.
How have welfare reforms affected recipients?
What is the impact of pre-PRWORA welfare reform policies on cycling?
We utilize the random assignment design of the three evaluation sites to ask whether the program implemented at each site affected the likelihood of cycling. Each site's program was implemented pre-PRWORA and was designed to evaluate several aspects of change in welfare benefit receipt. While many of these policies were later enacted under PRWORA, they should not be seen as representing final PRWORA implementation. Our analysis is based on program group and control group differences in cycling rates, after controlling for the factors shown to affect cycling in Table 6.
The results of the analysis are presented in Table 12. The top panel of the table shows impacts for the full sample, which includes both new recipients to welfare and recipients in the middle of a welfare spell at the time of sample intake, whereas the lower panel shows impacts for new recipients.(38) This panel shows how results would differ when using a sample for which all spell lengths are known, at least since their month of the sample intake. The top panel of the table shows that the Connecticut Jobs First program had a small but statistically significant effect on the likelihood of cycling for the full sample. The program decreased the occurrence of welfare cycling by 2.9 percentage points, while increasing the likelihood of short-term recipiency by 8.2 percentage points.
The results for Florida FTP are similar in direction. Although the program did not affect the likelihood of welfare cycling, it did increase the likelihood of short-term recipiency and decreased the likelihood of long-term recipiency. In contrast, Vermont WRP appears to have had no effect on the likelihood of cycling or not cycling.
The lower panel of the table presents program impacts for the subsample of new recipients. The lower panel shows that the program effects largely disappear for new recipients, indicating that the effects were concentrated among ongoing recipients in Connecticut Jobs First and Florida FTP. The single exception is the program effect of Florida FTP on short-term recipiency, which appears to have increased the number of new recipients that became short-term recipients within the four-year observation period.
| Program (%) | Program Group | Control Group | Difference (Impact) |
|---|---|---|---|
| Full Sample | |||
| Connecticut Jobs First | |||
| Cyclers | 4.6 | 7.4 | -2.9 ** |
| Short-term recipients | 52.3 | 44.1 | 8.2 ** |
| Long-term recipients | 43.1 | 48.4 | -5.3 ** |
| Sample size | 2,184 | 2,102 | |
| Florida FTP | |||
| Cyclers | 13.6 | 14.8 | -1.2 |
| Short-term recipients | 59.1 | 52.0 | 7.1 ** |
| Long-term recipients | 27.3 | 33.2 | -5.9 ** |
| Sample size | 1,150 | 1,124 | |
| Vermont WRP | |||
| Cyclers | 9.4 | 8.0 | 1.4 |
| Short-term recipients | 42.2 | 41.9 | 0.3 |
| Long-term recipients | 48.4 | 50.1 | -1.7 |
| Sample size | 4,051 | 1,004 | |
| New Recipients | |||
| Connecticut Jobs First | |||
| Cyclers | 6.2 | 7.7 | -1.5 |
| Short-term recipients | 60.5 | 58.1 | 2.4 |
| Long-term recipients | 33.3 | 34.1 | -0.9 |
| Sample size | 860 | 858 | |
| Florida FTP | |||
| Cyclers | 11.6 | 14.8 | -3.2 |
| Short-term recipients | 75.8 | 68.4 | 7.5 ** |
| Long-term recipients | 12.6 | 16.9 | -4.3 |
| Sample size | 420 | 362 | |
| Vermont WRP | |||
| Cyclers | 11.4 | 9.8 | 1.6 |
| Short-term recipients | 56.3 | 56.2 | 0.1 |
| Long-term recipients | 32.3 | 34.0 | -1.7 |
| Sample size | 1,383 | 315 | |
| Sources: MDRC calculations from state and county administrative records. Notes: Estimates were regression-adjusted using ordinary least squares, controlling for pre-random assignment (sample intake) characteristics of sample members and for environmental conditions. "**" indicates statistical significance at the 0.05 level or smaller. Results from logistic regressions performed on binary outcomes were consistent with the above results. | |||
In summary, welfare policies that anticipated PWRORA as represented by the Connecticut Jobs First, Florida FTP, and Vermont WRP programs decreased cycling somewhat among ongoing recipients, but did not affect cycling among new recipients. This suggests that the programs were more effective on long-term recipients. This difference in findings between ongoing recipients and new recipients will be useful in interpreting the results in the next section, which analyzes the change in the incidence of cycling after welfare reform among a large sample of new recipients.
Has the incidence of cycling changed after PRWORA?
Welfare caseloads have declined dramatically during the 1990s, especially during the years following passage of PRWORA. Undoubtedly, the changes to the welfare system mandated by PRWORA contributed to the nation-wide decrease in welfare receipt. However, the reduction in the welfare rolls began before August 1996, when PRWORA was enacted. Moreover, there are several other possible explanations for the decrease in caseloads. For instance, the growing economy during the mid- to late-90s possibly made it easier for current recipients and those at risk to find relatively high-paying jobs. The expansion of the federal Earned Income Tax Credit (EITC) may have encouraged many to leave welfare for work or to go to work instead of applying for welfare (Meyer and Rosenbaum, forthcoming). The aging of the population may have resulted in fewer families with children under the age of 18. Further, declines in out-of-wedlock childbearing may have resulted in fewer families being eligible for cash assistance (Sawhill, 2001).
These factors present difficulties for understanding the effects of PRWORA on cycling. All would be expected to possibly increase cycling, and all were present both before and after PRWORA was implemented.(39)
Descriptive results
This section begins by looking descriptively at what happened to the welfare caseload and welfare exits over time by recipient type. Figure 3 shows the number of open welfare cases each month by recipient type in Cleveland for members of the special sample for studying the effects of PRWORA. As the figure shows, the proportion of active cases that cycle increased throughout the period. In December 1999, cyclers represented 18 percent of all active recipients, up from 10 percent in January 1993. During the pre-reform period (1993 to 1995) cyclers represented slightly more than 10 percent of all active recipients, while during the post-reform period (1997 to 1999) cyclers represented almost 18 percent of the caseload in Cleveland. In general, cycling increased since the passage of PRWORA, although is not clear how much of this increase is actually due to welfare reform.
Figure 3 also shows that the proportion of active long-term recipients peaked in 1996 and declined thereafter. By definition, this change in the proportion of long-term recipients was accompanied by a decrease and then an increase in the proportion of short-term recipients. In fact, in June 2000, short-term recipients became the dominant type of active recipient among sample members.
The two vertical lines in Figure 3 represent the periods when welfare reform may have first affected behavior in Cleveland. The first vertical line represents August 1996, when PRWORA was signed into federal law. The second vertical line represents the implementation of Ohio Works First, Ohio's TANF program. Note that the increase in the proportion of active cyclers and the decrease in the proportion of active long-term recipients appear to coincide with these reform dates.
Figure 5 shows similar information for Philadelphia during each month from January 1993 through December 2001. Compared with Cleveland, Philadelphia had a smaller proportion of cyclers throughout the time frame. In fact, by the end of the period less than 10 percent of active recipients were cyclers. However, there was an increase in cycling over time similar to Cleveland's. For example, during the pre-reform period (1993 to 1995), slightly more than 3 percent of active recipients were cyclers, compared with almost 7 percent over the post-reform period (1997 to 2001).
In Philadelphia, the percentage of active long-term recipients increased early in the period and then stabilized. That is, the trend in Figure 5 represents people who receive benefits each month who are, or eventually will be, long-term recipients. Unlike Cleveland, there was no apparent decrease in the percentage of active long-term recipients. In fact, the percentage of active short-term recipients in Philadelphia decreased over time. By the end of the period, there were only slightly more active short-term recipients than cyclers.
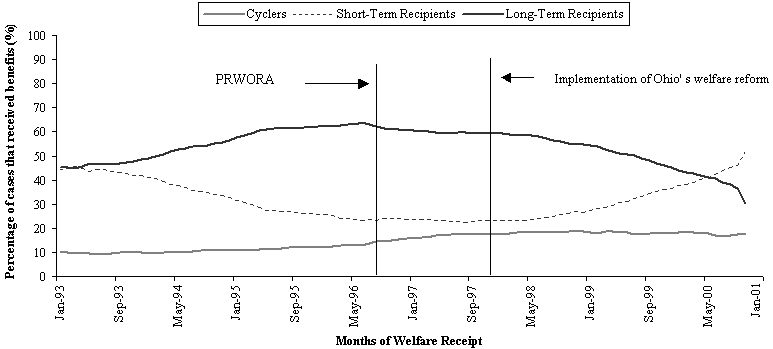
Sources: MDRC calculations from Cleveland administrative records.
Notes: The sample includes only new recipients during their month of sample intakes. See Table 2 for sample intake period for each site.
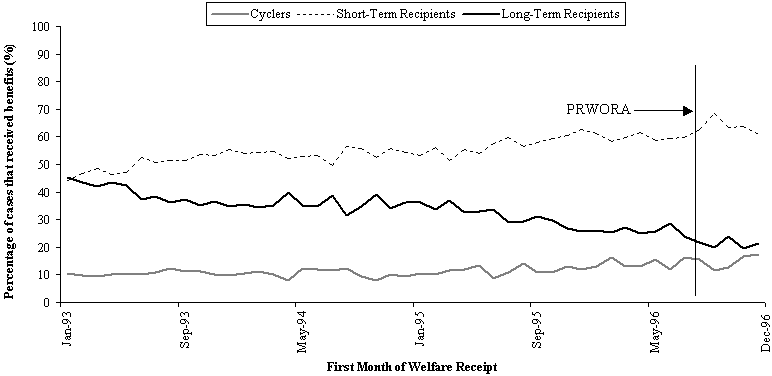
Sources: MDRC calculations from Cleveland administrative records.
Notes: The sample includes only new recipients during their month of sample intakes. See Table 2 for sample intake period for each site.
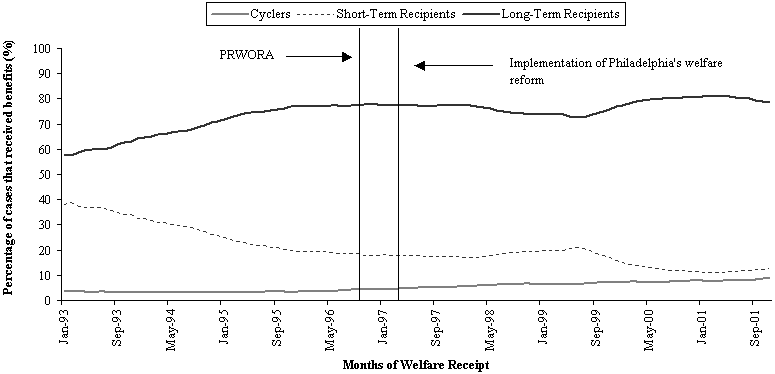
Sources: MDRC calculations from Cleveland administrative records.
Notes: The sample includes only new recipients during their month of sample intakes. See Table 2 for sample intake period for each site.
These descriptive results suggest that cycling was more prevalent in Cleveland than in Philadelphia at any particular point, although the incidence of cycling increased over time in both sites. While informative, these figures show all active recipients at a point in time and do not allow a clear look at trends in behavior as an entry cohort analysis, a variation of which is performed in the next section.
How do patterns of cycling differ before and after PRWORA?
To understand how cycling behavior changes over time, consider Figure 4. Each point on the figure represents an outcome for a group of new recipients. For example, the left-most point on each line represents the outcomes for the first cohort of new recipients, who began receiving welfare in January 1993. The corresponding points at the far right of the diagram represent outcomes for the last cohort of new recipients, who began receiving welfare in December 1996.(40) The vertical line represents August 1996, the official signing of PRWORA. Points to the right of the vertical line represent outcomes for people who first began receiving welfare after PRWORA was enacted, while points to the left of the vertical line represent outcomes for people who began receiving welfare before PRWORA was enacted.
The outcome of greatest interest represented in Figure 4 is the percentage of new recipients in Cleveland who became cyclers (versus becoming either short-term or long-term recipients) within four years of first receiving benefits. This result is shown by the solid line closest to the x-axis. The left-most point on this line indicates that about 10 percent of adults who began receiving welfare in Cleveland in January 1993 became welfare cyclers by December 1996, four years later. The figure consequently provides information on whether the proportion of welfare cyclers changed over time and whether that change seemed related at all to the PRWORA reforms.
Figure 4 shows a fairly stable trend: later groups were slightly more likely to become welfare cyclers than earlier groups. For example, the right-most point indicates that more than 17 percent of people who began receiving welfare in December 1996 had become cyclers within four years (that is, by November 2000), compared with the 10 percent of the January 1993 group mentioned above.
A similar trend for Philadelphia is shown in Figure 6, although this trend is less pronounced than that of Figure 4. The left-most point of Figure 6 indicates that 4 percent of people who began receiving welfare in January 1993 went on to become cyclers by December 1996, four years later. By the end of the period, the number of people who became cyclers increased slightly. The right-most point of Figure 6 indicates that close to 9 percent of people who started receiving welfare for the first time in December 1996 went on to become cyclers by November 2000. This is an increase of almost 5 percentage points over the entire period.
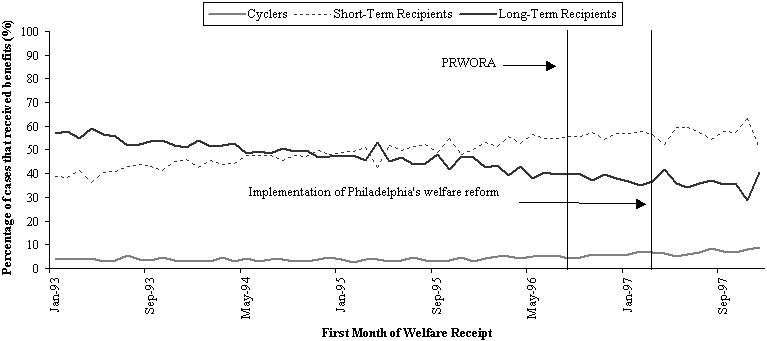
Sources: MDRC calculations from Cleveland administrative records.
Notes: The sample includes only new recipients during their month of sample intakes. See Table 2 for sample intake period for each site.
While the above descriptive analyses cannot determine whether PRWORA caused some or all of these trends, they do allow the comparison of the incidence of cycling pre- and post-PRWORA. Table 13 continues this analysis by averaging the incidence of cycling across all pre- and post-PRWORA months and then calculating the difference between these averages. The table also shows the pre-and post-PRWORA averages for becoming a short-term recipient and a long-term recipient. As previously, separate estimates are presented for Cleveland and Philadelphia.
For each comparison, the post-PRWORA sample includes all new recipients who first received welfare from August 1996 through the final month of sample intake, December 1996 in Cleveland and December 1997 in Philadelphia. Results for these groups are compared to two pre-PRWORA cohorts. The first (and larger) pre-PRWORA group includes all new recipients who first received welfare from January 1993 through July 1996. (See Table 13, top panel) Since the 1996 welfare reforms were widely publicized, it is reasonable to suspect that recipient behavior especially that of recipients who started welfare receipt closest to 1996 may have changed prior to the actual implementation of the reforms.
To account for this reasonable change in behavior, the lower panel of Table 13 limits the pre-PRWORA sample to adults who first received welfare during January through December 1993. In other words, the behavior of recipients who began welfare receipt in 1993 is considered to be completely governed by the rules of the then current welfare regulations and not influenced by the 1996 reforms.
For the cycler outcomes in the top panel of Table 13, the PRWORA difference in becoming another type of recipient is small, but statistically significant in both sites. In Cleveland, during the pre-reform period, 11.4 percent of recipients who began welfare receipt went on to become cyclers within the next four years. In contrast, 14.8 percent of recipients who began welfare receipt during the post-reform period went on to become cyclers. This resulted (with rounding) in a 3.5 percentage point increase in the incidence of cycling between the pre- and post-PRWORA period.
The PRWORA difference in becoming a long-term recipient versus either a cycler or a short-term recipient is also statistically significant, implying more extensive changes occurred in welfare receipt behavior over the two periods. For example, the rate at which sample members became long- term recipients in Cleveland decreased by 12.7 percentage points over the pre- and post-PRWORA period. In contrast, the incidence of becoming a short-term recipient increased by 9.2 percentage points.
| Sample Intake Months | |||
|---|---|---|---|
| Site (%) | Pre-PRWORA | Post-PRWORA | Difference |
| A. Pre-PRWORA: January 1993 to July 1996 | |||
| Cleveland | |||
| Cyclers | 11.4 | 14.8 | 3.5 ** |
| Short-term recipients | 54.6 | 63.9 | 9.2 ** |
| Long-term recipients | 34.0 | 21.3 | -12.7 ** |
| Philadelphia | |||
| Cyclers | 3.8 | 6.3 | 2.5 ** |
| Short-term recipients | 47.3 | 56.6 | 9.3 ** |
| Long-term recipients | 48.9 | 37.0 | -11.8 ** |
| B. Pre-PRWORA: January 1993 to December 1993 | |||
| Cleveland | |||
| Cyclers | 10.5 | 14.8 | 4.3 ** |
| Short-term recipients | 50.1 | 63.9 | 13.8 ** |
| Long-term recipients | 39.4 | 21.3 | -18.2 ** |
| Philadelphia | |||
| Cyclers | 3.8 | 6.3 | 2.6 ** |
| Short-term recipients | 41.6 | 56.6 | 15.1 ** |
| Long-term recipients | 54.7 | 37.0 | -17.7 ** |
| Sources: MDRC calculations using state and county administrative records. Notes: The sample includes only new recipients during their month of sample intake. See Table 2 for sample intake period for each site. There were 26,365 and 49,067 sample members included in the regressions for Cleveland and Philadelphia, respectively. Sample intake for the post-PRWORA group occured on or after August 1996. "**" indicates statistical significance at the 0.05 level or smaller. | |||
Table 13 also presents the results for Philadelphia. The top panel of this table shows that 6.3 percent of post-PRWORA groups of new recipients became cyclers, compared with 3.8 percent of pre-PRWORA groups. That is, the incidence of becoming a cycler versus another type of recipient increased over the period. This difference of 2.5 percentage points is small, but statistically significant. This is similar to the Cleveland results. The table also shows similar differences in the incidence of short-term and long-term recipiency compared to Cleveland's results. That is, short-term recipiency in Philadelphia increased by 9.3 percentage points, while long-term recipiency declined by 11.8 percentage points. It is interesting to note that while the pre- and post-PRWORA differences in Cleveland and Philadelphia are very similar, the overall levels of cyclers, both pre- and post-PRWORA, are significantly lower in Philadelphia than in Cleveland. Furthermore, the levels of long-term recipients are significantly higher in Philadelphia than in Cleveland.
The lower panel of Table 13 shows the results of a similar analysis using the more conservative pre-PRWORA period of 1993. The panel shows the same patterns as reported in the top panel, although the decrease in the rates of long-term recipiency and increase in the rates of short-term recipiency are noticeably larger in both sites.
How large are these effects? Comparing the PRWORA differences in cycling from the Urban Change sites to the effect of the programs from the random assignment evaluation sites helps to answer this question.(41) Compared with most welfare-to-work programs studied using random assignment in Table 12 (limited to new recipients), the differences reported in Table 13 are large. For example, Table 12 revealed that Connecticut's Jobs First program reduced welfare cycling by 1.5 percentage points, increased short-term recipiency by 2.4 percentage points, and decreased long-term recipiency by 0.9 percentage points in the four years after people entered the study. None of these effects were statistically significant at the five percent level. The lack of impacts compare with Cleveland's significant differences of a 3.5 percentage point increase in cycling, a 9.2 percentage point increase in short-term recipiency, and a decrease in long-term recipiency by 12.7 percentage points. While the differences in Table 13 are not causal, they do suggest that PRWORA may have influenced the large changes in recipient behavior.
(38) Recall that new recipients are defined as sample members who were just starting a welfare spell around their time of sample intake.
(39) A strong economy increases the demand for workers in the short term and a sustained, strong economy increases the demand for lower-skilled workers, resulting in higher employment at all skill levels. Declining caseloads suggest people are leaving the welfare rolls faster than new applicants start.
(40) Because the data for Cleveland extend back only to July 1992, there is no way to know whether someone received benefits prior to July 1992. The groups of "new" recipients, as they are defined here, may contain many people who had received benefits prior to July 1992 but who had not received benefits between July 1992 and the month when they began receiving benefits anew. Later groups of "new" recipients are likely to contain fewer relatively recent welfare recipients and more truly new recipients.
(41) Recall that this analysis, presented in Table 12, seeks to answer whether the program implemented at each evaluation site affected the likelihood of cycling.
Discussion of results
This report uses data from several evaluations of welfare-to-work programs to analyze the characteristics, employment patterns, and behavior of cyclers, short-term recipients, and long-term recipients. The incidence of cycling is fairly low across all of the sites used in this report. Cycling rates vary from 3.8 percent (in Philadelphia) to 13.7 percent (in Florida FTP). Other studies have reported cycling rates between 14 percent and 23 percent (see Table 1). The primary difference in the cycling rates in this report and those reported in the literature is that this report tracks welfare receipt over fewer years.
The findings in this report suggest that recipients who leave welfare repeatedly differ in a number of ways from recipients who utilize welfare benefits for only a short time and those who stay on persistently. In many respects, cyclers were shown to be a group in the middle less disadvantaged in the labor market than long-term recipients, but less able than short-term recipients to attain stable employment and work without welfare. Moreover, cyclers' pattern of welfare receipt during the observation period lies somewhere between that of short-term and long-term recipients. The length of the first two welfare spells of cyclers is similar to those of short-term recipients. However, cyclers spent an average of nearly 27 months on welfare during the observation period, compared with about 12 months for short-term recipients and 40 months for long-term recipients.
The background characteristics of cyclers differ from those of both short-term and long-term recipients in a number of ways. For example, cyclers have children earlier and are significantly younger than short-term or long-term recipients on average. Prior receipt of welfare, the number of children in the household, and the lack of a high-school diploma or GED appear to be good predictors of cycling. In addition, younger recipients are significantly more likely to become cyclers than recipients older than 44 at sample intake, and black recipients are more likely to become cyclers (as opposed to short-term recipients) than their white, non-Hispanic counterparts. The results also suggest that a recipient is less likely to become a cycler during good economic times.
Nearly all sample members entered employment at some point during the observation period, and employment levels were high among all three types of recipients. Cyclers appear to have more stable employment compared with long-term recipients, but less stable employment compared with short-term recipients. This is not surprising given the finding that cyclers have some characteristics that lie between those of short-term and long-term recipients. On average, cyclers earned considerably less during the observation period than short-term recipients, despite the fact that a larger percentage of cyclers than short-term recipients ever worked for pay. In addition, cyclers' patterns of work and welfare indicate somewhat greater self-sufficiency than long-term recipients, but considerably less than short-term recipients. For example, cyclers averaged relatively few quarters in the most self-sufficient status employment without welfare but significantly more than long-term recipients.
Overall, the findings in this report suggest that cyclers are a unique segment of the welfare caseload and the proportion of cyclers are increasing over time. This segment has characteristics and outcomes that differ from those of short-term and long-term recipients, and as a result, they may have different needs. For example, while cyclers are more likely to be employed, they return to assistance repeatedly due to a combination of factors, including low earnings and loss of employment made worse, perhaps, by the presence of younger children and having less access to financial and other support from other household members. For policy makers and administrators of state and local TANF programs, these findings suggest that cyclers should derive particular benefit from enhanced supports for work and post-employment services intended to promote employment retention and advancement.
References
Acs, Gregory and Pamela Loprest. Final Synthesis Report of Findings from ASPE "Leavers" Grants U.S. Department of Health and Human Services, ASPE, 2001.
Bane, Mary Jo, and David T. Ellwood. Welfare Realities: From Rhetoric to Reform. Cambridge, MS: Harvard University Press, 1994.
Bloom, Dan, Mary Farrell, and Barbara Fink. Welfare Time Limits State Policies, Implementation, and Effects on Families. New York: MDRC, 2002.
Bloom, Dan, Susan Scrivener, Charles Michalopoulos, Pamela Morris, Richard Hendra, Diana Adams-Ciardullo, Johanna Walter, with Wanda Vargas. Jobs First: Final Report on Connecticut's Welfare Reform Initiative. New York: MDRC, 2002.
Bloom, Dan, Richard Hendra, Charles Michalopoulos, Cindy Redcross, Susan Scrivener, Johanna Walter. WRP Final Report on Vermont's Welfare Restructuring Project. MDRC, 2002.
Bloom, Dan, Richard Hendra, James J. Kemple, Pamela Morris, Susan Scrivener, Nandita Verma, with Diana Adams-Ciardullo, David Seith and Johanna Walter. The Family Transition Program: Final Report on Florida's Initial Time-Limited Welfare Program. New York: MDRC, 2000.
Brauner, Sarah and Pamela Loprest. Where Are They Now? What States' Studies of People Who Left Welfare Tell Us? Washington, DC: The Urban Institute, Series A, No. A-32, 1999.
Brock, Thomas, Claudia Coulton, Andrew London, Denise Polit, Lashawn Richburg-Hayes, Ellen Scott, and Nandita Verma. Welfare Reform in Cleveland: Implementation, Effects, and Experiences of Poor Families and Neighborhoods. New York: MDRC, 2002.
Bruce, Donald, Karie Barbour, and Angela Thacker. An Analysis of Reentry to Families First. Knoxville, TN: Center for Business and Economic Research and Department of Economics, University of Tennessee, 2001.
Bruce Donald, Karie Barbour, and Angela Thacker. Welfare Program Reentry Among Post-Reform Leavers. Knoxville, TN: Center for Business and Economic Research and Department of Economics, University of Tennessee, 2002.
Cao, Jian. Welfare Recipiency and Welfare Recidivism: An Analysis of the NLSY Data. Madison, WI: Institute for Research on Poverty, Discussion Paper No. 1081-96, 1996.
Gleason, Philip, Anu Rangarajan, and Peter Schochet. "The Dynamics of Receipt of Aid to Families with Dependent Children among Teenage Parents in Inner Cities," The Journal of Human Resources, Vol. 33, Issue 4, Autumn 1998, pp. 988-1002.
Hamilton, Gayle, Moving People from Welfare to Work: Lessons from the National Evaluation of Welfare-to-Work Strategies. U.S. Department of Health and Human Services Administration for Children and Families and Office of the Assistant Secretary for Planning and Evaluation; and U.S. Department of Education. 2002.
Hamilton, Gayle, Stephen Freedman, Lisa Gennetian, Charles Michalopoulos, Johanna Walter, Diana Adams-Ciardullo, and Anna Gassman-Pines, MDRC, and Sharon McGroder, Martha Zaslow, Surjeet Ahluwalia, and Jennifer Brooks, Child Trends, How Effective Are Different Welfare-to-Work Approaches? Five-Year Adult and Child Impacts for Eleven Programs. Washington, D.C.: U.S. Department of Health and Human Services, Administration for Children and Families and Office of the Assistant Secretary for Planning and Evaluation; and U.S. Department of Education. 2001.
Harris Kathleen M., "Life after Welfare: Women, Work, and Repeat Dependency." American Sociological Review, Vol. 61, 1996, pp. 407-426.
Julnes, G., Halter, A., Anderson, S., Frost-Kumpf, L., Schuldt, R., & Staskon, F. Illinois Study of Former TANF Clients, Final Report. Springfield, IL: Institute for Public Affairs, University of Illinois at Springfield. 2000.
Julnes, George, Xitao Fan, and Kentaro Hayashi. "Understanding Self-Sufficiency of Welfare Leavers in Illinois: Elaborating Models with Psychosocial Factors." New Directions for Evaluation, No. 91, 2001, pp. 33-44
Loprest, Pamela. Who Returns to Welfare? Washington, DC: The Urban Institute, Series B, No. B-49, 2002.
Michalopoulos, Charles, Johannes Bos, Robert Lalonde, and Nandita Verma. Assessing the Impact of Welfare Reform on Urban Communities: The Urban Change Project and Methodological Considerations. New York: MDRC, 2000.
Miller, Cynthia. Leavers, Stayers, and Cyclers: An Analysis of the Welfare Caseload. New York: MDRC, 2002.
Miller, Cynthia, Cindy Redcross, and Christian Henrichson. Food Stamp Use Among Former Welfare Recipients. New York: MDRC, 2002.
Moffitt, Robert A. "Experienced-Based Measures of Heterogeneity in the Welfare Caseload." in Studies of Welfare Populations. National Academy Press, 2002, pp. 473-499.
Moffitt, Robert, Andrew Cherlin, Linda Burton, Mark King, and Jennifer Roff. The Characteristics of Families Remaining on Welfare, Working Paper 02-02, 2002.
Rickman, Dana K., Nancy Bross, and Michael E. Foster. "Patterns of Recidivism for Welfare Leavers." New Directions for Evaluation, No. 91, 2001, pp. 45-57.
Sandefur, Gary D. and Steven T. Cook. "Permanent Exits from Public Assistance: The Impact of Duration, Family, and Work" Social Forces, Vol. 77, No. 2, 1998, pp. 763-787.
Sawhill, Isabel, 2001. "What Can Be Done to Reduce Teen Pregnancy and Out-of-Wedlock Birth?" in Welfare Reform and Beyond Policy Brief No. 8. Washington, DC: Brookings Institution Press.
U.S. Department of Health and Human Services. Administration for Children and Families. Characteristics and Financial Circumstances of AFDC Recipients FY 1996 Aid to Families with Dependent Children October 1995 - September 1996. Washington, DC: U.S. Department of Health and Human Services, Administration for Children and Families, 1996.
Verma, Nandita and Claudia Colton, Monitoring Outcomes for Cuyahoga County's Welfare Leavers: How Are They Faring? New York: MDRC, 2001.
Ver Ploeg, Michele. "Preexit Benefit Receipt and Employment Histories and Postexit Outcomes of Welfare Leavers" in Studies of Welfare Populations. National Academy Press, 2002, pp. 415-472.
Zedlewski Sheila R. and Donald W. Alderson. Before and After Reform: How Have Families on Welfare Changed? Washington, DC: The Urban Institute, Series B, No. B-32, 2001.
Appendix: Calculating Regression-Adjusted Means
The estimates displayed in Tables 8 and 11 were regression-adjusted, using ordinary least squares and controlling for the background characteristics and environmental variables displayed in Table 6. In this model, 0/1 (dummy) variables for cycler (CYCLER) and short-term recipient (STRECIP) represent the independent variables. Sample members have the following values for these measures:
| Outcome Group | CYCLER | STRECIP |
|---|---|---|
| Cyclers | 1 | 0 |
| Short-Term Recipient | 0 | 1 |
| Long-Term Recipient | 0 | 0 |
The background characteristics and environmental variables included in the model represent the control variables, or covariates.
For each outcome measure, the coefficient associated with CYCLER displays the difference between cyclers and long-term recipients. Similarly, the coefficient associated with STRECIP displays the difference between short-term recipients and long-term recipients. The difference between cyclers and short-term recipients can be inferred by calculating the difference between the two coefficients. All of these differences are weighted equally by site.
When calculating the adjusted means shown in Tables 8 and 11, it is assumed that sample members have no other differences except for their being a cycler, short-term recipient, or long-term recipient. This assumption is implemented in the calculations by keeping each sample member's original values of CYCLER and STRECIP, but resetting the value of all of the covariates to their weighted full sample means. For instance, as shown in Table 5, 41.9 percent of sample members were aged 25 to 34 at sample intake. Therefore, each sample member would get the value of 0.419 (instead of a 0 or a 1) for the covariate associated with membership in this age group.
The following formulas are used to calculate adjusted means for each outcome group. For illustration, we include the numbers required for calculating the adjusted means for average total months of welfare receipt during the observation period, that are displayed in Table 8:
| 38.6 = Adjusted mean for long-term recipients |
25.8 Weighted full sample mean |
- (-11.3 * 0.0847) Weighted coefficient for CYCLER * Weighted proportion of the sample who are cyclers |
-(-25.4 * 0.4665) Weighted coefficient for STRECIP * Weighted proportion of the sample who are short-term recipients |
| 27.3= Adjusted mean for cyclers |
38.6 Adjusted mean for long-term recipients |
+ (-11.3) Weighted coefficient for CYCLER |
|
| 13.2= Adjusted mean for short-term recipients |
38.6 Adjusted mean for long-term recipients |
+ (-25.4) Weighted coefficient for CYCLER |
|
| 14.1= Difference between cyclers and short-term recipients |
(-11.3) Weighted coefficient for CYCLER |
+ (-25.4) Weighted coefficient for CYCLER |
| Characteristic | Evaluation Sites | Vermont WRP | Urban Change Sites | Full Sample | ||
|---|---|---|---|---|---|---|
| Connecticut Jobs First | Florida FTP | Cleveland | Philadelphia | |||
| Female (%) | 97.2 | 97.8 | 93.3 | 96.3 | 93.6 | 95.6 |
| Age (%) | ||||||
| 18-24 | 28.5 | 32.1 | 27.6 | 34.9 | 32.0 | 31.0 |
| 25-34 | 41.9 | 46.0 | 43.7 | 39.7 | 38.0 | 41.9 |
| 35-44 | 24.5 | 19.2 | 24.0 | 20.8 | 21.7 | 22.0 |
| 45 or older | 5.1 | 2.7 | 4.7 | 4.6 | 8.3 | 5.1 |
| Average age (years) | 30.6 | 29.0 | 30.8 | 29.7 | 30.8 | 30.2 |
| Ethnicity (%) | ||||||
| White | 38.2 | 42.0 | 96.9 | 26.3 | 14.6 | 43.6 |
| Black | 38.9 | 54.8 | 1.6 | 67.1 | 69.3 | 46.4 |
| Hispanic | 22.1 | 1.4 | 0.2 | 5.2 | 12.8 | 8.3 |
| Other | 0.8 | 1.8 | 1.2 | 1.4 | 3.3 | 1.7 |
| Number of children (%) | ||||||
| 1 | 50.4 | 42.9 | 43.1 | 45.1 | 34.5 | 43.2 |
| 2 | 25.9 | 28.7 | 34.3 | 28.2 | 29.2 | 29.3 |
| 3 | 14.7 | 16.8 | 15.8 | 15.6 | 18.5 | 16.3 |
| 4 or more | 9.0 | 11.7 | 6.9 | 11.2 | 17.8 | 11.3 |
| Average number of children | 1.9 | 2.0 | 1.9 | 2.0 | 2.4 | 2.0 |
| Age of youngest child (%) | ||||||
| 2 or under | 43.9 | 44.3 | 36.9 | 56.2 | 60.6 | 48.4 |
| 3 to 5 | 20.7 | 27.7 | 22.6 | 16.6 | 14.7 | 20.4 |
| 6 to 12 | 26.4 | 21.6 | 30.2 | 18.9 | 17.7 | 23.0 |
| 13 to 18 | 9.0 | 6.5 | 10.3 | 8.3 | 7.0 | 8.2 |
| Average age at birth of oldest child | 22.3 | 20.8 | 21.7 | 22.0 | 22.4 | 21.9 |
| Had a child as a teenager (%) | 39.6 | 53.6 | 39.8 | 42.7 | 43.4 | 43.8 |
| Welfare Status (%) | ||||||
| New recipient | 39.4 | 36.5 | 34.1 | 42.4 | 45.1 | 39.5 |
| Ongoing recipient | 60.6 | 63.5 | 65.9 | 57.6 | 54.9 | 60.5 |
| Average number of months of welfare receipt during two yearsprior to month of sample intake | 14.1 | 14.2 | 15.0 | 12.7 | 11.9 | 13.6 |
| Average number of months of food stamp receipt during two years prior to month of sample intake | 14.7 | 16.2 | 15.8 | 16.2 | 13.9 | 15.4 |
| Any earnings in two years prior to quarter of sample intake (%) | 57.1 | 55.6 | 57.2 | 61.9 | 45.7 | 55.5 |
| Average number of quarters of employment in two years prior to quarter of sample intake (%) | 2.2 | 2.0 | 2.3 | 2.4 | 1.9 | 2.2 |
| Sample size | 2,184 | 1,150 | 4,051 | 55,764 | 97,858 | 161,007 |
| Sources: MDRC calculations from state and county administrative records and Background Information Forms. Notes: Calculations for the full sample were weighted equally by site. |
||||||
| Characteristic or Environmental Condition | Odds Ratios and Statiscal Significance For Becoming a Cycler Versus Becoming a Short-Term Recipient |
||||
|---|---|---|---|---|---|
| Evaluation Sites | Vermont WRP | Urban Change Sites | |||
| Connecticut Jobs First | Florida FTP | Cleveland | Philadelphia | ||
| Ongoing recipient at sample intake | 0.50 | 0.82 | 1.18 | 0.79 ** | 1.11 |
| Total months of welfare receipt during two years prior to sample intake | 1.00 | 1.02 | 0.99 | 1.00 | 1.02 ** |
| Average monthly welfare grant during year prior to sample intake | 1.13 | 1.14 | 0.98 | 0.99 | 0.87 ** |
| Total months of food stamp receipt during two years prior to sample intake | 1.00 | 1.02 | 1.03 ** | 1.03 ** | 1.03 ** |
| Number of children | 1.16 | 1.06 | 1.00 | 1.17 ** | 1.49 ** |
| Youngest child is less than 6 years old | 1.38 | 0.78 | 1.65 ** | 1.33 ** | 1.23 ** |
| Had a child as a teenager | 0.78 | 0.95 | 1.32 ** | 1.00 | 1.05 |
| Female | 1.21 | 1.60 | 0.95 | 2.00 ** | 1.32 ** |
| Age 18 to 24 | 2.75 | 4.19 | 2.18 | 4.40 ** | 3.01 ** |
| Age 25 to 34 | 1.61 | 2.22 | 1.83 | 2.39 ** | 1.88 ** |
| Age 35 to 44 | 1.31 | 1.31 | 1.32 | 1.80 ** | 1.57 ** |
| Black | 1.77 ** | 1.21 | 0.80 | 2.17 ** | 2.10 ** |
| Hispanic | 1.19 | 0.69 | n/a | 1.36 ** | 1.49 ** |
| Other | n/a | 0.76 | 0.90 | 0.99 | 0.89 |
| No high school diploma or GED | 0.86 | 1.44 | 1.55 | n/a | n/a |
| Missing high school diploma or GED variable | 1.23 | 0.85 | 0.98 | n/a | n/a |
| Total quarters of employment during year prior to sample intake | 1.14 | 1.03 | 1.05 | 1.20 ** | 1.26 ** |
| Total earnings during year prior to sample intake | 1.00 | 0.98 | 1.03 | 0.95 ** | 0.97 ** |
| Randomly assigned in quarter 2, 1994 | n/a | n/a | n/a | n/a | 1.00 |
| Randomly assigned in quarter 3, 1994 | n/a | 1.24 | n/a | n/a | 1.27 ** |
| Randomly assigned in quarter 4, 1994 | n/a | 1.05 | 1.13 | 0.77 ** | 0.92 |
| Randomly assigned in quarter 1, 1995 | n/a | 0.92 | 1.12 | 0.86 | 0.80 |
| Randomly assigned in quarter 2, 1995 | n/a | n/a | 1.05 | 0.72 ** | 0.93 |
| Randomly assigned in quarter 3, 1995 | n/a | n/a | n/a | 0.70 ** | 0.98 |
| Randomly assigned in quarter 4, 1995 | n/a | n/a | n/a | 0.67 ** | 0.97 |
| Randomly assigned in quarter 1, 1996 | n/a | n/a | n/a | 0.75 ** | 1.04 |
| Randomly assigned in quarter 2, 1996 | 1.16 | n/a | n/a | 0.56 ** | 1.04 |
| Randomly assigned in quarter 3, 1996 | 1.78 | n/a | n/a | 0.51 ** | 0.98 |
| Randomly assigned in quarter 4, 1996 | 1.10 | n/a | n/a | 0.51 ** | 1.22 |
| Randomly assigned in quarter 1, 1997 | n/a | n/a | n/a | n/a | 1.39 ** |
| Randomly assigned in quarter 2, 1997 | n/a | n/a | n/a | n/a | 1.18 |
| Randomly assigned in quarter 3, 1997 | n/a | n/a | n/a | n/a | 1.51 ** |
| Randomly assigned in quarter 4, 1997 | n/a | n/a | n/a | n/a | 1.57 ** |
| Sources: MDRC calculations from state and county administrative records and Background Information Forms. Notes: The full sample includes 10,393 cyclers, 62,388 short-term recipients, and 88,226 long-term recipients. Effects were estimated with logistic regression with "Cycler" as the dependent variable. Separate regressions were run for samples of cyclers and short-term recipients and for samples of cyclers and long-term recipients. "**" indicates statistical significance at the 0.05 level or smaller. "n/a" indicates "not applicable." There are few or no observations for these categories. For the Urban Change sites, the high school diploma measure was unavailable. |
|||||
| Characteristic or Environmental Condition | Odds Ratios and Statiscal Significance For Becoming a Cycler Versus Becoming a Short-Term Recipient |
||||
|---|---|---|---|---|---|
| Evaluation Sites | Vermont WRP | Urban Change Sites | |||
| Connecticut Jobs First | Florida FTP | Cleveland | Philadelphia | ||
| Ongoing recipient at sample intake | 0.45 | 1.09 | 0.99 | 0.77 ** | 0.94 |
| Total months of welfare receipt during two years prior to sample intake | 1.01 | 0.98 | 1.02 | 1.00 | 1.00 |
| Average monthly welfare grant during year prior to sample intake | 1.00 | 0.80 | 0.86 ** | 0.93 ** | 0.91 ** |
| Total months of food stamp receipt during two years prior to sample intake | 0.99 | 1.01 | 0.98 | 1.00 | 1.00 |
| Number of children | 1.03 | 0.92 | 0.95 | 0.87 ** | 0.96 |
| Youngest child is less than 6 years old | 1.03 | 1.00 | 1.09 | 1.04 | 0.91 |
| Had a child as a teenager | 0.83 | 1.38 | 1.78 ** | 1.15 ** | 1.06 |
| Female | 1.11 | 0.95 | 0.53 ** | 1.21 | 0.88 |
| Age 18 to 24 | 0.93 | 2.12 | 1.91 | 2.29 ** | 3.62 ** |
| Age 25 to 34 | 0.84 | 2.09 | 2.00 | 1.92 ** | 3.66 ** |
| Age 35 to 44 | 0.72 | 1.02 | 1.43 | 1.72 ** | 3.04 ** |
| Black | 1.21 | 0.53 ** | 1.14 | 1.30 ** | 1.62 ** |
| Hispanic | 1.29 | 0.66 | n/a | 1.42 ** | 1.43 ** |
| Other | n/a | 1.06 | 1.77 | 1.06 | 0.65 ** |
| No high school diploma or GED | 0.47 ** | 0.75 | 1.10 | n/a | n/a |
| Missing high school diploma or GED variable | 1.83 | 1.00 | 1.47 | n/a | n/a |
| Total quarters of employment during year prior to sample intake | 1.10 | 1.10 | 1.14 ** | 1.34 ** | 1.60 ** |
| Total earnings during year prior to sample intake | 1.03 | 1.03 | 1.04 | 1.03 ** | 0.98 ** |
| Randomly assigned in quarter 2, 1994 | n/a | n/a | n/a | n/a | 1.02 |
| Randomly assigned in quarter 3, 1994 | n/a | 1.90 | n/a | n/a | 1.27 ** |
| Randomly assigned in quarter 4, 1994 | n/a | 1.48 | 1.26 | 0.72 ** | 0.97 |
| Randomly assigned in quarter 1, 1995 | n/a | 1.72 | 1.19 | 0.79 ** | 0.89 |
| Randomly assigned in quarter 2, 1995 | n/a | n/a | 1.03 | 0.69 ** | 0.95 |
| Randomly assigned in quarter 3, 1995 | n/a | n/a | n/a | 0.82 ** | 1.09 |
| Randomly assigned in quarter 4, 1995 | n/a | n/a | n/a | 0.92 | 1.05 |
| Randomly assigned in quarter 1, 1996 | n/a | n/a | n/a | 1.21 | 1.21 |
| Randomly assigned in quarter 2, 1996 | 1.03 | n/a | n/a | 1.02 | 1.45 ** |
| Randomly assigned in quarter 3, 1996 | 1.86 ** | n/a | n/a | 1.26 | 1.46 ** |
| Randomly assigned in quarter 4, 1996 | 1.01 | n/a | n/a | 1.43 ** | 1.94 ** |
| Randomly assigned in quarter 1, 1997 | n/a | n/a | n/a | n/a | 2.32 ** |
| Randomly assigned in quarter 2, 1997 | n/a | n/a | n/a | n/a | 2.00 ** |
| Randomly assigned in quarter 3, 1997 | n/a | n/a | n/a | n/a | 2.80 ** |
| Randomly assigned in quarter 4, 1997 | n/a | n/a | n/a | n/a | 2.83 ** |
| Sources: MDRC calculations from state and county administrative records and Background Information Forms. Notes: The full sample includes 10,393 cyclers, 62,388 short-term recipients, and 88,226 long-term recipients. Effects were estimated with logistic regression with "Cycler" as the dependent variable. Separate regressions were run for samples of cyclers and short-term recipients and for samples of cyclers and long-term recipients. "**" indicates statistical significance at the 0.05 level or smaller. "n/a" indicates "not applicable." There are few or no observations for these categories. For the Urban Change sites, the high school diploma measure was unavailable. |
|||||