Prepared for:
Assistant Secretary for Planning and Evaluation (ASPE)
U.S. Department of Health and Human Services (HHS)
Prepared by:
The Lewin Group
Mary Farrell, Michael Fishman, Stephanie Laud, and Vincena Allen
Contract Number: 100-96-0011, Task Order 7
Acknowledgments and Ordering Info
Work on the TANF Child-Only project was funded by the Assistant Secretary for Planning and Evaluation (ASPE), Department of Health and Human Services (HHS) under a contract to The Lewin Group. This report has benefited greatly from the oversight and input of Colleen Rathgeb, the ASPE Project Officer. At HHS, we would also like to thank Laura Feig Radel and Andrew Yoo.
The commitment and cooperation of state and county staff in the three sites have been critical to the completion of this report. From the state central offices, Maria Hernandez and Julie Lopes in California; Don Winstead, F. Patricia Hall, Myrlene Manke in Florida; and Denise Cross in Missouri were instrumental in providing us with information on state policies and helping us gain access to state and county data. Kathy Archuleta and Paul Reeves in Alameda County; Susan Oder and Richard Dryden in Duval County; and Marge Randle in Jackson County allowed us access to their county case files and provided us helpful insights into the operational details of the TANF programs. Additionally, Ray DeSear in Florida and Richard Koon and Becky Veit in Missouri provided us with information and data from the state administrative systems.
At The Lewin Group, Jennifer Duffy and Purvi Sevak assisted with the data collection effort and Julia Graffam assisted with the report's production.
For printed copies, fax a request including your name, mailing address, and title of this report to: (202) 690-6562
or mail to:
Office of the Assistant Secretary for Planning and Evaluation
U.S. Department of Health and Human Services
200 Independence Avenue, SW
Washington, DC 20201
National Overview
Introduction
Under the Personal Responsibility and Work Opportunity Reconciliation Act (PRWORA) of 1996, most families receiving Temporary Assistance to Needy Families (TANF) are subject to work requirements and time limits on benefit receipt. However, one portion of the TANF caseload, cases where only a child or children are receiving assistance, are generally exempt from these federal requirements. These "child-only" cases are not currently growing in absolute numbers but are becoming an increasing proportion of the overall TANF caseload. This has led to increasing interest in understanding the characteristics of child-only cases and the program services they receive.
A variety of circumstances result in child-only cases. In some cases, the child is not living with a parent, but with a relative, who chooses not to be included in the assistance group or whose income and assets preclude him or her from receiving cash assistance. In other situations, the child is living with a parent, but the parent is a Supplemental Security Income (SSI) recipient, a non-qualified alien, a qualified alien who entered the country after August 1996, a sanctioned adult, or otherwise excluded.(1)
The U.S. Department of Health and Human Services (HHS) contracted with The Lewin Group to obtain more information about the characteristics and trends of the child-only population, focusing on three states: California, Florida, and Missouri. The Lewin Group interviewed state officials and staff, conducted case file reviews, and analyzed administrative data to understand the trends in the child-only caseload and the policies and practices that affect this population.
This chapter presents an overview of the 1996 welfare legislation, discusses the national TANF and child-only caseload trends, examines the characteristics of child-only cases, and outlines the study questions and the methodology and data used to answer these questions. Chapter 2 examines the policies in the three states chosen for the study, while Chapter 3 analyzes the characteristics of the child-only cases in the three states. Chapter 4 concludes with a summary of the findings and the implications this analysis has on future research.
The 1996 Welfare Legislation
PRWORA changed the direction of the nation's welfare system by replacing Aid to Families with Dependent Children (AFDC) and the Job Opportunities and Basic Skills Training (JOBS) program with the TANF program. PRWORA imposes federal requirements on time limits, work participation requirements, and sanctions. However, with the new welfare legislation, states have been given broad latitude to design their own welfare policies, which include policies that affect child-only cases. In some cases, states that wish to deviate from federal policies must use state funds (which can count towards the maintenance of effort requirement); in other cases federal funding can be used. Five policies that affect child-only are worth noting:
- Sanction policy. Under federal TANF, states must sanction families for refusing to comply with work requirements or not cooperating with child support, although states have substantial leeway in deciding what constitutes noncompliance, the severity of the penalty, and the appeals process which restores benefits.(2) These policies may include removing the parent's benefits from the TANF case (which converts the case to child-only), reducing the overall benefit, but keeping the adult in the assistance unit, or closing the TANF case.
- Alien policy. PRWORA distinguishes between "qualified" aliens, a category which includes permanent residents, refugees, asylees, and certain others granted conditional entry, and "non-qualified" aliens, which includes both undocumented aliens and those in PRUCOL (permanently residing under color of law) status, among others.(3) In general, the federal block grant does not fund TANF benefits for most qualified aliens who entered the country after August 1996 for five years after entering the country or unqualified aliens. However, in both cases, the children may receive assistance if they are United States citizens (often because they were born in the United States). Federal funding can be used to provide assistance to qualified aliens who entered prior to this point in time, while states may use their own funds to extend TANF benefits to qualified aliens entering the country after August 1996.(4)
- Treatment of SSI. Individuals who are aged, blind, or disabled and who have little or no income and resources are eligible for SSI benefits. As was true under the AFDC program, SSI recipients may not receive TANF assistance for themselves, but can apply for their children. In almost all states, the SSI income is excluded when calculating TANF benefits. A small number of states have opted to include SSI benefits in the TANF benefit calculation; in these states, it is less likely that an SSI recipient's family will be eligible for a child-only TANF grant.
- Non-parental caregivers. Unlike parents who are caring for their children, in most states, non-parental caregivers may choose to apply for cash assistance for children under their care and themselves or for the children only. Non-parental caregivers are most often caregivers related to the children, although some states allow non-relative caregivers who have legal custody or guardianship to receive cash assistance. There are several reasons a non-parental caregiver may choose to be excluded from the assistance unit. First, most states exclude the income of non-parental caregivers who are not in the assistance unit. Thus, unlike parental cases, a non-parental caregiver can have income that would make them ineligible for cash assistance but obtain the assistance for the children. Second, requirements in PRWORA may discourage providers from being included in the assistance unit. The five-year federal time limit on assistance would apply to a case with a non-parental caregiver included in the unit since there is an adult receiving assistance. PRWORA also imposes work participation requirements on states and since non-parental caregivers who are in the assistance unit count toward a state's participation rate, states might have a difficult time meeting work participation rates if they exempted large numbers of these providers from work requirements. Finally, other factors such as welfare stigma may discourage some caregivers from applying for themselves.
- Time limit policy. The federal block grant can be used to provide assistance to families that include an adult or teen parent head-of-household (or spouse) for up to five cumulative years. Some states have indicated that they may decide to apply time limits to the parents only, which would transform the case to a child-only case at the time limit. States may also impose a time limit that is shorter than five years. Time limits that terminate the entire household's cash benefits may result in a greater number of child-only non-parental caregiver cases if the parents reach the time limit and cannot care for their children, placing the children in the care of relatives or other caregivers.
In addition, many states are creating alternative programs for relative caregivers, offering higher payments than TANF, which may result in a shift of cases from TANF into the alternative programs. Depending on state financing choices, these cases may or may not be counted as TANF child-only cases. (5)
Recent regulations clarified ambiguities in the law that dealt with child-only cases and definitions of "family." States have the flexibility to develop their own definition of family, with the qualifier that HHS "will consider proposing appropriate legislative or regulatory remedies if [HHS] finds that States are using the flexibility under the rules to avoid work requirements or time limits or otherwise undermine the goals of TANF."(6) For example, states that encourage parents to remove themselves from the grant in order to avoid a time limit or meet a participation requirement are violating the spirit of the law. HHS will be monitoring trends, especially practices of converting regular TANF cases to child-only cases.
Trends in the TANF Population
TANF Caseloads
In 1994, when the national AFDC caseload peaked, 5.0 million families were receiving cash assistance; in 1998, 3.2 million families were on the welfare rolls, a 37 percent decline. Almost all states or regions experienced a decline from 1994 to 1998, although some states experienced a more rapid decline than others did (see Exhibit 1.1, Columns (A) and (D)). This trend can be attributed in part to a movement promoting the reform of the nation's welfare system that began over twenty years ago and which culminated with the 1996 welfare reform legislation. The focus on reducing welfare dependency by encouraging welfare recipients to work spurred some TANF recipients to leave welfare for work and others to leave to avoid the more mandatory requirements.
The decline in caseloads can also be attributed to the economic expansion experienced during the mid-1990s. The economic growth the nation experienced undoubtedly allowed more welfare recipients to leave welfare for employment and allowed others to maintain employment and not enter the welfare rolls.
| State | Fiscal Year 1994 | Fiscal Year 1998 | ||||
|---|---|---|---|---|---|---|
| Total AFDC Families | Total Child-Only Families | Child-Only/ Total Families (%) | Total TANF Families | Total Child-Only Families | Child-Only/ Total Families (%) | |
| (A) | (B) | (C) | (D) | (E) | (F) | |
| U.S. Total | 5,046,263 | 868,646 | 17.2 | 3,089,492a/ | 723,891 | 23.4 |
| Alabama | 50,340 | 16,140 | 32.1 | 23,792 | 11,081 | 46.6 |
| Alaska | 12,759 | 836 | 6.6 | 10,210 | 1,059 | 10.4 |
| Arizona | 71,984 | 15,145 | 21.0 | 40,163 | 12,441 | 31.0 |
| Arkansas | 26,014 | 6,866 | 26.4 | 13,844 | 5,538 | 40.0 |
| California | 908,999 | 201,288 | 22.1 | 707,062 | 180,755 | 25.6 |
| Colorado | 41,614 | 6,367 | 15.3 | 21,194 | 5,835 | 27.5 |
| Connecticut | 59,201 | 6,530 | 11.0 | 47,188 | 8,040 | 17.0 |
| Delaware | 11,460 | 2,783 | 24.3 | 7,568 | 2,488 | 32.9 |
| District of Columbia | 27,117 | 4,476 | 16.5 | 21,263 | 2,752 | 12.9 |
| Florida | 247,087 | 47,852 | 19.4 | 111,143 | 40,814 | 36.7 |
| Georgia | 141,451 | 26,595 | 18.8 | 78,196 | 29,208 | 37.4 |
| Guam | 1,955 | 79 | 4.0 | 2,075 | 206 | 9.9 |
| Hawaii | 20,420 | 1,806 | 8.8 | 17,031 | 2,085 | 12.2 |
| Idaho | 8,676 | 1,446 | 16.7 | 1,860 | 798 | 42.9 |
| Illinois | 240,319 | 32,117 | 13.4 | 170,917 | 24,858 | 14.5 |
| Indiana | 73,803 | 10,408 | 14.1 | 39,679 | 4,730 | 11.9 |
| Iowa | 39,555 | 5,287 | 13.4 | 25,167 | 4,790 | 19.0 |
| Kansas | 30,102 | 4,146 | 13.8 | 13,914 | 4,256 | 30.6 |
| Kentucky | 79,840 | 14,751 | 18.5 | 52,645 | 15,697 | 29.8 |
| Louisiana | 86,915 | 19,379 | 22.3 | 47,916 | 11,985 | 25.0 |
| Maine | 22,934 | 1,565 | 6.8 | 15,331 | 3,135 | 20.4 |
| Maryland | 80,123 | 12,064 | 15.1 | 47,564 | 10,968 | 23.1 |
| Massachusetts | 111,783 | 14,911 | 13.3 | 66,409 | 15,670 | 23.6 |
| Michigan | 223,950 | 21,958 | 9.8 | 123,693 | 21,556 | 17.4 |
| Minnesota | 62,979 | 6,449 | 10.2 | 48,464 | 6,939 | 14.3 |
| Mississippi | 56,785 | 14,941 | 26.3 | 23,631 | 9,596 | 40.6 |
| Missouri | 92,110 | 12,215 | 13.3 | 60,074 | 14,134 | 23.5 |
| Montana | 11,908 | 826 | 6.9 | 7,275 | 1,069 | 14.7 |
| Nebraska | 15,934 | 4,069 | 25.5 | 13,374 | 3,152 | 23.6 |
| Nevada | 14,047 | 3,455 | 24.6 | 10,383 | 3,343 | 32.2 |
| New Hampshire | 11,475 | 1,506 | 13.1 | 6,295 | 1,559 | 24.8 |
| New Jersey | 122,427 | 20,117 | 16.4 | 78,143 | 16,782 | 21.5 |
| New Mexico | 33,633 | 5,321 | 15.8 | 21,363 | 3,248 | 15.2 |
| New York | 454,951 | 61,976 | 13.6 | 336,857 | 51,145 | 15.2 |
| North Carolina | 131,220 | 26,134 | 19.9 | 76,337 | 27,535 | 36.1 |
| North Dakota | 5,877 | 527 | 9.0 | 3,275 | 734 | 22.4 |
| Ohio | 250,208 | 43,595 | 17.4 | 140,286 | 35,417 | 25.2 |
| Oklahoma | 46,971 | 6,410 | 13.6 | 24,135 | 6,852 | 28.4 |
| Oregon | 42,135 | 8,010 | 19.0 | 18,898 | 4,014 | 21.2 |
| Pennsylvania | 210,155 | 24,665 | 11.7 | 134,995 | 25,773 | 19.1 |
| Puerto Rico | 58,827 | 6,711 | 11.4 | -- | c/ | -- |
| Rhode Island | 22,654 | 2,400 | 10.6 | 19,229 | 2,529 | 13.2 |
| South Carolina | 51,925 | 15,341 | 29.5 | 25,293 | 8,673 | 34.3 |
| South Dakota | 6,926 | 1,507 | 21.8 | 3,851 | 1,452 | 37.7 |
| Tennessee | 110,766 | 19,466 | 17.6 | 57,185 | 17,955 | 31.4 |
| Texas | 283,744 | 53,510 | 18.9 | 145,232 | 35,747 | 24.6 |
| Utah | 17,801 | 2,684 | 15.1 | -- | b/ | -- |
| Vermont | 9,883 | 748 | 7.6 | 7,366 | 807 | 11.0 |
| Virgin Islands | 1,098 | 103 | 9.4 | -- | b/ | -- |
| Virginia | 74,818 | 16,249 | 21.7 | 42,718 | 9,874 | 23.1 |
| Washington | 102,952 | 15,120 | 14.7 | 77,762 | 14,241 | 18.3 |
| West Virginia | 40,729 | 5,420 | 13.3 | -- | b/ | -- |
| Wisconsin | 77,188 | 13,712 | 17.8 | -- | c/ | -- |
| Wyoming | 5,739 | 662 | 11.5 | 1,247 | 579 | 46.4 |
| a/ The total number of TANF families in 1998 is 3,175,646. The total does not include the five states/regions for which child-only caseload data are not reported or considered unreliable.
b/ Data not reported. c/ Data reported, but not reliable. Source: Department of Health and Human Services, ACF, Characteristics and Financial Circumstances of AFDC Recipients, 1994 and Characteristics of Financial Circumstances of TANF Recipients, 1998. |
||||||
Finally, federal welfare waivers granted to states during the 1990s encouraged states to test a variety of reform strategies, including strategies focused on work requirements, time-limited assistance, child support enforcement, and parental responsibility. During the Clinton Administration, federal welfare waivers were granted to 43 states.(7) Many of the states that had received waivers between 1993 and 1996 were the same states that experienced significant declines in their welfare caseload numbers. Thus, welfare caseload decline could be attributed in part to welfare waiver implementation.
Child-Only Caseloads
This study defines child-only cases as all TANF cases without an adult in the assistance unit.(8) Some states use the term "child-only" to mean cases that are not required to participate in a work requirement or are not assigned a time limit. The focus of this study is understanding the cases without adults, regardless of whether they are subject to a time limit.(9)
As shown in Exhibit 1.1, Column F above, the proportion of TANF cases that are child-only varies tremendously by state. The proportion ranges from about ten percent in Alaska, Indiana, and Vermont to close to half of all TANF cases in Alabama, Idaho, and Wyoming.
While TANF cases become child-only for a variety of reasons, most child-only cases fall in one of the following categories:
- The state has sanctioned the parent for a program violation by removing her from the assistance unit.
- The parent is in the home but is ineligible because she is receiving SSI.
- The parent is a non-qualified alien.
- A non-parental caregiver is caring for the child and either chooses not to receive assistance for herself or is ineligible due to income or resource limits.
Note that when TANF recipients begin reaching time limits in states that continue to provide assistance to the children, this will result in additional child-only cases. This has not occurred to a large extent yet.
Growth in Child-Only Caseloads
As Exhibit 1.2 shows, the number of child-only families receiving AFDC/TANF assistance has increased steadily throughout most of the 1990s, declining only in the last two years. The largest increase in child-only cases occurred between 1989 and 1993, when the child-only caseload increased from 399,700 in 1989 to 786,700 in 1993, an increase of 97 percent. While the total AFDC/TANF caseload also increased during this period, from 3.8 million to 5.0 million, the percentage increase was 32 percent, one-third of the child-only percentage increase. The child-only caseload continued to grow through 1996.
Even though the child-only caseload began to decline starting in 1997, the percentage decline is smaller than the decline in the total TANF caseload. It is estimated that the child-only caseload declined by 18 to 19.5 percent between 1997 and 1998, compared to a percent reduction of 24 percent in the total TANF caseload. A range is presented because for 1998, five states/regions did not report data or reported data considered to be unreliable. Imputing for these missing states/regions adds between 15,000 to 29,000 to the national child-only caseload, depending on the estimation method used, resulting in a total caseload of between 739,000 and 752,000. (10)
| Year | Total Families | Annual Change in TANF Families (%) | Families With No Adult Recipients | Annual Change in Families With No Adults (%) |
|---|---|---|---|---|
| 1985 | 3,692 | -- | 437 | -- |
| 1986 | 3,748 | 1.5 | 437 | 0.0 |
| 1987 | 3,784 | 1.0 | 361 | -17.4 |
| 1988 | 3,748 | -1.0 | 360 | -0.3 |
| 1989 | 3,771 | 0.6 | 400 | 11.1 |
| 1990 | 3,974 | 5.4 | 459 | 14.8 |
| 1991 | 4,374 | 10.1 | 558 | 21.6 |
| 1992 | 4,768 | 9.0 | 707 | 26.7 |
| 1993 | 4,981 | 4.5 | 787 | 11.3 |
| 1994 | 5,046 | 1.3 | 869 | 10.4 |
| 1995 | 4,873 | -3.4 | 923 | 6.2 |
| 1996 | 4,553 | -6.6 | 978 | 6.0 |
| 1997 | 4,058 | -10.9 | 918 | -6.1 |
| 1998 | 3,176 | -23.9 | 739 - 753a/ | -19.5 to -18.0a/ |
| a/ 1998 child-only are unavailable or not reliable for five states/regions. Data were imputed for the five states using two assumptions: the upper bound assumes the 1998 caseloads are equal to the 1997 caseloads; the lower bound assumes the 1998 caseloads declined by the same percentage as total TANF caseload reductions in the states.
Source: Department of Health and Human Services, ACF, Characteristics and Financial Circumstances of AFDC Recipients, various years. |
||||
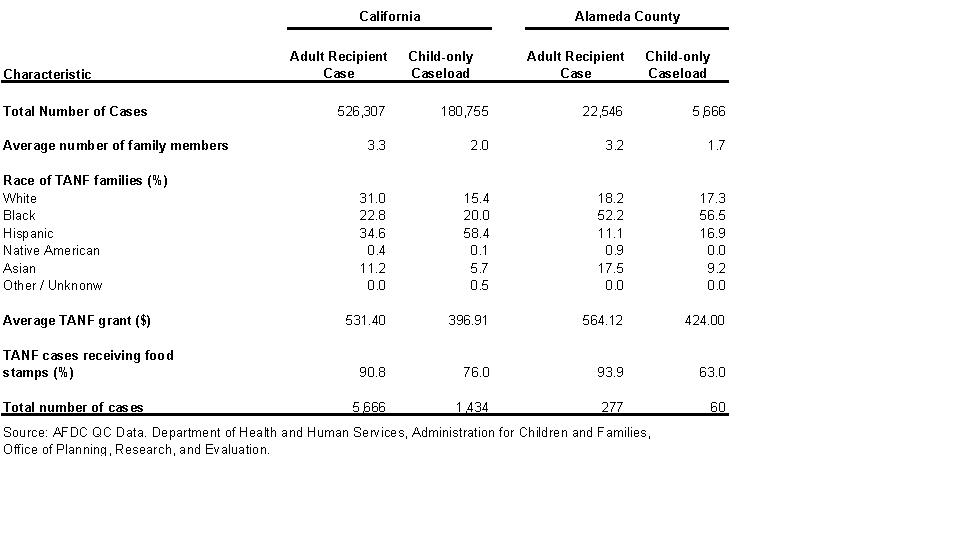
Within the child-only caseload, both parental and non-parental caregiver cases have increased, although the parental cases increased at a greater rate than non-parental cases from the late 1980s to the 1990s (see Exhibit 1.3). This is especially true of sanctioned cases, which increased from 14,000 to 112,000 cases between 1988 and 1996.
| Year | Non-parental | SSI | Alien | Sanction | Other Parental | Total Parental Cases | Total Child-Only Casesa/ |
|---|---|---|---|---|---|---|---|
| 1988 | 206 | 62 | 41 | 14 | 45 | 162 | 368 |
| 1991 | 263 | 96 | 87 | 36 | 60 | 279 | 542 |
| 1994 | 321 | 176 | 145 | 62 | 118 | 501 | 822 |
| 1995 | 364 | 179 | 140 | 86 | 99 | 505 | 869 |
| 1996 | 388 | 195 | 160 | 112 | 124 | 590 | 978 |
| 1997 | 341 | 214 | 145 | 75 | 134 | 568 | 909 |
| a/ The total number of child-only cases here differs slightly from the total number of no-adult cases in Exhibit 1.2 due to rounding and differences in the identification of subgroups.
Source: AFDC QC Data. Department of Health and Human Services, Administration for Children and Families, Office of Planning, Research, and Evaluation. |
|||||||
This is illustrated also in the first two panels of Exhibit 1.4, which shows how the composition changed in child-only cases from 1988 to 1994, the period of explosive growth in the child-only caseload. The proportion of child-only cases in sanction status more than doubled, from 4 percent to 10 percent, the proportion of alien cases increased by 5 percentage points, and the proportion of SSI cases increased by 4 percentage points.(11) As a result, the parental cases increased from 44 percent to 58 percent. The proportion of cases that are non-parental child-only cases declined, although this is not due to a decline in the absolute number of non-parental cases but to the larger increase in parental cases. (As Exhibit 1.3 shows, the non-parental cases increased from 206,000 in 1988 to 321,000 in 1994.)
Exhibit 1.4
Proportion of AFDC Child-Only Cases in 1988, 1994, and 1997
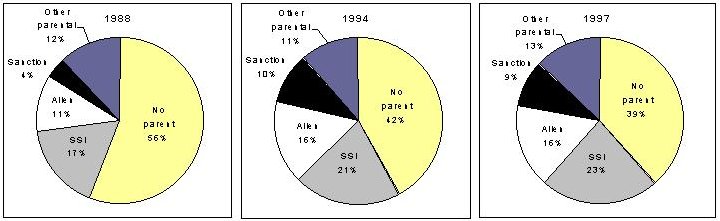
Source: AFDC QC Data. Department of Health and Human Services, Administration for Children and Families, Office of Planning, Research, and Evaluation.
From 1994 to 1997, the most recent year for which data are available, the composition of child-only cases did not change substantially. The non-parental cases comprised the largest portion of child-only cases, while SSI cases make up close to one-quarter of the caseload.
Several explanations may account for the increases in child-only cases from the late 1980s to the 1990s:
- An increase in sanctions for non-compliance with program requirements. The Family Support Act (FSA) of 1988 required non-exempt AFDC recipients to participate in job search, work experience, or education and training activities or be sanctioned. States sanctioned cases by removing the parent from the assistance unit, converting regular AFDC cases to child-only cases. In addition, some states were granted waivers that made additional AFDC recipients mandatory for the work requirements outlined by FSA, and thus, increased the number who could be sanctioned. Also, some states were granted waivers to impose harsher sanctions, such as extending the sanction period.(12)
- An increase in the number of individuals eligible for SSI. Congress enacted a series of legislation reforms in the mid-eighties and early-nineties that significantly expanded the scope of the SSI program. The biggest change was the enactment of the 1984 Disability Reform Act that significantly expanded eligibility, particularly for those with mental impairments. Outreach efforts in the early nineties coupled with major expansions in the child SSI program also had a major impact on the number of adults who applied for SSI benefits over this period. (13)
- An increase in the number of non-qualified aliens. The Immigration Reform and Control Act of 1986 (IRCA) allowed formerly illegal immigrants to attain legal status, although barred them from receiving AFDC for the first five years after their legalization. It is possible that the new legal status of the parents increased the likelihood that they would seek benefits for their citizen children. In addition, IRCA instituted employer sanctions for knowingly hiring illegal aliens, perhaps putting more non-qualified aliens in need of cash assistance for their families. Finally, illegal aliens living in the U.S. began growing by about 200,000 to 300,000 each year starting in 1989, after IRCA initially reduced the number of non-qualified aliens.(14)
- An increase in non-parental caregivers. One study examined Current Population Survey data and found an increase of kinship care between 1983 and 1993. Specifically, the number of children in the U.S. increased by 6.6 percent while the number of children living with relatives other than parents increased by 8.4 percent.(15) This growth in relative caregivers may have increased the number of TANF children living with relatives and receiving assistance on child-only cases. Additionally, there may have been an increased awareness on the part of relatives that cash assistance was available.
A decline in child-only cases began in 1997, with a greater reduction occurring in 1998. (Although, as explained above, data are incomplete; more complete data will be available starting in fiscal year 2000, when new federal data requirements take effect.) If this trend continues, there are several possibilities that may explain the decline. First, some states have changed their sanction policies in recent years, some imposing full-family sanctions, which closes the TANF case for noncompliance, and others reducing the overall grant level, but including the parent in the assistance group. These policy changes will reduce the number of sanctioned child-only cases in the state (to zero in some states). In addition, states are implementing programs for relative caregivers that could be considered alternatives to TANF, perhaps persuading some non-parental caregivers to migrate from TANF to these other programs. However, this might be offset partially by an increase of qualified aliens entering the country who can only get assistance for their children.
Proportion of Child-Only Caseload to Total TANF Caseload
As Exhibit 1.6 illustrates, the proportion of child-only cases has been steadily increasing from 1988 to 1998 (right-hand axis). During this period, the proportion of TANF cases comprised of child-only cases increased from 10 percent to 23 percent. The proportion continued to increase during the last two years despite the fact that the absolute number of child-only cases declined.
Exhibit 1.6
AFDC/TANF Families With No Adult Recipients, 1985 - 1998
(Number and Percentage of Total AFDC/TANF Families)
a/ 1998 child-only data are unavailable or not reliable for five states/regions. As discussed in Section III.C, the total number of child-only cases is estimated to be between 739,000 and 753,000 for fiscal year 1998, if these states/regions were included.
Note: The total number of child-only cases here differs slightly from the total number of no-adult cases in Exhibit A [in the Executive Summary] due to rounding and differences in the identification of subgroups.
Source: Department of Health and Human Services, ACF, Characteristics and Financial Circumstances of AFDC Recipients, 1994 and Characteristics of Financial Circumstances of TANF Recipients, 1998.
The child-only cases are not declining as rapidly as regular TANF cases, in part, because they are generally not subject to the work requirements and time limits imposed on regular cases. In addition, because TANF excludes non-parental caregivers' income in determining benefits for child-only cases, these caregivers of child-only cases are able to work while children remain eligible for cash assistance. Thus, these cases are not likely to be closed due to income limits.
Alternative Programs for Kinship Caregivers
In the past, many relative caregivers in need of financial assistance for children accessed AFDC/TANF or foster care funds. In order to receive payment as a foster parent, the state takes legal custody of the child, which has legal implications for family decision-making. In addition, foster care has more stringent licensing and other requirements, such as training.(16) In most instances, these alternative programs offer higher payments than TANF (but sometimes lower payments than foster care) with more relaxed licensing requirements than foster care. Some of these alternative programs offer services not offered in the state TANF programs. Currently, several states are creating alternative programs for relative caregivers.
Some states are classifying these cases as TANF, while others are not, depending in part on the funding source. Three state programs are discussed in Chapter 2.
Key Questions for the Study and Methodology
HHS funded this study to answer three key research questions:
- What are state policies and practices regarding child-only cases?
- What are the characteristics of the child-only caseload?
- What is the relationship between state policies and caseloads?
To answer these questions, The Lewin Group (TLG) interviewed state and local staff, examined national data and administrative data in three states, and conducted a case file review in three counties. These questions and the methods and data sources that were used to answer these questions are summarized below.
What are State Policies and Pactices Regarding Child-Only Cases?
HHS was interested in learning about state policies enacted with regard to child-only cases. Additionally, the implementation of these policies is important as well. TLG conducted interviews with state officials in California, Florida, and Missouri, and administrators and eligibility workers in Alameda, Duval, and Jackson counties. The focus of the interviews was to understand state policy choices, operational practices, and perspectives on trends and changes in the TANF child-only population. Results from these interviews are summarized in Chapter 2.
What are the Characteristics of the Child-Only Caseload?
To examine the characteristics of the child-only caseload, this study examines national data collected by HHS, state administrative data for three states, and case file data for three counties.
HHS Data
HHS collects sampled data from states, which permits it to determine the size and composition of cases by states. The data sources are the National Integrated Quality Control System (QC) prior to 1997 and the Emergency TANF Data Report starting in 1997. Both data sources rely on a sample of records submitted by states.
The data are limited in two ways. First, sample sizes are generally not large enough to examine basic demographic information of the child-only caseload by state. Second, the reasons the cases are child-only are often unknown (13 percent of the cases in 1997 were unknown). To supplement these data, HHS contracted with TLG to collect more detailed information from case files in three counties and, to the extent possible, state administrative data.
Case File Data
A more in-depth analysis of the child-only caseload is presented in Chapter 3. This is based on information collected from income maintenance case files of 761 child-only cases randomly selected from each of three county's child-only caseloads in May 1999. The sample was selected to be representative of each county at the 90 percent confidence level.
A focal child was randomly selected from each sampled child-only case, and counties were requested to pull all case files associated with the focal child since the child's birth. In some instances, earlier case files had been archived or destroyed and information on the earlier cases was unavailable, although complete information was generally available for the current case. As a result, much of the information presented in Chapter 3 focuses on the current child-only case.
Information was collected on the characteristics of the caregiver, focal child, and absent parent, the household composition, the circumstances surrounding the child-only case (i.e., how it became child-only), and the household's benefit receipt and income.
State Administrative Data
TLG requested information from state administrative data for the three states. This study hoped to compare California, Florida, and Missouri child-only caseloads in 1999 to a point in time prior to the enactment of PRWORA to examine the differences in composition of child-only cases. In addition, child-only caseloads could be compared to regular caseloads for these two points in time. Unfortunately, due to small sample sizes and confidentiality concerns, California was not able to supply data. (Some data on the California caseload were available by examining HHS' QC data.) Florida was able to supply data for two points in time: September 1997 and May 1999; all calculations were made by TLG. Missouri was able to supply basic information for May 1994 and May 1999; calculations were conducted by staff in Missouri's Department of Social Services, Research and Evaluation branch.
In addition, Florida and Missouri were both able to supply similar data for Duval County and Jackson County. The information from this data source is compared with the case file data to ensure that the case file data is representative of the county. Analysis of these data is included in Appendix C.
What is the Relationship Between State Policies and Caseloads?
Certain composition data can be linked directly with state policies. For example, states that sanction by reducing the benefit levels or closing the case, but not removing the adult, will not have sanctioned cases in their child-only caseload. Other policies and practices may indirectly affect the caseload. Chapter 3 links the results from the data analysis with information that was learned from interviews with state and county officials and county eligibility workers.
The Three States
As discussed above, this study focuses more attention on the policies and caseload composition of California, Florida, and Missouri child-only cases and, in particular, Alameda, Duval, and Jackson counties. These states were not selected randomly, but were selected after examining HHS data with regard to the TANF child-only composition and size of child-only caseloads.
The study sought to include three states that had a large and increasing proportion of TANF child-only caseloads, that offered geographic diversity, and that implemented different policies that might be reflected in the composition of child-only cases. Because cooperation and assistance were key in conducting this study, only states that indicated an interest in participating in the study were considered.
After selecting the states, discussions were held with state officials to select a county for the case file review. Only counties with sufficiently large child-only caseloads for a case file review could be considered. In addition, since the California caseload would have a relatively high percentage of aliens, a county in Florida that had a relatively low percentage of aliens was selected for diversity. With this general guidance, each state selected counties that were amenable to a case file review.
Exhibit 1.7 presents a summary of some of the major characteristics of the program environment of the state and selected counties. Below is a brief description of each county.
- Alameda County, California, which is located on the east side of San Francisco Bay, is the largest and most urban county in this study, with a population of 1.4 million. Oakland is the largest city in Alameda County, with a population of 387,600 (1995) followed by Fremont, Hayward, and Berkeley. The population is ethnically more diverse than the other two counties, with a higher share of Hispanics and Asians. It has the highest median household income and the lowest poverty rate relative to the other two counties. The county has the largest TANF caseload and offers the highest TANF grant.
- Duval County, Florida includes the city of Jacksonville and a few neighboring beach communities. In Duval, the population is about two-thirds white; it has a higher share of blacks (28 percent) compared with the state and U.S. average. The unemployment rate in Duval is lower than the state, overall, and lower than the other two counties.
- Jackson County, Missouri includes Kansas City, Independence, and Grandview. While Missouri is more rural than the U.S., on average, Jackson County has only a small share of the population living in rural areas. It has the highest share of whites (70 percent) relative to the other two counties; one-quarter of the county is black.
Exhibit 1.7
Characteristics of the Counties, States, and United States 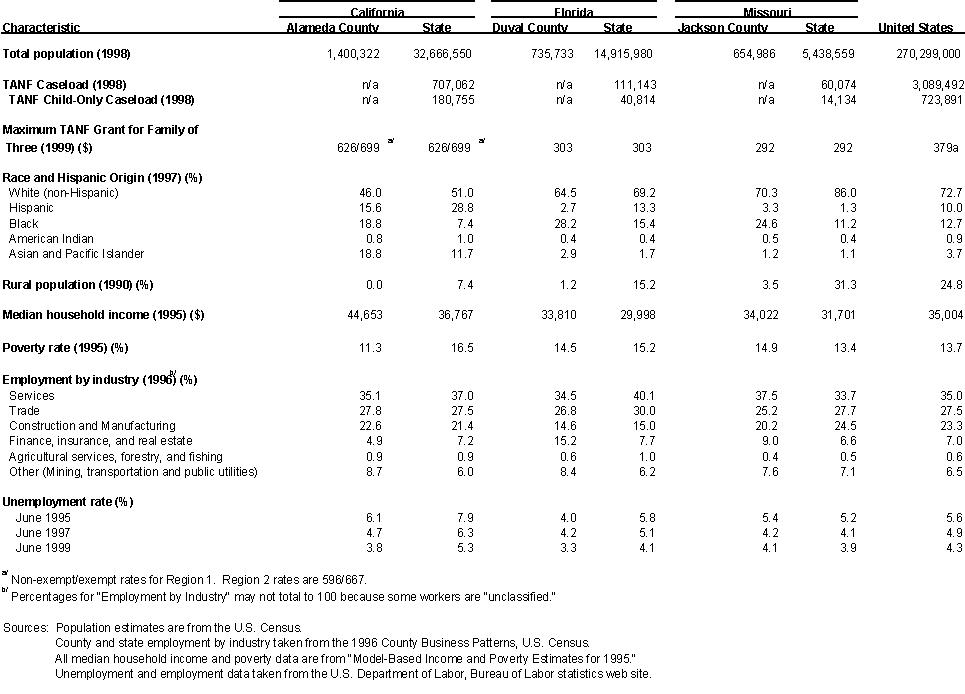
1. For example, adults may be ineligible if they have a drug felony conviction.
2. Kaplan, J. (1999). The Use of Sanctions Under TANF. Welfare Information Network. Washington, DC.
3. Kramer, F. (1997). Welfare Reform and Immigrants: Recent Developments and a Review of Key State Decisions. Welfare Information Network. Washington, DC.
4. States can choose not to provide assistance to qualified aliens who entered the country before August 1996.
5. These alternative state programs, which are discussed for three states below, may also be considered alternatives to foster care for relative caregivers. Foster care often requires licensing, home studies, and supervision by child welfare agencies, although payments may be higher.
6. Federal Register, Vol. 64, No. 69. April 12, 1999.
7. Department of Health and Human Services (1999). Second Annual Report to Congress. Washington, DC.
8. TANF cases with an adult in the assistance unit will be referred in this report as "regular TANF cases."
9. The time limit applies to sanctioned cases in many states.
10. A range was constructed for the five missing states, assuming for the upper-bound estimate that the child-only caseload was equal to the 1997 child-only caseload in the state and for the lower-bound estimate that the child-only caseload declined by the same percentage reduction as the total TANF caseload for the state. An analysis of the states and regions that reported reliable data found that about half of the states experienced reductions in the child-only caseload and the percent reduction was less than the percent reduction in the total TANF caseload.
11. Note that the "other parental" cases are cases headed by parents who in most cases were not receiving benefits, but the reasons could not be determined from state-submitted data. They may have been ineligible because they were felons, had committed fraud, or other state-specific reasons. Some probably should have been classified as an SSI recipient, an alien, or a sanctioned adult, but the exact reason was unknown. Finally, some administrative data systems classify cases headed by minor parents who are receiving benefits as child-only cases.
12. A description of the state waivers approved between January 1993 and August 1996 can be found on: http://aspe.hhs.gov/hsp/isp/waiver2/waivers.htm.
13. Stapleton, D. C., M. E. Fishman, G. A. Livermore, D. Wittenburg, A. Tucker, & S. Scrivner (1999). Policy Evaluation of the Overall Effects of Welfare Reform on SSA Programs: Final Report. Report by The Lewin Group prepared for the Social Security Administration. Washington, DC.
14. Fix, M. and J. Passel (1994). Immigration and Immigrants Setting the Record Straight. Urban Institute. Washington, DC.
15. Harden, A. W., and R. L. Clark (1997). Informal and Formal Kinship Care. Report prepared for HHS, ASPE, Washington, DC.
16. Some states remove some of the foster care licensing requirements for relative caregivers.
TANF Child-Only Policies and Practices in Three States
Introduction
As Chapter 1 explained, states have been given broad flexibility in determining which policies apply to child-only cases. In addition, states have been given the opportunity to develop TANF policies that could have a bearing on child-only caseloads in the future. This chapter describes in more detail the TANF policies and practices in three states, California, Florida, and Missouri, and in the three counties visited, which are Alameda County, Duval County, and Jackson County.
This chapter draws on information from interviews conducted with state officials, county administrators, and county staff, supplemented with information from other published reports, as cited. The chapter begins with a brief description of the organizational and staffing structure in the three counties. Section III outlines the policies and practices in the three states that were identified earlier as affecting child-only caseloads - policies regarding sanctioning, aliens, Supplemental Security Income (SSI), non-parental caregivers, and time limits. Section IV discusses the key differences between TANF and other programs available to non-parental caregivers, and Section V discusses the interaction between TANF staff and child welfare staff. Section VI concludes with a discussion of how county welfare offices are handling a growing share of TANF cases comprised of child-only cases.
Organizational and Staffing Structure
In Alameda County, the Welfare to Work Department operates the county's TANF program, which is called California Work Opportunity and Responsibility to Kids (CalWORKs). Unlike Florida and Missouri, CalWORKs is county administered, with each county given some autonomy in administering the program, under the state's supervision, and sharing in the costs of program operations. In Duval County, the First Coast Workforce Development Board and the Work and Gain Economic Self-Sufficiency (WAGES) Coalition administers the TANF program and contracts out to Lockheed Martin IMS as the service provider for the work activities and participant support services required under the WAGES program. The Florida Department of Children and Families (DCF) is the responsible entity for all eligibility functions of the program. In Jackson County, the Missouri Department of Social Services Division of Family Services operates the state's income maintenance and self-sufficiency programs, referred to as Temporary Assistance. The Division of Family Services also has a separate program, FUTURES, which provides education, skill training and employment assistance to individuals receiving AFDC.
In each of the counties, staff responsible for eligibility functions are separate from staff responsible for assigning work activities and monitoring participation. Differences exist in how the caseloads are assigned to the eligibility workers:
- Alameda has a unique organizational structure designed to provide more timely and accurate case management services. Eligibility workers are not assigned caseloads; rather they see clients as they arrive with an appointment to one of the four self-sufficiency centers. The county utilizes an on-line case management system, which allows an eligibility worker to retrieve electronically all necessary information to conduct the transaction, while all case files are housed in the Alameda Benefit Center and can be retrieved if necessary. While the county now has separate Employment Counselors who handle the employment and training activities and make all child care and travel arrangements, the county is making plans to have integrated case managers who handle both eligibility and employment services functions.
- In Duval, eligibility workers have a mixed caseload of child-only and regular cases. Some eligibility workers are specialized and handle cases that are not receiving cash assistance, but receive food stamps or Medicaid only. As mentioned above, Lockheed Martin staff operate the WAGES component, which includes work activities required of applicants at initial screening and work activities required of TANF recipients.
- In Jackson, eligibility staff are divided into caseworkers and self-sufficiency case managers. Caseworkers manage the child-only and Medicaid-only cases while self-sufficiency case managers review the regular TANF cases. FUTURES Advocates are staff who work with the welfare-to-work cases that need assistance attaining job skills or finding employment.
State TANF Policies Affecting Child-Only Caseloads
This section discusses the states' policies regarding sanctions, alien status, SSI, non-parental caregivers, and time limits focusing on how these policies impact child-only caseloads and how they were implemented in the three counties visited. In addition, all three states have developed other programs for relative caregivers who might otherwise apply for TANF assistance.
Sanctions
PRWORA gives states the flexibility to determine the penalty for noncompliance. In addition, welfare administrators may enforce the sanctions differently, based on the sanction processes and their philosophies regarding the effectiveness of sanctions. California, Florida, and Missouri have different sanctioning policies and processes involved in imposing the sanctions.
Exhibit 2.1 highlights the basic sanction policy in each of the three states.
(a) California
When a parent is sanctioned in California, generally for not participating in the welfare-to-work program, the parent's income is included in the benefit determination, but her needs are not considered and she is not included in the assistance unit. This essentially converts a regular case to a child-only case. For certain program violations, such as not providing proof of immunizations, the state issues a penalty, not a sanction. In this situation, the adult's needs are not included, although the adult remains in the assistance unit. Finally, the state reduces a family's grant by 25 percent if the adult refuses to cooperate with child support activities.
| California | Florida | Missouri |
|---|---|---|
|
|
|
| a/ This policy did not change. | ||
With the welfare-to-work sanction, an individual is ineligible until she complies, if it is the first violation. The second violation results in a minimum sanction of three months or until the client is compliant, whichever is latest; the third sanction results in a minimum sanction of six months, or until the client is compliant, whichever is latest. In addition, the county is required to issue voucher or vendor payments for at least the rent and utilities for the second and third sanction.
(b) Florida
Florida is one of several states that imposes full-family sanctions (i.e., closes the cash assistance case) when clients are first noncompliant for not participating in a work activity; this is referred to as a level-one sanction.(1) Prior to December 1999, a level-two sanction, which is imposed for the second incident of noncompliance, resulted in a loss of cash assistance and food stamps, until the client complied for 30 days. A level-three sanction was imposed for the third incident of noncompliance, and closed the cash and food stamps case for at least three months. In December 1999, the policy on food stamp sanctions was changed after it was determined that it did not conform to federal food stamp regulations. Specifically, the state first applies the food stamp work exemptions (which are broader, exempting mothers with children under age six) before closing the food stamp case and allows other household members to apply for food stamps after a penalty period. In addition, the state decided to apply the food stamp sanction to level-one sanctions as well.(2)
With level-two and level-three sanctions, the parents can apply for assistance for their children through a protective payee, a third party who receives the grant on behalf of the parent and children. For this study, these protective payee cases are categorized as child-only cases.
A sanction is "forgiven" after six months. This means that a client whose cash has been sanctioned, but who participates in a work activity for six months, would receive a level-one sanction and not a level-two sanction for a second violation. It is important to note that analysis presented in Chapter 3 showing some cases are child-only due to sanction are level-two and level-three sanctions. Many more cases were sanctioned but are not captured in the estimates because of case closure.
While the work activity sanction is imposed to a greater extent then other sanctions, a client can also be sanctioned for other reasons, including: (1) not cooperating with Child Support Enforcement (which closes the TANF grant and removes the adult from Medicaid); (2) failing to immunize the children (children's needs, and not the adult's needs, are removed); (3) having a teen child who is not attending school (children's needs, and not the adult's needs, are removed); and (4) not attending a school conference (adult's needs are removed). Only sanctions that remove the adult result in child-only cases.
(c) Missouri
Missouri's sanction policy changed in October 1998, which has implications for this study. Prior to this point, Missouri had a policy similar to California's - noncompliance resulted in the removal of the parent from the TANF grant, converting the case to a child-only case. Noncompliance under the current policy results in a 25 percent reduction of the grant but keeps the adult in the assistance unit. For all cases except households with one child, this new policy results in a greater reduction of benefits. This essentially results in a smaller child-only caseload in 1999 than would have been, due to this reclassification of sanctioned cases. Before this new policy was enacted, the state had been considering several changes to the sanction policy, including a full-family sanction,(3) but opted for a benefit reduction after pressure from advocacy and community groups.
Alameda had low sanction rates in the past, although there is evidence that this is changing. In the early 1990s in the GAIN program, the predecessor to CalWORKs, there was insufficient funding to provide employment services to the full caseload. During those years, GAIN served primarily volunteers, and the majority were in self-initiated education or training programs. Thus, Alameda referred very few cases for sanctioning relative to other California counties and sanctioned few, if any.(4) By late 1997, Alameda started implementing a Work First program and called in mandatory clients. By June 1998 there was approximately 4 percent of the caseload in sanction status; another 5 percent had been referred for sanction, but were complying or had not yet been sanctioned. By September 1998, the reported sanction rate had increased to 5 percent of the caseload and another 11 percent had been referred for sanction. This reflected the change in program focus and the increased number of clients being required to participate. An analysis conducted by the county in June 1998 found that almost half were sanctioned for not attending the initial orientation, 22 percent did not participate in job club/job search, 24 percent did not participate in an assigned education or training activity, and 5 percent did not attend their assessment.(5)
Of the three states, Florida's policy imposes the severest penalty for noncompliance by closing the cash assistance case for first violations. In addition, eligibility workers have no discretion in when to impose or lift a sanction. The WAGES program refers all cases that are noncompliant to the eligibility workers and they have 10 days to impose the sanction. When the client complies with their WAGES work requirements, the WAGES program will request that the sanction be lifted. For level-two and level-three sanctions with protective payees (the child-only cases), the TANF recipient volunteers a friend, relative, or neighbor as her protective payee to receive the welfare check on behalf of the children.
In Jackson County, the families are subject to sanctions for an adult's refusal of a job offer, for failure to comply with child support, and for failure to comply with or participate in work-related activities. If the case has no barriers and is expected to conduct a job search, the self-sufficiency eligibility worker determines whether to sanction the case or not. If the case has some barriers to immediate employment and is assigned to the FUTURES program, then it is the FUTURES worker's determination as to whether the case should be sanctioned. In this situation, the FUTURES worker will refer the case to the eligibility worker, who will impose the sanction. All sanctions require a face-to-face meeting, and the client is given several chances to come into compliance. As mentioned above, these sanctioned cases are not child-only, although they were in the past.
Eligibility of Aliens
Exhibit 2.2 outlines the states' policy regarding the eligibility of aliens in each state.
All three states deny benefits to non-qualified aliens who were ineligible under the AFDC program. As discussed in Chapter 1, states cannot use federal funds for payments to qualified aliens who entered the country after August 1996 for the first five years they are in the United States. Nevertheless, California and Missouri have opted to continue providing benefits to this group, using state funds, while Florida is not providing benefits to this group. All three states have opted to provide benefits to qualified aliens who entered before August 1996.
In all three states, the status of aliens who apply for TANF assistance as qualified aliens is verified with the U.S. Immigration and Naturalization Service (INS). Generally, non-qualified applicants admit to being non-qualified when they apply for their children who are U.S. citizens; in this situation, the case is not reported to INS, since false information has not been presented. The application asks about income and resources, although eligibility workers interviewed assumed that some income is not reported. Since this employment is "off the books," it goes undetected. The income that is reported is counted in the cash assistance benefit calculation.
| California | Florida | Missouri | |
|---|---|---|---|
| Non-qualified Aliens | Non-qualified aliens who were previously eligible under the AFDC program are eligible for state-funded benefits. Otherwise, they are not eligible for assistance and their U.S. citizen children are eligible (case is child-only). | Are not eligible for assistance. U.S. citizen children of non-qualified aliens are eligible (case is child-only). | Are not eligible for assistance. U.S. citizen children of non-qualified aliens are eligible (case is child-only). |
| Qualified Aliens Entering the Country Prior to August 1996 | Are eligible for TANF benefits. | Are eligible for TANF benefits. | Are eligible for TANF benefits. |
| Qualified Aliens Entering the Country After August 1996 | Are eligible for state-funded TANF benefits. After five years in the country, they are eligible for federal TANF benefits. | Are eligible for state-funded TANF benefits. After five years in the country, they are eligible for federal TANF benefits. | Are not eligible for TANF benefits for five years after entering the country. U.S. citizen children are eligible (case is child-only). |
SSI Child-Only Cases
Given the choice between SSI and TANF, individuals will most likely opt to receive SSI benefits, given the higher benefits. SSI recipients can then apply for TANF benefits for their children. This section discusses the differences in SSI and TANF benefits, the treatment of SSI in determining other benefits, and the process for referring individuals to SSI in the three counties.
Individuals who are aged, blind, or disabled and who have little or no income and resources are eligible for SSI benefits. Disabled individuals whose income and resources meet the SSI threshold are often eligible for TANF benefits from their state agency if they have children. However, since SSI payments are greater than TANF benefits for a disabled parent or child, these individuals have an incentive to apply for SSI. Exhibit 2.3 presents the difference between the SSI benefits for one parent's needs and the additional benefits parents could receive by being included in the TANF assistance group instead of on SSI in the three states. As this Exhibit shows, it is always in the financial interest of the SSI eligible individual to apply for SSI benefits rather than be included on the children's TANF grant.
| State | Maximum SSI payment for disabled individuals | Maximum TANF grant for one person's needsa/ |
|---|---|---|
| California | $676b/ | 102 - 221c/ |
| Florida | 484 | 61 - 62 |
| Missouri | 484 | 62 - 102 |
| a/ Represents range based on size of assistance unit; assumes at least one child remains on the grant
b/ SSI recipients are not eligible for food stamps in California because the state supplements the federal SSI payment instead of issuing food stamps. SSI for the blind is $732. c/ Represents the exempt rates for Region 1 (which includes Alameda) effective July 1999. |
||
In all three states, SSI is not considered when determining eligibility for TANF and benefit levels. Florida enacted legislation that included SSI recipients in the TANF assistance group, and subsequently, would count the SSI benefit as income in calculating TANF benefits. The state was to provide a special needs allowance for families that include SSI recipients. In the end, the state never implemented this provision and ultimately changed its state law, perhaps out of concern about the number of families that could potentially lose benefits.
TANF cases that are child-only because the parent is an SSI recipient may have started as a regular TANF case before the parent received SSI. Alternatively, the parent may have been receiving SSI when she learned that TANF benefits were available for her children. The process differs for each scenario. In the first situation, in which the parent was first receiving TANF, her TANF eligibility worker or case manager may have referred her to SSI. The assessment process for determining exemptions to work requirements could lead staff to detect possible eligibility for SSI. In the second situation, in which the parent was first receiving SSI, the SSI worker may have informed the parent that her children were eligible for TANF. In addition, some clients learn about benefits from outside organizations or through word-of-mouth.
The referral from TANF to SSI is fairly informal in all three counties, dependent upon staff's judgment, although Alameda has a more formal TANF appraisal and assessment process. Alameda County utilizes an upfront process that involves social workers at intake conducting an initial appraisal. The social workers are able to spot individuals who might be eligible for SSI and help them with the application process. Applicants are assigned to a two or three-hour orientation conducted by welfare-to-work staff at five agency and five community sites throughout the county. At the orientation, they are told about their rights and responsibilities and an appraisal is conducted where they are assigned to a job workshop and given child care. Those unable to find a job (or not employed full-time) are referred to assessment where an evaluation is conducted, in part, to uncover any educational, physical, or mental limitations.
In Duval, one worker noted that he typically asks clients who are not meeting their work requirements why they are not complying. The answers often reveal disability-related conditions and he will suggest that they apply for SSI. Another staff member mentioned that WAGES workers in Florida are more likely to discover individuals who might have learning or physical disabilities and they will actively encourage clients to apply for SSI, even helping them complete an application. As cases reach the time limit in Florida, clients who are potentially eligible for SSI will be given a hardship exemption until their application is processed, as long as they have not exceeded the 48-month lifetime limit. According to staff in Duval, however, clients who are eligible for SSI typically learn they are eligible early in the process before they have used up their time on the clock.
Missouri TANF workers may see individuals who might be eligible for SSI at intake and refer them, or they may learn about their possible eligibility during their participation in FUTURES, which handles the clients with barriers to participation. Still, one staff person said that she rarely referred clients to SSI because she was not qualified to make this judgment; referrals to SSI tended to come from physicians and outside organizations.
Staff in all three county offices said they have limited interaction with SSI staff, and most of it is limited to getting listings of TANF recipients approved for SSI. Confidentiality issues preclude the staff from sharing detailed information between the offices, although SSI may have questions regarding a client's eligibility that eligibility staff can answer.
TANF Policies Regarding Non-Parental Caregivers
Relative caretakers of TANF cases must have a specified degree of relationship to the child. Generally, this means a relative who is immediate family or a stepparent, uncle or aunt, first cousin, first cousin of parent, nephew or niece, persons of preceding generations such as a great-grandmother, or the spouse to one of these persons.
In California and Florida, caretakers who are not related to the children are not able to receive TANF benefits for children under their care. In Missouri, exceptions are allowed for non-relative caretakers who have legal custody or legal guardianship of the children. Legal custody can be obtained via family court after it has been determined that the child should be placed outside of the home. Legal guardianship is obtained through probate court after family court has relinquished its jurisdiction over the child and his or her caretaker.
In all three states, relative caregivers must cooperate with the state by supplying information on each parent absent from the home, which is forwarded to the state child support agency. In addition, the states require that relative caregivers also assign child support benefits over to the state. The child support agency pursues the absent parent to establish a support order, if none is in place, or to enforce an existing order.
The TANF programs in the three counties offer no services targeting non-parental caregivers, although non-parental caregivers who are in the assistance group are eligible for the same services available to parental caregivers, including job search assistance, child care, transportation, and other ancillary services. Non-parental caregivers not in the assistance group are generally not eligible for these services, although states often have non-TANF programs that offer services, such as child care and transportation, for which they can apply.
Time Limits
Child-only cases, with the exception of sanctioned cases in some states, are not subject to a time limit. Nevertheless, states' time limit policies can influence the number of cases that become child-only in two ways. First, states that remove the parents from the assistance group but continue to provide assistance to the children at the time limit, automatically convert regular cases to child-only cases. Second, states that reduce or terminate cash assistance at the time limit impose economic hardships on families, possibly leading to some children moving in with relatives or other caretakers who are better able to care for them, and thus, leading to an increase in child-only cases with non-parental caregivers.
Of the three states studied, only Florida welfare recipients have begun to reach the time limit. In California and Missouri, the discussion presented in this section focuses more on how states intend to implement these policies when individuals begin reaching the time limit and the methods used for tracking the time limit.
Exhibit 2.4 provides basic information on the time limit policies. The policies discussed in this section applies to the caseload that is not exempt; states can exempt 20 percent of its caseload from the five-year federal time limit and continue to provide assistance to this group using the federal block grant. In addition, states may exempt more than 20 percent and provide assistance using state funding.
| California | Florida | Missouri | |
|---|---|---|---|
| Length of Time Limit |
|
|
|
| What happens at time limit? |
|
|
|
| When did/will families begin reaching time limit? |
|
|
|
(a) California
California's TANF program, CalWORKs, places time limits on adult's TANF receipt, but not on children's benefits, meaning the case becomes child-only after the adults reach the cumulative five-year time limit. Counties may decide whether to provide benefits for the children in the form of cash or vouchers.(6) The five-year time limit does not apply to sanctioned cases.
Because the CalWORKs program was not implemented until 1998, well after PRWORA was signed, the state has to track two time limits: the federal time limit, starting December 1996, and the state time limit, starting January 1998. Both are five-year time limits, but some individuals will reach the federal time limit first (starting in December 2001). If the 20 percent exemption limit has been exceeded, the state will have to use state funding to provide assistance to these individuals. Welfare recipients will not reach the state time limit until January 2003.
Within the five-year time limit, applicants are eligible for 18 cumulative months and current recipients are eligible for 24 cumulative months of aid. Aid can continue after the 18- and 24-month cumulative time limits if the county certifies that there is no job currently available and the recipient participates in community service. Counties may also extend the 18-month time limit for up to 6 months if the extension is likely to result in unsubsidized employment or employment is not available in the local labor market.
(b) Florida
Florida's WAGES program limits most welfare recipients to 24 months of assistance over a 60-month period. Certain individuals - long-term recipients or individuals under age 24 who have not completed high school or have little or no work experience - are assigned a 36-month time limit out of a 72-month period. The clock is extended by one month for each month welfare recipients work, up to 12 months. All welfare recipients are limited to 48 months over their lifetime.
Unlike California, the time limit applies to the household and not just the adults of the household. This means that at the time limit, the state terminates the family's cash assistance, although the family is still eligible for food stamps and Medicaid. Two exceptions to this policy are allowed. First, exemptions of up to 12 months are offered to individuals who have "diligently participated in WAGES" and still not found employment (not exceeding the 48-month time limit). Adults continue to receive assistance on the grant, and the case is not child-only. Another exception is made when a hardship exemption is not granted, but Child Protection Services (CPS) reviews the case and determines that the child is likely to be placed into an emergency shelter or foster care as a result of case closure. In this situation, a protective payee is assigned to the case and the benefits for the children are paid to the protective payee, making the case a child-only case; however, the 48-month lifetime limit still applies to the children.
(c) Missouri
Missouri's TANF program applies the five-year lifetime limit to the household. Thus, the case closes when the time limit is reached. The child will continue to be eligible if he or she were to move in with another adult after the first household reached the time limit and is eligible when he or she becomes an adult. Five-year time limits in Missouri went into effect July 1997 and will be reached in July 2002. At this point, there are no provisions in the policy that will convert regular cases to child-only cases at the time limit.
2. Implementing the Time Limit
Clearly, for time limits to affect child-only caseloads, welfare departments must be able to track the number of months of benefits clients are receiving. In addition, time limits will only influence child-only caseloads if states take action when families reach the limits.
(a) How are staff tracking the time limit?
In Alameda, as discussed above, eligibility workers have to monitor the federal time limit and the state time limit. Both are five-year time limits, although individuals will reach the federal time limit first. This complex tracking must be done for fiscal purposes, to determine when to provide assistance from state funding and not from the federal block grant. The state is currently implementing a statewide-automated welfare data tracking system. The system will contain information regarding the 18- or 24- and 60-month time limits; welfare benefits received from the counties; and county-specific information on exemptions, exceptions, and sanctions.
In Duval County, the eligibility workers monitor the number of months of assistance both manually, on paper forms that are included in each case file, and electronically, in the automated case management system. The time limit follows the adults as they move from one case to another and the system should track this movement.
In Jackson, eligibility workers track the time limit by manually counting the months; the computer system has not been adapted to keep count of the number of months left on the clock.
(b) What will happen when families reach the time limit?
Since welfare recipients have not begun to reach the time limit in California and Missouri, and are only beginning to reach the time limit in Florida, questions remain regarding how cases will be handled at the time limit which will have an effect on child-only caseloads. For example, in California, counties may extend assistance to adults who have reached the five-year time limit if they meet particular conditions.(7) In Missouri, it is still unclear how these cases will be treated, although the policy calls for the closure of these cases. In Florida, welfare recipients have begun to reach the time limit but many are currently being offered benefit extensions. As more families reach the end of their extensions, the financial hardship could lead to an increase in the number of children who are left with relatives.
Key Differences Between TANF, Foster Care, and Other Programs for Relatives
As discussed above, non-parental caregivers may seek assistance from other programs rather than apply for TANF assistance. These programs available for relative and non-relative caretakers of children, generally offer higher levels of benefits, impose additional requirements, and offer additional services. The extent to which caregivers see these other programs as substitutes for TANF has an impact on child-only caseloads.
| California | Florida | Missouri |
|---|---|---|
|
|
|
This section discusses some of the characteristics of four of these programs - the federal foster care program, California's Kinship Guardianship Assistance Payment (Kin-GAP) Program (not yet implemented), Florida's Relative Caregiver Program, and Missouri's Grandparents as Foster Parents program. It outlines some of the differences in program goals, services and requirements, benefit levels, program funding, and caseloads.Exhibit 2.5 gives an overview of the programs.
Briefly, California plans on implementing the Kin-GAP Program statewide in January 2000 for relative providers who become legal guardians; Florida implemented the Relative Caregiver program in October 1998 for relative caregivers who have legal custody or are caring for children under court supervision; and Missouri implemented the Grandparents as Foster Parents program in August 1997, restricted to grandparents who are caring for their grandchildren (in August 1999, the program was expanded to include relatives other than grandparents).
Different Program Goals
The goals of TANF, foster care, and the alternative programs differ to some extent. Some alternative programs are considered alternatives to foster care while others are considered alternatives to TANF. In addition, foster care program goals differ by state, although these state differences are not discussed in this section.
- TANF was enacted "to increase state flexibility in operating programs designed to:
- aid needy families so that children may be cared for in their homes or those of relatives;
- end dependence of needy parents upon government benefits by promoting job preparation, work, and marriage;
- prevent and reduce out-of-wedlock pregnancies and establish goals for preventing and reducing their incidence; and
- encourage formation and maintenance of two-parent families."(8)
- The goal of foster care is to provide a protective environment for abused and neglected children until a permanent placement can be made. Reuniting children with their families is the goal for some children in foster care, although not for all, and support services are provided to assist families in reunification. For children who cannot be reunited with their parents, then adoption, permanent custody arrangements, or long-term foster care are considered.
- California's Kin-GAP Program seeks to move foster care children living with relatives to the Kin-GAP program and create permanency in the children's lives. Given that many children are in long-term, stable placements with relatives, the state Legislature saw "no need for continued governmental intervention in the family life through ongoing, scheduled court and social services supervision of the placement."(9) This gives the relatives the same level of payments as foster care, but allows them to leave the foster care system.
- The goal of Florida's Relative Caregiver Program is to provide assistance to relatives who would be unable to serve as a caregiver without the payment, putting children at risk of placement in shelter or foster care. The program strives to achieve permanency and stability for the children who are at risk of foster care placement.
- Missouri's Grandparents as Foster Parents program recognizes that grandparents and relatives age 50 and over need resources, parenting training, and other supportive services to care for their grandchildren. It seeks to provide an alternative to TANF assistance, which pays substantially less than foster care.
Services and Requirements
Among the TANF, foster care, and state alternative programs outlined above, TANF offers the fewest services and imposes the fewest requirements on non-parental caregivers, while foster care offers the most services and imposes the most stringent requirements. The alternative programs have some requirements, although they are generally not as stringent as foster care. These programs are discussed separately below.
The TANF programs require that non-parental caregivers meet with their eligibility workers for redeterminations of benefits. Generally, redeterminations take place every six to 12 months (depending on the state), or every three months in some states, if the case is receiving food.(10) During the redetermination, they must supply basic information about the household, although are not required to provide information regarding income and resources if they are non-parental caregivers excluded from the grant. Non-parental caregivers not included in the grant are not required to participate in the work activities required of caregivers included in the grant.
The key difference between foster care and TANF is that children in foster care are in the state's legal custody and not the caregiver's custody. In addition, foster care imposes stringent requirements, requiring the most supervision and oversight from the child welfare agency. In Florida, relative caregivers must be fully licensed as foster parents in the foster care component, while California and Missouri waive specific licensure requirements for relative caregivers. However, even in these states, families must undergo a home study and their cases are reviewed every six or twelve months. Training is often available, and sometimes required, of families. For example, the California DSS provides training to foster parents through community colleges and county-sponsored training programs; Missouri requires 30 hours of foster parent training; and Florida requires that families complete 21 hours of training. California and Missouri require that for relatives to receive foster care, the children must come from a poor family (i.e., were previously eligible for TANF).(11)
California's Kin-GAP program will require relative caregivers to have legal guardianship and have cared for the dependent child in foster care for at least 12 months. To receive Kin-GAP, the court must terminate dependency, meaning many of the requirements imposed in foster care are not imposed once families enter Kin-GAP. No services are to be provided to Kin-GAP participants.
Missouri's Grandparents as Foster Parents program provides assistance to grandparents and other relatives age 50 years or older, who are legal guardians or have legal custody of the child. The caretakers receive 30 hours of foster care training, but can forgo the formal foster care licensing procedures or home study.(12) The Grandparents program does not require that children be from TANF-eligible households, as is required for relatives to be eligible for foster care benefits.
Florida's Relative Caregiver Program offers assistance to relatives who are taking care of children under court supervision or who have temporary legal custody. Relatives are not required to be licensed but have to undergo a background check and a home study to ensure the home is safe.
Benefit Levels
Exhibit 2.6 lists the average benefits in each of the program categories, assuming two children in the household. The alternative program rates are set at or close to the foster care rate and are always greater than the payments offered to TANF non-parental caregivers. The fourth column lists the TANF rate for two children and one adult, for non-parental caregivers who choose to be included on the grant (and are willing to meet the work requirements and receive time-limited assistance).
| State | Foster Care Payment for Two Childrena/ | Alternative Program Payment for Two Childrena/ | TANF Payment for Two Children, No Adult | TANF Payment for Two Children, One Adult |
|---|---|---|---|---|
| California | 893 | 893b/ | 565c/ | 699c/ |
| Florida | 769 | 526 | 241 | 303 |
| Missouri | 515 | 515 | 234 | 292 |
| a/ Payments vary depending on the age of the child. The payment presented in this exhibit represents the 1999 payment, averaging the payment for a child age 2, 9, and 16 and multiplying it by two.
b/ Rates will be equal to foster care rates (which could change in 2000 when implemented) except without a clothing allowance or specialized care increments. c/ Maximum payment for exempt caregivers in Region 1, which includes Alameda County, July 1999. |
||||
The payments for all programs increase for additional children in the household. However, the incremental change in foster care payments is a fixed payment based on the child's age; the incremental change in TANF payments diminishes for additional children. Therefore, the difference between foster care and TANF payments increases as household size increases.
Program Funding
The TANF child-only cases may be funded with federal block grant dollars, to the extent that they meet federal requirements. The Foster Care Program is funded with Title IV-E (of the Social Security Act) dollars and state dollars. States share in the foster care costs for IV-E children and pay fully for foster care children who are not IV-E eligible.
The alternative programs rely on different funding schemes. California's Kin-GAP program will use TANF funding to pay up to the TANF base rate and the state and counties will share in the costs over and above this base rate. Florida's Relative Caregiver program is funded with TANF dollars, while Missouri's Grandparents program is funded primarily with state maintenance-of-effort (MOE) dollars (expenditures states must make from their own funds as a condition of receiving the TANF block grant) and some TANF dollars.
Participation
Consistent participation data for the different federal and state programs are difficult to obtain, with data covering different periods and different units (number of children or number of families). For example, the foster care estimates in Exhibit 2.7 represent the number of children in foster care, while the TANF estimates represent the number of cases with non-parental caregivers. In addition, the foster care estimates represent caregivers that are relatives and non-relatives. Still, the participation estimates suggest that in Florida and Missouri, non-parental caregivers are more likely to receive assistance from TANF rather than foster care. In California, the data are inconclusive. As will be seen in Chapter 3, California non-parental caregivers make up a smaller portion of the TANF caseload than in the other states.
| State | Title IV-E Foster Carea/ | Foster Careb/ | State Alternative Programs | TANF Non-Parental Caregiverse/ |
|---|---|---|---|---|
| California | 61,805 | 110,544 | n/a | 38,417 |
| Florida | 6,147 | 23,379 | 3,965c/ | 28,889 |
| Missouri | 4,826 | n/a | 275d/ | 8,015 |
| a/ Green Book. Average monthly number of children, 1996.
b/ The Adoption and Foster Care Analysis and Reporting System (AFCARS). ACF. Represents number of children as of September 1997. These figures are substantially higher than the Green Book estimates because they include the children who are not eligible for federal funding (primarily because they were not from AFDC-eligible homes), but are eligible for state foster care. c/ Total children as of September 1999. d/ Total cases as of September 1999. e/ Estimates are average monthly estimates for fiscal year 1997. |
||||
Not surprisingly, the state alternative programs have fewer participants owing in part to the newness of the programs. The levels will undoubtedly increase as the states conduct more outreach and relative caregivers learn of the programs; in Missouri, recent changes broadening eligibility may increase participation.(13)
Note that participants in Florida's Relative Caregiver Program are included in TANF caseload estimates, while participants in Missouri's Grandparents as Foster Parents are not because of the different funding sources discussed above. As of the time of this report, California had not decided how they would classify Kin-GAP participants.
Interaction Between TANF and Child Welfare Agency
All staff contacted for interviews agreed that they had little direct interaction with child welfare services. This is beginning to change somewhat as more individuals participate in alternative programs. In all states, child welfare services are administered in separate offices within the welfare department. In California, child welfare is administered by the DSS Children and Family Services Division and in Florida, the DCF Family Safety Program office oversees child welfare programs. In Missouri, Children's Services handles child welfare functions.
Interaction with Child Protection Service (CPS)
Alameda County eligibility staff interact with CPS in only rare situations, perhaps when CPS is trying to contact a client or CalWORKs staff are asked to provide information for a court proceeding.
Duval County staff interviewed also said they had very little interaction with CPS. By law they must report cases of abuse to CPS or suspicions of abuse and if a child has been removed from a case they may talk to child welfare to find out when the child is expected to return. However, this is primarily for eligibility purposes only. When CPS is investigating a case in Duval, they will not call and inform TANF. As one TANF worker noted, "There's no reason for them to do so."
In Florida, CPS is also involved after a case has reached the time limit and a decision is made not to offer the parent a hardship exemption. In this situation, CPS will investigate the case to determine if the child is at risk of entering foster care. If so, then benefits will continue and a protective payee will be assigned. In Duval County, CPS has not issued a protective payee for any cases they have reviewed.
Missouri noted that beyond an initial referral from Children's Services, they do not have contact with the agency; both agencies may be working with the same family (handling different responsibilities) but they do not collaborate.
Interaction with Foster Care
If the child(ren) enters foster care, foster care staff will notify TANF so that they can close the TANF case. In Duval, staff noted that they never advised clients to seek services or assistance from the child welfare agency; they know very little about the program. In Alameda, one staff mentioned that they would not make a referral to foster care because the state's goal is not to get more cases into the foster care system. However, another staff said that if a non-relative caregiver wanted to apply for TANF, he would direct the caregiver to foster care (since non-relatives are not eligible to receive child-only benefits in California). Interaction is often limited to determining Medicaid eligibility of foster care cases.
Interaction with State Alternative Programs
In Florida and Missouri, TANF eligibility workers are beginning to have more interactions with child welfare because of the implementation of the Relative Caregiver Program and the Grandparents as Foster Parent Program.
In Duval, Family Safety identifies individuals who are eligible for the Relative Caregiver Program and after conducting the home study, will refer the cases to the TANF office. After getting referrals to this new program, TANF staff may call Family Safety for additional information or documentation. If clients come in to apply for TANF benefits for relative children, the eligibility workers may tell them about the program or clients may see the posters exhibited in the welfare offices that describe the program and ask for information. Interested clients are told to contact Family Safety for a home study. Clients who have had any interaction with Family Safety in the recent past typically learn about this program from them.
In Missouri, clients who apply for TANF are referred to children's services in order to participate. Foster care provides training, but eligibility staff handles all eligibility functions.
Affect of Increasing Child-Only Caseloads on Workload
In Duval, the proportion of child-only cases to the TANF caseload doubled from 34 percent in July 1997 to 68 percent in May 1999. Originally, the staff handled child-only cases or regular cases. Staff who had child-only caseloads had a caseload of 175 cases, while staff who had regular cases had 150 cases, recognizing that regular cases required more case management time. Recently, the county decided to combine the caseloads. Eligibility workers now have a mixed caseload of 150 child-only and regular cases. This was to alleviate the workload of those handling a regular caseload that was taking an increasing amount of time. As one worker mentioned: "We are down to the hard core cases [on the regular caseload]. They get a job, lose a job, [and] get a job." Staff have to monitor the work requirements, sanction noncompliant cases, ensure that the client is receiving child care and transportation, and track the time left on the clock, as well as conduct redeterminations. In contrast, the child-only cases typically only require staff to conduct redeterminations.
Jackson eligibility workers are specialized. Case workers who handle child-only cases also handle Medicaid-only cases. Their total caseload is about 225 cases, compared to an average caseload of 110 for self-sufficiency workers, who handle regular cases. They are anticipating an increase in the child-only caseload and in at least one office, there has been some discussion of bringing in an additional case worker to handle the increased child-only caseload.
1. Noncompliant clients attend a counseling session and have 10 days to comply or show good cause before the sanction is imposed.
2. For the first sanction, if the noncompliant individual does not meet a food stamp exemption, the food stamp case is closed for one month or until the individual complies, whichever occurs later; the other members of the household may reapply after one month. For the second and third sanctions, the household is ineligible for three months and six months, respectively; other members of the household can apply for food stamps after this period if the head of household is still noncompliant.
3. J. Ferber and R. Storch (1998). Full-Family Sanctions: Not Worth the Risk. Gateway Legal Services. St. Louis, Missouri.
4. J. Riccio, S. Friedlander, and D. Freedman with M. Farrell, V. Fellerath, S. Fox and D. Lehman (1994). GAIN: Benefits, Costs, and Three-Year Impacts of a Welfare-to-Work Program, MDRC, New York, NY. According to this study, only 2 percent of AFDC single-parent cases in Alameda were referred for sanction and no one was sanctioned. This is the lowest referral rate of all counties studied, which included Butte (10 percent referred), Los Angeles (34 percent), Riverside (34 percent), San Diego (22 percent), and Tulare (12 percent). A referral came from a GAIN worker, who monitored GAIN participation, and referred noncompliant cases to the eligibility workers for sanctioning.
5. CalWORKs implementation reports posted on Alameda's Department of Welfare-to-Work web site: www.co.alameda.ca.us/assistance/calworks.
6. California officials indicated that these benefits would be paid for with state funds.
7. Specifically, adults may receive an extension if they are:
- 60 years of age or older;
- A caretaker for an ill or incapacitated person, a dependent child of the court, or a child at risk of placement in foster care and are exempt from the welfare-to-work participation requirement;
- Disabled;
- Unable to maintain employment or participate based on the county's assessment and finding that the individual has a history of participation and full cooperation in welfare-to-work activities; or
- Unaided (the individual is out of the assistance unit for reasons other than exceeding the time limit).
8. 1998 "Green Book"; Washington, DC.
9. California Welfare and Institutions Code, Section 11361.
10. In California, food stamp redeterminations are every 12 months (the same as TANF redeterminations).
11. Boots, S. and R. Geen (1999). Family Care or Foster Care? How State Policies Affect Kinship Caregivers. The Urban Institute. Washington, DC. This is a federal requirement; other states may provide state foster care benefits for relatives even though the children are not from needy families.
12. Grandparents or relatives who refuse to participate in foster parent training may receive cash benefits but not respite care, a clothing allowance, and transportation services available to those who complete the training. In addition, for this group, the TANF five-year time limit applies and participation in a mandatory work training component is required.
13. Previously, this program was reserved for grandparents age 55 and over. In August 1999, eligibility was broadened to include relatives other than grandparents and to include grandparents and relatives age 50 and over.
Characteristics of the TANF Child-Only Caseload in Three Counties
Introduction
The characteristics of child-only cases vary across states, counties, and type of caregiver (for example, parent versus non-parent). Demographics and policy choices in each state and county affect the characteristics and composition of the child-only caseload. This chapter focuses on the child-only caseload in California, Florida, and Missouri, and presents more detailed information for Alameda, Duval, and Jackson counties.
Section II begins with a discussion of the composition of child-only cases at the state level and continues by outlining the composition of child-only cases at the county-level. Section III explores demographic characteristics of the caregiver and focal child including race, age, household size, marital status, and time on welfare. Section IV follows with a description of the number of caregivers of focal children and their transitions into child-only status, exploring transitions into parental and non-parental cases separately and examining reasons why the caregiver is not receiving assistance. The discussion of non-parental cases outlines the reasons why the child came to live with the caregiver as well as the caregiver's relationship to the child. Section V discusses the characteristics that are particular to caregivers, including earnings and income. Section VI briefly discusses characteristics of absent parents.
Comparisons are made across counties and between different types of child-only cases (i.e., between parental and non-parental caregivers). Whenever possible, characteristics at the state and county level are compared as well as characteristics of each county's caseload across time.(1) To the extent possible, data were analyzed to allow for comparisons to be made between groups within the parental caregiver caseload (for example, SSI, alien, and sanctioned cases). However, sample size issues only permit this analysis to be done reliably in Alameda County.
Data sources for all exhibits in the chapter are the case file reviews unless otherwise noted. Additional analysis of case file data is included in Appendix B. State and county-level administrative data analysis is presented in Appendix C.
Composition of Child-Only Cases at the State and County Level
A quick glance at the composition of child-only cases at the state-level (Exhibit 3.1) may help to put the findings at the county-level into context. Data from HHS' quality control (QC) sample reveal that there are notable differences between the make-up of the states' child-only caseloads and those of the counties.
As Exhibit 3.1 shows, caseload compositions in Florida and Missouri look moderately similar while that of California is quite different. The highest proportion of the child-only caseload in California (46 percent) is comprised of non-qualified alien cases, whereas non-parental caregiver cases make up the largest portion of child-only cases in both Florida (58 percent) and Missouri (46 percent). The proportion of non-qualified aliens in the Florida caseload is 5 percent; in Missouri it is less than 1 percent. SSI cases comprise less than one-quarter of cases in all three states. In Florida and Missouri, a notable proportion of cases are "other parental"; 15 percent in Florida and 24 percent in Missouri (the reason is unknown according to the QC data).
Exhibit 3.1
Composition of the Child-Only Caseload in Three States
Source: AFDC QC Data, October 1996 - June 1997. Department of Health and Human Services, Administration for Children and Families, Office of Planning, Research, and Evaluation.
The number of cases that fall into each category across the three states is outlined in Exhibit 3.2.
| Type of Case | California | Florida | Missouri |
|---|---|---|---|
| Total AFDC/TANF families | 832,009 | 179,170 | 73,635 |
| Child-only families | 190,989 | 50,556 | 17,678 |
| Non-parental caregiver cases | 38,417 | 28,889 | 8,015 |
| Child-only units headed by parents | 152,572 | 21,667 | 9,663 |
| SSI child-only cases | 38,296 | 8,818 | 4,068 |
| Non-qualified alien child-only cases | 88,034 | 2,773 | 68 |
| Sanctioned child-only cases | 13,121 | 2,275 | 1,314 |
| Other/unknown parental cases | 13,121 | 7,800 | 4,213 |
| Source: AFDC QC Data, October 1996 - June 1997. Department of Health and Human Services, Administration for Children and Families, Office of Planning, Research, and Evaluation. | |||
B. County Caseload Composition
Exhibit 3.3 presents the composition of child-only cases in the three counties from case file data. The comparison of Exhibits 3.1 and 3.3 suggests that the composition of the child-only caseload in each county is not reflective of its respective state. It is important to note that the state caseload figures reflect the monthly caseload in fiscal year 1997 while the county data reflects the caseload in May 1999. Also, state data are less complete, in some respects. Namely, in Florida and Missouri, there was a greater proportion of "other parental" cases (the reason the parent was not in the assistance unit could not be determined from the data). In conducting the case file review, The Lewin Group had access to more detailed information located in case files, supplemented by information in the administrative data systems.
Non-parental caregiver cases, as well as SSI cases, comprise a greater percentage of the caseload in each county, compared to the states. In Alameda, sanctioned cases comprise 25 percent of the caseload while in the state, only 7 percent of cases are child-only due to sanction. In Jackson, no cases were coded as child-only due to sanction status while 7 percent of the child-only caseload in the state are in sanction status. As discussed in Chapter 2, the sanction policy was revised and sanctioned adults receive reduced benefits but continue to be included in the assistance unit.
While the county caseloads differ from those of the states, comparing the three counties to one another illustrates that in Duval and Jackson Counties the composition of child-only cases is quite similar, while the composition of Alameda County's caseload is very different. This is largely due to demographic differences of the three counties and state policies.(2)
Exhibit 3.3
Composition of the Child-Only Caseload in Three Counties
Source: Lewin Case File Review, 1999.
Non-parental caregiver cases comprise almost two-thirds of child-only cases in Duval and Jackson, according to the case file review. SSI cases make up the next largest portion of the caseload in these two counties, encompassing 27 percent of the caseload in Duval and 28 percent in Jackson. Six percent of Duval County's caseload is comprised of sanctioned cases and only 1 percent contains non-qualified aliens. Jackson County's caseload, on the other hand, includes no sanctioned cases but contains a greater proportion, 6 percent, of alien cases. The remaining portion of cases, 3 percent and 2 percent in Duval and Jackson, respectively, is made up of other parental cases (a small number of minor parents on aid, and cases which are child-only for unknown reasons).
Alameda County's caseload, unlike that in Duval County and Jackson County, is far more diverse; 28 percent of the cases are non-parental caregiver cases, 23 percent are SSI cases, 25 percent are sanctioned cases, and 16 percent are non-qualified alien cases. The remaining 8 percent fall under other categories or could not be placed in one of the aforementioned categories based on the information present in the case files.
Demographics / Characteristics of Child-Only Cases
Non-parental cases are in many ways different from parental cases. The composition of the households varies while caregivers differ with respect to their age, employment, marital status, and income. The children who reside with these two types of caregivers also differ from one another in notable ways.
A. Household Composition (of Parental and Non-parental Caregiver Cases)
The typical child-only case has two children in the assistance unit, although there are fewer children, on average, in non-parental caregiver assistance units than there are in parental caregiver assistance units (Exhibit 3.4). The average number of recipient children in non-parental caregiver versus parental arrangements, respectively, is 1.6 and 2.0 in Alameda; 2.2 and 2.4 in Duval; and 1.8 and 1.9 in Jackson. State and county administrative data in Florida and Missouri reveal that the number of children per child-only assistance unit has remained static over time.(3)
| Alameda County | Duval County | Jackson County | ||||
|---|---|---|---|---|---|---|
| Parent | Non-Parent | Parent | Non-Parent | Parent | Non-Parent | |
| Number of recipient children (%) | ||||||
| One | 41.1 | 59.0 | 27.3 | 38.2 | 39.5 | 57.2 |
| Two | 34.4 | 26.9 | 34.1 | 28.0 | 33.7 | 23.0 |
| Three | 16.7 | 10.3 | 22.7 | 17.8 | 20.9 | 11.2 |
| Four | 3.1 | 3.8 | 12.5 | 10.8 | 4.7 | 5.3 |
| Five or more | 4.7 | 0.0 | 3.4 | 5.1 | 1.2 | 3.3 |
| Average number of children in assistance unit | 2.0 | 1.6 | 2.4 | 2.2 | 1.9 | 1.8 |
| Average number of children in household | 2.2 | 1.7 | 2.7 | 2.6 | NA | NA |
| Average number of adults in household | 1.4 | 1.6 | 1.4 | 1.5 | NA | NA |
| Sample size | 194 | 79 | 90 | 159 | 86 | 153 |
In Duval and Alameda counties, parental cases tend to have more children and fewer adults in the household, on average, than non-parental caregiver cases. Parental cases average 2.2 children and 1.4 adults per household in Alameda, and 2.7 children and 1.4 adults per household in Duval. Non-parental caregivers house 1.7 children and 1.6 adults in Alameda and 2.6 children and 1.5 adults in Duval, on average; households in Duval have slightly fewer adults than in Alameda but are larger overall.
The number of children in the household may differ from the number of children in the assistance unit for a variety of reasons including: 1) some children in the household may be receiving SSI and, thus, are likely ineligible to receive TANF; 2) some children in alien households may not be qualified aliens; 3) the children of the non-parental caregiver may be living in the household and ineligible for TANF due to their parent's income; and 4) the number of children in the household reflects information reported on the application, whereas the number of children in the assistance unit refers to the May 1999 case. Thus, the household composition may have changed from the time of the application to the date of the review.
As illustrated in Exhibit 3.4 and mentioned above, cases reviewed in Duval county had a significantly larger number of children in both the household and the assistance unit than did the other two counties. In Duval, 15.9 percent of all child-only cases had four or more recipient children while 6.6 percent and 7.6 percent of cases in Alameda and Jackson, respectively, had four or more children in the assistance unit.
Nearly all of the focal children share the same ethnic background as their caregiver, including non-parental caregiver cases. Therefore, any reference to a caregiver's race is applicable to that of the focal child as well. The racial make-up of the child-only cases reviewed in each county is outlined in Exhibit 3.5.
| Alameda County | Duval County | Jackson County | ||||
|---|---|---|---|---|---|---|
| Parent | Non-Parent | Parent | Non-Parent | Parent | Non-Parent | |
| Race/ethnicity of caregiver (%) | ||||||
| White | 9.3 | 15.2 | 26.7 | 22.0 | 15.1 | 22.9 |
| Black | 48.5 | 69.6 | 72.2 | 76.1 | 61.6 | 72.5 |
| Hispanic | 29.9 | 11.4 | 0.0 | 1.9 | 19.8 | 2.0 |
| Asian | 10.8 | 3.8 | 0.0 | 0.0 | 1.2 | 0.7 |
| Other / Unknown | 1.5 | 0.0 | 1.1 | 0.0 | 2.3 | 2.0 |
| Race/ethnicity of focal child (%) | ||||||
| White | 9.3 | 13.9 | 24.4 | 20.8 | 17.4 | 21.6 |
| Black | 49.0 | 69.6 | 73.3 | 76.7 | 59.3 | 73.9 |
| Hispanic | 28.9 | 11.4 | 0.0 | 2.5 | 18.6 | 2.6 |
| Asian | 10.8 | 3.8 | 0.0 | 0.0 | 2.3 | 0.7 |
| Other / Unknown | 2.1 | 1.3 | 2.2 | 0.0 | 2.3 | 1.3 |
| Sample size | 194 | 79 | 90 | 159 | 86 | 153 |
The ethnic composition of child-only cases, while it differs between state and county, largely reflects the type of cases of the TANF caseload as a whole in each county (see Appendix Exhibit C.2). Thus, where the county's entire caseload (including cases with an adult recipient) is disproportionately black as a whole, the same is true for the child-only portion. In addition, ethnicity of child-only cases has remained fairly static over time in Florida and Duval County and Missouri and Jackson County.
The case file review data permit the comparison of race by type of caregiver in each county. Analysis reveals that the caregiver's race differs in Alameda and Jackson depending on whether the individual is a parental or a non-parental caregiver (these two counties have a considerable proportion of Hispanics in the caseload). Both Hispanic and Asian caregivers in the child-only caseloads in Alameda and Jackson are more likely to be parental caregivers than non-parental caregivers. A greater proportion of the non-parental cases in these two counties are comprised of blacks and whites.
Age is outlined in several exhibits in this report. Average ages of child-only cases reviewed are displayed for caregivers in Exhibit 3.6, for focal child in Exhibit 3.7, and for caregivers and focal children on Alameda parental cases by type of case in Appendix Exhibit B.1. Age statistics concerning regular and child-only cases calculated from state and county administrative data are located in the appendix. (Appendix Exhibits C.1 and C.2 present caregiver ages, and Appendix Exhibits C.3 and C.4 present average ages of the youngest child in the assistance unit.)
Unlike race and ethnicity, the age of the caregiver in the child-only population is not reflective of the total TANF population in each county. Caregivers (payees) on child-only cases are older, on average, than payees in regular TANF cases. This is primarily due to the fact that a significant portion of the caregivers on child-only cases are grandparents or great-grandparents. In Duval County, the average age of a regular payee is 31 years of age, compared to 45 years of age for a child-only payee. In Jackson County, the average age of a payee in a regular TANF case is 29 years of age while in child-only cases it is 44 years of age, a difference of 16 years (see Appendix Exhibit C.1).
Within the child-only caseload, non-parental caregivers are substantially older than parental caregivers. The average age of the caregiver in parental cases (Exhibit 3.6) ranges from 33 to 35 years of age while the average age of the non-parental caregivers ranges from 50 to 54 years of age. Sixty-one percent of non-parental caregivers in Alameda, 63 percent in Duval, and 56 percent in Jackson are 50 years of age or older (compared to 5, 2 and 8 percent of parental caregivers, respectively). In fact, a surprising proportion of non-parental caregivers are over age 60, and some are over 70 years of age. This is especially evident in California where nearly one-quarter of non-parental caregivers are between 60 and 69 years of age while 9 percent are 70 and above; 8 and 6 percent of non-parental caregivers in Duval and Jackson, respectively, are age 70 or above.
Within the parental caregiver caseload, SSI parents in Alameda are older than sanctioned and non-qualified alien parents and have older children. As noted in Appendix Exhibit B.1, the average age of SSI parents in Alameda is 39 years of age. Parental caregivers that do not receive aid due to alien and sanction status are noticeably younger than the SSI parents in the county. Alien parents are 9 years younger than SSI parents while those in sanction status are 7 years younger than the SSI parents in Alameda.
| Alameda County | Duval County | Jackson County | ||||
|---|---|---|---|---|---|---|
| Age group | Parent | Non-Parent | Parent | Non-Parent | Parent | Non-Parent |
| Age of the caregiver (%): | ||||||
| Under 20 | 3.7 | 1.3 | 8.9 | 0.6 | 7.1 | 2.0 |
| 20 - 29 | 36.1 | 5.2 | 30.0 | 1.3 | 27.4 | 4.7 |
| 30 - 39 | 34.6 | 3.9 | 37.8 | 10.8 | 34.5 | 14.1 |
| 40 - 49 | 20.4 | 28.6 | 21.1 | 24.2 | 22.6 | 22.8 |
| 50 - 59 | 3.7 | 27.3 | 2.2 | 32.5 | 6.0 | 34.9 |
| 60 - 69 | 1.6 | 24.7 | 0.0 | 22.3 | 1.2 | 15.4 |
| 70 and over | 0.0 | 9.1 | 0.0 | 8.3 | 1.2a/ | 6.0 |
| Average age (years) | 33.6 | 53.8 | 32.5 | 53.6 | 35.4 | 50.1 |
| Median age (years) | 32.2 | 55.7 | 32.7 | 53.6 | 36.9 | 52.1 |
| Sample size | 194 | 79 | 90 | 159 | 86 | 153 |
| a/ Most of the elderly parental caregivers are male. The remaining near-elderly caregivers have older (teenaged) focal children. | ||||||
In Duval, the age of the caregiver (defined as the payee on the case) has declined over time. As exhibited in Appendix Exhibit C.1, the proportion of child-only caregivers under the age of 20 has decreased dramatically over time. In 1997, 24 percent of child-only payees were under the age of 20 (most of whom were age 18 and under); in May 1999, 7 percent of payees were under the age of 20. It is assumed that this shift is a result of a policy change in the state which mandated that a minor parent could no longer be a payee but had to be living at home or in an adult-supervised setting - the adult receives the benefit check. This large decrease in the number of payees under the age of 20 drove the average age of the caregiver from 34 in 1997 to 45 in 1999. The average age of 45 in Duval is equivalent to the average age of a child-only payee in Jackson in both 1994 and 1999.
As with the age of the caregiver, the age of the focal child in the child-only population is not reflective of the total TANF population in Duval and Jackson counties. Children in child-only cases, as compared to those in regular TANF cases, are older on average. The age of children on regular TANF versus child-only cases is outlined in Appendix Exhibits C.3 and C.4 and reveals that in Duval and Jackson counties, about one-third of the youngest children on regular TANF cases were over age six compared to two-thirds of youngest children in child-only cases.
Within the child-only caseload, the age of the child is related to the type of caregiver (Exhibit 3.7). In Alameda and Duval, the focal children residing with non-parental caregivers are older, on average, than the focal children residing with a parent. In all three sites, the median age of the focal child is greater for those children residing with a non-parental caregiver.
The age of the youngest child in the Duval child-only caseload has increased slightly over time, according to administrative data. In July 1997, the youngest child in a child-only assistance unit averaged 7.8 years of age. This figure has since increased to 8.3 years of age in May 1999. This is also evident in the age distribution (Appendix Exhibit C.3). A larger portion of children fell into the two and under category in 1997 (20 versus 17 percent), and a smaller portion of the 1997 caseload fell into the 6 and over range (58 versus 64 percent).
| Alameda County | Duval County | Jackson County | ||||
|---|---|---|---|---|---|---|
| Age group | Parent | Non-Parent | Parent | Non-Parent | Parent | Non-Parent |
| Age of the focal child (%): | ||||||
| 2 and under | 22.7 | 5.1 | 15.6 | 12.6 | 17.4 | 7.8 |
| 3 to 5 | 13.4 | 12.7 | 13.3 | 10.7 | 19.8 | 12.4 |
| 6 to 8 | 25.8 | 17.7 | 23.3 | 17.6 | 15.1 | 17.0 |
| 9 to 11 | 14.9 | 20.3 | 20.0 | 23.9 | 12.8 | 20.9 |
| 12 to 15 | 12.4 | 25.3 | 17.8 | 25.2 | 18.6 | 28.8 |
| 16 to 19 | 10.8 | 19.0 | 10.0 | 10.1 | 16.3 | 13.1 |
| Average age (years) | 8.1 | 10.8 | 8.9 | 9.9 | 9.1 | 8.6 |
| Median age (years) | 7.8 | 11.5 | 8.5 | 10.2 | 8.2 | 10.7 |
| Sample size | 194 | 79 | 90 | 159 | 86 | 153 |
Marital status is another characteristic that varies appreciably between parental and non-parental caregiver cases; however, the rates vary little across counties. As noted in Exhibit 3.8, while most caregivers are not currently married, non-parental caregivers are more likely to be married than parental caregivers. In Alameda, around 13 percent of parental caregivers (whose marital status is known) are married while over 37 percent of non-parental caregivers in the sample are married. Similarly, in Duval, only 6 percent of parents are noted as being currently married, compared with 32 percent of non-parental caregivers.(4) The percent of cases where the caregiver is divorced, widowed, or separated is also higher among the non-parental caregiver cases.
| Alameda County | Duval County | Jackson County | ||||
|---|---|---|---|---|---|---|
| Marital Status (% of known) | Parent | Non-Parent | Parent | Non-Parent | Parent | Non-Parent |
| Married, living with spouse | 12.8 | 37.1 | 5.6 | 32.1 | NA | NA |
| Single | 62.2 | 22.6 | 58.9 | 17.0 | NA | NA |
| Divorced, widowed, or separated | 25.0 | 40.3 | 35.6 | 50.9 | NA | NA |
| Sample size | 194 | 79 | 90 | 159 | 86 | 153 |
The administrative data available for Florida and Duval County indicate that a larger percentage of child-only caregivers (including parental and non-parental caregivers) were married in May 1999, as compared to July 1997 (Appendix Exhibits C.1and C.2). In Duval, 12 percent of child-only caregivers were married in 1997 while 22 percent were married in 1999. Similarly, throughout the entire state, 11 percent of child-only caregivers were married in 1997 while 19 percent were married in 1999. Marital status has changed minimally for regular TANF caregivers in Florida and Duval County.
E. Length of Time on Welfare and in Child-Only Status
The average length of time on TANF, for the focal child's current case, is depicted in Exhibit 3.9. This exhibit reveals that children in parental cases have been receiving aid with that caregiver for 36 months in Alameda, 40 months in Duval, and 45 months in Jackson, on average. Children cared for by non-parental caregivers in Alameda have received aid the longest on their child-only case, averaging 55 months. Non-parental caregiver children in Duval are only slightly behind receiving 50 months of TANF; children in non-parental caregiver units in Jackson have received an average of 36 months of child-only TANF with their current caregiver.
| Type of Case | Alameda | Duval | Jackson |
|---|---|---|---|
| Parental caregiver cases | 35.8 | 39.6 | 45.1 |
| Non-parental caregiver cases | 55.0 | 49.9 | 36.1 |
The length of time on TANF is related to the age of the focal child. Thus, it is evident that children residing with non-parental caregivers in Alameda and Duval have older children and who received child-only TANF on the current case longer than those children residing with parents in these counties. In Jackson, however, children residing with parents have older children, on average, and have been receiving child-only TANF for a longer period of time than their counterparts residing with non-parental caregivers.
Transitions into Child-Only Status
Children receive assistance on child-only cases for a variety of reasons. Some have come to reside with the current caregiver (parent or non-parent) after having received assistance on a previous case with a different caregiver. Some children currently reside with parents while others reside with non-parental caregivers. This section explores the number and paths of different caregivers. In addition, the various factors which led to each type of case being child-only are discussed for each type of caregiver.
A. Number of Different Caregivers
In a majority of cases, focal children have resided with one caregiver while receiving TANF. Yet, a substantial percentage of children living with a non-parental caregiver have been cared for by multiple caregivers. The number of caregivers is illustrated in Exhibit 3.10.
Not surprisingly, children who are currently residing with a non-parental caregiver are more likely to have had multiple caregivers than those children living with a parent. In all three counties, over 95 percent of those children living with a parent have received assistance on that case only. However, as a proportion of those children residing with non-parental caregivers, 43 percent of children in Alameda had multiple caregivers while 39 of children in Duval and 35 percent of children in Jackson had multiple caregivers. A handful of children had three caregivers or more. It is assumed that some children have resided with a greater number of caregivers than indicated in Exhibit 3.10 because they had resided with caregivers who did not receive AFDC/TANF assistance and/or because earlier case files with additional caregivers have been archived or destroyed. The caregivers captured in this study (and in Exhibit 3.10) include only those that received AFDC/TANF with the focal child in the assistance unit.
| Alameda County | Duval County | Jackson Countya/ | ||||
|---|---|---|---|---|---|---|
| Number of Caregivers (%) | Parent | Non-Parent | Parent | Non-Parent | Parent | Non-Parent |
| One | 99.0 | 57.0 | 95.5 | 61.5 | 95.2 | 65.2 |
| Two | 1.0 | 36.7 | 4.5 | 32.3 | 4.8 | 34.8 |
| Three | 0.0 | 6.3 | 0.0 | 5.6 | 0.0 | 0.0 |
| Four | 0.0 | 0.0 | 0.0 | 0.6 | 0.0 | 0.0 |
| Sample size | 194 | 79 | 90 | 159 | 86 | 153 |
| a/ Case file information was reviewed for the past two caregivers only in Jackson County. | ||||||
The sequence of the two most recent caregivers of the focal child are outlined in Exhibit 3.11. As depicted, the sequence of caregivers varies by county. A larger portion of children in Alameda (70 percent) have received aid with one parent only, compared to Duval (34 percent) and Jackson (33 percent).
Exhibit 3.11
Sequence of Past Two Caregivers, by County
(Percent of Child-Only Caseload)
On the other hand, a greater proportion of children in Duval and Jackson have received aid with one non-parental caregiver and have also moved from a parent to a non-parent more than children in Alameda. This largely reflects the greater proportion of parental cases in Alameda. Nearly all of the cases that went from a parental caregiver to a non-parental caregiver were regular TANF cases under the parental caregiver. Those that went from one non-parent to another were generally child-only in both instances.
The types of parental cases vary from county to county. According to the case file review, 71 percent of all child-only cases in Alameda County have a parental caregiver while only 36 percent of child-only cases in Duval and Jackson counties have a parental caregiver. These cases are child-only for a variety of reasons.
Exhibit 3.12 outlines the various paths that parental caregivers have taken on their route to becoming a child-only payee. As illustrated, the type and frequency of each path taken varies across the three counties. Approximately 22 percent of Alameda's and nearly 17 percent of Jackson's parental caseloads are comprised of non-qualified alien cases. In addition, a substantial portion of cases in each of the counties is currently made up of SSI cases (approximately 32 percent in Alameda, 73 percent in Duval, and 82 percent in Jackson). Over 35 percent of cases in Alameda are sanctioned cases while 18 percent in Duval are in sanction status.(5) The large deviation in the proportion of the caseload in sanction status across counties is a direct result of state policy (as noted in Chapter 2).
From the perspective of the focal child, however, not all children who are receiving aid on an SSI or sanctioned child-only case began receiving aid on such a case. Despite the fact that not all historical TANF receipt information could be collected through the case files due to archiving and destruction of older records, the case files did reveal that, from the point of view of the focal child, approximately 53 percent, 55 percent, and 22 percent of parental cases in Alameda, Duval, and Jackson, respectively, were once regular TANF cases. Specifically, 9 percent of cases in Alameda went from regular TANF to SSI while 36 percent went from regular TANF into sanction status. In Duval, 34 percent of parental cases began on regular TANF before becoming SSI cases while 17 were considered regular TANF before the imposition of a sanction. Slightly over 17 percent of Jackson's cases went from regular TANF to SSI.
Lastly, cases are occasionally in child-only status for specialized reasons. Around 3 percent of all parent cases across the counties (and 8 percent in Duval County) are considered child-only because the focal child's parent is a minor. Thus, while the parent is in the assistance unit, there is technically no adult on the case, making it a child-only case. About 8 percent of cases in Alameda are child-only for reasons that are unknown, as the files did not always provide complete information about the case's status.
Two cases reviewed in Alameda County are child-only due to the incarceration of the parent. While the child would usually be cared for by a non-parental caregiver while the parent was in prison, a special program in this county allows infants to be cared for by the parent while they remain incarcerated.
Exhibit 3.12
Sequence of Case Type on Parental Caregiver Cases, by County
In some instances, parents (and possibly even non-parental caregivers) receive their TANF grants through a protective payee. This occurs more frequently in Duval as a result of Florida's sanction policy. Nevertheless, some parents in other counties do have a protective payee arrangement. Two cases in Alameda and Jackson (one in each county) receive their grants through a protective payee; in Duval, 14 percent of parental cases have a protective payee.
C. Non-Parental Caregiver Cases
Non-parental caregiver cases comprise a majority of the caseload in Jackson and Duval and approximately 28 percent of the child-only caseload in Alameda. The reasons why non-parental caregivers are not in the assistance unit differs substantially from those of parental caregivers. This is largely due to the fact that: 1) non-parental caregivers are less needy and, as a result, are less likely to ever have been on TANF and then been sanctioned; and 2) focal children of non-qualified alien parents are more likely to remain with the parent, as opposed to living with a non-parental caregiver at some point. Thus, non-parental caregivers are not on the grant because they are receiving SSI or have income over the standard of need.(6)
Exhibit 3.13 outlines the past two caregivers of focal children that are currently residing with a non-parental caregiver in each county. A notable portion of non-parental caregiver cases were once regular TANF cases headed by a parent. Over one-third of cases in Alameda, and over one-quarter of cases in Duval and Jackson were regular parent TANF cases that are now child-only with a non-parental caregiver. Between 7 and 9 percent of non-parental cases in each county were child-only with two different non-parental caregivers. One aspect worthy of exploration, and particular to non-parental caregiver cases, is why the child came to live with the current caregiver.
Exhibit 3.13
Path of Focal Children Currently Residing with a Non-parental Caregiver, by County
(percent of current non-parental cases)
1. How Child Came to Reside with Caregiver
The reasons why the child has come to reside with the caregiver vary widely and include desertion, substance abuse, incarceration, child abuse, and neglect, as outlined in the bottom panel of Exhibit 3.14. These reasons are not mutually exclusive and the child often came to reside with the caregiver for a combination of related reasons. Where multiple reasons were apparent, the most specific reason was documented in the file (for example, substance abuse would be noted in a case where a substance abusing parent deserted a child). In instances where the reason why the child came to reside with the caregiver differed for father and mother, the mother's situation was generally documented.
At times, the reason for the child being with the caregiver was well documented, whereas at other times, the reason had to be assumed or inferred based upon the context of the case. The overwhelming reasons that were documented in such instances of ambiguity were desertion and neglect. In addition, it is important to note that some reasons that were documented are subjective and dependent upon the caseworkers' assumptions and perceptions. Thus, the reasons why the child came to reside with caregiver are largely reflective of the quality of information in the case files, which varied from county to county. The percent of cases where the reason child came to reside with the current caregiver is unknown, ranges from 9 percent in Duval County to 25 percent in Jackson County; 13 percent of non-parental cases in Alameda are unknown.
| Non-Parental Caregiver Cases | Alameda | Duval | Jackson |
|---|---|---|---|
| Reason caregiver may not be receiving assistance (%)a/ | |||
| Has income or assets that may make them ineligible | 35.4 | 43.0 | 66.0 |
| Is receiving SSI | 35.4 | 36.1 | 15.7 |
| Sanctioned | 2.5 | 1.3 | 0.0 |
| Opted not to receive aid | 0.0 | 1.9 | 1.3 |
| Unknown | 26.6 | 17.7 | 17.0 |
| Reason child came to reside with caregiver (%) | |||
| Death of parent or caregiver | 10.1 | 3.8 | 3.9 |
| Parent disabled and unable to care for child | 6.3 | 1.3 | 3.3 |
| Parent incarcerated | 8.9 | 9.4 | 12.4 |
| Parent institutionalized | 1.3 | 1.3 | 2.0 |
| Evidence of child abuse | 2.5 | 6.3 | 3.9 |
| Parent has substance abuse problem | 7.6 | 26.4 | 10.5 |
| Environmental neglect (lack of adequate food, clothing, or shelter) | 5.1 | 6.9 | 0.0 |
| Desertion | 40.5 | 25.8 | 34.6 |
| Other court/CPS involvementb/ | 1.3 | 9.4 | 3.3 |
| Other | 3.8 | 0.6 | 1.3 |
| Unknown | 12.7 | 8.8 | 24.8 |
| Sample size | 79 | 159 | 153 |
| a/ The reasons documented are mutually exclusive.
b/ The case files reviewed in each county often provided little information concerning Child Protective Services (CPS) involvement. As discussed in Chapter 2, there appears to be little interaction between CPS and the welfare office. TANF case workers often would not know that CPS was involved in a case. |
|||
As delineated in Exhibit 3.14, a large portion of cases in each county are child-only with a non-parental caregiver due to the parent's desertion of the child (41 percent in Alameda; 26 percent in Duval; and 35 percent in Jackson). Substance abuse of the parent was also a common reason, but may have been one of other various factors leading to the child being placed with a non-parental caregiver. Over one-quarter of the non-parental cases in Duval County resulted from the substance abuse of the focal child's parent(s). The incarceration of a parent accounts for a number of non-parental child-only cases and ranges from 9 percent to 12 percent of cases. Death of the parent or previous care giver accounts for 10 percent of cases in Alameda, while 5 and 7 percent of cases in Alameda and Duval, respectively, resulted from the parent's neglect of the focal child.
In most instances, the child did not move from one non-parental caregiver to another while on TANF. Only 4 percent of all child-only cases across the three counties had more than one non-parental caregiver.
2. Relationship of Non-Parental Caregiver to Child
Two-thirds of non-parental caregivers are grandparents. (These figures are included in Exhibit 3.15.) In addition, it is not uncommon for great-grandparents (included in the "other adult relative" category) to be caregivers. Consequently, most caregivers are over the age of 50, as was discussed in Section III.C.
| Non-Parental Caregiver Cases (%) | Alameda | Duval | Jackson |
|---|---|---|---|
| Grandparent | 63.3 | 66.9 | 60.6 |
| Aunt / Uncle | 26.6 | 18.8 | 20.0 |
| Sibling | 1.3 | 0.0 | 0.6 |
| Other adult relative | 8.9 | 13.8 | 13.5 |
| Non-relative adult | 0.0 | 0.6 | 5.2 |
| Sample size | 79 | 159 | 153 |
It is very rare that the non-parental caregiver of a focal child is a non-relative. Less than one percent of cases in Duval and 5 percent of non-parental cases in Jackson have non-relative caregivers. The remainder of the cases are headed by some other adult relative, generally an aunt or uncle and, in rare instances, an older sibling, cousin, or great aunt.
Earnings and Income
The financial situation of child-only caregivers varies greatly between parental and non-parental caregivers. This is largely due to differences in employment levels, other income, and support from other household members.
Non-parental caregivers, despite the fact that they are older than parental caregivers on average, are more likely to be employed (Exhibit 3.16). The vast majority of parents are not employed. This is not surprising, since:
- adults who are sanctioned are likely to have been sanctioned for not meeting their work requirements;
- SSI recipients have disabilities and may not be able to work; and
- non-qualified aliens may be working, but are not likely to report this work to the welfare agency.
Employment status for the non-parental caregiver is not reported in many cases. Due to the fact that TANF assistance provided to a non-parental caregiver for the child(ren) does not count the non-parental caregivers' income in benefit determination (although the children's income and resources are considered), many caseworkers do not collect employment, income, and resource information on the application.(7) For those cases where information was available or inferred, it was revealed that many non-parental caregivers are working. Younger caregivers are more likely to be working than caregivers over the age 60 (30 percent versus 12 percent of all non-parental caregiver cases in Alameda;(8) 48 percent versus 21 percent in Duval; and 53 percent versus 28 percent in Jackson).
| Alameda County | Duval County | Jackson County | ||||
|---|---|---|---|---|---|---|
| Employment of Caregiver (%) | Parent | Non-Parent | Parent | Non-Parent | Parent | Non-Parent |
| Employed (any hours) | 7.7 | 24.1 | 11.1 | 39.6 | 5.8 | 47.7 |
| Not employed/Out of Labor Forcea/ | 73.2 | 51.9 | 83.3 | 45.9 | 87.2 | 45.1 |
| Unknown | 19.1 | 24.1 | 5.6 | 14.5 | 7.0 | 7.2 |
| Sample size | 194 | 79 | 90 | 159 | 86 | 153 |
| a/ If it was known that the caregiver was receiving SSI and no employment information questions were answered, it was assumed that the caregiver was out of the labor force. | ||||||
While a large proportion of employment information is unknown, it is useful to look at the reported employment rates in order to make comparisons between parental and non-parental caregivers. The figures reveal that the difference in reported employment between parental and non-parental caregivers is striking. This is most evident in Jackson county where 6 percent of parental caregivers reported employment while 48 percent of non-parental caregivers reported employment.
In Alameda, employment status of the parent is also broken out by the reason that the parental case is child-only (Appendix Exhibit B.1). Surprisingly, the group that has the highest, reported employment rate in Alameda consists of non-qualified aliens. Over 16 percent of non-qualified alien parental caregivers in Alameda are working, compared to no SSI cases and 10 percent of sanctioned cases.
B. Household Benefits and Income
Exhibit 3.17 delineates total income (in dollars) from each source as well as the percent of income that the caregiver receives from each source. Generally, non-parental caregivers have higher total incomes, ranging from $918 in Alameda to $1,331 in Jackson, while parents receive less income per month, ranging from $756 per month in Jackson to $846 per month in Duval.
In a high-grant state like California, both parental and non-parental caregivers receive a higher percentage of income from the TANF grant (51 percent and 45 percent for parental and non-parental caregivers in Alameda) than in low-grant states such as Florida and Missouri. In addition, as compared to parental caregivers, non-parental caregivers receive a larger portion of their incomes from sources other than TANF (for example, SSI, earnings, and pensions) in all three counties. The higher percent of total income received from food stamps for parental caregivers makes up some of this difference.
| Alameda County | Duval County | Jackson County | ||||
|---|---|---|---|---|---|---|
| Benefit / Income Source | Parent | Non-Parent | Parent | Non-Parent | Parent | Non-Parent |
| Caregiver receiving (%) | ||||||
| Food stamps (assistance unit) | 88.7 | 35.4 | 93.3 | 37.7 | 80.2 | 34.6 |
| Medicaid | 56.2 | 34.2 | 93.3 | 28.9 | 80.2 | 23.5 |
| SSI | 33.5 | 35.4 | 74.4 | 27.7 | 79.1 | 24.8 |
| Household benefits and income (monthly $) | ||||||
| AFDC/TANF | 431 | 415 | 236 | 264 | 195 | 187 |
| Food stamps | 160 | 46 | 189 | 76 | 118 | 76 |
| Other caregiver income of knowna/ | 300 | 805 | 380 | 774 | 432 | 1,055 |
| Other caregiver income for allb/ | 218 | 408 | 372 | 563 | 407 | 898 |
| Income from other adults in HH | 35 | 49 | 49 | 134 | 26 | 170 |
| Total incomec/ | 844 | 918 | 846 | 1,037 | 746 | 1,331 |
| Percent of total income from source (%) | ||||||
| AFDC/TANF | 51.0 | 45.2 | 27.9 | 25.4 | 26.2 | 14.1 |
| Food stamps | 18.9 | 5.0 | 22.4 | 7.3 | 15.8 | 5.7 |
| Other caregiver income for allc/ | 25.8 | 44.5 | 43.9 | 54.3 | 54.5 | 67.4 |
| Income from other adults in HH | 4.2 | 5.3 | 5.8 | 12.9 | 3.4 | 12.7 |
| Sample size | 194 | 79 | 90 | 159 | 86 | 153 |
| a/ This figure (including earnings, SSI, pension, child support, etc.) calculates average "other income" only of those whose "other income" was known.
b/ This figure (including earnings, SSI, pension, child support, etc.) assumes that "other income" is equal to $0.00 for all caregivers whose other income was unknown. c/ This figure is calculated using other caregiver income for all. |
||||||
Among the parental caregivers in Alameda, SSI parents receive a smaller portion of their income from TANF (36 percent) and food stamps (11 percent), and a larger portion from "other income" (47 percent). (See Appendix Exhibit B-1.) On the other hand, the TANF and food stamp grants comprise 68 and 23 percent of an alien parent's income and 61 and 28 percent of a sanctioned parent's income, on average. Parents in sanction and alien status reported other income that comprises 10 and 7 percent of their income in Alameda.
The average food stamp benefit is substantially higher among parental cases than non-parental caregiver cases, averaging $160, $189, and $188 in Alameda, Duval, and Jackson, respectively (Exhibit 3.17). This is largely due to the fact that a larger portion of parental cases receive food stamps - 88 percent versus 36 percent. Non-parental caregivers have greater incomes making them less likely to be receiving food stamps. In addition, parental cases have a larger assistance unit and, presumably food stamp household, than non-parental caregiver cases. The average food stamp grant amounts for all non-parental caregiver cases is only $46 in Alameda and $76 in both Duval and Jackson.
Within the parental caregiver caseload, the magnitudes of the TANF and food stamp grants also vary by the type of child-only case (e.g. alien, SSI, or sanctioned). The size of these income sources is affected by a number of variables. Sanctioned cases reviewed in Alameda have fewer recipient children on average but are the group with the highest food stamp benefit amounts, receiving $190 per month, on average (Appendix Exhibit B.1). While adults who are sanctioned are not included in the TANF assistance unit, they are included in calculating the food stamp benefit. Alien cases in Alameda tend to have a larger number of recipient children and receive a higher food stamp grant, on average, than SSI cases ($161 versus $132). The food stamp calculation considers the SSI benefits, resulting in SSI recipients being eligible for smaller food stamp grants.
While few parents are working, most parental caregiver assistance units report income from sources other than TANF or food stamps. Yet, non-parental caregivers receive more income per month, on average, than parental caregivers. The fact that non-parental caregivers are more likely than parental caregivers to be employed helps explain why non-parental caregiver households have greater incomes. Parental caregivers across the counties report between $218 and $407 per month in other income whereas non-parental caregivers report between $408 and $898 per month in additional income.(9)
The trend is similar with respect to income received from other household members. Again, non-parental caregivers receive more per month from other household members than do parental caregivers. In Jackson County, for example, non-parental caregivers supplement the household's income with $170 per month from other members while parental caregivers receive only $26 per month from other household members, a difference of $144.
Absent Parents
In most of the non-parental caregiver case files, a limited amount of information was available concerning the child's absent parent(s). Where information was available on both absent parents, the mother's information was collected. In instances where the parent was once a TANF case head or a child-only caregiver to the focal child, that information was used to supplement the information available on absent parents.
As indicated in Exhibit 3.18 most absent parents are under the age of 40 and were single and unemployed at TANF application. There are no substantial differences in the figures across the three counties.
| Characteristic | Alameda | Duval | Jackson |
|---|---|---|---|
| Age (%) | |||
| Under 20 | 4.6 | 0.9 | 3.9 |
| 20 - 29 | 27.7 | 41.1 | 29.4 |
| 30 - 39 | 36.9 | 44.6 | 53.9 |
| 40 - 49 | 29.2 | 12.5 | 12.7 |
| 50 and over | 1.5 | 0.9 | 0.0 |
| Average age | 34.5 | 32.3 | 32.2 |
| Median age | 34.5 | 31.2 | 32.8 |
| Marital status at the time of earlier TANF application (%) | |||
| Married, living with spouse | 10.1 | 11.3 | 5.9 |
| Single | 86.1 | 81.8 | 83.7 |
| Unknown | 3.8 | 6.9 | 10.5 |
| Married (% of known) | 10.5 | 12.2 | 6.6 |
| Single (% of known) | 89.5 | 87.8 | 93.4 |
| Employment status at the time of earlier TANF application (%) | |||
| Employed (any hours) | 5.1 | 2.5 | 3.3 |
| Not employed/Out of labor force | 43.0 | 42.8 | 42.5 |
| Unknown | 51.9 | 54.7 | 54.2 |
| Sample size | 79 | 159 | 153 |
1. This analysis can be done with the use of administrative data. These data are only available for Florida and Duval County and Missouri and Jackson County.
2. Alameda has a higher percentage of aliens. In addition, Alameda's sanction policy results in child-only cases while a portion of Duval's sanctioned cases are child-only (most are closed), and Jackson's sanctioned cases are not categorized as child-only.
3. From July 1997 to May 1999 in Duval/Florida, and from May 1994 to May 1999 in Jackson/Missouri.
4. Marital status was not collected on benefit application or redetermination forms in Jackson County.
5. A more detailed account of the type of sanction case for parental caregivers in each county is outlined in Appendix Exhibit B.3. The percentages in Appendix Exhibit B.3 differ from those in Exhibit 3.12 due to the fact that those cases that have never been regular TANF cases and are child-only for "unknown" and "other" reasons are not included in the denominator of Exhibit 3.12.
6. This is noted in Appendix Exhibit B.2.
7. Some TANF applications did reveal employment information; for food stamp recipients, this information could be determined from food stamp applications.
8. The sample of non-parental cases in Alameda is only 79; 19 of these cases indicated that the caregiver's employment status was unknown, leaving only 60 non-parental caregivers with which to calculate these figures.
9. These amounts are likely underestimated as those with unknown values for "other income" were assumed to have $0 in "other income."
Summary Findings and Implications for Future Research
Summary Findings
The preceding chapters revealed a number of interesting findings regarding the policies, composition, and characteristics of child-only cases. It is important to note that this study represents the information that was available during the summer of 1999; states are creating new programs and modifying their TANF policies in ways that could affect child-only caseloads in the future. In addition, this study was limited to information that was available from state administrative systems and TANF case files. This chapter summarizes the findings and concludes with ideas for future research on this important topic.
National and State Level Findings
After significant growth in the early 1990s, the child-only caseload has leveled off nationally; however, due to continued reductions in the regular TANF caseload, the proportion of child-only cases continues to grow. While all states have experienced growth in the numbers and relative proportion of their child-only caseloads since the early 1990s, recent changes vary significantly among states.
Nationally, the composition of child-only cases has changed since 1988; parent-headed cases due to sanction, SSI receipt, and alien status have grown more rapidly than non-parental caregiver cases.
State TANF policies affect the number and composition of child-only cases in each state. The main policies are as follows:
- Time limits. Application of time limits to the entire family is less likely to lead directly to child-only cases than when applied only to the case head; however, over time whole family time limits may create child-only cases under the auspices of either protective payees or non-parental caregivers.
- Sanctions. Sanctions that remove the adult from the assistance unit create child-only cases; sanctions that reduce the grant, but keep the adult in the assistance unit do not. Whole family sanctions may create child-only cases if protective payees are utilized to provide resources for the child(ren).
- Alien status. State policies on qualified aliens who entered the country before or after August 1996 determine whether adults in those families may be included in the TANF case; children born in the United States to ineligible aliens will be child-only cases.
- Referral to SSI. Policies to actively refer TANF case heads with disabilities to SSI may increase the number of child-only cases. On the other hand, the few states that include SSI benefits in the TANF grant determination, should see a reduction in the number of child-only cases.
- Non-parental caregivers. States have the flexibility to develop their own definition of family; some states allow non-relatives who have guardianship or legal custody to apply for TANF benefits and others limit benefits to relative caregivers or parents. A state's definition of "family" and the requirements imposed on non-parental caregiver cases should affect the number of child-only cases.
- Alternate state programs. Creation of alternate relative caregiver programs may result in a shift of cases from TANF into the alternative programs; depending on state financing choices these cases may or may not be counted as TANF child-only cases.
TANF Child-only Caseload in Three Counties
The case file data collection effort revealed the following key findings regarding the characteristics of the child-only cases and the caregivers on these cases, the pathways by which the cases became child-only, and the household income of these cases.
Characteristics of Child-Only Cases and Caregivers on the Case
- Non-parental caregiver cases comprise two-thirds of child-only cases in Jackson and Duval Counties while most of the remaining cases are due to parental receipt of SSI; the Alameda County caseload is more evenly divided among non-parental caregiver, SSI, alien, and sanctioned cases.
- The typical child-only case has two children in the assistance unit; there are somewhat fewer children in non-parental caregiver units than in parental caregiver units. Nearly all of the focal children are of the same ethnic background as their caregiver, including non-parental caregiver cases.
- Caregivers in child-only cases are older than those in regular TANF cases; within the child-only caseload, non-parental caregivers are substantially older than parental caregivers.
- 56 to 63 percent of non-parental caregivers are over 50 years old;
- 21 to 34 percent are over age 60; and
- 6 to 9 percent are over age 70.
- Two-thirds of non-parental caregivers are grandparents. Over 20 percent are aunts or uncles. It is not uncommon for great-grandparents to be caregivers. Non-parental caregivers are almost always relatives tot he children.
- While most child-only caregivers are not currently married, non-parental caregivers are more likely to be married than parental caregivers. Non-parental caregivers, despite being older, are more likely to report employment than parental caregivers.
- The length of time on TANF is related to the age of the focal child. Thus, it is evident that children residing with non-parental caregivers in Alameda and Duval have older children and have received child-only TANF on the current case longer than those children residing with parents in these counties. In Jackson, however, children residing with parents have older children, on average, and have been receiving child-only TANF for a longer period of time than their counterparts residing with non-parental caregivers. Most absent parents were under age 40, single, and unemployed when on TANF.
Transitions into Child-Only Status
- The reasons why a child comes to reside with a non-parental caregiver vary widely; major reasons include desertion, substance abuse, incarceration, child abuse, and neglect on the part of the parent.
- Most focal children have resided with one caregiver while receiving TANF; however, a substantial proportion residing with a non-parental caregiver (from 35 to 43 percent) have resided with multiple caregivers, usually their parents, while receiving TANF. A significant proportion of parental child-only cases had once been regular TANF cases (21 to 53 percent).
Earnings and Income
- Non-parental caregivers report higher incomes than parental caregivers and are less likely to receive SSI, food stamps, and Medicaid than parental caregivers. However, TANF grant amounts are similar, on average, for the two groups.
TANF Child-Only Policies and Practices in Three States
This study examined the child-only policies and practices in California, Florida, and Missouri and found a range of policies that could influence the size and composition of child-only cases, including the following:
- With the exception of sanctioned cases in some states, child-only cases are not subject to time limits, nor are child-only caregivers required to work or participate in employment-related activities. The caregivers generally do not have access to employment-related services.
- Non-parental caregivers are subject to fewer requirements and receive less money and support services than foster care parents. There is very little interaction between the TANF workers and the CPS or foster care staffs in the three counties visited.
- Newly created relative care programs in all three states offer higher payments than TANF, require legal guardianship or court supervision of the child, and some level of background review, licensing, and/or training for the caregiver. States are using some combination of TANF, MOE, and state and local funding to support these programs.
- At the time of this study, no special plans were being made to serve the child-only cases in the counties visited, within the scope of the regular TANF program. While they make up an increasing proportion of the TANF caseload (68 percent in Duval County), child-only cases are perceived as easier to work than regular cases.
Implications for Future Research
Future research is still needed to answer the following questions:
- How are states implementing alternative programs for relatives?
All three states visited had either recently initiated or were planning implementation of alternative programs. Future studies could document the extent to which such programs are either in place or in process around the country and collect information on their structures and characteristics. Case studies could examine practices as well as the characteristics of the children and the caregivers. - How will time-limited cash assistance affect the child-only caseloads?
Full-family time limits have the potential to lead to the creation of either protective payee child-only cases or to non-parental caregiver cases. Future research can examine more carefully what happens to the children in families that use up their TANF benefits. Do they stay with their natural family? Do their families receive benefits through protective payees? Do the children move in with relatives and return to TANF as child-only cases? How are these children faring? - Do children on child-only cases move from caregiver to caregiver or tend to stay on one case until they age out of the program (i.e., turn 18 years old)?
Since most child-only cases are not subject to time limits (with the exception of sanctioned cases in some states), future research could track a group of focal children over time to document whether they reside with the same caregivers and whether they continue to receive TANF until they age out of the program. One could examine these questions for children in both parental and non-parental cases. - What proportion of child-only cases is comprised of recent immigrants due to PRWORA restrictions?
The child-only cases examined in Alameda, Duval, and Jackson did not include any qualified aliens who entered the country after August 1996 who were ineligible for TANF benefits (California is providing benefits to these individuals using state money; the Duval and Jackson TANF caseloads have relatively few immigrants). Further studies could examine this group of immigrants to assess what services they are receiving and how they are managing compared to qualified aliens who entered the country prior to the enactment of PRWORA. - How is child support enforcement handled for non-parental child-only cases?
Non-parental caregivers are required to supply information to help the state locate the children's parents, unless the non-parental caregiver has good cause for not cooperating. Then states can seek child support from both or either parent in non-parental child-only cases. Additional research is needed to assess the extent to which non-parental caregivers are supplying information regarding the absent parents, are unable to supply this information (i.e., they have no knowledge of the whereabouts of the parents), or have good cause for not cooperating.Also of interest is understanding whether state child support agencies are vigorously pursuing these cases. When the caregiver assigns child support payments as a condition of eligibility, the federal and state governments retain all or nearly all child support payments from current TANF cases. As the child-only caseload continues to increase as a proportion of the overall TANF caseload, and if collections lag for child-only cases, both the federal and state governments may experience a drop in retained TANF collections.
Appendix A: Child-Only Composition Quality Control Data
Composition Data for AFDC Child-Only Cases, October 1993-September 1994
Exhibit A-1 (continued)
Composition Data for AFDC Child-Only Cases, October 1993-September 1994
Composition Data for AFDC Child-Only Cases, October 1995-September 1996
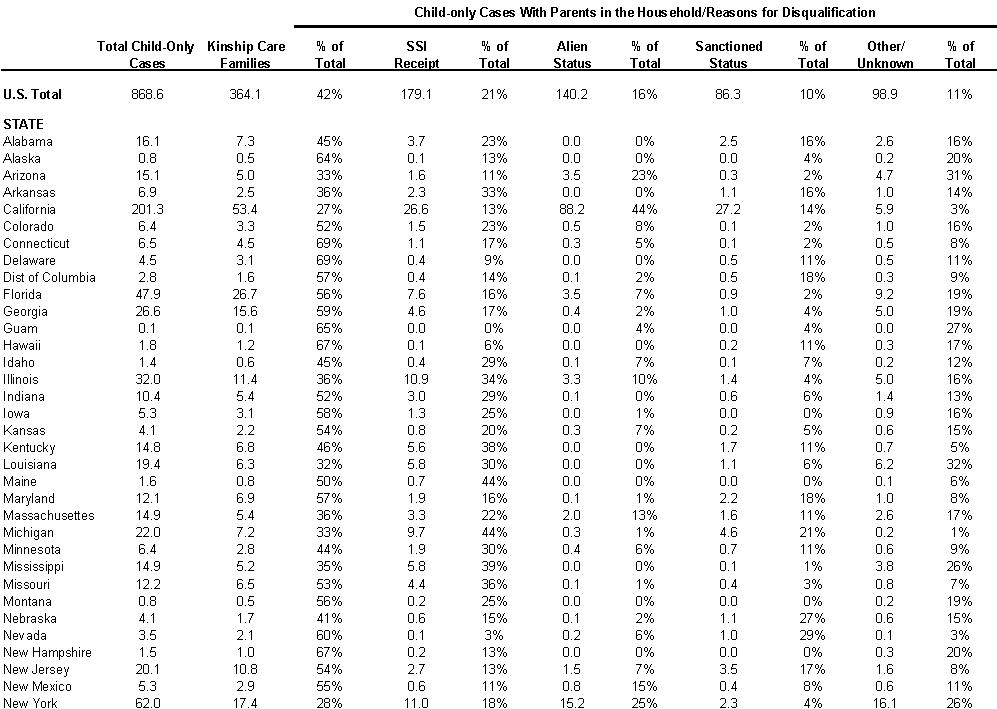
Exhibit A-2 (continued)
Composition Data for AFDC Child-Only Cases, October 1995-September 1996

Composition Data for AFDC Child-Only Cases, October 1996-June 1997
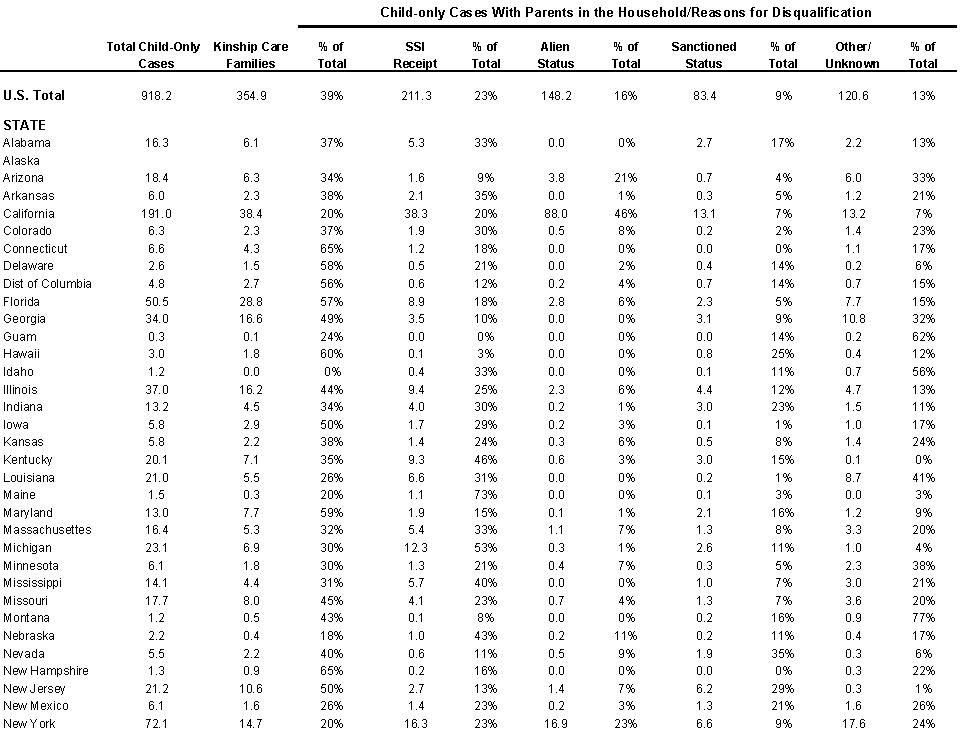
Exhibit A-3 (continued)
Composition Data for AFDC Child-Only Cases, October 1996-June 1997
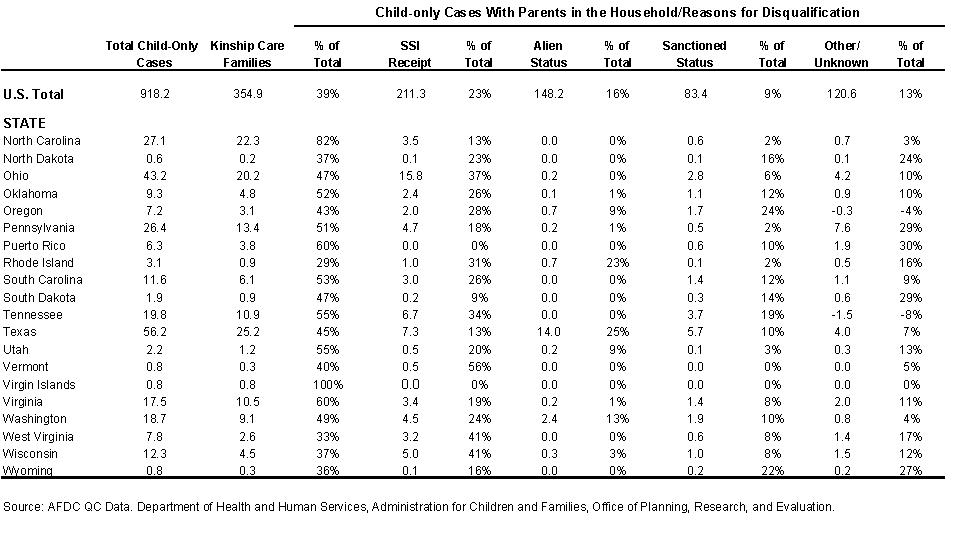
Appendix B: Case File Data
Characteristics of Child-Only Cases by Type of Case For Alameda County
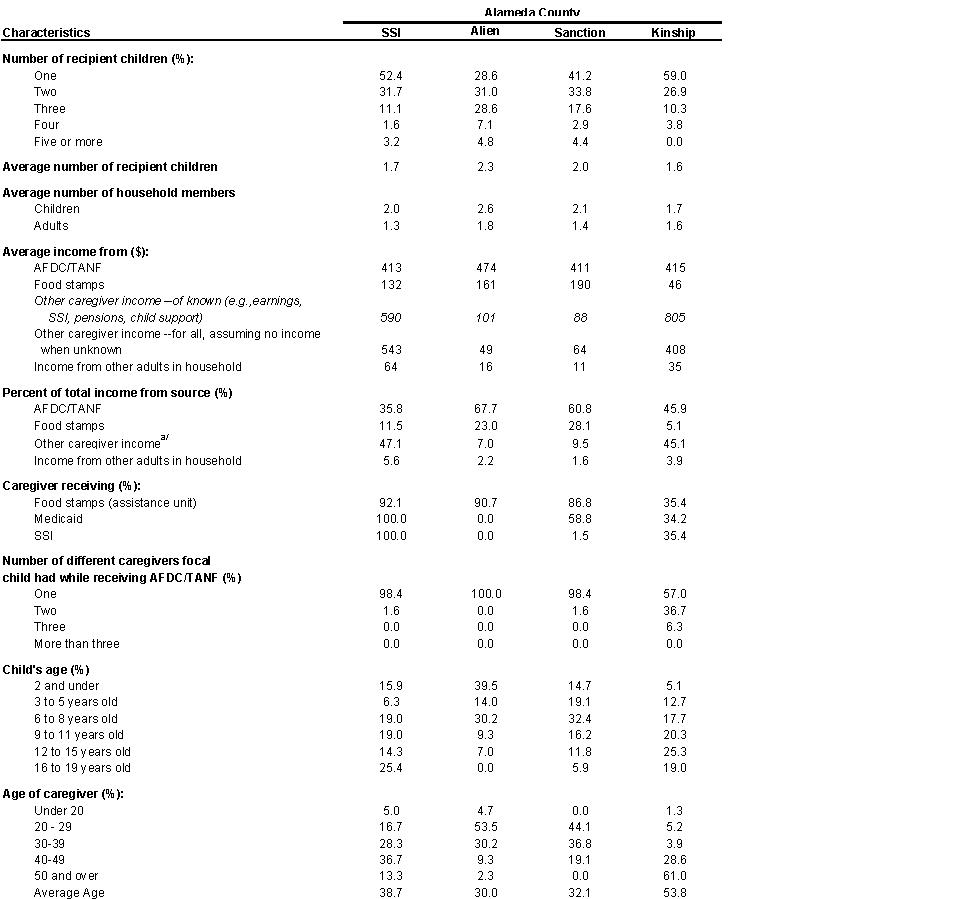
Exhibit B-1 (continued)
Characteristics of Child-Only Cases by Type of Case For Alameda County 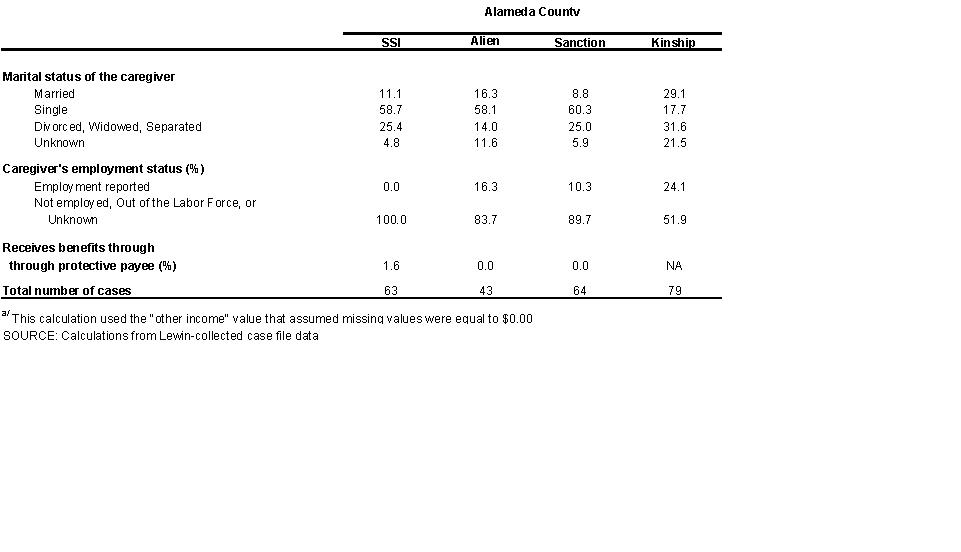
Circumstances Surrounding Child-Only Cases with Non-Parental Caregiver in Household
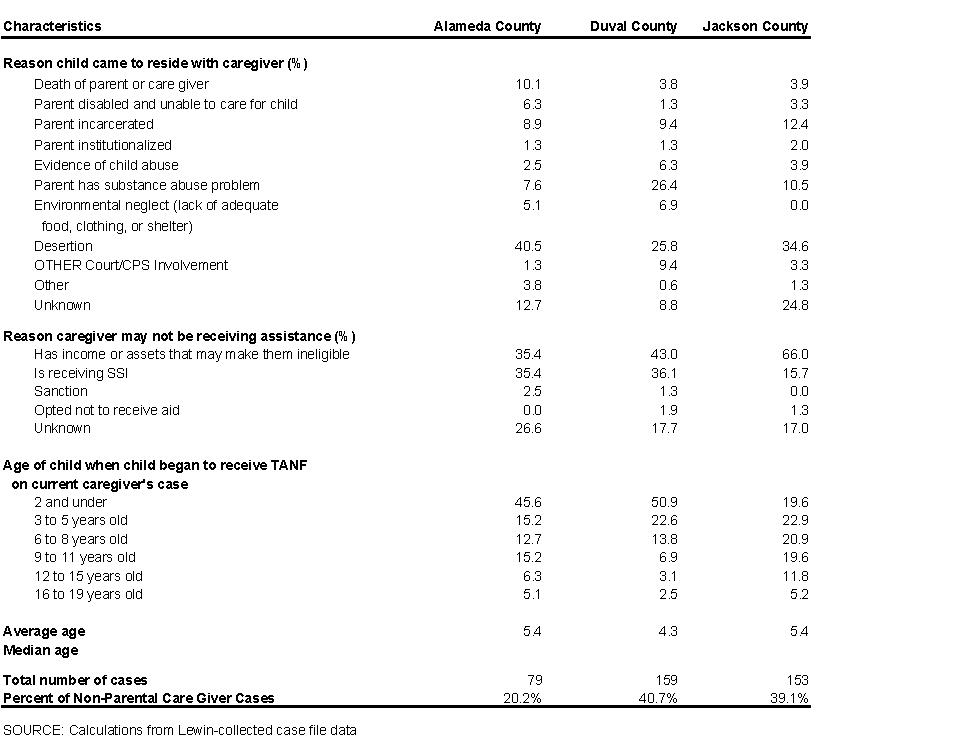
Circumstances Surrounding Child-Only Cases with Parent Living in Household
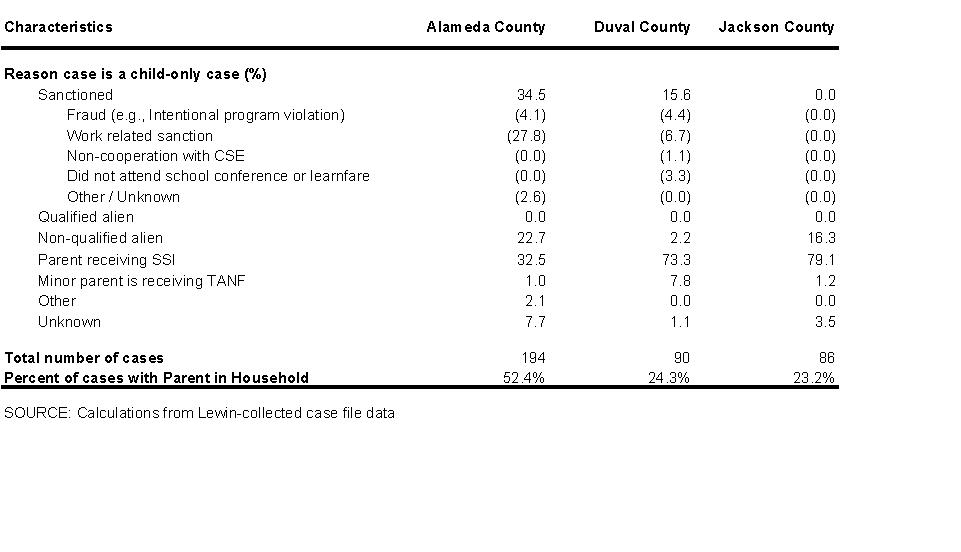
Appendix C: Administrative and Quality Control Data
Background Characteristics of Caregiver of TANF Caseloads and TANF Child-Only Caseloads
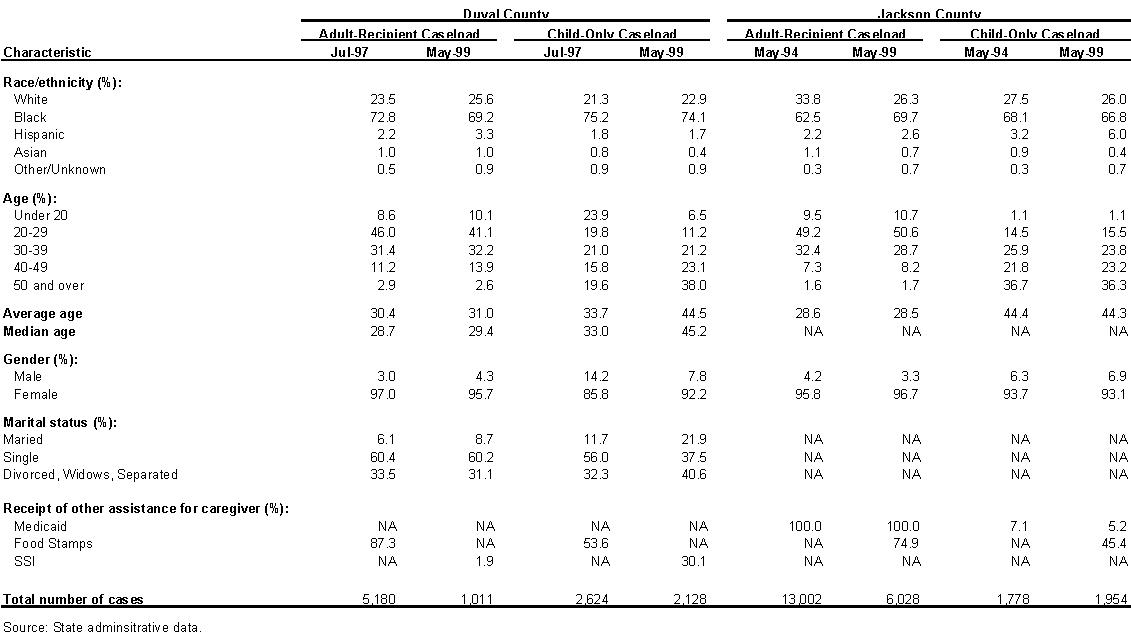
Background Characteristics of Caregiver of TANF Caseloads and TANF Child-Only Caseloads
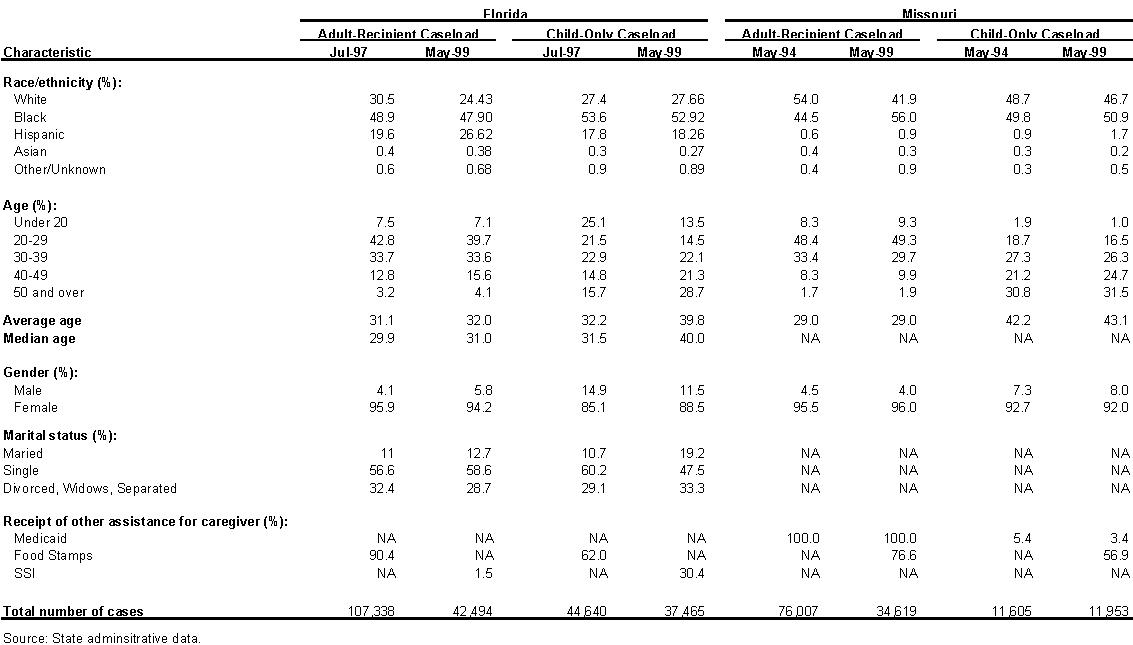
Background Characteristics of Younger Child of TANF Caseloads and TANF Child-Only Caseloads

Background Characteristics of Youngest Child of TANF Caseloads and TANF Child-Only Caseloads
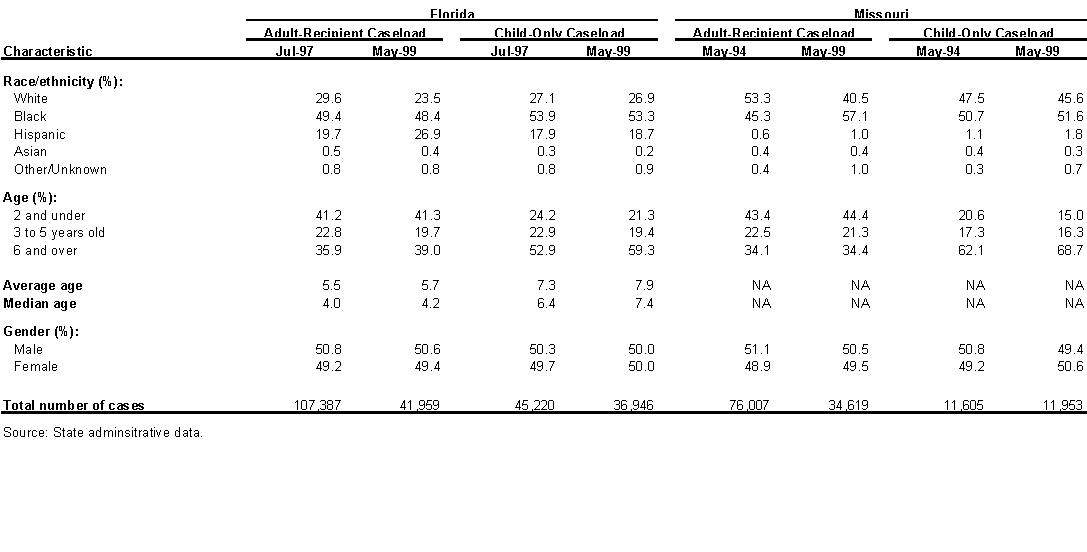
Background Characteristics of TANF Households and TANF Child-Only Households
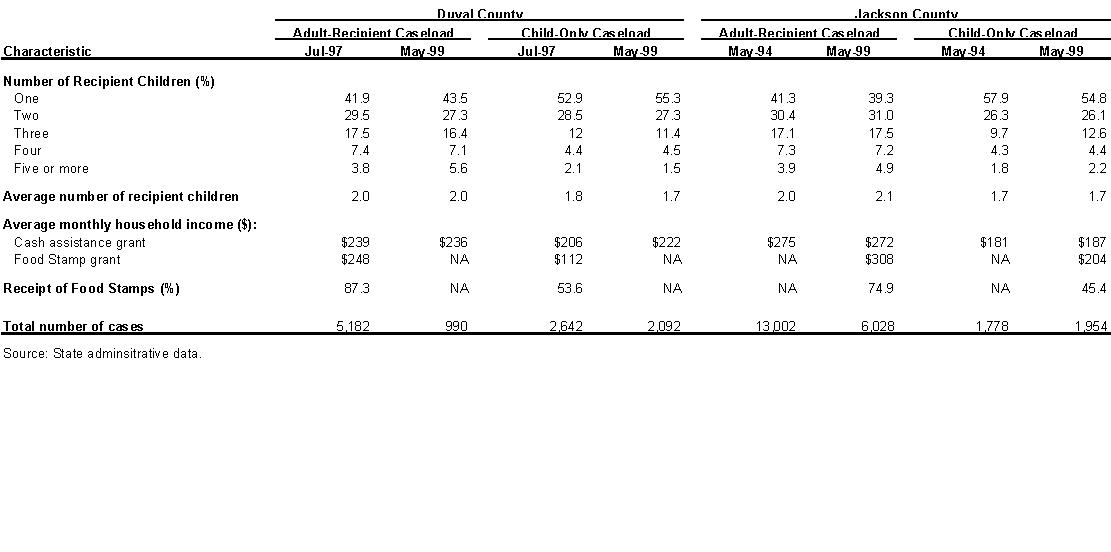
Background Characteristics of TANF Households and TANF Child-Only Households
Exhibit C-6
Background Characteristics of TANF Households and TANF Child-Only Households

Characteristics of the Adult Recipient and Child-Only Caseload in California and Alameda, October 1997 - September 1998