
By: Fredrik Andersson Office of the Comptroller of the Currency, Department of Treasury
Matthew Freedman Cornell University
Julia Lane National Science Foundation
Susan Hauan Office of the Assistant Secretary for Planning and Evaluation, Department of Health and Human Services
Contents
Sections
- Introduction
- Background
- Data
- Who are single mothers, where and how much do they work, and how much do they earn?
- What matters in getting a job and getting a good job?
- Summary
Abstract
The increasing labor supply of single mothers in the US labor market in the 1990s is well documented, but due to data deficiencies it generally has been difficult to track the progress in the labor market of this group. In this study we integrate household characteristics data from the Current Population Survey with administrative longitudinal employment and earnings records from the US Census Bureau's Longitudinal Employer-Household Dynamics (LEHD) program, enabling us to construct employment and earnings histories covering the six years prior to and five years following the survey year (either 1997 or 1998) of each respondent. In contrast to the broader population, single mothers as a group had persistently lower rates of employment and, if employed, higher job volatility and stagnant earnings in the years prior to the survey year. Subsequently, their position in the labor market improved markedly: low-income single mothers, in particular, experienced relatively rapid earnings growth and increased employment stability. Even so relatively large fractions of low-income single mothers continued to experience difficulties in the labor market, and a more detailed analysis of the factors contributing to success in the labor market suggests that past employment histories are closely related to subsequent labor market outcomes.
[ Go to Contents ]
1. Introduction
One of the striking features of the US labor market in the 1990s was the increase in the number of single mothers who entered the workforce. Still, for single mothers in the lowest income quintile, average earnings actually decreased between 1995 and 1997 (Primus, 1999). This research, however, analyzed aggregate trends by income group without examining decreases or increases in earnings for the same single mothers over time. Hence, while more and more mothers are working, less is understood about the relationship between past work experience, employer characteristics and long run earnings trajectories of single mothers, primarily because of the difficulties in tracking the same individuals over time.
In this paper, we seek to fill this research gap by exploiting a new data resource at the Census Bureau: the match of the Current Population Survey (CPS) to detailed administrative longitudinal earnings and employment histories. These data allow us to examine the individual earnings trajectories for single mothers. In particular we address the following questions:
- How strongly attached to the labor market and how economically mobile are single mothers? In particular, do low-income single mothers experience earnings growth over time?
- What factors contribute to a strong attachment to the labor market? In particular, what is the role of worker characteristics and characteristics of past employment histories?
- What factors contribute to upward earnings mobility? In particular, what is the role of worker characteristics and characteristics of past employment histories?
The study is organized as follows. After reviewing the existing literature on the labor market dynamics of single mothers and describing the data in more detail, we document the characteristics of a population of single mothers, including their earnings and employment histories, and compare them to other populations. We then describe the degree to which individuals get jobs and move up the earnings distribution. This is followed by an analysis of the importance of initial conditions, such as personal employment history and demographic characteristics, in earnings and employment transitions.
[ Go to Contents ]
2. Background
Single mothers as a group face a number of obstacles to successful transitions out of low-wage employment. These obstacles include both individual characteristics, such as low skill levels and disabilities (Danziger et al., 2006), and employment characteristics, since their employment is often in low-paying professions and industries (Peterson, Song and Jones-DeWeever, 2002; Ellwood, 2000; Friedlander and Burtless, 1995). The obstacles also include a general deterioration in the economic landscape for low-skill work: lower relative pay for low levels of education and weakened labor unions. As a result, single mothers seeking to work their way up the socioeconomic ladder are likely to face multiple difficulties given these trends facing low-skilled workers in general.
Studies examining welfare recipients and women who leave welfare (generally referred to as 'leavers' studies) reinforce this and provide ample documentation of the magnitude of the challenge. Early studies found that while most welfare recipients and leavers were employed at some point, they generally struggled to find good jobs, had frequent spells of unemployment and only modest wage growth over time (Pavetti, 1997; Burtless, 1997; Moffitt and Winder, 2005). Leavers studies also suggest that welfare leavers struggle to find stable employment. Acs and Loprest (2001), synthesizing key findings from fifteen of the Department of Health and Human Services ASPE-funded leavers studies, noted that over 70% of welfare leavers worked at some point in the year following welfare exit; however, only about one-third of welfare leavers worked in all four quarters after exiting TANF.
Researchers point to different factors contributing to these challenges. For example, Holzer and Martinson (2005) concluded that part of the problem is that many of these workers are employed with firms that have high job turnover, and in addition they often experience lengthy periods of time between jobs. This joblessness, in combination with low wages and few benefits while employed, reduces their annual earnings and inhibits their wage growth over time.
Indeed, some recent research suggests that one way of promoting economic self-sufficiency is to match former welfare recipients with better quality employers. An evaluation of various welfare-to-work strategies across the U.S. found that a program in Portland, OR, was the most successful in increasing the earnings of participants, partly because of its emphasis on finding better jobs for former welfare recipients (Manpower Demonstration Research Corporation, 2002). Consistent with these findings, Andersson, Lane and McEntarfer (2004) found that TANF recipients who worked for employers with certain characteristics were far more likely to transition out of low-earnings than other TANF recipients, even after controlling for characteristics of the worker. Similarly, Andersson, Holzer and Lane (2005) found that employer characteristics were important factors contributing to the movement of low-wage workers out of low-wage status.
Much of the recent research on low-wage employment has used matched employer-employee data. Such data have permitted researchers to document the large degree of heterogeneity in firms' human resource practices, as well as the clearly substantial effects of these differences on workers of all skill levels (Brown, Haltiwanger and Lane, 2006). Analyses of these matched data have demonstrated the value of temporary help agencies, and hence the importance of job placement as well as job training policies (Andersson, Holzer and Lane, 2005).
The matched data also have permitted the documentation of high levels of turbulence in the US labor market, much of which disproportionately affects a small group of workers. Golan, Lane and McEntarfer (2007) showed that about 26% of workers, who had previously exhibited a substantial degree of attachment to their employer, changed jobs in a given year. Older workers were much less likely to change jobs and more likely to exit the workforce than younger workers. They also found that a relatively small subset of workers was shuffled across jobs - both within and across industries - in the economy. Although the levels of reallocation (i.e., workers changing from one job to another) varied across demographic group, the basic pattern of persistence did not.
However, there has been little evidence about the importance of the employer-employee match in understanding the outcomes of low-income single mothers, primarily due to a lack of available data. The major data deficiency is that no dataset simultaneously has the following information: household characteristics of workers necessary to establish single mother status; long earnings histories and labor market outcomes necessary to determine both past and future earnings and employment trajectories; and the characteristics of employers.
Finally, few datasets combine such information with changes in marital status. In the next section we discuss the construction of a dataset that mitigates these problems.
[ Go to Contents ]
3. Data
The approach we take is to merge survey data that include household characteristics with two sets of administrative data records. The survey data are pooled from two years of the Annual Social and Economic Supplement (ASEC) to the Current Population Survey (CPS).[1] We base our pooled sample on the 1997 and 1998 ASEC survey instruments both of which collect respondent information for the previous calendar year. Thus, our main study sample is comprised of single mothers in the lowest quintiles of the income distribution in either 1996 or 1997 (depending on the year they were surveyed). We refer to 1996 or 1997 as the base year for the study throughout this report.
We use the CPS sample to define single mothers, at the time of the survey, as women ages 16 to 64 who are not enrolled in school and who are divorced, separated, never married, or widowed and reside with at least one of their own children under the age of 18. We also include in this sample women who head a female-headed household that contains a related child under 18 when the mother of that child is not present in the household. Low-income single mothers are defined to be those in the two bottom income quintiles of this sample.[2]
In order to capture past and future earnings and employment outcomes of the single women, the pooled sample is integrated with longitudinal earnings data provided by the Social Security Administration (SSA): the Detailed Earnings Record (DER).[3] These data enable us to construct an historical labor history documenting employment and earnings received from each employer for each respondent from the six years prior to the survey year going back to either 1990 or 1991 depending on the survey year. The data also permit the construction of labor market outcomes for each respondent in the five years following the survey year extending to either 2001 or 2002 depending on the survey year.[4]
Finally, in order to examine changes in marital status, we link the CPS with the 2000 Decennial Census Long Form data, which is a one in six sample of the U.S. population. Nine hundred and seventy single mothers in the pooled CPS sample also are in the 2000 Decennial Census Long Form data.
[ Go to Contents ]
4. Who are single mothers, where and how much do they work, and how much do they earn?
This section describes the demographic characteristics and employment experiences of the single mothers in our study. Subsection 4.1 provides baseline information during the survey year, while subsection 4.2 describes where and how much they worked (and earned) in the years before they were surveyed. Subsections 4.3 and 4.4 summarize their earnings and employment outcomes respectively in the years after they were surveyed.
4.1 Characteristics of single women in survey year
Demographic characteristics often are cited as important correlates of low income among single mothers. Our descriptive analysis of the data supports these previous findings. Table 4.1a presents the demographic characteristics in the base year (1996 or 1997 depending on the survey) of all single mothers (Column 2) and low-income single mothers (Column 1) compared to two sets of benchmarks: the demographic characteristics of all women (Column 3); and of the total adult population (Column 4).[5] [6]
Table 4.1a shows that single mothers were disproportionately young (20% were between ages 16 and 24) and black (24%) when compared to both the total population and women in general. The importance of educational barriers also is evident: only 10% of all single mothers had any post high school education (compared with 24% in the general population) and almost 25% of single mothers lacked a high-school diploma (compared with 16% in the general population). These numbers were even more striking for low-income single mothers: fewer than 3% had education beyond high school and almost 40% lacked high-school diplomas.
Again in keeping with the literature, the results in Table 4.1a show that many single-mother households were poor, with 38% of all single mothers living in families with incomes below the official poverty threshold. And even though this sample includes single-mothers living with other relatives, the average annual family income for single mothers was just over $28,000. The vast majority (88%) of low-income single mothers was in families with incomes below the official poverty threshold and virtually all lived in a family with income below 150% of this threshold. The number of children in the family is another factor: there were more children to support, especially children under age six, in low-income single mother families than in the broader population.
| Low-income single mothers | All single mothers | All women | All adults | |
| Source: Calculations based on the 1997 and 1998 Annual Social and Economic Supplement of the CPS. | ||||
| Race | ||||
| White | 65.0% | 71.3% | 85.3% | 86.3% |
| Black | 29.9% | 24.0% | 10.0% | 9.0% |
| Other | 5.1% | 4.7% | 4.8% | 4.7% |
| Age | ||||
| 16-24 | 21.3% | 19.9% | 8.7% | 8.8% |
| 25-34 | 36.1% | 30.8% | 25.0% | 25.2% |
| 35-44 | 29.7% | 32.5% | 28.5% | 28.4% |
| 45-64 | 13.0% | 16.7% | 37.8% | 37.6% |
| Education | ||||
| Less than HS graduate | 38.8% | 24.4% | 15.0% | 15.5% |
| HS graduate | 58.4% | 65.4% | 61.4% | 59.4% |
| Bachelor's degree | 2.8% | 10.0% | 23.0% | 24.1% |
| Postgraduate degree | 0.0% | 0.2% | 0.6% | 1.0% |
| Marital status | ||||
| Widow | 4.5% | 5.5% | 3.2% | 2.0% |
| Divorced | 28.3% | 35.3% | 12.7% | 11.0% |
| Separated | 17.1% | 15.0% | 3.5% | 2.8% |
| Never married | 50.1% | 44.3% | 18.7% | 21.0% |
| Children in household | ||||
| Average number of related children under 6 in primary family | 0.83 | 0.59 | 0.33 | 0.31 |
| Average number of related children under 18 in primary family | 2.21 | 1.88 | 0.99 | 0.93 |
| Subfamily contains own unmarried children under 18 | 95.2% | 95.5% | 48.1% | 45.3% |
| Family income status | ||||
| Total family income | $8,870 | 28,236 | $51,869 | $54,065 |
| Primary family income below 100% of poverty | 88.2% | 37.7% | 13.6% | 11.2% |
| Primary family income below 150% of poverty | 99.9% | 53.3% | 22.2% | 19.4% |
| Health and health insurance status | ||||
| Health or disability problem | 14.1% | 9.3% | 8.6% | 8.3% |
| Covered through employer | 12.7% | 36.4% | 41.1% | 49.2% |
| Covered by public HI | 56.1% | 33.3% | 14.8% | 12.9% |
| Not covered by health insurance | 29.1% | 24.7% | 16.9% | 18.1% |
| Number in sample | 2,998 | 7,279 | 48,629 | 94,362 |
Finally, single mothers, particularly low-income single mothers, were more likely to have reported health or disability problems and were less likely to be covered by health insurance.
Low-income single mothers often have low levels of attachment to the labor market, as well as low earnings from the jobs they are able to secure. As shown in Table 4.1b, the differences in employment rates between single mothers and all women were not great (67% vs. 70%), but those in the former group did have slightly lower work intensities as measured by hours of work per week and weeks of work per year, as well as a higher rate of unemployment (8% vs. 4%). Single mothers had a slightly higher labor force participation rate than all women, likely due in part to their higher unemployment rate, and they were slightly more likely to work full-time than all women.[7] In contrast, low-income single mothers had a much lower employment rate (44%), a much higher rate of unemployment (13%), and a lower labor force participation rate (only 57% as compared to 73% among all women). In addition, among low-income single mothers who were employed, a relatively large fraction worked part-time.
As compared to all employed women, employed single mothers had lower total earnings ($17,729 vs. $22,267 among those employed) and had lower total annual incomes ($20,651 vs. $24,428). Again the biggest differences are not found in comparisons between single mothers and all women, but between low-income single mothers and the general population. Low-income single mothers earned only $6,159 and had a total annual income of $7,964, when examining averages among employed individuals only (see the third panel of Table 4.1b).
Employment in low-wage industries and occupations is another correlate of low-wage status. Table 4.1c summarizes the dominant industries and occupations for each of the demographic subgroups; each table cell shows the industry (or occupation) that employed the largest proportion, the second largest proportion, or the third largest proportion of workers in each research sample. The results again are consistent with the earlier literature: single mothers, particularly low-income single mothers, were disproportionately employed in the low-wage, high turnover Retail trade industry and Personal services industry. They also were much more likely to be employed in the low-wage occupational categories of Service occupations and Sales occupations.
| Low-income single mothers | All single mothers | All women | All adults | |
| Source: Calculations based on the 1997 and 1998 Annual Social and Economic Supplement of the CPS and corresponding to the base year 1996 or 1997. | ||||
| Employment status | ||||
| Employed | 44.3% | 66.9% | 69.7% | 76.1% |
| Full-time | 61.2% | 76.7% | 75.9% | 84.8% |
| Part-time | 38.8% | 23.3% | 24.1% | 15.2% |
| Average hours worked per week | 27.3 | 34.4 | 35.7 | 38.7 |
| Average weeks worked per year | 34.7 | 43.4 | 45.6 | 46.9 |
| Unemployed | 12.5% | 8.0% | 3.5% | 4.1% |
| Participating in the labor force | 56.8% | 74.9% | 73.2% | 80.1% |
| Earnings and income All individuals | ||||
| Wages and salaries | $3,202 | $12,249 | $15,643 | $22,936 |
| Self-employment earnings | $123 | $385 | $630 | $1,492 |
| Unemployment Insurance income | $85 | $94 | $76 | $109 |
| Total income | $6,395 | $16,239 | $19,096 | $27,574 |
| Total earnings | $3,325 | $12,644 | $16,303 | $24,540 |
| Earnings and income - Employed individuals only | ||||
| Wages and salaries | $5,918 | $17,206 | $21,359 | $28,660 |
| Self-employment earnings | $240 | $510 | $865 | $1,912 |
| Unemployment Insurance income | $92 | $92 | $71 | $92 |
| Total income | $7,964 | $20,651 | $24,428 | $32,967 |
| Total earnings | $6,159 | $17,729 | $22,267 | $30,717 |
| Number employed | 1,329 | 33,885 | 48,629 | 71,791 |
| Low-income single mothers | All single mothers | All women | All workers | |
| Source: Calculations based on the 1997 and 1998 Annual Social and Economic Supplement of the CPS and corresponding to the base year 1996 or 1997. | ||||
| Top three industries with largest shares of workers | ||||
| First | Retail trade (33%) | Professional and related services (30%) | Professional and related services (37%) | Professional and related services (24%) |
| Second | Professional and related services (25%) | Retail trade (24%) | Retail trade (18%) | Retail trade (15%) |
| Third | Personal services, including private households (11%) | Personal services, including private households (7%) | Finance, insurance, and real estate (8%) | Durable goods manufacturing (10%) |
| Top three occupations with largest shares of workers | ||||
| First | Service occupations, excluding household and protective (37%) | Service occupations, excluding household and protective (23%) | Administrative support occupations, including clerical (24%) | Professional specialty occupations (15%) |
| Second | Sales occupations (17%) | Administrative support occupations, including clerical (22%) | Professional specialty occupations (17%) | Executive, administrative, and managerial occupations (14%) |
| Third | Administrative support occupations, including clerical (14%) | Sales occupations (14%) | Service occupations, excluding household and protective (16%) | Administrative support occupations, including clerical (14%) |
4.2 The evolution of earnings and employment prior to the base year[8]
The data used for this project enable us to document the earnings and employment of single mothers in the six years prior to the base year.[9] The first panel in Table 4.2a shows how average earnings (in 1998 dollars) changed over time for low-income single mothers, all single mothers, all women, and for the general population during the six-year historical period used in this study. The most striking finding is that earnings for both low-income single mothers and all single mothers were relatively stagnant, even as the broader population enjoyed steady increases. Women who were defined to be low-income single mothers in the base year consistently made less in the previous six years than did women in general, and made substantially less than the general population.
We measure the spread in earnings by the difference between what the highest-earning individuals (the average of those in the top earnings decile of the group) earned relative to the lowest-earning individuals (those in the bottom earnings decile). As shown in Panel B, earnings dispersion generally declined for all demographic groups over the period. In the low-income single mothers group, six years before the base year, the highest-earning women in the top earnings decile made almost eleven times as much as the lowest-earning women in the bottom earnings decile. The corresponding earnings spread at the start of the historical period for the other three groups (all single mothers, all women and all workers) was roughly thirteen. For all groups, however, the spread had dropped substantially by the time of the survey.[10]
The data also enable us to examine the evolution of single mothers employment shown in the last two panels. Panel C shows that single mothers, particularly low-income single mothers, were subject to more employment instability than the other groups. The number of jobs held in a year (whether it be simultaneously or sequentially) during the historical period ranged from 1.75 to 2.00 jobs for low-income single mothers and 1.64 to 1.82 jobs for all single mothers, as compared with 1.51 to 1.56 jobs for all women and 1.52 to 1.57 jobs for the general population. Considering that single mothers in general and low-income mothers in particular had higher rates of non-employment this translates into even larger differences in the average number of jobs among only those who are employed, which supports prior research that single mother populations are likely to have unstable employment.
It also is clear from examining Panel D that single mothers, and in particular low-income single mothers, experienced persistently higher rates of joblessness; six years prior to the base year 62% of low-income single mothers and 46% of all single mothers were without jobs, compared with only 33% of all women and 26% of the general population. In the base year the jobless rate of all single mothers was fairly comparable to that of all women, while low-income single mothers were still characterized by a significantly higher jobless rate.
One of the distinctive features of single-mother populations is that many are very young and have had only limited opportunities to accumulate experience in the labor market. A more detailed analysis controlling for age (see Table A1 in the Appendix) shows the results of comparing our sample of single mothers to a sample of women with the same age distribution.[11] The analysis reveals that part of the differences in earnings and employment patterns were indeed attributable to age effects, but, even after controlling for the effects of differences in the age distribution, single mothers had significantly lower earnings and generally higher job instability in the historical period. Thus, the effect of single mother status goes over and beyond the effect of age.
| Time | Low-income single mothers | Single mothers | All women | All workers |
| * Conditional on Earning At Least $1000. Earnings are in 1998 dollars.Source: Calculations based on the Detailed Earnings Records for populations defined by the 1997 and 1998 Annual Social and Economic Supplement of the CPS and corresponding to the base year 1996 or 1997. | ||||
| Panel A: Mean earnings* | ||||
| t-6 | $9,815 | $15,757 | $19,869 | $27,322 |
| t-5 | $9,435 | $16,016 | $20,223 | $27,683 |
| t-4 | $9,404 | $16,093 | $20,474 | $28,015 |
| t-3 | $8,887 | $16,004 | $21,027 | $28,702 |
| t-2 | $8,819 | $16,769 | $21,314 | $29,285 |
| t-1 | $8,313 | $16,710 | $21,757 | $30,088 |
| Base (t=0) | $9,673 | $17,592 | $22,676 | $31,495 |
| Panel B: Earnings dispersion (90/10 ratio) * | ||||
| t-6 | 10.7 | 13.3 | 12.8 | 13.8 |
| t-5 | 12.0 | 13.7 | 12.8 | 13.6 |
| t-4 | 11.2 | 14.4 | 12.6 | 13.2 |
| t-3 | 11.1 | 13.5 | 12.2 | 12.7 |
| t-2 | 9.1 | 13.4 | 11.8 | 12.1 |
| t-1 | 8.8 | 11.3 | 11.2 | 11.3 |
| Base (t=0) | 8.2 | 10.3 | 10.8 | 10.7 |
| Panel C: Number of jobs* | ||||
| t-6 | 1.75 | 1.64 | 1.51 | 1.52 |
| t-5 | 1.75 | 1.65 | 1.51 | 1.53 |
| t-4 | 1.79 | 1.69 | 1.53 | 1.55 |
| t-3 | 1.90 | 1.76 | 1.55 | 1.57 |
| t-2 | 1.93 | 1.78 | 1.55 | 1.57 |
| t-1 | 2.00 | 1.82 | 1.56 | 1.57 |
| Base (t=0) | 2.01 | 1.84 | 1.56 | 1.57 |
| Panel D: Proportion without jobs | ||||
| t-6 | 62% | 46% | 33% | 26% |
| t-5 | 60% | 43% | 31% | 25% |
| t-4 | 58% | 40% | 30% | 24% |
| t-3 | 55% | 36% | 29% | 22% |
| t-2 | 51% | 32% | 28% | 21% |
| t-1 | 47% | 28% | 27% | 21% |
| Base (t=0) | 39% | 23% | 26% | 20% |
4.3 The evolution of employment and earnings after the survey year
Weve shown that in the years leading up to our study base year, single mothers, and especially low-income single mothers, experienced stagnant earnings and had a higher number of jobs. What happened after the base year? Did single mothers see any subsequent earnings growth during the late 1990s and early 2000s? The boom of the late 1990s and subsequent recession in 2001 had major impacts on U.S. household incomes. These macroeconomic events, in combination with welfare reform legislation aimed at increasing labor force participation among poor families receiving public benefits and other factors, also worked to shape the labor market facing single mothers. These changes provide the backdrop against which we describe changes in the earnings and employment of single mothers in the five years after the survey. The richness of the data permits us to construct a number of different ways of measuring how transitory (or permanent) single mothers place is in the earnings distribution during this outcome period.
As Panel A of Table 4.3a reveals, the latter part of the 1990s and the early 2000s were a period of earnings growth for the single mother populations.[12] Growth in mean earnings was comparable across all groups in absolute terms, and hence the growth in relative earnings between the base year and the end of the outcome period five years later was larger for single mothers at 22% than the 14% and 12% increase experienced by all women and all workers, respectively, and larger yet, at 43%, for low-income single mothers.[13] [14] The spread in the earnings distribution remained about the same over the fiveyear outcome period: from Panel B it is evident that individuals at the top decile of the earnings distribution earned about 10 times that of individuals in the bottom earnings decile, with the ratio slightly less for low-income single mothers.
| Time | Low-income single mothers | Single mothers | All women | All workers |
| *Conditional on Earning At Least $1000. Earnings are in 1998 dollars.Source: Calculations based on the Detailed Earnings Records for populations defined by the 1997 and 1998 Annual Social and Economic Supplement of the CPS and corresponding to the base year 1996 or 1997. | ||||
| Panel A: Mean earnings* | ||||
| Base (t=0) | $9,673 | $17,592 | $22,676 | $31,495 |
| t+1 | $11,015 | $18,409 | $23,616 | $32,770 |
| t+2 | $11,954 | $19,363 | $24,338 | $34,025 |
| t+3 | $12,381 | $20,052 | $25,095 | $35,026 |
| t+4 | $13,107 | $20,577 | $25,590 | $35,014 |
| t+5 | $13,794 | $21,384 | $25,951 | $35,395 |
| Panel B: Earnings dispersion (90/10 ratio)* | ||||
| Base (t=0) | 8.2 | 10.3 | 10.8 | 10.7 |
| t+1 | 8.1 | 9.3 | 10.2 | 10.4 |
| t+2 | 8.0 | 8.8 | 10.1 | 10.4 |
| t+3 | 8.4 | 9.1 | 10.3 | 10.6 |
| t+4 | 7.9 | 9.3 | 10.4 | 10.8 |
| t+5 | 8.6 | 9.3 | 10.6 | 11.1 |
| Panel C: Number of jobs* | ||||
| Base (t=0) | 2.01 | 1.84 | 1.56 | 1.57 |
| t+1 | 1.98 | 1.82 | 1.54 | 1.55 |
| t+2 | 1.94 | 1.79 | 1.53 | 1.54 |
| t+3 | 1.87 | 1.73 | 1.50 | 1.51 |
| t+4 | 1.76 | 1.62 | 1.44 | 1.45 |
| t+5 | 1.65 | 1.55 | 1.40 | 1.41 |
| Panel D: Proportion without jobs | ||||
| Base (t=0) | 39% | 23% | 26% | 20% |
| t+1 | 35% | 22% | 27% | 21% |
| t+2 | 32% | 21% | 27% | 22% |
| t+3 | 32% | 21% | 28% | 23% |
| t+4 | 35% | 23% | 30% | 25% |
| t+5 | 36% | 26% | 32% | 27% |
Employment stability increased for all groups of workers, but particularly for single mothers. Panel C shows that the average number of jobs per worker declined in every year and by the end of the period the average number of jobs for single mothers was much closer to that of the total population. As Panel D shows, there was an initial dip in the proportion of single mother workers, including low-income single mother workers, without jobs which is likely related to the strong economy in the late 1990s. However, this initial dip was followed by an increase in the proportion without jobs by the early 2000s, when the economy was slower. In contrast, jobless rates for all women and all workers progressively increased across the five-year outcome period, suggesting that the broader populations were less likely than the single mother populations to gain jobs in the late 1990s.
These average earnings and employment figures provide an initial picture of overall labor market outcomes, but they do not describe the degree to which earnings gains have been experienced broadly across the population of interest or only by certain individuals. By examining individual earnings trajectories we can, however, analyze the extent of persistence in earnings levels and earnings mobility as well as in maintaining employment.
The data enable us to construct a number of different measures of employment and earnings persistence. In calculating the first measure, which we call a distribution measure, we categorize workers by the proportion of time they spent in different parts of the earnings distribution[15] (or not working) before, during, and after the base year.
The first panel in Table 4.3b shows that about 27% of low-income single mothers had no job at all during the six years prior to the base year, 39% had no job in the base year, and 18% had no job in the five years after the base year. This compares to levels of about 16%, 23% and 12% respectively for all single mothers and to 10%, 20% and 14% for the broader adult population. Further, 63% of low-income single mothers, and 41% of all single mothers, were either not employed or were employed with earnings in the lowest earnings quintile during the historical period, compared with 31% of women and 23% of the general population. Overall, single mothers were much more likely to be non-employed or in lower earnings quintiles than the broader population in the historical period.
| Historical | Base | Outcome | |
| Source: Calculations based on the Detailed Earnings Records for populations defined by the 1997 and 1998 Annual Social and Economic Supplement of the CPS and corresponding to the base year 1996 or 1997. | |||
| Low-income single mothers | |||
| Not employed all years | 26.9 | 39.0 | 18.4 |
| Not employed or quintile 1 all years | 62.8 | 76.3 | 49.6 |
| Not employed or quintile 1-2 all years | 87.5 | 94.7 | 80.9 |
| Not employed or quintile 1-3 all years | 95.6 | 98.6 | 95.1 |
| Not employed or quintile 1-4 all years | 99.3 | 99.6 | 99.1 |
| Not employed or quintile 1-5 all years | 100.0 | 100.0 | 100.0 |
| All single mothers | |||
| Not employed all Years | 15.8 | 23.4 | 11.8 |
| Not employed or quintile 1 all years | 40.6 | 50.4 | 31.5 |
| Not employed or quintile 1-2 all years | 64.9 | 73.1 | 58.5 |
| Not employed or quintile 1-3 all years | 82.5 | 87.2 | 80.2 |
| Not employed or quintile 1-4 all years | 94.0 | 95.7 | 93.1 |
| Not employed or quintile 1-5 all years | 100.0 | 100.0 | 100.0 |
| All women | |||
| Not employed all years | 14.4 | 26.3 | 18.3 |
| Not employed or quintile 1 all years | 31.0 | 46.3 | 34.8 |
| Not employed or quintile 1-2 all years | 51.5 | 64.3 | 54.7 |
| Not employed or quintile 1-3 all years | 71.4 | 79.7 | 73.2 |
| Not employed or quintile 1-4 all years | 88.2 | 92.2 | 88.5 |
| Not employed or quintile 1-5 all years | 100.0 | 100.0 | 100.0 |
| All adults | |||
| Not employed all years | 10.4 | 20.3 | 14.3 |
| Not employed or quintile 1 all years | 22.6 | 36.3 | 26.6 |
| Not employed or quintile 1-2 all years | 39.2 | 52.2 | 42.5 |
| Not employed or quintile 1-3 all years | 57.9 | 68.1 | 59.9 |
| Not employed or quintile 1-4 all years | 77.5 | 84.1 | 78.6 |
| Not employed or quintile 1-5 all years | 100.0 | 100.0 | 100.0 |
Strikingly, however, the relative position of single mothers improved markedly in the years after the survey. The fractions of single mothers that were non-employed or had earnings in the lowest earnings quintiles were substantially lower in the post-survey years as compared to the pre-survey years, which are trends that are opposite of those for the broader populations. In spite of these improvements a large fraction of low-income single mothers never experienced earnings above the bottom two quintiles (81% as compared to 43% among all adults).
An alternative way of describing whether individuals are persistently, rather than transitorily, low-income or have low levels of labor force attachment is to measure the percentages of individuals not employed or in the lowest earnings quintiles for the majority of the period examined (historical, base, and outcome periods) for each subgroup. The results of the calculations are reported in Table 4.3c.
The first column provides descriptive information on the employment picture across the study periods for the different populations. It reveals that about 19% of the general population of adults and 25% of the population of women did not have a job in four, five or six years out of the six years in the historical period, compared with 33% of all single mothers and 52% of low-income single mothers. In the outcome period, the employment picture for low-income single mothers was markedly different from that of all single mothers. Among all single mothers, about 16% did not have a job for four or five years out of the five years in the outcome period; among low-income single mothers 25% did not have a job for four or five years.
The second and third columns expand the analysis to describe the proportion of time that the individual either has no job or has a job with low earnings. This expansion reveals that large fractions of single mothers spent all five years in the outcome period either not employed or employed with earnings in the bottom two quintiles (59% for all single mothers and 81% for all low-income single). This is particularly interesting given that relatively large fractions of the single mother populations are in their prime working ages during the outcome period (as shown in Table 4.1a).
| Period | Years | Not employed | Not employed or earnings quintile 1 | Not employed or earnings quintile 1-2 |
| Source: Calculations based on the Detailed Earnings Records for populations defined by the 1997 and 1998 Annual Social and Economic Supplement of the CPS and corresponding to the base year 1996 or 1997. | ||||
| Low-income single mothers | ||||
| Historical period | 0 of 6 years | 18.8 | 5.7 | 1.4 |
| 1 of 6 years | 10.2 | 4.0 | 1.1 | |
| 2 of 6 years | 9.3 | 4.2 | 1.1 | |
| 3 of 6 years | 9.8 | 5.8 | 1.9 | |
| 4 of 6 years | 11.7 | 6.4 | 2.4 | |
| 5 of 6 years | 13.2 | 11.0 | 4.6 | |
| 6 of 6 years | 26.9 | 62.8 | 87.5 | |
| Base year | 0 of 1 year | 61.0 | 23.8 | 5.3 |
| 1 of 1 year | 39.0 | 76.3 | 94.7 | |
| Outcome period | 0 of 5 years | 46.4 | 14.7 | 3.1 |
| 1 of 5 years | 12.6 | 8.6 | 2.7 | |
| 2 of 5 years | 9.1 | 7.8 | 3.5 | |
| 3 of 5 years | 7.4 | 9.0 | 4.0 | |
| 4 of 5 years | 6.1 | 10.2 | 5.7 | |
| 5 of 5 years | 18.4 | 49.6 | 80.9 | |
| All single mothers | ||||
| Historical period | 0 of 6 years | 39.4 | 23.4 | 13.8 |
| 1 of 6 years | 10.7 | 6.8 | 3.6 | |
| 2 of 6 years | 8.6 | 6.2 | 3.4 | |
| 3 of 6 years | 8.5 | 6.7 | 3.5 | |
| 4 of 6 years | 8.6 | 6.9 | 4.6 | |
| 5 of 6 years | 8.4 | 9.3 | 6.4 | |
| 6 of 6 years | 15.8 | 40.6 | 64.9 | |
| Base year | 0 of 1 year | 76.6 | 49.7 | 26.9 |
| 1 of 1 year | 23.4 | 50.4 | 73.1 | |
| Outcome period | 0 of 5 years | 62.5 | 35.3 | 18.4 |
| 1 of 5 years | 10.4 | 9.6 | 5.4 | |
| 2 of 5 years | 6.5 | 8.1 | 5.2 | |
| 3 of 5 years | 4.9 | 7.8 | 5.6 | |
| 4 of 5 years | 3.9 | 7.8 | 6.9 | |
| 5 of 5 years | 11.8 | 31.5 | 58.5 | |
| All women | ||||
| Historical period | 0 of 6 years | 51.9 | 34.5 | 22.2 |
| 1 of 6 years | 9.5 | 7.9 | 5.4 | |
| 2 of 6 years | 7.1 | 6.9 | 4.7 | |
| 3 of 6 years | 6.2 | 6.3 | 4.8 | |
| 4 of 6 years | 5.7 | 6.3 | 5.2 | |
| 5 of 6 years | 5.2 | 7.2 | 6.3 | |
| 6 of 6 years | 14.4 | 31.0 | 51.5 | |
| Base year | 0 of 1 year | 73.7 | 53.7 | 35.7 |
| 1 of 1 year | 26.3 | 46.3 | 64.3 | |
| Outcome period | 0 of 5 years | 58.1 | 38.5 | 24.0 |
| 1 of 5 years | 8.3 | 7.9 | 5.6 | |
| 2 of 5 years | 6.0 | 6.4 | 4.9 | |
| 3 of 5 years | 4.9 | 6.0 | 5.1 | |
| 4 of 5 years | 4.4 | 6.5 | 5.7 | |
| 5 of 5 years | 18.3 | 34.8 | 54.7 | |
| All adults | ||||
| Historical period | 0 of 6 years | 60.1 | 43.5 | 31.3 |
| 1 of 6 years | 9.2 | 8.9 | 6.8 | |
| 2 of 6 years | 6.4 | 6.9 | 5.4 | |
| 3 of 6 years | 5.3 | 6.2 | 5.3 | |
| 4 of 6 years | 4.6 | 5.8 | 5.6 | |
| 5 of 6 years | 4.1 | 6.2 | 6.5 | |
| 6 of 6 years | 10.4 | 22.6 | 39.2 | |
| Base year | 0 of 1 year | 79.7 | 63.8 | 47.8 |
| 1 of 1 year | 20.3 | 36.3 | 52.2 | |
| Outcome period | 0 of 5 years | 64.4 | 47.2 | 33.6 |
| 1 of 5 years | 8.0 | 8.4 | 6.8 | |
| 2 of 5 years | 5.3 | 6.4 | 5.6 | |
| 3 of 5 years | 4.2 | 5.7 | 5.4 | |
| 4 of 5 years | 3.7 | 5.8 | 6.0 | |
| 5 of 5 years | 14.3 | 26.6 | 42.5 | |
Yet another approach to capturing the persistence of low earnings status is to pinpoint the location of individuals in the earnings distribution in a given year and then describe their earnings progression both before and after that year. In other words, we categorize their position in the earnings distribution in the base year (non-employed, first earnings quintile, second earnings quintile, third earnings quintile, fourth earnings quintile, or fifth earnings quintile) as was done for the previous tables. Then, we calculate and plot the average earnings in each year of the study for each of the earnings quintile categories separately for the four study populations.[16] If an individuals labor market status is transitory, then the average earnings of each group should be very similar before and after the survey; if low earnings are strongly persistent, then the mean earnings in the lowest quintile group should always be below the mean earnings in the second lowest quintile group, which in turn would be below mean earnings in the third lowest quintile group and so on. We call this a mean earnings measure.
The results of the calculations are plotted in four charts in Figure 4.3a. The divergence in mean earnings for each study population was persistent, although less so for low-income single mothers (see first chart in Figure 4.3a). Among low-income single mothers there were a number of individuals who despite having low family income had personal earnings in the highest real earnings quintile during the base year (as shown in the shaded bar of the first chart in Figure 4.3a). Retaining high earnings after the survey, however, appears to be more difficult for such individuals than for other populations (as shown in the second, third and fourth charts of Figure 4.3a), but the result should be interpreted with some care since the sample is small.[17]
Figure 4.3a
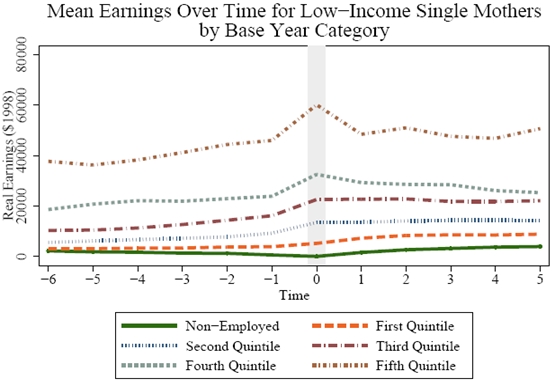
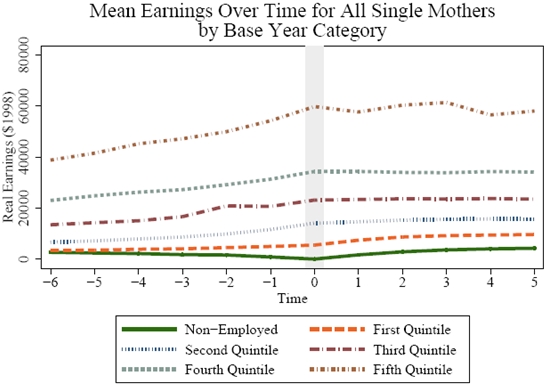
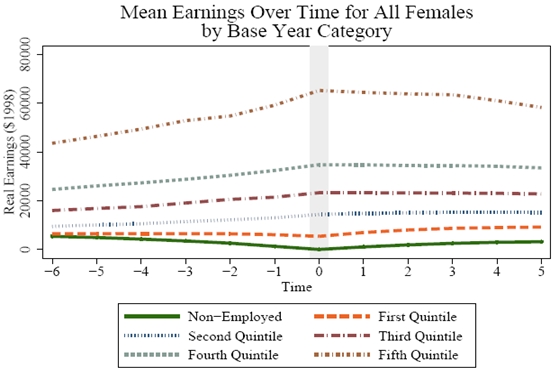
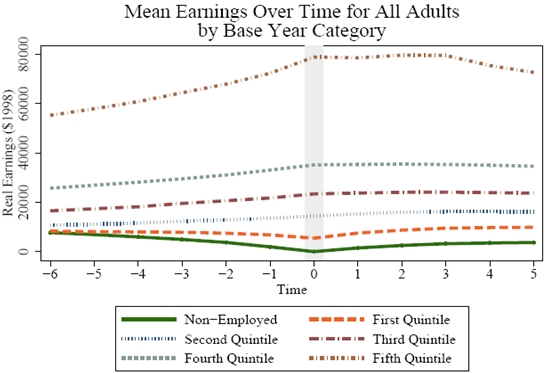
Figure 4.3a1: Line chart of mean earnings of low-income single mothers over time by their level of earnings in the base year of the study (1996 or 1997). Low-income single mothers who had earnings in the highest two earnings quintiles in the study base year were not able, on average, to maintain their earnings at the same levels five years later. Low-income single mothers who had earnings in the lowest two earnings quintiles in the study base year saw stagnant earnings levels on average over the next five years.
Figure 4.3a2: Line chart of mean earnings of all single mothers over time by their level of earnings in the base year of the study (1996 or 1997). Single mothers who had earnings in the highest two earnings quintiles in the study base year saw generally stagnant earnings levels on average over the next five years. Single mothers who had earnings in the lowest two earnings quintiles in the study base year saw some increases, on average, to their earnings five years later. Single mothers who saw stagnant earnings levels on average over the next five years.
Figure 4.3a3: Line chart of mean earnings of all women over time by their level of earnings in the base year of the study (1996 or 1997). Women who had earnings in the highest earnings quintile in the study base year maintained similar earnings levels on average over the next four years, with a slight drop in the fifth year. Women who had earnings in the lowest earnings quintile in the study base year saw some increases in earnings levels on average over the next five years.
Figure 4.3a4: Line chart of mean earnings of all adults over time by their level of earnings in the base year of the study (1996 or 1997). Adults who had earnings in the highest earnings quintile in the study base year maintained similar earnings levels on average over the next three years, with a drop in the fourth and fifth years. Adults who had earnings in the lowest earnings quintile in the study base year saw some increases in earnings levels on average over the next five years.
| Source: Calculations based on the Detailed Earnings Records for populations defined by the 1997 and 1998 Annual Social and Economic Supplement of the CPS and corresponding to the base year 1996 or 1997. |
The last measure that we use to capture earnings and employment persistence is the probability each year of remaining non-employed or in a particular earnings quintile for the different groups. Again, we start by categorizing each individuals position in the earnings distribution in the base year (non-employed or in one of the five earnings quintiles). Next we track the share or proportion of each group that are in that same category in each of the six years prior to the base year and in each of the five years after the base year. We call this the mobility measure. Figure 4.3b reports the results of this approach using a scale ranging from a share of 0.0 (where no one in a base-year earnings category also is in that same category in a given year before or after the base year) to a share of 1.0 (where 100% of the individuals in a base-year earnings category also are in that same category in a given year before or after the base year).
Several results are evident. First is the persistence of non-employment. Approximately 70% (a share of .7) of all women and all adults that were non-employed in the base year (1996 or 1997) remained non-employed five years afterwards (see third and fourth charts in Figure 4.3b, respectively). Second, there was a substantial difference between non-employed single mothers and other non-employed individuals: only about 60% (a share of .6) of single mothers remained non-employed by the end of the outcome period (see second chart in Figure 4.3b). Third, the persistence of workers staying in the lowest earnings quintile was low: just over 20% (a share of .2) of single mothers in the lowest earnings quintile (first quintile) in the base period also were in the same category at the start of the historical period and only about 40% (a share of .4) remained in it at the end of the outcome period (see second chart in Figure 4.3b). Finally, not only was there substantial persistence in the top earnings category (fifth quintile), but the patterns were more similar across subgroups for individuals in the upper earnings quintiles.
Figure 4.3b
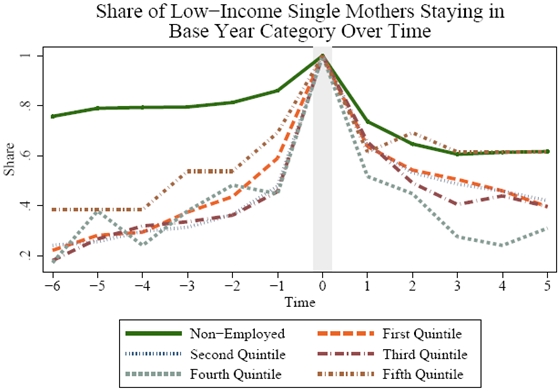
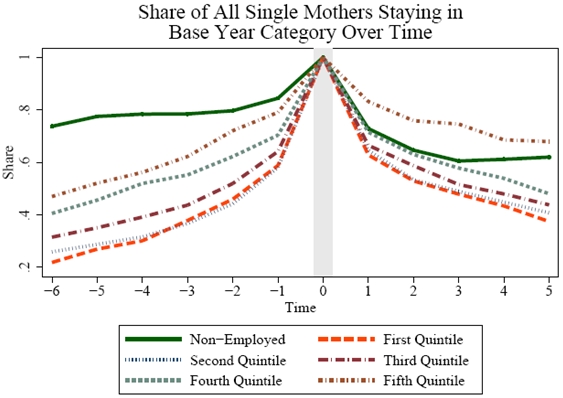
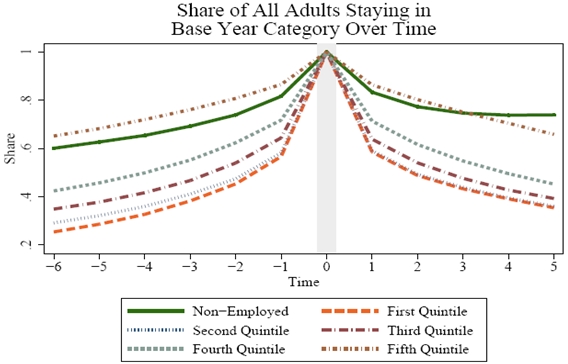
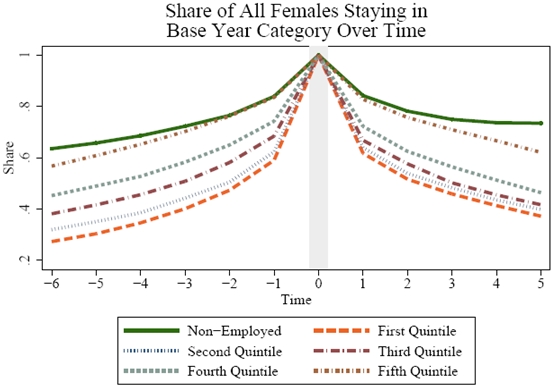
Figure 4.3b1: For low-income single mothers by level of earnings in the base year of the study (1996 or 1997), line chart showing the proportion of each group that remained in the same earnings category over time. Many low-income single mothers shifted earnings categories over time, with low-income single mothers in the second highest earnings quintile in the base year showing the greatest proportion changing categories over the next five years.
Figure 4.3b2: For all single mothers by level of earnings in the base year of the study (1996 or 1997), line chart showing the proportion of each group that remained in the same earnings category over time. Many single mothers shifted earnings categories over time, with low-income single mothers in the highest earnings quintile in the base year remaining the most stable over the next five years.
Figure 4.3b3: For all women by level of earnings in the base year of the study (1996 or 1997), line chart showing the proportion of each group that remained in the same earnings category over time. Many women shifted earnings categories over time, with women in the lowest earnings quintile in the base year experiencing the greatest shifts into other earnings categories over the next five years.
Figure 4.3b4: For all adults by level of earnings in the base year of the study (1996 or 1997), line chart showing the proportion of each group that remained in the same earnings category over time. Many adults shifted earnings categories over time, with adults in the highest earnings quintile in the base year experiencing a high level of stability in maintaining earnings in the highest earnings quintile over the next five years.
| Source: Calculations based on the Detailed Earnings Records for populations defined by the 1997 and 1998 Annual Social and Economic Supplement of the CPS and corresponding to the base year 1996 or 1997. |
4.4 Job Stability: Multiple Job Holding
The data also enable us to examine the job stability of each of the subgroups. The previous section established that single mothers had a greater number of jobs each year. This could occur either because single mothers tend to transition between jobs more often and/or because they hold more jobs simultaneously.
The following table provides the percentage of individuals in each period with different numbers of jobs over the course of the period. The results in Table 4.4a describe the distribution of multiple jobholding in each of the three key periods. Single mothers were much more likely to have held many jobs in each of the periods if employed. Nearly one-third (32%) had five or more jobs in the historical period, compared with 25% in the population as a whole, and over one quarter (27%) of single mothers (and 32% of low-income single mothers) had five or more jobs in the five years after the survey, compared with only 15% of all adults.
The effect of multiple job holding takes its toll on earnings, as is evident from the results shown in Table 4.4b. There is generally a negative relationship between average earnings and the number of different jobs in each period. This suggests that transitioning between jobs too often or holding many jobs at once may have a detrimental effect on earnings or that single mothers change jobs frequently in part because these jobs offer very low wages.
| Jobs | Historical (6 years) | Base (1 year) | Outcome (5 years) |
| Source: Calculations based on the Detailed Earnings Records for populations defined by the 1997 and 1998 Annual Social and Economic Supplement of the CPS and corresponding to the base year 1996 or 1997. | |||
| Low-income single mothers | |||
| 0 | 19.3 | 16.7 | 15.2 |
| 1 | 15.3 | 31.9 | 17.3 |
| 2 | 14.3 | 18.3 | 14.6 |
| 3 | 11.8 | 12.0 | 12.5 |
| 4 | 9.2 | 7.7 | 8.7 |
| 5+ | 30.1 | 13.4 | 31.7 |
| All single mothers | |||
| 0 | 11.8 | 9.7 | 10.0 |
| 1 | 17.0 | 36.2 | 20.7 |
| 2 | 15.5 | 21.9 | 17.6 |
| 3 | 13.2 | 13.1 | 14.1 |
| 4 | 10.6 | 7.8 | 10.1 |
| 5+ | 31.8 | 11.4 | 27.4 |
| All women | |||
| 0 | 11.7 | 12.3 | 16.6 |
| 1 | 24.4 | 48.0 | 29.7 |
| 2 | 18.3 | 20.2 | 19.6 |
| 3 | 12.9 | 9.3 | 12.3 |
| 4 | 9.3 | 4.6 | 7.6 |
| 5+ | 23.3 | 5.5 | 14.1 |
| All adults | |||
| 0 | 8.5 | 9.6 | 13.2 |
| 1 | 24.6 | 48.3 | 30.5 |
| 2 | 19.0 | 21.3 | 20.6 |
| 3 | 13.4 | 9.9 | 12.8 |
| 4 | 9.4 | 4.9 | 8.0 |
| 5+ | 25.2 | 6.0 | 15.1 |
| Average number of jobs held | Historical (6 years) | Base (1 year) | Outcome (5 years) |
| * Earnings are in 1998 dollars.Source: Calculations based on the Detailed Earnings Records for populations defined by the 1997 and 1998 Annual Social and Economic Supplement of the CPS and corresponding to the base year 1996 or 1997. | |||
| Low-income single mothers | |||
| 0 | $0 | $0 | $0 |
| 1 | $5,648 | $8,279 | $10,340 |
| 2 | $5,313 | $8,209 | $11,860 |
| 3 | $7,164 | $8,688 | $12,341 |
| 4 | $5,799 | $7,714 | $10,981 |
| 5+ | $6,414 | $7,781 | $9,851 |
| All single mothers | |||
| 0 | $0 | $0 | $0 |
| 1 | $15,077 | $18,939 | $21,437 |
| 2 | $14,142 | $16,509 | $20,516 |
| 3 | $12,658 | $14,378 | $19,257 |
| 4 | $11,632 | $12,519 | $18,052 |
| 5+ | $9,760 | $10,566 | $13,615 |
| All women | |||
| 0 | $0 | $0 | $0 |
| 1 | $20,458 | $22,901 | $23,545 |
| 2 | $19,726 | $21,029 | $24,174 |
| 3 | $17,620 | $18,591 | $22,637 |
| 4 | $15,843 | $16,835 | $22,229 |
| 5+ | $12,628 | $13,431 | $17,177 |
| All adults | |||
| 0 | $0 | $0 | $0 |
| 1 | $30,448 | $32,479 | $33,453 |
| 2 | $29,266 | $30,834 | $35,464 |
| 3 | $25,505 | $26,249 | $33,048 |
| 4 | $21,706 | $21,491 | $30,150 |
| 5+ | $15,978 | $16,466 | $21,721 |
[ Go to Contents ]
5. What matters in getting a job and getting a good job?
The previous section provided a broad overview of the very substantial average differences in the likelihood of getting a job and moving up the earnings distribution, for each of the study populations. We have shown thus far that single mothers, especially those with low-income, have experienced earnings growth on average, though not closing the earnings gap between single mothers and the more broadly defined groups in our study. What is the relationship between employment and earnings histories and outcomes? What factors are strong correlates of labor market success among single mothers? Many different factors combine and interact with each other in different ways in contributing to the key outcomes of interest in our study. In this section we examine in more detail the relative and combined contribution of these factors, including individual characteristics and prior employment and earnings histories, to labor market outcomes.
The first set of analyses uses probit regression to examine the importance of different demographic and historical factors in contributing to the likelihood of getting a job,[18] as well as the likelihood of moving up in the earnings distribution.[19] In particular, we estimate regressions of the form:
Prob(Employment 1998-2003 conditional on not employed in base year) = f(Personal Demographic Characteristics, Employment History) (5.1)
Prob(Transition from Non-Employment or Quintiles 1-2 in base year into Quintiles 3-5 1998-2003) = f(Personal Demographic Characteristics, Employment History) (5.2)
We estimate the effects of each of the factors contributing to becoming employed in at least one year in the outcome period for low-income single mothers who were not employed in the base year (equation 5.1) and report the results in Table 5.1a; the results for all single mothers are reported in Table 5.1b. We extend the analysis to estimate the effects of each factor in getting a good job, defined as average real annual earnings conditional on employment in the 3rd to 5th earnings quintiles over the entire outcome period (equation 5.2) and report those results for both low-income single mothers and all single mothers in Tables 5.1c and 5.1d, respectively. Each column represents an alternative model specification. The first column in each of the tables reports the results of a model when no controls for individuals employment histories in the base and historical period are included. Model results in columns two to five include controls for number of years employed (Column 2), the variation of earnings (Column 3), the number of unique jobs held in the base and historical period (Column 4) and a full model with all employment history controls included (Column 5).[20]
Age is clearly important in securing employment. In all cases, younger single mothers were more likely to get a job (Table 5.1a and Table 5.1b). Also, there appears to be a tendency for white single mothers to be more likely to get a job than single mothers of other races, although this depends on the model specification. Not surprisingly education is important: typically, the more educated the single mother, the more likely she was to get a job.[21] Finally, throughout all model specifications we found that single mothers who reported a disability were much less likely to become employed.[22]
Another important finding is the role of previous earnings and employment histories. Individuals with greater labor force attachment[23] were more likely to get a job. In fact, employment histories of just one to two years significantly increased the likelihood of gaining employment in the outcome period for low-income and all single mothers, although past employment of three to four years and five or more years increased the likelihood of employment even more. Interestingly, neither a history of volatile earnings (Column 3) nor a history of job-changing[24] (Column 4) negatively affected the likelihood of getting a job: indeed, workers with a history of multiple jobs were more likely to get a job in the outcome period than those who had never had a job in the past period at all. However, at least for low-income single mothers the effect was not linear: changing jobs frequently (3-5 jobs in the historical period) reduced the likelihood of getting a job relative to changing jobs only once (2 jobs in the historical period).
Which dimensions of a persons employment history matter most in getting a job? In order to answer this we include all measures of employment history simultaneously, rather than in isolation, and report the results in Column 5. The results of the previous models suggest that greater levels of past employment experience and a history of more jobs held are associated with getting a job, but unfortunately the sample size in the full model is too small to uniquely identify what factors matter the most.
| Model 1 | Model 2 | Model 3 | Model 4 | Model 5 | |
| Age (Omitted category: 16-24) | |||||
| Age 25-29 | -0.0395 | -0.0734 | -0.0589 | -0.0701 | -0.0721 |
| (0.0558) | (0.0568) | (0.0992) | (0.0569) | (0.1006) | |
| Age 30-39 | -0.1670 | -0.1925 | -0.1905 | -0.1919 | -0.1837 |
| (0.0462)*** | (0.0470)*** | (0.0839)** | (0.0472)*** | (0.0869)** | |
| Age 40-49 | -0.2525 | -0.2629 | -0.3252 | -0.2600 | -0.3151 |
| (0.0487)*** | (0.0492)*** | (0.0997)*** | (0.0495)*** | (0.1038)*** | |
| Age 50-59 | -0.3374 | -0.3583 | -0.4867 | -0.3525 | -0.4894 |
| (0.0528)*** | (0.0517)*** | (0.1027)*** | (0.0523)*** | (0.1071)*** | |
| Age 60-64 | -0.5434 | -0.5462 | # | -0.5441 | # |
| (0.0202)*** | (0.0201)*** | (0.0205)*** | |||
| Race (Omitted category: White) | |||||
| Black | -0.0080 | -0.0021 | -0.1007 | -0.0008 | -0.0947 |
| (0.0373) | (0.0379) | (0.0596)* | (0.0379) | (0.0602) | |
| Other race | -0.0305 | -0.0292 | -0.1466 | -0.0276 | -0.1280 |
| (0.0728) | (0.0740) | (0.1197) | (0.0740) | (0.1196) | |
| Education (Omitted category: Less than High-School Degree) | |||||
| High school degree | 0.0891 | 0.0432 | -0.0111 | 0.0438 | -0.0208 |
| (0.0369)** | (0.0385) | (0.0600) | (0.0385) | (0.0612) | |
| Some college | 0.1352 | 0.0563 | 0.0125 | 0.0597 | -0.0179 |
| (0.0469)*** | (0.0514) | (0.0678) | (0.0508) | (0.0716) | |
| Bachelors degree | 0.1705 | 0.1688 | 0.0838 | 0.1751 | 0.0587 |
| (0.1119) | (0.1140) | (0.2027) | (0.1138) | (0.2207) | |
| Master's, professional, or doctoral degree | -0.1998 | -0.2037 | # | -0.1995 | # |
| (0.2691) | (0.2762) | (0.2748) | |||
| Disability (Omitted category: No disability) | |||||
| Disability | -0.3691 | -0.3588 | -0.2218 | -0.3619 | -0.2131 |
| (0.0335)*** | (0.0346)*** | (0.0682)*** | (0.0346)*** | (0.0690)*** | |
| Employment (Omitted category: 0 years in 1991-97) | |||||
| Employed 1-2 years 1991-97 | 0.1946 | -0.0834 | |||
| (0.0382)*** | (0.0755) | ||||
| Employed 3-4 years 1991-97 | 0.2524 | -0.0256 | |||
| (0.0457)*** | (0.0671) | ||||
| Employed 5+ years 1991-97 | 0.2482 | # | |||
| (0.0503)*** | |||||
| Standard deviation of earnings 1991-97 (Omitted category: SD of earnings in top third | |||||
| SD of earnings in bottom third | 0.0196 | -0.0380 | |||
| (0.0596) | (0.0705) | ||||
| SD of earnings in middle third | 0.0770 | -0.0826 | |||
| (0.0661) | (0.0753) | ||||
| Number of jobs 1991-97 (Omitted category: 0 jobs in 1991-97) | |||||
| 1 job 1991-97 | 0.1777 | -0.1056 | |||
| (0.0419)*** | (0.0963) | ||||
| 2 jobs 1991-97 | 0.2681 | # | |||
| (0.0398)*** | |||||
| 3-5 jobs 1991-97 | 0.1993 | 0.1087 | |||
| (0.0549)*** | (0.0684) | ||||
| 6+ jobs 1991-97 | 0.0521 | ||||
| (0.0762) | |||||
| Observations | 1,092 | 1,092 | 372 | 1,092 | 372 |
| Standard errors in parentheses. # Effect not identified because of no observations in the corresponding category. * significant at 10%; ** significant at 5%; *** significant at 1% | |||||
| Model 1 | Model 2 | Model 3 | Model 4 | Model 5 | |
| Standard errors in parentheses. # Effect not identified because of no observations in the corresponding category. * significant at 10%; ** significant at 5%; *** significant at 1% | |||||
| Age (Omitted category: 16-24) | |||||
| Age 25-29 | -0.0122 | -0.0460 | -0.0343 | -0.0146 | -0.0377 |
| (0.0466) | (0.0476) | (0.0794) | (0.0480) | (0.0802) | |
| Age 30-39 | -0.1277 | -0.1609 | -0.1316 | -0.1018 | -0.1281 |
| (0.0382)*** | (0.0388)*** | (0.0675)* | (0.0395)** | (0.0696)* | |
| Age 40-49 | -0.2053 | -0.2148 | -0.2538 | -0.1552 | -0.2450 |
| (0.0397)*** | (0.0403)*** | (0.0774)*** | (0.0422)*** | (0.0802)*** | |
| Age 50-59 | -0.4069 | -0.4234 | -0.5072 | -0.3674 | -0.5069 |
| (0.0338)*** | (0.0329) | (0.0718)*** | (0.0390)*** | (0.0752)*** | |
| Age 60-64 | -0.5176 | -0.5240 | -0.6928 | -0.5049 | -0.6867 |
| (0.0195)*** | (0.0188)*** | (0.0320)*** | (0.0230)*** | (0.0363)*** | |
| Race (Omitted category: White) | |||||
| Black | 0.0074 | 0.0127 | -0.1059 | 0.0009 | -0.1063 |
| (0.0320) | (0.0327) | (0.0513)** | (0.0327) | (0.0516)** | |
| Other race | -0.0368 | -0.2039 | -0.2031 | -0.0470 | -0.2097 |
| (0.0593) | (0.0961)** | (0.0960)** | (0.0605) | (0.0966)** | |
| Education (Omitted category: Less than high school degree) | |||||
| High school degree | 0.0773 | 0.0220 | 0.0443 | 0.0324 | 0.0356 |
| (0.0309)** | (0.0323) | (0.0510) | (0.0322) | (0.0518) | |
| Some college | 0.1613 | 0.0665 | 0.0790 | 0.0802 | 0.0610 |
| (0.0377)*** | (0.0417) | (0.0545) | (0.0412)* | (0.0565) | |
| Bachelors degree | 0.2223 | 0.1739 | 0.1511 | 0.1854 | 0.1509 |
| (0.0699)*** | (0.0760)** | (0.0914)* | (0.0744)** | (0.0915)* | |
| Master's, professional, or doctoral degree | 0.0808 | 0.0103 | 0.2417 | 0.0452 | 0.2117 |
| (0.1680) | (0.1800) | (0.1704) | (0.1785) | (0.2193) | |
| Disability (Omitted category: No disability) | |||||
| Disability | -0.3266 | -0.3178 | -0.2352 | -0.3298 | -0.2317 |
| (0.0280)*** | (0.0289)*** | (0.0528)*** | (0.0286)*** | (0.0533)*** | |
| Employment (Omitted category: 0 years in 1991-97) | |||||
| Employed 1-2 years 1991-1997 | 0.2133 | # | |||
| (0.0322)*** | |||||
| Employed 3-4 years 1991-1997 | 0.2812 | 0.0396 | |||
| (0.0367)*** | (0.0533) | ||||
| Employed 5+ years 1991-1997 | 0.3079 | 0.0874 | |||
| (0.0378)*** | (0.0594) | ||||
| Standard deviation of earnings 1991-97 (Omitted category: SD of earnings in top third | |||||
| SD of earnings in bottom third | -0.0177 | 0.0077 | |||
| (0.0556) | (0.0589) | ||||
| SD of earnings in middle third | -0.0161 | -0.0181 | |||
| (0.0600) | (0.0608) | ||||
| Number of jobs 1991-97 (Omitted category: 0 jobs in 1991-97) | |||||
| 1 job 1991-1997 | 0.1676 | ||||
| (0.0388)*** | |||||
| 2 jobs 1991-1997 | 0.2547 | 0.1028 | |||
| (0.0390)*** | (0.0684) | ||||
| 3-5 jobs 1991-1997 | 0.3167 | 0.1772 | |||
| (0.0336)*** | (0.0627)*** | ||||
| 6+ jobs 1991-1997 | 0.3028 | 0.1195 | |||
| (0.0383)*** | (0.0683)* | ||||
| Observations | 1607 | 1607 | 606 | 1607 | 606 |
Turning to the factors that affect the likelihood of getting a good job, or moving up in the earnings distribution, it is clear that the contribution of basic demographic characteristics is very different than it is in the process of getting a job (Tables 5.1c and 5.1d). Although there was still a tendency for younger single mothers to do better, in most model specifications, age was less important. Further, unlike the previous results the race of single mothers was not significantly related to upward earnings mobility, controlling for other factors. In contrast, education appears to be even more important in earnings progression than in securing employment: throughout all model specifications we find significant and strong effects suggesting that well-educated single mothers have a much higher likelihood of getting better paying jobs. Similar to the employment analyses, single mothers who reported a health problem or disability were significantly less likely to advance in the earnings distribution but the relationship appears to be weaker relative to the employment model results.
The contribution of prior employment histories to upward mobility is substantial for single mothers.[25] Being employed for more years in the base and historical period was associated with moving up in the earnings distribution. As in the employment models, employment volatility, or frequent job changes, also was related to an increased likelihood of positive earnings mobility. Similarly, while a history of high earnings volatility was not correlated with the likelihood of getting a job, the earnings models show that higher earnings volatility tends to increase the probability of upward mobility among single mothers, though the results are mixed depending on the model specification.
| Model 1 | Model 2 | Model 3 | Model 4 | Model 5 | |
| The dependent variable takes on 1 if individual transitions from non-employment or earnings quintile 1 or 2 in base year to earnings quintile 3, 4, or 5 in the 1998-2003 period. Standard errors in parentheses. # Effect not identified because of no observations in the corresponding category. * significant at 10%; ** significant at 5%; *** significant at 1% | |||||
| Age (Omitted category: 16-24) | |||||
| Age 25-29 | -0.0230 | -0.0311 | -0.0280 | -0.0238 | -0.0344 |
| (0.0133)* | (0.0117)*** | (0.0201) | (0.0127)* | (0.0194)* | |
| Age 30-39 | 0.0033 | -0.0083 | -0.0110 | 0.0096 | -0.0212 |
| (0.0131) | (0.0123) | (0.0193) | (0.0131) | (0.0197) | |
| Age 40-49 | -0.0175 | -0.0248 | -0.0256 | -0.0078 | -0.0335 |
| (0.0144) | (0.0129)* | (0.0216) | (0.0152) | (0.0211) | |
| Age 50-64 | -0.0540 | -0.0559 | -0.0635 | -0.0451 | -0.0689 |
| (0.0154)*** | (0.0124)*** | (0.0264)** | (0.0176)** | (0.0235)*** | |
| Age 60-64 | |||||
| Race (Omitted category: White) | |||||
| Black | 0.0089 | 0.0086 | 0.0057 | 0.0080 | 0.0028 |
| (0.0112) | (0.0108) | (0.0165) | (0.0109) | (0.0162) | |
| Other race | -0.0225 | -0.0163 | -0.0211 | -0.0213 | -0.0159 |
| (0.0193) | (0.0196) | (0.0312) | (0.0189) | (0.0319) | |
| Education (Omitted category: Less than high school degree) | |||||
| High school degree | 0.0439 | 0.0267 | 0.0361 | 0.0334 | 0.0324 |
| (0.0135)*** | (0.0128)** | (0.0199)* | (0.0131)** | (0.0196)* | |
| Some college | 0.1396 | 0.1044 | 0.1199 | 0.1143 | 0.1122 |
| (0.0225)*** | (0.0210)*** | (0.0283)*** | (0.0216)*** | (0.0279)*** | |
| Bachelors degree | 0.2938 | 0.2619 | 0.3224 | 0.2780 | 0.3254 |
| (0.0708)*** | (0.0692)*** | (0.0877)*** | (0.0703)*** | (0.0882)*** | |
| Master's, professional, or doctoral degree | 0.2937 | 0.2531 | 0.2337 | 0.2847 | 0.2362 |
| (0.1593)* | (0.1521)* | (0.2001) | (0.1599)* | (0.2020) | |
| Disability (Omitted category: No disability) | |||||
| Disability | -0.0643 | -0.0522 | -0.0756 | -0.0587 | -0.0707 |
| (0.0099)*** | (0.0108)*** | (0.0170)*** | (0.0102)*** | (0.0174)*** | |
| Employment (Omitted category: 0 years in 1991-97) | |||||
| Employed 1-2 years 1991-1997 | 0.0356 | 0.0281 | |||
| (0.0198)* | (0.0269) | ||||
| Employed 3-4 years 1991-1997 | 0.0446 | # | |||
| (0.0220)** | |||||
| Employed 5+ years 1991-1997 | 0.1033 | 0.0588 | |||
| (0.0211)*** | (0.0180)*** | ||||
| Standard deviation of earnings 1991-97 (Omitted category: SD of earnings in top third | |||||
| SD of earnings in bottom third | -0.0856 | 0.0119 | |||
| (0.0152)*** | (0.0200) | ||||
| SD of earnings in middle third | -0.0639 | 0.0920 | |||
| (0.0150)*** | (0.0233)*** | ||||
| Number of jobs 1991-97 (Omitted category: 0 jobs in 1991-97) | |||||
| 1 job 1991-1997 | 0.0475 | -0.0345 | |||
| (0.0301) | (0.0292) | ||||
| 2 jobs 1991-1997 | 0.0372 | # | |||
| (0.0288) | |||||
| 3-5 jobs 1991-1997 | 0.0795 | 0.0179 | |||
| (0.0261)*** | (0.0263) | ||||
| 6+ jobs 1991-1997 | 0.0859 | 0.0007 | |||
| (0.0263)*** | (0.0260) | ||||
| Observations | 1092 | 1092 | 372 | 1092 | 372 |
| Model 1 | Model 2 | Model 3 | Model 4 | Model 5 | |
| The dependent variable takes on 1 if individual transitions from non-employment or earnings quintile 1 or 2 in base year to earnings quintile 3, 4, or 5 in the 1998-2003 period. Standard errors in parentheses. # Effect not identified because of no observations in the corresponding category. * significant at 10%; ** significant at 5%; *** significant at 1% | |||||
| Age (Omitted category: 16-24) | |||||
| Age 25-29 | -0.0214 | -0.0414 | -0.0342 | -0.0216 | -0.0566 |
| (0.0126)* | (0.0108)*** | (0.0171)** | (0.0122)* | (0.0160)*** | |
| Age 30-39 | 0.0001 | -0.0228 | -0.0217 | 0.0072 | -0.0519 |
| (0.0115) | (0.0107)** | (0.0155) | (0.0115) | (0.0155)*** | |
| Age 40-49 | -0.0002 | -0.0230 | -0.0097 | 0.0123 | -0.0454 |
| (0.0134) | (0.0118)* | (0.0180) | (0.0139) | (0.0171)*** | |
| Age 50-59 | -0.0272 | -0.0452 | -0.0283 | -0.0098 | -0.0658 |
| (0.0186) | (0.0150)*** | (0.0270) | (0.0206) | (0.0223)*** | |
| Age 60-64 | -0.1113 | -0.1031 | -0.1471 | -0.1029 | -0.1481 |
| (0.0097)*** | (0.0085)*** | (0.0153)*** | (0.0122)*** | (0.0117)*** | |
| Race (Omitted category: White) | |||||
| Black | 0.0019 | 0.0025 | 0.0001 | 0.0011 | -0.0013 |
| (0.0102) | (0.0098) | (0.0140) | (0.0099) | (0.0139) | |
| Other race | -0.0153 | -0.0056 | -0.0058 | -0.0130 | 0.0028 |
| (0.0194) | (0.0198) | (0.0284) | (0.0192) | (0.0293) | |
| Education (Omitted category: Less than high school degree) | |||||
| High school degree | 0.0963 | 0.0632 | 0.0860 | 0.0809 | 0.0762 |
| (0.0132)*** | (0.0127)*** | (0.0184)*** | (0.0130)*** | (0.0183)*** | |
| Some college | 0.2016 | 0.1454 | 0.1661 | 0.1731 | 0.1528 |
| (0.0187)*** | (0.0178)*** | (0.0229)*** | (0.0183)*** | (0.0227)*** | |
| Bachelors degree | 0.4126 | 0.3420 | 0.3623 | 0.3835 | 0.3396 |
| (0.0405)*** | (0.0410)*** | (0.0465)*** | (0.0409)*** | (0.0468)*** | |
| Master's, professional, or doctoral degree | 0.3569 | 0.3038 | 0.2645 | 0.3300 | 0.2377 |
| (0.0891)*** | (0.0883)*** | (0.1047)** | (0.0896)*** | (0.1034)** | |
| Disability (Omitted category: No disability) | |||||
| Disability | -0.0996 | -0.0778 | -0.1128 | -0.0907 | -0.1032 |
| (0.0089)*** | (0.0102)*** | (0.0151)*** | (0.0093)*** | (0.0162)*** | |
| Employment (Omitted category: 0 years in 1991-97) | |||||
| Employed 1-2 years 1991-1997 | 0.0488 | -0.0218 | |||
| (0.0215)** | (0.0211) | ||||
| Employed 3-4 years 1991-1997 | 0.0964 | # | |||
| (0.0235)*** | |||||
| Employed 5+ years 1991-1997 | 0.1595 | 0.0779 | |||
| (0.0185)*** | (0.0141)*** | ||||
| Standard deviation of earnings 1991-97 (Omitted category: SD of earnings in top third | |||||
| SD of earnings in bottom third | -0.1172 | -0.1029 | |||
| (0.0137)*** | (0.0141)*** | ||||
| SD of earnings in middle third | -0.0659 | -0.0653 | |||
| (0.0136)*** | (0.0134)*** | ||||
| Number of jobs 1991-97 (Omitted category: 0 jobs in 1991-97) | |||||
| 1 job 1991-1997 | 0.1229 | 0.0329 | |||
| (0.0332)*** | (0.0303) | ||||
| 2 jobs 1991-1997 | 0.0921 | ||||
| (0.0315)*** | |||||
| 3-5 jobs 1991-1997 | 0.1331 | 0.0057 | |||
| (0.0264)*** | (0.0210) | ||||
| 6+ jobs 1991-1997 | 0.1437 | -0.0118 | |||
| (0.0264)*** | (0.0210) | ||||
| Observations | 1607 | 1607 | 606 | 1607 | 606 |
5.2 The Effect of Marriage
The previous analysis made it clear that past employment patterns are highly correlated with the future labor market success of single mothers. However, changes in marital status also are likely to affect single mothers labor market outcomes. While we are not able to measure ongoing changes in marital status throughout the full study period, we take advantage of a matched CPS/Decennial Census sample[26] to get a sense of the contribution of changes in family structure to changes in earnings and employment.
Although 2000 is a fairly early outcome period, some interesting developments are apparent from an examination of Table 5.2a, which compares the marital status of mothers who were single in the CPS survey year (either 1997 or 1998) to their status as reported in the 2000 Decennial Census. Over 20% of single mothers in the matched sample had married only two or three years later. Divorced and never-married single mothers appear equally likely to have married, with separation being the most unstable state, fairly equally divided among married, divorced, and still separated two to three years later.
| Marital status in CPS (1997 or 1998) | Marital status in 2000 Decennial Census | ||||
| Currently married | Widowed | Divorced | Separated | Never-married | |
| Source: Calculations based on the sample of single mothers in the 1997 and 1998 Annual Social and Economic Supplement of the CPS that matches to the 2000 Decennial Census. | |||||
| Widowed | 13.79% | 77.59% | 6.90% | 0% | 1.72% |
| Divorced | 22.10% | 1.62% | 71.16% | 2.96% | 2.16% |
| Separated | 30.77% | 2.10% | 30.07% | 32.17% | 4.90% |
| Never-married | 21.11% | 0.50% | 5.53% | 2.26% | 70.60% |
| All (N=970) | 22.47% | 5.77% | 34.33% | 6.80% | 30.62% |
Another way of examining the effect of marital status on labor market outcomes is to compare changes in personal and family income, earnings and employment intensities between the base year (1996 or 1997) and 1999 while also examining differences by marital status between the CPS survey year (1997 or 1998) and 2000.[27] These results are reported in Table 5.2b. The group of single mothers who by 2000 had married had similar earnings, income and employment characteristics in the base year as did those single mothers who remained single as of 2000. However, changes in marital status are clearly correlated with changes in economic status. Single mothers who subsequently got married had significantly lower employment intensities, and also tended to earn less and have lower personal income than single mothers who remained single. However, this is likely to be out of choice rather than necessity, since single mothers who subsequently married had substantially higher family incomes ($50,410 vs. $33,530) than single mothers who remained single.
| Marital status in 2000 | |||
| Married | Single | All | |
| *In 1998 dollars.Source: Calculations based on the sample of all single mothers in the 1997 and 1998 Annual Social and Economic Supplement of the CPS that matches to the 2000 Decennial Census. | |||
| Total personal earnings in base year | $12,510 | $12,490 | $12,500 |
| Total personal income in base year | $15,770 | $16,370 | $16,240 |
| Total family income in base year | $26,860 | $27,910 | $27,670 |
| Fraction employed in base year | 73% | 76% | 75% |
| Total personal earnings in 1999 | $14,590 | $15,550 | $15,330 |
| Total personal income in 1999 | $16,740 | $20,650 | $19,770 |
| Total family income in 1999 | $50,410 | $33,530 | $37,310 |
| Fraction employed in 1999 | 84% | 95% | 92% |
| Number of observations | 216 | 748 | 964 |
These results also highlight the importance of interpreting some of the previous results on the earnings and employment trajectories of the population with some care: marital status is not a fixed characteristic and, thus, some of the individuals with lower levels of personal employment and earnings in the outcome period may have married and as a result may have greater total family income relative to the base year.
6. Summary
As a group single mothers are disadvantaged in the labor market along several dimensions. In addition to combining work with being the sole provider for children, they have lower levels of educational attainment, a higher incidence of poverty and are less likely to be covered by health insurance than the broader population. Yet there is relatively little knowledge about how individual members of this disadvantaged group have fared in the labor market over time. Motivated by research suggesting some decreases in average earnings across cohorts of very low-income single mothers despite overall employment increases, this study has attempted to fill the research gap by analyzing the employment, earnings, and income dynamics of single mothers over time using matched cross-sectional survey data from the Current Population Survey and longitudinal earnings and employment administrative records available from the US Census Bureaus LEHD program.
A number of key findings emerged. The first set of findings is related to the historical experience of women who were single mothers in the survey year. Their earnings in the early 1990s, in contrast to the broader population, were stagnant. In addition, they had persistently lower rates of employment and, if employed, much higher job volatility than did the total population. In particular, low-income single mothers experienced high job turnover and joblessness throughout the historical period.
The second set of findings has to do with the relative position of single mothers, in terms of earnings, employment and job stability outcomes. Their position improved markedly subsequent to the base year. Low-income single mothers, in particular, experienced relatively rapid earnings growth and increased employment stability. Average earnings for this group, among those employed, were 43% higher five years after the base year. However, a more detailed analysis also suggests that these improvements were not experienced broadly and relatively large fractions of low-income single mothers continued to experience difficulties in the labor market in the years after the survey, such as low employment rates and/or low earnings. For instance, 50% of all low-income single mothers either were not employed or had earnings in the lowest earnings quintile throughout all five years in the outcome period.
The third set of findings is related to the factors that correlate with successful labor market outcomes for low-income single mothers. While basic demographic characteristics help to explain some of the observed differences in labor market outcomes, employment and earnings histories also are related to future outcomes. Even controlling for differences in demographic characteristics, individuals past employment and job mobility patterns are important factors correlated with the future likelihood of both getting jobs and moving up in the earnings distribution. In particular, for both single mothers and low-income single mothers, past employment experience of just one or two years was significantly related to more positive outcomes, though past work experience of five to six years helped even more. In addition, having held more jobs in the past generally increased both the likelihood of future employment and earnings growth for all single mothers, including those who were low income.
The novel data approach taken is a major contribution of this study; since many of the key findings about low-income single mothers labor market experiences presented would not be available without access to longitudinal employment and earnings records. Still, we recognize that there remain important limitations with these data in the context of fully understanding how single mothers fare in the labor market over time. For instance, changes in marital status and household composition are likely to be related to the labor market outcomes of single mothers over time. Based on a limited investigation of a small sample for which we have repeated measures on marital status it is clear that changes in marital status are correlated with subsequent earnings and employment patterns, but a fuller investigation of the effects of changes in household structure goes beyond the scope of our data and is left for future research.
[ Go to Contents ]
Appendix: The importance of the age of single mothers and their children
When comparing the results for different populations it is important to remember one of the distinctive features of the single-mothers in our study, namely that many are quite young and therefore have had only limited opportunities to accumulate experience in the labor market. Thus, part of the differences in earnings and employment patterns may be attributable to age effects rather than to any effects associated with being single mothers. To disentangle the effects we have created a synthetic population of all women that have been sampled such that the age distribution is identical to that of the single mothers in our study. Thus, comparing results for single mothers with this synthetic population of all women allows us to isolate better the effects associated with being a single mother, independent of any age effects.
Another potentially important feature of the single mother population is how the opportunity of single mothers to supply labor is related to the changing support burden of aging children. In particular, there are single mothers in our data who have children in the outcome period who are old enough to enter the labor market themselves. By analyzing separately single mothers who have children that are young in the base period and also in the outcome period we can, at least partially, quantify the importance of changes in the care and support burden of single mothers in explaining the relatively rapid earnings growth in the outcome period.
Table A1 presents comparisons of earnings, employment and number of jobs for single mothers, all mothers and the synthetic population of all mothers in the historical period corresponding to Table 4.2a in the main text. Similarly Table A2 presents the same comparisons in the outcome period corresponding to Table 4.2b in the main text. While it is immediately clear that differences in the age distribution of single mothers and all women contributed to the differences in results with respect to earnings and employment patterns, the effects associated with single mother status were still significant and qualitatively similar to the results in the main text.
| Mean earnings* | 90/10 ratio of earnings* | Mean number of jobs* | Share non-employed | |
| Panel A: Single mothers | ||||
| t-6 | $17,757 | 13.3 | 1.64 | 0.46 |
| t-5 | $16,016 | 13.7 | 1.65 | 0.43 |
| t-4 | $16,093 | 14.4 | 1.69 | 0.40 |
| t-3 | $16,004 | 13.5 | 1.76 | 0.36 |
| t-2 | $16,769 | 13.4 | 1.78 | 0.32 |
| t-1 | $16,710 | 11.3 | 1.82 | 0.28 |
| Base (t=0) | $17,592 | 10.3 | 1.84 | 0.23 |
| Panel B: All women | ||||
| t-6 | $19,869 | 12.8 | 1.51 | 0.33 |
| t-5 | $20,223 | 12.8 | 1.51 | 0.31 |
| t-4 | $20,474 | 12.6 | 1.53 | 0.30 |
| t-3 | $21,027 | 12.2 | 1.55 | 0.29 |
| t-2 | $21,314 | 11.8 | 1.55 | 0.28 |
| t-1 | $21,757 | 11.2 | 1.56 | 0.27 |
| Base (t=0) | $22,676 | 10.8 | 1.56 | 0.26 |
| Panel C: Synthetic population of all women with same age distribution as single mothers | ||||
| t-6 | $18,264 | 14.6 | 1.59 | 0.38 |
| t-5 | $18,510 | 14.1 | 1.60 | 0.35 |
| t-4 | $18,874 | 14.3 | 1.61 | 0.33 |
| t-3 | $18,988 | 14.6 | 1.66 | 0.30 |
| t-2 | $19,709 | 13.5 | 1.68 | 0.27 |
| t-1 | $20,129 | 12.1 | 1.68 | 0.25 |
| Base (t=0) | $21,126 | 11.7 | 1.67 | 0.23 |
| * Conditional on Earning At Least $1000Source: Calculations based on the Detailed Earnings Records for samples defined by the 1997 and 1998 Annual Social and Economic Supplement of the CPS and corresponding to the base year 1996 or 1997. | ||||
| Mean earnings* | 90/10 ratio of earnings* | Mean number of jobs* | Share non-employed | |
| Panel A: Single mothers | ||||
| Base (t=0) | $17,592 | 10.3 | 1.84 | 0.23 |
| t+1 | $18,409 | 9.3 | 1.82 | 0.22 |
| t+2 | $19,363 | 8.8 | 1.79 | 0.21 |
| t+3 | $20,052 | 9.1 | 1.73 | 0.21 |
| t+4 | $20,577 | 9.3 | 1.62 | 0.23 |
| t+5 | $21,384 | 9.3 | 1.55 | 0.26 |
| Panel B: All women | ||||
| Base (t=0) | $22,676 | 10.8 | 1.56 | 0.26 |
| t+1 | $23,616 | 10.2 | 1.54 | 0.27 |
| t+2 | $24,338 | 10.1 | 1.53 | 0.27 |
| t+3 | $25,095 | 10.3 | 1.50 | 0.28 |
| t+4 | $25,590 | 10.4 | 1.44 | 0.30 |
| t+5 | $25,951 | 10.6 | 1.40 | 0.32 |
| Panel C: Synthetic population of all women with same age distribution as single mothers | ||||
| Base (t=0) | $21,126 | 11.7 | 1.67 | 0.23 |
| t+1 | $22,006 | 10.6 | 1.67 | 0.22 |
| t+2 | $22,988 | 10.3 | 1.64 | 0.23 |
| t+3 | $23,726 | 10.7 | 1.60 | 0.24 |
| t+4 | $24,546 | 11.1 | 1.50 | 0.25 |
| t+5 | $24,805 | 10.4 | 1.44 | 0.26 |
| Panel D: Single mothers with at least one own child under 6 years old in the base period | ||||
| Base (t=0) | $14,685 | 11.7 | 1.95 | 0.29 |
| t+1 | $15,564 | 9.7 | 1.95 | 0.26 |
| t+2 | $16,435 | 9.6 | 1.90 | 0.23 |
| t+3 | $17,039 | 10.0 | 1.82 | 0.23 |
| t+4 | $17,632 | 10.0 | 1.71 | 0.25 |
| t+5 | $18,215 | 10.3 | 1.62 | 0.27 |
| * Conditional on Earning At Least $1000Source: Calculations based on the Detailed Earnings Records for populations defined by the 1997 and 1998 Annual Social and Economic Supplement of the CPS and corresponding to the base year 1996 or 1997. | ||||
Also in Table A2 (Panel D) we present data for single mothers who have at least one own child under the age of six years old present in the household in the base period: a group of women who have children that do not enter the labor market themselves in the outcome period. While this group had lower average earnings, more jobs and somewhat lower employment as compared to the broader single mother population, this group experienced even more rapid earnings growth than all single mothers (24% increase in mean earnings from the base period to the last outcome year compared to a 22% increase for all single mothers), suggesting that the effect of changes in the labor supply as a result of children no longer present in the household in the outcome period is not important for explaining earnings growth.
[ Go to Contents ]
Endnotes
[1] This survey is conducted by the Bureau of the Census for the Bureau of Labor Statistics. ASEC is a widely used source of detailed information on income and work experience as well as the demographic characteristics of the population of the United States. Sample respondents, who are chosen to be representative of the civilian non-institutional population, provide information about employment status, earnings, hours of work, and other labor market indicators.
[2] The income quintiles used in this study are based on the CPS family income thresholds. The approach adjusts income for family size, and has the effect that a larger family with the same family income would be ranked as being more disadvantaged than a smaller family with the same income.
[3] The DER is an extract from the SSAs Master Earnings File (MEF), and contains earnings information collected by the Internal Revenue Service (IRS) from individuals W-2 forms for all sectors. This earnings information includes annual data on total earnings, earnings covered by Social Security, taxable earnings, and tax-deferred contributions to retirement accounts for each job of every individual (i.e. for each worker-EIN combination for each year).
[4] It is important to note that although the CPS has cross-sectional weights to enable the sample to be weighted to represent the population in the survey years; similar weights cannot be constructed for the historical and future periods. The results described in the subsequent analysis, accordingly, are not necessarily representative.
[5] Individuals enrolled in school at the time of the survey are excluded from all samples.
[6] Of the 94,362 individuals in the full sample 48,629 are women, 7,279 are single mothers and 2,998 individuals are low-income single mothers.
[7] Part of this is due to the younger age distribution of single mothers relative to all women.
[8] We use administrative data from DER to consistently track earnings and employment over time. Note that the base-year earnings and employment estimates are slightly different from those based on survey data presented in Table 4.1b for reasons related to differences in exact definitions, timing and possible reporting errors in both data sources.
[9] Recall this is either 1990-1995 or 1991-1996, depending on the base year (1996 or 1997).
[10] Low-income single mothers cannot have very large earnings in the base year, since this would result in family incomes above the lowest two income quintiles. At the same time there are no such implicit restrictions on earnings before or after the base year. Thus, the earnings pattern of this group can partly be due to a regression-to-mean effect.
[11] For details on how this sample was constructed see the Appendix.
[12] Earnings are in 1998 dollars.
[13] Also regression-to-the-mean effects are likely to contribute to the relative success for those single mothers defined to have low incomes in the base period.
[14] More rapid earnings growth among single mothers could again potentially be an effect of age. The results in Appendix Table A2 indicate that even after adjusting for age differences single mothers experienced more rapid growth in earnings in the outcome period. Another potential explanation for relatively rapid earnings growth among single mothers is related to the aging of children in the outcome period, i.e. single mothers with relatively older children in the outcome period may experience more rapid earnings growth as a result of greater labor supply opportunities. In Appendix Table A2 we also analyze separately a group of single mothers with their own children under 6 years old in the household in the base year. While these women have lower average earnings, more jobs and somewhat higher rates of joblessness, this group experienced even more rapid earnings growth than the sample of all single mothers (24% increase compared to 22% for all single mothers).
[15] We choose earnings quintiles to categorize the earnings distributions. The earnings quintiles are defined by year based on earnings among all workers. In the calculation of the quintiles, we exclude those not employed and those earning less than $1,000 a year. It should be noted that these are quintiles of earnings from DER and not the same (household) income quintiles that we used to define the population of Low-Income Single Mothers.
[16] Quintiles are again defined based on earnings in the total adult sample.
[17] That low-income single mothers have earnings in the higher earnings quintiles and still have family incomes in the bottom two income quintiles can be the result of an unusual support burden in terms of family size. However, another possibility is due to discrepancies in earnings as reported in the CPS vis-à-vis the DER.
[18] Defined as being employed and having real annual earnings above the $1,000/year threshold in any year.
[19] Earnings in the different periods are defined as the average in each period (i.e. base year and outcome period) conditional on employment. Thus, if earnings are not defined for an individual the person is defined as non-employed in that period. Note that the earnings quintiles are defined based on the distribution of average earnings conditional on employment (or earnings above $1,000) in each period (i.e. base year and outcome period) for the general sample of adults.
[20] It should be noted that the sample in column 3 and 5 is smaller, since variation in earnings is only defined for those who are employed at least one year in the base and the historical period. Here we only report a subset of all specifications we have estimated. We have experimented with a large number of different measures of an individuals employment history and interactions that are not shown here.
[21] Note that younger single mothers and especially those with higher educational qualifications are more likely to be non-employed in the base year, possibly as a result of getting further training.
[22] This is not surprising since disability in the CPS is defined as a health problem or disability that impacts an individuals ability to work.
[23] As measured by more years of employment in the period 1991-1997.
[24] As measured by a high number of different jobs in the period 1991-1997.
[25] As noted earlier, there are substantial selection issues, in that prior employment histories may well be correlated with unobservable personal characteristics.
[26] We were able to match 970 single mothers from the CPS with the 2000 Decennial Census Long Form data.
[27] Marital status is measured at time of the Decennial Census interview (2000) and income and earnings are measured in the calendar year prior to the interview year (1999).
[ Go to Contents ]
7. References
Acs, Gregory, and Pamela Loprest, Initial Synthesis Report of the Findings from ASPEs Leavers Grants, Report for the Department of Health and Human Services, January 2001. http://aspe.hhs.gov/hsp/leavers99/synthesis01/
Ahituv, Avner and Robert Lerman, Job Turnover, Wage Rates, and Marital Stability: How Are They Related? The Urban Institute Research Report, 2004. http://www.urban.org/url.cfm?ID=411148
Andersson, Fredrik, Julia Lane, and Erika McEntarfer, Successful Transitions Out of Low-Wage Work for TANF Recipients: The Role of Employers, Coworkers and Location, Washington, D.C.: The Urban Institute, Report for the Department of Health and Human Services, April 2004.
Andersson, Fredrik, Harry Holzer and Julia Lane, Moving Up or Moving On: Workers, Firms and Advancement in the Low-Wage Labor Market, Sage Press, 2005.
Danziger, Sheldon H., L.J. Turner, and Kristin Seefeldt, "Failing the Transition from Welfare to Work: Women Chronically Disconnected from Employment and Cash Welfare," Social Science Quarterly, 2006, 87(2), pp. 227-249.
Blank, Rebecca, Evaluating Welfare Reform in the United States, Journal of Economic Literature, 2002, 15, pp. 1105-1166.
Brown, Clair, John Haltiwanger and Julia Lane, Economic Turbulence: Is a Volatile Economy good for America? University of Chicago Press, 2006.
Burtless, Gary, Welfare Recipients Job Skills and Employment Prospects, The Future of Children, Spring 1997, 7:1.
Coulton, Claudia, Younghee Lim, Thomas Cook, and Nina Lalich, Did Welfare Leavers Employment Levels and Job Characteristics Change During TANF Implementation? An Analysis Using SIPP 1996-2000, Joint Center for Poverty Research, JCPR Working Paper 342, December 2003.
Ellwood, David, Anti-Poverty Policy for Families in the Next Century: From Welfare to Work and Worries, Journal of Economic Perspectives, Winter 2000, 14:1, pp. 187-198.
Friedlander, Daniel, and Gary Burtless, Five Years After: The Long-Term Effects of Welfare-to-Work Programs, New York: Russell Sage Foundation, 1995.
Golan, Amos, Julia Lane and Erika McEntarfer, The Dynamics of Worker Reallocation: A Markov Approach, Economica, 2007, Vol. 74, No. 293, pp. 1-20.
Holzer, Harry and Karin Martinson, Can We Improve Job Retention and Advancement among Low-Income Working Parents? Institute for Research on Poverty Working Paper, September 2005.
Lerman, Robert, How Did the 2001 Recession Affect Single Mothers? Single Parents Earnings Monitor, The Urban Institute, 2005. http://www.urban.org/url.cfm?ID=311128
Manpower Demonstration ResearchCorporation, The National Evaluation of Welfare-to-Work Strategies: Final Report, New York, 2002.
Pavetti, LaDonna, How Much More Can They Work? Setting Realistic Expectations for Welfare Mothers, Washington, D.C.: The Urban Institute, July 1997.
Peterson, Janice, Xue Song, and Avis Jones-DeWeever, Life After Welfare Reform: Low-Income Single Parent Families, Pre- and Post-TANF, Institute for Womens Policy Research Publication #D446, 2002.
Primus, Wendell, Lynette Rawlings, Kathy Larin, and Kathryn Porter, The Initial Impacts of Welfare Reform on the Incomes of Single-Mother Families, Center on Budget and Policy Priorities, 1999.
Schoeni, Robert and Rebecca Blank, What Has Welfare Reform Accomplished? Impacts on Welfare Participation, Employment, Income, Poverty, and Family Structure, National Bureau of Economic Research Working Paper 7627, Cambridge MA: NBER, 2000.
Weber, Bruce, Mark Edwards and Greg Duncan, Single Mother Work and Poverty Under Welfare Reform: Are Policy Impacts Different In Rural Areas? National Poverty Center Working Paper #03-7, September 2003, University of Michigan.