
Determinants of Asset Building
By: Sondra Beverly, Michael Sherraden, Min Zhan, Trina R. Williams Shanks, and Yunju Nam Center for Social Development Washington University in St. Louis and Reid Cramer New America Foundation
March 2008
Project Home Page:Poor Finances: Assets and Low-Income Households
This report is available on the Internet at:http://aspe.hhs.gov/hsp/07/PoorFinances/determinants/
Printer Friendly Version in PDF format (104 pages)
Contents
Executive Summary (in PDF format - 6 pages)
Chapters:
- Introduction
- Theories of the Determinants of Asset Building
- Conceptual Framework for the Determinants of Asset Building
- Introduction
- Effects of Saving and Investment Action on Asset Accumulation
- Effects of Individual Constructs on Saving and Investment Action
- Effects of Institutional Constructs on Saving and Investment Action
- Effects of Intergenerational and Interhousehold Transfers on Investment Action and Asset Accumulation
- How Public Policy Shapes Saving- and Asset-Related Institutional Constructs
- Empirical Evidence on The Determinants of Asset Building
- Conclusions
Appendix (in PDF format - 10 pages)
Exhibits
Exhibit ES-1. Determinants of Saving and Investment Action and Asset Accumulation
Exhibit 1. Summary of Neoclassical Economic Theory Related to Saving and Asset Accumulation
Exhibit 2. Summary of Psychological and Sociological Theory Related to Saving and Asset Accumulation
Exhibit 3. Summary of Behavioral Economic Theory Related to Saving and Asset Accumulation
Exhibit 4. Summary of Institutional Theory Related to Saving and Asset Accumulation
Exhibit 5. Determinants of Saving and Investment Action and Asset Accumulation
Exhibit 6. Value of Select Asset-Building Tax Expenditures, Fiscal Year 2006
Exhibit 8. Distribution of Mortgage Interest Deduction Benefit, by Income Class (2003)
Acknowledgments
The report has benefited from comments of the entire project teams at the Urban Institute and the Center for Social Development, as well as helpful comments from Jeremías Alvarez, Alana Landey, Gretchen Lehman, and Linda Mellgren of ASPE, from Elizabeth Lower-Basch and Michael Wiseman formerly of ASPE, and from John Tambornino and Leonard Sternbach of the Administration for Children and Families/DHHS.
The authors, most of whom are affiliated with the Center for Social Development (CSD), are grateful to the university for indirect support that makes this work possible. This work is informed by a large body of previous work at CSD, involving many staff members on saving-related research projects. Although this work cites these reports and publications, it does not adequately convey the authors gratitude toward all who contributed to the thinking and empirical work that underlie this report.
CSDs research on saving has been funded by many organizations. For applied research contributing to this report, special acknowledgement is owed to the Ford Foundation, Charles Stewart Mott Foundation, Annie E. Casey Foundation, F.B. Heron Foundation, Ewing Marion Kauffman Foundation, and MetLife Foundation.
The authors primary affiliations are as follows: Beverly, School of Social Welfare at the University of Kansas; Sherraden, George Warren Brown School of Social Work at Washington University in St. Louis; Cramer, New America Foundation; Zhan, School of Social Work at the University of Illinois, Urbana-Champaign; and Shanks, School of Social Work at the University of Michigan.
Mark Schreiner contributed to this report in multiple ways. Jennifer Adhima, Eunhee Han, Jung Hee Han, Jennifer Kim, and Lin Zhang provided valuable research assistance.
[ Go to Contents ]
Introduction
Although research on the determinants of saving and asset accumulation is extensive, it remains inadequate for public policy purposes. Most existing theories of saving point to individual characteristics to explain low levels of wealth. Relatively few studies offer research that could inform policy for increasing wealth. This report examines the following question: What factors determine financial asset building? In particular, the report presents a conceptual framework for the determinants of saving and asset accumulation.
The goal is to develop a framework that explains saving and asset accumulation in ways that can inform policy decisions. Thus, the emphasis is both narrow and broad. It is narrow because of the focus on decisions and outcomes related to assets, not decisions and outcomes related to consumption, income, participation in means-tested programs, and liabilities. A broader conceptualization of the economic life of low-income households might also be useful, but is beyond the scope of this report. At the same time, the emphasis is broad because the report seeks to develop a framework that explains saving and asset accumulation across the entire population, while accounting for low levels of saving and wealth in the low-income population. The goal is not to develop theory that applies only to the poor because this theory would not support broad knowledge development and would not connect with larger bodies of work on saving and asset accumulation. That said, the report does give specific attention to three disadvantaged populations low-income households, minority households, and single-mother households.
The emphasis on assets does not imply that income- and consumption-oriented strategies are undesirable. Economic constraints are very real and probably go a long way toward explaining low saving rates and limited asset accumulation in low-income households. The optimal decision for some very low-income households may be not to save, because saving would require harmful reductions in consumption. Thus, programs and policies that increase incomes and provide important supports, especially health insurance, are critical for the economic well-being of families. Both income generation and asset building are essential in the economic lives of everyone, rich and poor alike. The series to which this report belongs focuses on assets because policymakers (and others) have generally undervalued the role of assets in the economic well-being of low-income families (see Sherraden 1991) and because much more could be done to support the asset-building efforts of low-income families through public policy.
This report is organized as follows: Section II summarizes existing theories of saving and asset accumulation and discusses strengths and limitations, with an emphasis on ability to explain asset building in low-income households. Section III presents the conceptual framework. When applicable, this section considers how the hypothesized relationships might differ substantially for low-income, minority, and/or single-mother households. Because the aim is to develop a conceptual framework that will be of use to policymakers, this section also presents additional conceptual points related to public policy. Section IV reviews empirical evidence that supports or challenges the proposed framework, noting where findings seem to differ for low-income, minority, and single-mother households. The report concludes in Section V with a summary of strengths and weakness of existing empirical evidence and possible directions for future research.
[ Go to Contents ]
Theories of the Determinants of Asset Building
This section summarizes and assesses existing concepts and theoretical models of the determinants of saving and asset accumulation. These theories, which are at various stages of development, may be classified into three categories: (1) neoclassical economic; (2) psychological and sociological; and (3) behavioral economic. Exhibits 1, 2, and 3 summarize these perspectives, emphasizing their abilities to explain low saving and asset accumulation in low-income households. The last column of each exhibit summarizes explanations for low saving and asset accumulation implied by each perspective. A fourth theoretical category emphasizes institutional determinants of saving and asset accumulation (see Exhibit 4), and is the approach adopted and developed here. This section describes this emerging theory in the context of the conceptual model presented below.
A. Neoclassical Economic Theory
Neoclassical economic theory assumes that individuals are rational beings who respond in predictable ways to changes in incentives. From this perspective, there are two broad determinants of individual behavior: opportunities (or constraints) and individual preferences (Pollak 1998). Preferences are generally assumed to be stable and exogenous (e.g., unaffected by opportunities and constraints). Many economic models also assume that individuals have perfect knowledge and access to perfect markets. Individual utility (i.e., happiness or satisfaction) is usually assumed to be a function of consumption, and economic models often treat savings as a residual, those resources that remain after consumption decisions are made.
The starting points for much neoclassical economic research on saving and asset accumulation have been the life cycle hypothesis (LCH) (Ando and Modigliani 1963; Modigliani and Ando 1957; Modigliani and Brumberg 1954) and the permanent income hypothesis (PIH) (Friedman 1957). Both of these theories assume that individuals and households are concerned about long-term consumption opportunities and therefore explain saving and consumption in terms of expected future income. These models assume that saving is a way to smooth consumption in the face of income fluctuations. Since consumption is determined by anticipated lifetime resources (rather than only current resources), saving over short periods of time (e.g., a year) is expected to reflect departures of current income from average lifetime resources. In other words, according to these theories, when current income falls below average expected lifetime income, saving decreases, and individuals and households may even borrow to finance consumption. When current income exceeds average expected lifetime resources, individuals and households save (or repay debt).
| Common Assumptions | Key Constructs | Explanations for Low Saving and Asset Accumulation |
|
|
|
As its name suggests, the life cycle hypothesis posits that consumption and saving reflect an individuals stage in the life cycle, which is generally proxied by age. Since retirement, for most people, is the most substantial and enduring income fluctuation, this model emphasizes saving for retirement as a primary motivation for deferred consumption. Young households are expected to have negative saving since they typically have relatively low earnings and incur debt for education, home purchase, and other expenses. In the middle period of the life cycle, saving is expected to be positive because individuals pay their debts and begin to save for retirement. Upon retirement, households are expected to dissave (i.e., spend money previously saved). Thus, differences in consumption and saving among households are believed to be partly the product of age differences, and the pattern of saving and dissaving creates an inverted U-shaped pattern across age categories and/or over time (Ando and Modigliani 1963; Modigliani and Ando 1957; Modigliani and Brumberg 1954).
In recent years, economists have extended the LCH and PIH. Some models consider the desire to leave a bequest (e.g., Hurd and Mundaca 1989; Menchik and David 1983). Buffer-stock models (e.g., Carroll 1997; Carroll and Samwick 1997; Deaton 1991) emphasize a precautionary motive for saving, particularly for younger households and for households facing greater income uncertainty. These households are expected to accumulate small stocks of assets (buffer stocks) to smooth consumption in the face of short-term income fluctuations and liquidity constraints. The pattern of asset accumulation predicted by buffer-stock models is very different than the inverted U-shape predicted by the LCH: Wealth is expected to remain fairly constant (assuming that households have accumulated and can maintain their optimal buffer stocks) until about age 50 when households begin saving for retirement (see Carroll and Samwick 1997, Figure 3). Other models, sometimes called augmented life cycle models, have attempted to incorporate the effects of public policy on precautionary saving motives (see Hubbard, Skinner, and Zeldes 1994; 1995, discussed in more detail below in Sections III.D and IV.D, under Incentives).
B. Psychological and Sociological Theory
Psychological and sociological theories of saving consider additional determinants of saving and asset accumulation, including personality characteristics, motives, aspirations, expectations, and peer and family influences. Some of the propositions emphasize the effects of relatively stable personality characteristics on asset building. Other psychological and sociological propositions assume that saving-related preferences and aspirations are not fixed and in fact seek to explain how motives, aspirations, and expectations are shaped. The propositions that emphasize relatively stable personality characteristics typically come from psychology. For example, psychologists have examined the effects of thrift, conscientiousness, emotional stability, autonomy, extraversion, agreeableness, inflexibility, and toughmindedness on saving (e.g., Nyhus and Webley 2001; Wärneryd 1996). The propositions that seek to explain how motives, aspirations, expectations, and even preferences are shaped come from both sociology and psychology. Some scholars have emphasized social norms, suggesting that the norm of conspicuous consumption leads people to over-spend (and thus to under-save). Some researchers consider the effects of families and peers. For example, Stack (1974) suggests that demands from social network members for money or other material assistance can sabotage efforts to save. And, the literature on financial socialization (e.g., Chiteji and Stafford 1999; Cohen 1994) suggests that social network members can strongly influence an individuals consumption patterns, saving-related beliefs, and aspirations and expectations for saving. For example, a child who knows that her family spends carefully and saves regularly, who overhears and perhaps participates in conversations about stock performance, and who is encouraged to have her own savings account is expected to be more financially sophisticated and more inclined to save as an adult than an individual raised in a family that does not save and does not make use of a variety of financial products.
| Key Assumptions | Key Constructs | Explanations for Low Saving and Asset Accumulation |
|
|
|
Other researchers have emphasized the effects of individual experiences. For example, Duesenberry (1949) wrote about personal norms, suggesting that individuals may strive to maintain past consumption levels even when income falls. Economic psychologists (e.g., Furnham 1985; Katona 1975) have proposed that past savings experiences (good and bad) shape individuals beliefs about their abilities to save in the future.
C. Behavioral Economic Theory[1]
The emerging behavioral theory of saving attempts to explain how people actually behave with regard to financial matters. Unlike neoclassical economic theory, these models do not assume that people are rational and all-knowing. As the title of an article by Thaler (2000) suggests, behavioral theory attempts to explain (and make assumptions that are consistent with) the behavior of Homo sapiens not Homo economicus. Behavioral theorists also assume that financial planning has significant nonfinancial costs.[2]
Behavioral theorists have identified a number of common human characteristics that shape financial behavior, including lack of self-control (people tend to place too much weight on current consumption relative to future consumption); limited cognitive abilities (for example, people do not always learn from their mistakes, and people tend to become overwhelmed by too many choices); inertia (people tend to continue doing what they are currently doing); the tendency to interpret default options as advice;[3] and the tendency to use mental accounting techniques.[4] Often, according to behavioral theory, these tendencies lead individuals to behave in ways that are inconsistent with their own priorities or inconsistent with maximizing long-term consumption. For example, the lack of self-control often causes people to over-spend and under-save, even when they are saving for a specific, much-desired goal. Also, limited intellectual capabilities and inertia lead people to postpone making financial decisions.
If people are aware of these tendencies, they may try to compensate for them. For example, people may attempt to control their spending by imposing precommitment constraints, such as arranging for direct deposit to saving and investment vehicles. Even if people are naïve about their limitations, saving and investment programs may facilitate saving by deliberately attempting to compensate for these common human characteristics. In fact, behavioral theorists have begun to propose some programmatic reforms and innovations such as simplified investment options and automatic enrollment in 401(k) plans.[5] These program reforms are institutional arrangements that will require an institutional theory for knowledge building that can inform policy and program design.
| Key Assumptions | Key Constructs | Explanations for Low Saving and Asset Accumulation |
|
|
|
D. Strengths and Weaknesses of the Existing Theoretical Work
In their current stages of development, none of the existing theories provides a suitable explanation for saving and asset accumulation in low-income households. Neoclassical economic models tend to be specified clearly and tested rigorously, and there is an extensive body of scholarly work. But these models tend to make unrealistic assumptions, such as the assumptions that individuals have near-perfect knowledge and are forward-thinking and rational. In reality, the decisions required to optimize consumption (and other financial goals) over the life course are extraordinarily complex (Bernheim and Scholz 1993, 87), and empirical studies suggest that the majority of Americans lack the financial sophistication and information to make even basic economic calculations (Bernheim 1994). Since low-income individuals may also have limited financial sophistication, they may have trouble making optimal long-term decisions regarding saving and consumption. Neoclassical models also assume that saving-related preferences are fixed. The lack of discussion about origins of preferences suggests that preferences are the product of stable personality characteristics. Thus, neoclassical economic models may implicitly blame individuals for low rates of saving and asset accumulation, and they may offer no policy pathway for improvement.
Psychological propositions that emphasize personality characteristics also blame individuals and have little to offer in the way of policy implications. Some of the propositions offered by psychologists and sociologists attend to the origins of preferences and aspirations and so are less likely to imply that individuals are solely responsible for limited asset accumulation. Relatively few of these propositions have been tested, however.
Behavioral theory is an important advance. This theory is rooted in neoclassical economic theory and tends to have the theoretical rigor of neoclassical models, but it makes more realistic assumptions about individuals (see Exhibit 3). These assumptions (which partly flow from systematic observation of individuals) might be thought of as psychological variables. Thus, behavioral theory complements and advances psychological as well as economic theories of saving.
The number of empirical studies examining behavioral propositions is growing rapidly. Although these studies largely examine the behavior of middle- and upper-income individuals who are eligible for retirement plans, most of these studies provide support for behavioral theory. The section on empirical evidence below provides a summary and assessment of several of these studies. Although behavioral theory appears to describe most individuals quite accurately, it sometimes emphasizes individual deficiencies. Theory could move beyond this focus on individuals to emphasize institutions that can encourage saving and asset accumulation by accounting for, and perhaps even taking advantage of, individual tendencies. The behavioral literature seems to be moving in this direction, and a merging of behavioral and institutional theory seems likely in the future.
[ Go to Contents ]
Conceptual Framework for the Determinants of Asset Building
A. Introduction
This section develops a conceptual framework to explain saving and asset accumulation in a way that can inform public policy. The framework is based on an institutional theory presented below, wherein both institutional and individual constructs affect saving and investment, which in turn lead to asset accumulation. Interhousehold sources of asset accumulation through inter vivos transfers and inheritances are also acknowledged but are not the focus of this discussion.
First, individual constructs,[6] including economic resources and needs, informal social support, financial literacy, and psychological variables, such as future orientation and saving-related attitudes are discussed. Next, institutional constructs, that is, characteristics of saving-related programs and policies that can shape saving-related behavior are discussed. The aim of this section is to offer a set of propositions with direct relevance to asset-building policy. The framework places less emphasis on individuals than the theories of saving and asset accumulation described above. However, individual constructs are relevant because individual choices can affect asset accumulation. In addition, knowledge of individuals can lead to the design of institutions that more effectively encourage saving and asset accumulation.
This emphasis on institutions warrants a careful explanation. In neoclassical economic theory, rational and omniscient individuals have preferences and then make decisions in the context of constraints. Behavioral economics modifies this theory by assuming that individuals are not usually all-knowing and rational and that preferences are not fixed. Essentially, behavioral economists are specifying new aspects of the individual for study. In this section, a similar approach to the other half of neoclassical theory is presented. This approach attempts to specify the vague area that individuals interact with, known as constraints, thus providing a richer, more detailed description of factors that individuals face when making choices.
In economic reasoning, individual preferences (neoclassical view) or cognitions and emotions (behavioral view) determine action. But it can work the other way around. Sometimes an institution will change the action of an individual, and then she changes her preferences. For example, participation in a 401(k) plan may result in asset accumulation that can change a participants time horizon and assessment of future possibilities. This is the opposite of standard economic understanding, which is that future orientation leads to saving. Both views are probably correct to some extent, that is, forward-looking cognition causes saving, and savings cause forward-looking cognition, a virtuous circle (Sherraden 1991; Yadama and Sherraden 1996).
The institutional theory presented here and behavioral economics can be viewed as different sides of the same coin. Institutions exist and, to some extent, act on their own, and people also respond to them with their saving behaviors. In extreme cases, the saving action is completely due to institutions, or completely due to individual characteristics, but most often it is due to the interplay between these. Thus, individual-level theory and institutional theory are not mutually exclusive, but indeed are complementary. In saving theory and research, however, more emphasis has been placed on individual variables than on institutional variables.
So what does the institutional theory presented here say about saving and asset accumulation? This theoretical perspective places primary emphasis on purposeful institutional arrangements that structure and support asset accumulation (see Exhibit 4). The discussion here builds on an emerging body of work at the Center for Social Development at Washington University in St. Louis. The focus on the role of institutions in saving by the poor was initiated by Sherraden (1991); detailed in Beverly and Sherraden (1999) and Schreiner et al. (2001); and extended in Schreiner and Sherraden (2007), Sherraden, Schreiner, and Beverly (2003), and Sherraden and Barr (2005).
| Key Assumptions | Key Constructs | Explanations for Low Saving and Asset Accumulation |
|
|
|
The term institutions refers to purposefully-created policies, programs, products, and services that shape opportunities, constraints, and consequences. In the social sciences, the term is often used much more broadly, but the focus here is narrowly on conditions that are put in place on purpose, as in a public policy. Institutions affect world views and thus actions because they shape constraints and consequences and expose people to knowledge of opportunities and choices. For example, laws against theft matter not only because people weigh the benefits and costs of theft but also because people due to limited time, effort, knowledge, and cognition often skip the benefit-cost calculus completely and instead assume from the mere existence of the law that the net benefits of theft are negative (Schreiner and Sherraden 2007).
From an institutional perspective, saving and asset accumulations are in large part the result of structured mechanisms involving explicit connections, rules, incentives, and subsidies (Sherraden 1991, 116). For the non-poor, these mechanisms include deductions for home mortgage interest and property taxes, exclusions for employment-sponsored pension contributions and earnings, tax deferments for Individual Retirement Accounts (IRAs) and Keogh Plans, and employer contributions and tax deferments for employee pension plans. Low- and moderate-income households, with little existing savings, do not have the same access or receive the same incentives from institutions that promote and subsidize asset accumulation (Howard 1997; Seidman 2001; Sherraden 1991). For example, the poor are less likely to own homes, and when they do own homes, they receive little or no subsidy because they have low or zero marginal tax rates and the tax benefits are not refundable.
Some of the institutions that influence saving include formal laws and regulations, financial enterprises, and financial products. From a neoclassical economic perspective, these institutions reduce the cost of saving. A behavioral economic perspective (e.g., Thaler 2000) would emphasize, in particular, that these institutions reduce the need for cognitive processing and self-control on the part of individuals. For example, when firms automatically deposit a portion of income into a retirement account unless the employee opts out, institutions may reduce transaction costs to close to zero and eliminate the need for cognitive processing. In this case, the institution is doing all of the choosing and acting, and the individual is essentially passive.
The major propositions of the conceptual framework are illustrated in Exhibit 5 and discussed in detail in the following subsections. Many of these propositions appear to be common sense, but it is useful to state them because a theory must be well-specified to be evaluated and tested. And, as the section on empirical evidence shows, some hypotheses that seem common sense have rarely been tested or have less empirical support than one might assume.
Exhibit 5. Determinants of Saving and Investment Action and Asset Accumulation
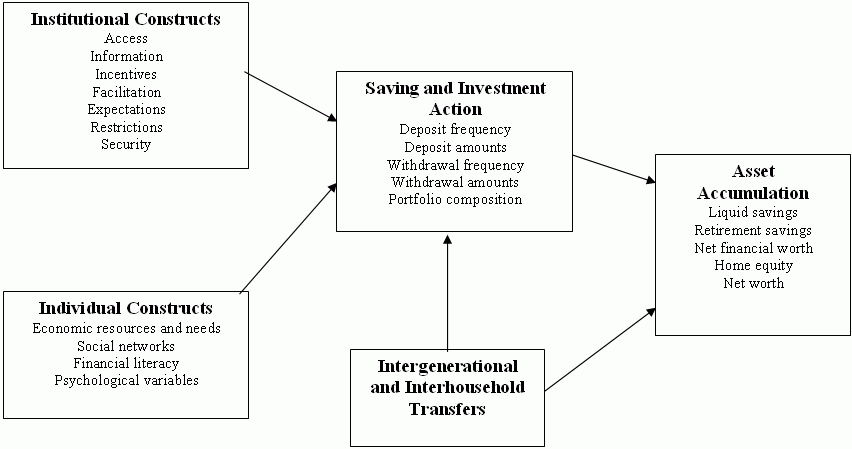
B. Effects of Saving and Investment Action on Asset Accumulation
Saving action and investment action appear to affect asset accumulation. Saving action refers to decisions and behaviors[7] that influence the amount of money or other resources held aside as savings (i.e., not consumed). Saving action includes deposit frequency and deposit amounts. It also includes variables related to dissaving, such as withdrawal frequency and withdrawal amounts, because asset accumulation occurs only when individuals protect their savings (Beverly, Moore, and Schreiner 2003). Investment action refers to decisions and behaviors that influence where savings are kept, that is, portfolio composition. Portfolios may include informal saving vehicles (e.g., cash kept at home and savings held by a trusted family member), as well as formal vehicles. Measures of portfolio composition might include dichotomous variables indicating whether or not a household owns various assets (or has money stored in various informal ways) and percentage of total assets held in each of these.
The conceptual framework presented here focuses on simple measures of asset accumulation, such as net worth, net financial worth, and levels of liquid savings, home equity, and retirement savings.[8] The link between saving and investment action and asset accumulation is described in the following simple propositions: (1) deposit patterns affect asset accumulation, (2) withdrawal patterns affect asset accumulation, and (3) portfolio composition affects asset accumulation. The first two propositions are essentially truisms. The third proposition refers, of course, to the fact that some assets have greater returns than others. This proposition is stated very broadly and has nearly universal acceptance in this form. A more specific and controversial subquestion whether homeownership increases the asset levels of low-income households is the focus here. This question is particularly relevant because home equity tends to be the primary asset for low-income households with assets and because despite the fact that homeownership is key component of the American Dream there are reasons that low-income, minority, and single-mother households might receive below-average, and even negative, rates of return on housing.
Rates of return on housing are strongly influenced by location and timing of purchase and sale. The supply of and demand for housing vary dramatically by neighborhood, and these affect prices. In addition, real estate markets tend to be cyclical, and rates of return are strongly influenced by whether home prices were inflated at the time of purchase and sale. Because residential neighborhoods are highly segregated by race and class, location is a particularly salient variable for the subgroups of interest. Put simply, the homes that low-income families can afford to purchase tend to be in less desirable neighborhoods. As a result of racial and ethnic segregation, minorities tend to have access to even fewer neighborhoods. This spatial concentration may weaken housing markets in these areas, resulting in lower returns (Gyourko, Linneman, and Wachter 1999). Stuart (2003) extends this argument, claiming that current mortgage practices tend to concentrate people with poor credit in particular neighborhoods. Weakened housing markets lead to lower returns and limited opportunities to sell if families experience financial trouble. As a result, he argues, families are more vulnerable to default and foreclosure.
Stuarts (2003) emphasis on mortgage default calls attention to issues of timing. Presumably, low-income households are more likely than others to experience financial crises that create pressure for them to sell their homes. In these cases, households cannot consider whether market conditions are favorable for sellers in their neighborhoods. Low-income households may therefore be more likely to sell at a loss. A final factor that may reduce rates of return for low-income households is difficulty maintaining homes. When financial strains make it hard for families to make repairs, returns to housing are likely to be much lower.
C. Effects of Individual Constructs on Saving and Investment Action
This section explores several individual constructs expected to shape saving and investment action: economic resources and needs, informal social support, financial literacy, and psychological variables.
Economic Resources and Needs
As noted in the introduction to this report, economic resources and needs appear to be important predictors of saving and investment action. By definition, low-income individuals have limited financial in-flows, so they have less extra money to save. It is also difficult for low-income individuals to finance saving by reducing consumption because reductions in consumption are more costly when consumption is near subsistence level. At the most fundamental level, therefore, low income is a persistent obstacle to saving.
Some specific expenses, however, such as medical expenses, vehicle expenses, and debt payments, probably depress saving in many low-income households. Of course there are other large expenses, such as rent or mortgage payments and, for families with children, child care expenses. And because people move money around within their household budgets, it is probably impossible to say with certainty that a specific expense reduces saving. These three expense categories are the focus here because there is evidence that some low-income families believe these specific expenses create financial hardship and make it difficult to save or maintain assets. As noted in Section IV, however, there is little quantitative research directly linking these specific expenses to saving outcomes.
The first expense category that may be an obstacle to saving is medical expenses, which are heavily influenced by health insurance coverage. Families without health insurance may incur large health expenses, especially when a family member has a chronic condition or experiences a serious acute illness or injury. Even those who have insurance may have large medical expenses if their insurance premiums are not subsidized by an employer or by federal and state governments. Thus, lack of access to subsidized health insurance is probably a barrier to saving and asset holding, although there appears to be little empirical literature on this topic.
Descriptive studies do show that the number of uninsured Americans is rising, that medical expenses are growing and are burdensome for many families, and that low-income and minority families are especially at risk. For example, Census data reveal that almost 16 percent of Americans were uninsured in 2005 and that this percentage has been rising (DeNavas-Walt et al 2006). More than 24 percent of low-income individuals (people with incomes below $25,000), almost 20 percent of African Americans, and almost 33 percent of Hispanics were uninsured in 2005.[9] According to the Kaiser Family Foundation and Health Research and Educational Trusts Survey of Employer-Sponsored Health Benefits (2004), health insurance premiums rose almost five times faster (59 percent growth rate) than average earnings (12 percent growth rate) between 2000 and 2004. Merlis, Gould, and Mahato (2006) found that 23 percent of families had high health care costs (including insurance premiums, deductibles, co-payments, and other direct costs not covered by insurance) relative to their income over the period of 2001-02.[10]
A second potential obstacle to saving is expenses incurred when vehicles break down (i.e., expenses for car repair and purchase). Empirical evidence regarding the magnitude of these expenses is difficult to find, but it is common knowledge that low-income families tend to drive older, more problem-prone vehicles. Expenses related to vehicle breakdown are probably smaller, over the course of a year, than the other expenses discussed here, but they are mentioned fairly frequently in qualitative studies of low-income families (see below), perhaps because they are irregular and somewhat unpredictable and because families do not budget for them.
The third financial obstacle to saving is partly related to these other two monthly debt payments, including payments for credit card debt and medical debt. One indicator of problematic debt burden is having total debt payments greater than 40 percent of income. According to data from the Survey of Consumer Finances (SCF), 27 percent of families in the lowest quintile of annual income met this criterion in 2001. This was 2.5 times higher than the figure for all U.S. families (11 percent) (Aizcorbe, Kennickell, and Moore 2003). Another indicator of debt repayment problems is making late debt payments. Data from the 2001 SCF show that 13 percent of debtors in the lowest income quintile were sixty or more days late with at least one loan payment in the previous year, a slight increase from 1998. In the overall U.S. population, seven percent of families were late in making debt payments (Aizcorbe, Kennickell, and Moore 2003). These findings suggest that many low-income households are over-burdened with debt. It may be in a households best interest to pay down debt before attempting to accumulate savings, and reducing debt increases net worth, but debt obligations can nonetheless depress saving, including deposits to incentivized accounts.
As Sherraden, McBride, et al. (2005) have noted, households accrue debt in a variety of ways. Some are in debt because of unwise financial decisions, but many accumulate debt gradually because their incomes never quite cover necessary expenses. Others become burdened by debt due to crises, such as health problems, divorce, or job loss. One study of about 1,800 people who filed for personal bankruptcy in 2001 finds that almost half of the bankruptcies may have been due to medical causes (Himmelstein, Warren, Thorne, and Woolhandler 2005).[11]
On average, minority and single-mother households have substantially lower incomes than white households (DeNavas-Walt et al 2006), so, all else equal, they are particularly likely to have trouble saving due to limited economic resources. There are additional economic barriers for single-mother households (regardless of race or ethnicity). A large number of single-mother households do not receive child support; even when they do, they may still struggle to cover basic expenses. By definition, these households have children, and if mothers are employed, the family may have to pay for child care. One study examines the burden of child care expenses for employed mothers with children under age 14. The ratio of weekly child care expenses to monthly household income was 10 percent for never-married mothers and 12 percent for ever-married mothers, compared to 6 percent for currently-married mothers (U.S. Census Bureau 1999). Another Census Bureau report (U.S. Census Bureau 2004) shows that single-mother families are less likely than married-couple families to have health insurance, even though they tend to have poorer physical and mental health (Altman and Taylor 2004). Therefore, single mothers may have higher medical expenses, relative to income, than others. Other studies show that single-parent households are more likely than married-couple households to experience material hardship (e.g., Lerman 2002).
Informal Social Support
The second individual construct identified here is informal support from social network members. Section III.E Intergenerational and Interhousehold Transfers discusses transfers of money, such as assistance with a down payment on a home. Here, the focus is on less-tangible support, that is, the degree to which social network members encourage or hinder efforts to save and maintain assets. It is likely that informal social support affects saving action. For example, encouragement, positive reinforcement, and reminders to save are likely to send the message that saving is desirable and to make saving easier. Social network members may discourage saving by sending the message that extra income should be shared with others. This second hypothesis flows from a ground-breaking ethnographic study by Stack (1974), showing that frequent demands from social network members make it difficult for blacks to accumulate assets. For cultural reasons, the pressure to share savings with others may be stronger for black families than for white families.[12] The pressure may also be stronger for low-income families of any race, who are more likely than middle- and upper-income families to have social network members who are struggling to meet basic expenses.
Financial Literacy
The third individual construct is financial literacy, including both knowledge and skills. Financial literacy likely affects saving and investment action. It seems common sense that people will save more and make better investment decisions when they know how much money is needed to achieve a certain goal, understand compound interest, know how to create a budget, are familiar with saving strategies, understand the trade-off between risk and return, recognize predatory lending practices, and so forth. In fact, the belief that financial literacy affects saving and investment is the fundamental premise of financial education initiatives. The relationship may be weaker than many would assume, however. Financial knowledge may have fairly strong effects on intended behavior, but intentions often do not directly translate into action. The direction of causality is also ambiguous. Following recommended financial practices may lead to increased financial literacy, rather than the reverse. For example, accumulating wealth may motivate people to obtain financial knowledge so that they can better manage their assets (Kotlikoff and Bernheim 2001). Finally, a third variable, such as motivation or future orientation, might influence both financial literacy and financial behavior.
Psychological Variables
Economists and others have long assumed that personality characteristics and attitudinal variables affect saving and asset accumulation. This report hypothesizes that three psychological variables future orientation, motives for saving, and perceived ability to save affect saving and investment action. It is not that these are the only important psychological variables or even the most important ones, but these hypotheses help to illustrate how psychology might affect asset building. Economists, economic psychologists, and other psychologists have done some important theoretical and empirical work in this area, and there is room for more.
Future Orientation
Future orientation is defined here as a willingness to invest in ones future, even when one must postpone pleasure. In different disciplines, future orientation goes by many names. Neoclassical economists have referred to the rate of time preference. This is defined as the ratio of the utility of a current dollar and the utility of a dollar delayed one year. People with a high rate of time preference are impatient; they require a large compensation to postpone a reward. More recently, behavioral economists have discussed self control.
As noted above, the rapidly growing literature in behavioral economics assumes and/or suggests that many if not most people have trouble postponing pleasant experiences. One implication, of course, is that people have trouble saving because saving requires them to postpone consumption, and numerous theoretical articles have suggested that self-control problems lead to under-saving (e.g., Laibson 1997; O'Donoghue and Rabin 1999; Strotz 1956). Consistent with this literature, this report presents the hypothesis that future orientation shapes saving action, that is, that patient people deposit more and withdraw less.[13]
Motives for Saving
The notion of saving motives encompasses two phenomena: how important saving is to an individual and the goal or purpose of savings.[14] This report offers the hypothesis that those with salient and specific saving motives are more likely to save. Neoclassical economists typically emphasize four motives for saving: (1) maintaining consumption during retirement; (2) preparing for income shocks and other emergencies (precautionary saving); (3) transferring wealth to future generations (bequest motive); and (4) purchasing big ticket items such as consumer durables, education, or a vacation (target saving). The first three are expected to influence long-term saving, and the fourth to affect short- to medium-term saving and dissaving (Sturm 1983).
Perceived Ability to Save
In addition to future orientation and motives for saving, aspirations and expectations of success are likely to affect saving action.[15] This report predicts that those who expect saving attempts to be successful are more likely to save (e.g., more likely to deposit, more likely to enroll in saving programs, and so forth). Conversely, those who expect their saving attempts to be unsuccessful are less likely to save.
In part, individual saving-related aspirations and expectations are likely to be determined by past experiences, including past asset-accumulation experiences. According to aspirations theory (Lewin, Dembo, Festinger, and Sears 1944), an individuals aspirations are raised (lowered) according to her success (failure) in achieving them. Applying this proposition to economic behavior, Katona (1975) suggests that an individual who makes progress toward a savings goal is more likely to raise that goal. Conversely, those whose saving attempts are unsuccessful are likely to lower their saving aspirations. If these propositions are true, then there is a potential virtuous circle (people who save and accumulate assets become more confident in their saving ability and so save more) and a potential vicious circle (people who fail in their attempts to save lose confidence in their ability to save and so are less likely to try to save in the future). If low-income families have had limited success with saving in the past, these propositions suggest that they may not even attempt to save money. At the very least, they are likely to set lower savings goals. The experiences of social network members may also be important. If an individual has rarely seen someone else achieve a savings goal, she may not believe that she can be successful. Conversely, if she has seen others save successfully, she is probably more likely to believe that saving is feasible.
D. Effects of Institutional Constructs on Saving and Investment Action
Seven institutional constructs are the heart of the conceptual framework offered here. These constructs appear to be important aspects of institutions designed to promote saving and asset accumulation. This particular formulation of an institutional framework is created with an eye toward application, that is, each of the constructs has direct policy relevance. The constructs are: (1) access; (2) information; (3) incentives; (4) facilitation; (5) expectations; (6) restrictions; and (7) security. These seven constructs have emerged from research on individual development accounts (IDAs).[16] As Exhibit 5 shows, the focus is on effects of these constructs on saving and investment action. In other words, it is suggested that the effects of institutional constructs on asset accumulation are largely indirect, through saving and investment action. There are important exceptions. For example, incentives and security almost certainly have strong direct effects on asset accumulation, perhaps moderating the relationship between portfolio choices and asset accumulation.[17] These relationships should be specified and examined in light of empirical evidence. To keep the framework simple, however, the focus here is on the effects of institutional constructs on saving and investment action.
Access
This report hypothesizes that access affects saving and investment action. Access refers to eligibility and practicality. As discussed below, many U.S. households are not eligible for programs and policies that encourage asset building for example, a large portion of the population does not have access to a pension plan in the workplace and eligibility varies substantially by race and class. Regarding practicality, distance is a major barrier to financial services and other markets in rural areas. Even though markets may exist at a distance, transaction costs in reaching them can make them unavailable. In these circumstances, it is not fully informative to interpret saving and asset accumulation outcomes as resulting solely from individual characteristics and choices; some people have greater access than others.
Information
This report posits that financial information shapes saving and investment action. This information may be general (e.g., basic information about the need for retirement savings, about the trade-off between risk and return, or about the advantages and disadvantages of different types of products); it may also be specific to a particular financial product or program. For example, to participate successfully in a traditional IRA, a person must know that an IRA is available and that she is eligible. She must also know how to choose an appropriate investment, how to make contributions, how to receive the tax deduction, and, later, how to make withdrawals. Some individuals (probably those who are more educated and more comfortable with financial matters) will seek out this type of information, but many will not obtain information unless it is delivered to them in an accessible format.
Incentives
This report proposes that incentives and disincentives shape saving and investment action. Incentives come in at least three forms: nonfinancial rewards, subsidies, and rates of return. Nonfinancial rewards may include peer relationships, status, or opportunities to learn. The report focuses on financial incentives because it appears that, overall, financial incentives tend to be more important than nonfinancial incentives.[18]
Subsidies are direct or indirect payments to those who save in particular saving plans or hold particular kinds of wealth. Often these subsidies directly increase wealth, as in the case of matching contributions for deposits into 401(k)s and IDAs (unless people save less in other forms to offset these subsidies). Other times, these subsidies are not deposited into saving vehicles, so recipients may choose whether or not to save them. For example, tax benefits associated with homeownership and IRA contributions reduce tax liability but do not directly increase home equity or IRA savings. Schreiner and Sherraden (2007) argue that matches in IDAs may encourage saving by low-income people for at least three reasons. First, of course, matches increase the reward to saving and may help compensate for the sacrifice required to defer consumption. Second, matches may motivate people to save by translating a given level of saving into a stock of wealth that is large enough to use for a major asset, such as a house or a college education. Third, the match may be the program feature that catches a participants eye and motivates him to enroll in the first place. The first characteristic of matches may be somewhat less relevant to high-income people than to low-income people because deferring consumption is less painful for those with higher levels of consumption. The second characteristic might also be less relevant to high-income people[19] and/or to those considering contributions to 401(k)s, for example, rather than IDAs.
Rates of return are also incentives. The fact that investors seek the highest possible rate of return for a given level of risk provides some evidence that financial incentives shape financial decisions. To consider this proposition more carefully, however, one must ask whether incentives affect: (1) participation in a particular saving plan or program, (2) levels of contribution to the plan or program, (3) and overall (net) saving. The effect of financial incentives on net saving is the subject of much debate. According to economic theory, an increase in the rate of return will not necessarily increase saving for two reasons. First, changes in the rate of return on savings may simply result in the reshuffling of the form of assets, with no new saving. Second, for net savers, an increase in the after-tax rate of return has two contradictory effects. Individuals may choose to save more because the price of current consumption increases relative to the price of future consumption (the substitution effect). On the other hand, with higher rates of return, individuals can save less and still enjoy the same amount of future consumption (the fixed-goal effect, according to Schreiner and Sherraden 2007).
Common disincentives for saving are unattractive or even negative rates of return, often due to inflation, high fees, and/or investment risk. Reasons that low-income, minority, and single-mother households might receive lower rates of return on owner-occupied housing have been mentioned earlier. Other types of disincentives reduce the need for or even the desirability of assets. Means-tested income transfer programs, such as Temporary Assistance for Needy Families (TANF), Food Stamps, and Supplemental Security Income, are expected to create saving disincentives for two reasons: (1) they provide a certain level of income at the time of economic emergencies; and (2) they have restrictive asset means tests (Hubbard, Skinner, and Zeldes 1995; Ziliak 2003). The first phenomenon is often called the consumption-floor effect. Because income transfer programs guarantee a minimum level of income (to some), they create consumption floors. These consumption floors are expected to reduce the precautionary saving motive (the perceived need to save in preparation for sudden economic losses) and are therefore expected to lower saving rates in general. Asset means tests are expected to discourage the accumulation of financial assets because households must spend down or keep their financial assets below asset limits in order to be eligible for transfer benefits. Presumably, asset means tests affect those who are likely to participate in these programs as well as those who are currently receiving benefits (Hubbard, Skinner, and Zeldes 1995; Neumark and Powers 1998). [20] These disincentives, then, are relevant to low-income households (by definition the only households eligible for these programs) and to minority and single-mother households (because they are more likely than non-Hispanic whites and married couples to participate in these programs).
Facilitation
This report posits that facilitation shapes saving and investment action. Facilitation refers to any form of assistance in saving, especially making saving automatic. Common examples are automatic payroll deduction and automatic transfers into saving products. Usually, people must arrange for automatic transfers, but after signing up, they no longer have to make conscious decisions to save. In agreement with other research (Beverly, Moore, and Schreiner 2003; Maital and Maital 1994; Shefrin and Thaler 1988), this report posits that these precommitment constraints increase deposits because funds for saving are never in hand and are therefore much less likely to trigger spending temptations.
Another type of facilitation involves automatic enrollment into a savings plan. For example, employees in a particular firm might be automatically enrolled in the companys 401(k) plan, with a default investment option, unless they actively opt out or choose a different investment option. (These plans are often called opt-out plans.) Automatic enrollment is likely to shape saving and investment action because, as behavioral theory suggests, people often postpone financial decisions and remain with the status quo.
A third and perhaps surprising source of facilitation is the federal income tax system. Many households especially low- and moderate-income households receive sizeable federal tax refunds.[21] Building on the notion of mental accounting, Thaler and others have argued that people are more likely to save irregular income than regular wage and salary income, especially when the irregular in-flows are large (see Shefrin and Thaler 1992; Thaler 1990). This proposition implies that people are more likely to save out of tax refunds than out of wage and salary income, especially when refunds are large. Thus, by providing sizeable refunds to many households (through the Earned Income Tax Credit and Child Tax Credit, for example), the income tax system may shape saving action.
Expectations
Expectations are implicit or explicit suggestions about desired saving, investment, or asset accumulation. They are embodied in institutional features such as match caps (amount of money that earns matching deposits), saving targets, and social pressure of peers and staff of saving programs. For example, the fact that up to $4,000 in contributions to a traditional IRA is tax deductible may set up an expectation that individuals save $4,000 a year for retirement. This report hypothesizes that people respond to these implicit and explicit expectations, that expectations shape saving and investment action.
Restrictions
Restrictions are prohibitions, rules that restrict access to or use of assets. Most subsidized saving policies have restrictions. For example, money in 529 college savings plans must be used for college education, and 401(k) savings are not available until retirement.[22] This report hypothesizes that restrictions shape saving action, specifically by helping people resist temptations to spend savings. This hypothesis is consistent with a growing literature in behavioral economics about self-control problems and the tendency to over-spend (e.g., Laibson 1997; Thaler and Shefrin 1981; Thaler 1994). In addition, the fact that people deposit money in simple restricted accounts (such as Christmas club accounts) that do not provide higher interest rates than basic savings accounts suggests that some people believe restrictions help them accumulate savings.
Of course, for every individual who makes use of a restricted account, there may be others who desire liquidity. In this case, there is a need for a variety of saving products. If no unrestricted accounts are available, then restrictions might actually decrease saving because some people will choose not to put any money in restricted accounts.
Security
Security refers to freedom from unreasonable risk in saving and asset holding. All households need a safe place to put their money. Therefore, it seems probable that security shapes saving and investment action, specifically that people are more likely to deposit, less likely to withdraw, and more likely to have a diverse portfolio when they can participate in a variety of secure saving policies, programs, and products. Security can be considered at two levels: micro and macro. Micro security refers to protection from risks of lost assets for a particular household and in the shorter-term. Macro security refers to protection from risks for the political economy as a whole and in the longer-term.
Micro security includes both risk of property loss and investment risk. Property loss risk refers to threats of misplacement, theft, and destruction (e.g., through catastrophes such as fire or flood). For most middle- and upper-income savers in the United States, security from property-loss risk of savings is taken for granted with deposits into a financial institution. Not everyone in the world has ready access to and trust in such institutions, however. Where such access and trust cannot be taken for granted, (lack of) security may be the dominant institutional construct in explaining saving action and savings outcomes.
At the micro level, a second type of risk is investment risk. The topic of investment risk is well-developed in microeconomics, usually in relation to rates of return. It is commonly understood that, in competitive markets, riskier investment options, over time, can offer higher rates of return. Therefore, some degree of investment risk is desirable for asset accumulation over the long term, and security from this risk can have negative consequences.
Discussion of security would not be complete without also mentioning macro risks to which all asset accumulations are vulnerable. Macro risks have to do with the competence and integrity of the political system, integrity of the financial markets, and management of the macro economy. Whenever assets accumulate, as in a defined contribution retirement plan, these assets may be subject to depletion through mismanagement or corruption. Fortunately, the United States has exceptionally strong, efficient, and transparent financial markets, so macro risks in financial markets are relatively limited. Fiscal and monetary policies greatly affect investment returns. Indeed, inflation risk is often the single greatest threat to long-term asset accumulation.
E. Effects of Intergenerational and Interhousehold Transfers on Investment Action and Asset Accumulation
In addition to individual and institutional constructs, the conceptual framework proposed in this report suggests that intergenerational and interhousehold transfers shape asset building. In particular, this report posits that interhousehold transfers affect investment action (the mix of assets held) and asset accumulation. Transfers take a variety of forms. They may involve living people (inter vivos transfers), or they may occur at death (bequests). They may consist of money, material assistance, or time. Transfers may be consumed or saved. Transfers that are saved increase the recipients wealth. Even transfers that are consumed can indirectly facilitate asset accumulation. For example, parental assistance with educational expenses can allow a young adult to graduate from college with little or no debt. The absence of debt in turn makes it easier for the graduate to save and makes her more attractive to mortgage lenders (Shapiro 2004).
One common phenomenon is for parents or other family members to give money to young adults for a down payment on a first home. This down-payment assistance may make homeownership possible for some families. In all likelihood, it reduces the recipients monthly mortgage payment by reducing the mortgage amount and perhaps by eliminating private mortgage insurance and so frees up money for saving (Shapiro 2004). And when down-payment assistance allows families to purchase homes in neighborhoods that they otherwise could not afford, it can improve their neighborhood environments, their social standing, and their childrens educational opportunities. Shapiro argues that these transfers can have lasting effects: These head-start assets set up different starting lines, establish different rules for success, fix different rewards for accomplishments, and ultimately perpetuate inequality (p. 3). As discussed below, low-income families are less likely to receive substantial down-payment assistance.
Another phenomenon is worth mentioning here: The availability of financial help from others may reduce saving for some individuals. For example, individuals who believe that family members will provide money in the event of job loss might be less motivated to accumulate precautionary savings. And those who expect a large bequest or substantial down-payment assistance may save less for retirement or homeownership. On the whole, it seems likely that bequests and inter vivos transfers increase the wealth of recipients, but more empirical evidence on this topic is needed.
F. How Public Policy Shapes Saving- and Asset-Related Institutional Constructs
The goal of this report is to develop a conceptual framework of relevance for public policy. Therefore, this section describes how public policy currently shapes institutional constructs, illustrating how institutional supports for saving tend to be delivered in bundles. This section also describes existing federal asset-related programs and policies that are targeted to low-income households.[23]
Bundles of Institutional Constructs
Applied social theory and research is complicated by many real world factors, one of which is bundling of multiple constructs within a single policy, program, or other intervention. Seldom does an intervention represent a single theoretical construct. In asset-based policies, for example, the constructs discussed above access, information, incentives, facilitation, expectations, restrictions, security and perhaps others, rarely appear alone, but instead are usually bundled together in some form.
The challenges for researchers are to (1) identify the constructs that may be present; (2) develop measures for each of them; (3) assess each construct in an applied setting; and (4) employ analytical procedures to sort out which constructs may be causing the outcome(s) of interest. In quantitative research, a typical approach would be to use multiple regression, controlling for many individual and program characteristics, to assess which factors predict an outcome such that the results are statistically significant and effect sizes are large enough to matter for program or policy purposes.
An analytical step beyond this would be to test for interaction effects among constructs of interest. It could be, for example, that information and expectations both independently predict a savings outcome, but have even greater predictive power when they occur together. Or it could be that incentives are not predictive in and of themselves, but the interaction of incentives with access has a strong effect. Testing interactions is one pathway for beginning to understand effectiveness of various bundles of constructs that may be represented in a policy or program.
It seems likely that bundles of constructs for saving action tend to come in common forms. For example, there may be a form that provides mostly security in a rainy day fund (e.g., a passbook savings account in the private sector). Other forms may have strong elements of incentives, facilitation, expectations, and restrictions designed for long-term asset accumulation (e.g., a 401(k) retirement savings plan). Thus, some bundles may be better for particular purposes. If inclusive (universal and progressive) asset accumulation is the goal, structured saving plans that represent large bundles of key constructs are likely to be the most effective policy package (Clancy and Sherraden 2003; Clancy, Orszag, and Sherraden 2004; Sherraden 2005). Current examples of savings plans all of which are created by public policy include 401(k) plans in the private sector, 403(b) plans in the non-profit sector, the Thrift Savings Plan for federal employees, and 529 plans.
Currently, asset-building bundles tend to be delivered through employment settings and through the tax system. Federal expenditures on the initiatives that provide these bundles of supports are large (see Exhibit 6). For the most part, those who have jobs with benefits, those who are homeowners, and those who are investors have access to these bundles. The next three subsections present the major bundles of institutional supports and show that low-income, minority, and single-mother households have less access to these bundles than others.
Bundles of Institutional Supports Provided through Employment.
The primary institutional supports delivered through employment settings come through retirement benefits, both defined benefit (DB) and defined contribution (DC) plans. These retirement plans support asset building in several ways. Perhaps most importantly, they provide incentives for asset accumulation. Employer matches directly increase wealth (unless recipients offset these matches by saving less in other forms). When employer contributions require a corresponding employee contribution, they also create potential incentives for saving. The federal government provides an additional subsidy and incentive by deducting employee contributions from income (in income tax calculations).
These retirement plans also provide facilitation. When participation is mandatory, deciding to save and acting on this decision require no mental effort. Even when participation is voluntary, the use of automatic transfers allows individuals to precommit, and this greatly reduces the mental effort required to save. The automatic-enrollment or opt-out plans described above provide even greater facilitation, by automatically enrolling individuals in voluntary plans unless they elect otherwise.
Employer-sponsored retirement accounts are almost always restricted. In many DB plans, funds are not available until workers reach a certain age. In most DC plans, there are substantial penalties for early withdrawals. Although a sizeable proportion of families do withdraw funds before retirement, especially when changing jobs,[24] on the whole, these restrictions probably help protect retirement savings. Employees who have access to employer-sponsored retirement plans often have access to financial education as well, especially if they work for medium-size or large firms. These educational initiatives often newsletters or optional group seminars attempt to motivate and inform employees.
| Asset-Building Tax Expenditure | In Millions of Dollars |
| Housing | |
| Deductibility of Mortgage Interest on Owner-Occupied Housing | 76,030 |
| Deductibility of Property Tax | 14,830 |
| Capital Gains Exclusion on Home Sales | 36,270 |
| Exclusion of Net Imputed Rental Income on Owner-Occupied Housing | 29,720 |
| Subtotal Housing | 156,850 |
| Investment | |
| Reduced Tax Rate for Some Capital Gains | 28,370 |
| Exclusion of Small Corporation Stock from Capital Gains | 250 |
| Step-up Basis of Capital Gains at Death | 28,760 |
| Carryover Basis of Capital Gains on Gifts | 290 |
| Exclusion of Interest on Life Insurance Savings | 24,070 |
| Subtotal Investment | 81,740 |
| Retirement | |
| Net Exclusion of Pension Contributions: Employer Plans | 51,050 |
| Net Exclusion of Pension Contributions: 401(k) Plans | 48,140 |
| Net Exclusion of Pension Contributions: IRAs | 7,310 |
| Net Exclusion of Pension Contributions: Savers Credit | 1,170 |
| Net Exclusion of Pension Contributions: Keogh Plans | 9,980 |
| Subtotal Retirement | 117,650 |
| Source: Office of Management and Budget 2005b, Table 19.1 | |
Subsidies, facilitation, restriction, and education all send the message that saving and asset accumulation are desirable. The terms of matching contributions may also set up specific expectations for saving. If a worker receives the maximum employer contribution when she contributes five percent of her earnings to a 401(k) plan, for example, then the plan may create an expectation that employees save five percent of earnings. Similarly, the terms of automatic-enrollment plans may communicate specific expectations about saving for retirement.
Low-income individuals are less likely than middle- and upper-income individuals to have access to these benefits. For example, the first row of Exhibit 7 shows that the percent of full-time private workers employed at firms that sponsor pension plans increases substantially with earnings.[25] Minorities and women also tend to have less access to employer-sponsored pension plans than non-Hispanic whites and men. For example, in 1999, 47 percent of white, non-Hispanic private-sector workers were covered by these plans; the comparable figures for black non-Hispanic and Hispanic workers were 41 percent and 27 percent, respectively. Forty-seven percent of male workers were covered, compared to 40 percent of female workers (U.S. Department of Labor Employee Benefits Security Administration n.d.).
When low-earning workers do have access to pension plans, they are less likely to participate (Exhibit 7).[26] Limited ability to save is almost certainly one important reason for lower participation rates. And, when low-income households are able to save, they may choose to save for more immediate goals than retirement (and may thus prefer less-restricted saving vehicles). Institutional variables probably also play a role. The tax-favored treatment of pension contributions is worth less to households in lower tax brackets than households in higher tax brackets, and worth nothing at all to households with no income tax liability.[27] As Gale, Iwry, and Orszag (2004, 2) have written,
The tax system in general provides little incentive for participation in tax-preferred saving plans to households who most need to save more for retirement and who, if they contribute, are most likely to use the accounts to raise net saving. By contrast, the tax code provides its strongest incentives to those who are generally already better prepared for retirement, and who are more likely to use tax-deferred vehicles as a shelter than as an opportunity to increase overall saving.
| Less than $20,000 | $20,000 - $40,000 | $40,000 - $60,000 | More than $60,000 | |
| Percent of Workers Employed at Firms that Sponsor Pension Plans | 42 | 65 | 78 | 80 |
| Percent of Eligible Workers Who Participated in Pension | 68 | 85 | 92 | 94 |
| Source: U.S. Census Bureau Current Population Survey, cited in Purcell (2001)Note: Sample includes full-time, year-round, private sector, non-agricultural workers age 25 to 64. | ||||
Bundles of Institutional Supports Provided through Homeownership
Homeownership also comes with a bundle of institutional supports. In this case, facilitation and restriction are probably most important. When an individual takes out a mortgage to purchase a home, she has a contractual obligation to make monthly payments, and the portion of each payment that goes to principal directly increases her wealth. Since most people will go to great lengths to avoid mortgage default, little or no mental energy or extra effort is required to save monthly in the form of home equity. Also because people will go to great lengths to avoid default and because the transaction costs of selling a home are very high, home equity is quite illiquid. These restrictions help protect home equity.[28]
In addition to facilitation and restrictions, there are incentives and subsidies for homeownership. Interest payments on home mortgages and state and local property taxes for owner-occupied homes may be deducted from income (if deductions are itemized). These tax benefits reduce the cost of homeownership (and/or send the message that homeownership is good) and so may encourage people to purchase homes.[29] This is important because home equity is the primary asset for many people. In some time periods in some locations, home values have appreciated dramatically. These high rates of return directly increase wealth, and the possibility of passive asset accumulation may serve as an additional incentive for saving in the form of home equity. The exclusion of capital gains on the sales of principle residences from federal income tax also provides an incentive and subsidy for homeownership.[30]
Although owner-occupied housing is the primary asset for many low-income, minority, and single-mother households, these groups have less access to homeownership and receive fewer benefits from ownership than others do. The two primary prerequisites for homeownership are assets (to make a down payment) and evidence of credit worthiness (to qualify for a mortgage). For a conventional loan, mortgage lenders typically require a down payment equal to 10 to 20 percent of the purchase price.[31] Some evidence suggests that first-time home buyers are having a harder time financing down payments. Using data from surveys of first-time home buyers in 18 major U.S. cities, Mayer and Engelhardt (1996) find that, between 1985 and 1993, the average number of years that households had saved for down payments increased while the average down payment as a percent of purchase price decreased. In addition, the percent of down payment coming from personal savings (rather than gifts or loans, for example) decreased.
A first-time home buyer typically has two main sources for her down payment: her own personal savings and/or transfers from others. Mayer and Engelhardt (1996) find that 21 percent of first-time buyers received gifts for down payments in the late 1980s and early 1990s. For recipients, this assistance was substantial: The average gift equaled 51 percent of the total down payment. Using 1996 PSID data, Shapiro (2004) reports that 54 percent of white and 88 percent of black first-time home buyers said that their down payments came entirely from their own savings. These figures suggest that a substantial proportion of white buyers (and a smaller proportion of black buyers) receive down-payment assistance. These figures may underestimate the importance of transfers because an individuals savings may have come from earlier gifts or bequests.
In addition to down payments, a potential home buyer must demonstrate the ability to repay her mortgage, and evidence suggests that low-income, minority, and single-mother households have limited access to mainstream credit.[32] Lenders assessment of credit worthiness depends upon level of income, stability of income, savings, and credit history (Belsky and Calder 2004). By definition, low-income households do not fare as well as others on the first criterion. In addition, many low-income, minority, and single-mother households have fairly volatile incomes because they work seasonally, because they have experienced unemployment, and/or because some or all of their earnings come from informal employment. And, as documented in another report in the Poor Finances series, these households are less likely to have savings.[33]
Credit history provides additional insight to lenders about an applicants credit worthiness. Those who have been identified as credit risks are unlikely to qualify for mainstream credit. Some of the factors that lead to this label are having a debt-to-income ratio above a certain threshold, a history of missed payments, or a history of personal bankruptcy. Low-income individuals are more likely than others to be identified as credit risks. Other households may be unable to demonstrate credit worthiness because they have little or no documented credit history. Those without bank accounts and credit cards are particularly likely to have this problem (Belsky and Calder 2004). Low-income and minority households are less likely than others to have bank accounts and credit cards (see Aizcorbe, Kennickell, and Moore 2003; Hogarth, Anguelov, and Lee 2005). Single-mother households are slightly less likely than others to have bank accounts and credit cards (Hogarth and Lee 2000).[34] Racial discrimination may serve as an additional barrier to homeownership for minority households. Using PSID data, Charles and Hurst (2002) find that blacks are twice as likely as whites to have applications for home mortgages rejected, even when they control for wealth and proxies for credit history.
This report has already argued that homeownership may be a risky investment for low-income, minority, and single-mother households. In addition, low-income households benefit less than others from homeownership because the subsidies for homeownership are delivered through the tax system. To benefit from the deductions for mortgage interest payments and state and local property taxes, a household must itemize deductions. According to 1998 data from the SCF, only 13 percent of homeowners in the bottom forty percent of the income distribution itemized (Glaeser and Shapiro 2002). In addition, these deductions are not refundable, so households benefit only if they owe taxes. Families that owe taxes but are in the lowest tax brackets benefit less than families in higher tax brackets. Finally, the homes owned by low-income households are likely to be modestly priced, and deductions for mortgage interest payments and property taxes are more valuable for expensive homes (or large mortgages) than for modestly-priced homes (or small mortgages).
Empirical evidence confirms that these deductions disproportionately benefit higher-income families. According to the Joint Committee on Taxation (2003), in 2003, more than half of the benefits of the mortgage interest deduction accrued to households with annual incomes of $100,000 or more (Exhibit 8). Less than ten percent of the benefits accrued to households with incomes below $50,000, and less than two percent accrued to households with incomes below $30,000. Among recipients, the average benefit for households with incomes between $10,000 and $20,000 was about $250; the average for households with incomes between $100,000 and $200,000 was over $2,500. Results from the simulation cited by Woo, Schweke, and Buchholz (2004) predict that, in 2006, the bottom 60 percent of taxpayers by income will receive less than five percent of the combined benefits from the mortgage interest and property tax deductions. The top one percent of tax payers by income is expected to receive almost 11 percent of the combined benefits.
| Annual Income | Amount (in millions) | Amount (as percent of total) | Average benefit for recipients |
| Below $10,000 | $10 | 0.02 | $125 |
| $10,000 to $20,000 | $226 | 0.38 | $246 |
| $20,000 to $30,000 | $898 | 1.52 | $473 |
| $30,000 to $50,000 | $4,600 | 7.80 | $751 |
| $50,000 to $75,000 | $9,829 | 16.66 | $1,088 |
| $75,000 to $100,000 | $11,091 | 18.80 | $1,647 |
| $100,000 to $200,000 | $18,818 | 31.90 | $2,870 |
| $200,000 and over | $13,512 | 22.91 | $6,305 |
| Total | $58,984 | 100.00 | $1,761 |
| Source: Joint Committee on Taxation 2003. | |||
Bundles of Institutional Supports Provided through Other Types of Saving and Investment
Finally, a bundle of institutional supports is available to investors, that is, to those who hold specific, fairly sophisticated saving and investment vehicles. Of particular interest here are individual retirement accounts, such as traditional IRAs, Roth IRAs, and Keogh plans.
The most important institutional supports provided by these programs are incentives, restrictions, and expectations. Incentives are provided through the tax system. For example, contributions to traditional IRAs are deductible (although withdrawals are taxable). Contributions to Roth IRAs are not deductible, but earnings and allowed withdrawals are not taxed.
Traditional IRAs and Keogh plans are restricted. For example, withdrawals taken from a traditional IRA before age 59½ are subject to a 10-percent penalty unless used for higher education or first-time home purchase or unless the account-holder becomes disabled. The maximum deductible contributions for these individual retirement programs may also set up expectations for saving. Unlike employer-sponsored retirement plans, participation in individual retirement plans must be initiated and structured by individuals. Thus, accessing these institutional supports requires effort and financial sophistication, as well as wealth.
Low-income households are eligible for traditional and Roth IRAs, but the participation rate is extremely low. According to estimates by Burman et al. (2004, Table 6), in 2004, only 0.2 percent of tax units in the lowest income quintile contributed to a traditional IRA, and only 0.3 percent contributed to a Roth IRA. The comparable figures for all tax units were 2.7 percent and 2.8 percent. Low-income filers were also much less likely than high-income filers to contribute the maximum amounts.[35] Financial constraints and the desire to save for shorter-term goals almost certainly limit participation by low-income households. Again, however, it is important to note that tax benefits are worth less to households in lower tax brackets. Because the ability to make deductible contributions phases out at higher income limits, low- and moderate-income households receive a greater proportion of the tax benefits for these accounts than they do for the other tax benefits discussed here. Still, Burman et al. estimate that 58 percent of the tax benefits for traditional and Roth IRAs accrue to the top income quintile, and 85 percent to the top two quintiles.
Low-income, minority, and single-mother households have limited access to the federal subsidies related to long-term capital gains, life insurance and annuities, and capital gains transferred through estates. These groups tend to hold more conservative saving and investment products, and the tax-preferred products require greater financial sophistication and/or greater risk-tolerance than vehicles like savings accounts and certificates of deposit. And, these subgroups are much less likely than others to leave sizeable bequests.
Institutional Supports Provided through Targeted Asset-Building Initiatives
The previous paragraphs show that low-income households are much less likely than others to benefit from the policy bundles just described. The federal government, however, has a number of asset-building policies and programs that are targeted specifically to low-income households. The following sections describe some of these major targeted asset-building initiatives and discuss the extent to which these targeted programs provide institutional supports. Federal asset-building initiatives for low-income households include both discretionary spending programs and tax expenditures. Targeted policies exist in at least four categories: homeownership, IDAs, small business development, and tax credits (see Exhibits 9 and 10).
Homeownership
In recent years, the U.S. Department of Housing and Urban Development (HUD) has focused increasingly on promoting homeownership for lower-income households, spending about $2 billion of HUDs overall discretionary budget of $32 billion on targeted homeownership programs. By far, the largest HUD program promoting homeownership is the HOME Investment Partnership Program (HOME). HOME can be used to support homeownership and provide rental assistance. State and local officials have flexibility to determine how to best address their communitys low-income housing needs, and in recent years, the percentage of funds devoted to homeownership has increased. Support for homeownership includes down-payment and rehabilitation assistance. In 2003, a new set-aside within HOME, the American Dream Downpayment Initiative, was authorized. These funds provide grants of up to $10,000 to low-income, first-time homebuyers for down payments and closing costs. Funds may also be used for some rehabilitation and home repair of housing acquired with assistance.
Another source of federal assistance for low-income homebuyers is the Community Development Financial Institutions Fund (operating under the Treasury Department). This fund promotes economic revitalization and community development by investing in and providing assistance to community development financial institutions. These institutions, in turn, provide loans, investments, financial services, and technical assistance to underserved populations and communities.
A third important source of federal assistance for low-income home buyers is the Federal Housing Administration (FHA). FHA has recently expanded its suite of products, but its primary mission is to provide mortgage insurance on loans made by FHA-approved lenders. A significant portion of low-income borrowers use FHA products when purchasing a home, and these products help reduce the barriers to homeownership. The FHA generates money for the federal government.
Individual Development Accounts (IDAs)
While IDA programs are relatively new, they have received some support from the federal government through the Assets for Independence Act (AFIA) and the Office of Refugee Resettlement. Enacted in 1998, AFIA created the first federally-funded national demonstration program for IDAs. Through AFIA, the Office of Community Services in the Administration for Children and Families (ACF) within the Department of Health and Human Services (HHS) awards five-year grants to nonprofit organizations and to government or financial institutions partnering with nonprofits. Grant recipients must provide an equal amount of funding from private sources. Federal funds may be used to administer programs and to provide matching funds for IDA deposits. IDA funds must be used to purchase a first home, pay for higher education, or capitalize a small business. As of 2005, 216 agencies and community-based groups across the nation had been awarded grants to implement 317 AFIA projects. There are more than 1,100 subrecipient agencies and organizations active in these projects. In these AFIA projects, participants had established more than 34,000 IDAs and had saved a total of $24.8 million.
| Actual 2004 | Estimated 2005 | Requested 2006 | |
| Department of Housing and Urban Development | |||
| Self-Help Homeownership Program | 25 | 52 | 30 |
| Housing Counseling | 40 | 38 | 40 |
| American Dream Downpayment Fund | 87 | 50 | 200 |
| Family Self-Sufficiency Voucher Program | 48 | 46 | 55 |
| HOME Investment Partnership Program | 1,859 | 1,788 | 1,730 |
| Department of Treasury | |||
| Community Development Financial Institutions | 63 | 56 | 8 |
| Department of Health and Human Services | |||
| Assets for Independence Demonstration Program | 25 | 25 | 25 |
| Small Business Administration | |||
| Microloan Program (loans) | 23 | 10 | 0 |
| Microloan Program (technical assistance) | 15 | 15 | 0 |
| Program for Investment in Microentrepreneurs | 5 | 5 | 0 |
| Source: Office of Management and Budget 2005a | |||
| Earned Income Credit | Child Tax Credit | Savers Credit | |
| Phase-Out Range (2004) | |||
| Married Filing Jointly | $15K - $35.5K | $110K - $170K | $30K - $50K |
| Head of Household/Single | $14K - $34.5K | $75K - $135K | $15K - $25K |
| Number of Claimants (2002) | 21.9 million | 25.7 million | 5.4 million |
| Total Value of Claimed Creditsa (Estimated, 2006) | $39.5 billion | $46.0 billion | $1.2 billion |
| Sources: Internal Revenue Service 2005; Office of Management and Budget 2005aa The total value equals the value of outlays (refunds) plus the value of tax expenditures (forgone tax payments). | |||
In a separate program, the HHS/ACF Office of Refugee Resettlement (ORR) awards grants to nonprofit organizations providing IDAs to refugees. Since 1999, ORR has awarded approximately $78 million which has funded approximately 20,000 IDA participants. While there is no specific budget line to support refugee IDA programs, it has been funded through the ORR discretionary budget. This budget item has fluctuated in recent years; the most recent ORR IDA program announcement was issued in FY 2007.[36]
Small Business Development
The federal government offers a number of programs to support small business capitalization, mostly through activities of the U.S. Small Business Administration. Only a few of these programs including the Microenterprise Development Initiative, Microloan program, and Program for Investment in Microentrepreneurs are targeted to lower-income borrowers. Most of these programs are small and primarily provide loans and technical assistance to microenterprises.
Tax Credits
As noted above, several large tax expenditures support asset building for primarily middle- and upper-income households. Two tax expenditures, the Savers Credit and the Earned Income Tax Credit (EITC), are targeted to low-income households. A third, the Child Tax Credit (CTC), is available to a broader segment of the population but also benefits low-income households. These tax expenditures are described here.
The Saver's Credit was created in 2001 to encourage low-income people to save for retirement. It provides up to a 50-percent tax credit for up to $1,000 in contributions to retirement accounts, including 401(k) plans and IRAs. This credit, however, is nonrefundable, so it benefits only those with federal tax liability.
The EITC is a federal income tax credit for low-income workers. In tax year 2004, working families with children were eligible for the EITC if they had incomes below about $30,000 to $36,000, depending on number of children in the family and filing status (Internal Revenue Service n.d.). That same year, the average EITC claim was $1,834 (Kneebone 2007).[37] The EITC is refundable, so an individual receives a refund if the credit amount exceeds her tax liability.
The EITC was not explicitly designed to encourage asset building.[38] There is evidence, however, that it does facilitate asset accumulation, especially (perhaps) when linked to initiatives explicitly designed to encourage saving and asset accumulation. As discussed earlier, behavioral theory suggests, and some empirical evidence confirms, that people view lump-sum refunds differently than wage and salary income and may be more likely to save and/or purchase assets with refund payments. This has led both for-profit and not-for-profit organizations to offer a variety of saving products at the time of tax preparation, including low-fee bank accounts (Beverly, Romich, and Tescher 2003), IRAs (Duflo, Gale, Liebman, Orszag, and Saez 2005; Tufano and Schneider 2004) and IDAs. Another program encouraged EITC recipients to split their refunds, directing part to a savings account and receiving the rest in the form of a check for consumption (Beverly, Schneider, and Tufano 2006).[39]
The CTC is also a federal income tax credit, worth up to $1,000 to eligible tax filers for each qualifying child. In tax year 2004, eligibility began to phase out at $75,000 for single heads of household and $110,000 for couples filing jointly. The CTC is only partially refundable. Like the EITC, it is not explicitly an asset-building initiative, but it does affect the potential of a lower-income family to build assets by reducing its tax liability and perhaps increasing the size of its tax refund.
Assessment of Targeted Asset-Building Initiatives
It is not yet possible to say, with confidence, whether targeted asset-building programs described above substantially increase the assets of participants. This important question requires detailed information about a variety of assets and some reasonable estimate of how asset levels would have changed in the absence of the programs. IDAs are probably the most-researched of all the initiatives listed here, and a small body of research suggests that some IDA saving is new saving (see discussion under Incentives in Section IV.C). In the absence of more information about impact, the scope of these targeted initiatives and the level of institutional support provided is described here.
The low-income targeted initiatives described here may be assessed, in part, by the amount of appropriations designated for each. For fiscal year (FY) 2006, about $2 billion was requested for the HOME Investment Partnership Program and the American Dream Downpayment Fund (Exhibit 9). Expenditures for the Savers Credit were expected to be about $1.4 billion (Office of Management and Budget 2005a), and $25 million was requested for the Assets for Independence demonstration program. No funding was requested for the microenterprise programs under the Small Business Administration (Exhibit 9).[40]
The targeted initiatives may also be assessed in regard to their accessibility. IDA programs often require that participants be employed, and the IDA programs funded by the Office of Refugee Resettlement are limited to refugees. The EITC is limited to individuals with earnings, and childless workers who are eligible for a small credit. Small business programs are available to those who have or are starting their own businesses. In addition, an application or a meeting with a case manager may be required for individuals who wish to participate in a homeownership, IDA, or small business programs. Such requirements may limit participation.
With regard to information, it is difficult to say whether information needed to participate successfully in targeted programs is more available or less available than information related to homeownership and retirement saving benefits. One study suggests that less than two-thirds of low-income parents knew about the EITC in 1999 (Phillips 2001). The authors are aware of no empirical evidence about knowledge of the other targeted programs described here. Presumably, social service agencies provide information about these targeted programs to potential participants, but individuals who are not connected to these agencies may have no source of information about these programs.[41] Moreover, the motives or incentives for providing information differ for targeted programs, compared to homeownership and retirement saving initiatives. For the targeted programs, the motivation to educate comes from the good will of nonprofit organizations and staff members, that is, from the desire to provide resources to disadvantaged families. For homeownership and retirement saving initiatives, there are individuals and organizations realtors, lenders, and investment companies, for example that receive clear benefits when new participants are recruited. Also related to information is the fact that most of these targeted programs require some degree of financial sophistication. It takes financial knowledge and confidence, for example, to purchase a home or start a small business.
Of the targeted programs described here, IDAs have the most obvious incentives for saving. These incentives are generous in percentage terms, but benefits are capped, and the dollar amount transferred can be far less generous than, say, retirement pension benefits. In addition, federally-funded IDA programs are small, in budgetary terms and in terms of people served, and do not have permanent funding streams. Also, to receive AFIA funds, nonprofit organizations must provide match money, a requirement that does not exist in the tax expenditure programs supporting homeownership and retirement savings. The Savers Credit also provides an incentive for saving, but this program is limited in scope because only filers with federal income tax liability benefit.[42]
With regard to facilitation, automatic enrollment is not often available for these targeted programs. For some, automatic transfers can be arranged, if the participant has a bank account or, in the case of the Savers Credit, access to a 401(k) plan. The EITC and CTC provide some facilitation, to the extent that income tax refunds are more save-able than more regular income. In some IDA programs, staff actively encourage and sometimes assist participants in making a monthly saving deposit.
As discussed below (Section IV.C, under Expectations), there is some evidence that IDA programs create expectations for saving and asset accumulation. IDA program staff create these expectations, and some participants come to view the monthly IDA saving target itself as an expected saving amount. These expectations seem to help some participants save. In theory, the Savers Credit could create expectations for retirement saving, but there is no empirical evidence on this topic.
Most of the targeted programs discussed here have restrictions. For example, financial assistance from homeownership programs may be used only for homeownership, support from microenterprise programs is restricted to small business efforts, matching funds for IDA deposits may be used only for approved purposes, and deposits that qualify for the Savers Credit go into restricted retirement accounts. There are no restrictions associated with the use of the EITC and the CTC (consistent with the fact that these are not explicitly designed as asset-building programs).
Very likely, for most participants, these targeted programs are perceived as secure. Although there are risks involved with investing in a small business, purchasing a home, and contributing to a retirement savings plan, receiving additional support for these activities through these targeted programs creates no additional risk.
In sum, these targeted programs provide much less institutional support for saving and asset accumulation than the homeownership and retirement saving initiatives that operate through the tax system and through employers. In large part, this is due to substantial differences in size and scope. Targeted programs reach far fewer people, they are primarily available only to those with earnings, and the financial benefits provided are typically much lower in dollar terms. Like the non-targeted initiatives, targeted programs provide restrictions and security, and some provide incentives and expectations. But these institutional supports are available only to the small portion of the low-income population that applies for assistance and satisfies eligibility requirements. In the case of employment-based retirement pensions, institutionalization of saving can be almost total and continuous; that is, the participant does nothing month after month, year after year, and the savings continue to accumulate. Targeted programs do not lend themselves to such extensive institutionalization. For example, automatic enrollment is unlikely and even the opportunity to arrange for automatic deposits into saving products is somewhat limited. The end result is likely to be that targeted programs have modest effects, in the aggregate, on asset building.
[ Go to Contents ]
Empirical Evidence on The Determinants of Asset Building
A discussion of empirical evidence related to the conceptual framework proposed above is in order. This section begins with an overview of the strengths and weaknesses of the data sources and methods in existing studies. Next, the report summarizes the empirical evidence (and/or notes the lack of evidence) for the major propositions suggested above (empirical studies that are directly related to the determinants of asset building are summarized in Appendix Exhibit 1). This section closes with suggestions for future research.
A. Data Sources Used in the Literature
Strengths and Limitations of Data Sources
The studies cited here primarily use data from large national surveys such as the Panel Study of Income Dynamics (PSID) and the Survey of Consumer Finances (SCF), data from a national demonstration of IDA programs (the American Dream Demonstration or ADD), or administrative data from employers offering defined contribution plans. The specific strengths and weaknesses of the national data sets and of ADD data are covered in a separate report in the Poor Finances series.[43] Strengths and weaknesses of administrative data are described here.
Administrative data sets are useful because they contain objective data on actual behavior (e.g., actual participation and contribution decisions). In contrast, the surveys provide self-reported data, which may be inaccurate for a variety of reasons. In addition, survey data sometimes refer to planned behavior or hypothetical behavior, which may differ substantially from actual behavior. One major weakness of the administrative data sets, however, is that they almost exclusively relate to retirement saving, and to saving in employer-sponsored retirement plans in particular. These data cannot indicate how low-income people would respond to saving programs that are not retirement-related. In fact, they provide quite limited information about low-income saving and investment action because many low-income households (especially the most disadvantaged) do not work for firms that sponsor these plans. One important exception is the administrative data from ADD, because IDAs are targeted to low-income households and IDA participants may save for homeownership, education, and small business capitalization.
Still, all of these administrative data sets are tied to particular saving programs with particular institutional characteristics. This is both strength and weakness for research on institutional determinants of asset building. It is an important strength to be able to observe how people actually respond to a real bundle of institutional characteristics. On the other hand, it is not possible to observe how people would respond to a different set of institutional characteristics without altering the actual saving program, something that is not easily done. A few large administrative data sets combine data from people who are eligible for different saving plans and thus allow researchers to observe how behavior varies in response to different institutional characteristics, but these data sets are not usually in the public domain.
B. Methods Used in the Literature
Strengths and Limitations of Methods
The research cited in this section on empirical evidence is diverse. It includes both qualitative and quantitative studies. It includes rigorous studies with findings that may have implications for policy, as well as less rigorous studies with findings that should be considered tentative.
The most quantitatively rigorous studies cited here use experimental and quasi-experimental methods or sophisticated multivariate analysis. From these more rigorous studies, there is fairly consistent evidence that precommitment constraints, automatic enrollment, restrictions, and the existence of a match increase saving (in the designated savings vehicle).[44]
Many of the studies cited here do not use such rigorous methods, and this is a major weakness of the body of literature. Some of the research examines correlations. For example, the study by Hilgert, Hogarth, and Beverly (2003) finds a positive correlation between financial knowledge and financial behavior, but it is not possible to conclude with confidence that the knowledge shaped the behavior. And, some studies examine perceived relationships. For example, Moore et al. (2001) report the percentage of participants who believe that they save less in other accounts because they have IDAs.
The samples used in the quantitative research cited here are quite diverse. A number of studies involve low-income IDA participants. A small number involve low-income households in developing countries. Many of the other studies use fairly advantaged samples, that is, middle- and upper-income households who are eligible for employment-based retirement plans. For general knowledge-building and policymaking, it would be useful to have studies that examine whether each of the proposed hypotheses holds for a broadly representative sample of households and for lower-income households. And, for the specific purpose of designing policy to facilitate asset building in low-income households, it would be especially useful to have more studies that involve this group.
Another important weakness of the samples is vulnerability to selection bias. Many of the studies cited here use samples of volunteers, that is, people who chose to participate in a particular savings program. These volunteers are probably different from those who did not choose to participate. For example, those who enroll in an IDA or financial education program are probably more motivated to save or change their financial behavior than those who do not. These and other differences are likely to influence how much individuals save, how they respond to institutional characteristics, and so forth; therefore, the findings reported here may not hold in more diverse samples.
A fair number of the studies cited here are qualitative. Qualitative studies are useful when little is known about a topic, a circumstance that certainly applies to some of the hypotheses of interest here. They can call attention to relationships and patterns that might have otherwise been unnoticed; they can also help explain observed relationships, from the perspective of the research participants, in ways that quantitative studies cannot. Most of the qualitative studies cited here have small samples, however, and their findings should be considered tentative. Like much qualitative research, these studies can be used to generate hypotheses that may later be tested in quantitative research.
C. Findings from the Literature
Effects of Saving and Investment Action on Asset Accumulation
Above, this report proposed that deposit patterns affect asset accumulation, that withdrawal patterns affect asset accumulation, and that portfolio composition affects asset accumulation. The first two hypotheses, as noted earlier, are essentially truisms and the third hypothesis has nearly universal acceptance. The report identified a somewhat controversial question, whether homeownership increases the asset levels of low-income households and presented reasons that low-income, minority, and single-mother families might receive low and even negative rates of return on housing. This section discusses empirical evidence on this topic.
Evidence clearly indicates that market conditions have a strong effect on rates of return on owner-occupied housing. Beyond this, however, it is difficult to draw a clear conclusion from the literature. To accurately compute the rate of return to homeownership, one might want to consider not only the difference between purchase price and selling price but also real estate transaction costs, foregone earnings from alternative investments, maintenance costs (in comparison to maintenance costs incurred by renters) (Belsky and Calder 2004), and even foregone rental assistance. Existing studies vary in their coverage of these factors, and this at least partly explains mixed findings. Just a few studies are described here, to illustrate the need for more research.
Using PSID data, Reid (2004) examines the housing choices and outcomes over a several-year period for about 5,000 renters. She finds that many renters who purchased homes especially low-income and minority home buyers returned to renting in a relatively short time. The financial returns to homeownership were very small for low- and middle-income minorities and low-income whites. Although some low-income and minority homeowners did experience appreciation, Reid concludes that white and middle- and upper-income households were much more likely to benefit financially from homeownership.
Using data on purchase and sale price for homes that were both purchased and sold, Belsky and Duda (2002) compare the returns for individuals purchasing low-cost homes to other buyers. They find that returns from the sale of a home were strongly influenced by the timing of the sale and that many people experienced losses (i.e., after real estate transaction costs were considered, they sold their homes for less than the purchase price). Those who purchased low-cost homes, however, were more likely to sell at a profit during market upswings and less likely to suffer losses when selling during market downturns. This study is limited to four metropolitan areas and examines repeat sales of short-term owners. It is not clear whether these authors consider the (foregone) cost of rental payments when computing return on the sale of a home.
Case and Marynchenko (2002) also use administrative data to examine the change in home value for homes in Boston, Los Angeles, and Chicago. To look at outcomes by income, they group homes according to the average income of the zip code. They find that rate of return is greatly influenced by the time of purchase and the supply of and demand for real estate at the local level. They note that borrowing to purchase a home can result in serious losses (p. 253) in some circumstances.
In sum, more evidence is needed, but existing research seems to suggest that homeownership may be a risky investment for low-income and minority households. Learning more about rates of return for low-income and minority home buyers and finding ways to help potential home buyers make informed choices are very important research objectives because home equity is the primary asset for many low-income and minority households.
Effects of Individual Constructs on Saving and Investment Action
This section provides a summary of evidence related to the individual constructs identified in the conceptual framework presented in this report.
Economic Resources and Needs
The large body of evidence showing that low-income families have less wealth than middle- and upper-income families provides strong indirect support for the hypothesis that economic constraints shape saving action, but few studies have directly tested the hypothesis (probably because this relationship is viewed as a truism). Based on household budgets developed during in-depth interviews with almost 200 low-income mothers, Edin (2001) argues that, to accumulate assets, low-income households would have to give up expenditures that most Americans view as necessities. In one of the few quantitative studies on this topic (a survey of 298 IDA participants), Moore et al. (2001) find that 30 percent of IDA participants strongly agreed, and 52 percent agreed, that it was difficult to save because most of their money went for necessities.
There is also some limited evidence that the three specific types of expenses identified in Section III.C under Economic Resources and Needs medical expenses, vehicle expenses, and debt payments depress saving in many low-income households. In some qualitative studies, low-income individuals state explicitly that burdensome debt payments (Edin 2001), medical costs (Edin 2001; Hogan et al. 2004; Sherraden, McBride et al. 2005), and vehicle breakdowns (Finn, Zorita, and Coulton 1994; Hogan et al. 2004; Sherraden, McBride et al. 2005) make it difficult for them to save and maintain assets. Quantitative evidence directly linking these expenses to saving outcomes is quite limited. The most rigorous data known to the authors come from a study of 1,855 ADD participants (Banov 2005). Banov examines the effects of medical debt (whether or not an individual has overdue medical payments) on six indicators of IDA success, while controlling for numerous other variables (including health insurance). Medical debt has moderate and significant effects in the expected directions on all outcomes. For example, the average monthly IDA deposit (net of unmatched withdrawals) for those with medical debt is about $3.50 (19 percent) less than the average monthly deposit for those without medical debt. And, those with medical debt are about five percentage points more likely to drop out of the IDA program (39 percent vs. 34 percent).[45] One important limitation of this study is that the data set does not include indicators of health status, so medical debt may be a proxy for poor health status.
Banov (2005) also examines the effects of health insurance (whether or not an individual has insurance) on the same indicators of IDA success. She finds that health insurance is significantly and positively related to average monthly net deposits and to gross deposits into IDAs over the duration of program but not to the other outcomes. These findings are somewhat difficult to interpret, however, because there is no indicator of out-of-pocket (OOP) medical expenses, and it is not clear that people with insurance have low OOP expenses. (Some insured individuals pay high very premiums, for example.)
Informal Social Support
This report posits that informal support from social network members makes saving easier and that demands from network members make saving and the maintenance of assets difficult. Thus, the nature of an individuals social network (e.g., whether network members are in need and make demands, and/or whether they communicate that saving is feasible and desirable) affects saving action and asset accumulation. These hypotheses are intuitive, but empirical evidence is rare.
As noted above, the hypothesis that demands from social network members make it difficult to save and maintain assets flows from ground-breaking qualitative research by Stack (1974). At least two more recent qualitative studies support this hypothesis. In a qualitative study of 30 Hispanic and black families in San Jose, California and rural Mississippi, Caskey (1997) reports findings similar to Stack (1974); some interviewees said they did not save because others would insist they share their savings.[46] In quantitative, multivariate studies, Chiteji and Hamilton (2005) and Heflin and Patillo (2002) find that families are less likely to have bank accounts when they have poor siblings and parents. Heflin and Patillo also find that these kin characteristics decrease the likelihood of homeownership for whites, but not for blacks. Chiteji and Hamilton find that poverty in extended families decreases the likelihood of stock ownership. Both sets of researchers conclude that poverty in the extended family can constrain asset accumulation.
The authors are aware of even less empirical evidence related to the hypothesis that informal support increases saving. One qualitative study of 25 IDA participants in Minnesota finds that support from family, friends, and community organizations during times of crisis is an important facilitator of saving. In-depth interviews with IDA participants in ADD also suggests that encouragement and saving reminders from IDA staff help people save (Sherraden, McBride et al. 2005).
Financial Literacy
This report hypothesizes that financial literacy affects saving and investment action. As noted above, however, examining this relationship requires fairly sophisticated empirical tests. It is not enough to examine the effects of financial knowledge on attitudes or intended behavior, because these attitudes and intentions may not translate into action. When data on actual behavior are available, researchers must consider the possibility that financial behavior may shape literacy (reverse causality) and that other variables such as motivation and future orientation may explain an observed relationship between literacy and behavior.
Empirical studies on this topic are rare. Using nationally representative data from the Survey of Consumers, Hilgert et al. (2003) find a positive association between overall financial knowledge and following recommended financial practices. They also find positive associations between specific types of financial knowledge and specific types of financial behavior. For example, those who scored high on knowledge of credit management also tended to follow recommended credit management practices. This study relies on self-reported data regarding financial behavior, however, and does not consider the possibility that financial behavior may affect financial knowledge. Another study uses two-stage least squares regression to control for reverse causality and finds that financial knowledge is positively associated with retirement savings (Kotlikoff and Bernheim 2001). The measure of financial knowledge used may not be a particularly valid indicator of practical financial knowledge, however.[47] This study also relies on self-reported financial data.
While more evidence is needed that increasing financial literacy leads to greater saving and smarter investment choices, it is certainly likely that those who lack basic financial knowledge and skills will have more trouble finding and using appropriate saving and investment vehicles. Americans in general are not very educated about financial matters, and evidence shows that low-income people are especially likely to score poorly on tests of financial knowledge (e.g., Bernheim 1998; Brobeck 2002; Consumer Federation of America 1990). In one study of over 600 low-income people (Anderson, Zhan, and Scott 2004), the average participant answered only 56 percent of the 41 financial knowledge questions correctly. Knowledge of saving and investment strategies was especially low. For example, only 48 percent understood that investments are usually riskier than savings accounts.
Few studies have examined the financial literacy of single parents in particular. Because they tend to have less income and wealth and because their households may have less access to financial education, single parents may have less financial knowledge, on average. Conversely, at least one study of participants in a financial management program for low-income people (90 percent women) finds that single parents have greater financial knowledge than married participants (Zhan, Anderson, and Scott 2006). This may indicate, consistent with qualitative evidence in Sherraden, McBride, et al. (2005), that married women rely more on their husbands in financial matters, while single women make many financial decisions by themselves.
Psychological Variables
Future orientation. The willingness to trade-off benefits and costs at one time versus another derives from a combination of pure taste (time preference) and other factors such as returns on savings, uncertainty, and inflation. In their review, Frederick, Loewenstein, and ODonoghue (2003) find spectacular disagreement (p. 389) among estimates of time preference, mostly due to failure to distinguish between pure taste-based motives and other related (but distinct) factors. Most estimates reviewed by Frederick et al. imply that $100 today is more valuable to most people than $150 in one year, implying that costs and rewards three to five years in the future have almost no value from the perspective of today. Those authors argue, however, that existing estimates are biased and that a more realistic description is valuing current rewards almost equally with future ones. They conclude that people (on average) probably have much longer time horizons than the very short time horizons implied by existing estimates.
At the same time, as noted above, a key assumption of behavioral theory is that many individuals lack the self-control to reduce current consumption in favor of future consumption. Behavioral economists call this the self-control problem (e.g., Thaler 1994). Anecdotal and indirect evidence is abundant. For example, the very existence of Christmas club accounts, which require regular deposits and do not allow withdrawals until the holiday season but which do not provide higher interest rates than basic saving accounts, suggest that people have self-control problems. Still, the authors are aware of very few studies that attempt to document the prevalence of self-control problems quantitatively. One exception is a study by Ameriks, Caplin, Leahy and Tyler (2004). These scholars use survey data to identify individuals who tend to over-consume and those who tend to under-consume.[48] They find that under-consumption (too much self-control) is more common than over-consumption (too little self-control). Their sample of about 1,400 TIAA-CREF participants is much more educated than the broader U.S. population, however,[49] so these descriptive statistics provide limited insight. A more useful finding for the purposes of this report is that, in multivariate analysis, under-consumption is associated with higher net worth, and over-consumption is associated with lower net worth. The authors argue that this second finding is unlikely to be an artifact of the high levels of education in the sample, but more empirical research would be useful. In addition to this quantitative study, a few qualitative studies provide evidence that individuals with both low incomes and high incomes believe that they have trouble postponing consumption (Beverly, Romich, and Tescher 2003; Caskey 1997; Kennickell, Starr-McCluer, and Sunden 1997; Romich and Weisner 2000).
Motives for saving. As noted above, neoclassical economists typically emphasize four motives for saving: for long-term changes in income (retirement saving), for short-term changes in income (precautionary saving), for bequests, and for big ticket items (target saving). Simple descriptive evidence from the 2001 SCF shows that retirement and precautionary motives are the most common motives, followed by education and other types of target saving (Aizcorbe, Kennickell, and Moore 2003, Table 2).[50] During the 1990s, retirement became an increasingly common most-important saving motive.
In recent years, economists have given special attention to the role of precautionary saving in asset accumulation. Using the PSID, Carroll and Samwick (1997) find that U.S. households overall save mostly for precautionary reasons until about age 50. Of course, income uncertainty is higher for the poor, so all else constant they have an extra-strong precautionary motive. But if precautionary savings matter so much to the poor, why do they have low or no wealth? Simulated outcomes from the model in Hubbard, Skinner, and Zeldes (1995) can replicate observed patterns in household wealth accumulation after accounting explicitly for precautionary saving and asset-based, means-tested social insurance (p. 360). In particular, their model suggests that holding low (or no) wealth can make sense for low-educated, low-income households because they face what amounts to a 100-percent tax on savings, should their uncertain incomes fall so low that they qualify for asset-tested public assistance.
Perceived ability to save. Above, this report hypothesized that those who expect saving attempts to be successful are more likely to save, while those who expect failure are less likely to save. Research has rarely examined these hypotheses directly. In-depth interviews with IDA participants provide some evidence that successes with saving make people feel more confident in their ability to save and increase their intentions to save (Sherraden, McBride et al. 2005). In the only quantitative study known to the authors, Moore et al. (2001) find that perceived inability to save is negatively related to saving in IDAs, but the relationship is not statistically significant (p=0.17).[51] A related variable, the perception that saving takes too long is also statistically insignificant (p=0.43). The sample for this regression is relatively small (N=166) and excludes people who had dropped out of IDA programs. If those who dropped out were those who felt the least able to save (as one would expect), the study may underestimate the effects of perceived inability to save. The study also uses self-reported data on IDA saving.
Effects of Institutional Constructs on Saving and Investment Action
This section summarizes existing evidence related to the institutional constructs identified in the conceptual framework.
Access
The hypotheses that access (eligibility and practicality) affects saving and investment action seem to be common sense but are difficult to test. As implied above in the discussion of bundles, access is almost inevitably combined with the other institutional constructs discussed here. The authors are not aware of any study that has attempted to identify the effects of access separate from the effects of other institutional characteristics. This may be an important task for future research.
Information
This report has hypothesized that information shapes saving and investment action. To some extent, this hypothesis is a truism: Without information about a particular product or program, an individual cannot purchase it or participate in it. Beyond this, however, whether or not information affects financial behavior is an empirical question. Almost all of the related empirical studies examine the effects of financial education (one method of providing financial information) on financial outcomes. One exception is a study that examines the effects of financial communication (e.g., paper and web-based education materials, projection tools, and plan statements) on 401(k) participation and contribution decisions of employees in 26 firms (Nyce 2005). The findings suggest that financial communication, especially web-based, has large positive effects on participation and contribution and that the effects may be strongest for low earners. An important strength of this study is the use of administrative data. However, the measures of financial communication are fairly crude,[52] and the study examines participation in just a single saving product. More research on the effects of financial communication is needed.
The remaining studies described here examine financial education. Many of these studies have an important limitation: Data on outcomes come from participants self-report. In order to please research or program personnel, participants may exaggerate their savings and/or their adherence to recommended financial practices. Or, they may make honest mistakes, due to faulty recall.[53] Measures of financial knowledge that come from objective financial tests are not subject to this type of bias. Many existing studies are also subject to selection bias: When financial education is voluntary, those who choose to attend are probably more motivated than others to increase their financial literacy and financial well-being (Caskey 2001). Or, attendees may seek out financial information because they already have substantial assets (Lusardi 2002).
For many adults in the United States, employers are an important source of information related to retirement saving. A few studies suggest that employer-sponsored financial education seminars increase pension-plan participation rates and contributions. For example, Bayer, Bernheim, and Scholz (1996) find that more frequent corporate-sponsored retirement seminars are associated with both higher participation and higher levels of contributions to 401(k) plans. Similarly, Bernheim and Garrett (2003) find that employees who work for companies that offer financial education are more likely to participate in pension plans and tend to have greater wealth. The effects on wealth are especially strong for those with little wealth. The results of these studies are probably not greatly affected by selection bias, as long as employees in the firms with and without education had similar motivations to save. Lusardi (2002) also finds that employer-sponsored retirement seminars have large effects on wealth in low-wealth and low-education samples. This study does not use a comparison group but attempts to minimize selection bias by controlling for several variables that may proxy for motivation to save, future orientation, and other individual characteristics that might be correlated with saving. All three of these studies rely on self-reports of financial behavior and wealth.
Some studies examine the effects of financial education that is specifically targeted to low-income households. A study by Hirad and Zorn (2002) evaluates the effects of pre-purchase homeownership counseling and finds that counseling, especially individual and classroom counseling, is associated with a large reduction in the risk of 90-day mortgage delinquency. When using a statistical strategy to control for selection bias, the researchers confirm that counseling (broadly defined) and classroom counseling in particular significantly reduce delinquency rates. The effects of individual counseling become insignificant, however. In research on IDAs using ADD data, Clancy, Grinstein-Weiss and Schreiner (2001) find that up to 12 hours of general financial education is associated with large increases in net IDA savings, but selection bias is a potential problem because the most motivated savers may have completed more financial education.
Finally, a few studies look not at specific financial education programs but at state curriculum mandates related to financial education in public schools.[54] There is evidence that curriculum mandates, especially mandates requiring coverage of personal finance in a specific course, increase financial knowledge and/or saving rates. For example, Tennyson and Nguyen (2001) use data on 1,600 high school students in 31 states to examine whether state curriculum mandates predict students scores on a 31-item test of financial knowledge. Controlling for other characteristics of the state, school size, and several individual characteristics, they find that students in states that required coverage of personal finance in a specific course scored significantly higher. Using data from a 1995 survey of about 2,000 respondents between the ages of 30 and 49, Bernheim, Garrett and Maki (2001) find evidence that curriculum mandates related to coverage of personal finance during high school increase self-reported saving rates in adulthood. These studies are probably not subject to selection bias because students did not choose to be exposed to financial education. However, it is impossible to assess the accuracy of the self-reported saving rates used by Bernheim et al.
In sum, there is a fair amount of evidence that financial education improves financial outcomes, but more rigorous research is needed. Of particular interest are studies that minimize selection bias and examine financial outcomes that may be objectively verified. If additional research confirms that financial information can shape financial behavior, it will be important to determine whether low-income, minority, and single-mother households have access to appropriate financial information. Few studies have examined this question, but there are reasons for concern. Due to job instability and/or concentration in the low-wage service sector, these subpopulations probably have less access than others to employer-sponsored financial information. Those who did not complete high school are also less likely to have received school-based financial education.
Incentives
What is the evidence for the hypothesis that financial incentives shape saving and investment action? This section summarizes evidence related to the effects of matching contributions (incentives) followed by evidence related to the potential disincentives created by means-tested income transfer programs.
Effects of matching contributions. A large number of studies examine the effects of matching contributions, but the evidence is mixed. In perhaps the only randomized experiment designed to test match rates,[55] Duflo et al. (2005) examine the effects of matching contributions on IRA participation and contributions. Over 14,000 H&R Block clients in St. Louis were randomly assigned to one of three groups and then invited to deposit portions of their tax refund into Express IRAs. One group was eligible for a 20 percent match (on contributions up to $1,000), one group was eligible for a 50 percent match, and the control group received no match. Take-up rates were 17 percent for the 50-percent match group, 10 percent for the 20-percent match group, and 3 percent for the control group. For those who contributed, average contribution levels (excluding the match) were $1,310, $1,280, and $860, respectively. Although there is an important competing hypothesis because there is evidence that tax professionals had a large influence on whether individuals chose to contribute to the Express IRA the authors conclude that match rates affected both IRA participation and contributions.
Most of the other evidence on the effects of match rates comes from research on defined contribution pension plans and IDAs. Because those who are eligible for DC plans tend to have higher-than-average income, the evidence from IDAs may be more directly relevant to efforts to facilitate asset building in low-income households. Below, this report considers whether the match structure seems to affect (1) participation and contributions, and (2) net saving.
Evidence suggests that the existence of a match increases participation and that higher match rates are associated with higher participation. For example, Nyce (2005) examines administrative data on 401(k) participation for over 300,000 employees in 48 firms. In descriptive analysis, he finds that participation rates are higher in firms that have a match than in firms that do not and that participation increases as the match rate increases. Multivariate analysis also suggests that participation rises with the match rate. This pattern is consistent with the idea that match rates are eye-catching. Survey data from several hundred participants in a matched savings program in England support this conclusion: Over 90 percent said that the 1:1 match was the primary reason they opened accounts (Kempson, McKay, and Collard 2005). Finally, some in-depth interviewees in ADD volunteered that the availability of a match was the primary reason they enrolled in the IDA program. When asked, some people said that the high level of the match rate was critical (Sherraden, McBride et al. 2005).
Evidence on 401(k) participation strongly suggests that the existence of a match (regardless of the match rate) increases the amount of contributions (see discussion in Schreiner and Sherraden 2007). Evidence about the effect of match rate on contributions is mixed, however. Examining this relationship is complicated because programs that offer matches almost always have match caps, and programs that provide high match rates tend to have low match caps (Schreiner and Sherraden 2007).[56] When match caps exist, data on contributions are censored at the match cap, because some people want to make contributions beyond the match cap, but are not allowed. According to Schreiner and Sherraden:
Failure to adjust for censoring at the match cap biases estimates of match-rate effects downward. Most studies of match rates in 401(k) plans do not adjust for censoring, and they often find (perhaps spuriously) that higher match rates are associated with lower levels of savings as a share of income (Munnell, Sundén, and Taylor 2002; VanDerhei and Copeland 2001; Clark et al. 2000; Papke 1995; Andrews 1992). This result could reflect two-way causation in which employers correctly expect their employees to have difficulty saving and thus try but do not completely succeed to compensate by setting a higher match rate (Even and Macpherson 2003). In contrast, specifications that do adjust for censoring (Engelhardt and Kumar 2003; Cunningham and Engelhardt 2002) find that higher match rates are associated with higher savings.
Choi, Laibson, and Madrian (2004, 289) conclude that the widely divergent empirical results in the literature on matching appear to result from empirical analysis that does not carefully account for the effect of both the match rate and the match threshold on employee contribution rates.
Using ADD data, Schreiner and Sherraden (2007) examine the effects of match rates on IDA contributions. Their two-step regression controls for a large number of individual characteristics that might be correlated with saving outcomes. It accounts for the match cap. It does not control for censoring, but the authors state that the results of a regression that does control for censoring are very similar. Schreiner and Sherraden find that IDA participants who are eligible for higher match rates are more likely to have net IDA contributions of $100 or more. For these savers, however, a match rate of 2:1 is associated with lower monthly net IDA contributions than a match rate of 1:1. Schreiner and Sherraden conclude: (1) that higher match rates improved inclusion by making more participants savers, and (2) that many ADD participants were saving for fixed goals (and so saved less when eligible for larger matches because they could reach their goals with lower levels of saving). The analysis also reveals that higher match rates increased asset accumulation per participant when both effects of match rates are considered (the positive effect of higher match rates on inclusion and the negative effect of higher match rates on net contributions for savers).
As noted above, neoclassical economic theory does not posit that incentives (including matches) will necessarily increase net saving (across all saving vehicles). On the one hand, incentives may cause people to save more by increasing the reward for saving. On the other hand, people may save less because match money allows them to reach a fixed savings goal with less of their own saving. In addition, people may simply reshuffle assets, that is, move existing assets from another savings vehicle into the match-eligible product instead of saving more.
Empirical evidence about the effect of incentives on saving among the non-poor is mixed (see reviews in Engen, Gale, and Scholz 1996; Hubbard and Skinner 1996; Poterba, Venti, and Wise 1996). There is limited empirical evidence on the effects of matches for low-income households. Low-income households are probably less likely than others to reshuffle because they are less likely to have assets to reshuffle. Empirical analysis simulating the effects of private pension plans suggests that pensions do not offset personal saving among less-educated (and presumably lower-income) workers (Bernheim and Scholz 1993). Using ADD data to examine the sources of IDA deposits, Schreiner et al. (2001) observe that many IDA participants had no or very low liquid assets at enrollment and that most had too few liquid assets to fund all of their IDA deposits. Based partly on these observations, Schreiner et al. conclude that IDAs come from some mix of new savings and shifted assets, but they emphasize that ADD data do not allow them to quantify or even rank these two sources.
Findings from a cross-sectional survey of about 300 IDA participants (Moore et al. 2001) are consistent with the conclusion that IDA deposits are a mix of new savings and reshuffled assets. Evidence of new savings includes the following: 29 percent of respondents said that, because of IDAs, they worked longer hours; 41 percent said they were more likely to work more; and 59 percent said they were more likely to work or stay employed. In response to questions about how they financed IDA deposits, many respondents said that they reduced consumption. For example, 70 percent said they shopped more carefully for food; 68 percent said they ate out less; and 64 percent said they spent less on leisure. Evidence of asset shifts includes the fact that 35 percent of respondents said that, because of IDAs, they were less likely to save in other forms. In addition, 16 percent said that they financed IDA deposits by postponing the payment of bills, 7 percent said they borrowed from family and friends, and 3 percent said they borrowed from credit. These findings may underestimate the extent of reshuffling, if survey respondents attempted to please interviewers with their responses (Moore et al. 2001).
In sum, there is limited evidence that IDA deposits are a mix of new savings and reshuffled assets, but no study attempts to estimate the percent of saving that is new. Because matches seem to be one of the most salient characteristics of IDA programs for participants, this research may suggest that matches increase net saving somewhat for low-income households. IDA programs have other important characteristics, however such as financial education and staff support and these studies do not separate the effects of matches from the rest of the IDA bundle.
Effects of disincentives in income transfer programs. Above, this report described how means-tested income transfer programs such as TANF, Food Stamps, and Supplemental Security Income (SSI) may reduce saving through the consumption-floor effect (i.e., they provide a certain level of income at the time of economic emergencies) and because of asset means tests. Empirical evidence related to the consumption-floor effect is discussed below.
Using PSID data, Hubbard et al. (1995) compare actual lifetime wealth accumulation patterns by income with two simulated wealth accumulation patterns. The first simulated pattern assumes a general consumption floor from all available means-tested transfer programs of $7,000; the second assumes a general consumption floor of $1,000, much lower than the average welfare-receiving household actually receives.[57] Both simulations assume that a households wealth accumulation at a certain age is determined by cash on hand, earnings, and medical expenses, in addition to the total amount of transfer income available from means-tested welfare programs. For low-income groups, Hubbard et al. find that actual lifetime wealth accumulation patterns are much more similar to simulated patterns that assume a $7,000 consumption floor than those that assume a $1,000 consumption floor. For middle- and upper-income groups, both simulated patterns are very similar to actual lifetime wealth accumulation. In addition, for middle and upper-income groups, the two simulated wealth accumulation patterns do not differ from each other. Thus, there is evidence that the presence of a consumption floor has a greater effect on asset accumulation in low-income households than in other households.
Other scholars reach similar conclusions when examining the consumption-floor effects of individual income transfer programs, such as Unemployment Insurance, SSI, Aid to Families with Dependent Children (AFDC)/TANF, and Food Stamps. These studies use data from the SIPP (Bird and Hagstrom 1999; Engen and Gruber 2001; Gruber and Yelowitz 1999; Neumark and Powers 1998), the Consumer Expenditure Survey (Gruber and Yelowitz 1999), and the PSID (Ziliak 2003). They estimate the impacts of transfer programs, using either expected benefit levels calculated from individual household characteristics or state-level data on maximum benefit levels (see Appendix Exhibit 1 for more information on data and methods). These studies show that a high likelihood of receiving income-transfer benefits, a high level of expected benefits, or living in a state with generous benefits tends to decrease household financial assets (Bird and Hagstrom 1999; Engen and Gruber 2001; Gruber and Yelowitz 1999; Neumark and Powers 1998; Ziliak 2003).
Next, empirical evidence related to the effects of asset tests is discussed. Asset tests require applicants and recipients to show that their financial assets are below a certain level. For example, the asset limit is $2,000 for an individual and $3,000 for a couple receiving SSI. SSI households are allowed one vehicle, if this vehicle is used for employment and medical care. For households receiving Food Stamps, the financial asset limit is $3,000, and the vehicle asset limit is $4,650.
Asset limits for AFDC/TANF have undergone dramatic changes during welfare reform. The asset limit for AFDC was $1,000 in all states before the Family Support Act of 1988 allowed states to request a waiver from the federal government to raise asset limits (Corporation for Enterprise Development 2002). The Personal Responsibility and Work Opportunity Reconciliation Act of 1996 abolished the federal asset limits for TANF, allowing states to create their own thresholds. Responding to changes in federal policy, state governments raised asset limits for AFDC/TANF during the 1990s. For example, in 1993, Iowa increased its countable asset limits[58] for AFDC to $2,000 for applicants and $5,000 for current recipients and its vehicle equity limits to $3,000. In addition, some state governments introduced a new asset policy. They created separate and higher asset limits for funds in special accounts that restrict withdrawals to certain types of activities (e.g., financing education or buying a house or vehicle).[59] In addition, money in IDAs is not counted at all toward asset limits if the program is funded with the Asset for Independence Act grant or state TANF money (Corporation for Enterprise Development 2002). As of 2000, 44 states had relaxed their rules on countable asset limits to some degree, 27 states had allowed welfare recipients to open special restricted accounts with higher asset limits, and all states had raised vehicle asset limits in TANF (Nam 2008).
Empirical research suggests that asset tests have a stronger effect on the asset accumulation of low-income households than does the consumption floor (Gruber and Yelowitz 1999; Hubbard, Skinner, and Zeldes 1995; Powers 1998; Ziliak 2003). Most existing studies use variance in state asset limits and welfare benefit levels as instruments in estimating the impacts of asset means test on financial assets and net wealth among likely welfare recipients (Gruber and Yelowitz 1999; Powers 1998; Ziliak 2003). Using individual-level data from the PSID merged with state-level data on welfare policies and economic conditions, Ziliak (2003) finds that both income from transfer programs with asset tests and income from transfer programs without asset tests are negatively related to asset holding. The effect of income from transfer programs with asset tests is twice as strong. He concludes that asset tests impose an additional barrier to asset accumulation, independent of the consumption-floor effect. Using data from the SIPP and the Consumer Expenditure Survey, Gruber and Yelowitz (1999) find that a $1,000 increase in estimated benefits from Medicaid reduces financial assets by 4.4 percent in the presence of an asset test but reduces financial assets by only 1.8 percent in the absence of an asset test. Using data from the SIPP, Neumark and Powers (1998) find that likely SSI participants aged 63 to 64 have much lower liquid assets than likely SSI participants aged 60 to 62. They conclude that elderly low-income households dissave their liquid assets as they approach the eligible age for SSI in order to pass the asset test. Finally, using data from the National Longitudinal Survey of Youth, Powers (1998) estimates that an increase of $1 in asset limits for AFDC families increases a female heads savings by 25 cents.
A few studies empirically test whether increased asset limits for AFDC/TANF during welfare reform have facilitated saving and asset accumulation among likely welfare participants (Hurst and Ziliak 2006; McKernan, Ratcliffe, and Nam 2007; Nam 2008; Sullivan 2006). Using the PSID, Hurst and Ziliak (2006) find that gaps in financial assets between likely welfare participants (female heads with children) and unlikely welfare participants (male heads and female heads without children) do not significantly differ between states with and without generous asset rules. The only exception is that higher countable asset limits are significantly and positively associated with vehicle ownership among likely welfare participants. Using data from the SIPP, Sullivan (2006) reports somewhat different results. Like Hurst and Ziliak, he concludes that relaxed asset tests have promoted vehicle ownership, but he finds that changes in vehicle asset limits, not countable asset limits, are associated with vehicle ownership. The elimination of vehicle asset limits increases vehicle ownership by 20 percent among single mothers without a high school degree in an analysis using single women without children as a comparison group. He also finds that increased countable asset limits are not significantly associated with vehicle ownership or liquid assets.
Compared to these two studies, Nam (2008) finds stronger evidence of positive effects of relaxed asset tests on asset accumulation in low-income households. Because it may take time for a target population to learn about and adapt to policy changes and because states did not introduce new asset means tests simultaneously, Nam creates policy variables that measure the length of time since new asset limits were adopted. Like Hurst and Ziliak (2006) and Sullivan (2006), they consider countable asset limits on general accounts and vehicle asset limits. In addition, they include state policies on special accounts in their analyses. Using PSID data, Nam shows that different types of policy variables produce distinct results. When the independent variable is the actual dollar amount of asset limits, these researchers find (like Hurst and Ziliak) that relaxed asset tests are not associated with greater liquid asset accumulation among likely welfare recipients. Results differ, however, when the independent variable is the number of years since new policies were introduced: The earlier a state raised its countable asset limit on general accounts, the more likely are female-headed households with children to accumulate liquid assets. Among those who saved, the amount of saving is significantly higher for those living in states that introduced special accounts early.
McKernan, Ratcliffe, and Nam (2007) report mixed results of the effectiveness of policy changes on low-education single mothers and families, based in findings from the SIPP data. They show that generous unrestricted asset limits, as measured in dollar amount, are not associated with increased liquid asset holdings for either low-education single mothers or low-education families, consistent with Hurst and Ziliak (2006), Sullivan (2006), and Nam (2008). They, however, show that generous restricted account asset limits increases liquid asset holdings for low-education single mothers and families. This variable, restricted account asset limit, is unique in McKernan, Ratcliffe, and Nam (2007) and is not included in other previous studies. Similar to Nam (2008), they find that the number of years since unrestricted asset limits became more generous (greater than $1000) is associated with increased liquid asset holdings for low-education single mothers and families. The number of years since the adoption of a new restricted account limit is not significantly associated with increased liquid asset holdings for either low-education single mothers or families.
In sum, with regard to saving incentives, there is some evidence that matches increase participation in saving programs, and even more evidence that matches increase contributions to these programs. Evidence is mixed regarding the effect of matches on net saving (across all saving vehicles); contributions to incentivized saving programs are probably a mix of new savings and shifted assets. With regard to disincentives, evidence suggests that income transfer programs reduce asset accumulation by low-income households due to the consumption-floor effect and due to their restrictive asset means tests. The effects of asset means tests seem to be stronger than consumption-floor effects. Recent studies examining increases in asset limits associated with welfare reform show some inconsistent results, so it is not yet clear whether loosening asset restrictions will increase saving by low-income households.
Facilitation
A small but growing body of empirical evidence supports the hypothesis that facilitation shapes saving action. This section discusses evidence related to the effects of precommitment constraints, automatic enrollment, and the federal income tax system.
Effects of precommitment constraints. In in-depth interviews, IDA participants commonly stated that direct deposit helped them save (Sherraden, McBride et al. 2005). Much more rigorous evidence that precommitment constraints increase deposits comes from a test of the Save More Tomorrow plan (SMarT) (Thaler and Benartzi 2004). In this study, 286 workers in a mid-sized manufacturing firm (out of 315 eligible workers) agreed to meet with an investment consultant hired by the firm to discuss saving in the company pension plan. Of these, 79 immediately agreed to increase their contributions to the pension plan. The remaining 207 were invited to enroll in the SMarT plan, which allowed workers to precommit to automatically save their 3 percent annual raises in the company pension plan. More than three-fourths 162 employees enrolled in the SMarT plan. After four annual pay raises, these employees had increased their average saving rates from 3.5 percent to 13.6 percent of income. Those who had immediately agreed to increase their contributions to the pension plan but who did not arrange for automatic annual saving increases had increased their saving rates only from 4.4 percent to 8.8 percent.
Effects of automatic enrollment. Another rigorous study provides evidence that automatic enrollment affects saving and investment action. Madrian and Shea (2000) examine 401(k) participation and contribution rates in a company that began automatically enrolling employees in their 401(k) plan. Before the change, employees had to sign up to participate in the 401(k) plan. After the change, employees had to actively opt out of the plan if they did not want to participate. Although none of the economic features of the plan changed, participation was significantly higher under automatic enrollment. Participants were also likely to stay with the default contribution rate and fund allocation.
Effects of the federal income tax system. There is some evidence that the federal income tax system facilitates saving and asset purchases. Three studies provide quantitative but largely indirect evidence. Using multivariate analysis and a nationally representative sample of consumer units from the Consumer Expenditure Survey, Barrow and McGranahan (2000) find an increase in expenditures on durable goods among EITC recipients in February, the modal month of refund receipt. Similarly, data from ADD show that net IDA deposits increase substantially in tax season (Schreiner and Sherraden 2007). In a survey of 650 Chicago households expecting to receive a federal refund and EITC benefits, Smeeding, Phillips, and OConnor (2000) find that 50 percent of respondents plan to save at least a portion of the tax refunds. Actual behavior may differ from planned behavior, of course, so quantitative data on actual refund use would be more informative.
At least three qualitative studies provide additional evidence that federal refunds are used to purchase and maintain assets (in addition to purchasing goods and services for immediate consumption, paying bills, and paying down debt). In in-depth interviews with almost 200 low-income single mothers in Chicago and Charleston, South Carolina, Edin (2001) finds that some mothers use refunds to make property tax and insurance payments; to finance car expenses; and even to make down payments on homes. In in-depth interviews with a random sample of 42 New Hope participants,[60] Romich and Weisner (2000) find that some of their respondents use refunds to buy appliances and furniture, repair cars, or make down payments on cars and homes.
Finally, some scholars have argued that people deliberately use the income tax system as a kind of saving plan. Millions of households withhold more than the taxes they owe. More evidence is needed to determine whether this is because they want a lump-sum refund and are willing to forego earnings on the money to receive one (Neumark 1995), whether they over-withhold to avoid the penalties of under-withholding (Highfill, Thorson, and Weber 1998), or whether they over-withhold inadvertently. The only empirical evidence on this question known to the authors comes from three small qualitative studies (Edin 2001; Olson and Davis 1994; Romich and Weisner 2000), showing that some low-income households choose not to receive the Earned Income Tax Credit (EITC) in advance so that they can accumulate a lump sum for special purposes.
Expectations
A small but growing body of research supports the hypothesis that expectations shape saving action. Milligan (2003) finds that a $1 increase in the match cap in the Canadian Registered Retirement Savings Plan is associated with a 50-cent increase in saving. In ADD research, Schreiner and Sherraden (2007) find that a $1 increase in the IDA match cap is associated with a 57-cent increase in net IDA savings. Both of these studies control for censoring at the match cap. Also in ADD, a number of in-depth interviewees said that they saved more or saved more regularly because they were expected to deposit a specific amount each month. There is also evidence that IDA participants viewed the match cap as a savings goal (Sherraden, McBride et al. 2005). On the other hand, very few eligible individuals maximize an IRA deduction or a 401(k) match, and this suggests that many people do not view caps as expectations or are unable or unwilling to conform to these expectations.
Restrictions
What is the evidence for the hypothesis that restrictions affect saving and investment action? Again, the very existence of simple restricted accounts that do not provide higher interest rates than basic savings accounts (e.g., Christmas club accounts) suggests that some people desire restrictions. In fact, people of all income levels talk about the benefits of restricted access.[61] IDA participants have said that they like the restrictions on IDA withdrawals (Moore et al. 2001; Sherraden, McBride et al. 2005).[62] In in-depth interviews with about 30 participants in a matched saving program for low-income individuals in England, Kempson et al. (2005) find that a majority liked the fact that they could not access their savings immediately.[63] Most of these individuals said, however, that they would not favor restrictions on the use of their money. Low participation rates in IRAs, 401(k)s, 529 plans, and other restricted saving vehicles probably indicate that a substantial proportion of American households are not comfortable with restrictions, at least as currently structured and as currently bundled with other institutional characteristics. More research is needed to determine what types of restrictions people are willing to accept.
In one of the few rigorous studies of the effects of restrictions, Ashraf, Karlan, and Yin (2006) randomly assigned existing clients at a small rural bank in the Philippines to one of three groups. One group was invited to open an account with strong withdrawal restrictions.[64] One group was encouraged to save using existing bank products but was not offered the new product. The control group received no further contact. The fact that 28 percent (about 200) of those who were eligible chose to open the restricted account, even though they were not compensated with higher interest rates, provides evidence that some people believe restrictions help them save. Additional evidence suggests that the restricted account increased savings. Over time, those who were eligible for the account increased their bank account balances more than those in the other groups, and this savings did not appear to have been moved from other accounts in the same bank. The increased savings is small in nominal terms, but substantial as a percentage of prior formal savings.
Security
At this point, the body of evidence related to the hypothesis that security affects saving and investment action is small and indirect.[65] African Americans have much lower net worth than whites and hold smaller portions of their investments in financial securities and larger portions in real estate. As scholars ranging from W.E.B. Dubois (1935) to Melvin Oliver and Thomas Shapiro (1995) have noted, blacks historically have had reason not to trust financial institutions and security investments, preferring literally to keep their money closer to home.
Rutherford (2000) gives examples of savers in developing countries who are willing to accept sharply negative rates of interest in exchange for the security of their savings. He describes, for example, a poor woman in India who saves informally through a deposit collector that comes daily to the clients house to collect five rupees after earning the trust of clients over a period of years. After the client has made 220 deposits, the collector gives the accumulated money back to the client, minus a 30 percent fee for her services. According to Rutherford, the client finds this fee reasonable because without the collector, she could not save enough to pay for clothing and school fees for her children. This willingness to pay for security may not be limited to developing countries, but the authors are not aware of empirical research on this topic.
Effects of Intergenerational and Interhousehold Transfers on Investment Action and Asset Accumulation
Existing evidence strongly suggests that inter vivos transfers and bequests, in the aggregate, are substantial. For example, using SCF data, Gale and Scholz (1994) estimate that the annual flow of intended intergenerational transfers (including inter vivos transfers, trust accumulations, and life insurance payments to children) equaled about $63 billion in 1986 (in 1986 dollars) and that the annual flow of bequests equaled an additional $105 billion. Using PSID data from the mid- to late-1980s, Wilhelm (2001) estimates that 22 percent of the U.S. population has ever received a bequest, with an average inheritance amount of over $140,000. Schoeni and Ross (2005) use 1988 PSID data to look at transfers to young adults and consider the benefits of shared housing and help with college tuition and other educational expenses, as well as cash gifts. They find that young adults received substantial amounts of material support, perhaps as much as $38,000 (in 2001 dollars) between the ages of 18 to 34. One important weakness of the latter two studies is that the authors report averages, not medians. Transfer amounts probably have a large positive skew, so information on medians would be useful.
Although it seems plausible that these transfers affect saving action and asset accumulation (for the reasons cited in the discussion of the conceptual framework), researchers have rarely examined how transfers are used by recipient families, that is, whether transfers are saved and/or used in ways that free up other money for saving. There is some indirect evidence that interhousehold transfers make home purchase possible for some families: Data from the 1986 SCF indicate that those who received an intergenerational transfer of $3,000 or more during a three-year period were more likely to have purchased their first home during this period than those who had neither received nor given a transfer (16 percent vs. 6 percent) (Gale and Scholz 1994). And data from the 1988 PSID show that receipt of money assistance is positively correlated with home purchase (Schoeni 1997). Some qualitative evidence also suggests that down-payment assistance sometimes makes the difference between becoming a homeowner or remaining a renter (Shapiro 2004). If home purchase in turn increases wealth for these families, then transfers have indirectly increased asset accumulation. More research on this topic is needed.
Studies on interhousehold transfers also show that higher-income households and whites are much more likely than others to receive sizeable transfers of money and material assistance. For example, Gale and Scholz (1994) find that recipients of transfers of at least $3,000 had higher average income (and higher net worth), and were more likely to be white, than those who neither gave nor received a transfer. Wilhelm (2001) also finds that 28 percent of those in the highest permanent income quintile had ever received a bequest, compared to 13 percent in the lowest quintile. Higher-income families also tended to receive much larger amounts. For inter vivos gifts, the likelihood of receiving a transfer did not vary much by income, but higher-income recipients tended to receive larger gifts. In research on transfers to young adults, Schoeni and Ross (2005) find that youth in the top quartile of family income received almost three times as much assistance as youth in the bottom two quartiles.
Other studies confirm that whites are more likely than blacks and Hispanics to expect and to receive inheritances (Gittleman and Wolff 2004; Menchik and Jianakoplos 1997; Wolff 2002). One study estimates that, for the period between 1984 and 1994, differences in the likelihood of receiving an inheritance raised the rate of wealth accumulation of whites relative to blacks more than differences in the rate of return to capital and more than differences in saving rates (Gittleman and Wolff 2004). Although some studies find that race differences in the likelihood of giving or receiving a transfer disappear once variables like income, wealth, and education are controlled (Jayakody 1998; Sarkisian and Gerstel 2004), as long as blacks and Hispanics tend to have lower income, wealth, and/or education, minorities will likely be at a disadvantage in wealth accumulation.
Fewer studies have examined the likelihood of single mothers to receive interhousehold transfers. If unmarried mothers do not have partners, their extended families are likely to be smaller than those of married couples, so the probability of receiving interhousehold transfers is probably lower. And Hao (1996) suggests that never-married single mothers are unlikely to receive financial support from their parents for two reasons. First, if parents do not approve of out-of-wedlock births they may withdraw financial support. Second, many never-married mothers come from poor families who are unable to provide financial support. Using data from the National Survey of Families and Households, Hao (1996) finds that married families with children receive the most private transfers (including all loans and gifts from kin and non-kin), while never-married single mothers receive the least. Hao also finds that the positive association between private financial transfers and family wealth is stronger among married-couple families. On the other hand, Schmidt and Sevak (2004) find that inheritance does not explain the difference in net worth between single-mother households and married households.
D. Suggestions for Future Research
This summary of empirical evidence reveals a number of gaps in knowledge. Of special interest are gaps that limit ability to design programs and policies that facilitate saving and asset building in low-income households. Some research questions that may provide additional policy-relevant knowledge include the following:[66]
- Under what conditions is homeownership a good asset-building strategy for low-income households? What are effective strategies for helping potential homeowners make wise choices about ownership?
- Does health insurance coverage facilitate saving and asset building for low-income households?
- Does financial education change financial knowledge, attitudes, and behaviors in ways that lead to increased saving and asset accumulation in low-income households? Does well-targeted financial information that is delivered automatically to individuals (e.g., is not available just to those who choose to attend a financial seminar) produce these outcomes?
- What match structure (i.e., match rate and match cap) maximizes participation in incentivized saving programs? What match structure maximizes contributions? What match structure maximizes net saving (across all saving vehicles)? Do these findings vary by income or education level?
- Does loosening the asset tests in income transfer programs lead to increased saving and asset holding?
- Under what circumstances do people want restrictions? Under what circumstances do they want liquidity? Do these patterns vary by income or education level?
New or improved data sources may not be sufficient to answer all of these important research questions. Answering these research questions may require the development and implementation of new strategies. For example, there are two scenarios where new interventions may be indicated. First, if policymakers would like research that examines an institutional characteristic or bundle of characteristics that is not currently offered, such as a savings account for education, provided automatically to all children at birth, and with match money for low-income households, then a new intervention would be needed. Second, if policymakers want rigorous research to examine, using random assignment or other experimental evaluation designs, how actual behavior responds to varying institutional characteristics, programs would have to be developed that have such systematically varying institutional characteristics.
An important line of experimental or quasi-experimental research, for example, would involve match structure. This research focus is promising because existing studies suggest that people (across the income spectrum) respond to financial incentives, but these studies do not identify optimal match structures. Like questions about match structure, questions about the demand for restrictions and liquidity would be best answered with an intervention that included an experimental or quasi-experimental designed evaluation component. Questions about financial education and financial information could be answered with new interventions, or research plans might be carefully designed around existing interventions. In lieu of interventions with impact assessments, some insights could be gained from carefully constructed survey questions that ask individuals how they feel about, and whether they would save, in saving products with different restrictions.
Other avenues for future research might require new data. For example, to identify conditions under which homeownership is a good asset-building strategy, researchers would probably require a new data set that combines: (1) information on neighborhood characteristics from existing Census data; (2) information about individual and household characteristics (including net worth) from survey data; and (3) information on real estate transactions from survey data or, preferably, from administrative records. Questions about effects of health insurance could probably be answered with existing data sets.
In short, data requirements to answer research questions identified here vary substantially. For the purpose of designing programs and policies that facilitate asset building in low-income households, there is a particular imperative for research using low-income samples.
[ Go to Contents ]
Conclusions
Policy and programs for asset accumulation cannot be effectively designed unless there is a policy-relevant theory, or at least a set of propositions, along with empirical evidence, on how saving and asset accumulation occur (Sherraden, Scanlon et al. 2005). The point about policy relevance is central. It is possible to develop a wide range of theory on any human activity, including saving and asset accumulation. But if the purpose is to inform policy, then theory must be more or less at the middle range (Merton 1957). Middle-range theory is not at the individual level (e.g., it is not about motivation), and it is not at a social structural level (e.g., it is not about class structure). Instead, it is at the level of individuals interacting with conditions and circumstances around them. The very essence of effective social policy research is to address this nexus of how individuals live and act in their surroundings.
This report provides a framework of a middle-range theory, emphasizing individual interactions with institutions in the saving process. The conceptual framework includes individual constructs (economic resources and needs, informal support for saving, financial knowledge, and psychological variables, such as future orientation and saving-related attitudes). These individual constructs (and probably others) are relevant because individual choices can affect asset accumulation, and because knowledge of individuals can lead to the design of institutions that more effectively encourage saving and asset accumulation. However, the framework places less emphasis on individuals than do the major economic, psychological, and behavioral perspectives on saving.
The framework emphasizes institutional constructs that shape saving behavior and outcomes. These factors are external to the individual but present in daily life. An example of a highly institutionalized saving structure is a 401(k) retirement plan, wherein institutional features do most of the acting and the individual is largely passive. These institutional constructs which may be thought of as building blocks of an institutional theory are access, information, incentives, facilitation, expectations, restrictions, and security. Access refers to eligibility and practicality. Information includes both general financial information and information that is specific to a particular financial product or program. Incentives include subsidies and rates of return. Facilitation refers to any form of assistance in saving, especially making saving automatic. Expectations are implicit or explicit suggestions about desirable saving, investment, or asset accumulation. Restrictions are rules that restrict access to or use of assets. And security is freedom from unreasonable risk in saving and asset holding. In the framework presented here, each of these constructs is expected to shape saving and investment action and, as a result, to affect asset accumulation.
In the real world, these institutional constructs tend to exist in bundles rather than in isolation. These bundles, supported through public policy, tend to be delivered through employment settings and through the tax system. A 401(k) plan with an employer match, for example, provides several institutional supports for saving, especially incentives, facilitation, restrictions, and information. For the most part, those who have jobs with benefits, those who are homeowners, and those who are investors have access to these bundles of institutional supports. Low-income households benefit much less from these bundles than others. There are some asset-building policies and programs targeted specifically to low-income households, but these initiatives are small and, overall, provide much less support for saving and asset accumulation than the programs that largely benefit middle- and upper-income households.
The assumption of this work is that better theory can build knowledge that will inform and improve policy. From this perspective, institutional features can be purposefully created and put in place by public policy. This is not a social scientific perspective that seeks only to understand social forces and behaviors, but rather it is an applied agenda that seeks to inform policy design and implementation. While a fully developed and integrated institutional theory of saving and assets does not yet exist, the identification of institutional constructs and related empirical evidence informs policy development and also lays the groundwork for future research.
Empirical support for the propositions offered here is mixed. There is fairly strong evidence that precommitment constraints, automatic enrollment, restrictions, and the existence of a match increase saving (in the designated savings vehicle), but most constructs remain understudied. Future research that examines the effects of a variety of match structures, the effects of financial education, the effects of health insurance, and the effects of loosening asset tests on saving and asset accumulation could be helpful for policymaking. Research on the demand for restricted accounts and the returns to homeownership could also be beneficial. There is a particular need for research using low-income samples.
It may well be that the institutional constructs identified here are not the only relevant building blocks for an institutional theory on saving. Some of these may be precursors to others, or some other mediating variables may help determine effects on saving. Some of these constructs may be far more important than others (from a policy standpoint, this in particular would be essential to know). Particular combinations of these building blocks may create interactions that are synergistic. At this point, little is known about these issues and therefore more theoretical development and empirical testing lie ahead.
[ Go to Contents ]
Appendix Exhibit:
Empirical Studies of Determinants of Asset Building
[ Main Page of Report | Contents of Report ]
| Author | Data Source | Sample/Study Population | Method | Outcomes Analyzed | Key Explanatory Variables | Findings | Author’s Principal Conclusions |
|---|---|---|---|---|---|---|---|
| Aizcorbe, Kennickell, & Moore (2003) | 1998, 2001 SCF. | Full sample (About 4,000 households in each year). | Descriptive. | Motives for saving, ownership, value of various assets. | Income, education, race. | (1) Most common saving motives are retirement, "liquidity" (i.e., precautionary), education, and purchases. (2) Ownership and value of assets increase with income. (3) Most common reasons for not having a checking account were: "Don't write enough checks to make it worthwhile", "Don't like dealing with banks", and "Don't have enough money." | NA. |
| Ameriks et al. (2004) | 2003 Data from new survey, combined with data from 2000 Survey of Participant Finances, 2001 Survey of Financial Attitudes and Behaviors. | 1,444 TIAA-CREF participants (Sample very highly educated). | Multivariate. | Net worth, liquid assets, non-liquid assets. | Self-control (Survey had hypothetical questions about ideal and expected actual use of free "dream dinners" over two years; Overconsumption = using too many in year 1; Underconsumption = using too few in year 1). | Many had problem of under-consumption, not over-consumption. Over-consumption is associated with lower net worth, under-consumption with higher net worth. Effect of self-control is greater for liquid assets than for non-liquid. "Conscientious" people have smaller self-control problems in either direction. | At least one broad personality characteristic, "conscientiousness" seems to affect asset accumulation. |
| Anderson, Zhan, & Scott (2004) | FLLIP in Illinois. | Low-income people. | Descriptive. | Financial knowledge of low-income individuals. | NA. | (1) Financial knowledge levels of low-income people are low, especially on savings & investments, and public and work related benefits. (2) Choices of financial training models can impact characteristics of participants. | NA. |
| Ashraf, Karlan, & Yin (2006) | Survey, administrative data, including account data. | About 900 existing customers of bank in Philippines. | Descriptive. | Take-up of restricted savings account, saving. | NA. | 28% of eligible opened a restricted account, even without a financial incentive. Those who were eligible increased savings more than those who were not. | NA. |
| Banov (2005) | ADD. | 1855 ADD participants with data on health insurance. | Multivariate. | Six indicators of IDA "success". | Health insurance; medical debt. | Health insurance is significantly and positively related to average monthly net deposits and to cumulative gross deposits; Medical debt is significant related to all outcomes. | Health insurance facilitates saving. Medical debt is a barrier to saving. |
| Barrow & McGranahan (2000) | 1982-1996 CES. | Nationally representative consumer units. | Multivariate. | Expenditures on durable goods (Household furnishings and equipment, electronics, vehicles) | Calendar month. | Among EITC recipients, there was an increase in expenditures on durable goods in February, the modal month of refund receipt. | EITC is often used to purchase durable goods. |
| Bayer, Berheim, & Scholz (1996) | 1993, 1994 KPMG Peat Marwick Retirement Benefits Survey. | Private and public employers with at least 200 employees. | OLS. | Participant rates and contribution rates of retirement savings. | Retirement seminars by employers. | (1) Both participation in and contributions to voluntary savings plans are significantly higher when employers offer retirement seminars. (2) Effect is typically much stronger for non-highly compensated employees. (3) Frequency of seminars is important. | NA. |
| Belsky & Duda (2002) | Case-Schiller weighted repeat sales indexes (Information on purchase and sale of matchedpairs of single-family homes). | Matched pairs of housing transactions in Boston, Chicago, Denver, & Philadelphia (Homes both purchased and re-sold between 1982 -1999). | Descriptive. | Gain/loss on resale of home. | Purchase price of home and years held. | Owners of low-cost homes more likely than owners of mid-cost and high-cost homes to sell at profit during market upswings and less likely to suffer losses when selling during market downturns. | Homeownership is risky, but it is less risky for low-income homebuyers. Market conditions have a large impact on rate of return. |
| Bernheim (1998) | 1993, 1994 Household surveys by Merrill Lynch, Inc. | Individuals between the age of 29-47 (The "baby boom" cohort). | (1) Probit. (2) OLS. | Economic knowledge, financial knowledge, retirement savings. | (1) For knowledge: demographic factors. (2) For retirement savings: financial knowledge and employer-based financial education. | (1) Higher earnings and education are positively related to economic and financial knowledge. (2) Financial knowledge and financial education by employers are positively related to retirement savings. | NA. |
| Bernheim & Garrett (2003) | 1993, 1994 Household surveys by Merrill Lynch, Inc. | Individuals between the age of 29-47 (The "baby boom" cohort). | (1) Probit. (2) Median regression analyses. | Household and retirement savings. | Employer-based retirement education. | Employer-based retirement education positively influences household financial behavior. Effects are particularly pronounced among those least inclined to save. | NA. |
| Bernheim & Scholz (1993) | SCF. | 1300 married couples with working-aged and employed husband. | Multivariate. | Wealth-to-wage ratio. | Education (proxy for permanent income) and pension coverage. | Pension eligibility does not affect asset trajectories for households without a college education. | "Private pensions displace personal wealth accumulation only when the head of the household is college educated". |
| Bernheim, Garrett, & Maki (2001) | 1995 Household surveys by Merrill Lynch, Inc. | National representative sample of respondents between the ages of 30-49. | OLS. | Rates of savings, net worth. | Whether exposed to high school financial curriculum mandates and years since mandates. | Mandates have raised subsequent asset accumulation when students reached adulthood these effects appear to be gradual rather than immediate. | NA. |
| Bird & Hagstrom (1999) | 1984-1986 SIPP. | (1) Working-age (18-60) couples who were continuously married during the entire 24 month panel period and who had no imputed asset data. (2) Households with self-employment income excluded. | OLS. | Ln (total net worth), Ln (non-housing net worth), Ln (liquid wealth). | Expected transfer income [probability of becoming poor multiplied with the maximum possible welfare benefits (FS & AFDC) in the state of residence] , expected unemployment insurance benefit [probability of becoming unemployed multiplied with the maximum weekly state UI benefit]. | Expected transfer income has significantly negative coefficients on log non-housing wealth and log liquid wealth but not on log net wealth. Expected UI benefit has significantly negative coefficients on all three types of wealth measures. | NA. |
| Burman el al. (2004) | 1999 tax returns and supplementary records | About 130,000 tax returns. | (1) Microsimulation. (2) Descriptive. | Distribution of tax benefits for retirement savings. | Income. | In 2004, the top 20% of tax filing units received 70% of the tax benefits for DC plans and 60% of benefits for IRAs. | Tax benefits for retirement savings disproportionately benefit higher-income groups. |
| Carroll & Samwick (1997) | 1981-1987 PSID. | Full sample. | (1) Cross-tabs between forms of wealth and estimates of income uncertainty. (2) Comparison of simulation results with cross-tabs. | Simulated distributions of age-wealth profiles. | Occupation, education, industry, & age. | Consumers who face greater income uncertainty hold greater wealth. Both transitory and permanent shocks predict levels of household wealth. The degree of precautionary savings depends on the assumed rate of time preference. | Until about age 50, households mostly do precautionary saving. After age 50, they mostly save for retirement. |
| Case & Maryanchenko (2002) | Case-Schiller weighted repeat sales indexes, American Housing Survey. | Matched pairs of single-family homes in Boston, Chicago, L.A. (time period varies by MSA). | Descriptive. | Change in home value over time, home equity accumulation. | Income. | Change in equity varied substantially depending on location and time period examined. | Homeownership can be a good or bad investment depending on timing of purchase, local housing market, and conditions in the regional economy. Cannot make blanket statement that homeownership is a good or bad strategy for helping low-income households accumulate wealth. |
| Caskey (1997) | In-depth interviews. | 30 low- to moderate-income Black and Hispanic households in Mississippi and San Jose, CA | Inductive. | Financial attitudes and behaviors. | NA. | Some did not save because social network members would insist they share their savings. | NA. |
| Caskey (2001) | SCF, survey conducted by author. | Unbanked Individuals. | Descriptive. | Characteristics of the unbanked, reasons for unbanking, an outreach strategy to bring the unbanked to the banking system. | NA. | Special branch office, or "outlets" can help bring the unbanked to the banking system. | NA. |
| Charles & Hurst (2002) | 1991-1996 PSID. | Households between the ages of 20-60 who were renters in 1991 and present every year between 1991-1996. | (1) Descriptive. (2) Multivariate. | Differences in the likelihood that black and white families become homeowners. | Race, income, marginal tax rate, neighborhood location, parental assistance, & parental wealth. | Beginning with a sample of 1991 renters, whites were much more likely than blacks to become homeowners by 1996 (32% vs. 13%). Two reasons are; 1) black mortgage applications were more than 73% more likely to be rejected than whites, 2) blacks were also less likely to apply for mortgages in the first place. | Two possible sources of discouragement for black renters in the mortgage application process: 1) anticipated differential treatment, 2) less assistance from parents and family members. |
| Chiteji & Hamilton (2005) | 1994 PSID. | 1,700 to 3,000 middle-class families. | (1) Descriptive. (2) Multivariate. | Bank account ownership, stock ownership, net worth. | Parental poverty, sibling poverty. | (1) Parental poverty reduces the probability of account and stock ownership. (2) Sibling poverty reduces wealth and the probability of account ownership. (3) Controlling for family poverty consistently reduces the effect of race on outcomes. | Poverty in the extended family may be a constraint on asset accumulation, and this may partly explain why blacks tend to have less wealth than whites. |
| Choi et al. (2002) | Survey, administrative data on 401(k) participation. | Unspecified number of employees at one U.S. firm who attended a one-hour financial education seminar. | Descriptive. | Planned and actual financial behavior. | NA. | 14% of those who said they planned to enroll in the 401(k) plan actually did so. 30% of those who said they planned to increase their contribution rates actually did so. | Financial education does not substantially increase 401(k) savings. |
| Clancy, Grinstein-Weiss, & Schreiner (2001) | Data from American Dream Demonstration. | Low-income people. | Heckman two-step regression. | Frequency and average amount of deposits into IDAs. | Financial education, other program factors, participant characteristics. | Financial education was positively related to savings outcomes up to 12 hours. | NA. |
| Consumer Federation of America (1990) | Survey. | 1,139 from general U.S. population. | (1) Descriptive. (2) Bivariate. | Financial knowledge. | Gender, age, ethnicity, education, & income. | The average participant answered only 54% of the items correctly. The average score for participants with income under $15,000 was 45%. The average score for those with income between $15,000 to 24,999 was 52%. | NA. |
| Danes & Haberman (n.d.) | Survey. | About 5,300 students who participated in NEFE High School Financial Planning Program. Sample for 3-month follow-up included 324 students. | Retrospective pretest. | Knowledge, behavior, self-efficacy. | NA. | Students reported significant increases in financial knowledge, behavior, and confidence. Almost all improvements were maintained at the 3-month follow-up. | NA. |
| Duflo et al. (2005) | Tax returns and other administrative records from H&R Block. | Over 14,000 tax prep clients in St. Louis. | (1) Experimental design. (2) Descriptive. (3) Multivariate. | IRA take-up rates, contributions. | Match rate, tax preparer. | Take-up rates and contributions varied by match rate. Take-up rates varied by tax preparer. | Match rates can have large effects on IRA take-up rates and contributions. |
| Edin (2001) | Qualitative data collected by the author. | Low-income single mothers in Chicago and Charleston, South Carolina (N=198), non-custodial low-income fathers in Philadelphia (N=180). | (1) Qualitative. (2) In-depth interview. | Types of assets held by single parents and the effects of these assets. | NA. | (1) The accumulation of assets over the life course is largely dependent upon having an income surplus, along with the belief and faith that one's income will remain relatively stable from one month to next. (2) Some low-income parents view refunds differently than wage income. Some choose not to receive the EITC in advance in order to accumulate a lump sum. | NA. |
| Engen & Gruber (2001) | 1984-1986, 1987, 1989 SIPP. | Households whose heads were aged between 25-64 with non-self-employment earnings in the wave prior to the wealth survey, whose heads' marital statuses did not change, and which had non-missing (non-imputed) values for wealth data (N=24,904). | Robust regression. | Gross financial assets. | Expected Unemployment Insurance (UI) benefit replacement rate (based on state-year variation in UI benefits). | Unemployment Insurance (UI) benefit replacement rate has a significantly negative association with gross financial assets. Reducing the UI benefit replacement rate by 50% is estimated to increase the average households' financial asset-to-income ratio by 14%. | The precautionary motive is an important determinant of individual savings behavior. |
| Finn, Zorita, & Colton (1994) | In-depth interviews. | 20 women living in extreme-poverty neighborhoods. | Inductive. | Perceptions of assets. | NA. | Cars were perceived as assets but also drained resources. | NA. |
| Gale & Scholz (1994) | 1983, 1986 SCF. | Full sample (2,822 households including 359 in the high-income sample). | Descriptive. | Net worth. | Inter vivos, inheritances. | Intended family transfers and bequests are estimated to account for 51% of current U.S. wealth. Of that 51%, intended family transfers account for 20% and bequests account for 31%. Additional 12% was acquired through the payment of college expenses by parents. Consequently, approximately two-thirds of the net worth that individuals acquire comes through family transfers. | Intended transfers are an important source of wealth. |
| Gittleman & Wolff (2004) | 1984, 1989, 1994 PSID. | Households where head stays the same, trimming the top and bottom 1% of wealth appreciation distribution. | (1) Descriptive. (2) Multivariate. (3) Simulation. | Inheritances, saving rates, rates of return (for blacks and whites). | Race. | Savings and inheritances tend to raise the rate of wealth accumulation for Whites relative to Blacks. For this period, rate of return to capital higher for Blacks. | Blacks would have gained more ground relative to Whites if they inherited similar amounts, had comparable income, and similar portfolio composition. Controlling for income, no racial differences in savings behavior. However, even with extreme changes to achieve parity with Whites in terms of rates of wealth accumulation, racial gaps in wealth would remain for long periods. |
| Glaeser & Shapiro (2002) | 1998 SCF. | Not described. | Descriptive. | Share of itemizers by income, share of itemized income by income. | Income group. | Low-income Americans rarely itemize. Only 13% of homeowners in the bottom forty percent of the income distribution itemize. Almost 50% of people in the top decile itemize, whether they are home owners or not. | Home mortgage interest deduction is a poor instrument for encouraging homeownership because it benefits the wealthy, who are almost always homeowners. |
| Gruber & Yelowitz (1999) | 1984-1993 SIPP, 1984-1993 CES. | Households headed by those between ages of 18-64 and without members over age 65. | Instrumental variables regressions. | SIPP: Ln (Net worth) Having positive net worth, CEX: Ln (total nondurable, nonmedical consumption). | Expected Medicaid eligible dollars (probability of becoming Medicaid eligible * area/age/sex-specific mean medical spending), Medicaid eligible dollar* existence of asset test. | (1) Significantly negative coefficients of expected Medicaid dollars on probability of having positive net worth and amount of net worth; significantly positive coefficient of expected Medicaid dollars on consumption. (2) Interaction term has a significant coefficients in all three regressions. (3) Coefficient size of interaction term is twice expected Medicaid dollars in net worth regression, suggesting that an asset test" more than doubles the wealth reduction attributable to expanding Medicaid eligibility". | NA. |
| Hao (1996) | NSFH. | Black, white, Hispanic families with children 18 years old or younger. | OLS. | Net worth. | Family structure, private transfers, interactions of family structure and private transfers. | (1) Marriage is a wealth-enhancing institution. (2) Private transfers promote family net worth. (3) Marriage reinforces the promoting effect of private transfer on family wealth. | NA. |
| Heflin & Patillo (2002) | NLSY. | 7,573 white or African American individuals aged 14-21 in 1978. | (1) Descriptive. (2) Logistic regression. | Account ownership and homeownership in 1994. | Race, sibling poverty, parental poverty. | Families were less likely to have bank accounts when they had poor siblings and parents. White families were less likely to own homes when they had poor siblings and parents. | Demands from disadvantaged network members may decrease resources (even to the point that households do not have enough to justify owning an account). |
| Hilgert, Hogarth, & Beverly (2003) | Supplement to Nov and Dec 2001 Survey of Consumers. | 1,004 households, representative of contiguous U.S. | Descriptive. | 4 indices of financial behavior (cash-flow management, credit management, saving, & investment). | Financial knowledge. | There was a positive association between overall financial knowledge and following recommended financial practices. There were also positive associations between specific types of financial behavior and specific types of financial knowledge. | Financial education (combination of information, skill-building, motivation) may improve financial behavior. |
| Hirad & Zorn (2002) | Freddie Mac's Affordable Gold Program. | Low-income (100% or less of area median income) borrowers for homeownership. | Comparisons of means between treatment and control groups. | Borrower's delinquency rates for low-income individuals. | Pre-purchase home ownership counseling, administrative and delivery mechanisms. | (1) Home ownership counseling can reduce the delinquency rates of borrowers. (2) In particular, counseling conducted in a classroom or individual setting is effective, while home study or telephone counseling is not effective. | NA. |
| Hogan et al. (2004) | Qualitative data from in-depth interviews. | 25 working IDA holders in Minnesota. All had income between 100% and 200% of poverty level and had at least one child. | Analytic induction. | NA. | NA. | Financial crises make saving difficult. Support from friends, family, and organizations helped some cope with crises and so helped them save. Some families are very committed to saving, very resourceful in efforts to save. | Financial vulnerability is a barrier, but decision-makers should not assume that LIH cannot save. |
| Hogarth, Anguelov, & Lee (2005) | 1989, 1992, 1995, 1998, 2001 SCF. | Sample sizes ranged from about 3,000 to about 4,500 households. | (1) Descriptive. (2) Logistic regression. | Whether or not household had transaction account. | Income group, net worth, education, & race/ethnicity. | Account ownership increased between 1989 and 2001. All listed explanatory variables were significantly associated with banked status. Largest effects were found for income, net worth, and education. | Policies that support employment, income, and asset accumulation will encourage participation in the mainstream financial system. |
| Hogarth & Lee (2000) | SCF. | Low- to moderate-income households (with incomes at 80% of the regional median or less). | Descriptive. | Financial portfolios of poor households, uses of various types of financial institutions. | NA. | Compared to all U.S. households, low- to moderate-income households are less likely to hold financial products. | NA. |
| Hubbard, Skinner & Zeldes (1995) | 1984 PSID. | Full sample. | Model simulation with parameters derived from the PSID, comparing outcomes with PSID aggregates. | Simulated distributions of age-wealth profiles. | Minimum guaranteed consumption floor by government programs ($1000 vs. $7000). | The simulated wealth pattern with a $7000 consumption floor assumption generally predicts wealth accumulation patterns across education groups. | Low wealth accumulation can be explained as a utility-maximizing response to asset-based, means-tested welfare programs. |
| Hurst & Ziliak (2006) | 1994-2001 PSID. | Households where the head was between the ages of 18-44 in 1994, had less than 16 years of education, remained in the sample continuously between 1994-2001, did not change marital status between 1994-2001, and did not have missing values for wealth in either 1994 and 2001. | Difference-in difference (OLS, robust regressions). | Change in liquid asset between 1994-2001, change in net worth between 1994-2001, vehicle ownership, home ownership, & checking account. | State asset limits on liquid asset and vehicle asset in 2001. | No significant effect of relaxed liquid asset limit on liquid assets. No significant effect of relaxed liquid asset limit on home ownership, checking account ownership, stock ownership, and business ownership. Statistically positive effect of relaxed liquid assets. | NA. |
| Jayakody (1998) | PSID, its 1988 Time and Money Transfers file supplement. | 4,965 black and white families for which either the head or spouse has at least one living parent. | (1) Descriptive. (2) Multivariate regression. | Receipt of financial assistance from parents, amount of money received. | Income, race, family structure. | Overall, there is no race difference in the likelihood of receiving financial assistance when other variables are controlled. In sub-group analyses, Whites are more likely to receive assistance only in the low-income group (less than $15,000). | Black kin networks may be inadequate to mitigate the financial strain faced by low-income households. Not all families can step in and provide assistance to less well off kin. |
| Kennickell, Starr-McCluer, and Sunden (1997) | Focus group. | Eight Chicago residents with high income and/or high wealth. | Descriptive. | NA. | NA. | Several participants mentioned the need to put money "out of reach" to avoid spending it. | Saving requires self-control. |
| Kempson, McKay, & Collard (2005) | Surveys and in-depth interviews of participants in Saving Gateway pilot project. | Low-income individuals in five areas of England who chose to participate in matched-savings program. 1,030 completed baseline survey, 539 completed follow-up survey, about 30 completed in-depth interviews. | Descriptive. | Perceptions of saving program, sources of saving. | NA. | 1:1 match was main reason many opened accounts. Participants liked that they had to keep money in account for 18 months to maximize match. They were not in favor of restrictions on use of match money. It was uncommon for participants to borrow or transfer money from other accounts to make deposits. However, the money used to make deposits may have been saved (formally or informally) even in the absence of this program. | NA. |
| Kotlikoff & Bernheim (2001) | 1993 survey of nationally, representative sample of individuals between 29-47 years old. | 1,209 individuals completed Wave 1, with questions about intended and actual saving and financial attitudes. 806 completed Wave 2, with questions about financial knowledge. | (1) Multivariate. (2) Instrumental variable regression. | Ratio of retirement savings to earnings (variables self-reported). | Financial knowledge. | Financial knowledge was positively associated with retirement savings. | Increasing financial knowledge will increase retirement savings. |
| Lusardi (2002) | HRS. | About 3,000 U.S. households with financial respondent aged 50 to 61. | (1) Multivariate. (2) Controls for several variables that may proxy for individual characteristics associated with greater saving. | Financial net worth, total net worth. | Attended employer-sponsored retirement seminar. | Attending retirement seminars has large positive effect on wealth for low-wealth and low-educated groups, but not for higher wealth and higher-educated groups. | Providing information and reducing planning costs (e.g., through retirement seminars) may facilitate asset accumulation. |
| McKernan, Ratcliffe, and Nam (2007) | 1990, 1992, 1993, 1996, and 2001 SIPP | Low education single mother sample: female household heads 18-54 years old and high school degree or less education: Low-education families: families whose head and/or spouse are ages 18 through 54 and with high school degree or less education | Fixed effect regressions | (1) presence of liquid assets, (2) value of liquid assets, (3) vehicle ownership, (4) vehicle equity, (5) net worth (excluding housing), and (6) net worth (including housing). | AFDC/TANF asset limits, IDA program rules, Food Stamp asset limits | Generous asset limit on unrestricted account is not significantly associated with liquid asset holdings but generous restricted account asset limits increase liquid asset holdings. The number of years since unrestricted asset limits became more generous (greater than $1000) is associated with increased liquid asset holdings. | |
| Madrian & Shea (2000) | Administrative data on 401(k) participation. | Several thousand employees under age 65 in one large U.S. firm. | (1) Natural experiment. (2) Descriptive analysis. | 401(k) participation and allocation. | Automatic enrollment in 401(k) plan. | Participation in 401(k) plan was significantly higher after the firm began automatic enrollment. Participants were also likely to stay with the default contribution rate and allocation. | The "power of suggestion" can produce large changes in saving behavior. |
| Mayer & Engelhardt (1996) | 1988, 1990, 1993 Chicago Title and Trust Company survey of recent home buyers. | A random sample of about 1300 first time home buyers, collected in 18 major U.S. cities. | (1) Descriptive. (2) Multivariate | Gift amount as percent of down payment. | Income, median home price in city. | Between 1985 and 1993, the average number of years that households saved for down payments increased, the average down payment as a percent of purchase price decreased, and the percent of down payment coming from personal savings decreased. For recipients, the average gift equaled 51% of total down payment. | Home ownership is becoming less affordable for first-time buyers. |
| Menchik & Jianakoplos (1997) | 1976 NLS of Mature Men, 1989 SCF. | (1) NLS: men ages 45-59 in 1966 who remained in the sample in 1976. (2) SCF: Full sample. | (1) Descriptive. (2) OLS. | Receipt of inheritance and the relevance of this factor in explaining racial differences in household wealth. | Race, income, age, inheritance, asset composition, rate of return on assets, & value of private pensions. | Whites in both samples were more likely to have received an inheritance and to expect to receive an inheritance in the future. In addition, inheritances are estimated to significantly increase household wealth. Although differences in permanent income explain more variance, racial differences in inheritance can explain between 10% and 20% of the average racial differences in household wealth in 1989. | Racial differences in wealth among current households reflect in part the influence of prior generations. |
| Milligan (2003) | Administrative data. | Random sample of about 42,000 Canadian tax filers. | (1) Natural experiment. (2) Multivariate analysis. | Contributions to Canadian tax-preferred retirement savings account. | Contribution rules. | Controlling for censoring of desired saving at the match cap, a $1 increase in the match cap is associated with a 50-cent increase in saving. | NA. |
| Moore et al. (2001) | Survey. | About 300 participants in six IDA programs. | (1) Descriptive. (2) Bivariate. (3) Multivariate. | Sources of savings. | NA. | 92% of IDA participants said they liked the restrictions on withdrawals. Sizeable percentages said they had increased their work efforts and reduced consumption because they had IDAs. Smaller percentages said they financed deposits with debt or were less likely to save in other forms because they had IDAs. 82% said it was difficult to save because most of their money went to necessities. | Economic resources affect saving outcomes. IDA participants were willing to alter consumption patterns to save in IDAs. |
| Nam (2008) | 1994, 2001 PSID. | Household heads 18-57 years old who had 15 or less years of education in 1994, maintained the same marital status, lived in the same state, were not in school, and did not have work-limiting health conditions throughout the observation period (1994-2001). | Difference-in difference (median regression, robust logic regression). | Changes in liquid asset between 1994-2001, vehicle ownership in 2001. | State asset limits on general, special, and vehicle assets in 2000 and years since new asset limits were introduced. | The earlier a state raised its asset limit on general accounts, the more likely female-headed households with children were to accumulate liquid assets between 1994 and 2001. Among those who were able to save, the amount of saving was significantly higher for those who lived in states that allowed special accounts with high asset limits early. The longer new asset limits had been in place, the more likely female-headed households with children, relative to the non-target population, were to own a vehicle and to own a vehicle above the previous value limit of $1,500. | NA. |
| Neumark & Powers (1998) | 1983-1986 SIPP(1984 panel). | Male householders aged 60-64. | Difference-in difference (median regression). | Saving (change in net wealth excluding housing between waves 4 and 7). | Maximum state SSI benefit in 1985. | Significantly negative coefficient of SSI benefit level on saving. | NA. |
| Nyce (2005) | Administrative data on 401(k) participation, survey data describing financial communication of firm. | Over 306,000 employees of 48 firms that offer 401(k)s. (only 26 of these firms completed survey describing their 401k plan.) | (1) Descriptive. (2) Multivariate. | 401(k) participation and contributions. | Nature of financial communication. | Financial communication is significantly and positively related to 401(k) participation, especially for low earners. Financial communication is positively associated with contribution rates. | Firms can encourage 401(k) savings by improving financial communication. |
| Olson & Davis (1994) | In-depth interviews. | 30 low-income women in Chicago. | Inductive. | Perceptions of EITC. | NA. | Some women thought about refunds differently than wage income. Some were not interested in the advance-payment option. They wanted to accumulate a lump sum for special purposes. | NA. |
| Powers (1998) | 1978-1983 NLS-YW. | 229 female head of households whose marital status did not change between 1978-1983. | Robust regression. | Change in total net wealth (excluding vehicle value) between 1978-1983. | Change in state asset limits between 1978-1983. | Significantly positive coefficient of asset limit (about 0.25) on assets. | NA. |
| Reid (2004) | PSID. | 5,300 renters who had not owned a home in past five years. | (1) Descriptive. (2) Multivariate. | Home ownership status, value of home, home equity. | Income, race. | (1) Among low-income renters, whites, married couples, professionals, and those with at least HS degree were more likely to buy homes. (2) Many homeowners, especially low-income and minority, return to renting. (3) Financial returns to home ownership were very small for low-income minorities, low-income whites, and middle-income minorities. Still, housing wealth is essentially the only asset for many low-income minority home owners and some do experience appreciation. (4) Experiencing a divorce is one of the most important factors in the transition from owing to renting, regardless of race or income. | (1) Homeownership disproportionately benefits white and middle- and upper-income households. (2) Increasing homeownership among blacks will not substantially reduce the racial wealth gap. (3) Homeownership is an incredibly fluid category, with many families moving in and out of homeownership several times over the course of their lives. |
| Romich & Weisner (2000) | In-depth interviews. | 42 families randomly selected from families who volunteered for an anti-poverty program in Wisconsin. | Inductive. | Perceptions and use of EITC. | NA. | Some view and use refunds differently than wage income. Some prefer a lump-sum over the advance-payment option. | The preference for a lump-sum is consistent with behavioral economic theory. |
| Sarkisian & Gerstel (2004) | 1992-1994 NSFH. | 9200 black and white households. | (1) Descriptive. (2) Multinomial logistic regression. | Gender and class differences in kin support among blacks and whites. | Race, income, wealth, education, employment status, employment hours, occupation, & public assistance (structural variables). | Whites report greater financial and emotional kin support while blacks are involved in more practical help (transportation, household work, and child care). Black men and white men are very similar while significant differences exist between women. | Many racial differences in kin support can be explained by structural and class differences. |
| Schmidt & Sevak (2004) | PSID. | A national representative sample of households. | (1) OLS. (2) Quantile regression. | Net worth. | Family structure, gender, other demographic and socioeconomic variables. | After controlling for other demographic and socioeconomic factors, the net worth of married couples is higher than other family types, and single females have the least wealth holdings. However, the wealth gaps by gender and family types may emerge later in life. | NA. |
| Schoeni(1997) | 1988 PSID with supplement on private interhousehold transfers. | About 6,000 individuals aged 20 to 80. | (1) Descriptive. (2) Multivariate. | Interhousehold transfers of money and time in 1987. | Age, income, home purchase. | Home purchase in the past year was positively associated with the receipt of money and time help. | NA. |
| Schoeni & Ross (2005) | PSID (1988 with Special Time and Money Transfers Supplement). | 6,661 young adults between 18-34 years old, including 4,848 who were heads of household or spouses in 1988. | (1) Descriptive. (2) Synthetic cohort approach. | Total amount of material assistance (housing, food, educational expense or cash) received by young adults during transition to adulthood. | Parents' economic status when they were 10-15 years old. | (1) Young adults receive about $38,000 in material assistance (housing, food, support for educational expenses, or cash) throughout transition to adulthood (from 18 to 34 years old), annual average = $2,200. (2) Young adults in top quartile of family income receive three times more material assistance than those in bottom quartile. | More research needed to determine if material assistance, or some other family mechanism, leads to more successful transition for children of affluent parents. |
| Schreiner & Sherraden (2007) | Administrative data from ADD. | Over 2,000 participants in 14 IDA programs. | (1) Descriptive. (2) Multivariate. | IDA saving. | Match rate, match cap. | Participants who were eligible for higher match rates were more likely to be "savers" but had lower monthly net savings. When both of these effects are considered, higher match rates increased average saving. Higher match caps were associated with greater saving. Net IDA deposits increased substantially during tax season. | Higher match rates increase inclusion. Many IDA participants were saving for fixed goals. |
| Schreiner et al. (2001) | Administrative data from ADD. | Over 2,000 participants in 14 IDA programs. | (1) Descriptive. (2) Multivariate. | Sources of IDA deposits. | NA. | Many participants had no or very low liquid assets at enrollment. Most had too few liquid assets to fund all of their IDA deposits. | IDA deposit comes from both new savings and shifted assets. |
| Shapiro (2004) | Qualitative data from in-depth interviews, SIPP, PSID. | In-depth interview sample of 200 poor to middle-class families with school-age children in Boston, LA, and St. Louis. | Descriptive. | Receipt of transfer or financial assistance, effects of transfer/financial assistance. | Race. | (1) Sizable inheritances and inter vivos gifts can give young families a "head start" (e.g., Allows home purchase in neighborhood with good schools). (2) Whites are more likely than blacks to receive sizable transfers. (3) Families with assets are able to acquire high-quality education for their children, and their education can transfer their economic advantages to their children. | Transfer of "transformative assets" perpetuates inequality. |
| Sherraden, McBride et al. (2005) | In-depth interviews. | 59 IDA participants in OK, plus 25 non-IDA participants. | Inductive. | Perceptions of saving and IDA program, sources of saving. | NA. | The match was a primary reason for opening IDAs. Some participants like restrictions on withdrawals, and restrictions may be translated into goals. Direct deposit and encouragement from IDA staff helped some participants save. Medical expenses and vehicle breakdowns made saving difficult. | NA. |
| Smeeding, Phillips, & O'Connor (2000) | Survey. | 650 tax units with children, living in Chicago and expecting to receive a federal refund and EITC benefits. | (1) Descriptive. (2) Bivariate. | Planned use of tax refund. | NA. | Paying bills was the most common planned refund use. One-half said they planned to save some or all. 22% planned to purchase or repair a car. | Families plan to use EITC refunds for immediate consumption and for investments in longer-term well-being. |
| Stack (1974) | Observation, in-depth interviews. | Individuals and families in one Midwestern, urban, low-income, black community in the 1970s. | (1) Descriptive. (2) Inductive. | "Survival strategies". | NA. | Frequent demands from social network members made it difficult for blacks to accumulate assets. | |
| Sullivan (2006) | 1992-1999 SIPP (1992, 1993, 1996 panels). | Single mothers with a high school degree or less, single mothers and single women without children (comparison group) with a high school degree or less. | (1) Probit. (2) OLS. (3) Difference-in-difference. | Vehicle ownership, vehicle equity, liquid assets. | Vehicle asset limit, liquid asset limit. | Relaxed vehicle limit significantly increase vehicle ownership among single mothers. Increased asset limit has negligible effect on vehicle ownership and liquid assets. | NA. |
| Tennyson & Nguyen (2001) | 1997 survey of high school students conducted by Jumpstart Coalition for Personal Financial Literacy. | High school students and teachers. | OLS. | Personal financial literacy. | Curriculum mandates and required specific financial education course work. | (1) Curriculum mandates, broadly defined, are not generally associated with financial literacy. (2) Students in states that required specific financial education course work scored higher. | NA. |
| Thaler & Benartzi (2004) | Administrative data. | 315 employees at midsize manufacturing company who were eligible for retirement savings plan. | Descriptive. | Contribution rates. | Participation in SMarT plan (precommitment plan). | Those who precommitted to save most of their pay raises increased their average saving rate much more than those who agreed to try to increase their saving but did not arrange for automatic saving increases. | Inertia is powerful. Carefully constructed saving programs can increase saving. |
| Wilhelm (2001) | Mid- to late-1980s PSID. | Unweighted samples vary from about 4,000 to about 6,000. | Direct estimation. | Inheritance, inter vivos gifts. | Income, race, age, education, & occupation. | (1) Household in highest permanent income quintile is much more likely to have received inheritance than a household in lowest quintile (28% vs 13%). Average inheritance amount (conditional on receipt varies dramatically by income (e.g., Average for highest permanent income quintile is almost 5 times as high as average for lowest quintile). (2) Likelihood of receiving inter vivos gift doesn't vary that much by income. However, amount of gift (conditional on receipt) does increase with income. | A large share of wealth is traceable to intergenerational transfers. These transfers disproportionately go to higher-income families. However, a non-negligible number of low- to moderate-income households receive sizeable transfers. |
| Wolff (2002) | 1989, 1992, 1995, 1998 SCF. | Full sample (both core and high-income supplement). | Descriptive. | Receipt of financial transfers, amount of transfers, present net value of all transfers in 1998 dollars. | Race, income. | Twenty percent of all households received a transfer in 1998. The proportion of non-Hispanic whites receiving a transfer was more than twice that of other groups (23.8% for whites, 10.8% for blacks, 4.2% for Hispanics, and 9.1% for Asian and other races). | Although poor households receive less in inheritances than non-poor households, wealth transfers may reduce wealth inequality. This is because even a small gift to the poor may make up a huge portion of their wealth portfolio. Even though wealth inequality rose between 1983 and 1998, it might have been worse without the mitigating effects of gifts and inheritances. |
| Woo, Schweke & Buchholz (2004) | Microsimulation by Institute on Taxation and Economic Policy. | Database of almost 750,000 tax returns and supplementary records. | Simulation, using existing tax returns and government or other respected projections. | Distribution of tax expenditures for mortgage interest and property tax deductions. | Income group. | Most benefits of mortgage interest and property tax deductions accrue to high-income taxpayers. | Federal policies disproportionately benefit those who highest incomes and most assets. |
| Zhan, Anderson, & Scott (2006) | Pretest and posttest survey of financial education (FLLIP) participants. | 163 low-income (below or at 200% poverty line) people in Illinois. | (1) Descriptive. (2) Multivariate. | Pre-training financial knowledge, knowledge gains. | (1) For pre-training knowledge: participant characteristics. (2) For knowledge gains: financial training program and participant characteristics. | Single participants had better financial knowledge than married participants. | NA. |
| Ziliak (2003) | 1980-1991 PSID. | 1,210 male and female household heads between the ages of 25 - 52 in 1980 who did not change marital status over the sample period (14,520 person-year). | (1) Generalized method-of-moments (GMM). (2) Decomposition. | Ln(liquid-wealth-to-permanent-income ratio), Ln(net-wealth-to-permanent-income ratio). | Permanent asset-tested transfer income (12 year average over observation period), permanent non-asset tested transfer income. | (1) Permanent asset-tested transfer income and permanent non-asset-tested transfer income have significantly negative associations with liquid-asset-to-income-ratio. The former has much larger effect on liquid asset accumulation. (2) Both asset-tested and non-asset tested transfer income have negative but not statistically significant effect on net-wealth-to-income ratio. (3) Decomposition results indicate that virtually all rich-poor liquid asset gap is attributable to differences in average characteristics, not differences in coefficients. | NA. |
References
Aizcorbe, Ana M., Arthur B. Kennickell, and Kevin B. Moore. 2003. Recent Changes in U.S. Family Finances: Results from the 1998 and 2001 Survey of Consumer Finances. Federal Reserve Bulletin 89(1): 132.
Altman, Barbara M., and Amy K. Taylor. 2004. Women in the Health Care System: Health Status, Insurance, and Access to Care. Rockville, MD: Agency for Healthcare Research and Quality.
Ameriks, John, Andrew Caplin, John Leahy, and Tom Tyler. 2004. Measuring Self-Control. Cambridge, MA: National Bureau of Economic Research.
Anderson, Steven G., Min Zhan, and Jeff Scott. 2004. Targeting Financial Management Training at Low-Income Audiences. Journal of Consumer Affairs 38(1): 16777.
Ando, Albert, and Franco Modigliani. 1963. The Life Cycle Hypothesis of Saving: Aggregate Implications and Tests. American Economic Review 53: 5584.
Ashraf, Nava, Dean S. Karlan, and Wesley Yin. 2006. Tying Odysseus to the Mast: Evidence from a Commitment Savings Product in the Philippines. Quarterly Journal of Economics 121(2): 63572.
Banov, Rachel. 2005. The Effect of Health Insurance on Savings Outcomes in Individual Development Accounts. St. Louis, MO: Washington University in St. Louis, Center for Social Development.
Barrow, Lisa, and Leslie McGranahan. 2000. The Effects of the Earned Income Credit on the Seasonality of Household Expenditures. National Tax Journal 53(4, Part 2): 121144.
Bayer, Patrick J., B. Douglas Bernheim, and John Karl Scholz. 1996. The Effects of Financial Education in the Workplace: Evidence from a Survey of Employers. Cambridge, MA: National Bureau of Economic Research.
Belsky, Eric, and Allegra Calder. 2004. Credit Matters: Low-Income Asset Building Challenges in a Dual Financial Service System. Cambridge, MA: Harvard University, Joint Center for Housing Studies.
Belsky, Eric S., and Mark Duda. 2002. Asset Appreciation, Timing of Purchase and Sales, and Returns to Low-Income Homeownership. In Low-Income Homeownership: Examining the Unexamined Goal, edited by Nicolas P. Retsinas and Eric S. Belsky. Cambridge, MA: Joint Center for Housing Studies and Washington, DC: Brookings Institution Press.
Bernheim, B. Douglas. 1994. Personal Saving, Information, and Economic Literacy. In Tax Policy for Economic Growth in the 1990s. Washington, DC: American Council for Capital Formation.
. 1997. Rethinking Saving Incentives. In Fiscal Policy: Lessons from Economic Research, edited by A. Auerbach. Cambridge, MA: MIT Press.
. 1998. Financial Illiteracy, Education, and Retirement Saving. In Living with Defined Contribution Plans, edited by O. S. Mitchell and S. J. Schieber. Philadelphia, PA: University of Pennsylvania, Wharton School, Pension Research Council.
Bernheim, B. Douglas, and Daniel M. Garrett. 2003. The Effects of Financial Education in the Workplace: Evidence from a Survey of Households. Journal of Public Economics 87(78): 14871519.
Bernheim, B. Douglas, Daniel M. Garrett, and Dean M. Maki. 2001. Education and Saving: The Long-Term Effects of High School Financial Curriculum Mandates. Journal of Public Economics 80: 43565.
Bernheim, B. Douglas, and John Karl Scholz. 1993. Private Saving and Public Policy. Tax Policy and the Economy 7: 73110.
Beverly, Sondra G., Amanda Moore, and Mark Schreiner. 2003. A Framework of Asset-Accumulation Stages and Strategies. Journal of Family and Economic Issues 24(2):14356.
Beverly, Sondra G., Jennifer L. Romich, and Jennifer Tescher. 2003. Linking Tax Refunds and Low-Cost Bank Accounts: A Social Development Strategy for Low-Income Families? Social Development Issues 25(1/2): 23546.
Beverly, Sondra G., Daniel Schneider, and Peter Tufano. 2006. Splitting Tax Refunds and Building Savings: An Empirical Test. In Tax Policy and the Economy 20, edited by J. M. Poterba. Cambridge, MA: MIT Press.
Beverly, Sondra G., and Michael Sherraden. 1999. Institutional Determinants of Saving: Implications for Low-Income Households and Public Policy. Journal of Socio-Economics 28(4): 45773.
Bird, Edward J., and Paul A. Hagstrom. 1999. The Wealth Effects of Income Insurance. Review of Income and Wealth 45(3): 33952.
Brobeck, Stephen. 2002. Developing a National Strategy to Advance Financial Literacy. Washington, DC: Consumer Federation of America.
Burman, Leonard E., William G. Gale, Matthew Hall, and Peter R. Orszag. 2004. Distributional Effects of Defined Contribution Plans and Individual Retirement Arrangements. National Tax Journal 57(3): 671701.
Carasso, Adam, and Signe-Mary McKernan. 2007. The Balance Sheets of Low-Income Households: What We Know about Their Assets and Liabilities. A Report in the Series: Poor Finances: Assets and Low-Income Households. Washington, DC: Office of the Assistant Secretary for Planning and Evaluation, U.S. Dept. of Health and Human Services. http://aspe.hhs.gov/hsp/07/PoorFinances/balance/
Carroll, Christopher D. 1997. Buffer-Stock Saving and the Life Cycle/Permanent Income Hypothesis. Quarterly Journal of Economics 12(1): 155.
Carroll, Christopher D., and Andrew A. Samwick. 1997. The Nature of Precautionary Wealth. Journal of Monetary Economics 40(1): 4171.
Case, Karl E., and Maryna Marynchenko. 2002. Home Price Appreciation in Low- and Moderate-Income Markets. In Low-Income Homeownership: Examining the Unexamined Goal, edited by N. P. Retsinas and E. S. Belsky. Cambridge, MA: Joint Center for Housing Studies and Washington, DC: Brookings Institution Press.
Caskey, John P. 1997. Beyond Cash-and-Carry: Financial Savings, Financial Services, and Low-Income Households in Two Communities. Swarthmore, PA: Swarthmore College.
. 2001. Can Lower Income Households Increase Savings with Financial-Management Education? Cascade 46(Summer/Fall):14, 1011, 18.
Charles, Kerwin Kofin, and Erik Hurst. 2002. The Transition to Home Ownership and the Black-White Wealth Gap. Review of Economics and Statistics 84(2): 28197.
Chiteji, Ngina, and Darrick Hamilton. 2005. Family Matters: Kin Networks and Asset Accumulation. In Inclusion in the American Dream: Assets, Poverty, and Public Policy, edited by M. Sherraden. New York: Oxford University Press.
Chiteji, Ngina S., and Frank P. Stafford. 1999. Portfolio Choices of Parents and Their Children as Young Adults: Asset Accumulation by African-American Families. American Economic Review 89(2): 37780.
Choi, James C., David Laibson, and Brigitte C. Madrian. 2004. Plan Design and 401(k) Savings Outcomes. National Tax Journal 57(2): 27598.
Choi, James, David Laibson, Brigitte Madrian, and Andrew Metrick. 2002. Defined Contribution Pensions: Plan Rules, Participant Decisions, and the Path of Least Resistance. Tax Policy and the Economy 16: 67114.
Clancy, Margaret, Michal Grinstein-Weiss, and Mark Schreiner. 2001. Financial Education and Savings Outcomes in Individual Development Accounts. St. Louis, MO: Washington University in St. Louis, Center for Social Development.
Clancy, Margaret, Peter Orszag, and Michael Sherraden. 2004. College Savings Plans: A Platform for Inclusive Saving Policy? St. Louis, MO: Washington University in St. Louis, Center for Social Development.
Clancy, Margaret, and Michael Sherraden. 2003. The Potential for Inclusion in 529 Savings Plans: Report on a Survey of States. St. Louis, MO: Washington University in St. Louis, Center for Social Development.
Cohen, Stewart. 1994. Consumer Socialization: Children's Saving and Spending. Childhood Education 70(4): 24446.
Consumer Federation of America. 1990. Consumer Knowledge: The Results of a Nationwide Test. Washington, DC: Author.
Corporation for Enterprise Development. 2002. 2002 Federal IDA Briefing Book: How IDAs Affect Eligibility for Federal Programs. Washington, DC: Author.
Danes, Sharon M., and Heather Haberman. n.d. 20032004 Evaluation of the NEFE HSFPP. Greenwood Village, CO: National Endowment for Financial Education.
Deaton, Angus. 1991. Saving and Liquidity Constraints. Econometrica 59(5): 122148.
DeNavas-Walt, Carmen, Bernadette D. Proctor, and Cheryl Hill Lee. 2006. Income, Poverty, and Health Insurance Coverage in the United States: 2005. Washington, DC: U.S. Government Printing Office.
Dubois, W. E. Burghardt. 1935. Black Reconstruction: An Essay Toward a History of the Part Which Black Folk Played in the Attempt to Reconstruct Democracy in America, 1860 1880. New York: Harcourt, Brace and Company
Duesenberry, James S. 1949. Income, Saving and the Theory of Consumer Behavior. Cambridge, MA: Harvard University Press.
Duflo, Esther, William Gale, Jeffrey Liebman, Peter Orszag, and Emmanuel Saez. 2005. Saving Incentives for Low- and Middle-Income Families: Evidence from a Field Experiment with H&R Block. Washington, DC: Retirement Security Project.
Edin, Kathryn J. 2001. More than Money: The Role of Assets in the Survival Strategies and Material Well-Being of the Poor. In Assets for the Poor: The Benefits of Spreading Asset Ownership, edited by Thomas M. Shapiro and Edward N. Wolff. New York: Russell Sage Foundation.
Engelhardt, Gary V. 2002. PreRetirement LumpSum Pension Distributions and Retirement Income Security: Evidence from the Health and Retirement Study. National Tax Journal 55(4): 66585.
Engen, Eric M., William G. Gale, and John Karl Scholz. 1996. The Illusory Effects of Saving Incentives on Saving. Journal of Economic Perspectives 10(4): 11338.
Engen, Eric M., and Jonathan Gruber. 2001. Unemployment Insurance and Precautionary Saving. Journal of Monetary Economics 47(3): 54579.
Finn, Cathleen M., Paz M.-B. Zorita, and Claudia Coulton. 1994. Assets and Financial Management Among Poor Households in Extreme Poverty Neighborhoods. Journal of Sociology and Social Welfare 21(4): 7594.
Frederick, Shane, George Loewenstein, and Ted O'Donoghue. 2003. Time Discounting and Time Preference: A Critical Review. Journal of Economic Literature 40(2): 351401.
Friedman, Milton. 1957. A Theory of the Consumption Function. Princeton, NJ: Princeton University Press.
Furnham, Adrian. 1985. Why do people save? Attitudes to, and Habits of, Saving Money in Britain. Journal of Applied Social Psychology 15(4): 35473.
Gale, William G., and John Karl Scholz. 1994. Intergenerational Transfers and the Accumulation of Wealth. Journal of Economic Perspectives 8:14560.
Gale, William G., J. Mark Iwry, and Peter R. Orszag. 2004. The Saver's Credit: Issues and Options. Tax Notes 103(5): 597612.
Gittleman, Maury, and Edward N. Wolff. 2004. Racial Differences in Patterns of Wealth Accumulation. Journal of Human Resources 39(1): 193227.
Glaeser, Edward L., and Jesse M. Shapiro. 2002. The Benefits of the Home Mortgage Interest Deduction. Cambridge, MA: Harvard Institute of Economic Research.
Gruber, Jonathan, and Aaron Yelowitz. 1999. Public Health Insurance and Private Savings. Journal of Political Economy 107(6): 124974.
Gyourko, Joseph, Peter Linneman, and Susan Wachter. 1999. Analyzing the Relationships among Race, Wealth, and Home Ownership in America. Journal of Housing Economics 8(2): 6389.
Hao, Lingxin. 1996. Family Structure, Private Transfers, and the Economic Well-Being of Families. Social Forces 75(1): 26992.
Heflin, Colleen M., and Mary Patillo. 2002. Kin Effects on Black-White Account and Home Ownership. Sociological Inquiry 72(2): 22039.
Highfill, Janet, Douglas Thorson, and William V. Weber. 1998. Tax Overwithholding as a Response to Uncertainty. Public Finance Review 26(4): 37691.
Hilgert, Marianne A., Jeanne M. Hogarth, and Sondra G. Beverly. 2003. Household Financial Management: The Connection between Knowledge and Behavior. Federal Reserve Bulletin 89(7): 30922.
Himmelstein, David U., Elizabeth Warren, Deborah Thorne, and Steffie Woolhandler. 2005. MarketWatch: Illness and Injury as Contributors to Bankruptcy. Health Affairs Web Exclusive February 2.
Hirad, Abdighani, and Peter M. Zorn. 2002. Prepurchase Homeownership Counseling: A Little Knowledge is a Good Thing. In Low-Income Homeownership: Examining the Unexamined Goal, edited by N. P. Retsinas and E. S. Belsky. Cambridge, MA: Joint Center for Housing Studies and Washington, DC: Brookings Institution Press.
Hogan, M. Janice, Catherine Solheim, Susan Wolfgram, Busisiwe Nkosi, and Nicola Rodrigues. 2004. The Working Poor: From the Economic Margins to Asset Building. Family Relations 53(2): 22936.
Hogarth, Jeanne, Christoslav Anguelov, and Jinkook Lee. 2005. Who Has a Bank Account? Exploring Changes over Time, 19892001. Journal of Family and Economic Issues 26(1): 730.
Hogarth, Jeanne M., and Jinkook Lee. 2000. Use of Financial Services and the Poor. St. Louis, MO: Washington University in St. Louis, Center for Social Development.
Howard, Christopher. 1997. The Hidden Welfare State: Tax Expenditures and Social Policy in the United States. Princeton, NJ: Princeton University Press.
Hubbard, R. Glenn, and Jonathan S. Skinner. 1996. Assessing the Effectiveness of Saving Incentives. Journal of Economic Perspectives 10(4): 7390.
Hubbard, R. Glenn, Jonathan Skinner, and Stephen P. Zeldes. 1994. Expanding the Life-Cycle Model: Precautionary Saving and Public Policy. American Economic Review 84(2): 17479.
. 1995. Precautionary Saving and Social Insurance. Journal of Political Economy 103(2): 36099.
Hurd, Michael D., and B. Gabriela Mundaca. 1989. The Importance of Gifts and Inheritances among the Affluent. In The Measurement of Saving, Investment, and Wealth, edited by R. E. Lipsey and H. S. Tice. Chicago: University of Chicago Press.
Hurst, Erik., and James P. Ziliak. 2006. Do Welfare Asset Limits Affect Household Saving? Evidence from Welfare Reform. Journal of Human Resources 41(1): 4671.
Immergluck, Daniel, and Marti Wiles. 1999. Two Steps Back: The Dual Mortgage Market, Predatory Lending, and the Undoing of Community Development. Chicago: Woodstock Institute.
Internal Revenue Service. 2005. SOI Bulletin. Individual Income Tax Returns. Tax Year 2002. (Table 1).
. n.d. Individual Income Tax Returns Publication 1304. Tax Year 2004. (Section 1). http://www.irs.gov/pub/irs-soi/04insec1.pdf
Jayakody, R. 1998. Race Differences in Intergenerational Financial Assistance: The Needs of Children and the Resources of Parents. Journal of Family Issues 19(5): 50833.
Joint Committee on Taxation. 2003. Estimates of Federal Tax Expenditures for Fiscal Years 2004-2008. Paper prepared for the U.S. House of Representatives Committee on Ways and Means and the Committee on Finance. Washington, DC: U.S. Government Printing Office.
Joulfaian, David, and David Richardson. 2001. Who Takes Advantage of Tax-Deferred Savings Programs? Evidence from Federal Income Tax Data. National Tax Journal 54(3): 66988.
Kaiser Family Foundation and Health Research and Educational Trust. 2004. Employer Health Benefits 2004 Summary of Findings. Menlo Park, CA: Author.
Katona, George. 1975. Psychological Economics. New York: Elsevier.
Katz, Michael. 1990. The Undeserving Poor. New York: Pantheon.
Kempson, Elaine, Stephen McKay, and Sharon Collard. 2005. Incentives to Save: Encouraging Saving among Low-Income Households. Bristol, England: University of Bristol, Personal Finance Research Centre.
Kennickell, Arthur B., Martha Starr-McCluer, and Annika E. Sunden. 1997. Saving and Financial Planning: Some Findings from a Focus Group. Financial Counseling and Planning 8(1): 18.
Kneebone, Elizabeth. 2007. A Local Ladder for Low-Income Workers: Recent Trends in the Earned Income Tax Credit. Washington, DC: The Brookings Institution. http://www.brookings.edu/~/media/Files/rc/reports/2007/04childrenfamilie...
Kotlikoff, Laurence J., and B. Douglas Bernheim. 2001. Household Financial Planning and Financial Literacy: The Need for New Tools. In Essays on Saving, Bequests, Altruism, and Life-Cycle Planning, edited by L. J. Kotlikoff. Cambridge, MA: MIT Press.
Laibson, David. 1997. Golden Eggs and Hyperbolic Discounting. The Quarterly Journal of Economics 112(2): 44377.
Lerman, Robert I. 2002. How do Marriage, Cohabitation, and Single Parenthood Affect the Material Hardship of Families with Children? Washington, DC: Urban Institute.
Lewin, Kurt, Tamara Dembo, Leon Festinger, and Pauline S. Sears. 1944. Level of Aspiration. In Personality and the Behavior Disorders, edited by J. M. Hunt. New York: Ronald Press Company.
Lusardi, Annamaria. 2002. Preparing for Retirement: The Importance of Planning Costs. National Tax Association Proceedings: 14854.
Madrian, Brigitte C., and Dennis F. Shea. 2000. The Power of Suggestion: Inertia in 401(k) Participation and Savings Behavior. Quarterly Journal of Economics 116(4): 114987.
Maital, Shlomo, and Sharone L. Maital. 1994. Is the Future What It Used to Be? A Behavioral Theory of the Decline of Saving in the West. Journal of Socio-Economics 23(1/2): 132.
Mayer, Christopher J., and Gary V. Engelhardt. 1996. Gifts, Down Payments, and Housing Affordability. Journal of Housing Research 7(1): 5977.
McKernan, Signe-Mary, Caroline Ratcliffe, and Yunju Nam. 2007. The Effects of Welfare and IDA Program Rules on the Asset Holdings of Low-Income Families. A Report in the Series: Poor Finances: Assets and Low-Income Households. Washington, DC: Office of the Assistant Secretary for Planning and Evaluation, U.S. Dept. of Health and Human Services. http://aspe.hhs.gov/hsp/07/PoorFinances/assets/
Menchik, Paul L., and Martin David. 1983. Income Distribution, Lifetime Savings, and Bequests. American Economic Review 73(4): 67290.
Menchik, Paul L., and Nancy Ammon Jianakoplos. 1997. Black-White Wealth Inequality: Is Inheritance the Reason? Economic Inquiry 35: 42842.
Merlis, Mark, Douglas Gould, and Bisundev Mahato. 2006. Rising Out-of-Pocket Spending for Medical Care: A Growing Strain on Family Budgets. New York: The Commonwealth Fund.
Merton, Robert. 1957. Social Theory and Social Structure. Revised ed. London: The Free Press.
Milligan, Kevin. 2003. "How Do Contribution Limits Affect Contributions to Tax-Preferred Savings Accounts?" Journal of Public Economics 87: 25381.
Modigliani, Franco, and A. K. Ando. 1957. Tests of the Life Cycle Hypothesis of Savings. Bulletin of the Oxford Institute of Statistics 19: 99124.
Modigliani, Franco, and Richard Brumberg. 1954. Utility Analysis and the Consumption Function: An Interpretation of Cross-Section Data. In Post-Keynesian Economics, edited by K. K. Kurihara. New Brunswick, NJ: Rutgers University Press.
Moore, Amanda, Sondra Beverly, Mark Schreiner, Michael Sherraden, Margaret Lombe, Esther Y. N. Cho, Lissa Johnson, and Rebecca Vonderlack. 2001. Saving, IDA Programs, and Effects of IDAs: A Survey of Participants. St. Louis, MO: Washington University in St. Louis, Center for Social Development.
Mullainathan, Sendhil, and Richard H. Thaler. 2000. Behavioral Economics. Cambridge, MA: National Bureau of Economic Research.
Nam, Yunju. 2008. Welfare Reform and Asset Accumulation: Asset Limit Changes, Financial Assets, and Vehicle Ownership. Social Science Quarterly 89(1):133-154.
Neumark, David. 1995. Are Rising Earnings Profiles a Forced-Saving Mechanism? The Economic Journal 105: 95106.
Neumark, David, and Elizabeth Powers. 1998. The Effect of Means-Tested Income Support for the Elderly on Pre-Retirement Saving: Evidence from the SSI Program in the U.S. Journal of Public Economics 68: 181206.
Nyce, Steven A. 2005. The Importance of Financial Communication for Participation Rates and Contribution Levels in 401(k) Plans. Philadelphia, PA: University of Pennsylvania, Wharton School, Pension Research Council.
Nyhus, Ellen K. and Webley, Paul. 2001. The Role of Personality in Household Saving and Borrowing Behavior. European Journal of Personality 15: S85-S103.
O'Donoghue, Ted, and Matthew Rabin. 1999. Procrastination in Preparing for Retirement. In Behavioral Dimensions of Retirement Economics, edited by H. J. Aaron. Washington DC: Brookings Institution Press.
Office of Management and Budget, Executive Office of the President. 2005a. Budget of the U.S. Government, Fiscal Year 2006. Washington, DC: U.S. Government Printing Office.
. 2005b. Budget of the U.S. Government, Fiscal Year 2006: Analytic Perspectives. Washington, DC: U.S. Government Printing Office.
Oliver, Melvin L., and Thomas M. Shapiro. 1995. Black Wealth/White Wealth: A New Perspective on Racial Inequality. New York: Routledge.
Olson, Lynn M., and Audrey Davis. 1994. The Earned Income Tax Credit: Views from the Street Level. Evanston, IL: Northwestern University, Center for Urban Affairs and Policy Research.
Phillips, Katherin Ross. 2001. Who Knows about the Earned Income Tax Credit. Washington, DC: Urban Institute.
Pollak, Robert A. 1998. Notes on How Economists Think. Chicago: Joint Center for Poverty Research.
Poterba, James M., Stephen F. Venti, and David A. Wise. 1996. How Retirement Saving Programs Increase Saving. Journal of Economic Perspectives 10(4): 91112.
Powers, Elizabeth T. 1998. Does Means-Testing Welfare Discourage Saving? Evidence from a Change in AFDC policy in the United States. Journal of Public Economics 68(1): 3353.
Purcell, Patrick J. 2001. Pension Sponsorship and Participation: Summary of Recent Trends. Washington, DC: Congressional Research Service.
Ratcliffe, Caroline, Henry Chen, Trina R. Williams Shanks, Yunju Nam, Mark Schreiner, Min Zhan, and Michael Sherraden. 2007. Assessing Asset Data on Low-Income Households: Current Availability and Options for Improvement. A Report in the Series: Poor Finances: Assets and Low-Income Households. Washington, DC: Office of the Assistant Secretary for Planning and Evaluation, U.S. Dept. of Health and Human Services. http://aspe.hhs.gov/hsp/07/PoorFinances/data/
Reid, Carolina Katz. 2004. Achieving the American Dream? A Longitudinal Analysis of the Homeownership Experiences of Low-Income Households. Seattle: University of Washington, Center for Studies in Demography and Ecology.
Romich, Jennifer L., and Thomas Weisner. 2000. How Families View and Use the EITC: Advance Payment Versus Lump Sum Delivery. National Tax Journal 53(4, Part 2): 124565.
Rutherford, Stuart. 2000. The Poor and Their Money. Delhi: Oxford University Press.
Sarkisian, Natalia, and Naomi Gerstel. 2004. Kin Support among Blacks and Whites: Race and Family Organization. American Sociological Review 69(6): 81237.
Schmidt, Lucie, and Purvi Sevak. 2004. Gender, Marriage, and Asset Accumulation in the United States. Williamstown, MA: Williams College.
Schoeni, Robert. 1997. Private Interhousehold Transfers of Money and Time: New Empirical Evidence. Review of Income and Wealth 43(4): 42348.
Schoeni, Robert F., and Karen E. Ross. 2005. Material Assistance from Families during the Transition to Adulthood. In On the Frontier of Adulthood: Theory, Research, and Public Policy, edited by R. A. Settersten, Jr., F. F. Furstenberg, Jr. and R. G. Rumbaut. Chicago: University of Chicago Press.
Schreiner, Mark, and Jonathan Morduch. 2002. Opportunities and Challenges for Microfinance in the United States. In Replicating Microfinance in the United States, edited by J. H. Carr and Z.-Y. Tong. Washington, DC: Woodrow Wilson Center Press.
Schreiner, Mark, and Michael Sherraden. 2007. Can the Poor Save? Saving and Asset Building in Individual Development Accounts. New Brunswick, NJ: Transaction Publishers.
Schreiner, Mark, Michael Sherraden, Margaret Clancy, Lissa Johnson, Jami Curley, Michal Grinstein-Weiss, Min Zhan, and Sondra Beverly. 2001. Savings and Asset Accumulation in Individual Development Accounts. St. Louis, MO: Washington University in St. Louis, Center for Social Development.
Seidman, Laurence S. 2001. Assets and the Tax Code. In Assets for the Poor: The Benefits of Spreading Asset Ownership, edited by T. M. Shapiro and E. N. Wolff. New York: Russell Sage Foundation.
Shapiro, Thomas M. 2004. The Hidden Cost of Being African American: How Wealth Perpetuates Inequality. New York: Oxford University Press.
Shefrin, Hersh M., and Richard H. Thaler. 1988. The Behavioral Life-Cycle Hypothesis. Economic Inquiry 26: 60943.
. 1992. Mental Accounting, Saving, and Self-Control. In Choice over Time, edited by G. Loewenstein and J. Elster. New York: Russell Sage Foundation.
Sherraden, Margaret, Amanda Moore McBride, Elizabeth Johnson, Stacie Hanson, Fred M. Ssewamala, and Trina R. Shanks. 2005. Saving in Low-Income Households: Evidence from Interviews with Participants in the American Dream Demonstration. St. Louis, MO: Washington University in St. Louis, Center for Social Development.
Sherraden, Margaret, Amanda Moore, and Philip Hong. 2000. Savers Speak: Case studies of IDA Participants. Paper presented at Society for Social Work Research Annual Conference, Charleston, SC.
Sherraden, Margaret, Trina Williams, Amanda Moore McBride, and Fred M. Ssewamala. 2003. Overcoming Poverty: Supported Savings as a Household Development Strategy. Paper presented at Council on Social Work Education Annual Program Meeting, Washington, D.C.
Sherraden, Michael. 1991. Assets and the Poor: A New American Welfare Policy. Armonk, NY: M. E. Sharpe, Inc.
. 2005. Inclusion in Asset Building. Testimony for Hearing on Building Assets for Low-Income Families, Subcommittee on Social Security and Family Policy, Senate Finance Committee. St. Louis, MO: Washington University in St. Louis, Center for Social Development.
Sherraden, Michael, and Michael S. Barr. 2005. Institutions and Inclusion in Saving Policy. In Building Assets, Building Credit: Bridges and Barriers to Financial Services in Low-Income Communities, edited by N. Retsinas and E. Belsky. Washington, DC: Brookings Institution Press.
Sherraden, Michael, Edward Scanlon, Deborah Adams, Mark Schreiner, and Sondra Beverly. 2005. Inclusion in Asset Building: Directions for Theory and Research. In Inclusion in the American Dream: Assets, Poverty, and Public Policy, edited by M. Sherraden. New York: Oxford University Press.
Sherraden, Michael, Mark Schreiner, and Sondra G. Beverly. 2003. Income, Institutions, and Saving Performance in Individual Development Accounts. Economic Development Quarterly 17(1): 95112.
Smeeding, Timothy M., Katherin Ross Phillips, and Michael O'Connor. 2000. The Earned Income Tax Credit: Expectation, Knowledge, Use, and Economic and Social Mobility. National Tax Journal 53(4, Part 2): 11871209.
Stack, Carol B. 1974. All our Kin: Strategies for Survival in a Black Community. New York: Harper and Row.
Strotz, Robert H. 1956. Myopia and Inconsistency in Dynamic Utility Maximization. Review of Economic Studies 23(3): 16580.
Stuart, Guy. 2003. Discriminating Risk: The U.S. Mortgage Lending Industry in the Twentieth Century. Ithaca: Cornell University Press.
Sturm, Peter H. 1983. Determinants of Saving: Theory and Evidence. OECD Economic Studies 1: 14796.
Sullivan, James X. 2006. Welfare Reform, Saving, and Vehicle Ownership: Do Asset Limits and Vehicle Exemptions Matter? Journal of Human Resources 41(1): 72105.
Tax Policy Center. 2005. Table T05-0271. Effect of the Child Tax Credit, Distribution of Federal Tax Benefits by Cash Income Class, 2005. http://www.taxpolicycenter.org/TaxModel/tmdb/Content/PDF/T05-0271.pdf.
Tennyson, Sharon, and Chau Nguyen. 2001. State Curriculum Mandates and Student Knowledge of Personal Finance. Journal of Consumer Affairs 35(2): 24162.
Thaler, Richard H. 1990. Saving, Fungibility and Mental Accounts. Journal of Economic Perspectives 4(1): 193205.
. 1994. Psychology and Savings Policies. American Economic Review 84(2): 18692.
. 1999. Mental Accounting Matters. Journal of Behavioral Decision Making 12: 183206.
. 2000. From Homo Economicus to Homo Sapiens. Journal of Economic Perspectives 14(1): 13341.
Thaler, Richard H., and Shlomo Benartzi. 2004. Save More Tomorrow: Using Behavioral Economics to Increase Employee Saving. Journal of Political Economy 112(1, Pt 2): S164S187.
Thaler, Richard H., and Hersh M. Shefrin. 1981. An Economic Theory of Self-Control. Journal of Political Economy 89(2): 392401.
Tufano, Peter, and Daniel Schneider. 2004. H&R Block and Everyday Financial Services. Cambridge, MA: Harvard Business School Publishing.
U.S. Census Bureau. 1999. Average Weekly Child Care Expenditures by Employed Mothers of Children under 14: Spring 1999 (PPL Table 6). http://www.census.gov/population/socdemo/child/ppl-168/tab06.pdf.
. 2004. Current Population Survey, 2004 Annual Social and Economic Supplement (Table HI02. Health Insurance Coverage Status and Type of Coverage by Selected Characteristics for People in the Poverty Universe: 2003). http://pubdb3.census.gov/macro/032004/health/h02_001.htm.
U.S. Department of Labor, Bureau of Labor Statistics. 2004. National Compensation Survey: Employee Benefits in Private Industry in the United States, March 2004. Washington, DC: Author.
U.S. Department of Labor Employee Benefits Security Administration. n.d. Table 6. Coverage Rates under Employer Sponsored Pension Plans: Private Wage and Salary Workers by Selected Demographic Variables, 1999. http://www.dol.gov/ebsa/programs/opr/CWS-Survey/table_6.htm.
Wärneryd, Karl-Erik. 1996. Personality and Saving. VSB-Center Savings Project Progress Report 39. Tilburg University, the Netherlands: Center for Economic Research.
Wilhelm, Mark O. 2001. The Role of Intergenerational Transfers in Spreading Asset Ownership. In Assets for the Poor: The Benefits of Spreading Asset Ownership, edited by T. M. Shapiro and E. N. Wolff. New York: Russell Sage Foundation.
Wolff, Edward N. 2002. Inheritances and Wealth Inequality, 19891998. American Economic Review 92(2): 26064.
Woo, Lillian G., F. William Schweke, and David E. Buchholz. 2004. Hidden in Plain Sight: A Look at the $335 Billion Federal Asset-Building Budget. Washington, D.C.: Corporation for Enterprise Development.
Yadama, Gautam, and Michael Sherraden. 1996. Effects of Assets on Attitudes and Behaviors: Advance Test of a Social Policy Proposal. Social Work Research 20: 3-11.
Zhan, Min, Steven G. Anderson, and Jeff Scott. 2006. Financial Knowledge of the Low-Income Population: Effects of a Financial Education Program. Journal of Sociology and Social Welfare 33(1): 5374.
Ziliak, James P. 2003. Income Transfers and Assets of the Poor. The Review of Economics and Statistics 85(1): 6376.
[ Go to Contents ]
Endnotes
[1] One of the earliest behavioral economists, and still one of the most active, is Richard Thaler. This summary draws heavily from his writings (e.g., Mullainathan and Thaler 2000; Thaler 1994, 1999; Thaler 2000; Thaler and Shefrin 1981). Some of the other key references on behavioral theory are Bernheim (1997); Choi, Laibson, Madrian and Metrick (2002); Choi, Laibson and Madrian (2004); Lusardi (2002); and Madrian and Shea (2000).
[2] As Schreiner and Sherraden (2007) state, financial decisions are especially difficult because they involve the future, uncertainty, and math.
[3] For example, a worker signing up for a 401(k) investment option may assume that the default option is the best choice for him; otherwise, this choice would not have been defined as the default.
[4] The use of mental accounting means, in part, that people think about funds differently, depending on their source. For example, regular wage and salary income may be defined as funds for consumption, while irregular income, such as money from a temporary job or from a tax refund may be defined as savings or treat money.
[5] Programs that enroll people automatically are sometimes called opt-out programs because eligible individuals are enrolled in the program unless they take the initiative to opt out.
[6] In reality, many financial decisions and outcomes might be better measured at the household or family level. For simplicity, however, we frame this discussion around individual constructs.
[7]As shown below, this conceptual framework suggests that institutional factors have an important influence on saving and investment action. When institutional factors are very influential, the words decisions and behaviors may exaggerate the degree of individual choice involved.
[8] However, we also expect the propositions suggested here to hold when researchers examine measures of asset accumulation that evaluate the adequacy of asset holdings (by using a measure of asset poverty, for example).
[9] Most low-income children are eligible for public health insurance, through Medicaid and the State Childrens Health Insurance Program, but few low-income adults are.
[10] High costs relative to income is defined as more than ten percent of income generally, and five to ten percent of income for families below 200 percent of the federal poverty line.
[11] Predatory lending practices (e.g., payday loans, refund anticipation loans, car title loans, and high-fee credit cards) are important to mention here. Predatory lending traps some low-income households who would otherwise be debt-free and makes it more difficult for many others to manage and reduce debt. As noted in the introduction, this report focuses on saving and investment, but it would also be useful to consider liabilities or, more broadly, the common portfolios of households.
[12] Existing studies have focused on black-white differences. Additional research is needed to study other racial and ethnic minorities.
[13] For centuries, some have argued that poor people and other out-groups (such as racial and ethnic minorities) live for the present and cannot or choose not to postpone pleasure (see, for example, the discussion in Katz 1990). In response, some have argued that low-income people and minorities have below-average life expectancies and thus fewer incentives to save. Others claim that minorities have learned through negative experiences that rewards do not often arrive as promised and therefore have fewer incentives to postpone pleasure. Thus, there has been much speculation (but little research) on the determinants of future orientation. When people discuss future orientation, time preference, and perhaps to a lesser extent, self-control, we suspect they are thinking of fairly stable personality characteristics. The opinion of the authors is that some people are consistently patient or impatient, regardless of the opportunities and constraints they face. For most people, however, we believe that willingness to postpone pleasure is substantially influenced by external factors, especially institutional factors, such as information, incentives, expectations, and so on.
[14] The first phenomenon is probably related to future orientation. To the extent, however, that future orientation is a stable personality characteristic for some people, we are thinking of motives as attitudes that are potentially more transitory, that is, as perceptions, beliefs, and opinions that are more likely to be altered by experiences.
[15] Again, perceived ability to save is probably closely related to future orientation and motives for saving. It is plausible that perceived ability affects the other two variables and vice versa.
[16] IDAs are matched savings accounts for low-income people (see http://gwbweb.wustl.edu/csd/asset/idas.htm). The first four of the constructs access, information, incentives, and facilitation were identified by Sherraden and appeared in Beverly and Sherraden (1999). Expectations later emerged from qualitative research on IDAs (Sherraden, Moore, and Hong 2000). In Sherraden, Schreiner, and Beverly (2003), we added limits, which we now call restrictions. Security is emerging in IDA qualitative research (Sherraden, Williams, et al. 2003) and has been emphasized in saving programs in developing countries (Rutherford 2000; Schreiner and Morduch 2002).
[17] Two types of incentives, subsidies and rates of return, clearly affect how an individuals saving deposits grow (or do not) over time. At least one type of security, protection from investment risk, also affects how assets grow over time. These constructs are described below.
[18] Saving is a financial activity more than a social activity, and focusing on financial incentives connects this thinking directly with the existing knowledge on saving that can best inform policy.
[19] High-income savers may have less trouble accumulating meaningful amounts of wealth in the absence of matches.
[20] The role that asset limits play in shaping asset accumulation is examined empirically by McKernan, Ratcliffe, and Nam (2007) in another Poor Finances report, The Effects of Welfare and IDA Program Rules on the Asset Holdings of Low-Income Families, available at http://aspe.hhs.gov/hsp/07/PoorFinances/assets/index.shtml
[21] Many households receive state income tax refunds, too, but these tend to be much smaller than federal refunds.
[22] Very often, money in restricted accounts may be used for other purposes, but financial penalties are imposed.
[23] In this section, we focus largely on public policies that are explicitly designed to encourage asset building. We do not discuss social insurance programs, such as Social Security, unemployment insurance, and disability insurance, although these programs almost certainly have important effects on asset holding. Social insurance programs protect assets by providing cash assistance when income declines due to age, unemployment, or injury, for example. These programs might also offset private saving, however, because people who know they are eligible for social insurance benefits may be less motivated to save on their own for emergencies and retirement.
[24] Engelhardt (2002) estimates that less than 43 percent of pre-retirement lump-sum distributions from DC plans are rolled over to an IRA, transferred to another employer, or converted to an annuity.
[25] Similarly, data from the Bureau of Labor Statistics National Compensation Survey (U.S. Department of Labor 2004) show that white collar workers are more likely than blue collar workers and, especially, service workers to be eligible for retirement benefits. Full-time workers are much more likely than part-time workers to be eligible.
[26] Joulfaian and Richardson (2001) provide additional statistics on participation in tax-deferred savings programs.
[27] For example, a $1,000 deduction from income is worth $330 to someone in the 33 percent tax bracket, $150 to someone in the 15 percent tax bracket, and nothing at all to someone who has no income tax liability.
[28] At the same time, interest-only and negative-amortization mortgages allow homeowners to not engage in this easy saving, and home equity loans and second mortgages reduce home equity.
[29] Glaeser and Shapiro (2002) argue that the home mortgage interest deduction does not increase homeownership because it disproportionately benefits those who would own homes even in the absence of the deduction.
[30] Excluded gains were limited to $250,000 for individuals and $500,000 for married couples in the 2004 tax year.
[31] Borrowers who take out conventional mortgages with less than a 20-percent down payment usually must purchase private mortgage insurance. Government-sponsored mortgage programs, such as those affiliated with the Federal Housing Administration, provide mortgages to eligible households with down payments of only two to three percent (Mayer and Engelhardt 1996).
[32] Many low-income individuals qualify for credit from subprime lenders, but these loans tend to have higher interest rates and higher penalties for default (Belsky and Calder 2004). Immergluck and Wiles (1999), and others after them, have described a dual mortgage market, in which mainstream lenders serve higher-income white neighborhoods and subprime lenders serve lower-income and minority communities.
[33] See The Balance Sheets of Low-Income Households: What We Know about Their Assets and Liabilities, Carasso and McKernan, 2007, available at http://aspe.hhs.gov/hsp/07/PoorFinances/balance/index.shtml
[34] Making matters even more complicated for these households is the fact that it is difficult for an individual with poor credit to open a savings or checking account (Belsky and Calder 2004). Thus, it can be difficult for an individual to recover from past credit problems. Hogarth, Anguelov, and Lee (2005) examine barriers to basic account ownership in detail.
[35] Only about 40 percent of all contributors to these accounts contributed the maximum amount, however (Burman et al. 2004, Table 6). This means, for example, that only about one percent of all tax units contributed the maximum amount to a traditional IRA. The figure for Roth IRAs is comparable.
[36] The ORR IDA program is not included in Exhibit 9 because it does not have a discrete funding line in the federal budget.
[37] The maximum credit allowed varies according to number of qualifying children, $390 for no qualifying children, $2,604 for one, and $4,300 for two or more (IRS n.d.)
[38] Instead, it was created (in 1975) to offset the burden of Social Security and Medicare payroll taxes for low-income working people with children. In 1978, the advance-payment option was created, allowing EITC-eligible individuals to receive a portion of their credits through their paychecks. The vast majority of recipients continued to receive the credit as a lump-sum, after filing their taxes. Many advocates for low-income workers were initially disappointed that workers did not take advantage of the advance-payment option. In time, advocates learned that some families valued the opportunity to accumulate a lump-sum, either for savings, for special purchases, or for catching up on bills.
[39] Overall, evidence on the effectiveness of these programs is mixed. The programs have had low to moderate take-up rates, ranging from about 3 percent for IRAs with no matching funds (Duflo et al., 2005) to about 20 to 25 percent for programs that deposit funds in basic savings accounts (Beverly, Romich, and Tescher 2003; Beverly, Schneider, and Tufano 2006). There is some evidence that participants believe that these programs helped them save, spend more thoughtfully, and/or achieve specific saving or spending goals (Beverly, Romich, and Tescher 2003; Beverly, Schneider, and Tufano 2006), but more rigorous studies are needed to determine whether these programs actually increase saving and wealth.
[40] FY 2006 expenditures for the EITC and CTC are expected to be large about $39.3 billion for the EITC and about $45.5 billion for the CTC (Office of Management and Budget, 2005a) but these are not asset-building initiatives per se. In addition, in 2005, the 45 percent of tax units with cash incomes under $30,000 a year received less than 20 percent of total CTC benefits (authors calculations based on the data from Tax Policy Center 2005).
[41] Low-income filers who use a tax preparation service do not need to know about the EITC to receive it, but those who file their own returns must know to claim it. And, some households without tax liability may not file because they are unaware that they are eligible for the credit.
[42] Gale, Iwry, and Orszag (2004) estimate that only about one out of every 1,000 returns that qualify for the Savers Credit based on income has enough tax liability to receive the maximum possible credit (if the maximum eligible contribution were made).
[43] Assessing Asset Data on Low-Income Households: Current Availability and Options for Improvement, Ratcliffe et al. 2007. Available at http://aspe.hhs.gov/hsp/07/PoorFinances/data/index.shtml
[44] Of course, it would be valuable to confirm these findings with additional studies, and future research could build the body of policy-relevant knowledge by asking more refined research questions. We identify some of these follow-up research questions in the section on future research.
[45] Other outcomes examined are the probability of saving at least $100 in IDAs; the amount of gross deposits into IDAs over the duration of program; the probability of finishing the program; and the probability of making an asset purchase.
[46] Reinforcing the importance of social context, some interviewees also said that any savings they managed to accumulate would be quickly depleted because network members would refuse to help during a financial crisis as long as the family had savings (Caskey 1997).
[47] The measure was created from only six knowledge questions, including, What is the current Dow Jones Industrial average?; For people who pay federal income taxes, what is the lowest income tax bracket?; and What is the 30-year conventional mortgage rate right now?
[48] The survey asked questions about hypothetical free dream dinners available over two years. More specifically, respondents were asked how many of these dinners they would like to use in the first year. Then they were asked how many they would probably actually use in the first year. Those who said they would probably use more than they would have liked in the first year are defined as over-consumers. Those who said they would probably use too few in the first year are defined as under-consumers.
[49] Over 70 percent of respondents have a graduate or professional degree.
[50] Just over 32 percent of respondents said retirement was their most important saving motive. Over 31 percent gave responses classified as liquidity-related, including saving for emergencies, for periods of unemployment, and for health care costs, and saving to have ready money. Almost 11 percent named education, and 9.5 percent named purchases as their most important saving motives. Just over 5 percent gave reasons Aizcorbe et al. (2003) classified as for the family; it is not clear what portion of these responses reflect a bequest motive.
[51] Perceived inability to save is defined as agreeing or strongly agreeing with the following statement: You could save a little, but not enough to make a difference.
[52] The variables describing firms 401(k) communication program measure: (1) how often plan information is provided to employees; (2) how often financial education materials are provided; (3) the proportion of employees with access to projection information; and (4) the percent of communication materials that are available on the internet.
[53] Some studies of financial education use a post-test to examine intended behavior of participants. As both psychology and behavioral economics emphasize, however, intentions often do not directly translate into action. In fact, one study finds that only 14 percent of those who said, after a one-hour employer-sponsored retirement seminar, that they planned to enroll in the 401(k) plan actually did so. About 30 percent of those who said they planned to increase their contribution rate actually did so (Choi et al. 2002). We do not discuss studies that use only measures of intended behavior as outcomes.
[54] In addition to the studies cited here, there is at least one study of a well-known financial education program for high school students, the National Endowment for Financial Educations High School Financial Planning Program (Danes and Haberman n.d.). This study relies on a survey of students administered by teachers who had implemented the curriculum. We do not discuss these results because the response rates were very low and because we believe these data are particularly vulnerable to social desirability bias and other types of bias.
[55] ADD included a randomized experiment, but random assignment was to either a group that was eligible for IDAs or a group that was not. The match rate varied for treatment group members, but not randomly. Withdrawals for home purchase received a 2:1 match; other approved withdrawals received a 1:1 match.
[56] A firm can limit the amount of matching funds it provides by offering a low match rate, or by combining a generous match rate with a low match cap. (For example, a 401(k) plan with a 1:1 match rate may have a $4,000 match cap. A 401(k) with a 3:1 match rate may have a $1,500 match cap.) Thus, to examine the effects of match rates on contributions to 401(k) plans., researchers should also take into account match caps.
[57] Using PSID data, the authors estimate that the average non-elderly welfare-receiving household received $6,937 in transfer income. The comparable figure for the average elderly welfare-receiving household was $6,893.
[58] Countable assets include cash on hand, money in saving and checking accounts, bonds, stocks, and vehicle values that exceed the vehicle asset limit.
[59] These state special account programs are similar to IDA programs, but they do not provide matching funds.
[60] The New Hope demonstration program provided a variety of services to low-income working adults in Milwaukee. To create the group of New Hope participants, researchers randomly assigned eligible applicants to the New Hope program or to a control group.
[61] For example, in a focus group conducted as part of the pretest of the 1995 Survey of Consumer Finances, several high-income individuals mentioned the need to put money out of reach to avoid spending it (Kennickell, Starr-McCluer, and Sunden 1997, p. 4).
[62] In ADD in-depth interviews, some said that, without restrictions, their IDA savings would have been drawn upon by family and friends. This finding is consistent with evidence from Chiteji and Hamilton (2005) and Stack (1974) that poor people and people of color may have difficulty accumulating assets due to social network demands. Thus restrictions on savings may have negative social consequences. We cannot evaluate this, except to report that some IDA participants express appreciation for the restrictions.
[63] Participants could withdraw their money at any point, but this resulted in the loss of match money.
[64] Account-openers had to choose either a goal restriction or a date restriction. If they chose a goal restriction, they could not withdraw funds until they had accumulated the desired savings amount. If they chose the date restriction, they could not withdraw funds until the chosen date, but they were not required to deposit additional funds after opening the account. Deposits earned the same interest as regular savings accounts.
[65]As noted above, however, there is much evidence that security affects asset accumulation, that is, that risk affects rate of return.
[66] While this report has focused on asset building, it might also be useful for scholars and policy-makers to focus more broadly on the economic decisions of low-income households. From this perspective, broad policy-oriented research questions might include: Where on the income/resource distribution can households save without giving up goods and services that most Americans view as necessities? How do families make inter-related decisions about consumption, savings, and debt? Are there differences by race or ethnicity? What are optimal decisions for particular economic and family circumstances? What are effective strategies for helping households make wise decisions? What policy changes (e.g., curtailing predatory lending) help families make wise decisions?
Questions about the Project or any of the Papers?
Please contact: Gretchen Lehman Social Science Analyst Office of Human Services Policy Office of the Assistant Secretary for Planning and Evaluation U.S. Dept. of Health and Human Services 200 Independence Ave SW, Room 426F.6 Washington, DC 20201 202-401-6614 (phone) 202-690-6562 (fax)Gretchen.Lehman@hhs.gov