
Acknowledgments
This report, and its earlier editions, would not have been possible without the substantial support of the Federal Interagency Forum on Child and Family Statistics whose member agencies provided data and carefully reviewed relevant sections. The contributing departments and agencies include: the National Center for Education Statistics (NCES); the Centers for Disease Control and Prevention; the National Center for Health Statistics (NCHS); the Bureau of the Census; the Bureau of Labor Statistics; the Department of Housing and Urban Development; the Administration for Children and Families; the Food and Nutrition Service of the Department of Agriculture; the Office of Management and Budget; the Office of Juvenile Justice and Delinquency Prevention; and the Office of the Assistant Secretary for Planning and Evaluation (ASPE) of the Department of Health and Human Services (HHS).
Thanks to the many people in ASPE who contributed to the development, review, and production of this report. Special thanks to Matt Stagner of ASPE who has served as project officer for this report and earlier reports. We have greatly appreciated his guidance. He has a strong commitment to indicators and understanding trends in the well-being of children and youth.
Several non-federal individuals and organizations also supplied data or analyses for this report including Ryan Mahon of Walter R. McDonald & Associates Inc's NCAND Technical Team and Ginger Maggio of the University of Michigan.
This report was produced under contract by Westat. Babette Gutmann served as project director, and Jennifer Hamilton served as project manager. Other Westat staff who contributed to this report include Allison Henderson, Tamara Morse, and Christine Nord. The graphic design of the report was produced by Westat's Graphics Department. Editorial reviews were completed by Westat's Editorial Department.
Introduction
This is the fifth edition of an annual report from the Department of Health and Human Services (HHS) on trends in the well-being of our nation's children and youth. The report presents the most recent and reliable estimates on more than 80 indicators of well-being. It is intended to provide the policy community, the media, and all interested citizens with an accessible overview of data describing the condition of children in the United States.
The indicators have been organized into five broad areas:
- Population, family, and neighborhood;
- Economic security;
- Health conditions and health care;
- Social development, behavioral health, and teen fertility; and
- Education and achievement.
For each indicator, the report provides graphics to highlight key trends and important population subgroup differences and tables that provide more detailed information for the interested user. These are accompanied by text that briefly describes the importance of each indicator and highlights the most salient features of the data.
Indicators Included in the Report
This report presents a broad and carefully chosen collection of national estimates of child and youth well-being. It reports indicators that have been collected more than once over the last few years so that trends may be presented. Where possible, trends are presented from the 1970s through the 1990s. In a few cases, data for earlier years are also presented, as are projections into the future.
Decisions regarding which indicators to include in the report have been guided by a combination of scientific and practical considerations. In preparation for the first edition of this report, a list of indicators was culled from over 20 papers presented at a major national conference on indicators of child well-being. At this conference, nationally recognized experts representing a broad spectrum of disciplines and research interests related to child well-being recommended key indicators that should be tracked on a regular basis by the federal statistical system.
The final list of indicators was modified based on a number of practical considerations that included data availability (the data needed to be available for a nationally representative sample and on a regular basis), timeliness (the estimates had to be available for 1990 or later), and quality and consistency (the data had to be both reliable and consistently measured over time). Some sections of this report, mostly sections one and two, have been significantly revised since the 1999 edition of this report. Some indicators have been combined, such as low and very low birthweight, while other indicators have been rewritten or replaced with new sources of data. A new indicator on the number of births in the United States (PF 1.6) has been added, while several other indicators have been removed. Indicators have been removed for a variety of reasons, such as out-of-date information or replication of information in other reports produced by the Office of the Assistant Secretary for Planning and Evaluation in the Department of Health and Human Services. The indicators that have been removed are:
- Children as a percentage of the dependent population;
- Long-term childhood poverty;
- Effect of government cash and near-cash transfer programs on poverty among persons living in families with children under 18;
- Long-term welfare dependence;
- Parental labor force detachment;
- Secure labor force attachment; and
- Lead exposure.
The Need for Better Data on Children
As this report demonstrates, the data available for tracking the well-being of children and youth at the national level are fairly extensive. Even so, there remain major gaps in the federal statistical system that must be filled if we are to have a complete picture of the quality of our children's lives.
We have few measures of social development and health-related behaviors for very young and pre-teenage children that are measured on a regular basis. For example, we currently lack good indicators of school readiness for young children. Measures of mental health for any age child are rare, though one such measure was recently added to the National Health Interview Survey. Positive measures of social development and related behaviors are also sparse, with the result that the current set of indicators may present a gloomier picture of our children's overall well-being than is in fact the case. New indicators that reflect the positive developments we desire for our children and youth clearly need to be developed and incorporated into the federal statistical system.
We have very few indicators available that reflect important social processes affecting child well-being that go on inside the family and within the neighborhood. Measures of parent-child interactions, critical to the social and intellectual development of children, are only now beginning to work their way into regularly repeated national surveys. We currently lack an annual measure of whether both biological parents of a child are in the household. Reliable indicators of child homelessness also need to be developed.
Other important areas in need of measurement development or improvements in the quality, consistency, and frequency of available data include child abuse and neglect, youth violent crime, day care quality, learning disabilities, and measures of children in institutionalized care.
Finally, data that can be used to track the well-being of children at the state and local levels are much less plentiful than at the national level. As state and local governments take on increasing levels of responsibility for the design and implementation of all sorts of government programs affecting children, youth, and their families, the need for such information is increasing. The federal statistical system is positioned to play a significant role in increasing the availability of such data for use at the state and local levels.
Federal Interagency Forum on Child and Family Statistics
The Federal Interagency Forum on Child and Family Statistics, an interagency group of leaders of federal agencies and departments responsible for collecting data on children and youth, has adopted a mandate to improve the federal statistical system regarding data on children, youth, and their families. Member agencies have played a crucial role in the production of this report, providing data and carefully reviewing relevant text. This forum, created in 1995, will continue to develop strategies for improving the federal statistical system in ways that preserve existing data in these areas while filling in the data gaps described above.
For example, member agencies have recently been working to develop new indicators in several areas where they are currently lacking. A subcommittee on fatherhood has been established and is working with agency researchers and members of the National Institute of Child Health and Human Development (NICHD) Family and Child Well-being Research Network to develop new indicators related to fathering and male fertility and incorporating them into federal surveys where appropriate. In addition, the Department of Agriculture has recently developed a measure of food security for children which is also included in this report. As additional measures from these and similar efforts become available, they will be incorporated into future editions of the report.
Using the Document
In the presentation of data for this report, percents and rates were, as a rule, rounded to the nearest whole number. Estimates based on the Decennial Census, the National Vital Statistics System, and surveys with very large sample sizes were often presented to one decimal place since differences of less than one percentage point are often significant from these sources.
Practical considerations did not allow for the use of tests of statistical significance for all cross-time and between-group differences discussed in the text, though they were used in a few cases. When such tests were not available, differences were either not reported in the text or were reported cautiously. Often in such cases estimates were simply reported without any claims as to statistical significance.
For More Information
This report is intended to provide a broad cross section of the most relevant trend data in the lives of children and adolescents in America. For those interested in more detailed information, a number of additional resources, both print and electronic, are available. New to this report is a detailed bibliography, which is included for more detailed information. If you would like to investigate a topic further, please use the abbreviated footnote reference to find the full citation located in the bibliography. A few of these resources are listed below, by topic area. They should provide the reader with a starting point when searching for additional information in these areas.
Population, Family and Neighborhood
Bureau of the Census. It is possible to access nearly all Bureau of the Census publications, such as the Current Population Reports, from the Bureau's web page, www.census.gov. It is also possible to extract data directly from public use census files using the Federal Electronic Research and Review Extraction Tool (FERRET) available at http://ferret.bls.census.gov/. FERRET allows the user to:
- Create crosstabs;
- Create frequencies;
- Create a SAS data set for downloading; and
- Create an ASCII output file where it is possible to either download the file or transfer the data into a spreadsheet.
Economic Security
Office of the Assistant Secretary for Planning and Evaluation (ASPE). As part of the Department of Health and Human Services, ASPE will soon publish its first annual Trends in the Economic Well-Being of Low-Income Americans. This report will provide detailed information on how the distribution of poverty differs across population subgroups such as families with children, working-age adults, and the elderly.
Bureau of Labor Statistics. The Bureau of Labor Statistics produces a variety of employment data and can be found on the web athttp://www.bls.gov/.
Health Conditions and Health Care
Centers for Disease Control and Prevention (CDC). The Centers for Disease Control and Prevention conducts many data collection efforts, including the Youth Risk Behavior Surveillance System (YRBSS). The YRBSS which monitors six categories of priority health-risk behaviors among youth and young adults. The categories are: 1) tobacco use, alcohol and other drug use, 2) sexual behaviors that contribute to unintended pregnancy and sexually transmitted diseases, 3) unhealthy dietary behaviors, and 4) physical inactivity. This information can be accessed via CDC's main web page, located at http://www.cdc.gov/.
National Center for Health Statistics (NCHS). The National Center for Health Statistics publishes a number of reports that provide data on the health of children and youth in the United States. Some of these include the National Vital Statistics Reports and the Vital and Health Statistics series. These reports and many others are available at the NCHS web site http://www.cdc.gov/nchs/. Additional NCHS data are available through the Census’ FERRET system at http://www.cdc.gov/nchs/datawh/ferret/ferret.htm. Currently, the 1994 Underlying Cause-of-Death File, the 1993 National Health Interview Survey, and the third National Health and Nutrition Examination Survey, NHANES III, are all available via FERRET.
Social Development, Behavioral Health and Teen Fertility
Bureau of Justice Statistics. It is possible to obtain detailed information on juvenile offenders at the Bureau of Justice Statistics’ main web site, located at http://www.ojp.usdoj.gov/bjs/.
Institute for Social Research. This institute has collected information on the behaviors, attitudes, and values of American secondary school students, college students, and young adults since 1975 in its Monitoring the Future survey. Information and data from this study are available online at http://monitoringthefuture.org/.
Education and Achievement
National Center for Education Statistics (NCES). NCES is the primary federal agency for collecting and analyzing data that are related to education in the United States. Its web site is located at http://nces.ed.gov/ and contains links to its many data collection activities. These surveys include the Common Core of Data (CCD), the Schools and Staffing Survey (SASS), the Private School Universe Survey, and the National Household Education Survey (NHES). In addition, NCES collects and reports on the academic performance of the nation's students. The National Assessment of Educational Progress (NAEP) is NCES' primary assessment of what American elementary and secondary students know and can do in a variety of academic subjects.
Last, additional information can be found in our sister report, America’s Children: Key National Indicators of Well-Being, 2000, which is available online at http://childstats.gov/ac2000/ac00.asp.
Section 1: Population, Family, and Neighborhood (PF)
Child Population Characteristics
PF 1.1 Number of Children Under Age 18 in the United States
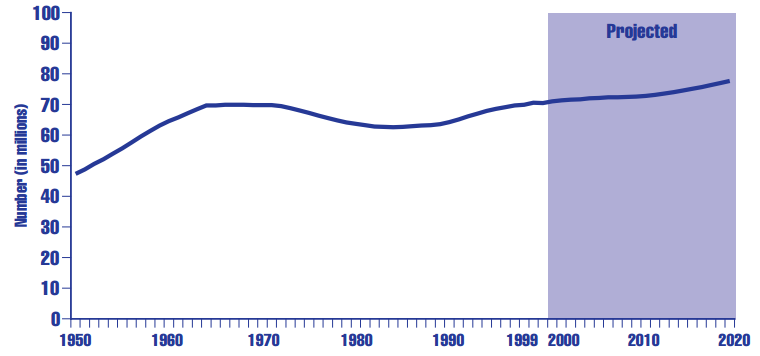
In 1999, there were 70.2 million children under age 18 in the United States. This number is expected to increase to 77.2 million by 2020. The total number of children under age 18 has increased by 48 percent since 1950. Most of that increase occurred during the “baby boom” years of the 1950s and early 1960s, when record numbers of children were born in these prosperous post-World War II years. During the 1970s and 1980s, the number of children initially declined and then grew slowly. Beginning in 1990, the rate of growth in the number of children increased, although not as rapidly as during the baby boom. These trends gave rise to the terms “baby bust” or “birth dearth,” and “echo baby boom.”
In 1999, there were approximately equal numbers of children—between 23 and 24 million—in each age group 0-5, 6-11, and 12-17 years of age. In 1950 and 1960, there were more children under age 6 than there were ages 6-11 or 12-17, reflecting the large number of babies being born during these years.
Table PF 1.1 Number (in millions) of children under age 18 in the United States, by age: Selected years, 1950-1999, and projected, 2000-2020
| Projected | |||||||||
|---|---|---|---|---|---|---|---|---|---|
| 1950 | 1960 | 1970 | 1980 | 1990 | 1999 | 2000 | 2010 | 2020 | |
| ll children | 47.3 | 64.5 | 69.8 | 63.7 | 64.2 | 70.2 | 70.4 | 72.1 | 77.2 |
| Under age 6 | 19.1 | 24.3 | 20.9 | 19.6 | 22.5 | 22.8 | 22.7 | 24.0 | 26.3 |
| Ages 6-11 | 15.3 | 21.8 | 24.6 | 20.8 | 21.6 | 24.0 | 24.1 | 23.4 | 25.6 |
| Ages 12-17 | 12.9 | 18.4 | 24.3 | 23.3 | 20.1 | 23.4 | 23.5 | 24.6 | 25.2 |
Sources: U.S. Bureau of the Census, Current Population Reports, Series P-25, no. 311, no. 519, no. 917, no. 1130 (Table 2 in each); and unpublished data, U.S. Bureau of the Census.
Figure PF 1.1 Number (in millions) of children under age 18 in the United States: 1950-1999, and projected, 2000-2020
Sources: U.S. Bureau of the Census, Current Population Reports, Series P-25, no. 311, no. 519, no. 917, no. 1130 (Table 2 in each); and unpublished data, U.S. Bureau of the Census.
PF 1.2 Children as a Percentage of the Total Population
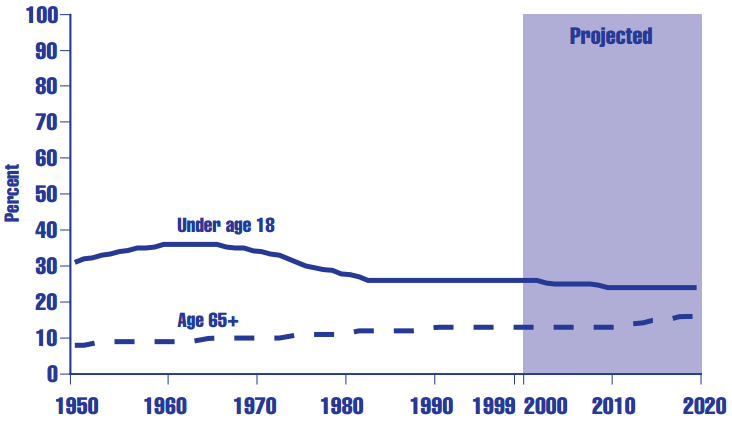
Though children represent a smaller proportion of the population today than they did in 1960, they are still a substantial segment of the U.S. population and will remain so in the coming decades. In 1999, children under age 18 made up 26 percent of the population, down from 36 percent in 1960 at the end of the baby boom.
Projections by the U.S. Bureau of the Census predict that this proportion will drop further—to 24 percent—by the year 2010 and will remain at that level through 2020.
In contrast, the proportion of the population ages 65 and older has increased from 8 percent in 1950 to 13 percent in 1999. That percentage is projected to increase to 17 percent by the year 2020.
Together, children and senior citizens make up the “dependent population” that is, those persons considered economically inactive because of their age. Children’s share of the dependent population fell from 79 percent in 1960 to 67 percent in 1990, and has remained unchanged since then. That percentage is projected to continue to decline to 59 percent by the year 2020.
Table PF 1.2 Persons in selected age groups as a percentage of the total U.S. population and children under age 18 as a percentage of the dependent population: Selected years, 1950-1999 and projected, 2000-2020
| Projected | |||||||||
|---|---|---|---|---|---|---|---|---|---|
| 1950 | 1960 | 1970 | 1980 | 1990 | 1999 | 2000 | 2010 | 2020 | |
| Percent of total | |||||||||
|
Ages 0-17 |
31 | 36 | 34 | 28 | 26 | 26 | 26 | 24 | 24 |
|
Ages 18-64 |
61 | 55 | 56 | 61 | 62 | 62 | 62 | 63 | 60 |
|
Ages 65+ |
8 | 9 | 10 | 11 | 13 | 13 | 13 | 13 | 17 |
| Percent of dependent populationa | |||||||||
|
Ages 0-17 |
79 | 79 | 78 | 71 | 67 | 67 | 67 | 64 | 59 |
a The dependent population includes all persons ages 17 and under, and 65 and older.
Sources: U.S. Bureau of the Census, Current Population Reports, Series P-25, no. 311, no. 519, no. 917, no. 1130 (Table 2 in each); and unpublished data, U.S. Bureau of the Census
Figure PF 1.2 Children under age 18 and adults ages 65 and over as a percentage of the U.S. population: 1950- 1999, and projected, 2000-2020
Sources: U.S. Bureau of the Census, Current Population Reports, Series P-25, no. 311, no. 519, no. 917, no. 1130 (Table 2 in each); and unpublished data, U.S. Bureau of the Census.
PF 1.3 Racial and Ethnic Composition of the Child Population of the United States
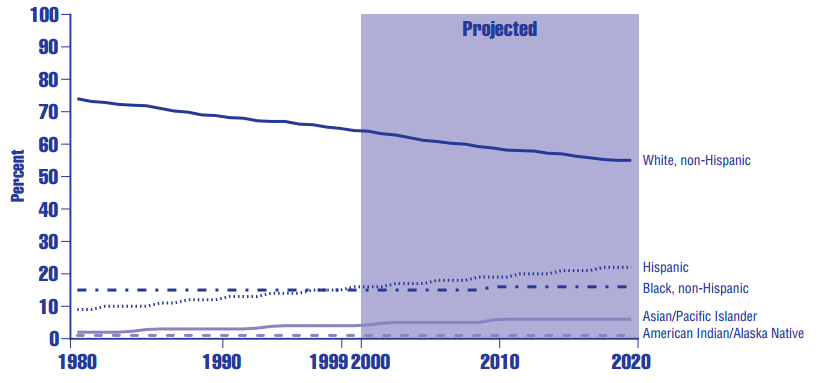
The United States has become increasingly racially and ethnically diverse over the last several decades and is projected to become even more so in the future. As recently as 1980, nearly three-quarters (74 percent) of all children in this country were non-Hispanic whites (see Table PF 1.3). This proportion diminished to 65 percent in 1999 and is expected to continue a steady downward trend so that, by the year 2020, non-Hispanic whites will constitute just over one-half (55 percent) of the U.S. child population.
Prior to 1997, non-Hispanic blacks were the largest minority population of children in the United States. In 1997 and 1998, however, Hispanics and non-Hispanic blacks each constituted about 15 percent of the total child population, with more Hispanic than black children (10.7 versus 10.2 million) in 1998. These were followed by non-Hispanic Asian Americans at 4 percent and non-Hispanic Native Americans at 1 percent. By the year 2020, more than one in five American children are expected to be Hispanic, more than double the percentage in 1980. The Asian/Pacific Islander population is also expected to continue its growth, increasing from 4 percent in 1999 to 6 percent by the year 2020.
Table PF 1.3. Number (in millions) and percentage distribution of children under age 18 in the United States, by race and Hispanic origin:a Selected years, 1980-1999, and projected, 2000-2020
| Projected | ||||||||
|---|---|---|---|---|---|---|---|---|
| Number (in millions) | 1980 | 1990 | 1997 | 1998 | 1999 | 2000 | 2010 | 2020 |
|
White, non-Hispanic |
47.1 | 44.2 | 45.6 | 45.5 | 45.6 | 45.4 | 42.7 | 42.4 |
|
Black, non-Hispanic |
9.3 | 9.5 | 10.2 | 10.2 | 10.5 | 10.6 | 11.3 | 12.2 |
|
Hispanica |
5.7 | 7.9 | 10.4 | 10.7 | 10.8 | 11.0 | 13.7 | 17.2 |
|
Asian/Pacific Islanderb |
1.1 | 2.0 | 2.7 | 2.8 | 3.0 | 3.1 | 4.0 | 5.0 |
|
American Indian/Alaska Nativeb |
0.5 | 0.6 | 0.7 | 0.7 | 0.7 | 0.7 | 0.7 | 0.8 |
| Projected | ||||||||
| Percentage of population | 1980 | 1990 | 1997 | 1998 | 1999 | 2000 | 2010 | 2020 |
|
White, non-Hispanic |
74 | 69 | 66 | 65 | 65 | 64 | 59 | 55 |
|
Black, non-Hispanic |
15 | 15 | 15 | 15 | 15 | 15 | 16 | 16 |
|
Hispanica |
9 | 12 | 15 | 15 | 15 | 16 | 19 | 22 |
|
Asian/Pacific Islanderb |
2 | 3 | 4 | 4 | 4 | 4 | 6 | 6 |
|
American Indian/Alaska Nativeb |
1 | 1 | 1 | 1 | 1 | 1 | 1 | 1 |
a Persons of Hispanic origin may be of any race.
b Excludes persons who are of Hispanic origin.
Sources: U.S. Bureau of the Census, Current Population Reports, Series P-25, no. 1095, Table 1; and no. 1130, Table 2; also unpublished data, U.S. Bureau of the Census. Percentage estimates as published in America's Children: Key National Indicators of Well-Being, 2000. Federal Interagency Forum on Child and Family Statistics, Washington, D.C.: U.S. Government Printing Office, Table POP3.
Figure PF 1.3. Percentage distribution of children under age 18 in the United States, by race and Hispanic origin:a 1980-1999, and projected, 2000-2020
a Persons of Hispanic origin may be of any race. Estimates for whites, blacks, Asian/Pacific Islanders, and American Indian/Alaska Natives exclude persons of Hispanic origin.
Sources: U.S. Bureau of the Census, Current Population Reports, Series P-25, no. 1095, Table 1; and no. 1130, Table 2; also unpublished data, U.S. Bureau of the Census.
PF 1.4 Immigrant Children and Children of Immigrants
The United States is a nation of immigrants. Rates of immigration have varied substantially over time, as have the countries and cultures from which these immigrants originate. Immigrant children and children of immigrants are of particular interest, since they may have special needs (cultural and lingual adjustment and misunderstandings, etc.) that must be addressed throughout the education system.
Immigrant Children
The percentage of America’s children and youth under age 20 who are foreign born has been increasing steadily over the last several decades, from 1.2 percent in 1970 to 3.7 percent in 1990.
Differences by Age. Older children are more likely than younger children to be foreign born. In 1990, 6.5 percent of youth ages 15 through 19 were foreign born, compared with only 1.4 percent of children under age 5 (see Table PF 1.4.A).
Differences by Race and Hispanic Origin. The percentage of children and youth under age 20 who are foreign born varies substantially by racial and ethnic background (see Table PF 1.4.A). In 1980, less than 2 percent of whites, blacks, and Native Americans were foreign born, compared with 40 percent of Asians and 14 percent of Hispanics. By 1990, the percentage of foreign-born Asian children had declined from 40 to 33.2 percent, while the percentage of foreign-born Hispanic children increased to almost 16 percent. More recent data for children under age 18 show a similar pattern, though differences in both data source and age range prevent direct comparison with earlier data (see Table PF 1.4.B).
Children of Immigrants
The Current Population Survey periodically collects information on fertility among the foreign born. According to data from the Current Population Survey, the number of foreignborn women of childbearing age almost doubled between 1983 and 1994, increasing from 3.3 million to 6.2 million. Birth rates among foreign-born women increased between 1983 and 1986, but have decreased somewhat since that time.1 The children of these foreignborn women need to be watched closely as they move through the educational system in order to ensure healthy cultural and linguistic adjustment and understanding. While a large number of children of immigrants seem to adjust well in schools, problems can and do arise (see Table PF 1.4.C).
Table PF 1.4.A. Percentage of children under age 20 in the United States who were foreign born,a by age, and by race and Hispanic origin:b 1970, 1980, and 1990
| 1970 | 1980 | 1990 | |
|---|---|---|---|
| All foreign-born children | 1.2 | 2.9 | 3.7 |
|
Under age 5 |
0.6 | 1.4 | 1.4 |
|
Ages 5-9 |
1.1 | 2.6 | 2.7 |
|
Ages 10-14 |
1.4 | 3.2 | 4.3 |
|
Ages 15-19 |
1.8 | 4.1 | 6.5 |
| Race and Hispanic originb | |||
|
White |
1.2 | 1.7 | 1.8 |
|
Black |
0.5 | 1.8 | 2.2 |
|
American Indian/Alaska Native |
— | 1.5 | 1.1 |
|
Asian/Pacific Islander |
— | 40.0 | 33.2 |
|
Hispanic |
— | 14.0 | 15.8 |
a Includes both immigrants (citizens and non-citizens) and illegal aliens.
b Persons of Hispanic origin may be of any race. Estimates for whites, blacks, Asians, and Native Americans include persons of Hispanic origin.
Sources: U.S. Bureau of the Census, National Origin and Language, PC(2-1A), 1970; U.S. Bureau of the Census, Detailed Characteristics of the Population, 1980, Chapter D, U.S. Summary; U.S. Bureau of the Census, The Foreign-Born Population in the U.S., 1990, CP-3-1, and 1990 STF-3A census files.
Table PF 1.4.B. Percentage of children under age 18 in the United States who were foreign born,a by race and Hispanic origin:b 1994-1997
| 1994 | 1995 | 1996 | 1997 | |
|---|---|---|---|---|
| All foreign-born children | 4 | 4 | 4 | 4 |
| Race and Hispanic originb | ||||
| White | 3 | 3 | 3 | — |
| Black | 2 | 2 | 2 | — |
| Asian/Pacific Islander | 25 | 28 | 27 | — |
| Hispanic | 14 | 14 | 13 | — |
a Includes both immigrants (citizens and non-citizens) and illegal aliens.
b Persons of Hispanic origin may be of any race. Estimates for whites, blacks, and Asians include persons of Hispanic origin.
Sources: U.S. Bureau of the Census, Current Population Reports, Series P-20, no. 486, Tables 1 and 2; U.S. Bureau of the Census, Paper Listing, Series PPL-58, Series PPL-59, Series PPL-92, The Foreign-Born Population, 1995, 1996, 1997, Detailed Tables, Tables 1 and 2. All percentages calculated by Child Trends, based on number estimates from these sources.
Table PF 1.4.C. Percentage of children with selected student outcomes by immigrant status and children's race and ethnicity: Children ages 3 to 8, 1996
| Total children ages 3–8 | Children of Immigrants | ||||||
|---|---|---|---|---|---|---|---|
| Total | NativeBorn | ForeignBorn | Hispanic | Asian | White | ||
| Total (thousands) | 22,959 | 3,213 | 2,782 | 430 | 1,734 | 239 | 837 |
| Student Outcome | |||||||
|
Child gets mostly A'sa |
58% | 54% | 54% | 53% | 41% | 63% | 51% |
|
Child enjoys schoola |
50 | 45 | 46 | 37 | 37 | 51 | 56 |
|
Child participates in extracurricular activitiesb |
74 | 63 | 65 | 56 | 49 | 78 | 79 |
|
Child experienced problems at schoolb |
29 | 25 | 26 | 24 | 30 | 17 | 22 |
|
Child ever repeated a gradeb |
5 | 5 | 5 | 6 | 8 | 3 | 3 |
a Applies to children in grades 1 and above.
b Applies to children in kindergarten and higher grades.
Source: Nord, & Griffin, 1999.
1 Nord, C.W. 1996. What is Causing School Enrollment to Increase? A Demographic Explanation. Rockville, MD: Westat
PF 1.5 Fertility Rates
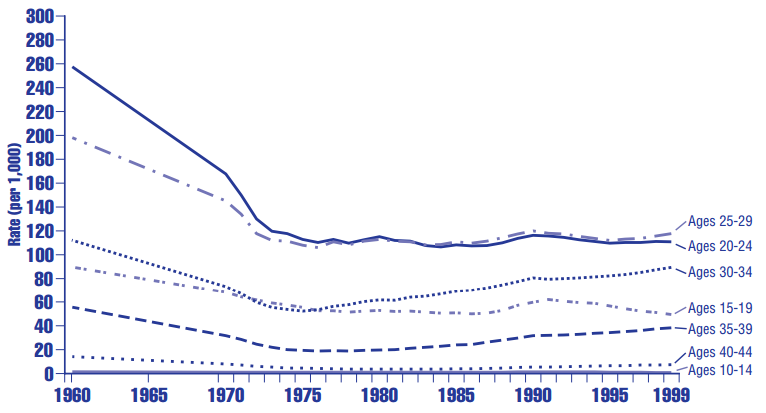
The fertility rate in the United States dropped dramatically between 1960 and 1980 from 118.0 to 68.4 live births per 1,000 women ages 15 to 44. The declines occurred in all age groups (see Figure PF 1.5) and among both whites and blacks (see Table PF 1.5). Fertility rates for Hispanics, Asians, and American Indians/Alaska Natives were not tabulated separately in 1960.
Since 1980, the birth rate has remained between 65 and 71 live births per 1,000 women ages 15 to 44. In 1999 the fertility rate was 65.8 live births per 1,000 women these ages.
During the 1960s, age-specific fertility rates – the number of births per thousand women in a given age group—were highest among women ages 20 to 24. This pattern began to change during the 1980s as more and more women delayed childbearing. Since 1983, women ages 25 to 29 have had the highest age-specific fertility rates, followed closely by women ages 20 to 24 (see Figure PF 1.5).
In recent years, Hispanic women have had a much higher fertility rate than women from the other race and ethnic groups. In 1999, Hispanic women had 101.8 births per 1,000 women ages 15 to 44, while non-Hispanic, white, black, Asian, and American Indian women had between 57.9 and 70.2 births per 1,000 women ages 15 to 44 (see Table PF 1.5). There is, however, wide disparity in fertility rates within the Hispanic population. In 1998, the fertility rate for Mexican-origin women was 112.1 compared to 75.5 for Puerto Ricanorigin and 50.1 for Cuban-origin women.2
There is widespread policy interest in teenage childbearing. Between 1960 and 1985, birth rates for teens ages 15 to 19 dropped from 89.1 to 51.0 per 1,000 teen women. This trend reversed between 1985 and 1991, and the teen birth rate increased to 62.1 per 1,000 teen women. Since 1991, the teen birth rate has again turned downward, declining to 49.6 per 1,000 teen girls by 1999. The birth rate for black teens has remained about twice that of white teens since 1960. In 1999, the birth rate for black teens ages 15 to 19 was 81.1 per 1,000 girls compared to 34 per 1,000 white teen girls. The highest teenage childbearing rates, however, are found among Hispanic teens. In 1999, the teen fertility rate among Hispanics was 93.1 for girls ages 15 to 19.
Figure PF 1.5. Birthrates by selected age of mother (per 1,000 women) in the United States: 1960-1997
Source: Ventura, et al., 1999. Births, Tables 4 and 9.
Table PF 1.5. Birth rates in the United States by race and hispanic origin and age of mother for selected ages (births per 1,000 females in each age group): Selected years: 1960-1999
| 1960 | 1970 | 1980a | 1990 | 1995 | 1996 | 1997 | 1998 | 1999f | |
|---|---|---|---|---|---|---|---|---|---|
| All races | |||||||||
| All agesb | 118.0 | 87.9 | 68.4 | 70.9 | 65.6 | 65.3 | 65.0 | 65.6 | 65.8 |
| Ages 10-14 | 0.8 | 1.2 | 1.1 | 1.4 | 1.3 | 1.2 | 1.1 | 1.0 | 0.9 |
| Ages 15-19 | 89.1 | 68.3 | 53.0 | 59.9 | 56.8 | 54.4 | 52.3 | 51.1 | 49.6 |
| Ages 15-17 | 43.9 | 38.8 | 32.5 | 37.5 | 36.0 | 33.8 | 32.1 | 30.4 | 28.7 |
| Ages 18-19 | 166.7 | 114.7 | 82.1 | 88.6 | 89.1 | 86.0 | 83.6 | 82.0 | 80.2 |
| White non-Hispanicc | |||||||||
| All agesb | 113.2 | 84.1 | 65.6 | 62.8 | 57.6 | 57.3 | 57.0 | 57.7 | 57.9 |
| Ages 10-14 | 0.4 | 0.5 | 0.6 | 0.5 | 0.4 | 0.4 | 0.4 | 0.3 | 0.3 |
| Ages 15-19 | 79.4 | 57.4 | 45.4 | 42.5 | 39.3 | 37.6 | 36.0 | 35.2 | 34.1 |
| Ages 15-17 | 35.5 | 29.2 | 25.5 | 23.2 | 22.0 | 20.6 | 19.4 | 18.4 | 17.1 |
| Ages 18-19 | 154.6 | 101.5 | 73.2 | 66.6 | 66.1 | 63.7 | 61.9 | 60.6 | 59.0 |
| Black non-Hispanicc,f | |||||||||
| All agesb | 153.5 | 115.4 | 84.7 | 89.0 | 74.5 | 72.5 | 72.4 | 73.0 | 70.2 |
| Ages 10-14 | 4.3 | 5.2 | 4.3 | 5.0 | 4.3 | 3.8 | 3.4 | 3.0 | 2.6 |
| Ages 15-19 | 156.1 | 140.7 | 97.8 | 116.2 | 99.3 | 94.2 | 90.8 | 88.2 | 81.1 |
| Ages 15-17 | — | 101.4 | 72.5 | 84.9 | 72.1 | 66.6 | 62.6 | 58.8 | 52.1 |
| Ages 18-19 | — | 204.9 | 135.1 | 157.5 | 141.9 | 136.6 | 134.0 | 130.9 | 122.9 |
| Hispanicd,e | |||||||||
| All agesb | — | — | 95.4 | 107.7 | 105.0 | 104.9 | 102.8 | 101.1 | 101.8 |
| Ages 10-14 | — | — | 1.7 | 2.4 | 2.7 | 2.6 | 2.3 | 2.1 | 2.0 |
| Ages 15-19 | — | — | 82.2 | 100.3 | 106.7 | 101.8 | 97.4 | 93.6 | 93.1 |
| Ages 15-17 | — | — | 52.1 | 65.9 | 72.9 | 69.0 | 66.3 | 62.3 | 61.2 |
| Ages 18-19 | — | — | 126.9 | 147.7 | 157.9 | 151.1 | 144.3 | 140.1 | 139.0 |
| Asian/Pacific Islanderc | |||||||||
| All agesb | — | — | 73.2 | 69.6 | 66.4 | 65.9 | 66.3 | 64.0 | 65.7 |
| Ages 10-14 | — | — | 0.3 | 0.7 | 0.7 | 0.6 | 0.5 | 0.4 | 0.4 |
| Ages 15-19 | — | — | 26.2 | 26.4 | 26.1 | 24.6 | 23.7 | 23.1 | 22.8 |
| Ages 15-17 | — | — | 12.0 | 16.0 | 15.4 | 14.9 | 14.3 | 13.8 | 12.6 |
| Ages 18-19 | — | — | 46.2 | 40.2 | 43.4 | 40.4 | 39.3 | 38.3 | 38.8 |
| American Indianc | |||||||||
| All agesb | — | — | 82.7 | 76.2 | 69.1 | 68.7 | 69.1 | 70.7 | 69.4 |
| Ages 10-14 | — | — | 1.9 | 1.6 | 1.8 | 1.7 | 1.7 | 1.6 | 1.7 |
| Ages 15-19 | — | — | 82.2 | 81.1 | 78.0 | 73.9 | 71.8 | 72.1 | 67.7 |
| Ages 15-17 | — | — | 51.5 | 48.5 | 47.8 | 46.4 | 45.3 | 44.4 | 41.3 |
| Ages 18-19 | — | — | 129.5 | 129.3 | 130.7 | 122.3 | 117.6 | 118.4 | 110.4 |
a Births from 1980 onward are by race of mother. Tabulations prior to 1980 are by race of child, which assigns the child to the race of the nonwhite parent, if any, or to the race of the father, if both are nonwhite.
b Fertility rates were computed by relating total births, regardless of age of mother, to women ages 15 to 44.
c Includes persons of Hispanic origin until 1990. After 1990, persons of Hispanic origin are not included.
d Persons of Hispanic origin may be of any race.
e White and black non-Hispanic excludes data for New Hampshire and Oklahoma, which did not report Hispanic origin.
f Data for 1999 are not available for black non-Hispanic women; data shown for 1999 are for all black women.
Sources: Ventura, et al., 1999. Births, Tables 1, 4, and 9; Ventura, 1983. Births, Table 5; also unpublished data, National Center for Health Statistics; Curtin, & Martin, 2000. Births: Preliminary Data for 1999.
2 Ventura, S.J., Martin, J.A., Curtin, S.C., & Park, M.M. 2000. Births: Final Data for 1998. National Vital Statistics Reports 48, (3.) Hyattsville, MD: National Center for Health Statistics.
PF 1.6 Number of Births
In 1999, there were nearly 4.0 million births in the United States. Twenty-seven percent of the births were to women ages 25 to 29, 25 percent were to women 20 to 24, and 23 percent were to women 30 to 34 years of age. The percentage of births occurring to older women (those 30 and older) has increased since the mid-1980s. In 1980, 20 percent of all births were to women ages 30 and older. In 1999, the proportion of all births to women age 30 and older had increased to 36 percent. About 60 percent of all births were to white nonHispanic women, 15 percent to black women, and 19 percent to women of Hispanic origin (see Table PF 1.6).
Most births are to women who have at least a high school degree. In 1998, 22 percent of births were to women who had less than a high school education, 33 percent were to high school graduates, and 46 percent were to women with one or more years of college (see Table PF 1.6).
Table PF 1.6. Percentage of births in the United States by mother's age, race and Hispanic origin, and education level: Selected years, 1990- 1999
| 1990 | 1995 | 1996 | 1997 | 1998 | 1999 | |
|---|---|---|---|---|---|---|
| Total number | 4,158,212 | 3,899,589 | 3,891,494 | 3,880,894 | 3,941,553 | 3,957,829 |
| Age of mother | ||||||
| Ages 15-19 | 13% | 13% | 13% | 13% | 12% | 12% |
| Ages 20-24 | 26 | 25 | 24 | 24 | 24 | 25 |
| Ages 25-29 | 31 | 27 | 28 | 28 | 27 | 27 |
| Ages 30-34 | 21 | 23 | 23 | 23 | 23 | 23 |
| Ages 35-39 | 8 | 10 | 10 | 11 | 11 | 11 |
| Ages 40-44 | 1 | 2 | 2 | 2 | 2 | 2 |
| Race and Hispanic origin | ||||||
| Whitea | 64 | 61 | 61 | 60 | 60 | 59 |
| Blacka | 16 | 15 | 15 | 15 | 15 | 15 |
| Hispanicb | 14 | 17 | 18 | 18 | 19 | 19 |
| Education level | ||||||
| Less than high school | 24 | 22 | 22 | 22 | 22 | — |
| Completed high school | 38 | 34 | 33 | 32 | 33 | — |
| Some college | 20 | 22 | 22 | 22 | 22 | — |
| Four + years of college | 18 | 21 | 22 | 22 | 23 | — |
a Estimates for whites and blacks do not include persons of Hispanic origin. In 1999 figures for black women include Hispanics. Hispanics may be of any race.
b Births by Hispanic origin are based on 48 states and the District of Columbia in 1990; and 50 states and the District of Columbia in 1995 through 1997.
Sources: Curtin & Martin, 2000; Ventura, et al., 2000, Births, Tables 17, 18, 19 and 21; Ventura, et al., 1999, Births, Tables 2, 17, and 21; Ventura, et al., Natality 1996; Ventura, et al., 1997, Tables 2, 6, and 21; Ventura, et al., 1997, Natality 1995, Tables 2, 6, 14, and 18; National Center for Health Statistics, 1994, Vital Statistics, Table 1-35; also, 1985, Table 1-54, 1980, Table 1-54, and 1970 editions of this annual report.; National Center for Health Statistics, 1987, Natality, Monthly Vital Statistics Report, 36(4, Supp), Table 2, and Monthly Vital Statistics Report, 31(8, Supp.), Table 2; Ventura, 1983, Table 2; Center for Disease Control, National Center for Health Statistics, 1974, Table 2.
PF 1.7 Percentage of All Births to Unmarried Women
Children who are born to single women, regardless of the age of the women, are considerably more likely than children born to two parents to grow up poor, to spend large portions of their childhood without two parents, and to become single parents themselves.
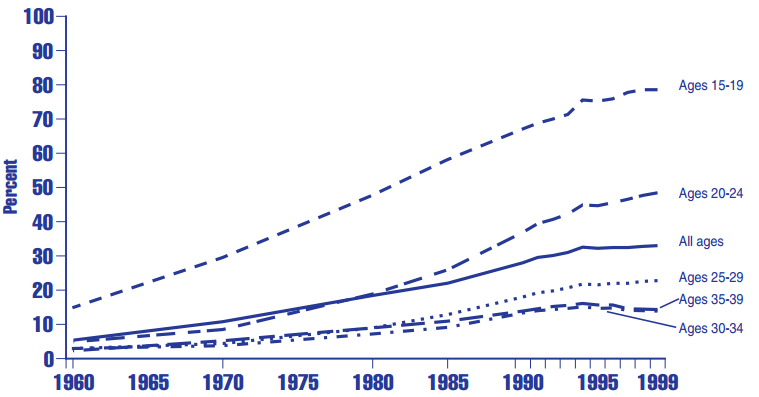
Differences by Age. Nonmarital childbearing increased among women of all age groups between 1960 and 1994 before dropping off modestly in 1995 (see Figure PF 1.7.A). However, data for 1996 through 1999 show continued increases for women ages 15 through 19, 20 through 24, and 25 through 29. Younger mothers are far more likely than older mothers to be unmarried. In 1999, 78.6 percent of births to women ages 15 through 19 were to unmarried women. In contrast, 48.4 percent of births to women ages 20 through 24 were to unmarried women, and only 13.9 percent of births to women ages 30 through 34 were to unmarried women (see Table PF 1.7.A). Bearing children outside of marriage is a particularly troubling development for teenagers because these young women often have little education and lack the ability to support their families economically, especially as single parents.
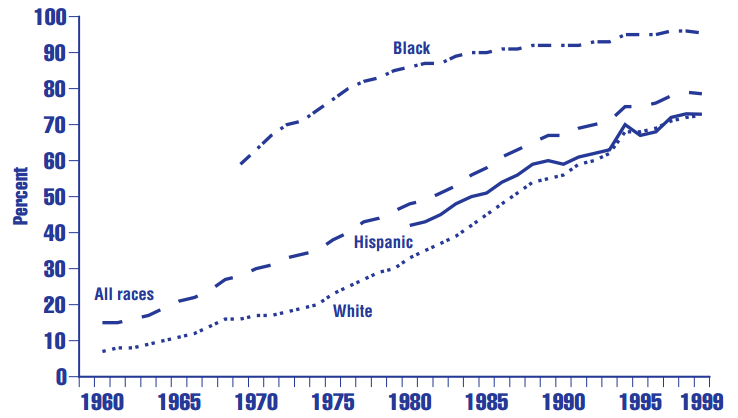
Nonmarital births as a percent of all births have increased among teens of all ages and across all racial and ethnic groups since 1960 (see Figures PF 1.7.A and B). Among all young women ages 15 through 19, 15 percent of births were nonmarital in 1960, compared with 79 percent in 1999 (see Table PF 1.7.B). The percentage of births to teens that occurred outside of marriage rose fairly steadily through 1999; however, the rather sharp increase between 1993 and 1994 (from 71 to 75 percent) is largely the result of improvements in the identification of nonmarital births in two states: Texas and Michigan.3
Differences by Race and Hispanic Origin. The percentage of all births to unmarried women increased for whites, blacks, American Indians, and Hispanics between 1980 and 1998 (see Table PF 1.7.A). Asian women have experienced a steady increase in the percentage of all births to unmarried women from 1980 to 1996, but the percentage decreased in 1997 and was unchanged in 1998.
In 1998, Asian and white women had the lowest percentage of nonmarital births at 15.6 and 21.9 percent, respectively. Hispanics were next at 41.6 percent, followed by American Indian and black women at 59.3 percent and 69.3 percent, respectively. This ordering is the same for most age groups, though the size of the difference can vary substantially by the age of the mother. For young women ages 15 through 19 in 1999, for example, whites and Hispanics have very similar percentages of births to unmarried women—72.6 and 72.9 percent, respectively—while the percentage among young black women ages 15 through 19 is much higher at 95.4 percent. By ages 25 through 29, however, percentages for Hispanic women move midway between white and black rates, with whites at 13.8 percent, Hispanics at 32.0 percent, and blacks at 56.7 percent (see Table PF 1.7.A).
Figure PF 1.7.A. Percentage of all births to unmarried women in the United States, by age: 1960-1999.
Sources: Ventura, et al., 2000, Births, Tables 17, 18, 19, and 21; Ventura, 1995, Births to Unmarried Mothers, Table 5; Ventura, et al., 1997, Natality, 1996, Table 17; Also previous issues of this annual report (volume 45, no.11; volume 44, no. 11; volume 44, no. 3, Table 14 in each); Ventura, et al., 1999, Births, Table 17; Ventura, et al., 2000, Births, Table 17; Curtin & Martin, 2000, Table C; unpublished data from S. Ventura, National Center for Health Statistics.
Table PF 1.7.A. Percentage of all live births to unmarried women in the United States, by race and Hispanic origin and by age: 1960-1999
| 1960 | 1965 | 1970 | 1975 | 1980b | 1985 | 1990 | 1991a | 1992 | 1993 | 1994 | 1995 | 1996 | 1997 | 1998 | 1999 | |
|---|---|---|---|---|---|---|---|---|---|---|---|---|---|---|---|---|
| All races | ||||||||||||||||
| All ages | 5.3 | 7.7 | 10.7 | 14.3 | 18.4 | 22.0 | 28.0 | 29.5 | 30.1 | 31.0 | 32.6 | 32.2 | 32.4 | 32.4 | 32.8 | 33.0 |
|
Ages 15-19 |
14.8 | 20.8 | 29.5 | 38.2 | 47.6 | 58.0 | 67.1 | 68.8 | 70.0 | 71.3 | 75.5 | 75.2 | 75.9 | 77.8 | 78.5 | 78.6 |
|
Ages 20-24 |
4.8 | 6.8 | 8.9 | 12.3 | 19.4 | 26.3 | 36.9 | 39.4 | 40.7 | 42.2 | 44.9 | 44.7 | 45.6 | 46.6 | 47.7 | 48.4 |
|
Ages 25-29 |
2.9 | 4.0 | 4.1 | 5.4 | 9.0 | 12.7 | 18.0 | 19.2 | 19.8 | 20.7 | 21.8 | 21.5 | 22.0 | 22.0 | 22.5 | 22.8 |
|
Ages 30-34 |
2.8 | 3.7 | 4.5 | 5.3 | 7.5 | 9.7 | 13.3 | 14.0 | 14.3 | 14.7 | 15.1 | 14.7 | 14.8 | 14.1 | 14.0 | 13.9 |
|
Ages 35-39 |
3.0 | 4.0 | 5.2 | 7.0 | 9.4 | 11.2 | 13.9 | 14.6 | 15.2 | 15.6 | 16.1 | 15.7 | 15.7 | 14.6 | 14.4 | 14.3 |
| Whitea | ||||||||||||||||
| All ages | 2.3 | 4.0 | 5.7 | 7.3 | 11.2 | 14.7 | 16.9 | 18.0 | 18.6 | 19.5 | 20.8 | 21.2 | 21.5 | 21.5 | 21.9 | 22.0 |
|
Ages 15-19 |
7.2 | 11.4 | 17.1 | 22.9 | 33.1 | 44.8 | 55.6 | 57.8 | 59.8 | 62.3 | 66.6 | 67.9 | 69.3 | 70.9 | 71.9 | 72.6 |
|
Ages 20-24 |
2.2 | 3.8 | 5.2 | 6.1 | 11.7 | 17.7 | 24.5 | 26.8 | 28.3 | 30.1 | 32.5 | 33.3 | 34.4 | 35.3 | 36.4 | 37.1 |
|
Ages 25-29 |
1.1 | 1.9 | 2.1 | 2.6 | 5.2 | 8.1 | 9.7 | 10.4 | 10.7 | 11.4 | 12.4 | 12.7 | 13.2 | 13.3 | 13.6 | 13.8 |
|
Ages 30-34 |
1.0 | 1.6 | 2.1 | 2.7 | 4.6 | 6.3 | 6.9 | 7.3 | 7.5 | 7.8 | 8.2 | 8.3 | 8.4 | 7.9 | 7.9 | 7.8 |
|
Ages 35-39 |
1.3 | 1.9 | 2.7 | 3.9 | 6.4 | 8.1 | 7.8 | 8.2 | 8.5 | 8.9 | 9.4 | 9.4 | 9.6 | 8.8 | 8.8 | 8.7 |
| Blacka | ||||||||||||||||
| All ages | — | — | 37.6 | 48.8 | 56.1 | 61.2 | 66.7 | 68.2 | 68.4 | 68.9 | 70.7 | 70.0 | 70.0 | 69.4 | 69.3 | 68.8 |
|
Ages 15-19 |
— | — | 62.7 | 76.9 | 85.7 | 90.2 | 92.1 | 92.5 | 92.8 | 93.1 | 95.5 | 95.3 | 95.5 | 95.8 | 95.8 | 95.4 |
|
Ages 20-24 |
— | — | 31.3 | 43.0 | 57.0 | 65.4 | 72.8 | 74.9 | 75.4 | 76.9 | 79.2 | 79.3 | 79.9 | 80.0 | 80.5 | 80.4 |
|
Ages 25-29 |
— | — | 20.3 | 26.8 | 36.8 | 45.2 | 53.4 | 54.9 | 55.1 | 55.9 | 57.5 | 56.8 | 57.5 | 56.9 | 57.1 | 56.7 |
|
Ages 30-34 |
— | — | 19.6 | 24.1 | 29.6 | 37.0 | 45.2 | 46.6 | 46.7 | 46.9 | 47.4 | 46.5 | 45.6 | 44.1 | 43.6 | 43.2 |
|
Ages 35-39 |
— | — | 18.6 | 23.9 | 28.4 | 35.1 | 42.1 | 43.8 | 44.7 | 44.8 | 45.7 | 45.3 | 44.2 | 42.5 | 41.6 | 40.8 |
| Hispanicb | ||||||||||||||||
| All ages | — | — | — | — | 23.6 | 29.5 | 36.7 | 38.5 | 39.1 | 40.0 | 43.1 | 40.8 | 40.7 | 40.9 | 41.6 | 42.1 |
|
Ages 15-19 |
— | — | — | — | 41.9 | 51.3 | 59.4 | 61.2 | 61.9 | 62.8 | 69.7 | 67.3 | 67.7 | 71.6 | 72.9 | 72.9 |
|
Ages 20-24 |
— | — | — | — | 23.8 | 30.9 | 39.6 | 41.5 | 42.3 | 43.4 | 47.0 | 45.0 | 45.2 | 46.1 | 47.5 | 48.5 |
|
Ages 25-29 |
— | — | — | — | 15.9 | 22.2 | 28.6 | 30.3 | 30.8 | 31.7 | 33.2 | 31.1 | 31.2 | 30.4 | 31.2 | 32.0 |
|
Ages 30-34 |
— | — | — | — | 15.2 | 19.6 | 25.5 | 26.6 | 27.2 | 27.5 | 28.6 | 26.4 | 26.0 | 24.6 | 24.4 | 25.0 |
|
Ages 35-39 |
— | — | — | — | 16.2 | 20.8 | 26.5 | 27.6 | 28.5 | 29.0 | 30.3 | 27.4 | 26.9 | 25.7 | 24.7 | 25.3 |
| Asian/Pacific Islandera | ||||||||||||||||
| All ages | — | — | — | — | 7.3 | 9.5 | 13.2 | 13.9 | 14.7 | 15.7 | 16.2 | 16.3 | 16.7 | 15.6 | 15.6 | — |
|
Ages 15-19 |
— | — | — | — | 40.6 | 47.7 | 57.0 | 58.4 | 59.6 | 60.7 | 62.7 | 63.1 | 62.7 | 72.0 | 72.1 | — |
|
Ages 20-24 |
— | — | — | — | 10.9 | 15.5 | 23.5 | 25.1 | 27.0 | 29.0 | 30.0 | 30.1 | 31.0 | 31.8 | 32.4 | — |
|
Ages 25-29 |
— | — | — | — | 4.2 | 5.7 | 8.3 | 8.8 | 9.6 | 10.6 | 11.3 | 12.1 | 12.9 | 11.5 | 11.4 | — |
|
Ages 30-34 |
— | — | — | — | 3.0 | 4.6 | 6.3 | 6.4 | 7.1 | 7.7 | 8.0 | 8.0 | 8.9 | 6.6 | 6.4 | — |
|
Ages 35-39 |
— | — | — | — | 4.0 | 5.8 | 7.5 | 7.9 | 8.4 | 9.0 | 8.8 | 8.9 | 9.2 | 6.9 | 6.5 | — |
| American Indiana | ||||||||||||||||
| All ages | — | — | — | — | 39.2 | 46.8 | 53.6 | 55.3 | 55.3 | 55.8 | 57.0 | 57.2 | 58.0 | 58.7 | 59.3 | — |
|
Ages 15-19 |
— | — | — | — | 61.9 | 72.5 | 78.9 | 79.1 | 80.3 | 80.6 | 82.9 | 82.5 | 84.1 | 84.4 | 85.9 | — |
|
Ages 20-24 |
— | — | — | — | 38.6 | 48.5 | 57.2 | 58.7 | 58.6 | 59.5 | 60.6 | 60.7 | 61.7 | 63.2 | 63.3 | — |
|
Ages 25-29 |
— | — | — | — | 28.1 | 35.9 | 43.2 | 45.2 | 45.3 | 45.2 | 45.5 | 45.7 | 46.4 | 47.3 | 47.6 | — |
|
Ages 30-34 |
— | — | — | — | 22.2 | 31.8 | 38.3 | 39.0 | 39.6 | 40.0 | 40.6 | 40.6 | 41.4 | 41.2 | 42.0 | — |
|
Ages 35-39 |
— | — | — | — | 22.5 | 27.7 | 35.5 | 38.8 | 38.2 | 38.1 | 38.5 | 40.6 | 40.1 | 40.3 | 41.1 | — |
a Beginning in 1980, births were tabulated by race and ethnicity of the mother. Prior to 1980, births were tabulated by race of child, assigning a child to the race of the nonwhite parent, if any, or to the race of the father, if both are nonwhite. Data for black and white births include births of Hispanic origin until 1990. Beginning 1990, persons of Hispanic origin are not included, except in 1999 where figures for blacks include Hispanics
b Persons of Hispanic origin may be of any race. Data for Hispanics have been available only since 1980, with 22 states reporting in 1980, representing 90 percent of the Hispanic population. Hispanic birth data were reported by 23 states and the District of Columbia in 1985; 48 states and the District of Columbia in 1990; 49 states and the District of Columbia in 1991 and 1992; and all 50 states and the District of Columbia since 1993
Sources: Curtin, & Martin, 2000, Table C; Ventura, et al., 2000. Births, Table 17; Tables 17, 18, 19, and 21; Ventura, et al., 1999, Births, Table 17; Ventura, 1995, Table 5; Ventura, et al., 1998, Natality, Table 17. Also previous issues of this annual report (Volume 45, no. 11; Volume 44, no. 11; Volume 44, no. 3, Table 14 in each); Ventura, Births, 1985, Tables 6 and 7; Ventura, 1983, Table 11; unpublished data from S. Ventura, National Center for Health Statistics.
Figure PF 1.7.B. Percentage of all births to unmarried women ages 15 through 19 in the United States, by racea and Hispanic origin:b 1960-1999
a Beginning in 1980, births were tabulated by race and ethnicity of the mother. Prior to 1980, births were tabulated by race of child, assigning a child to the race of the nonwhite parent, if any, or to the race of the father, if both are nonwhite. Data for black and white births include births of Hispanic origin until 1990. Beginning 1990, persons of Hispanic origin are not included, except in 1999 where figures for blacks include Hispanics.
b Persons of Hispanic origin may be of any race. Data for Hispanics have been available only since 1980, with 22 states reporting in 1980, representing 90 percent of the Hispanic population. Hispanic birth data were reported by 23 states and the District of Columbia in 1985; 48 states and the District of Columbia in 1990; 49 states and the District of Columbia in 1991 and 1992; and all 50 states and the District of Columbia since 1993.
Sources: Ventura, et al., 2000, Births, Tables 17, 18, 19, and 21; Ventura, 1995, Table 5; Ventura & Curtin, 1999, Table 17; Ventura, et al., 1999, Births, Table 17; Ventura, et al., 2000 Births, Tables 2, 7, and 17; also unpublished data, National Center for Health Statistics.
Table PF 1.7.B. Percentage of all births to unmarried women ages 15 through 19 in the United States, by age of mother and by racea and Hispanic origin: Selected years, 1960-1999
| 1960 | 1965 | 1970 | 1975 | 1980 | 1985 | 1990 | 1991 | 1992 | 1993 | 1994c | 1995 | 1996 | 1997 | 1998 | 1999 | |
|---|---|---|---|---|---|---|---|---|---|---|---|---|---|---|---|---|
| All races | ||||||||||||||||
|
Ages 15-17 |
24 | 33 | 43 | 51 | 62 | 71 | 78 | 79 | 79 | 80 | 84 | 84 | 84 | 87 | 88 | 88 |
|
Ages 18 or 19 |
11 | 15 | 22 | 30 | 40 | 51 | 61 | 63 | 65 | 66 | 70 | 70 | 71 | 73 | 74 | 74 |
|
Ages 15-19 |
15 | 21 | 30 | 38 | 48 | 58 | 67 | 69 | 70 | 71 | 75 | 75 | 76 | 78 | 79 | 79 |
| Whitea | ||||||||||||||||
|
Ages 15-17 |
12 | 17 | 25 | 33 | 45 | 58 | 68 | 70 | 72 | 73 | 78 | 79 | 81 | 83 | 83 | 83 |
|
Ages 18 or 19 |
5 | 9 | 14 | 17 | 27 | 38 | 50 | 52 | 54 | 57 | 61 | 62 | 64 | 65 | 67 | 67 |
|
Ages 15-19 |
7 | 11 | 17 | 23 | 33 | 45 | 56 | 58 | 60 | 62 | 67 | 68 | 69 | 71 | 72 | 73 |
| Blacka | ||||||||||||||||
|
Ages 15-17 |
— | — | 76 | 87 | 93 | 96 | 96 | 96 | 96 | 96 | 98 | 98 | 98 | 98 | 98 | 98 |
|
Ages 18 or 19 |
— | — | 52 | 68 | 80 | 86 | 90 | 90 | 91 | 91 | 94 | 93 | 94 | 94 | 94 | 94 |
|
Ages 15-19 |
— | — | 63 | 77 | 86 | 90 | 92 | 93 | 93 | 93 | 96 | 95 | 96 | 96 | 96 | 95 |
| Hispanicb | ||||||||||||||||
|
Ages 15-17 |
— | — | — | — | 51 | 61 | 68 | 69 | 69 | 70 | 77 | 75 | 75 | 80 | 82 | 82 |
|
Ages 18 or 19 |
— | — | — | — | 36 | 46 | 54 | 56 | 57 | 58 | 65 | 62 | 63 | 66 | 67 | 67 |
|
Ages 15-19 |
— | — | — | — | 42 | 51 | 59 | 61 | 62 | 63 | 70 | 67 | 68 | 72 | 73 | 73 |
a Beginning in 1980, births were tabulated by race and ethnicity of the mother. Prior to 1980, births were tabulated by race of child, assigning a child to the race of the nonwhite parent, if any, or to the race of the father, if both are nonwhite. Data for black and white births include births of Hispanic origin until 1990. Beginning 1990, persons of Hispanic origin are not included, except in 1999 where figures for blacks include Hispanics.
b Persons of Hispanic origin may be of any race. Data for Hispanics have been available only since 1980, with 22 states reporting in 1980, representing 90 percent of the Hispanic population. Hispanic birth data were reported by 23 states and the District of Columbia in 1985; 48 states and the District of Columbia in 1990; 49 states and the District of Columbia in 1991 and 1992; and all 50 states and the District of Columbia since 1993.
c Increases between 1993 and 1994 were due primarily to improvements in the identification of nonmarital births in Texas and Michigan
Sources: Ventura, 1995, Table 5; Ventura, & Curtin, 1999, Table 3; Ventura, et al., 1999, Table 17; Ventura, et al., 2000, Births, Tables 2, 7, and 17. Also unpublished data from S. Ventura, National Center for Health Statistics.
3 Ventura, S.J., Martin, J.A., Mathews, T.J.,& Clarke, S.C. 1996. Advance Report of Final Natality Statistics, 1994. Monthly Vital Statistics Report, 44, (11, Supp.). Hyattsville, MD: National Center for Health Statistics.
Family Structure
PF 2.1 Percentage of Families with Children and Distribution of Families by Number of Children
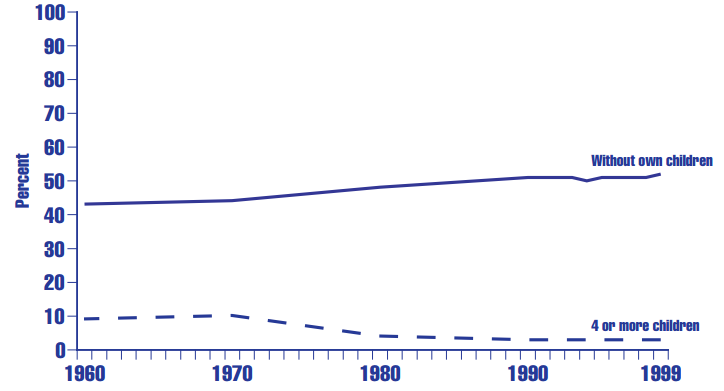
Since 1960, Americans have been moving toward having families with fewer children. Indeed, a growing percentage of families have no minor children of their own in their household. Between 1960 and 1990, the percentage of families with four or more of their own children under age 18 in the household decreased from 9 percent to 3 percent, where it has remained (see Figure PF 2.1). During the same period, the proportion of families with no minor children grew from 43 percent to 51 percent.
Differences by Race and Hispanic Origin. These general trends are also evident when white, black, and Hispanic families are considered separately, though the levels are substantially different for each group (see Table PF 2.1). For example, between 1970 and 1999 the percentage of black families with four or more children dropped from 19 percent to 4 percent. The percentage for whites during that period went from 9 percent to 3 percent. For Hispanic families, the percentage dropped from 10 percent to 6 percent between 1980 (the first year for which Hispanic estimates are available) and 1999.
In 1999, black and Hispanic families were considerably less likely than white families to be without any minor children, with proportions of 44 percent and 37 percent respectively, compared to 53 percent for whites. They were also more likely than white families to have four or more children, though these differences were smaller than in previous decades.
Figure PF 2.1. Percentage of families in the United States with no children, and with four or more resident children: Selected years, 1960-1999
Sources: U.S. Bureau of the Census, Households and Family Characteristics: 1998, no. 515; also previous issues of this annual report (Series P-20, no. 509, no. 495, no. 488, no. 483, no. 477, no. 467, no. 458, no. 447, and no. 366, Table 1 in each; no. 218, Table 5; and no. 106, Table 7).
Table PF 2.1. Percentage distribution of families in the United States by number of own children under age 18 and by race and Hispanic origin:a Selected years, 1960-1999
| 1960 | 1970 | 1980 | 1990 | 1991 | 1992 | 1993 | 1994 | 1995 | 1996 | 1997 | 1998 | 1999 | |
|---|---|---|---|---|---|---|---|---|---|---|---|---|---|
| All families | |||||||||||||
| Without own children | 43 | 44 | 48 | 51 | 51 | 51 | 51 | 50 | 51 | 51 | 51 | 51 | 52 |
| One child | 19 | 18 | 21 | 21 | 20 | 20 | 20 | 20 | 20 | 20 | 20 | 20 | 20 |
| 2 children | 18 | 17 | 19 | 19 | 19 | 18 | 19 | 19 | 19 | 19 | 19 | 19 | 18 |
| 3 children | 11 | 11 | 8 | 7 | 7 | 7 | 7 | 8 | 7 | 7 | 7 | 8 | 7 |
| 4 or more children | 9 | 10 | 4 | 3 | 3 | 3 | 3 | 3 | 3 | 3 | 3 | 3 | 3 |
| Whitea families | |||||||||||||
| Without own children | 43 | 45 | 49 | 51 | 53 | 53 | 53 | 52 | 52 | 52 | 52 | 52 | 53 |
| One child | 19 | 18 | 21 | 21 | 19 | 20 | 19 | 19 | 20 | 19 | 20 | 20 | 19 |
| 2 children | 18 | 18 | 19 | 19 | 18 | 18 | 19 | 19 | 19 | 19 | 19 | 18 | 18 |
| 3 children | 11 | 11 | 8 | 7 | 7 | 7 | 7 | 7 | 7 | 7 | 7 | 7 | 7 |
| 4 or more children | 9 | 9 | 4 | 3 | 3 | 3 | 2 | 2 | 2 | 3 | 2 | 2 | 3 |
| Blacka families | |||||||||||||
| Without own children | — | 39 | 38 | 41 | 41 | 42 | 42 | 40 | 42 | 43 | 42 | 42 | 44 |
| One child | — | 18 | 23 | 25 | 25 | 24 | 25 | 25 | 24 | 24 | 24 | 23 | 24 |
| 2 children | — | 15 | 20 | 19 | 19 | 19 | 18 | 20 | 20 | 18 | 20 | 21 | 19 |
| 3 children | — | 10 | 10 | 9 | 9 | 10 | 10 | 9 | 9 | 9 | 9 | 9 | 9 |
| 4 or more children | — | 19 | 8 | 6 | 6 | 5 | 5 | 5 | 5 | 5 | 5 | 4 | 4 |
| Hispanica families | |||||||||||||
| Without own children | — | — | 31 | 37 | 36 | 36 | 37 | 36 | 36 | 36 | 35 | 36 | 37 |
| One child | — | — | 23 | 23 | 22 | 22 | 23 | 22 | 23 | 23 | 24 | 23 | 23 |
| 2 children | — | — | 23 | 21 | 23 | 22 | 22 | 23 | 23 | 23 | 23 | 23 | 22 |
| 3 children | — | — | 13 | 12 | 12 | 13 | 12 | 13 | 12 | 12 | 12 | 12 | 12 |
| 4 or more children | — | — | 10 | 7 | 7 | 7 | 7 | 6 | 7 | 7 | 6 | 6 | 6 |
a Persons of Hispanic origin may be of any race. Estimates for whites and blacks include persons of Hispanic origin. Source: U.S. Bureau of the Census. Current Population Reports, Series P-20.
PF 2.2 Percentage Distribution of Children by Number of Parents in Household
Family structure is one of many factors that contributes to child well-being. It is also associated with the well-being of the child as an adult. For example, children from disrupted families or families where the parents never married are somewhat more likely to use alcohol and drugs, to become teen parents, and are less likely to earn a high school diploma than children from intact families. These associations are evident even after controlling for family socioeconomic status, race, and other background factors.4 Nevertheless, the great majority of children brought up in single-parent families do well. In particular, differences in well-being between children from divorced and those from intact families tend, on average, to be moderate to small.5
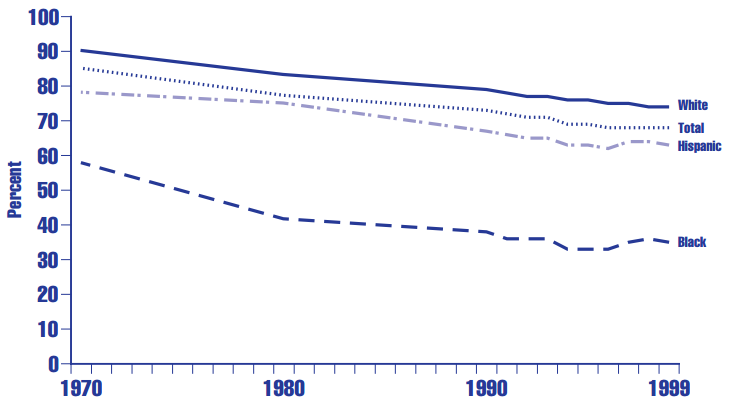
Between 1970 and 1999, the proportion of children in two-parent families (about 84 percent of whom live with both biological parents)6 decreased from 85 percent to 68 percent (see Table PF 2.2.A)
In 1999, 23 percent of children lived with their mother only; 4 percent lived with their father only;7 and 4 percent lived with neither parent (see Table PF 2.2.A).8 Of those who lived with neither parent, more than one-half were residing with one or more grandparents as of 1993 (see Table PF 2.2.B).
Differences by Race and Hispanic Origin. The decrease in the proportion of children living in two-parent families is evident for black, white, and Hispanic children, though the decline is somewhat steeper for black children (see Figure PF 2.2.A). Between 1970 and 1996, the proportion of black children living in two-parent families fell by 25 percentage points from 58 percent to 33 percent (see Table PF 2.2.A). However, between 1996 and 1999, that percentage increased modestly to 35 percent. Between 1970 and 1999, the drop for white children was 16 percentage points, from 90 percent to 74 percent. For Hispanic children, the percentage living in two-parent families decreased from 78 percent to 63 percent.
Table PF 2.2.A Percentage distribution of living arrangements of children under age 18 in the United States, by race and Hispanic origin:a Selected years, 1970-1999
| 1970 | 1980 | 1990 | 1991 | 1992 | 1993 | 1994b | 1995b | 1996b | 1997b | 1998b | 1999b | |
|---|---|---|---|---|---|---|---|---|---|---|---|---|
| Total | ||||||||||||
| Two parents | 85 | 77 | 73 | 72 | 71 | 71 | 69 | 69 | 68 | 68 | 68 | 68 |
| Mother only | 11 | 18 | 22 | 22 | 23 | 23 | 23 | 23 | 24 | 24 | 23 | 23 |
| Father only | 1 | 2 | 3 | 3 | 3 | 3 | 3 | 4 | 4 | 4 | 4 | 4 |
| No parent | 3 | 4 | 3 | 3 | 3 | 3 | 4 | 4 | 4 | 4 | 4 | 4 |
| Whitea | ||||||||||||
| Two parents | 90 | 83 | 79 | 78 | 77 | 77 | 76 | 76 | 75 | 75 | 74 | 74 |
| Mother only | 8 | 14 | 16 | 17 | 18 | 17 | 18 | 18 | 18 | 18 | 18 | 18 |
| Father only | 1 | 2 | 3 | 3 | 3 | 3 | 3 | 3 | 4 | 4 | 5 | 4 |
| No parent | 2 | 2 | 2 | 2 | 2 | 2 | 3 | 3 | 3 | 3 | 3 | 3 |
| Blacka | ||||||||||||
| Two parents | 58 | 42 | 38 | 36 | 36 | 36 | 33 | 33 | 33 | 35 | 36 | 35 |
| Mother only | 30 | 44 | 51 | 54 | 54 | 54 | 53 | 52 | 53 | 52 | 51 | 52 |
| Father only | 2 | 2 | 4 | 4 | 3 | 3 | 4 | 4 | 4 | 5 | 4 | 4 |
| No parent | 10 | 12 | 8 | 7 | 7 | 7 | 10 | 11 | 9 | 8 | 9 | 10 |
| Hispanica | ||||||||||||
| Two parents | 78 | 75 | 67 | 66 | 65 | 65 | 63 | 63 | 62 | 64 | 64 | 63 |
| Mother only | — | 20 | 27 | 27 | 28 | 28 | 28 | 28 | 29 | 27 | 27 | 27 |
| Father only | — | 2 | 3 | 3 | 4 | 4 | 4 | 4 | 4 | 4 | 4 | 5 |
| No parent | — | 3 | 3 | 4 | 3 | 4 | 5 | 4 | 5 | 5 | 5 | 5 |
a Persons of Hispanic origin may be of any race. Estimates for whites and blacks include persons of Hispanic origin.
b Numbers in these years may reflect changes in the Current Population Survey because of newly instituted computer-assisted interviewing techniques and/or because of the change in the population controls to the 1990 Census-based estimates, with adjustments.
Sources: U.S. Bureau of the Census, Current Population Reports, Series P-20, no. 410, no. 461, no. 468, no. 478, no. 491, no. 496u, no. 506u, no. 514u (Table 4 in each); and no. 484, Table A-5; also unpublished data, U.S. Bureau of the Census.
Table PF 2.2.B. Percentage distribution of children under age 18 in the United States in two-parent, one-parent, or no-parent families, by age, race and Hispanic origin, poverty status, and parent’s education level: 1993
| Two-Parent Families | Single-Parent Families | No Parents Present | ||||||
|---|---|---|---|---|---|---|---|---|
| Totala | Biological Parents | One Biological, One Step-parent | Totala | Biologica Mother | Biological Father | Totala | Grandparents | |
| All children | 70.8 | 59.8 | 7.1 | 26.5 | 22.6 | 2.1 | 2.4 | 1.5 |
| Ages 0-5 | 72.8 | 67.4 | 1.8 | 25.4 | 22.5 | 1.2 | 1.8 | 1.3 |
| Ages 6-11 | 70.8 | 58.9 | 7.9 | 26.7 | 22.8 | 1.9 | 2.4 | 1.8 |
| Ages 12-17 | 68.8 | 52.3 | 12.2 | 27.5 | 22.4 | 3.2 | 3.2 | 1.6 |
| Race and Hispanic originb | ||||||||
| White, non-Hispanic | 80.1 | 67.8 | 8.2 | 18.4 | 15.2 | 2.2 | 1.4 | 0.9 |
| Black, non-Hispanic | 35.9 | 28.2 | 4.4 | 56.9 | 48.9 | 2.2 | 7.1 | 4.7 |
| Hispanic | 61.5 | 52.9 | 5.6 | 35.3 | 32.6 | 1.4 | 2.7 | 1.6 |
| Poverty status | ||||||||
| Below poverty | 37.1 | 31.1 | 3.5 | 58.4 | 52.4 | 1.9 | 4.2 | 2.5 |
| At or above poverty | 80.6 | 68.2 | 8.2 | 17.2 | 13.9 | 2.1 | 1.9 | 1.2 |
| Parent's education levelb | ||||||||
| Less than high school | 45.2 | 38.7 | 4.3 | 54.8 | 47.3 | 2.6 | — | — |
| Completed high school | 67.8 | 55.8 | 8.1 | 32.2 | 27.2 | 2.8 | — | — |
| At least some college | 76.5 | 63.1 | 9.4 | 23.5 | 20.3 | 1.9 | — | — |
| Four or more years of college | 90.3 | 79.1 | 6.2 | 9.7 | 7.8 | — | — | — |
a Totals for two-parent, one-parent, and no-parent families include categories beyond those presented separately.
b Education level in two-parent families is determined by the higher educated parent.
Source: Survey of Income and Program Participation, 1993. Analysis by Child Trends.
Figure PF 2.2 Percentage of children under age 18 in the United States who are living with two parents, by race and Hispanic origin:a 1970-1999b
a Persons of Hispanic origin may be of any race. Estimates for whites and blacks include persons of Hispanic origin.
b Numbers in the years 1994 and beyond may reflect changes in the Current Population Survey because of newly constituted computer-assisted interviewing techniques and/or because of the change in the population controls to the 1990 Census-based estimates, with adjustments.
Sources: U.S. Bureau of the Census, Current Population Reports, Series P-20, no. 410, no. 461, no. 468, no. 478, no. 491, no. 496u, no. 506u, no. 514u (Table 4 in each); and no. 484, Table A-5; also unpublished data, U.S. Bureau of the Census. As published in America’s Children: Key National Indicators of Well-Being, 1998. Federal Interagency Forum on Child and Family Statistics, Washington, D.C.: U.S. Government Printing Office, Table POP5.
4 Amato, P.R. 1993. Children’s Adjustment to Divorce: Theories, Hypotheses, and Empirical Support. Journal of Marriage and the Family, 55: 23-58.
5 Zill, N., Morrison, D., & Coiro, M. 1993. Long-Term Effects of Parental Divorce on Parent-Child Relationships: Adjustment and Achievement in Early Adulthood. Journal of Family Psychology 7 (1): 91-103.
6 Analyses by Child Trends of the 1993 Survey of Income and Program Participation indicates that 84 percent of children in married-couple families live with both biological parents (see Table PF 2.2.B).
7 The Current Population Survey overestimates the proportion of children living in father-only families, because it identifies many cohabiting biological-parent couples as father-only. Though the precise size of the overestimate is not known, analyses of the 1993 Survey of Income and Program Participation indicate that a little over 2 percent of all children actually lived in father-only families in that year (see Table PF 2.2.B).
8 Data from the 1996 Current Population Survey (not shown) indicate that 11 percent of all children under age 18 who are living in families live with single parents who are divorced. See Saluter, A. 1997. PPL-66, Household and Family Characteristics: March 1996 (Update), U.S. Bureau of the Census.
PF 2.3 Children Living in Foster Care (9)
A child is placed in foster care when a court determines that his or her family cannot provide a minimally safe environment. This determination often follows an investigation by a state or county child protective services worker. Placement most commonly occurs either because a member of a household has physically or sexually abused a child or because a child’s caretaker(s) has severely neglected the child. In some cases, children with severe emotional disturbances may also be put into foster care.
Since both federal and state laws discourage removal of children from their families unless necessary to ensure a child’s safety, placement in foster care is an extreme step taken only when a child is in immediate danger or when attempts to help the family provide a safe environment have failed; thus, the frequency of placements in foster care is an indicator of family dysfunction that is so severe that a child cannot remain safely with his or her family
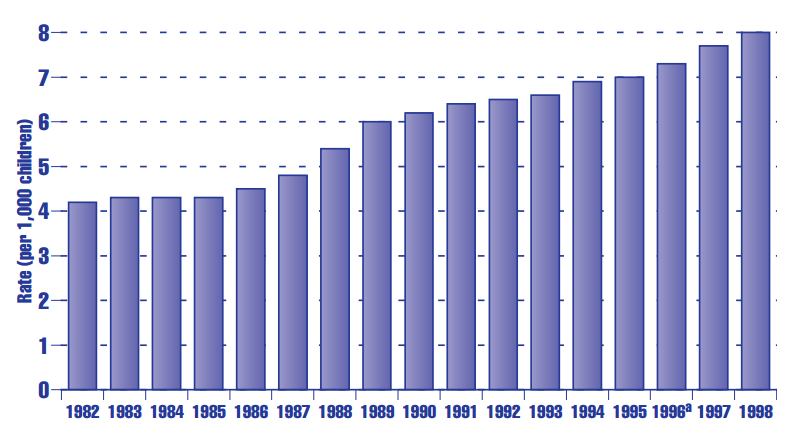
The number of children in foster care rose sharply from 262,000 in 1982 to 560,000 in 1998 (see Table PF 2.3). As shown in Figure PF 2.3, the rate of children living in foster care (i.e., the number of children in foster care per 1,000 children under age 18) also rose dramatically during the same time period, from 4.2 per 1,000 children under age 18 in 1982 to 8.0 per 1,000 in 1998.
Table PF 2.3 Number and rate (per 1,000) of children in the United States living in foster care: 1982-1998
| 1982 | 1983 | 1984 | 1985 | 1986 | 1987 | 1988 | 1989 | 1990 | 1991 | 1992 | 1993 | 1994 | 1995 | 1996a | 1997 | 1998 | |
|---|---|---|---|---|---|---|---|---|---|---|---|---|---|---|---|---|---|
| Total number (in thousands) | 262 | 269 | 276 | 276 | 280 | 300 | 340 | 383 | 400 | 414 | 427 | 445 | 468 | 483 | 507 | 537 | 560 |
| Rate | 4.2 | 4.3 | 4.3 | 4.3 | 4.5 | 4.8 | 5.4 | 6.0 | 6.2 | 6.4 | 6.5 | 6.6 | 6.9 | 7.0 | 7.3 | 7.7 | 8.0 |
Note: Estimate of total is the number of children in foster care on the last day of the fiscal year.
a 1996 was the last year in which data on foster care were collected through the Voluntary Cooperative Information System (VCIS). The Administration on Children and Families (ACF) has implemented the Adoption and Foster Care Analysis and Reporting System (AFCARS) as a replacement for VCIS. While VCIS was a voluntary reporting system, states are required to participate in AFCARS and must use uniform definitions. Most importantly, AFCARS collects case-level foster care data. Estimates in this table may not be comparable to estimates provided in previous issues of Trends in the Well-Being of America's Children and Youth due to the population estimates provided by the U.S. Bureau of the Census.
Sources: Estimate of children in foster care for 1997 and 1998 from special analysis by John Gavdiosi, Department of Health and Human Services, Administration for Children and Families, Children’s Bureau, 1999; estimates of children in foster care for years 1982-1996 from Tashio Tatara, 1995, and 1997; population estimates for 1982-1990 from U.S. Bureau of the Census, Statistical Abstract of the United States, 1996; population estimates for 1990-1998 from Population Estimates Program, Population Division, U.S. Census Bureau, Table ST-99-9.
Figure PF 2.3 Children in the United States living in foster care (rate per 1,000 children): 1982-1998
Note: Estimate of total is the number of children in foster care on the last day of the fiscal year.
a 1996 was the last year in which data on foster care were collected through the Voluntary Cooperative Information System (VCIS). The Administration on Children and Families (ACF) has implemented the Adoption and Foster Care Analysis and Reporting System (AFCARS) as a replacement for VCIS. While VCIS was a voluntary reporting system, states are required to participate in AFCARS and must use uniform definitions. Most importantly, AFCARS collects case-level foster care data. Estimates in this table may not be comparable to estimates provided in previous issues of Trends in the Well-Being of America’s Children and Youth due to changes in the population estimates provided by the U.S. Bureau of the Census.
Sources: Estimate of children in foster care for 1997 and 1998 from special analysis by John Gavdiosi, Department of Health and Human Services, Administration for Children and Families, Children’s Bureau, 1999; estimates of children in foster care for years 1982-1996 from Tatara, 1995, and 1997, no. 13; population estimates for 1982-1990 from U.S. Bureau of the Census, Statistical Abstract of the United States, 1996; population estimates for 1990-1998 from Population Estimates Program.
9 For purposes of this report, “foster care” is defined as a living arrangement where a child resides outside his or her own home, under the case management and planning responsibility of a state child welfare agency. These living arrangements include relative and nonrelative foster homes, group homes, child-care facilities, emergency shelter care, supervised independent living, and nonfinalized adoptive homes.
Neighborhoods
PF 3.1 Residential Stability: Percentage of Children Under Age 18 (10) Who Have Moved Within the Last Year
Research has demonstrated a strong relationship between residential stability and child well-being, with frequent moves associated with such negative outcomes as dropping out of high school, delinquency, depression, and nonmarital teen births. Some researchers theorize that these negative associations may result from a lack of attachment to a local community and its institutions on the part of frequent movers.
The United States has long been a highly mobile society. In 1960, 21 percent of children under the age of 18 had moved to a new residence during the previous year. The general trend since that time has been toward somewhat lower rates of mobility, with a rate of 18 percent in 1997.11
Differences by Age. Young children were the most mobile of any child age group (see Table PF 3.1). In 1999, 23 percent of children between the ages of 1 and 4 had changed residences in the previous year, compared with 18 percent among children ages 5 through 9, 13 percent of ages 10 through 14, and 13 percent of youth ages 15 through 17.
Differences by Race and Hispanic Origin. For all children under age 18 in 1999, white children were the least mobile, with 16 percent moving during the previous year compared with 23 percent of black and 19 percent of Hispanic children.
Table PF 3.1 Percentage of children in the United States under age 18a who have moved within the last year, by age and by race and Hispanic origin:b 1990-1999c
| 1990 | 1991 | 1992 | 1993 | 1994 | 1996 | 1997 | 1998 | 1999 | |
|---|---|---|---|---|---|---|---|---|---|
| All children | |||||||||
| All ages | 18 | 17 | 18 | 17 | 17 | 18 | 18 | 17 | 17 |
| Ages 1-4 | 24 | 23 | 22 | 23 | 22 | 25 | 24 | 23 | 23 |
| Ages 5-9 | 19 | 18 | 18 | 17 | 17 | 18 | 19 | 18 | 18 |
| Ages 10-14 | 15 | 14 | 15 | 14 | 13 | 15 | 15 | 14 | 13 |
| Ages 15-17 | 15 | 15 | 14 | 14 | 15 | 13 | 14 | 13 | 13 |
| Whiteb children | |||||||||
| All ages | 18 | 17 | 17 | 16 | 16 | 17 | 17 | 16 | 16 |
| Ages 1-4 | 23 | 22 | 21 | 22 | 21 | 24 | 23 | 22 | 21 |
| Ages 5-9 | 18 | 17 | 17 | 16 | 16 | 18 | 18 | 16 | 17 |
| Ages 10-14 | 14 | 13 | 15 | 13 | 12 | 14 | 15 | 13 | 13 |
| Ages 15-17 | 14 | 14 | 14 | 14 | 13 | 12 | 13 | 12 | 12 |
| Blackb children | |||||||||
| All ages | 21 | 21 | 21 | 20 | 20 | 22 | 23 | 22 | 23 |
| Ages 1-4 | 26 | 26 | 27 | 26 | 25 | 29 | 29 | 28 | 32 |
| Ages 5-9 | 22 | 22 | 22 | 20 | 22 | 22 | 26 | 24 | 27 |
| Ages 10-14 | 19 | 17 | 18 | 17 | 16 | 18 | 18 | 20 | 17 |
| Ages 15-17 | 18 | 16 | 16 | 14 | 18 | 14 | 17 | 16 | 15 |
| Hispanicb children | |||||||||
| All ages | 25 | 21 | 24 | 23 | 21 | 23 | 23 | 21 | 19 |
| Ages 1-4 | 32 | 27 | 27 | 28 | 26 | 31 | 28 | 26 | 24 |
| Ages 5-9 | 28 | 20 | 25 | 24 | 20 | 23 | 21 | 21 | 19 |
| Ages 10-14 | 18 | 19 | 21 | 19 | 15 | 18 | 22 | 16 | 14 |
| Ages 15-17 | 21 | 19 | 19 | 20 | 21 | 19 | 17 | 17 | 16 |
a Estimates are based on children ages 1 and older at time of survey
b Persons of Hispanic origin may be of any race. Estimates for whites and blacks include persons of Hispanic origin.
c Estimates for 1995 are not available.
Sources: U.S. Bureau of the Census, 1999. Geographical Mobility, and earlier reports; also previous issues of this annual report (Series P-20, no. 510, P-20, no. 497, no. 485, no. 481, no. 463, no. 456, Table 26 in all).
10 Estimates were based on children ages 1 and older at time of survey.
11 Wood, D., Halfon, N., Scarlata, D., Newacheck, P., & Nessim, S. 1993. Impact of Family Relocation on Children’s Growth, Development, School Function, and Behavior. JAMA 270: 1334-1338; Coleman, J. 1988. Social Capital and the Creation of Human Capital. American Journal of Sociology 94: s95-s120.
PF 3.2 Children in Poor and Very Poor Neighborhoods
Recent research has demonstrated a significant relationship between neighborhood quality and the well-being of the children and youth who live in them. Even after controlling for relevant personal and family background characteristics, residence in a low-income neighborhood has been shown to have negative effects on early childhood development, associated with higher rates of dropping out of high school, and with teen parenthood.12 In 1997, 55.8 percent of children living below the poverty level lived in a very poor neighborhood— defined as a census tract in which 40 percent or more of the residents live in poor families13 (see Table PF 3.2).
Differences by Race and Hispanic Origin. Hispanic children were the most likely to live in very poor neighborhoods, followed by white children and black children. Sixty-one percent of Hispanic children in poverty lived in more than 40 percent poor neighborhoods, compared to 56 percent of white children and 53 percent of black children (see Figure PF 3.2).
Differences by Family Structure. Children in single-parent families in poverty were much more likely to live in a very poor neighborhood than were children in two-parent families (70.8 percent versus 38.6 percent) (see Figure PF 3.2)
Table PF 3.2. Percentage of related childrena in the United States below the poverty levelb by the poverty level of their neighborhood, by age, family structure, and race and Hispanic originc : 1997
| All Areas | Neighborhood Poverty Level | ||||
|---|---|---|---|---|---|
| Poor | Non-Poor | Poor | 30+ Percent Poor | 40+ Percent Poor | |
| Total | 19.2 | 13.2 | 41.5 | 51.0 | 55.8 |
| Age of child | |||||
| Under 6 years | 21.6 | 15.2 | 45.4 | 54.8 | 57.6 |
| 6 - 17 years | 18.0 | 12.2 | 39.6 | 49.0 | 54.9 |
| Family structure | |||||
| Married couple families | |||||
| Under 6 years | 10.6 | 7.7 | 26.9 | 38.0 | 38.2 |
| 6 - 17 years | 8.8 | 6.0 | 23.7 | 33.1 | 38.8 |
| Single parent families (female) | |||||
| Under 6 years | 59.1 | 51.0 | 70.3 | 72.3 | 78.5 |
| 6 - 17 years | 44.7 | 35.8 | 60.3 | 64.0 | 67.6 |
| Race and Hispanic originc | |||||
| Whitec | 15.4 | 11.2 | 38.3 | 51.9 | 56.0 |
| Blackc | 36.8 | 28.6 | 45.5 | 48.5 | 53.0 |
| Hispanicc | 36.4 | 25.9 | 52.2 | 58.6 | 61.1 |
a Under 18 years of age.
b Poverty rate of neighborhood in 1979, poverty status of persons in 1997.
c Persons of Hispanic origin may be of any race. Estimates for whites and blacks include persons of Hispanic origin. Estimates for whites also include all other persons not white, black, or Hispanic.
Note: Neighborhoods are defined as census tracts and block-numbering areas. Both metropolitan and nonmetropolitan areas are included. The poverty rate is the percentage of all persons in the neighborhood living in families below the federal poverty line in 1990.
Source: U.S. Bureau of the Census, Current Population Survey: March Supplement. Available online at http://ferret.bls.census.gov/macro/031998/pov/5_001.htm.
Figure PF 3.2. Percentage of children below the poverty level in the United States who live in very poor (40+ percent poverty) neighborhoods, by race and family structure, 1997
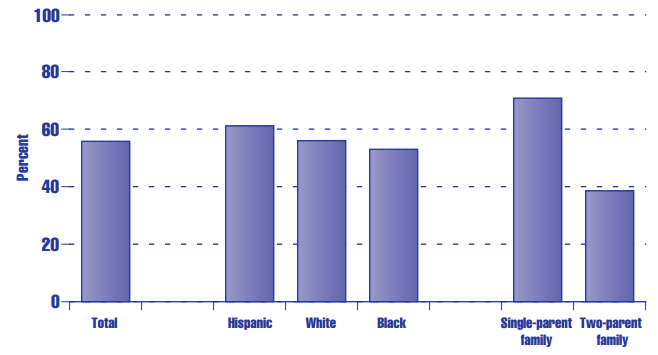
Source: U.S. Bureau of the Census, Current Population Survey: March Supplement. Available online at http://ferret.bls.census.gov/macro/031998/pov/5_001.htm.
12 Brooks-Gunn, J., Duncan, G., Klebanov, P., & Sealand, N. 1994. Do Neighborhoods Influence Child and Adolescent Behavior? American Journal of Sociology 99 (2): 353-395. See also Crane, J. 1991. The Epidemic Theory of Ghettos and Neighborhood Effects on Dropping Out of High School and Teenage Childbearing. American Journal of Sociology 96 (5): 1126-1159.
13 While trend data for children are not available, trends for the entire population show that between 1970 and 1990, the percent of all persons living in very poor neighborhoods increased from 3 percent to 4.5 percent, and the numbers nearly doubled from 4.1 million to 8 million. See Jargowsky, P.A. 1996. Poverty and Place: Ghettos, Barrios, and the American City, Table 2.1. New York: Russell Sage.
Section 2: Economic Security (ES)
Poverty and Income
ES 1.1 Median Family Income
Median income1 of families with children is a good starting point for assessing the economic well-being of children since it measures the ability of a family at the midpoint of the income distribution to purchase food, shelter, clothing, child care, and other basic goods and services required to raise children.2
However, median family income fails to capture important economic resources that may also be available to a family, such as employer-paid health benefits, Medicaid, or Food Stamps; moreover, it says nothing about changes in the distribution of income across families. For a more complete picture of children’s economic well-being, it is necessary to look at several measures of economic well-being, including those in the following sections.
Median Family Income of All Families with Children. Between 1975 and 1998, median income of all families with children (in constant 1998 dollars)3 increased gradually from $41,304 in 1975 to $45,442 in 1998 (see Table ES 1.1).4
Median Family Income by Family Type. Throughout the period from 1975 through 1998, median income of mother-only families has never exceeded 35 percent of median income of two-parent families (see Figure ES 1.1). In 1998, the median family income of mother-only families was $18,409, compared with $57,022 for married-couple families with children. During the same time period, the median income of father-only families never exceeded 62 percent of median income of two-parent families (see Figure ES 1.1). In 1998, median income of father-only families was $30,869.
Differences in Median Family Income by Race and Hispanic Origin. Median family incomes are substantially higher for white families with children than for black or Hispanic families with children. In 1998, whites enjoyed median family incomes that were about 89 percent higher than those of black families and 76 percent higher than those of Hispanic families (see Table ES 1.1).
Table ES 1.1 Median income of families in the United States with related children under age 18, by race and Hispanic origina and family structure (in constant 1998 dollars):b Selected years, 1975-1998
| 1975 | 1980 | 1985 | 1990 | 1995 | 1996 | 1997 | 1998 | |
|---|---|---|---|---|---|---|---|---|
| All families | $41,304 | $42,315 | $41,969 | $42,689 | $42,799 | $42,578 | $44,223 | $45,442 |
| White | — | — | — | $45,522 | $46,088 | $46,258 | $47,498 | $48,878 |
| Black | — | — | — | $24,143 | $24,248 | $23,803 | $25,629 | $25,841 |
| Hispanic | — | — | — | $27,441 | $24,671 | $25,576 | $26,527 | $27,742 |
| Married-couple families | ||||||||
| All races | $45,611 | $48,139 | $49,005 | $51,457 | $53,445 | $53,781 | $55,242 | $57,022 |
| White | — | — | — | $51,987 | $54,113 | $54,388 | $56,092 | $57,974 |
| Black | — | — | — | $44,549 | $47,003 | $44,357 | $48,373 | $48,536 |
| Hispanic | — | — | — | $34,264 | $31,737 | $32,841 | $33,751 | $34,243 |
| Mother-only families | ||||||||
| All races | $15,908 | $16,763 | $15,264 | $16,327 | $17,364 | $17,026 | $17,525 | $18,409 |
| White | — | — | — | $18,542 | $19,358 | $18,844 | $19,234 | $20,799 |
| Black | — | — | — | $12,853 | $13,982 | $14,178 | $15,346 | $15,356 |
| Hispanic | — | — | — | $12,648 | $12,627 | $11,678 | $13,185 | $14,083 |
| Father-only families | ||||||||
| All races | $34,131 | — | — | $31,441 | $28,867 | $27,531 | $29,115 | $30,869 |
| White | — | — | — | $32,635 | $30,146 | $28,771 | $30,671 | $32,606 |
| Black | — | — | — | $25,647 | $23,866 | $23,091 | $22,155 | $25,012 |
| Hispanic | — | — | — | $25,909 | $20,861 | $23,430 | $20,340 | $24,661 |
a Persons of Hispanic origin may be of any race. Estimates for whites and blacks include persons of Hispanic origin.
b Income statistics converted to constant 1998 dollars using the CPI-U-X1 (all items) price index. CPI-U-X1 is a rental equivalence approach to homeowners’ costs for the consumer price index prior to 1983, the first year for which the official index (CPI-U) incorporates such a measure.
Sources: Unpublished tabulations of the March Current Population Survey supplied by U.S. Bureau of the Census; U.S. Bureau of the Census, Current Population Survey, Annual Demographic Survey: March Supplement, Table FINC-04 available online at www.census.gov/hhes/income/histinc.html; Council of Economic Advisors, 1997. Economic Report of the President, 1997, Table B-58; U.S. Bureau of the Census, 1998. Current Population Reports, Money Income (with separate data on valuation of noncash benefits), Table B-1. U.S. Bureau of the Census, Historical Income Tables — Families, Table F9, F10, F10A, F10B, F10C, available online at www.census.gov/hhes/income/histinc.html.8/9/00
Figure ES 1.1 Median income of families in the United States with related children under age 18, by family structure (in constant 1998 dollars):a Selected years, 1975-1998
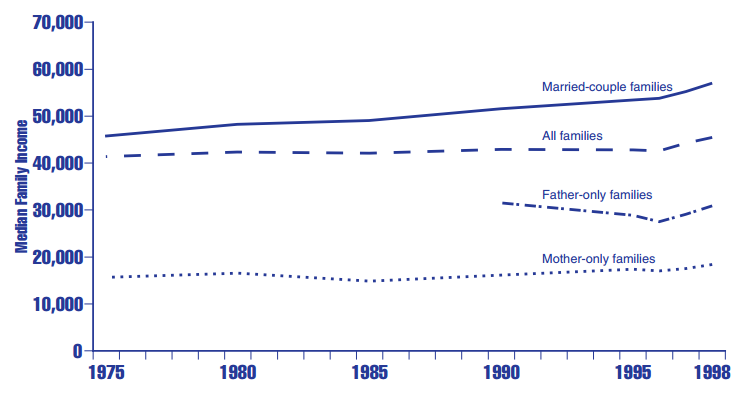
a Income statistics converted to constant 1998 dollars using the CPI-U-X1 (all items) price index. CPI-U-X1 is a rental equivalence approach to homeowners’ costs for the consumer price index prior to 1983, the first year for which the official index (CPI-U) incorporates such a measure.
Sources: Unpublished tabulations of the March Current Population Survey supplied by U.S. Bureau of the Census; U.S. Bureau of the Census, Current Population Survey, Annual Demographic Survey: March Supplement, Table FINC-04; 1/20/99; Council of Economic Advisors, 1997; U.S. Bureau of the Census, 1998.
1 Median income is the amount that divides the income distribution into two equal groups, half having incomes above the median, half having incomes below the median.
2 When median family income is rising, the likelihood is that children in a typical family are enjoying a rising standard of living.
3 In constructing income figures in constant 1998 dollars, we have followed the practice of the Bureau of the Census and used the CPI-U-X1 consumer price index. This index differs from the standard CPI-U index in its treatment of the costs of owner-occupied housing for years prior to 1986. After 1986, it is identical to the CPI-U.
4 However, this apparent stagnation was in part the result of a shift in the living arrangements of families with children. As shown in Table PF 2.1.A, between 1970 and 1997 the percentage of children living in female-headed families increased from 11 percent to 24 percent. Since, as will be described in the next section, female-headed families have much lower incomes than two-parent families, this shift in living arrangements depressed the median income of all families with children.
ES 1.2 Children in Poverty
Being raised in economically deprived circumstances can have far-reaching negative consequences for children. Growing up at or near the poverty line ($16,530 for a family of four in 1998) means not only that a child has a much lower level of consumption than other children but also that he or she is more likely than a nonpoor child to experience difficulties in school,5 to become a teen parent,6 and, as an adult, to earn less and experience greater unemployment.7 The effects of being raised in a family with income significantly below the poverty line are correspondingly more damaging.8
Differences by Family Structure. The chances of a child experiencing poverty are strongly influenced by the type of family in which he or she lives. Throughout the period from 1960 through 1994, over half of the children living in female-headed families were poor. This percentage decreased in the late nineties to 46 in 1998 (see Table ES 1.2.A). In contrast, during the 1990s, only about 10 percent of children living in married-couple families were poor (see Figure ES 1.2.A).
Differences by Race and Hispanic Origin. The proportion of black and Hispanic children at or below 100 percent of the poverty line has declined between 1996 and 1998 (from 40 percent to 36 percent for black children and from 40 percent to 34 percent for Hispanic children). In contrast, the proportion of white children dropped only slightly from 16 percent to 14 percent. There was also a significant drop between 1996 and 1998 in the proportion of black and Hispanic children living at or below 200 percent of the poverty line (from 68 percent to 64 percent for black children and from 72 percent to 66 percent for Hispanic children) (see Table ES 1.2.B).
Children At, Below, and Slightly Above the Poverty Level. Figures ES 1.2.B and ES 1.2.C illustrate trends in the proportions of children living in various degrees of poverty and near-poverty.
- Children in families with incomes below 50 percent of the poverty line. Between 1975 and 1993, the proportion of children living in extreme poverty, that is, at or below 50 percent of the poverty line, doubled from 5 percent in 1975 to 10 percent by 1993. By 1998, this percentage had dropped back to 8 percent (see Table ES 1.2.B).
- Children in families with incomes at or below the poverty line. Less dramatic but still striking, the proportion of children at or below 100 percent of the poverty line increased by 31 percent9 from 17 percent in 1975 to 22 percent by 1993 before dropping to 18 percent in 1998 (see Figure ES 1.2.A).
- Children above but near the poverty line. In contrast, the proportion of children living at or below 150 percent of the poverty line was about the same in 1998 (29 percent) as it was in 1975 (30 percent). As shown in the upper line of Figure ES 1.2.C, the proportion of children living at or below 200 percent of the poverty line in 1998 was 40 percent, compared with 43 percent in 1975.
Table ES 1.2.A Percentage of children in the United States under age 18 living below the poverty level,a by family structure, age, and race and Hispanic origin:b Selected years, 1960-1998
| 1960 | 1965 | 1970 | 1975 | 1980 | 1985 | 1990 | 1991 | 1992 | 1993 | 1994 | 1995 | 1996 | 1997 | 1998 | |
|---|---|---|---|---|---|---|---|---|---|---|---|---|---|---|---|
| All families with related children under age 18 | 26 | 21 | 15 | 17 | 18 | 20 | 20 | 21 | 22 | 22 | 21 | 20 | 20 | 19 | 18 |
| White | 20 | 14 | 10 | 12 | 13 | 16 | 15 | 16 | 16 | 17 | 16 | 16 | 16 | 15 | 14 |
| Black | — | — | 42 | 41 | 42 | 43 | 44 | 46 | 46 | 46 | 43 | 41 | 40 | 37 | 36 |
| Hispanic | — | — | — | 33 | 33 | 40 | 38 | 40 | 39 | 40 | 41 | 39 | 40 | 36 | 34 |
| Asian | — | — | — | — | — | — | 17 | 17 | 16 | 18 | 18 | 19 | 19 | 20 | — |
| Related children ages 6-17 | — | — | 14 | 16 | 17 | 19 | 18 | 19 | 19 | 20 | 19 | 18 | 18 | 18 | 21 |
| White | — | — | 10 | 12 | 12 | 14 | 14 | 15 | 15 | 15 | 15 | 14 | 14 | 14 | 17 |
| Black | — | — | 41 | 42 | 40 | 41 | 41 | 42 | 43 | 43 | 40 | 37 | 37 | 35 | 35 |
| Hispanic | — | — | — | — | 32 | 39 | 36 | 37 | 37 | 38 | 39 | 37 | 38 | 35 | 32 |
| Related children under age 6 | — | — | 17 | 18 | 20 | 23 | 23 | 24 | 26 | 26 | 25 | 24 | 23 | 22 | 17 |
| White | — | — | 12 | 14 | 16 | 18 | 18 | 19 | 20 | 20 | 19 | 18 | 18 | 18 | 13 |
| Black | — | — | 42 | 41 | 45 | 47 | 50 | 51 | 53 | 52 | 49 | 49 | 45 | 40 | 35 |
| Hispanic | — | — | — | — | 34 | 41 | 40 | 44 | 43 | 43 | 44 | 42 | 42 | 38 | 32 |
| Married-couple families with related children under age 18 | — | — | — | — | — | — | 10 | 11 | 11 | 12 | 11 | 10 | 10 | 9 | 9 |
| White | — | — | — | — | — | — | 9 | 10 | 10 | 11 | 10 | 9 | 9 | 9 | 8 |
| Black | — | — | — | — | — | — | 18 | 15 | 18 | 18 | 15 | 13 | 14 | 13 | 12 |
| Hispanic | — | — | — | — | — | — | 26 | 29 | 29 | 30 | 30 | 28 | 29 | 26 | 23 |
| Asian | — | — | — | — | — | — | — | — | — | 16 | — | 15 | 15 | — | — |
| Related children ages 6-17 | — | — | — | — | — | — | 9 | 10 | 10 | 11 | 10 | 9 | 9 | 9 | 10 |
| White | — | — | — | — | — | — | 8 | 9 | 9 | 10 | 9 | 9 | 8 | 8 | 10 |
| Black | — | — | — | — | — | — | 17 | 14 | 16 | 17 | 14 | 12 | 14 | 13 | 10 |
| Hispanic | — | — | — | — | — | — | 25 | 26 | 26 | 28 | 28 | 27 | 28 | 25 | 25 |
| Related children under age 6 | — | — | — | — | — | — | 12 | 12 | 13 | 13 | 12 | 11 | 12 | 11 | 8 |
| White | — | — | — | — | — | — | 11 | 11 | 12 | 13 | 11 | 11 | 11 | 10 | 8 |
| Black | — | — | — | — | — | — | 20 | 17 | 22 | 20 | 15 | 14 | 14 | 13 | 13 |
| Hispanic | — | — | — | — | — | — | 28 | 33 | 32 | 33 | 33 | 31 | 32 | 28 | 22 |
| Female-headed families with related children under age 18 | 68 | 64 | 59 | 53 | 51 | 54 | 53 | 55 | 55 | 54 | 53 | 50 | 49 | 49 | 46 |
| White | 60 | 53 | 43 | 44 | 42 | 45 | 46 | 47 | 46 | 46 | 46 | 42 | 43 | 44 | 40 |
| Black | — | — | 68 | 66 | 65 | 67 | 65 | 68 | 67 | 6 | 63 | 62 | 58 | 55 | 55 |
| Hispanic | — | — | — | — | 65 | 72 | 68 | 69 | 66 | 66 | 68 | 66 | 67 | 63 | 60 |
| Related children | |||||||||||||||
| ages 6-17 | — | — | 49 | 49 | 46 | 48 | 47 | 50 | 49 | 48 | 47 | 45 | 45 | 45 | 55 |
| White | — | — | 38 | 40 | 36 | 40 | 39 | 41 | 39 | 40 | 40 | 37 | 38 | 39 | 50 |
| Black | — | — | 66 | 66 | 62 | 63 | 60 | 65 | 63 | 62 | 59 | 56 | 55 | 53 | 60 |
| Hispanic | — | — | — | — | 62 | 70 | 64 | 65 | 62 | 63 | 65 | 62 | 65 | 60 | 67 |
| Related children under age 6 | — | — | 64 | 62 | 65 | 66 | 66 | 66 | 66 | 64 | 64 | 62 | 59 | 59 | 42 |
| White | — | — | 59 | 58 | 60 | 59 | 60 | 60 | 61 | 58 | 59 | 55 | 54 | 57 | 36 |
| Black | — | — | 71 | 67 | 72 | 75 | 73 | 74 | 73 | 72 | 70 | 71 | 64 | 61 | 52 |
| Hispanic | — | — | — | — | 70 | 78 | 77 | 74 | 72 | 72 | 74 | 72 | 72 | 68 | 55 |
a The poverty level is based on money income and does not include noncash benefits, such as Food Stamps. Poverty thresholds reflect family size and composition and are adjusted each year using the annual average Consumer Price Index (CPI) level. The average poverty threshold for a family of four was $16,530 in 1998. Related children include biological children, stepchildren, and adopted children of the householder and all other children in the household related to the householder (or reference person) by blood, marriage, or adoption.
b Persons of Hispanic origin may be of any race. Estimates for whites, blacks, and Asians include persons of Hispanic origin.
Sources: U.S. Bureau of the Census, Current Population Reports, Series P-60, 4; 86, Table 1; 106, Table 11; 133, Table 11; 158, Table 7; 175, Table 6; 181, Table 5; 185, Revised Table 6; 188, Table 8; 189, Table 9; 194, Table 2; 198, Table 2; and 201, Tables 2, A-1, and C-2; U.S. Bureau of the Census, Current Population Reports, The Asian and Pacific Islander Population,Table 8; 77, Table 5; and 81, Table 5.
Figure ES 1.2.A Percentage of children in the United States under age 18 living below the poverty level,a by family type: Selected years, 1960-1998
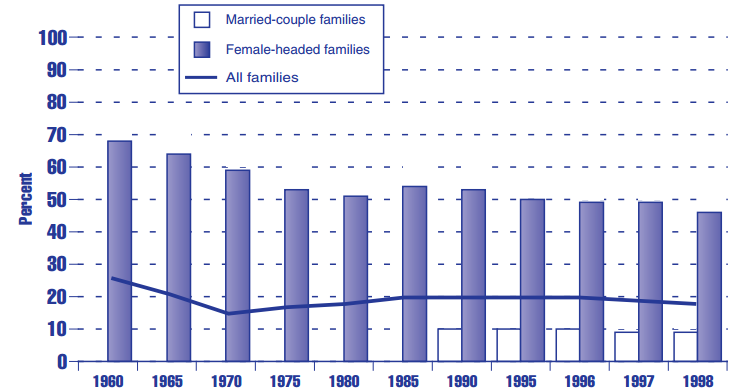
a The poverty level is based on money income and does not include noncash benefits, such as Food Stamps. Poverty thresholds reflect family size and composition and are adjusted each year using the annual average Consumer Price Index (CPI) level. The average poverty threshold for a family of four was $16,530 in 1998. Related children include biological children, stepchildren, and adopted children of the householder and all other children in the household related to the householder (or reference person) by blood, marriage, or adoption.
Sources: U.S. Bureau of the Census, Current Population Reports, Series P-60, no. 81, Table 4; no. 86, Table 1; no. 106, Table 11; no. 133, Table 11; no. 158, Table 7; no. 175, Table 6; no. 181, Table 5; no. 185, Revised Table 6; no. 188, Table 8; no. 189, Table 9; no. 194, Table 2; no. 198, Table 2; and no. 201, Tables 2, A-1, and C-2.
Table ES 1.2.B Percentage of children in the United States under age 18 living below selected povertya thresholds, by age and by race and Hispanic origin:b Selected years, 1975-1998
| 1975 | 1980 | 1985 | 1990 | 1991 | 1992 | 1993 | 1994 | 1995 | 1996 | 1997 | 1998 | |
|---|---|---|---|---|---|---|---|---|---|---|---|---|
| Under 50% of poverty | ||||||||||||
| Related children under age 18 | 5 | 7 | 8 | 8 | 9 | 10 | 10 | 9 | 8 | 8 | 8 | 8 |
| White | 4 | 5 | 6 | 6 | 6 | 6 | 6 | 6 | 6 | 6 | 6 | 5 |
| Black | 14 | 17 | 21 | 22 | 25 | 27 | 26 | 23 | 20 | 20 | 19 | 17 |
| Hispanic | — | — | — | 14 | 14 | 15 | 14 | 17 | 16 | 14 | 16 | 13 |
| Under 100% of poverty | ||||||||||||
| Related children under age 18 | 17 | 18 | 20 | 20 | 21 | 22 | 22 | 21 | 20 | 20 | 19 | 18 |
| White | 12 | 13 | 16 | 15 | 16 | 16 | 17 | 16 | 16 | 16 | 15 | 14 |
| Black | 41 | 42 | 43 | 44 | 46 | 46 | 46 | 43 | 41 | 40 | 37 | 36 |
| Hispanic | 33 | 33 | 40 | 38 | 40 | 39 | 40 | 41 | 39 | 40 | 36 | 34 |
| Under 150% | ||||||||||||
| of poverty | ||||||||||||
| Related children | ||||||||||||
| under age 18 | 30 | 29 | 32 | 31 | 32 | 33 | 33 | 32 | 32 | 31 | 30 | 29 |
| White | 24 | 24 | 26 | 25 | 26 | 27 | 27 | 27 | 26 | 26 | 26 | 24 |
| Black | 60 | 57 | 59 | 57 | 60 | 60 | 61 | 58 | 56 | 56 | 51 | 52 |
| Hispanic | — | — | — | 55 | 58 | 58 | 59 | 58 | 59 | 57 | 56 | 52 |
| Under 200% | ||||||||||||
| of poverty | ||||||||||||
| Related children | ||||||||||||
| under age 18 | 43 | 42 | 43 | 42 | 43 | 44 | 44 | 43 | 43 | 43 | 41 | 40 |
| White | 38 | 37 | 38 | 37 | 38 | 38 | 38 | 38 | 37 | 37 | 36 | 34 |
| Black | 73 | 70 | 71 | 68 | 70 | 71 | 72 | 68 | 68 | 68 | 64 | 64 |
| Hispanic | — | — | — | 69 | 71 | 70 | 72 | 72 | 72 | 72 | 69 | 66 |
Financial Support
ES 2.1 Means-Tested Assistance: AFDC(10) and Food Stamps
Many poor children have depended on Aid to Families with Dependent Children (AFDC) and the Food Stamp program for basic material needs. AFDC was a federal and state cash assistance program targeted at needy children and at certain others in these children’s households.11 Among all children under age 6 in 1982, 21 percent were on AFDC for at least 1 year over the next 10 years (see Figure ES 2.1.A). As a result of major welfare reform enacted in August 1996, the AFDC program has now been replaced by the Temporary Assistance for Needy Families (TANF) program. TANF provides a block grant to states to design and administer their own welfare and work programs.
The Food Stamp program provides low-income households with vouchers that can be exchanged for food. The welfare reform law includes significant new restrictions on Food Stamp eligibility for immigrants who have not become U.S. citizens.
Children’s Receipt of AFDC and Other Welfare Benefits. Twelve percent of all children lived in families receiving AFDC or General Assistance in 1979, according to survey data (see Figure ES 2.1.B). The rate decreased slightly to 11 percent in 1989 but by 1993 had increased to 14 percent. However, by 1997, the recipiency rate had dropped to 9 percent.
Children’s Receipt of Food Stamps. Food Stamp receipt shows a similar pattern. The percentage of all children living in households receiving Food Stamps remained fairly constant at around 15 percent from 1979 to 1989 (see Figure ES 2.1.B). The proportion had increased to 20 percent by 1993. In that year 14.2 million children lived in households receiving Food Stamps (see Table ES 2.1.B). However, the recipiency rate had dropped back down to 15 percent by 1997.
Receipt of AFDC and Food Stamps by Race and Hispanic Origin. The percentage of children receiving AFDC and Food Stamps varies substantially by race/Hispanic origin. According to 1992 data from the Panel Study of Income Dynamics,12 only 5 percent of white non-Hispanic children received AFDC and only 8 percent received Food Stamps (see Figure ES 2.1.C). In contrast, among black non-Hispanic children, 32 percent received AFDC and 42 percent received Food Stamps. Among Hispanic children, 18 percent received AFDC and 30 percent received Food Stamps.
There was also substantial variation among Hispanic children, depending on their descent. Among children of Cuban descent, only 8 percent received AFDC and 18 percent received Food Stamps. In contrast, among children of Puerto Rican descent, 28 percent received AFDC and 48 percent received Food Stamps. Among children of Mexican descent, 15 percent received AFDC and 30 percent received Food Stamps.
Figure ES 2.1.A Percentage of children under age 6 in the United States receiving any AFDCa benefit, by number of years and by race:b 1982
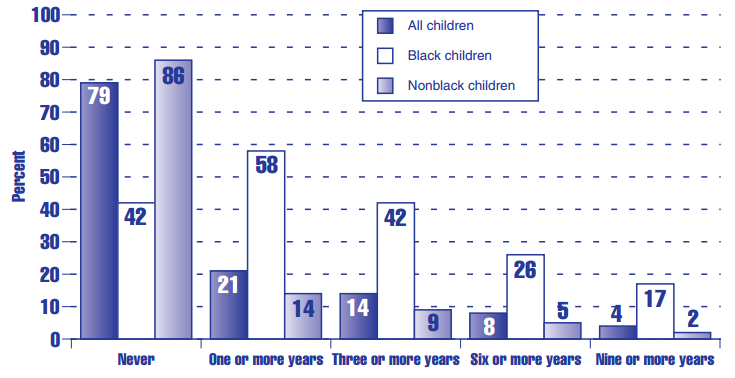
a Receipt of AFDC by families of children who were under age 6 in 1982 was monitored for the decade beginning in 1982 and ending in 1991. The figure displays the percentage who participated in AFDC by number of years participating over the 10-year period (minimum is zero; maximum is 10 years).
b Persons of Hispanic origin may be of any race. Estimates for blacks and nonblacks include persons of Hispanic origin. Source: Estimates supplied by Greg J. Duncan, Northwestern University, based on data from the Panel Study of Income Dynamics.
Table ES 2.1.A Percentage and number (in thousands) of children in the United States under age 18 in families receiving AFDC or General Assistance: Selected years, 1979-1997
| 1979 | 1989 | 1993 | 1994 | 1995 | 1996 | 1997 | |
|---|---|---|---|---|---|---|---|
| Number (in thousands) | 7,228 | 7,116 | 9,440 | 9,463 | 8,656 | 7,490 | 6,201 |
| Percent | 12 | 11 | 14 | 13 | 12 | 11 | 9 |
Sources: Estimates for 1979-1994 calculated by Child Trends based on analysis of the March 1980, 1990, 1994, and 1995 Current Population Surveys. Estimates for 1995-1997 provided by U.S. Bureau of the Census.
Figure ES 2.1.B Percentage of children in the United States under age 18 living in families receiving AFDC or General Assistance, and in households receiving Food Stamps: Selected years, 1979-1997
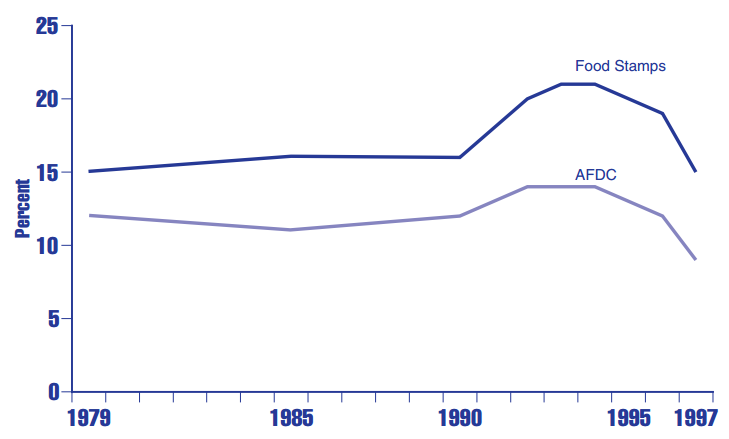
Sources: Estimates for 1979-1994 calculated by Child Trends based on analysis of the March 1980, 1990, 1994, and 1995 Current Population Surveys. Estimates for 1995-1997 provided by U.S. Bureau of the Census.
Table ES 2.1.B Percentage and number (in thousands) of children in the United States under age 18 in households receiving Food Stamps: Selected years, 1979-1997
| 1979 | 1989 | 1993 | 1994 | 1995 | 1996 | 1997 | |
|---|---|---|---|---|---|---|---|
| Number (in thousands) | 9,336 | 9,696 | 14,193 | 13,677 | 13,115 | 12,272 | 10,987 |
| Percent | 15 | 15 | 20 | 19 | 18 | 17 | 15 |
Sources: Estimates for 1979-1994 calculated by Child Trends based on analysis of the March 1980, 1990, 1994, and 1995 Current Population Surveys. Estimates for 1995-1997 provided by U.S. Bureau of the Census.
Figure ES 2.1.C Percentage of children in the United States under age 18 in households receiving AFDC and Food Stamps, by race/ethnicitya and by descent: 1992
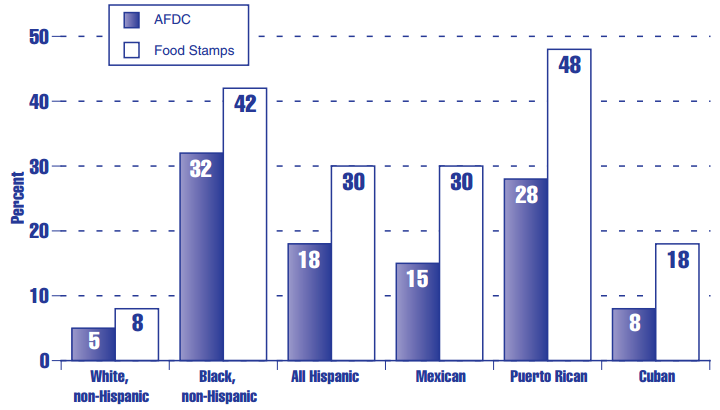
a Estimates for Hispanic children exclude those migrating to the United States after 1990.
Source: Estimates supplied by Sandra Hofferth, University of Michigan, based on data from the Panel Study of Income Dynamics.
10 Includes General Assistance.
11 Needy children include those “who have been deprived of parental support or care because their father or mother is absent from the home continuously, is incapacitated, is deceased or is unemployed.” See Overview of Entitlement Programs: 1994 Green Book. U.S. House of Representatives, Committee on Ways and Means.
12 The Panel Study of Income Dynamics excludes children who migrated to the United States after 1990. Consequently, it understates recent migrants’ share of the Hispanic population. This is likely to lead to a lower estimate of receipt of transfers for Hispanics than a more representative survey such as the Current Population Survey.
ES 2.2 Child Support Nonpayment
The issue of child support has gained in importance in recent years. As rates of divorce and nonmarital births have risen, an increasing proportion of children and their custodial parents depend on this source of income for financial support and suffer when it is not forthcoming. In addition, when noncustodial parents do not support their children financially, it is often left to the government to step in and provide support in the form of AFDC/TANF, Food Stamps, and other forms of assistance.
In many cases, and particularly where nonmarital births are concerned, families who should be receiving child support from the noncustodial parent lack a court order establishing how much is owed. In 1995, 42 percent of custodial parents lacked a court order. Among custodial parents with a court order who were owed child support, 39 percent received the full amount.13
Table ES 2.2.A shows the proportion of custodial mother families who had court orders for child support but received no support at all for selected years between 1978 and 1991. Table ES 2.2.B shows similar estimates for 1993 and 1995, though changes in child support questions render these estimates incomparable to estimates for earlier years. Rates of nonpayment decreased somewhat from 1978 to 1985, from 28 to 21 percent, then rose to about 24 percent by 1991. The estimates for 1993 and 1995, which are not comparable with earlier estimates, are 29 and 30 percent, respectively.
Differences by Marital Status. Women who were separated or never married were substantially less likely to have court orders for child support than those who were divorced or who had remarried.2 In 1995, rates of nonpayment for those who had court orders ranged from 24 percent among divorced women to 44 percent among never-married women.
Differences by Race and Hispanic Origin. In most years, eligible white custodial mother families experienced lower rates of nonpayment than either black or Hispanic families. For example, in 1995, the most recent year for which estimates are available, the percentage of eligible custodial mother families receiving no payment was 27 percent for whites, 41 percent for blacks, and 42 percent for Hispanics (see Table ES 2.2.B).
Differences by Poverty Status. Women who are poor are less likely to have received child support payments. In 1995, rates of nonpayment for eligible custodial mothers were 38 percent among poor mothers and 27 percent among nonpoor mothers (see Table ES 2.2.B).
Methods of Payment. Some custodial parents receive their child support payments directly from the noncustodial parent or that parent’s employer. Other parents use the Child Support Enforcement program, authorized under Title IV-D of the Social Security Act, to establish and enforce child support orders. Since fiscal year 1992, collections made by child support enforcement agencies have increased by nearly 80 percent, from $8 billion in fiscal year 1992 to $14.4 billion in fiscal year 1998.3 For the same period, paternity establishments increased more than 40 percent, and child support orders increased 16 percent.
Table ES 2.2.A Child support nonpayment: Percentage of eligible womena in the United States who are not receiving child support, by marital status and by race and Hispanic origin:b Selected years, 1978-1991
| 1978 | 1981 | 1983 | 1985 | 1987 | 1989 | 1991c | |
|---|---|---|---|---|---|---|---|
| Total | 28 | 23 | 24 | 21 | 24 | 25 | 24 |
| Marital status | |||||||
| Married | 32 | 25 | 28 | 24 | 27 | 28 | 24 |
| Divorced | 27 | 23 | 24 | 21 | 22 | 23 | 22 |
| Separated | 27 | 16 | 13 | 12 | 26 | 20 | 26 |
| Never-married | 19 | 27 | 24 | 20 | 17 | 27 | 26 |
| Race and Hispanic originb | |||||||
| White | 27 | 23 | 23 | 21 | 23 | 24 | 22 |
| Black | 37 | 23 | 31 | 22 | 27 | 30 | 30 |
| Hispanic | 35 | 29 | 38 | 26 | 25 | 30 | 31 |
a Eligible women are those with court orders for child support.
b Persons of Hispanic origin may be of any race. Estimates for whites and blacks include persons of Hispanic origin.
c Estimates for 1991 were produced using somewhat different assumptions than in previous years and should not be contrasted with earlier estimates.
Sources: 1978-1987 data from Child Support and Alimony, Series P-23, 112, 140, 141, 154, and 167 (Table 1 in each); and Current Population Reports, Series P-60, 173, Table C. Data for 1991 from Current Population Reports, Series P-60, 187, Table 1.
Table ES 2.2.B Child support nonpayment: Percentage of eligible womena in the United States who are not receiving child support, by marital status, race and Hispanic origin, b and poverty status: 1993 and 1995c
| 1993 | 1995 | |
|---|---|---|
| Total | 29 | 30 |
| Marital status | ||
| Married | 26 | 28 |
| Divorced | 24 | 24 |
| Separated | 34 | 31 |
| Never-married | 41 | 44 |
| Race and Hispanic originb | ||
| White | 25 | 27 |
| Black | 39 | 41 |
| Hispanic | 35 | 42 |
| Poverty status | ||
| Poor | 35 | 38 |
| Nonpoor | 26 | 27 |
a Eligible women are those with court orders for child support.
b Persons of Hispanic origin may be of any race. Estimates for whites and blacks include persons of Hispanic origin.
c Starting with the April 1994 CPS questionnaire, revisions were made to the questions surrounding child support awards and the receipt of payments.
Sources: U.S. Bureau of the Census. Current Population Reports, Series P60, 196; data for 1993 and 1995 can be found at: www.census.gov/hhes/www/childsupport/chldsu94.html (Table 4) and www.census.gov/hhes/www/childsupport/chldsu96.html (Table 4).
13 Scoon-Rogers, L. 1999. Child Support for Custodial Mothers and Fathers; 1995. Current Population Reports, P-60, no. 196, Table 7 (Detailed Tables), at http://www.census.gov/hhes/www/childsupport/cs95.html.
14 Scoon-Rogers, L. 1999. Child Support for Custodial Mothers and Fathers; 1995. Current Population Reports, P-60, no. 196, Table 9 (Detailed Tables), at http://www.census.gov/hhes/www/childsupport/cs95.html
15 U.S. Department of Health and Human Services (HHS), Administration on Children and Families. 1998. Child Support Collections Reach New Records. HHS Press Release. Washington, DC: Author.
Parental and Youth Employment
ES 3.1 Parental Labor Force Participation: Percentage of Children with Both Parents or Only Resident Parent in the Labor Force
Over the last three decades, the proportion of single-parent families has increased, as has the proportion of mothers who work regardless of marital status.15 These factors have reduced the percentage of children who have a parent at home full-time. Figure ES 3.1.A presents data on the percentage of children who have at least one parent in the labor force by family structure, while Figure ES 3.1.B shows the percentage of children with no resident parent in the labor force.
Parents in the Labor Force by Family Structure. Between 1985 and 1998, the percentage of children who have both parents or only the resident parent in the labor force increased from 59 percent to 68 percent (see Table ES 3.1.A). Between 1990 and 1996, this percentage was similar for both married-couple families and single-mother families; however, the rate for single-mother families increased sharply from 66 percent in 1996 to 74 percent in 1998, while the rate for married-couple families was nearly unchanged (64 percent in 1996 and 65 percent in 1998). The rate for children in single-father families was much higher, at 91 percent in 1998. Between 1994 and 1998, there was a large and statistically significant decline in the proportion of children living in families in which no resident parent was attached to the labor force, as shown in Table ES 3.1.B.
Parents in the Labor Force by Age of Child. Children under age 6 have been less likely than older children to have both parents or only the resident parent in the labor force (see Table ES 3.1.A). In 1998, 62 percent of children under age 6 had both parents or only the resident parent in the labor force, compared with 71 percent for older children.
Parents in the Labor Force by Race and Hispanic Origin. Between 1985 and 1990, white children, black children, and Hispanic children all became more likely to have both parents or only the resident parent in the labor force (see Table ES 3.1.A). Between 1990 and 1996, the rates stayed virtually the same for blacks and Hispanics and increased modestly for whites. However, the rate for all three groups increased between 1996 and 1998, with especially large increases for blacks and Hispanics. Between 1996 and 1998, the rate for black children of all ages increased from 64 percent to 73 percent, and the rate for black children under age 6 increased from 58 percent to 71 percent. Between 1996 and 1998, the rate for Hispanic children of all ages increased from 50 percent to 58 percent. By 1998, 68 percent of white children, 73 percent of black children, and 58 percent of Hispanic children lived in families in which all resident parents were working.
Figure ES 3.1.A Percentage of children under age 18 in the United States with both parents or only resident parent in the labor force, by family structure: Selected years, 1985-1998
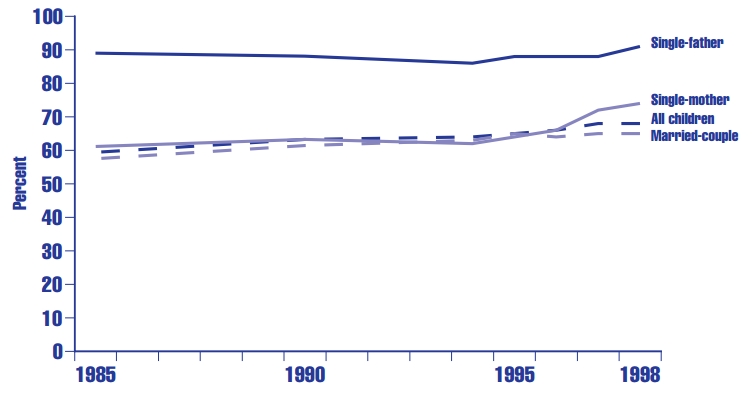
Sources: 1985, 1990, 1994, and 1995 statistics calculated by Child Trends based on the March 1985, 1990, 1994, and 1995 Current Population Surveys; 1996, 1997, and 1998 statistics calculated by the U.S. Bureau of the Census based on the 1996, 1997, and 1998 Current Population Surveys.
Figure ES 3.1.B Percentage of children under age 18 in the United States with no resident parent in the labor force, by family structure: Selected years, 1985-1998
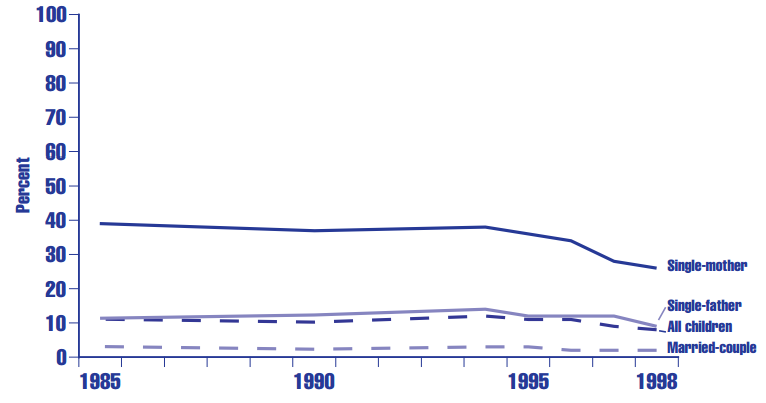
Sources: 1985, 1990, 1994, and 1995 statistics calculated by Child Trends based on analyses of the March 1985, 1990, 1994, and 1995 Current Population Surveys; 1996, 1997, and 1998 statistics calculated by U.S. Bureau of the Census based on the March 1996, 1997, and 1998 Current Population Surveys.
Table ES 3.1.A Percentage of children in the United States with both parents or only resident parent in the labor force, by age, family structure, and race and Hispanic origin:a Selected years, 1985-1998
| 1985 | 1990 | 1994 | 1995 | 1996 | 1997 | 1998 | |
|---|---|---|---|---|---|---|---|
| All children | 59 | 63 | 64 | 65 | 66 | 68 | 68 |
| Under age 6 | 51 | 55 | 56 | 59 | 58 | 61 | 62 |
| Ages 6-17 | 63 | 67 | 68 | 69 | 70 | 71 | 71 |
| Family structure | |||||||
| Married-couple | 57 | 61 | 63 | 65 | 64 | 65 | 65 |
| Under age 6 | 51 | 54 | 57 | 59 | 58 | 58 | 58 |
| Ages 6-17 | 61 | 65 | 67 | 68 | 67 | 69 | 68 |
| Single-mother | 61 | 63 | 62 | 64 | 66 | 72 | 74 |
| Under age 6 | 49 | 51 | 52 | 54 | 56 | 65 | 67 |
| Ages 6-17 | 67 | 70 | 68 | 69 | 72 | 76 | 77 |
| Single-father | 89 | 88 | 86 | 88 | 88 | 88 | 91 |
| Under age 6 | 90 | 90 | 85 | 86 | 86 | 89 | 94 |
| Ages 6-17 | 89 | 88 | 86 | 88 | 89 | 88 | 90 |
| Race and Hispanic origina | |||||||
| White | 59 | 63 | 64 | 66 | 66 | 68 | 68 |
| Under age 6 | 51 | 55 | 57 | 59 | 58 | 61 | 61 |
| Ages 6-17 | 63 | 67 | 68 | 70 | 70 | 71 | 71 |
| Black | 60 | 63 | 62 | 64 | 64 | 71 | 73 |
| Under age 6 | 54 | 55 | 56 | 57 | 58 | 68 | 71 |
| Ages 6-17 | 63 | 67 | 66 | 67 | 68 | 73 | 75 |
| Hispanic | 45 | 50 | 49 | 50 | 50 | 54 | 58 |
| Under age 6 | 40 | 44 | 41 | 44 | 43 | 49 | 52 |
| Ages 6-17 | 48 | 54 | 54 | 54 | 55 | 57 | 62 |
a Persons of Hispanic origin may be of any race. Estimates for whites and blacks include persons of Hispanic origin. Sources: 1985, 1990, 1994, and 1995 statistics calculated by Child Trends based on the March 1985, 1990, 1994, and 1995 Current Population Surveys; 1996, 1997, and 1998 statistics calculated by the U.S. Bureau of the Census based on the 1996, 1997, and 1998 Current Population Surveys.
Table ES 3.1.B Percentage of children in the United States with no resident parent in the labor force, by age, family structure, and race and Hispanic origin:a Selected years, 1985-1998
| 1985 | 1990 | 1994 | 1995 | 1996 | 1997 | 1998 | |
|---|---|---|---|---|---|---|---|
| All children | 11 | 10 | 12 | 11 | 11 | 9 | 8 |
| Under age 6 | 12 | 13 | 14 | 14 | 13 | 10 | 9 |
| Ages 6-17 | 10 | 9 | 11 | 10 | 9 | 8 | 8 |
| Family structure | |||||||
| Married-couple | 3 | 2 | 3 | 3 | 2 | 2 | 2 |
| Under age 6 | 2 | 2 | 2 | 2 | 2 | 2 | 2 |
| Ages 6-17 | 3 | 3 | 3 | 3 | 3 | 2 | 2 |
| Single-mother | 39 | 37 | 38 | 36 | 34 | 28 | 26 |
| Under age 6 | 51 | 49 | 48 | 46 | 44 | 35 | 33 |
| Ages 6-17 | 33 | 30 | 32 | 31 | 28 | 24 | 23 |
| Single-father | 11 | 12 | 14 | 12 | 12 | 12 | 9 |
| Under age 6 | 10 | 10 | 15 | 14 | 14 | 11 | 6 |
| Ages 6-17 | 11 | 12 | 14 | 12 | 11 | 12 | 10 |
| Race and Hispanic origina | |||||||
| White | 8 | 7 | 9 | 8 | 7 | 7 | 7 |
| Under age 6 | 8 | 9 | 11 | 10 | 9 | 7 | 7 |
| Ages 6-17 | 7 | 6 | 8 | 7 | 7 | 6 | 6 |
| Black | 27 | 26 | 27 | 27 | 25 | 20 | 17 |
| Under age 6 | 33 | 34 | 33 | 33 | 32 | 23 | 20 |
| Ages 6-17 | 24 | 21 | 24 | 23 | 21 | 18 | 15 |
| Hispanic | 19 | 17 | 19 | 19 | 17 | 14 | 13 |
| Under age 6 | 20 | 19 | 22 | 21 | 20 | 15 | 14 |
| Ages 6-17 | 19 | 16 | 18 | 17 | 15 | 12 | 13 |
a Persons of Hispanic origin may be of any race. Estimates for whites and blacks include persons of Hispanic origin. Sources: 1985, 1990, 1994, and 1995 statistics calculated by Child Trends based on analyses of the March 1985, 1990, 1994, and 1995 Current Population Surveys; 1996, 1997, and 1998 statistics calculated by U.S. Bureau of the Census based on the March 1996, 1997, and 1998 Current Population Surveys.
ES 3.2 Maternal Employment: Percentage of Mothers with Children Under Age 18 Who Are Employed, Full-Time and Part-Time
Over the last several decades, the increasing proportion of mothers moving into employment has had substantial consequences for the everyday lives of families with children. Maternal employment adds to the financial resources available to families and is often the only source of income for families headed by single mothers—although if child-care services are purchased and unsubsidized, they may offset a substantial percentage of lowwage mothers’ earnings.
Maternal employment rates for all mothers with children under age 18 increased steadily from 53 percent to 63 percent between 1980 and 1990 (see Figure ES 3.2). From 1990 to 1997, rates increased at a slower pace from 63 percent to 68 percent. This pattern of increasing maternal employment was evident for all mothers, regardless of the age of their children.
Differences by Age of Child. The percentage of mothers who are employed increases with the age of the youngest child for all time periods presented in Table ES 3.2. In 1997, 57 percent of mothers with children under age 3 were employed, compared with 64 percent and 74 percent for mothers with youngest children ages 3-5 and 6-17, respectively.
Differences by Marital Status. Throughout the period between 1980 and 1997, divorced mothers had higher rates of employment than never-married or currently married mothers (see Table ES 3.2). However, the gap narrowed over the period as employment increased from 62 percent to 69 percent for married mothers and from 40 percent to 57 percent for never-married mothers. In contrast, there was only a slight increase from 75 percent to 77 percent for divorced mothers.
Differences by Race and Hispanic Origin. In 1997, 69 percent of white mothers, 65 percent of black mothers, and 53 percent of Hispanic mothers were employed (see Table ES 3.2). Black mothers were the most likely to be employed full-time (55 percent). All three groups substantially increased their rates of employment between 1980 and 1990 and have continued to increase their rates of employment during the 1990s.
Full-Time Versus Part-Time Employment. Among all employed mothers, 50 percent were working full-time in 1997 (see Table ES 3.2). Employed mothers with older children were more likely to work full-time than those with young children, with rates ranging from 57 percent for mothers with children under age 3, to 74 percent for mothers with a youngest child between the ages of 6 and 17. Divorced mothers were more likely to work full-time (77 percent) than never-married mothers (57 percent) and married mothers (69 percent). Black mothers who were employed were more likely to work full-time (55 percent) than white mothers (48 percent) or Hispanic mothers (41 percent).
Figure ES 3.2 Percentage of mothers in the United States with children under age 18 who were employed, by age of youngest child: Selected years, 1980-1997
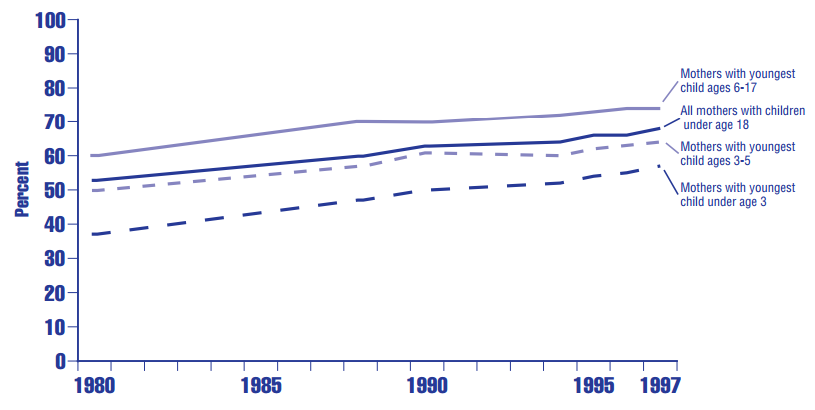
Source: Unpublished tables, Bureau of Labor Statistics, based on analyses of March Current Population Surveys for 1980, 1988, 1990, and 1994-1996.
Table ES 3.2 Percentage of mothers in the United States with children under age 18 who were employed, full-time and part-time,a by age of youngest child, marital status, and race and Hispanic origin:b Selected years, 1980-1997
| 1980 | 1988 | 1990 | 1994 | 1995 | 1996 | 1997 | |
|---|---|---|---|---|---|---|---|
| Total employed | 53 | 60 | 63 | 64 | 66 | 66 | 68 |
| Working full-time | — | 44 | 46 | 45 | 46 | 47 | 50 |
| Working part-time | — | 16 | 17 | 19 | 19 | 19 | 18 |
| Age of youngest child | |||||||
| Under age 3 | 37 | 47 | 50 | 52 | 54 | 55 | 57 |
| Working full-time | — | 32 | 34 | 34 | 35 | 36 | 38 |
| Working part-time | — | 15 | 16 | 18 | 19 | 19 | 19 |
| Ages 3-5 | 50 | 57 | 61 | 60 | 62 | 63 | 64 |
| Working full-time | — | 40 | 43 | 41 | 42 | 43 | 47 |
| Working part-time | — | 17 | 18 | 19 | 20 | 20 | 17 |
| Ages 6-17 | 60 | 70 | 70 | 72 | 73 | 74 | 74 |
| Working full-time | — | 53 | 53 | 53 | 53 | 55 | 56 |
| Working part-time | — | 17 | 17 | 19 | 19 | 19 | 18 |
| Marital status | |||||||
| Married, spouse present | 62 | 63 | 66 | 67 | 67 | 68 | 69 |
| Working full-time | — | 43 | 44 | 45 | 45 | 46 | 48 |
| Working part-time | — | 19 | 19 | 21 | 22 | 21 | 20 |
| Never married | 40 | 45 | 46 | 48 | 48 | 49 | 57 |
| Working full-time | — | 32 | 36 | 34 | 35 | 35 | 42 |
| Working part-time | — | 8 | 9 | 12 | 13 | 14 | 14 |
| Divorced | 75 | 75 | 74 | 77 | 77 | 79 | 77 |
| Working full-time | — | 66 | 66 | 63 | 64 | 66 | 65 |
| Working part-time | — | 9 | 9 | 11 | 13 | 13 | 12 |
| Race and Hispanic origin | |||||||
| White | 52 | 62 | 63 | 65 | 67 | 67 | 69 |
| Working full-time | — | 44 | 44 | 45 | 46 | 47 | 48 |
| Working part-time | — | 18 | 19 | 20 | 21 | 21 | 20 |
| Black | 54 | 56 | 61 | 58 | 62 | 63 | 65 |
| Working full-time | — | 48 | 53 | 47 | 50 | 52 | 55 |
| Working part-time | — | 8 | 8 | 11 | 11 | 10 | 10 |
| Hispanic | 42 | 49 | 50 | 48 | 49 | 49 | 53 |
| Working full-time | — | 38 | 39 | 36 | 37 | 37 | 41 |
| Working part-time | — | 11 | 11 | 12 | 12 | 12 | 12 |
a Percentages for 1980 are not presented separately by marital status and full-time versus part-time due to incompatibilities with definitions used in later years. Sums may not add to totals due to rounding.
b Persons of Hispanic origin may be of any race. Estimates for whites and blacks include persons of Hispanic origin.
Source: Unpublished tables, Bureau of Labor Statistics, based on analyses of March Current Population Surveys for 1980, 1988, 1990, and 1994-1997.
ES 3.3 Child Care
The child care needs of American families have been increasing over the past several decades as mothers have moved into the labor force in ever greater numbers. Child care that is reliable and of high quality is especially important for infants and preschoolers because they are dependent on caregivers for their basic needs and safety.
Child-Care Centers and Preschools. Working mothers with preschool children have increasingly chosen care provided in day care centers and preschools. In 1965, only 8 percent of mothers working full-time chose day care centers and preschools for child care (see Table ES 3.3.A). By 1994, 34 percent did so. Similarly, for children whose mothers worked part-time, use of child care centers and preschools increased from 3 percent in 1965 to 22 percent in 1994.
Child Care in a Nonrelative’s Home. For children of full-time working mothers, care in a nonrelative’s home ranged from 25 to 27 percent between 1977 and 1988, then declined to 18 percent by 1994. Similarly, for children whose mothers worked part-time, care in a nonrelative’s home peaked at 21 percent in 1986 and has since declined to 10 percent.
Child Care at Home. The fraction of children of full-time working mothers cared for at their home by either relatives or nonrelatives was 26 percent in 1994, compared with 21 percent in 1988 and 47 percent in 1965. The fraction of children of part-time working mothers cared for at home was 45 percent in 1994, compared with 42 percent in 1984-1985 and 47 percent in 1965 (see Table ES 3.3.A).
Child Care Arrangements by Various Child and Family Characteristics. Table ES 3.3.B presents 1994 estimates of the distribution of child-care types used by all working mothers (regardless of hours worked) by child’s race and Hispanic origin and age, mother’s marital status and educational attainment, poverty status, monthly income, and AFDC program participation status. The information in this table indicates the following:
- Relatives usually care for employed mothers’ children before their first birthday. In 1994, 56 percent of infants were cared for by relatives either inside or outside the child’s home (see Figure ES 3.3). Among toddlers (ages 1-2), about half (51 percent) were cared for by relatives, while the other half were split about evenly between day care centers and preschools (26 percent) and nonrelatives (22 percent). Among children of preschool age (ages 3-4), 44 percent were cared for by relatives, another 37 percent in day care centers and preschools, and 16 percent by nonrelatives.
- Hispanic families were less likely than white and black non-Hispanics to use day care centers and preschools. In 1994, 19 percent of Hispanic children of working mothers were cared for in day care centers and preschools, compared with 31 percent of non-Hispanic white children and 34 percent of non-Hispanic black children.
- Children of employed mothers with higher socioeconomic status were the most likely to be receiving care from a day care center or preschool. For example, 22 percent of poor children under age 5 received care from such sources, compared with 30 percent of nonpoor children.
Table ES 3.3.A Percentage distribution of child care arrangements of children under age 5 in the United States with employed mothers, by mother’s employment status: Selected years, 1965-1994
| 1965a,b | 1977b | 1982b | 1984-85 | 1986 | 1987 | 1988 | 1991 | 1993 | 1994 | |
|---|---|---|---|---|---|---|---|---|---|---|
| Mother employed full-time | ||||||||||
| Day care center or preschool | 8 | 15 | 20 | 30 | 26 | 28 | 31 | 28 | 34 | 34 |
| Nonrelative care in provider's home | 20 | 27 | 25 | 27 | 26 | 25 | 27 | 21 | 18 | 18 |
| Grandparent/other relative in relative's home | 18 | 21 | 21 | 16 | 18 | 14 | 14 | 14 | 17 | 17 |
| Father in child's home | 10 | 11 | 11 | 10 | 11 | 10 | 8 | 15 | 11 | 13 |
| Other care in child's homec | 37 | 18 | 16 | 13 | 15 | 15 | 13 | 15 | 15 | 13 |
| Other care outside child's homed | 7 | 8 | 7 | 4 | 5 | 8 | 7 | 7 | 5 | 5 |
| Mother employed part-time | ||||||||||
| Day care center or preschool | 3 | 9 | 8 | 17 | 16 | 18 | 17 | 15 | 23 | 22 |
| Nonrelative care in provider's home | 8 | 16 | 19 | 14 | 21 | 18 | 17 | 13 | 14 | 10 |
| Grandparent/other relative in relative's home | 9 | 13 | 16 | 16 | 14 | 13 | 11 | 11 | 13 | 13 |
| Father in child's home | 23 | 23 | 21 | 22 | 21 | 25 | 27 | 29 | 25 | 28 |
| Other care in child's homec | 24 | 20 | 20 | 18 | 14 | 15 | 14 | 17 | 15 | 17 |
| Other care outside child's homed | 33 | 19 | 26 | 13 | 13 | 13 | 14 | 15 | 10 | 10 |
a Data for 1965 are for children under 6 years old.
b Data for 1982 and earlier are based on survey questions that asked about care arrangements for the youngest child in the family. Percentages for 1982 and earlier have been recalculated after removal of cases in “don’t know” category.
c Includes care by relatives and nonrelatives.
d Includes children who are cared for by their mother at work or in kindergarten or school-based activities.
Sources: U.S. Bureau of the Census, Current Population Reports, Series P-23, 117, Table A; U.S. Bureau of the Census, Current Population Reports, Series P-70, 9, 20, 30, 36, and 53 (Table 1 in each); Casper, 1997; Current Population Reports, PPL 81 (Tables B and 2).
Table ES 3.3.B Percentage distribution of child care arrangements of children under age 5 in the United States with employed mothers, by selected characteristics: 1994
| Day Care Center/ Preschoola | Father in Child's Home | Other Relative in Child's Home | Nonrelative in Child's Home | Relative in Another Home | Nonrelative in Another Home | Mother Cares for Childb | Other Care Arrange- mentsc | |
|---|---|---|---|---|---|---|---|---|
| All preschoolers | 29 | 18 | 9 | 5 | 16 | 15 | 5 | 1 |
| Race and Hispanic origin | ||||||||
| White, non-Hispanic | 31 | 20 | 7 | 6 | 14 | 16 | 7 | 1 |
| Black, non-Hispanic | 34 | 11 | 13 | 2 | 23 | 13 | 3 | 2 |
| Hispanicd | 19 | 17 | 15 | 6 | 24 | 15 | 2 | 2 |
| Other | 21 | 22 | 19 | 6 | 12 | 15 | 3 | 2 |
| Age of child | ||||||||
| Under 1 year | 18 | 21 | 11 | 7 | 17 | 19 | 7 | 0 |
| Ages 1-2 | 26 | 19 | 10 | 5 | 18 | 17 | 4 | 0 |
| Ages 3-4 | 37 | 17 | 8 | 4 | 13 | 12 | 6 | 2 |
| Marital status | ||||||||
| Married, husband present | 29 | 22 | 6 | 6 | 14 | 16 | 6 | 1 |
| All other marital statusese | 31 | 5 | 21 | 3 | 22 | 15 | 3 | 1 |
| Educational attainment | ||||||||
| Less than high school | 20 | 24 | 15 | 4 | 20 | 12 | 5 | 1 |
| High school, 4 years | 26 | 17 | 11 | 3 | 19 | 16 | 5 | 1 |
| College, 1-3 years | 32 | 21 | 7 | 4 | 14 | 14 | 6 | 1 |
| College, 4+ years | 35 | 15 | 6 | 9 | 11 | 17 | 5 | 1 |
| Poverty statusf | ||||||||
| Below poverty | 22 | 18 | 15 | 4 | 20 | 11 | 10 | 1 |
| Above poverty | 30 | 19 | 9 | 5 | 15 | 16 | 5 | 1 |
| Monthly family incomef | ||||||||
| Less than $1,200 | 24 | 17 | 11 | 4 | 22 | 15 | 6 | 1 |
| $1,200 to $2,999 | 26 | 22 | 10 | 3 | 19 | 13 | 6 | 1 |
| $3,000 to $4,499 | 27 | 19 | 10 | 4 | 15 | 18 | 6 | 2 |
| $4,500 and over | 36 | 15 | 7 | 9 | 12 | 16 | 5 | 1 |
| Program participation | ||||||||
| AFDC recipient | 27 | 15 | 17 | 3 | 18 | 11 | 6 | 2 |
| AFDC nonrecipient | 29 | 19 | 9 | 5 | 16 | 16 | 5 | 1 |
a Includes day care centers, nursery schools, and preschools.
b Includes mothers working at home or away from home.
c Includes preschoolers in kindergarten and school-based activities.
d Persons of Hispanic origin may be of any race
e Includes married, spouse absent, widowed, separated, divorced, and never married.
f Omits preschoolers whose families did not report income.
Source: Casper, 1997, Tables B, 1, and 2.
Figure ES 3.3 Percentage distribution of child care arrangements of children under age 5 in the United States with employed mothers, by age of child: 1994
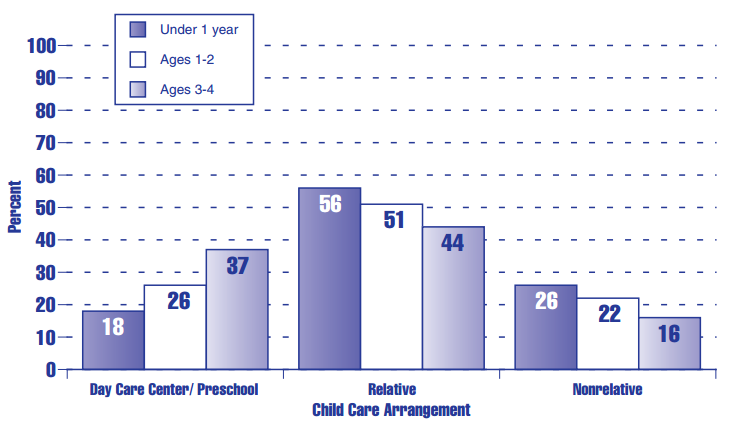 Source: Casper, 1997, Tables B and 2.
Consumption
ES 4.1 Housing Problems
Housing is a major expense for most families; however, spending more than 30 percent of income on housing may compromise the budget for other essential goods and services. A home’s physical condition, its safety, the level of crowding in a household, and the quality of the surrounding neighborhood can all affect children’s well-being.16 This section presents recent trends in both the cost burden and the physical quality of housing for all households with children under age 18 and for renter households with children and very low income.
Cost Burden. The share of all households (containing children) spending more than 30 percent of their incomes on housing increased from 15 percent in 1978 to 28 percent in 1997, while the share spending more than half their income on housing doubled from 6 percent in 1978 to 12 percent in 1997 (see Table ES 4.1). For renter households with children and very low income17 the trend was similar, but housing expenses were a much higher share of income. Between 1978 and 1997, the percentage of renter households (with children and very low income) paying more than 30 percent of their income on housing rose from 59 percent to 74 percent, while the percentage spending more than 50 percent rose from 31 percent to 41 percent.
Physical Problems. During this same period, the percentage of households (containing children) living in housing with moderate to severe physical problems18 declined from 9 percent in 1978 to 7 percent in 1997. For renter households (with children and very low income), the percentage living in housing with moderate to severe physical problems declined from 18 percent in 1978 to 13 percent in 1995, before increasing to 15 percent in 1997.
Differences by Type of Family. Married-couple families with children are the least likely to experience housing with physical problems, followed by households with one or no adult and households with two or more adults who are not married. In 1997, for example, 6 percent of married-couple households with children, 11 percent of households with one or no adult, and 12 percent of households with two or more unmarried adults lived in housing with moderate to severe physical problems (see Figure ES 4.1.A). Similarly, among all households with children, married couples are the least likely to be paying over 30 percent of their income on housing. For example, in 1997, 20 percent of married-couple households paid over 30 percent, compared with 54 percent of households with one or no adult and 34 percent of households with two or more unmarried adults (see Figure ES 4.1.B).
Table ES 4.1 Percentage of households with children under age 18 in the United States having selected housing problems,a all households and very low incomeb renter households: Selected years, 1978-1997
| 1978 | 1983 | 1989 | 1993 | 1995 | 1997 | |
|---|---|---|---|---|---|---|
| All households with children | ||||||
| Number of households(in millions) | 32.3 | 33.6 | 35.7 | 35.5 | 37.3 | 37.0 |
| Percentage with | ||||||
| Any problems | 30 | 33 | 33 | 34 | 36 | 36 |
| Moderate or severe physical problems | 9 | 8 | 9 | 7 | 7 | 7 |
| Crowded housing | 9 | 8 | 7 | 6 | 7 | 7 |
| Cost burden greater than 30 percent | 15 | 21 | 24 | 27 | 28 | 28 |
| Cost burden greater than 50 percent | 6 | 11 | 9 | 11 | 12 | 12 |
| Severe problems | 8 | 12 | 10 | 11 | 12 | 11 |
| Renter households with children and very low income | ||||||
| Number of households (in millions) | 4.2 | 5.1 | 5.9 | 6.7 | 6.5 | 6.2 |
| Percentage with | ||||||
| Any problems | 79 | 83 | 76 | 75 | 77 | 82 |
| Moderate or severe physical problems | 18 | 18 | 18 | 14 | 13 | 15 |
| Crowded housing | 22 | 18 | 17 | 14 | 17 | 17 |
| Cost burden greater than 30 percent | 59 | 68 | 67 | 67 | 68 | 74 |
| Cost burden greater than 50 percent | 31 | 38 | 36 | 38 | 38 | 41 |
| Severe problems | 33 | 42 | 33 | 34 | 32 | 28 |
| Rental assistance | 23 | 23 | 29 | 28 | 29 | 30 |
a Housing problems include physical problems, excessive cost burden, and overcrowding . “Crowded” is defined as having more than one person per room. Physical problems include plumbing, heating, electricity, upkeep, and/or condition of apartment hallways. For detailed definitions of “moderate” and “severe” physical problems, see U.S. Bureau of the Census and U.S. Department of Housing and Urban Development (1997), Current Housing Reports H150/95RV, American Housing Survey for the United States in 1995, Washington, D.C., pp. A-13 and A-14. Cost burden is the ratio of housing costs to reported household income.
b Very low income households are those with incomes at or below one-half the median income in a geographic area.
Source: U.S. Department of Housing and Urban Development, tabulations of data from the American Housing Survey for the United States as published in America's Children: Key National Indicators of Well-Being, 1998. Federal Interagency Forum on Child and Family Statistics, Washington, D.C.: U.S. Government Printing Office, Table ECON3.
Figure ES 4.1.A Percentage of households with children under age 18 in the United States living in housing with moderate to severe physical problems:a 1997
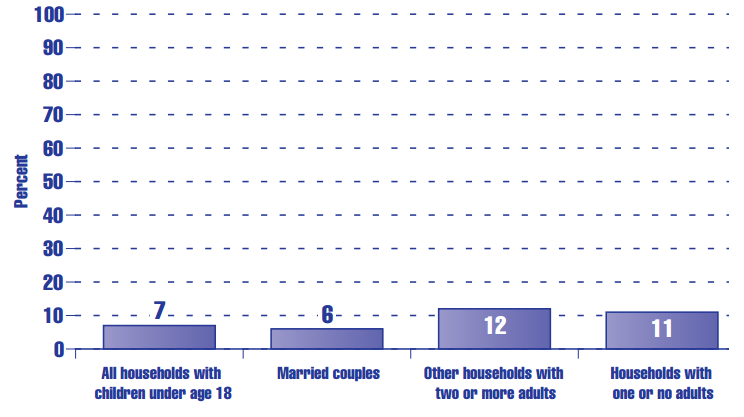
a Physical problems include plumbing, heating, electricity, upkeep, and/or condition of apartment hallways. For detailed definitions of “moderate” and “severe” physical problems, see U.S. Bureau of the Census and U.S. Department of Housing and Urban Development (1999), Current Housing Reports H150/95RV, American Housing Survey for the United States in 1997, Washington, D.C., p. A-18.
Source: U.S. Department of Housing and Urban Development, unpublished tabulations of data from the American Housing Survey for the United States, 1995.
Figure ES 4.1.B Percentage of households containing children under age 18 and paying over 30 percent of their income on housing: 1997
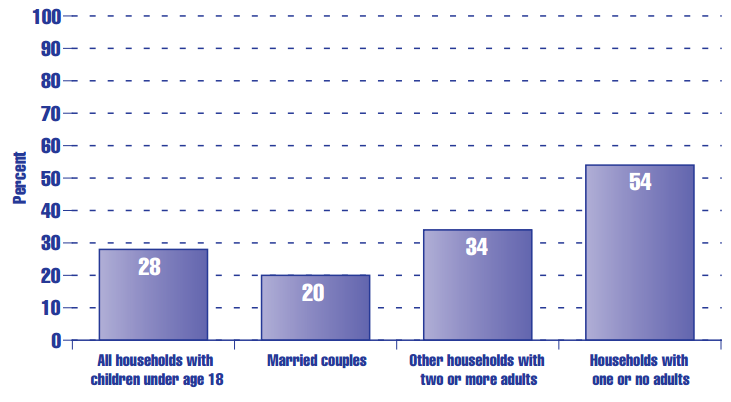
Source: U.S. Department of Housing and Urban Development, unpublished tabulations of data from the American Housing Survey for the United States, 1995.
16 Moore, K., Zaslow, M.J., Coiro, M., Miller, S.M., & Magenheim, E. 1996. The Jobs Evaluation: How Are They Faring? AFDC Families with Preschool-Aged Children in Atlanta at the Outset of the JOBS Evaluation. Washington, D.C.: U.S. Department of Health and Human Services, Office of the Assistant Secretary for Planning and Evaluation; Blackman, T., Evason, E., Melaugh, M., & Woods, R. 1989. Housing and Health: A Case Study of Two Areas in West Belfast. Journal of Social Policy, 18, (1): 1-26.
17 Very low income households are those with incomes at or below one-half the median income in a geographic area.
18 Physical problems include plumbing, heating, electricity, upkeep, and/or condition of apartment hallways. For detailed definitions of “moderate” and “severe” physical problems, see U.S. Bureau of the Census and U.S. Department of Housing and Urban Development, 1997, Current Housing Reports H150/95RV, American Housing Survey for the United States in 1995, Washington, D.C., pp. A-13 and A-14.
ES 4.2 Food Security
Children’s good health and development depend on a diet sufficient in nutrients and calories. Food security has been defined as access at all times to enough nourishment for an active, healthy life. At a minimum, food security includes the ready availability of sufficient, nutritionally adequate and safe food, and the assurance that families can obtain adequate food without relying on emergency feeding programs or resorting to scavenging, stealing, or other desperate efforts to secure food.19 A family’s ability to provide for children’s nutritional needs is linked to income or other resources and secure access to adequate, nutritious food.
Members of food-insecure households are at risk of hunger, that is, the uneasy or painful sensation caused by a lack of food. The following indicator measures food insecurity on a scale that indicates increasing levels of severity of food insecurity and accompanying hunger. Food-insecure households without hunger report having difficulty obtaining enough food, reduced quality of diets, anxiety about their food supply, and increased resort to emergency food sources and other coping behaviors, but do not report hunger to a significant degree. However, food-insecure households with moderate and severe hunger report increasing difficulty obtaining food and decreased food intakes.20
- In 1995, 12.8 percent of children lived in households experiencing food insecurity. This rose slightly to 15.0 percent in 1998 and then decreased to 13.1 percent in 1999. This trend is also evident for children in homes with incomes below the federal poverty level and for children in homes with incomes at or above the poverty level (see Table ES 4.2).
- In 1999, 3.8 percent of children lived in households experiencing food insecurity with moderate or severe hunger; 3.3 percent experienced food insecurity with moderate hunger and 0.5 percent experienced severe hunger (see Figure ES 4.2 and Table ES 4.2).
- Poor children are much more likely than others to live in households experiencing food insecurity with moderate to severe hunger. In 1999, 11.8 percent of children in homes with incomes below the federal poverty level lived in households experiencing food insecurity with moderate to severe hunger, compared to 1.9 percent of children in nonpoor households.
- Most food-insecure households do not report actual hunger for household members. In 1999, 13.1 percent of all children and 32.2 percent of poor children lived in households experiencing food insecurity without hunger evident.
- The number of children who actually experience hunger themselves, even though they may live in a food-insecure household where one or more family members experience hunger, is believed to be significantly smaller than the total number of children living in such households. This is because in most such households the adults go without food, if necessary, so that the children will have food.
Table ES 4.2 Percentage of children under age 18 in the United States living in households experiencing food insecurity,a by severity and poverty status: 1995-1999
| 1995 | 1996 | 1997 | 1998 | 1999 | |
|---|---|---|---|---|---|
| All children | |||||
| Food insecure without hunger | 12.8 | 13.0 | 11.3 | 15.0 | 13.1 |
| Food insecure with moderate or severe hunger | 6.2 | 6.2 | 4.2 | 4.7 | 3.8 |
| Food insecure with moderate hunger | 5.2 | 5.2 | 3.5 | 4.0 | 3.3 |
| Food insecure with severe hunger | 1.0 | 1.0 | 0.7 | 0.7 | 0.5 |
| Children below poverty line | |||||
| Food insecure without hunger | 26.6 | 28.7 | 26.8 | 34.5 | 32.2 |
| Food insecure with moderate or severe hunger | 15.7 | 17.4 | 11.1 | 14.2 | 11.8 |
| Food insecure with moderate hunger | 12.8 | 13.9 | 9.2 | 11.8 | 10.2 |
| Food insecure with severe hunger | 2.9 | 3.5 | 1.9 | 2.4 | 1.6 |
| Children at or above poverty line | |||||
| Food insecure without hunger | 7.9 | 8.5 | 6.7 | 10.3 | 8.7 |
| Food insecure with moderate or severe hunger | 3.0 | 3.1 | 2.1 | 2.3 | 1.9 |
| Food insecure with moderate hunger | 2.6 | 2.8 | 1.8 | 1.9 | 1.6 |
| Food insecure with severe hunger | 0.4 | 0.3 | 0.3 | 0.4 | 0.3 |
a The food security scale provides a near-continuous measure of the level of food insecurity and hunger experienced within each household. A categorical measure based on the scale classifies households according to four designated levels of household food security: food-secure, food-insecure without hunger, food-insecure with moderate hunger, and food- insecure with severe hunger. Food-secure households are households that do not report a significant number of instances of difficulty obtaining enough quality food. Food-insecure households without hunger report having difficulty obtaining enough food, reduced quality of diets, anxiety about their food supply, and increasing resort to emergency food sources and other coping behaviors, but do not report hunger to a significant degree. Food-insecure households with moderate hunger report food insecurity and significant instances of hunger for one or more adults and, in some cases, for children. Food-insecure households with severe hunger report food insecurity and significant instances of hunger for adults and children. For a detailed explanation of the new USDA/DHHS Food Security Measurement scale, see Household Food Security in the United States in 1995 (USDA, Food and Nutrition Service, 1997).
Source: Food Security Supplement to the April 1995, September 1996, and April 1997 Current Population Survey, Table ECON4.A.
Figure ES 4.2 Percentage of children under age 18 in the United States living in households experiencing food insecurity, by severity and poverty status: 1999
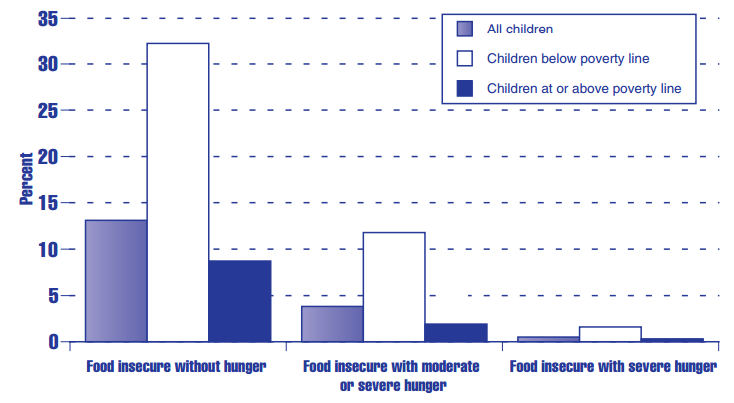
Source: Food Security Supplement to the April 1997, Current Population Survey.
19 Life Sciences Research Office and American Institute of Nutrition. 1990. Core Indicators of Nutritional State for Difficult to Sample Populations. Bethesda, MD: Author.
20 See the note to Table ES 4.2 for a description of the Food Security Supplement to the Current Population Survey and for details on the food security scale.
Section 3: Health Conditions and Health Care (HC)
Mortality
HC 1.1 Infant Mortality
Infancy is defined as the first year of life and is commonly divided into two periods. The first is the neonatal period which is the first 27 days of life. The second is the postnatal period which is 28 days to 1 year. About two-thirds of infant deaths occur during the neonatal period (although advances in neonatology in recent decades have greatly improved the chances that infants will survive this period).
The three leading causes of death to infants, overall, are congenital anomalies, disorders relating to a short gestation period and low birthweight, and sudden infant death syndrome (SIDS).1 In 1994, SIDS dropped from the second to the third leading cause of infant mortality. The SIDS decline accounted for nearly one-third of the total drop in infant mortality in 1995 and 1996.2 Infant deaths due to SIDS have been declining since 1989,3 including nearly a 12 percent drop between 1996 and 1997.4
The U.S. infant mortality rate has decreased rapidly over the past three decades, largely due to medical developments over this time. Between 1960 and 1998, the rate fell from 26.0 to 7.2 infant deaths per 1,000 live births (see Figure HC 1.1.A). There was a steep decline in the rate of neonatal deaths (from 18.7 to 4.8 infant deaths per 1,000 live births) and a smaller, more gradual decline in the rate of postneonatal deaths (from 7.3 to 2.4 infant deaths per 1,000 live births).
International Comparisons. Despite declines in recent decades, the U.S. infant mortality rate ranks among the highest of industrialized nations. For example, in 1995, the rate of infant deaths per 1,000 live births was 3.9 in Finland, 4.3 in Japan, 5.3 in Germany, and 6.1 in England and Wales, compared with 7.6 deaths per 1,000 live births in the United States. The Russian Federation, in contrast, had an infant mortality rate of 18.2 deaths per 1,000 live births in 1995.5
Differences by Race and Hispanic Origin. While infant mortality rates have declined for all races and ethnic groups in the United States, there is, nevertheless, considerable variation by race and Hispanic origin (see Figure HC 1.1.B). Specifically:7
- For white infants, the infant mortality rate declined by 74 percent between 1960 and 1998—from 22.9 to 6.0 deaths per 1,000 live births (see Table HC 1.1.A).
- For black infants, the infant mortality rate declined by 69 percent between 1960 and 1998—from 44.3 to 13.8 deaths per 1,000 live births (see Table HC 1.1.A).
- For Hispanic infants, the infant mortality rate declined by 33 percent between 1985 and 1998—from 8.6 to 5.8 deaths per 1,000 live births (see Table HC 1.1.A).
- For Asian/Pacific Islander infants, the infant mortality rate declined by 34 percent from an average of 8.3 deaths per 1,000 live births during the period 1983-1985 to 5.5 deaths per 1,000 live births in 1998 (see Table HC 1.1.B).6
- For American Indian/Alaska Native infants, the infant mortality rate declined by 33 percent from an average of 13.9 deaths per 1,000 live births during the period 1983-1985 to 9.3 deaths per 1,000 live births in 1998 (see Table HC 1.1.B).
Figure HC 1.1.A Infant, neonatal, and postneonatal mortality rates (deaths per 1,000 live births) in the United States: Selected years, 1960a-1998
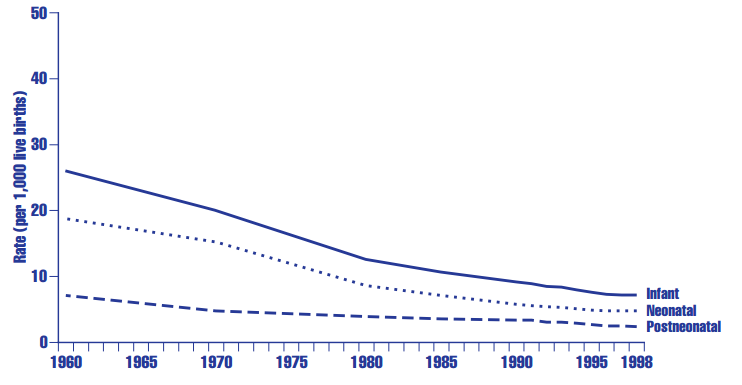
a Includes births and deaths of persons who were not residents of the 50 states and the District of Columbia.
Sources: Anderson, Kochanek, & Murphy, 1997, Tables 25 and 26. Also previous issues of this annual report [Table 26 in 41 (7, Supp.), Table 25 in 42 (2, Supp.), Table 28 in 43 (6, Supp.), Table 32 in 44 (7, Supp.), and Table 25 in 45 (3, Supp.)]; 1970, data from the Center for Disease Control, National Center for Health Statistics, 1996, (Table 2-2); Center for Disease Control, National Center for Health Statistics, 1988, (Table 2-19); Ventura, et al., 1998, Births and Deaths, Table 14.
Figure HC 1.1.B Infant mortality rates (deaths per 1,000 live births) in the United States, by race and Hispanic origin:a Selected years, 1960b,c-1998
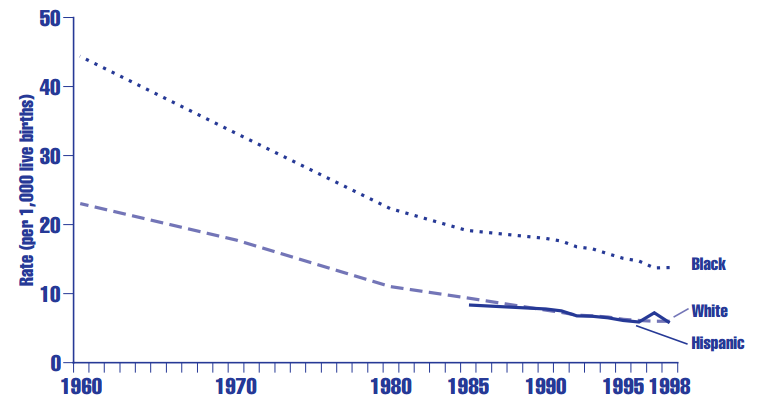
a Estimates for whites and blacks include Hispanics of those races. Persons of Hispanic origin may be of any race. Hispanic rates not available prior to 1985. Infant mortality by Hispanic origin was reported by 17 states and the District of Columbia in 1985; 45 states, New York State (excluding New York City), and the District of Columbia in 1990; 47 states, New York State (excluding New York City), and the District of Columbia in 1991; 48 states and the District of Columbia in 1992; 49 states and the District of Columbia from 1993 to 1996; and all 50 states and the District of Columbia in 1997.
b Includes births and deaths of persons who were not residents of the 50 states and the District of Columbia.
c Data for 1960 are by race of child; all other years are by race of mother.
Sources: Anderson, Kochanek, & Murphy, 1997; Also previous issues of this annual report [Table 26 in 41 (7, Supp.), Table 25 in 42 (2, Supp.), Table 28 in 43 (6, Supp.), Table 32 in 44 (7, Supp.), and Table 25 in 45 (3, Supp.)]; 1970 data from the Center for Disease Control, National Center for Health Statistics, 1996; Peters, Kochanek, & Murphy, 1998; 1996 United States Deaths, Table 26.
Table HC 1.1.A Infant, neonatal, and postneonatal mortality rates (deaths per 1,000 live births) in the United States, by race and Hispanic origin:a Selected years, 1960-1998
| 1960b,c | 1970 | 1980 | 1985 | 1990 | 1991 | 1992 | 1993 | 1994 | 1995 | 1996 | 1997 | 1998 | |
|---|---|---|---|---|---|---|---|---|---|---|---|---|---|
| Infantd total | 26.0 | 20.0 | 12.6 | 10.6 | 9.2 | 8.9 | 8.5 | 8.4 | 8.0 | 7.6 | 7.3 | 7.2 | 7.2 |
| White | 22.9 | 17.6 | 10.9 | 9.2 | 7.6 | 7.3 | 6.9 | 6.8 | 6.6 | 6.3 | 6.1 | 6.0 | 6.0 |
| Black | 44.3 | 33.3 | 22.2 | 19.0 | 18.0 | 17.6 | 16.8 | 16.5 | 15.8 | 15.1 | 14.7 | 14.2 | 13.8 |
| Hispanic | — | — | — | 8.6 | 7.8 | 7.5 | 6.8 | 6.7 | 6.5 | 6.1 | 5.9 | 6.0 | 5.8 |
| Neonatale total | 18.7 | 15.1 | 8.5 | 7.0 | 5.8 | 5.6 | 5.4 | 5.3 | 5.1 | 4.9 | 4.8 | 4.8 | 4.8 |
| White | 17.2 | 13.7 | 7.4 | 6.0 | 4.8 | 4.5 | 4.3 | 4.3 | 4.2 | 4.1 | 4.0 | 4.0 | 4.0 |
| Black | 27.8 | 23.2 | 14.6 | 12.6 | 11.6 | 11.2 | 10.8 | 10.7 | 10.2 | 9.8 | 9.6 | 9.4 | 9.4 |
| Hispanic | — | — | — | 5.4 | 5.0 | 4.6 | 4.3 | 4.1 | 4.1 | 4.0 | 3.8 | 3.9 | 3.9 |
| Postneonatalf total | 7.3 | 4.9 | 4.1 | 3.7 | 3.4 | 3.4 | 3.1 | 3.1 | 2.9 | 2.7 | 2.5 | 2.5 | 2.4 |
| White | 5.7 | 4.0 | 3.5 | 3.2 | 2.8 | 2.8 | 2.6 | 2.5 | 2.4 | 2.2 | 2.1 | 2.0 | 2.0 |
| Black | 16.5 | 10.1 | 7.6 | 6.4 | 6.4 | 6.3 | 6.0 | 5.8 | 5.6 | 5.3 | 5.1 | 4.8 | 4.4 |
| Hispanic | — | — | — | 3.2 | 2.8 | 2.8 | 2.5 | 2.6 | 2.5 | 2.1 | 2.1 | 2.0 | 1.9 |
a Estimates for whites and blacks include Hispanics of those races. Persons of Hispanic origin may be of any race. Hispanic rates not available prior to 1985. Infant mortality by Hispanic origin was reported by 17 states and the District of Columbia in 1985; 45 states, New York State (excluding New York City), and the District of Columbia in 1990; 47 states, New York State (excluding New York City), and the District of Columbia in 1991; 48 states and the District of Columbia in 1992; 49 states and the District of Columbia from 1993 to 1996; and all 50 states and the District of Columbia in 1997.
b Includes births and deaths of persons who were not residents of the 50 states and the District of Columbia.
c Data for 1960 are by race of child; all other years are by race of mother.
d Under one year old.
e Under 28 days old.
f Twenty-eight days to one year old.
Sources: Anderson, Kochanek, & Murphy, 1997; Also previous issues of this annual report [Table 26 in 41 (7, Supp.), Table 25 in 42 (2, Supp.), Table 28 in 43 (6, Supp.), Table 32 in 44 (7, Supp.), and Table 25 in 45 (3, Supp.)]; 1970 data from the Center for Disease Control, National Center for Health Statistics, 1996; Peters, Kochanek, & Murphy, 1998; 1996 United States Deaths, Table 26; Kramorow, et al., 1999, Health.
Table HC 1.1.B Infant mortality rates (deaths per 1,000 live births) in the United States, by detailed racea and Hispanic origin:b Selected years, 1983-1998
| 1983-1985 | 1986-1988 | 1989-1991 | 1995 | 1996 | 1997 | 1998 | |
|---|---|---|---|---|---|---|---|
| Infant (all races) | 10.6 | 9.8 | 9.0 | 7.6 | 7.3 | 7.2 | 7.2 |
| White | 9.0 | 8.2 | 7.4 | 6.3 | 6.1 | 6.0 | 6.0 |
| Black | 18.7 | 17.9 | 17.1 | 14.6 | 14.1 | 13.7 | 13.8 |
| American Indian/Alaska Native | 13.9 | 13.2 | 12.6 | 9.0 | 10.0 | 8.7 | 9.3 |
| Asian/Pacific Islander | 8.3 | 7.3 | 6.6 | 5.3 | 5.2 | 5.0 | 5.5 |
| Chinese | 7.4 | 5.8 | 5.1 | 3.8 | 3.2 | — | 4.0 |
| Japanese | 6.0 | 6.9 | 5.3 | 5.3 | 4.2 | — | 3.5 |
| Filipino | 8.2 | 6.9 | 6.4 | 5.6 | 5.8 | — | 6.2 |
| Hawaiian and part Hawaiian | 11.3 | 11.1 | 9.0 | 6.6 | 5.6 | — | 10.0 |
| Other Asian or Pacific Islander | 8.6 | 7.6 | 7.0 | 5.5 | 5.7 | — | 5.7 |
| Hispanic | 9.2 | 8.3 | 7.6 | 6.3 | 6.1 | 6.0 | 5.8 |
| Mexican American | 8.8 | 7.9 | 7.2 | 6.0 | 5.8 | 5.8 | 5.6 |
| Puerto Rican | 12.3 | 11.1 | 10.4 | 8.9 | 8.6 | 7.9 | 7.8 |
| Cuban | 8.0 | 7.3 | 6.2 | 5.3 | 5.1 | 5.5 | 3.6 |
| Central and South American | 8.2 | 7.6 | 6.6 | 5.5 | 5.0 | 5.5 | 5.3 |
| Other and unknown | |||||||
| Hispanic | 9.9 | 9.0 | 8.2 | 7.4 | 7.7 | 6.2 | 6.5 |
a Estimates are based on specified race or national origin of mother.
b Estimates for separate race groups include Hispanics of those races. Persons of Hispanic origin may be of any race.
Sources: Data from the National Linked Files of Live Births and Infant Deaths. Health, United States, 1996-97, Table 20; MacDorman, & Atkinson, 1998, Tables A and C; MacDorman, & Atkinson, 1997, Tables A and C; MacDorman & Atkinson, 1999.
1 Ventura, S.J., Anderson, R.N., Martin, J.A., & Smith, B.L. 1998. Births and Deaths: Preliminary Data for 1997. National Vital Statistics Report 47 (4). Hyattsville, MD: National Center for Health Statistics.
2 Singh, G.K., Kochanek, K.D., & MacDorman, M.F. 1994. Advance Report of Final Mortality Statistics, 1994. Monthly Vital Statistics Report 45 (3 Supp.). Hyattsville, MD: National Center for Health Statistics.
3 Ibid.
4 As reported in Ventura, S.J., Anderson, R.N., Martin, J.A., & Smith, B.L. 1998. Births and Deaths: Preliminary Data for 1997.
5 World Health Organization: World Health Statistics Annuals Vols. 1990-1996. Geneva; United Nations: Demographic Yearbook 1996. New York; Centers for Disease Control & Prevention, NCHS. Vital Statistics of the United States, 1995. Washington: Public Health Service.
6 Infant mortality data for Asians/Pacific Islanders and American Indians/Alaska Natives are presented from the National Linked Files of Live Births and Infant Deaths in Table HC 1.1.B. Rather than relying solely on death certificate data, which may underestimate mortality for infants of Hispanic origin or of races other than white and black, data from the National Linked Files of Live Births and Infant Deaths use race from birth certificates and, therefore, provide more accurate data for these populations. The National Linked Files of Live Births and Infant Deaths data are available for 1983- 1991, 1995-1996, and 1998.
HC 1.2 Child and Youth Deaths
Injuries are a common cause of death for children of all ages.7 Among children ages 1 to 4, unintentional injuries were the leading cause of death, followed by congenital anomalies, malignant neoplasms, homicide and legal intervention, and diseases of the heart.8 In 1996, all injuries, including homicides and suicides, accounted for 52 percent of deaths to children ages 5 through 14 and for 80 percent of deaths to youth ages 15 through 19.9,10
Overall, child death rates have decreased substantially over the past several decades (see Figure HC 1.2.A). In 1998, death rates per 100,000 were 35.6 for 1- through 4-year-olds, 18.5 for 5- through 9-year-olds, 23.1 for 10- through 14-year-olds, and 73.3 for 15- through 19-year-olds.
Differences by Age. The most dramatic declines in death rates occurred among children under age 15, with decreases of 67 percent among children ages 1 to 4, 62 percent among children ages 5 to 9, and 48 percent among children ages 10 through 14 since 1960 (see Figure HC 1.2.A). Most of the decline in the death rate for these groups occurred between 1960 and 1990. In contrast, death rates for youth ages 15 through 19 have decreased by only 21 percent since 1960. Moreover, unlike the fairly steady declines among the younger age groups, the death rate for this age group has had a variable pattern over the last 30 years (see Figure HC 1.2.A).
Differences by Race and Hispanic Origin. Multi-year data from the National Center for Health Statistics are used to examine the differences in the death rate of children and youth for several racial and ethnic groups across three time periods spanning 1989 through 1998 (see Table HC 1.2). For children ages 1 to 14 and youth ages 15 to 24, black children and youth have the highest death rate, followed by American Indian/Alaska Native, Hispanic, and white children and youth. Asian children and youth consistently have the lowest death rates.
The death rate for children ages 1 to 14 decreased modestly for all racial and ethnic groups except American Indian/Alaska Native children. The death rate for American Indian/ Alaska Native children dropped sharply from its high of 40 in 1994-1996 to 33 in 1998. Trends in the death rate for youth ages 15 to 24 were similar with all racial groups. Overall, black and American Indian/Alaska Native youth experienced the largest decreases for the 15- to 24-year-old age group.
Differences by Race for Adolescents. The black-white disparity among adolescents ages 15 through 19 was substantial in 1970 but had declined by 1980 to the point where black youth registered lower death rates than white youth (see Figure HC 1.2.B). This reversal was short-lived, however. Black death rates surged from 85.2 per 100,000 in 1985 to 145.0 per 100,000 by 1994, while white death rates remained fairly stable. Much of this increase in black teen deaths reflected a substantial increase in black teen male homicide rates, which are reviewed in Section HC 1.4 of this report. Recently, the difference between the white and black adolescent death rates has narrowed, as the rate for blacks declined 27 percent between 1994 and 1997.
Differences by Gender. Male child death rates are higher than female rates for all age and racial/ethnic groups, but the differences are far more pronounced for the older age groups, for whom injury-related deaths disproportionately affect males (see Table HC 1.2).11
Figure HC 1.2.A Child and youth death rates (per 100,000 population in each age group) in the United States, by age group: Selected years, 1960-1998
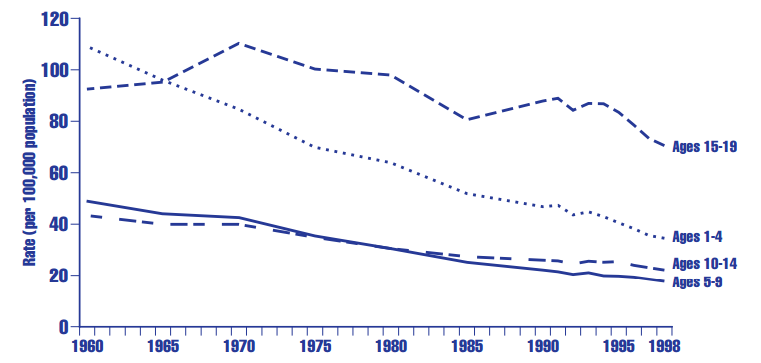
Source: Murphy, 1999.
Table HC 1.2 Child and youth death rates (per 100,000 population in each age group) in the United States, by age group, gender, and race and Hispanic origin: 1989-1998
| Combined Years 1989-1991 | Combined Years 1992-1993 | Combined Years 1994-1996 | 1998 | |||||||||
|---|---|---|---|---|---|---|---|---|---|---|---|---|
| Total | Male | Female | Total | Male | Female | Total | Male | Female | Total | Male | Female | |
| Ages 1-14 | ||||||||||||
| All races | 31.4 | 36.2 | 26.3 | 29.3 | 33.7 | 24.6 | 27.6 | 31.7 | 23.3 | 24.0 | 27.3 | 20.5 |
| Whitea | 28.4 | 32.8 | 23.8 | 26.1 | 30.3 | 21.7 | 24.5 | 28.3 | 20.6 | 21.5 | 24.4 | 18.5 |
| Blacka | 48.3 | 56.1 | 40.3 | 47.1 | 53.4 | 40.7 | 44.7 | 51.2 | 38.0 | 38.1 | 44.6 | 31.4 |
| Asian/Pacific Islandera | 22.7 | 25.3 | 20.0 | 20.3 | 23.1 | 17.4 | 18.7 | 21.3 | 16.0 | 16.2 | 17.6 | 14.7 |
| American Indian/Alaska Nativea | 37.3 | 45.1 | 29.2 | 38.9 | 47.0 | 30.6 | 40.0 | 45.1 | 34.8 | 33.4 | 38.4 | 28.2 |
| Hispanicb | 30.2 | 34.7 | 25.5 | 28.4 | 32.4 | 24.2 | 25.6 | 29.6 | 21.4 | 21.5 | 24.4 | 18.4 |
| Ages 15 to 24 | ||||||||||||
| All races | 99.1 | 146.1 | 50.0 | 97.0 | 144.0 | 47.9 | 94.3 | 139.0 | 47.5 | 82.3 | 119.3 | 43.5 |
| Whitea | 89.3 | 129.5 | 47.0 | 84.2 | 122.3 | 44.1 | 83.0 | 120.2 | 43.8 | 75.4 | 107.6 | 41.2 |
| Blacka | 161.9 | 254.9 | 69.8 | 174.8 | 279.5 | 70.6 | 161.5 | 253.3 | 69.7 | 126.5 | 194.6 | 58.0 |
| Asian/Pacific Islandera | 50.1 | 70.8 | 28.1 | 56.1 | 80.1 | 31.1 | 55.6 | 79.0 | 31.9 | 44.4 | 59.9 | 28.8 |
| American Indian/Alaska Nativea | 142.0 | 208.3 | 71.1 | 129.4 | 184.2 | 71.4 | 127.2 | 188.5 | 63.6 | 115.6 | 166.4 | 64.1 |
| Hispanicb | 103.3 | 156.5 | 40.9 | 107.5 | 167.3 | 40.2 | 102.1 | 158.1 | 39.9 | 83.3 | 128.8 | 34.0 |
a Includes persons of Hispanic origin
b Persons of Hispanic origin may be of any race. Death figures for Hispanic persons are based on data from 44 states and the District of Columbia that reported Hispanic origin on the death certificate in 1989, 47 states and the District of Columbia in 1990, 48 states and the District of Columbia in 1991 and 1992, and 49 states and the District of Columbia in 1993-1996.
Note: Death rates reported for white and black persons are based on highly consistent information. However, persons identified as American Indian, Asian, or Hispanic origin in the data from the Census Bureau (denominator of death rates) are sometimes misreported as white or non-Hispanic on the death certificate (numerator), resulting in underestimates of about 22 percent to 30 percent for death rates of American Indians, about 12 percent for death rates of Asians, and about 7 percent for persons of Hispanic origin. (National Center for Health Statistics, Health, United States, 1993, Table 33; Sorlie, P.D., Rogot E., and Johnson, N.J. 1992. "Validity of Demographic Characteristics on the Death Certificate." Epidemiology 3 (2): 181-184.)
Sources: Murphy, 1999, Centers for Disease Control and Prevention, National Center for Health Statistics. Data Computed by the Division of Analysis from data compiled by the Division of Vital Statistics and from national population estimates for race groups. Also, data computed by Infant and Child Health Studies Branch, National Center for Health Statistics, from mortality data compiled by Division of Vital Statistics, Centers for Disease Control, National Center for Health Statistics, 1994, Health,Table 32.
Figure HC 1.2.B Youth death rates (per 100,000 population in age group) in the United States for ages 15 through 19, by race: Selected years, 1970-1998
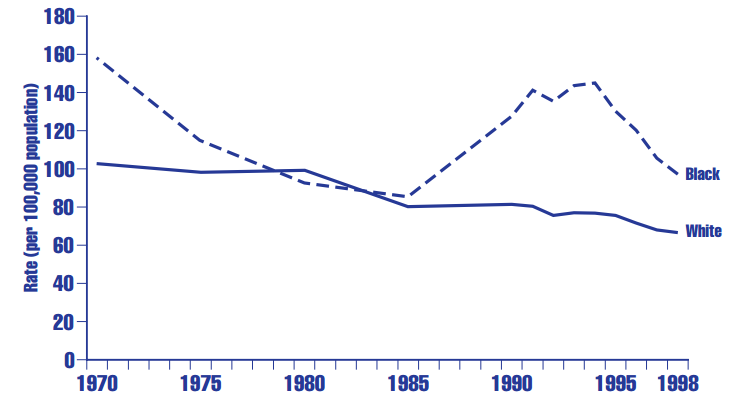 Sources: Peters, Kochanek, & Murphy, 1998, 1996 United States Deaths; Anderson, Kochanek, & Murphy, 1997; Murphy, 1999, Table 2.
7 Injury-related deaths include deaths from motor vehicle crashes, fires and burns, drowning, suffocation, and accidents caused by firearms and other explosive materials, as well as homicides, suicides, and other external causes of death. See Fingerhut, L.A., Annest J.L., Baker, S.P., Kochanek, K.D., & McLoughlin, E. 1996. Injury Mortality among Children and Teenagers in the United States, 1993. Injury Prevention, 2: 93-94.
8 Murphy, S.L. 1999. Deaths: Final Data for 1998. National Vital Statistics Report, 48, (11). Hyattsville, MD: National Center for Health Statistics.
9 Percentages calculated by Child Trends based on data on the number of deaths from all causes and from injuries. Peters, Kochanek, & Murphy, 1998, Table 2; National Center for Injury Control and Prevention, Centers for Disease Control. 1996 United States Deaths and Rates per 100,000: All Injury, available online at http://www.cdc.gov/ncipc/osp/states/0001.htm, 10/15/98.
10 Discussion and data regarding motor vehicle crashes, the largest category of accident-related death for 15- to 19-yearolds, follows in the next section (HC 1.3).
HC 1.3 Youth Motor Vehicle Crash Deaths
Youth ages 15 to 24 had the highest fatality and injury rates of any age group in 1998 due to motor vehicle crashes.12 Such crashes are among the major causes of injury-related deaths13 for 15- to 19-year-olds, accounting for 36 percent of injury deaths in 1996;14 however, as a fraction of all violent deaths to teens, motor vehicle crashes have declined. Data for 1998 show that motor vehicle crashes claimed 26.4 lives per 100,000 youth ages 15 through 19, compared with 43.6 per 100,000 youth in 1970 (see Figure HC 1.3). The rate of motor vehicle crash deaths among youth has been relatively constant since 1992.
Differences by Gender and Race. For persons under age 20, the decrease in the rate of youth motor vehicle deaths between 1970 and 1998 has been greatest among white males ages 15 through 19, falling from 67.1 to 36.2 deaths per 100,000 and among black males who declined from 43.4 to 26.0 deaths per 100,000 (see Table HC 1.3). Similar decreases in the rates of motor vehicle crash deaths have not been seen among females ages 15 through 19. Among white females, ages 15 through 19, the rate of deaths due to motor vehicle crashes has fluctuated between 20 and 26 per 100,000; by 1998 it was 20.9 deaths per 100,000, compared with 24.4 deaths per 100,000 in 1970. Black females have had lower motor vehicle crash death rates than whites. After a drop from 11.1 deaths per 100,000 in 1970 to 6.7 deaths per 100,000 in 1980, rates have generally increased for this group, to 8.5 deaths per 100,000 in 1998.
Differences by Age. Among youth ages 10 through 14, motor vehicle death rates are quite low in comparison to older youth and dropped from 9.6 to 5.4 per 100,000 between 1970 and 1998. This decline was evident for both white and black males and females, with most of the decline occurring before 1990.
Figure HC 1.3 Youth motor vehicle crash deaths (rate per 100,000) in the United States, by age: Selected years, 1970-1998
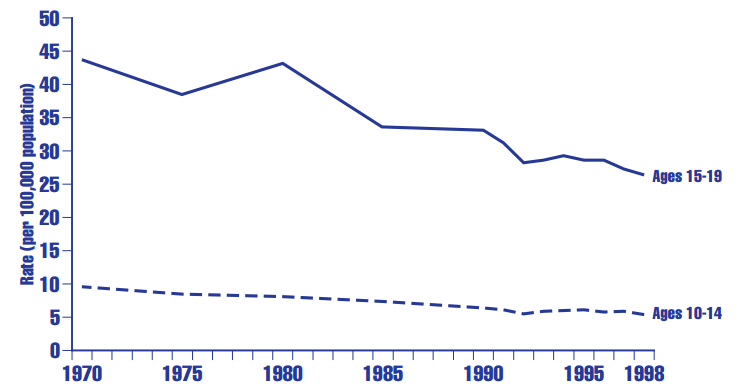
Source: National Center for Health Statistics, Table 291, p473-478, Mortality Statistics Branch, Division of Vital Statistics.
Table HC 1.3 Youth motor vehicle crash deaths (rate per 100,000) in the United States, by age, gender, and race: Selected years, 1970- 1998
| 1970 | 1975 | 1980 | 1985 | 1990 | 1991 | 1992 | 1993 | 1994 | 1995 | 1996 | 1997 | 1998 | |
|---|---|---|---|---|---|---|---|---|---|---|---|---|---|
| All youth | |||||||||||||
| Ages 10-14 | 9.6 | 8.4 | 8.1 | 7.4 | 6.4 | 6.1 | 5.5 | 5.9 | 6.0 | 6.1 | 5.8 | 5.9 | 5.4 |
| Ages 15-19 | 43.6 | 38.4 | 43.0 | 33.5 | 33.1 | 31.2 | 28.2 | 28.6 | 29.3 | 28.6 | 28.6 | 27.3 | 26.4 |
| White males | |||||||||||||
| Ages 10-14 | 12.6 | 10.9 | 10.9 | 9.8 | 7.7 | 7.8 | 7.0 | 7.1 | 7.5 | 7.2 | 7.2 | 6.8 | 6.4 |
| Ages 15-19 | 67.1 | 61.7 | 69.1 | 51.3 | 49.3 | 44.5 | 39.6 | 41.6 | 41.7 | 38.9 | 39.5 | 36.6 | 36.2 |
| White females | |||||||||||||
| Ages 10-14 | 6.6 | 5.8 | 5.7 | 5.6 | 5.3 | 4.4 | 4.1 | 4.4 | 4.8 | 5.0 | 4.8 | 4.9 | 4.3 |
| Ages 15-19 | 24.4 | 20.6 | 25.6 | 22.6 | 22.2 | 23.0 | 21.0 | 20.2 | 21.3 | 22.1 | 21.2 | 21.4 | 20.9 |
| Black males | |||||||||||||
| Ages 10-14 | 11.9 | 9.6 | 7.9 | 8.9 | 7.9 | 8.8 | 7.8 | 8.3 | 7.6 | 7.7 | 6.8 | 7.4 | 7.8 |
| Ages 15-19 | 43.4 | 24.6 | 24.4 | 22.1 | 28.7 | 29.5 | 26.2 | 26.7 | 29.0 | 29.0 | 28.2 | 28.7 | 26.0 |
| Black females | |||||||||||||
| Ages 10-14 | 6.4 | 4.2 | 4.0 | 3.0 | 3.8 | 3.3 | 3.6 | 4.8 | 4.8 | 4.2 | 3.0 | 4.8 | 3.1 |
| Ages 15-19 | 11.1 | 7.1 | 6.7 | 7.5 | 9.7 | 9.0 | 9.1 | 8.2 | 10.4 | 10.7 | 12.4 | 10.4 | 8.5 |
Source: National Center for Health Statistics, Table 291, p473-478, Mortality Statistics Branch, Division of Vital Statistics.
12 Murphy, S.L. 2000. National Vital Statistics Reports, 48, (11).
13 Injury-related deaths include deaths from motor vehicle crashes, fires and burns, drowning, suffocation, and unintentional injuries caused by firearms and other explosive materials, as well as homicides, suicides, and other external causes of death.
14 Percentages calculated by Child Trends based on data on the number of deaths from all causes and from injuries. Peters, K.D., Kochanek, K.D., & Murphy, S.L. 1998. National Vital Statistics Report, 47, (9), Table 2. National Center for Injury Control and Prevention, Centers for Disease Control. 1996 United States Deaths and Rates per 100,000: All Injury. Available online at http://www.cdc.gov/ncipc/osp/states/0001.htm, 10/15/98.
HC 1.4 Youth Homicides
After more than a decade of sharp increases, the youth homicide rate decreased between 1993 and 1997. The rate of death from homicide for youth ages 15 through 19 more than doubled between 1970 and 1993, increasing from 8.1 to 20.7 per 100,000 (see Table HC 1.4.A). Virtually all of this increase occurred after 1985. Since 1993, rates have decreased steadily to 11.8 deaths per 100,000 in 1999.
Male Youth Homicide Rates by Race. The trend in the death rate due to homicide for black males largely dominates the rate of youth homicides for ages 15 through 19. Since 1990, the rate of death due to homicide for black males ages 15 through 19 has been about eight to nine times higher than the rate for their white peers. The rate for this age group of black males actually declined nearly 30 percent from 1970 to 1985, but it increased dramatically from 46.7 per 100,000 in 1985 to 140.7 per 100,000 in 1993. Since 1993, this rate has decreased by over 50 percent, falling to 71 deaths per 100,000 by 1998 (see Table HC 1.4.A).
While the homicide rate for white males of the same age group (15 through 19) is substantially less than that of black males, similar fluctuations in this rate can be seen over time, with the largest increases occurring between 1985 and the early 1990s and decreases in recent years. Overall, this rate has almost doubled, going from 5.2 deaths per 100,000 in 1970 to 10.2 deaths per 100,000 in 1998.
Female Youth Homicide Rates by Race. Homicide rates for females ages 15 through 19 are considerably lower than among similarly aged males within the same race groups (rates for black females have actually been higher than rates for white males). For example, the rate for black females was 10.6 per 100,000 in 1997, 87 percent lower than the rate for black males. The gender disparity in homicide rates is also large for whites, although it is not as great as that between black males and females. In 1998, the homicide rate for white females ages 15 through 19 was 2.4 deaths per 100,000, just over a quarter of that for white males. As is the case for males, the youth homicide rate for black females is higher than the rate for white females—nearly four times higher in 1998 (see Table HC 1.4.A).
Homicide Rates for Younger Youth. The homicide rate for youth ages 10 through 14 was 1.5 per 100,000 in 1998—substantially lower than the rate for older youth (see Figure HC 1.4.B). The disparity between males and females is not as pronounced in this age group as the difference for older youth ages 15 through 19. However, the homicide rates for both white and black males ages 10 through 14 have been approximately twice those of females in recent years.
Homicides Involving Firearms. Firearms have been involved in the majority of youth homicides since 1980 (see Figure HC 1.4.C). Deaths to youth ages 15 through 19 involving firearms accounted for 66 percent of the total deaths due to homicide in 1980 (7.0 firearm deaths per 100,000 out of a total of 10.6 deaths per 100,000 due to homicide). The percentage of firearm-related homicides increased to 85 percent by 1997 for this same age group.
Homicides due to firearms are more likely among black youth than among white youth and most particularly among black males ages 15 through 19 (see Table HC 1.4.B). In 1997, 91 percent of homicides among older male black youth (ages 15 through 19) involved a firearm, compared with 84 percent among older white male youth. The rate of death due to firearms among black males ages 15 through 19 has decreased since 1993, serving as one explanation for the decline in the overall homicide rate among this group. Homicides among female youth involve a firearm less often, although firearms are still the means of the majority of female homicides.
Table HC 1.4.A Youth homicidesa (rate per 100,000) in the United States, by age, gender, and race: Selected years, 1970-1998
| 1970 | 1975 | 1980 | 1985 | 1990 | 1991 | 1992 | 1993 | 1994 | 1995 | 1996 | 1997 | 1998 | |
|---|---|---|---|---|---|---|---|---|---|---|---|---|---|
| All youth | |||||||||||||
| Ages 10-14 | 1.2 | 1.2 | 1.4 | 1.5 | 2.1 | 2.2 | 2.4 | 2.5 | 2.2 | 2.1 | 1.8 | 1.5 | 1.5 |
| Ages 15-19 | 8.1 | 9.6 | 10.6 | 8.6 | 17.0 | 19.6 | 19.3 | 20.7 | 20.3 | 18.2 | 15.7 | 13.7 | 11.8 |
| White males | |||||||||||||
| Ages 10-14 | 0.6 | 1.0 | 1.1 | 1.4 | 1.7 | 1.8 | 2.0 | 1.9 | 1.8 | 2.0 | 1.5 | 1.4 | 1.3 |
| Ages 15-19 | 5.2 | 8.1 | 10.9 | 7.2 | 12.5 | 14.4 | 15.2 | 15.2 | 15.4 | 14.7 | 12.2 | 11.1 | 10.2 |
| White females | |||||||||||||
| Ages 10-14 | 0.6 | 0.8 | 1.1 | 0.9 | 0.9 | 0.9 | 1.0 | 1.2 | 0.9 | 1.0 | 0.9 | 0.6 | 1.0 |
| Ages 15-19 | 2.1 | 3.2 | 3.9 | 2.7 | 3.6 | 3.6 | 3.6 | 3.6 | 3.4 | 3.9 | 2.9 | 2.9 | 2.4 |
| Black males | |||||||||||||
| Ages 10-14 | 6.8 | 4.1 | 3.9 | 4.2 | 8.1 | 9.1 | 9.6 | 10.5 | 9.1 | 8.2 | 6.0 | 5.6 | 4.4 |
| Ages 15-19 | 65.2 | 51.4 | 48.8 | 46.7 | 115.7 | 134.6 | 128.5 | 140.7 | 135.8 | 110.5 | 100.9 | 85.3 | 71.0 |
| Black females | |||||||||||||
| Ages 10-14 | 2.3 | 2.3 | 2.4 | 1.7 | 4.8 | 3.8 | 5.1 | 5.2 | 4.6 | 3.0 | 3.1 | 2.3 | 2.6 |
| Ages 15-19 | 10.6 | 15.3 | 11.0 | 10.4 | 15.6 | 15.6 | 14.2 | 18.4 | 15.1 | 16.4 | 12.9 | 10.6 | 9.8 |
a Homicide includes death by legal intervention.
Source: National Center for Health Statistics, Table 291, p491-496, Mortality Statistics Branch, Division of Vital Statistics.
Figure HC 1.4.A Youth homicidesa for males ages 15 through 19 (rate per 100,000) in the United States, by race: Selected years, 1970-1998
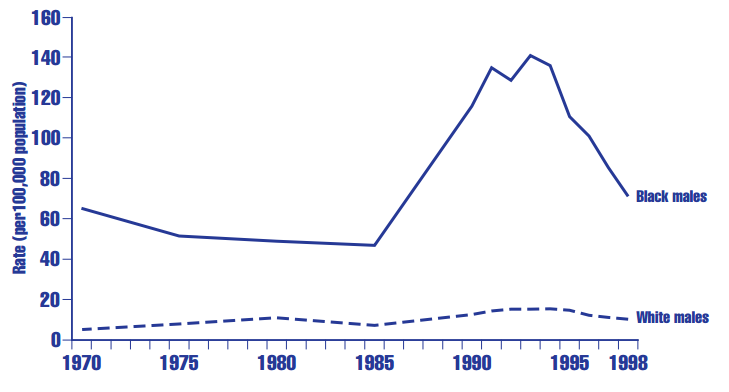
a Homicide includes death by legal intervention.
Source: National Center for Health Statistics, Table 291, p473-478, Mortality Statistics Branch, Division of Vital Statistics.
Figure HC 1.4.B Youth homicidesa (rate per 100,000) in the United States, by age: Selected years, 1970-1998
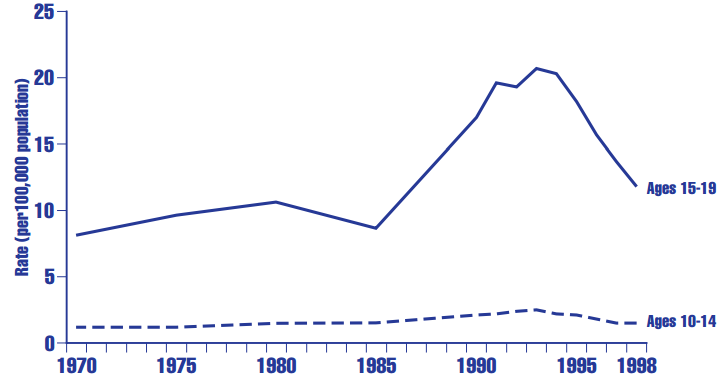
a Homicide includes death by legal intervention.
Source: National Center for Health Statistics, Table 291, p473-478, Mortality Statistics Branch, Division of Vital Statistics.
Table HC 1.4.B Youth homicides due to firearmsa (rate per 100,000) in the United States, by age, gender, and race: Selected years, 1980-1998
| 1980 | 1985 | 1990 | 1991 | 1992 | 1993 | 1994 | 1995 | 1996 | 1997 | 1998 | |
|---|---|---|---|---|---|---|---|---|---|---|---|
| All youth | |||||||||||
| Ages 10-14 | 0.8 | 0.8 | 1.5 | 1.6 | 1.9 | 1.9 | 1.7 | 1.6 | 1.3 | 1.0 | 1.0 |
| Ages 15-19 | 7.0 | 5.7 | 13.8 | 16.4 | 16.7 | 17.8 | 17.7 | 15.4 | 13.2 | 10.9 | 9.7 |
| White males | |||||||||||
| Ages 10-14 | 0.7 | 0.9 | 1.3 | 1.4 | 1.6 | 1.5 | 1.5 | 1.6 | 1.2 | 1.1 | 1.0 |
| Ages 15-19 | 7.2 | 4.9 | 9.4 | 11.7 | 12.9 | 12.6 | 12.9 | 12.3 | 10.0 | 8.3 | 8.0 |
| White females | |||||||||||
| Ages 10-14 | 0.5 | 0.4 | 0.4 | 0.5 | 0.6 | 0.6 | 0.5 | 0.5 | 0.5 | 0.3 | 0.5 |
| Ages 15-19 | 1.7 | 1.2 | 2.0 | 2.1 | 2.3 | 2.2 | 2.4 | 2.2 | 1.7 | 1.5 | 1.3 |
| Black males | |||||||||||
| Ages 10-14 | 3.2 | 3.0 | 6.9 | 8.2 | 8.4 | 9.8 | 7.7 | 7.4 | 5.2 | 4.1 | 3.1 |
| Ages 15-19 | 38.4 | 36.6 | 104.4 | 122.6 | 118.8 | 130.1 | 126.6 | 101.7 | 91.7 | 75.2 | 64.5 |
| Black females | |||||||||||
| Ages 10-14 | 1.0 | 0.6 | 3.2 | 2.7 | 3.4 | 3.3 | 3.3 | 2.0 | 1.8 | 1.5 | 1.6 |
| Ages 15-19 | 6.2 | 5.0 | 10.4 | 11.2 | 10.5 | 14.3 | 11.1 | 12.3 | 9.9 | 7.2 | 6.7 |
a Includes assault by handguns and all other and unspecified firearms.
Sources: National Center for Health Statistics, Table 291, p491-496, Mortality Statistics Branch, Division of Vital Statistics. Murphy, 1999.
Figure HC 1.4.C Percentage of youth homicidesa due to firearmsb in the United States, for youth ages 15 through 19: Selected years, 1980-1998
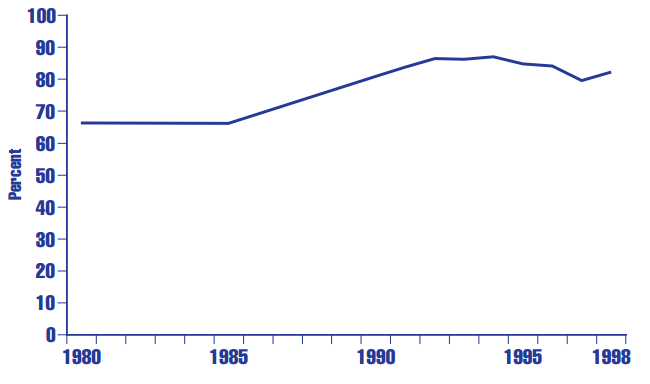
a Homicide includes death by legal intervention
b Includes assault by handguns and all other and unspecified firearms.
Sources: National Center for Health Statistics, Table 291, p491-496, Mortality Statistics Branch, Division of Vital Statistics; Murphy, 1999.
HC 1.5 Youth Suicides
Suicide, like homicide, has come to play a proportionately larger role in teen deaths over the past several decades. Between 1970 and 1990, the suicide rate for youth ages 15 through 19 nearly doubled, from 5.9 to 11.1 per 100,000 (see Figure HC 1.5). After remaining stable from 1990 to 1994 at approximately 11 deaths per 100,000 youth ages 15 through 19, the rate decreased slightly to 8.9 per 100,000 in 1998.
Differences by Gender. Male teens are more likely than females to commit suicide (see Table HC 1.5). The suicide rate for white males ages 15 through 19 was 15.3 per 100,000 in 1998, more than five times the rate of 3.0 per 100,000 for white females. Among blacks, males had a rate almost six times that of females for youth ages 15 through 19 in 1998 (10.7 and 1.8 per 100,000, respectively).
Differences by Race. White males ages 15 through 19 have long had a higher suicide rate than their black male peers (see Table HC 1.5). In 1970, white males ages 15 through 19 were twice as likely as black males to commit suicide (9.4 versus 4.7 per 100,000). However, the gap between white and black male suicide rates has narrowed in recent years, with suicide rates of 15.3 and 10.7 per 100,000, respectively, according to 1998 white and black males.15 Among females ages 15 through 19, whites and blacks were equally likely to commit suicide in 1970, with rates of 2.9 per 100,000. By 1975, white female suicide rates were more than twice that of their black peers ages 15 through 19. White female suicide rates have remained higher than black female rates since1975.
Suicide Rates for Younger Youth. While considerably lower, suicide rates for youth ages 10 through 14 have followed trends similar to those among older youth, with males having higher rates of suicide than females and whites having higher suicide rates than blacks (see Table HC 1.5). In this age group, suicide is infrequent for both sexes and races, making gender or racial differences small as well.
Figure HC 1.5 Youth suicides (rate per 100,000) in the United States, by age: Selected years, 1970-1998
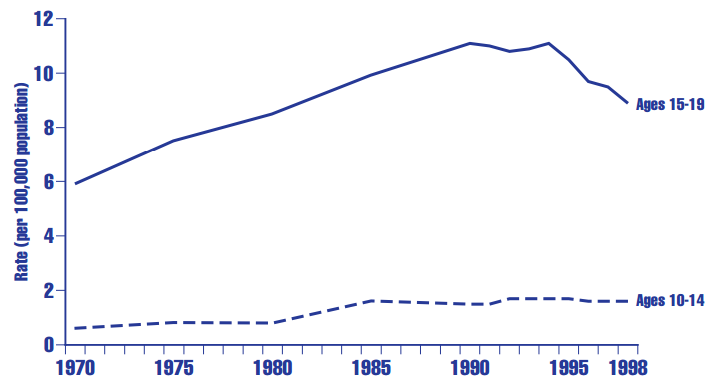
Source: National Center for Health Statistics, Table 291, p485-490, Mortality Statistics Branch, Division of Vital Statistics.
Table HC 1.5 Youth suicides (rate per 100,000) in the United States, by age, gender, and race: Selected years, 1970-1998
| 1970 | 1975 | 1980 | 1985 | 1990 | 1991 | 1992 | 1993 | 1994 | 1995 | 1996 | 1997 | 1998 | |
|---|---|---|---|---|---|---|---|---|---|---|---|---|---|
| All youth | |||||||||||||
| Ages 10-14 | 0.6 | 0.8 | 0.8 | 1.6 | 1.5 | 1.5 | 1.7 | 1.7 | 1.7 | 1.7 | 1.6 | 1.6 | 1.6 |
| Ages 15-19 | 5.9 | 7.5 | 8.5 | 9.9 | 11.1 | 11.0 | 10.8 | 10.9 | 11.1 | 10.5 | 9.7 | 9.5 | 8.9 |
| White males | |||||||||||||
| Ages 10-14 | 1.1 | 1.4 | 1.4 | 2.5 | 2.3 | 2.4 | 2.6 | 2.4 | 2.5 | 2.8 | 2.3 | 2.5 | 2.6 |
| Ages 15-19 | 9.4 | 12.9 | 15.0 | 17.1 | 19.3 | 19.1 | 18.4 | 18.5 | 18.7 | 18.4 | 16.3 | 16.0 | 15.3 |
| White females | |||||||||||||
| Ages 10-14 | 0.3 | 0.4 | 0.3 | 0.9 | 0.9 | 0.8 | 1.1 | 1.0 | 1.0 | 0.9 | 0.9 | 0.8 | 0.9 |
| Ages 15-19 | 2.9 | 3.1 | 3.3 | 4.1 | 4.0 | 4.2 | 3.7 | 4.2 | 3.5 | 3.3 | 3.8 | 3.5 | 3.0 |
| Black males | |||||||||||||
| Ages 10-14 | 0.3 | 0.2 | 0.5 | — | 1.6 | 2.0 | 2.0 | 2.3 | 2.1 | 1.6 | 1.9 | 1.9 | 1.4 |
| Ages 15-19 | 4.7 | 6.1 | 5.6 | 8.2 | 11.5 | 12.2 | 14.8 | 14.4 | 16.6 | 13.8 | 11.5 | 11.4 | 10.7 |
| Black females | |||||||||||||
| Ages 10-14 | 0.4 | 0.3 | 0.1 | — | — | — | — | — | — | — | — | — | — |
| Ages 15-19 | 2.9 | 1.5 | 1.6 | 1.5 | 1.9 | — | 1.9 | — | 2.4 | 2.3 | 1.8 | 2.7 | 1.8 |
— = Not calculated because of unreliability due to infrequency of the event.
Source: National Center for Health Statistics, Table 291, p485-490, Mortality Statistics Branch, Division of Vital Statistics.
15 The race disparity in the suicide rate between all white youth ages 10 through 19 and all black youth ages 10 through 19 narrowed substantially between 1980 and 1995, largely due to the increase of suicide among black youth. In 1980, white youth (ages 10-19) had a suicide rate that was 157 percent greater than that of their black peers; by 1995, the rate among whites was 42 percent greater than the rate among blacks. [These data, not shown here, can be found in Centers for Disease Control and Prevention. March 20, 1998. Suicide among Black Youths—United States, 1980-1995. Morbidity and Mortality Weekly Report 47 (10).]
HC 1.6 Firearm-Related Deaths
Death due to injury by firearms includes deaths due to homicide, suicide, legal intervention, unintentional death by firearms, and firearm-related deaths of undetermined intent. Taken together, suicide and homicide have accounted for the vast majority of firearm-related deaths over the past 30 years—as high as 94 percent in 1994.16
Firearm-related death is a growing public health concern for all ages. It was a major contributor to death in 1994 and the fourth leading cause of years of potential life lost before age 65.17 However, the rate of firearm-related death among youth ages 15 through 19 is of particular concern, as homicide rates for this group rose dramatically in the late 1980s and early 1990s, particularly among black males. In addition, the rate of unintentional death due to firearms has historically been highest among youth ages 15 through 19. Overall, the rate of death due to injury by firearms doubled for youth ages 15 through 19 between 1980 and 1994, from 14.7 deaths to 28.2 deaths per 100,000. Since 1994, the firearm-related death rate has declined, and in 1998 it was at 16.3 deaths per 100,000 (see Table HC 1.6). The firearm-related death rate for youth ages 10 through 14, 2.3 per 100,000 in 1998, is considerably lower than the rate for older youth.18
Differences by Race. Among younger adolescents ages 10 through 14, and among females ages 15 through 19, the rate of death due to injury by firearms ranges from two to three times higher for blacks than for whites. In 1998, the rate of firearm-related death for black males ages 15 through 19 is almost four times the rate for their white peers, but it has decreased by 50 percent since 1993, when the rate was over five times higher than that of white males. Based on 1998 data, the rate for older black males decreased by 25 percent between 1996 and 1997, from 108.7 to 75.5 per 100,000. The high rate of deaths due to homicide among black males in this age group largely accounts for the high firearm-related death rate.19
Differences by Gender. Among blacks and whites in both age groups, firearm-related deaths are more prevalent among males; for example, the death rate for black females ages 15 through 19 was 8.0 per 100,000 in 1998, while the rate for their male peers was almost 10 times greater (75.5 per 100,000). Among whites ages 15 through 19, females experience firearm-related deaths at approximately one-sixth the rate of males.
Figure HC 1.6 Deaths due to injury by firearms (rate per 100,000) for youth ages 15 through 19 in the United States, by gender and race: 1990-1998a
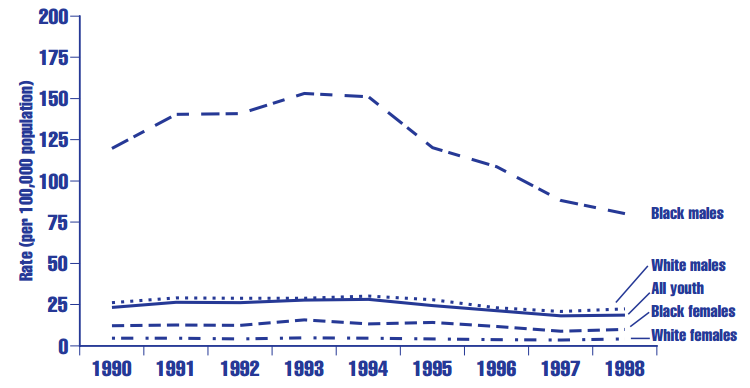
Source: Centers for Disease Control, National Center for Health Statistics, Mortality Statistics Branch, Division of Vital Statistics, 2000.
Table HC 1.6 Youth deaths due to injury by firearms (rate per 100,000) in the United States, by age, gender and race: Selected years, 1980- 1998
| 1980 | 1985 | 1990 | 1991 | 1992 | 1993 | 1994 | 1995 | 1996 | 1997 | 1998 | |
|---|---|---|---|---|---|---|---|---|---|---|---|
| All youth | |||||||||||
| Ages 10-14 | 2.4 | 2.8 | 3.3 | 3.5 | 3.7 | 3.8 | 3.5 | 3.4 | 2.7 | 2.2 | 2.3 |
| Ages 15-19 | 14.7 | 13.3 | 23.3 | 26.4 | 26.2 | 27.8 | 28.2 | 24.5 | 21.2 | 18.2 | 16.3 |
| White males | |||||||||||
| Ages 10-14 | 3.6 | 4.5 | 4.2 | 4.6 | 4.5 | 4.4 | 4.3 | 4.4 | 3.6 | 3.1 | 3.1 |
| Ages 15-19 | 20.9 | 18.4 | 26.2 | 29.1 | 28.8 | 28.8 | 30.2 | 27.9 | 23.1 | 20.8 | 19.4 |
| White females | |||||||||||
| Ages 10-14 | 1.0 | 1.0 | 1.0 | 1.0 | 1.3 | 1.2 | 1.2 | 1.2 | 1.0 | 0.6 | 1.0 |
| Ages 15-19 | 4.1 | 3.5 | 4.6 | 4.6 | 4.3 | 4.9 | 4.7 | 4.2 | 3.8 | 3.5 | 3.1 |
| Black males | |||||||||||
| Ages 10-14 | 4.7 | 4.8 | 10.2 | 11.5 | 11.6 | 13.4 | 11.2 | 10.1 | 7.8 | 6.2 | 4.6 |
| Ages 15-19 | 46.7 | 46.5 | 119.7 | 140.5 | 140.9 | 153.1 | 151.1 | 120.3 | 108.7 | 88.2 | 75.5 |
| Black females | |||||||||||
| Ages 10-14 | 1.5 | — | 3.7 | 3.0 | 3.9 | 3.9 | 3.5 | 2.5 | 2.2 | 2.3 | 2.0 |
| Ages 15-19 | 7.5 | 6.1 | 12.1 | 12.7 | 12.4 | 15.8 | 13.3 | 14.2 | 11.7 | 8.8 | 8.0 |
Source: Centers for Disease Control, National Center for Health Statistics, Mortality Statistics Branch, Division of Vital Statistics, 2000; Murphy, 1999.
16 Ikeda, R.M., Gorwitz, R., James, S.P., Powell, K.E., & Mercy, J.A. 1997. Fatal Firearm Injuries in the United States, 1962- 1994. Violence Surveillance Summary Series (3). Atlanta: Centers for Disease Control and Prevention, National Center for Injury Prevention and Control.
17 Ibid.
18 Data for 1997 are preliminary, based on a sample of 85 percent of all deaths.
19 Refer to section HC 1.4 for further discussion of youth homicide.
Health Conditions
HC 2.1 Healthy Births
A healthy birth is defined here as a birth with the following characteristics: a 5-minute Apgar score of 7 or more out of 10,20 weight at birth of at least 2,500 grams (5 lbs. 8oz.), a gestational age of at least 37 weeks, and maternal receipt of prenatal care within the first trimester.
Table HC 2.1.A reports the percentage of all births qualifying as healthy births, by race and Hispanic origin, according to the above criteria in 1998. The table shows non-Hispanic black newborns scored lower on all four measures of healthiness than non-Hispanic white and Hispanic newborns. For example, 86.8 percent of non-Hispanic black infants were born weighing 2,500 grams or more, while the comparable numbers for Hispanic and nonHispanic white newborns were 93.6 and 93.4 percent respectively
Apgar Score. The Apgar score is a numerical expression of the physical condition of an infant shortly after delivery and is used to predict the newborn’s chance of survival. The score considers five characteristics of the baby—heart rate, respiratory effort, muscle tone, reflex irritability, and color. Each of these characteristics is assessed and assigned a value between 0 and 2. The total score is the sum of the scores of the five components and thus ranges between 1 and 10. Ninety-nine percent of all births were rated with an Apgar score at 5 minutes after birth of 7 or more in 1998 (See Table HC 2.1.A). These numbers were nearly the same for all racial/ethnic groups except non-Hispanic blacks. In 1998, 97.6 of all births to this group were rated as healthy according to the Apgar criteria.
Birthweight. The risks for infants born weighing less than 2,500 grams (5lb. 8oz.) is discussed in the following indicator, HC 2.2. As stated in that section, the percentage of infants born at low birthweight has increased steadily since 1985 to 7.6 percent in 1999 (See Table HC 2.2.A). In contrast, the percentage of children born weighing more than 2,500 in 1998 was 92.4. Hispanic and non-Hispanic whites had similarly high percentages with 93.6 and 93.4 percent respectively. The percentage of infants born to non-Hispanic black mothers weighing over 2,500 grams was much lower however, at 86.8 percent (See Table HC 2.1A).
Period of Gestation. Preterm birth, defined as infants that are born prior to 37 weeks of gestation, is a major cause of infant mortality and has been associated with long-term neurodevelopment and respiratory disorders. The percentage of births that are preterm has risen steadily over the past decade. In 1989, 10.6 of all births were preterm, and this percentage had risen to 11.6 in 1998 (See Table HC 2.1.B). It appears that the rising number of preterm infants born to white non-Hispanic mothers account for much of this increase. This percentage has risen from 8.4 in 1989 to 10.2 percent in 1998. In comparison, the percentage of preterm infants born to black non-Hispanic mothers has decreased (from 19 percent in 1989 to 17.6 percent in 1998), and the percentage of preterm Hispanic infants has increased only slightly, from 11.1 to 11.4 in the same time period.
Prenatal care. Early prenatal care (especially within the first trimester of pregnancy) can promote healthier births by detecting and managing preexisting medical conditions, and by providing health advice to the mother.21 In 1998, nearly 88 percent of all non-Hispanic white mothers received prenatal care sometime during their first trimester of pregnancy. The percentages for non-Hispanic blacks and Hispanic mothers were considerably lower at 73 and 74 percent respectively (See Table HC 2.1.A). This topic is discussed in greater detail in section HC 3.2.
Table HC 2.1.A Percentage of all births in the United States defined as healthy, by mother’s race: 1998
| Gestational age 37 weeks + | Birthweight 2,500 grams + | Apgar score 7 or above | Prenatal care 1st trimester | |
|---|---|---|---|---|
| All | 88.4 | 92.4 | 98.6 | 82.8 |
| White | 89.8 | 93.4 | 98.7 | 87.9 |
| Black | 82.4 | 86.8 | 97.6 | 73.3 |
| Hispanic | 88.6 | 93.6 | 98.8 | 74.3 |
Source: Special tabulations for 1998 birth data by Sally C. Curtin, National Center for Health Statistics.
Table HC 2.1.B Percentage of preterma live births by race and Hispanic origin of mother: 1989-1998
| 1989b | 1990c | 1991d | 1992d | 1993 | 1994 | 1995 | 1996 | 1997 | 1998 | |
|---|---|---|---|---|---|---|---|---|---|---|
| All | 10.6 | 10.6 | 10.8 | 10.7 | 11.0 | 11.0 | 11.0 | 11.0 | 11.4 | 11.6 |
| White | 8.4 | 8.5 | 8.7 | 8.7 | 9.1 | 9.3 | 9.4 | 9.5 | 9.9 | 10.2 |
| Black | 19.0 | 18.9 | 19.0 | 18.5 | 18.6 | 18.2 | 17.8 | 17.5 | 17.6 | 17.6 |
| Hispanic | 11.1 | 11.0 | 11.0 | 10.7 | 11.0 | 10.9 | 10.9 | 10.9 | 11.2 | 11.4 |
a Infants born prior to 37 weeks of gestation.
b Data by Hispanic origin exclude New Hampshire, Oklahoma, and Louisiana, which did not report Hispanic origin.
c Data by Hispanic origin exclude New Hampshire and Oklahoma, which did not report Hispanic origin.
d Data by Hispanic origin exclude New Hampshire which did not report Hispanic origin.
Sources: Ventura, et al., 2000. Births.
20 The Apgar score is a numerical expression of the physical condition of an infant shortly after delivery. The infant is rated 0, 1, or 2 on color, heart rate, reflex irritability, muscle tone, and breathing. The maximum score is 10, and a score of 4 or less indicates examination and treatment are warranted. As defined in Apgar, V., Holiday, D.A., James, L.S., Weisbrot, I.N., & Berrien, C. 1953. Evaluation of the Newborn Infant-2nd Report. Current Researchers in Anesthesia and Analgesia, 32: 260-267.
21 Ibid.
HC 2.2 Low and Very Low Birthweight
Low Birthweight
Babies born weighing less than 2,500 grams (5lb. 8oz.) face an increased risk of physical and developmental complications and death.22 These babies account for four-fifths of all neonatal deaths (deaths under 28 days of age) and are 24 times more likely to die during the first year than are heavier infants.23
Although slight declines are seen in the early 1980s, overall the percentage of all infants born at low birthweight has increased steadily since 1985, when 6.8 percent of infants were born at low birthweight, compared with 7.6 percent in 1999 (see Table HC 2.2.A).
Smoking. Babies born to mothers who smoke during pregnancy are at greatly elevated risk of low birthweight, a finding documented in birth certificate data as well as in numerous other studies.24 In 1998, 12 percent of infants born to smokers weighed less than 2,500 grams (5lb. 8oz.) compared with 7.2 percent of births to nonsmokers (See Figure HC 2.2.A). This substantial differential is found for every race and Hispanic origin group (See Figure HC 2.2.A). The low birthweight risk is heightened as the number of cigarettes increases, “although low birthweight is elevated even among babies born to the lightest smokers (one to five cigarettes daily).” “Advancing maternal age exacerbates the risk, probably a consequence of the much greater cigarette consumption among older women.”25
Differences by Race and Ethnicity. Low birthweight rates are substantially higher among black infants than among other races and Hispanics. The percentages of low birthweight infants among whites, American Indians/Alaska Natives, Asians/Pacific Islanders, and Hispanics have remained within 1 percentage point of each other and have mostly hovered around 6 to 7 percent over the last two decades, compared to around 13 percent for blacks.
Among Asians/Pacific Islanders and Hispanics, there are important subgroup differences. Since 1970, Chinese women have consistently had the lowest percentage of low-weight births, and Filipino women have had the highest among Asian/Pacific Islander women. Among Hispanics, Mexican American women have generally had the lowest percentage of low birthweight infants, and Puerto Rican women have had the highest (see Table HC 2.2.A).
Differences by Age. For women in all age groups, there was a decline in the percentage of low-weight births between 1970 and 1985. Since 1985, however, that percentage increased slightly across nearly all age groups. The following trends, illustrated in Table HC 2.2.A, are particularly noteworthy:
- Women under age 15 consistently have the highest rates of low-weight births of any age group (see Figure HC 2.2.B).
- For women in all other age groups, rates of low-weight births have generally stayed within 1.5 percentage points of their 1970 rate.
- Women between the ages of 25 and 29 consistently have the lowest rates of lowweight births.
Multiple births. Multiple births are more likely than singletons to be born either preterm or low birthweight (See Figure HC2.2.C). Multiples comprised only 3 percent of all births in 1998, but 21 percent of all low birthweight infants and 24 percent of very low birthweight. Multiple birth rates generally rise with increasing maternal age, with the rate peaking for mothers 45 to 54 years of age. The rising multiple birth rate and the accompanying high risk for these births has increasingly influenced measures of perinatal health at the national and State levels.26
Very Low Birthweight
Babies born weighing less than 1,500 grams (3lb. 4oz.) are at particularly high risk of severe physical and developmental complications and death. Advances in medical technology in recent years have made it possible for increasing numbers of very low birthweight infants to survive; however, these babies are 96 times more likely to die during the first year of life than babies weighing at least 2,500 grams.27
The percentage of infants born at very low birthweight has increased steadily since the early 1980s, by 25 percent overall since 1981 (see Table HC 2.2.C). Between 1970 and 1989 (not shown), 1.2 percent of all infants were classified as very low birthweight. The proportion then increased to 1.27 percent in 1990, and to 1.45 percent in 1998.
Differences by Race and Ethnicity. The percentage of babies born at very low birthweight varies by race and Hispanic origin (see Table HC 2.2.C). For white, Hispanic, American Indian/Alaska Native, and Asian/Pacific Islander infants, the percentage of very low-weight births was about 1 percent in 1998. However, the percentage of black infants born at very low birthweight is considerably higher. In 1970, 2.4 percent of all infants born to black mothers weighed 1,500 grams or less, a percentage that has increased to 3.1 in 1998. The percentage of very low birthweight has increased steadily for all groups since the early 1980’s.
Differences by Age. A woman’s age is an important factor in the likelihood of very low birthweight, particularly at the youngest ages. The percentage of very low birthweight infants born to women under age 15 was 3.3 percent in 1998. The percentage of very low birthweight births among women ages 15 through 19 is lower than the proportion of such births to their younger counterparts but remains slightly higher than the proportion observed for women ages 20 and older, (see Table HC 2.2C).
Table HC 2.2.A Low birthweighta infants as a percentage of all infants born in the United States by mother’s race/ethnicityb and by age: Selected years, 1970-1999
| 1970 | 1975 | 1980 | 1985 | 1990 | 1995 | 1996 | 1997 | 1998 | 1999 | |
|---|---|---|---|---|---|---|---|---|---|---|
| Total | 7.9 | 7.4 | 6.8 | 6.8 | 7.0 | 7.3 | 7.4 | 7.5 | 7.6 | 7.6 |
| Race/ethnicity | ||||||||||
| Whitec | 6.9 | 6.3 | 5.7 | 5.7 | 5.6 | 6.2 | 6.4 | 6.5 | 6.6 | 6.6 |
| Blackc | 13.9 | 13.2 | 12.7 | 12.7 | 13.3 | 13.2 | 13.1 | 13.1 | 13.2 | 13.1 |
| American Indian/Alaskan Native | 8.0 | 6.4 | 6.4 | 5.9 | 6.1 | 6.6 | 6.5 | 6.8 | 6.8 | — |
| Asian/Pacific Islander | — | — | 6.7 | 6.2 | 6.5 | 6.9 | 7.1 | 7.2 | 7.4 | — |
| Chinese | 6.7 | 5.3 | 5.2 | 5.0 | 4.7 | 5.3 | 5.0 | 5.1 | 5.3 | — |
| Japanese | 9.0 | 7.5 | 6.6 | 6.2 | 6.2 | 7.3 | 7.3 | 6.8 | 7.5 | — |
| Filipino | 10.0 | 8.1 | 7.4 | 7.0 | 7.3 | 7.8 | 7.9 | 8.3 | 8.2 | — |
| Hawaiian and part Hawaiian | — | — | 7.2 | 6.5 | 7.2 | 6.8 | 6.8 | 7.2 | 7.2 | — |
| Other Asian or Pacific Islander | — | — | 6.8 | 6.2 | 6.7 | 7.1 | 7.4 | 7.5 | 7.8 | — |
| Hispanic originb, d | — | — | 6.1 | 6.2 | 6.1 | 6.3 | 6.3 | 6.4 | 6.4 | 6.4 |
| Mexican American | — | — | 5.6 | 5.8 | 5.6 | 5.8 | 5.9 | 6.0 | 6.0 | — |
| Puerto Rican | — | — | 9.0 | 8.7 | 9.0 | 9.4 | 9.2 | 9.4 | 9.7 | — |
| Cuban | — | — | 5.6 | 6.0 | 5.7 | 6.5 | 6.5 | 6.8 | 6.5 | — |
| Central and South American | — | — | 5.8 | 5.7 | 5.8 | 6.2 | 6.0 | 6.3 | 6.5 | — |
| Other and unknown Hispanic | — | — | 7.0 | 6.8 | 6.9 | 7.5 | 7.7 | 7.9 | 7.6 | — |
| Age | ||||||||||
| Under age 15 | 16.6 | 14.1 | 14.6 | 12.9 | 13.3 | 13.5 | 12.8 | 13.6 | 13.1 | 12.8 |
| 15-19 years | 10.5 | 10.0 | 9.4 | 9.3 | 9.3 | 9.3 | 9.3 | 9.5 | 9.5 | 9.6 |
| 20-24 years | 7.4 | 7.1 | 6.9 | 6.9 | 7.1 | 7.3 | 7.4 | 7.4 | 7.5 | 7.6 |
| 25-29 years | 6.9 | 6.1 | 5.8 | 5.9 | 6.2 | 6.4 | 6.5 | 6.6 | 6.7 | 6.7 |
| 30-34 years | 7.5 | 6.8 | 5.9 | 6.1 | 6.4 | 6.7 | 6.8 | 6.9 | 7.0 | 7.0 |
| 35-49 yearse | 8.8 | 8.4 | 7.2 | 7.1 | 7.4 | 8.3 | 8.3 | 8.6 | 8.7 | 8.7 |
a Before 1979, low birthweight was defined as infants weighing 2,500 grams (5lb. 8oz.) or less. From 1979 and beyond, low birth weight defined as infants weighing less than 2,500 grams (5lb. 8oz.).
b Birth figures for Hispanic infants are based on data from 22 states that reported Hispanic origin on the birth certificate in 1980, 23 states and the District of Columbia in 1985, 48 states and the District of Columbia in 1990, 49 states and the District of Columbia in 1992, and 50 states and the District of Columbia since 1993.
c Excludes persons of Hispanic origin after 1990.
d Persons of Hispanic origin may be of any race.
e Data for 1997 and 1998 are for ages 35-54 years.
Sources: Curtin & Martin, 2000; Ventura, et al., 2000; Ventura, et al., 1999, Births, Tables 24, 25, and 45; Centers for Disease Control, National Center for Health Statistics, 1998, Health, United States, 1998, Table 11; and unpublished tabulations, Division of Vital Statistics, National Center for Health Statistics.
Table HC 2.2.B Percent low birthweighta among singletons by race/Hispanic origin of mother: 1989-98
| 1989d | 1990c | 1991b | 1992b | 1993 | 1994 | 1995 | 1996 | 1997 | 1998 | |
|---|---|---|---|---|---|---|---|---|---|---|
| Total | 6.00 | 5.90 | 5.99 | 5.93 | 6.05 | 6.05 | 6.05 | 6.03 | 6.08 | 6.05 |
| Non-Hispanic White | 4.60 | 4.56 | 4.61 | 4.59 | 4.70 | 4.79 | 4.87 | 4.90 | 4.95 | 4.91 |
| Non-Hispanic Black | 12.22 | 11.92 | 12.15 | 11.91 | 11.90 | 11.79 | 11.66 | 11.55 | 11.46 | 11.44 |
| Hispanic | 5.35 | 5.23 | 5.29 | 5.22 | 5.34 | 5.37 | 5.36 | 5.34 | 5.43 | 5.40 |
a Low birthweight is less than 2,500 grams or 5lb 8oz.
b Excludes data for New Hampshire, which did not require reporting of Hispanic origin of mother.
c Excludes data for New Hampshire and Oklahoma which did not require reporting of Hispanic origin of mother.
d Excludes data for Louisiana, New Hampshire, and Oklahoma which did not require reporting of Hispanic origin of mother.
Sources: Martin & Park, Trends in twin and triplet births: 1980-1997; National Vital Statistics Reports 47(24). Hyattsville, MD: National Center for Health Statistics; Ventura, et al., 2000, Births; Ventura, et al., 1999, Births, Tables 24, 25 and 45
Figure HC 2.2.A Percentage of children born with low birthweight,a by mother’s smoking status and age, race and Hispanic origin, 1998
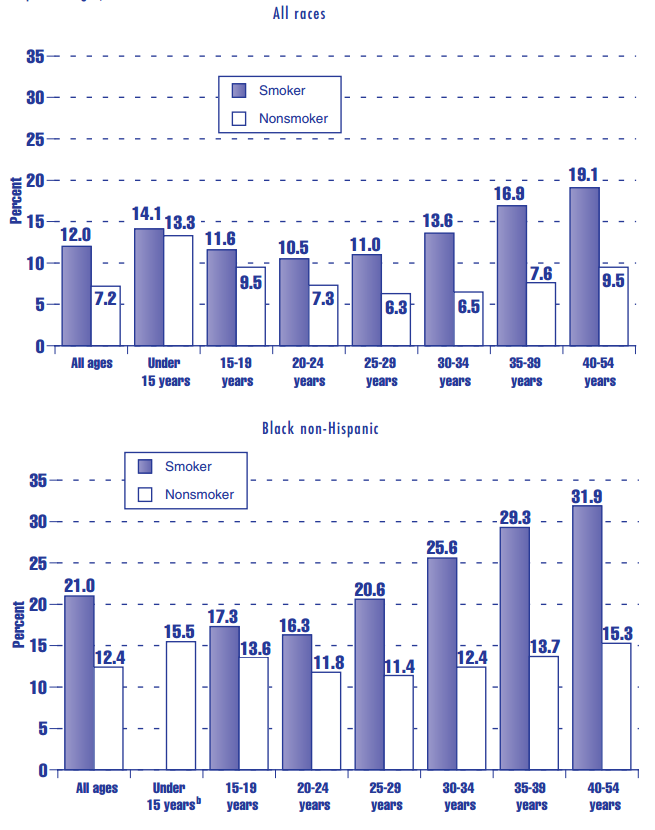
Figure HC 2.2.A continued Percentage of children born with low birthweight,a by mother’s smoking status and age, race and Hispanic origin, 1998
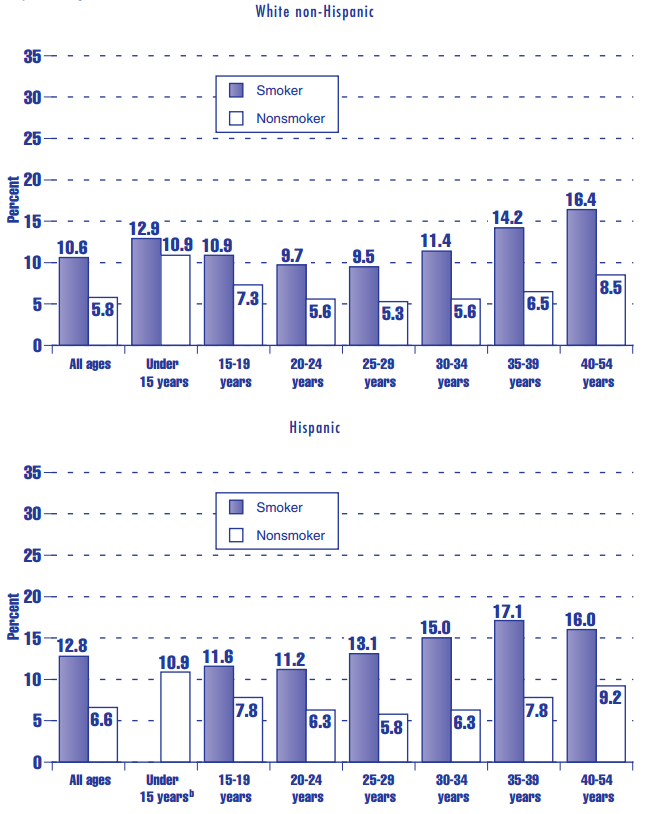
a Low birthweight defined as infants weighing less than 2,500 grams (5lb. 8oz.).
b Data for smokers under 15 years did not meet standards of reliability or precision; based on fewer than 20 births in numerator or denominator.
Sources: Ventura, et al., 2000, Births, Tables 24, 25, and 45.
Figure HC 2.2.B Low birthweighta infants as a percentage of all infants born in the United States, by age of mother: 1998
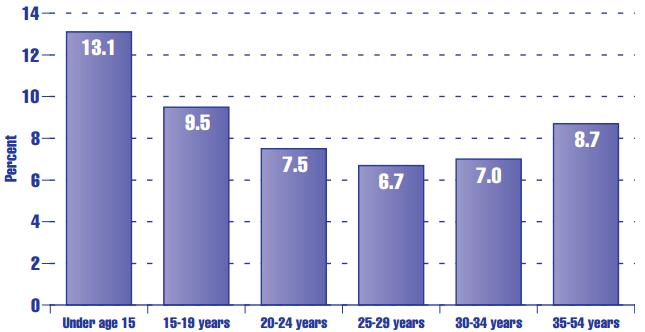
a Low birthweight defined as infants weighing less than 2,500 grams (5lb. 8oz.).
Sources: Ventura, et al., 1999, Births, Table 45.
Figure HC 2.2.C Percentage of children born with low birthweight by plurality and age of mother: United States, 1998

Source: Unpublished tabulation, Division of Vital Statistics, National Center for Health Statistics, 2000.
Table HC 2.2.C Very low birthweighta infants as a percentage of all infants born in the United States, by mother's race/ethnicityb and by age. Selected years: 1970-1998
| 1970 | 1975 | 1980 | 1985 | 1990 | 1995 | 1996 | 1997 | 1998 | |
|---|---|---|---|---|---|---|---|---|---|
| Total | 1.17 | 1.16 | 1.15 | 1.21 | 1.27 | 1.35 | 1.37 | 1.42 | 1.45 |
| Race/ethnicityb | |||||||||
| Whitec | 0.95 | 0.92 | 0.90 | 0.94 | 0.93 | 1.04 | 1.08 | 1.12 | 1.15 |
| Blackc | 2.40 | 2.40 | 2.48 | 2.71 | 2.93 | 2.98 | 3.02 | 3.05 | 3.11 |
| American Indian/Alaska Nativec | 0.98 | 0.95 | 0.92 | 1.01 | 1.01 | 1.10 | 1.21 | 1.19 | 1.24 |
| Asian/Pacific Islanderc | — | — | 0.92 | 0.85 | 0.87 | 0.91 | 0.99 | 1.05 | 1.10 |
| Chinese | 0.80 | 0.52 | 0.66 | 0.57 | 0.51 | 0.67 | 0.64 | 0.74 | 0.75 |
| Japanese | 1.48 | 0.89 | 0.94 | 0.84 | 0.73 | 0.87 | 0.81 | 0.78 | 0.84 |
| Filipino | 1.08 | 0.93 | 0.99 | 0.86 | 1.05 | 1.13 | 1.20 | 1.29 | 1.35 |
| Hawaiian and part Hawaiian | — | — | 1.05 | 1.03 | 0.97 | 0.94 | 0.97 | 1.41 | 1.53 |
| Other Asian or Pacific Islander | — | — | 0.96 | 0.91 | 0.92 | 0.91 | 1.04 | 1.07 | 1.12 |
| Hispanic origind | — | — | 0.98 | 1.01 | 1.03 | 1.11 | 1.12 | 1.13 | 1.15 |
| Mexican American | — | — | 0.92 | 0.97 | 0.92 | 1.01 | 1.01 | 1.02 | 1.02 |
| Puerto Rican | — | — | 1.29 | 1.30 | 1.62 | 1.79 | 1.70 | 1.85 | 1.86 |
| Cuban | — | — | 1.02 | 1.18 | 1.20 | 1.19 | 1.35 | 1.36 | 1.33 |
| Central and South American | — | — | 0.99 | 1.01 | 1.05 | 1.13 | 1.14 | 1.17 | 1.23 |
| Other and unknown Hispanic | — | — | 1.01 | 0.96 | 1.09 | 1.28 | 1.48 | 1.35 | 1.38 |
| Age | |||||||||
| Under age 15 | — | 3.10 | 3.40 | 3.10 | 3.20 | 3.15 | 3.16 | 3.06 | 3.28 |
| 15-19 years | — | 1.80 | 1.70 | 1.80 | 1.80 | 1.74 | 1.72 | 1.78 | 1.81 |
| 20-24 years | — | 1.10 | 1.10 | 1.20 | 1.30 | 1.31 | 1.32 | 1.37 | 1.38 |
| 25-29 years | — | 0.90 | 1.00 | 1.00 | 1.10 | 1.16 | 1.22 | 1.24 | 1.27 |
| 30-34 years | — | 1.00 | 1.00 | 1.10 | 1.20 | 1.24 | 1.26 | 1.33 | 1.37 |
| 35-49 yearse | — | 1.20 | 1.20 | 1.30 | 1.40 | 1.58 | 1.65 | 1.68 | 1.71 |
a Before 1979, very low birthweight defined infants weighing 1,500 grams (3lb. 4oz.) or less. From 1979 and beyond, very low birthweight defined as infants weighing less than 1,500 grams (3lb. 4oz.).
b Birth figures for Hispanic infants are based on data from 22 states that reported Hispanic origin on the birth certificate in 1980, 23 states and the District of Columbia in 1985, 48 states and the District of Columbia in 1990, 49 states and the District of Columbia in 1992, and 50 states and the District of Columbia since 1993.
c Includes persons of Hispanic origin until 1990. Beginning in 1990, persons of Hispanic origin are not included.
d Persons of Hispanic origin may be of any race.
e Data for 1997 and 1998 are for ages 35-54 years.
Sources: Ventura, et al., 2000, Births; Ventura, et al., 1999; Natality 1996, Tables 24, 25, and 45; Centers for Disease Control, National Center for Health Statistics, 2000, Health, Table 12; and unpublished tabulations, Division of Vital Statistics, National Center for Health Statistics.
26 Ibid.
27 Mathews, Curtin, & MacDorman, 2000.
HC 2.3 General Health Conditions: Percentage of Children in Very Good or Excellent Health
Most children in the United States are reported by their parents to be in very good or excellent health. The percentage of all children under age 18 reported to be in very good or excellent health has remained at about 80 percent since 1984.
Differences by Race. Parents’ reports of their children’s health vary by race. Between 1984 and 1996, black parents were less likely than white parents to report that their children were in very good or excellent health. In 1996, 75 percent of black children under age 5 were reported in very good or excellent health, compared with 82 percent of white children. Seventy percent of black children ages 5 to 17 were reported in very good or excellent health, compared with 81 percent of white children in this age group (see Table HC 2.3).
Differences by Family Income. Parents’ reports of their children’s health also vary by family income, with higher-income families more likely to report that their children are in very good or excellent health. For example, in 1997, 68 percent of children under age 18 who fell below the poverty line were reported to be in very good or excellent health, compared with 86 percent for children at or above the poverty line. Sixty-seven percent of children under age 5 in families with annual incomes under $10,000 were reported to be in very good or excellent health, compared with 87 percent of children in families with annual incomes of $35,000 or more in 1996. A similar pattern exists for children ages 5 to 17 (see Figure HC 2.3.A).
Table HC 2.3 Percentage of children under age 18 in the United States who are reported by their parents to be in very good or excellent health, by age, race, gender, poverty status, and family income:a Selected years, 1984–1997
| 1984 | 1990 | 1992 | 1993 | 1994 | 1995 | 1996 | 1997b | |
|---|---|---|---|---|---|---|---|---|
| Ages 0-17 | ||||||||
| Total | 78 | 81 | 80 | 79 | 79 | 81 | 80 | 81 |
| Poverty status | ||||||||
| Below poverty | 62 | 66 | 65 | 64 | 64 | 65 | 64 | 68 |
| At or above poverty | 82 | 84 | 83 | 83 | 83 | 85 | 84 | 86 |
| Under age 5 | ||||||||
| Total | 79 | 81 | 80 | 80 | 81 | 81 | 81 | 62 |
| Race | ||||||||
| White | 81 | 83 | 82 | 82 | 83 | 83 | 82 | 86 |
| Black | 67 | 72 | 70 | 71 | 72 | 72 | 75 | 77 |
| Gender | ||||||||
| Male | 78 | 80 | 79 | 80 | 81 | 80 | 80 | 83 |
| Female | 79 | 82 | 81 | 80 | 81 | 82 | 81 | 84 |
| Annual family incomea | ||||||||
| Under $10,000 | — | — | — | — | — | — | 67 | 73 |
| $10,000-$19,999 | — | — | — | — | — | — | 74 | 78 |
| $20,000-$34,999 | — | — | — | — | — | — | 82 | 82 |
| $35,000 or more | — | — | — | — | — | — | 87 | 91 |
| Poverty status | ||||||||
| Below poverty | 66 | 69 | 67 | 68 | 68 | 66 | 68 | 74 |
| At or above poverty | 82 | 84 | 84 | 84 | 84 | 86 | 85 | 88 |
| Ages 5-17 | ||||||||
| Total | 77 | 80 | 80 | 79 | 79 | 80 | 79 | 82 |
| Race | ||||||||
| White | 80 | 83 | 82 | 81 | 81 | 82 | 81 | 84 |
| Black | 65 | 68 | 68 | 70 | 68 | 70 | 70 | 70 |
| Gender | ||||||||
| Male | 78 | 81 | 80 | 79 | 79 | 80 | 79 | 81 |
| Female | 77 | 80 | 79 | 78 | 78 | 80 | 79 | 81 |
| Annual family incomea | ||||||||
| Under $10,000 | — | — | — | — | — | — | 59 | 64 |
| $10,000-$19,999 | — | — | — | — | — | — | 68 | 69 |
| $20,000-$34,999 | — | — | — | — | — | — | 77 | 76 |
| $35,000 or more | — | — | — | — | — | — | 88 | 89 |
| Poverty status | ||||||||
| Below poverty | 60 | 64 | 64 | 63 | 62 | 64 | 62 | 65 |
| At or above poverty | 81 | 84 | 83 | 82 | 82 | 85 | 83 | 85 |
a Family income is not adjusted in the National Health Interview Survey for comparison over time; therefore, family income is shown only for the most recent year. Income breaks are those provided by the National Center for Health Statistics.
b In 1997, the National Health Interview Survey was redesigned. Data for 1997 are not strictly comparable with earlier data.
Sources: Data from the National Health Interview Survey, National Center for Health Statistics (unpublished tabulations provided by the Centers for Disease Control and Prevention and other estimates as published in America's Children: Key National Indicators of Well-Being, 2000, Federal Interagency Forum on Child and Family Statistics, Table HEALTH1, available online at http://childstats.gov/ac1998/xhealth1.htm); Benson, & Marono, 1996, Table 70; National Center for Health Statistics. Also previous issues of this report [Series 10, 156, 166, 181, 189, 190, and 199 (Table 70 in each)].
Figure HC 2.3.A Percentage of children under age 18 in the United States who are reported by their parents to be in very good or excellent health, by age and family income: 1996
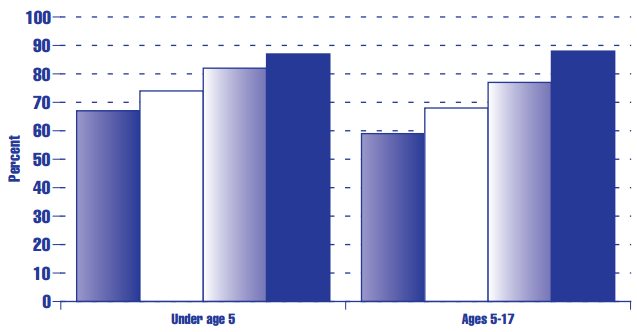
Source: Unpublished data from the National Health Interview Survey, provided by the National Center for Health Statistics.
Figure HC 2.3.B Percentage of children under age 18 in the United States who are reported by their parents to be in very good or excellent health, by poverty status: 1984-1996
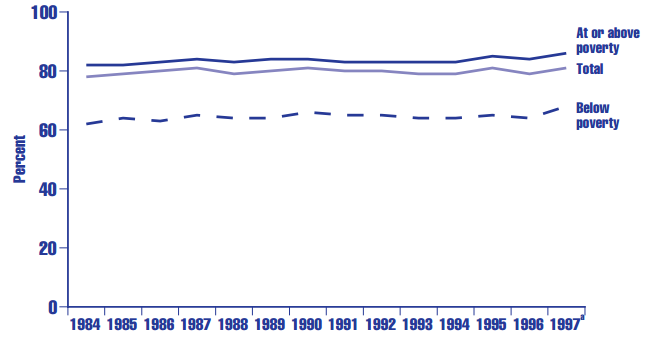
a In 1997, the National Health Interview Survey was redesigned. Data for 1997 are not strictly comparable with earlier data.
Sources: Data from the National Health Interview Survey, National Center for Health Statistics (unpublished tabulations provided by the Centers for Disease Control and other estimates as published in America's Children: Key National Indicators of Well-Being, 1998, Federal Interagency Forum on Child and Family Statistics, Table HEALTH1, available online at http://childstats.gov/ac1998/xhealth1.htm); Benson, & Marono, 1996, Table 70; Also previous issues of this report [Series 10, Nos. 156, 166, 181, 189, 190, and 199 (Table 70 in each)].
HC 2.4 Chronic Health Conditions
Chronic health problems can cause children to miss school and often require medical assistance and follow-up. Chronic conditions can also create stress for children and their parents, cause parents to miss work, and increase a family’s medical expenses.
Over the period from 1984 to 1996, respiratory conditions were the most prevalent chronic health problems experienced by children under age 17 (see Table HC 2.4). The incidence of asthma and chronic sinusitis increased between 1984 and 1995 but decreased in 1996. Chronic sinusitis affected 47 children per thousand in 1984, 76 per thousand in 1995, and 64 per thousand in 1996. Meanwhile, asthma affected 43 children per thousand in 1984, compared with 75 per thousand in 1995 and 62 per thousand in 1996. Asthma attacks, which involve episodes of wheezing, breathlessness, and coughing, can range from mild to life-threatening, and children with asthma miss an average of twice as many school days as children without asthma.28 The prevalence rate for asthma increased between 1980 and 1994 for all race groups, both sexes, and all age groups, with the most substantial increase among children under age 4 (a 160 percent increase) and ages 5 to 14 (a 74 percent increase).29
Between 1984 and 1996, the number of children suffering from chronic diseases of the tonsils or adenoids (34 and 20 per thousand in 1984 and 1996, respectively), hearing impairments (24 and 13), and anemia (11 and 5) decreased (see Table HC 2.4).
Table HC 2.4 Selected chronic health conditionsa for children under age 18 (rate per 1,000 children) in the United States: Selected years, 1984-1996
| Rate per 1,000 | ||||||||
|---|---|---|---|---|---|---|---|---|
| 1984 | 1987 | 1990 | 1992 | 1993 | 1994 | 1995 | 1996 | |
| Respiratory conditions | ||||||||
| Hay fever, allergic rhinitis without asthma | 61 | 64 | 57 | 71 | 57 | 61 | 66 | 59 |
| Chronic bronchitis | 50 | 62 | 53 | 54 | 59 | 55 | 54 | 57 |
| Chronic sinusitis | 47 | 58 | 57 | 69 | 80 | 65 | 76 | 64 |
| Asthma | 43 | 53 | 58 | 63 | 72 | 69 | 75 | 62 |
| Chronic diseases of tonsils or adenoids | 34 | 30 | 23 | 28 | 26 | 23 | 19 | 20 |
| Skin conditions | ||||||||
| Dermatitis | 39 | 32 | 31 | 41 | 36 | 38 | 35 | 31 |
| Serious acne | 26 | 26 | 26 | 25 | 28 | 29 | 26 | 24 |
| Impairments | ||||||||
| Deformity or orthopedic impairment | 35 | 36 | 29 | 33 | 29 | 28 | 30 | 26 |
| Speech impairment | 16 | 19 | 14 | 21 | 20 | 21 | 18 | 16 |
| Hearing impairment | 24 | 16 | 21 | 15 | 17 | 18 | 15 | 13 |
| Visual impairment | 9 | 10 | 9 | 10 | 7 | 9 | 7 | 6 |
| Other conditions | ||||||||
| Heart disease | 23 | 22 | 19 | 19 | 20 | 18 | 19 | 24 |
| Migraine headache | 11 | 8 | 14 | 13 | 13 | 16 | 13 | 15 |
| Anemia | 11 | 8 | 10 | 11 | 9 | 12 | 7 | 5 |
| Epilepsy | 7 | 4 | 4 | 3 | 5 | 5 | 4 | 5 |
a Chronic health conditions as defined in the National Health Interview Survey are conditions that either (a) were first noticed 3 months or more before the reference date of the interview; or (b) belong to a group of conditions (including heart diseases, diabetes, and others) that are considered chronic regardless of when they began. The prevalence estimates are based on reports by parents or other adult respondents in response to checklists administered in household interviews.
Sources: Unpublished data from the National Health Interview Survey, National Center for Health Statistics; Benson, & Marono, 1996, tables 57 and 62; also previous issues of this report [Series 10, 156, 166, 181, 189, 190, and 193 (Tables 57 and 62 in each)].
Figure HC 2.4 Selected chronic health conditionsa for children under age 18 (rate per 1,000 children) in the United States: 1996
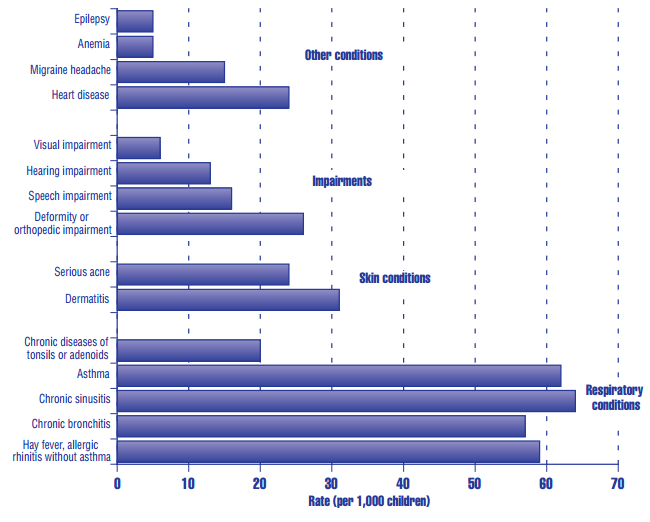 a Chronic health conditions as defined in the National Health Interview Survey are conditions that either (a) were first noticed 3 months or more before the reference date of the interview; or (b) belong to a group of conditions (including heart diseases, diabetes, and others) that are considered chronic regardless of when they began. The prevalence estimates are based on reports by parents or other adult respondents in response to checklists administered in household interviews.
Source: Unpublished data from the National Health Interview Survey, National Center for Health Statistics.
28 U.S. Department of Health and Human Services Press Office. May 21, 1998. HHS Targets Efforts on Asthma. Fact Sheet. Available online at http://www.hhs.gov/news/press/1998.html.
29 Mannino, D.M., Homa, D.M., Pertowski, C.A., Ashizawa, A, Nixon, L.L., Johnson, C.A., et al., 1998. Surveillance for Asthma: United States, 1960-1995. Morbidity and Mortality Weekly Report 47 (SS-1): 1-28.
HC 2.5 Overweight Prevalence Among Children and Adolescents
Persons who are overweight in adolescence are at greater risk of being overweight as adults, and adults who are overweight are at higher risk of numerous health problems, including hypertension, coronary heart disease, gallbladder disease, noninsulin-dependent diabetes, and some cancers.30 Because being overweight in childhood and adolescence increases the risk of being overweight in adulthood, the trends in overweight prevalence among children and youth have become an important public health concern. Overall, the percentage of children ages 6 through 17 who are overweight has increased more than twofold since the 1960s, with the largest increases seen since 1980 (see Table HC 2.5).31
Differences by Age. In the earliest period shown in Table HC 2.5 (1963-1965), 5 percent of children ages 6 through 11 were overweight, with this percentage rising to 13.6 percent in the last period (1988-1994). Similar increases are shown among older children ages 12 through 17, although overweight prevalence has been about two percentage points lower for older children in the later time periods.
Differences by Gender. In the latest time period (1988-1994), 14.7 percent of males ages 6 through 11 were overweight, compared with 12.6 percent of females; 12.4 percent of males ages 12 through 17 were overweight, compared with 10.5 percent of females.
Differences by Race. In later years, overweight prevalence among male children (ages 6 through 11) and adolescents (ages 12 through 17) ranges within one percentage point between black and white males. The percentage of overweight black female children and adolescents is nearly six percentage points above that of their white peers (see Figure HC 2.5).
Table HC 2.5 Percentage of overweighta children and adolescents in the United States, by age, gender, and race:b Selected years, 1963-1994
| 1963-1965 | 1966-1970 | 1971-1974 | 1976-1980 | 1988-1994 | |
|---|---|---|---|---|---|
| Ages 6-11 | |||||
| Total | 5.0 | — | 5.5 | 7.6 | 13.6 |
| Male | 4.9 | — | 6.5 | 8.1 | 14.7 |
| White | 5.4 | — | 6.6 | 8.1 | 14.6 |
| Black | 1.7 | — | 5.6 | 8.6 | 15.1 |
| Female | 5.2 | — | 4.4 | 7.1 | 12.6 |
| White | 5.1 | — | 4.4 | 6.5 | 11.7 |
| Black | 5.3 | — | 4.5 | 11.5 | 17.4 |
| Ages 12-17 | |||||
| Total | — | 5.0 | 6.2 | 5.6 | 11.4 |
| Male | — | 5.0 | 5.3 | 5.3 | 12.4 |
| White | — | 5.2 | 5.5 | 5.3 | 13.1 |
| Black | — | 3.6 | 4.4 | 6.0 | 12.1 |
| Female | — | 5.0 | 7.2 | 6.0 | 10.5 |
| White | — | 4.8 | 6.6 | 5.4 | 10.0 |
| Black | — | 6.4 | 10.5 | 10.2 | 16.1 |
a Overweight is defined as body mass index (BMI) at or above the sex- and age-specific 95th percentile BMI cutoff points calculated at 6-month age intervals for children ages 6 through 11 [from the 1963-1965 National Health Examination Survey (NHES)] and for adolescents ages 12 through 17 (from the 1966-70 NHES). Age is at time of examination at mobile examination center. This definition differs from that reported in earlier versions of this report, which was based on children at or above the 85th percentile of BMI.
b Totals for male and female children and adolescents include data for race groups not shown separately. Sources: Centers for Disease Control, National Center for Health Statistics, 1998, Health, United States, 1998, With Socioeconomic Status and Health Chartbook, Table 71; Estimates were calculated from the National Health Examination Survey (1963-1965 for ages 6 through 11, and 1966-1970 for ages 12 through 17) and from the National Health and Nutrition Examination Survey (NHANES; 1971-1974 for NHANES I, 1976-1980 for NHANES II, and 1988-1994 for NHANES III).
Figure HC 2.5 Percentage of overweighta adolescents (ages 12 through 17) in the United States, by gender and race: 1976-1980 and 1988-1994
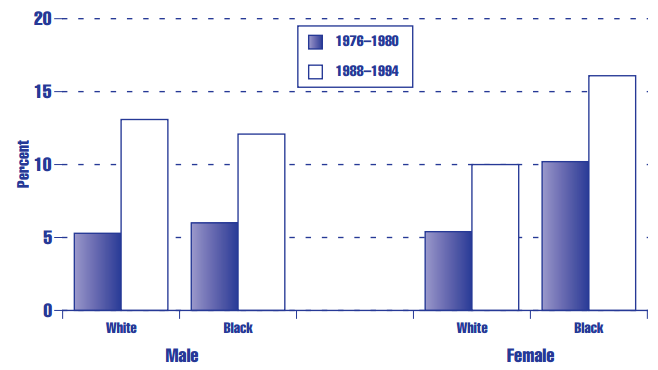
a Overweight is defined as body mass index (BMI) at or above the sex- and age-specific 95th percentile BMI cutoff points calculated at 6-month age intervals for children ages 6 through 11 [from the 1963-1965 National Health Examination Survey (NHES)] and for adolescents ages 12 through 17 (from the 1966-70 NHES). Age is at time of examination at mobile examination center. This definition differs from that reported in earlier versions of this report, which was based on children at or above the 85th percentile of BMI.
Source: Centers for Disease Control, National Center for Health Statistics, 1998, Health, United States, 1998.
30 Troiano, R.P., Flegal, K.M., Kuczmarski, R.J., Campbell, S.M., & Johnson, C.L. 1995. Overweight Prevalence and Trends for Children and Adolescents: The National Health and Nutrition Examination Surveys, 1963-1991. Archives of Pediatrics and Adolescent Medicine 149 (October).
31 Overweight is defined as body mass index (BMI) at or above the sex- and age-specific 95th percentile BMI cutoff points calculated at 6-month age intervals for children ages 6 through 11 [from the 1963-65 National Health Examination Survey (NHES)] and for adolescents ages 12 through 17 (from the 1966-70 NHES). Age is at time of examination at mobile examination center. This definition differs from that reported in earlier versions of this report, which was based on children at or above the 85th percentile of BMI.
HC 2.6 Abuse and Neglect
Abuse and neglect cause physical and/or emotional harm to children. They can produce short-term psychological consequences that range from poor peer relations to violent behavior, as well as untold long-term psychological and economic consequences when children reach adulthood.32 They can result in serious injury or, in extreme cases, death.
According to data from the most comprehensive annual data collection efforts undertaken to date, there were an estimated 903,395 child victims of maltreatment in 1998 (see Table HC 2.6). Of these cases, 23 percent were classified as physical abuse, 12 percent as sexual abuse, 54 percent as neglect, 2 percent as medical neglect, 6 percent as emotional maltreatment, and 26 percent as “other” or “unknown” types of maltreatment.33
Between 1990 and 1994, the total estimated number of victims increased by 20 percent from 860,577 to 1,029,118 in 1994. However, between 1994 and 1998, the total estimated number of victims fell by 12 percent from 1,209,118 to 903,395.
The number of victims shown in Table HC 2.6 may substantially understate the actual number of victims of maltreatment. In order for a child to be included in these counts, a report must first be made to child welfare authorities, an investigation undertaken, and a determination made that maltreatment occurred.
\Another data source, the third National Incidence Study of Child Abuse and Neglect, yields a much higher estimate of the total number of cases of child maltreatment—possibly as high as 2.8 million children in 1993. This study includes (1) all cases determined to be substantiated or indicated by child protective services34 and (2) cases known to community professionals but not necessarily reported to child protective services (in a representative sample of counties).
Differences by Race. Black children, who account for about 15 percent of the child population, constituted 25 percent of all child abuse and neglect victims in 1998. Whites accounted for 55 percent of all victims and Hispanics 12 percent of all victims (see Table HC 2.6).
Differences by Age. No age group accounts for an obviously disproportionate share of abuse and neglect victims. In 1998, infants age 1 and under accounted for 14 percent of all victims; children ages 2 to 5 accounted for 24 percent; children ages 6 to 9 accounted for 25 percent; children ages 10 to 13 accounted for 20 percent, and children ages 14 to 17 accounted for 15 percent (see Table HC 2.6).
Table HC 2.6 Victims of child maltreatment in the United States. Substantiated incidences by type of maltreatment, race/ethnicity, gender and age: 1990-1998
| 1990 | 1991 | 1992 | 1993 | 1994 | 1995 | 1996 | 1997 | 1998 | |
|---|---|---|---|---|---|---|---|---|---|
| Number of victims, per 1,000 childrena | 860,577 | 911,690 | 994,655 | 1,026,331 | 1,029,118 | 1,005,511 | 1,011,973 | 956,711 | 903,395 |
| Type of sustantiated maltreatmentb | |||||||||
| Neglect | 49 | 46 | 50 | 49 | 52 | 52 | 52 | 55 | 54 |
| Physical Abuse | 27 | 26 | 23 | 24 | 24 | 24 | 24 | 24 | 23 |
| Sexual Abuse | 17 | 16 | 14 | 14 | 14 | 13 | 12 | 12 | 12 |
| Psychological or Emotional | 7 | 6 | 5 | 5 | 5 | 4 | 6 | 6 | 6 |
| Abuse or Neglectc | 0 | 2 | 3 | 2 | 2 | 3 | 3 | 2 | 2 |
| Other and Unknown | 10 | 13 | 21 | 17 | 16 | 17 | 19 | 12 | 26 |
| Gender | |||||||||
| Male | 44 | 45 | 45 | 41 | 41 | 40 | 39 | 40 | 47 |
| Female | 50 | 52 | 51 | 47 | 46 | 45 | 43 | 44 | 51 |
| Unknown | 7 | 3 | 4 | 11 | 14 | 15 | 17 | 16 | 2 |
| Age of victimd | |||||||||
| 1 year and younger | 13 | 14 | 13 | 12 | 12 | 11 | 11 | 11 | 14 |
| 2 to 5 years old | 24 | 25 | 25 | 23 | 23 | 23 | 22 | 21 | 24 |
| 6 to 9 years old | 22 | 23 | 23 | 21 | 20 | 21 | 21 | 21 | 25 |
| 10 to 13 years old | 19 | 20 | 19 | 18 | 17 | 17 | 16 | 17 | 20 |
| 14-17 years old | 14 | 15 | 15 | 14 | 13 | 13 | 13 | 12 | 15 |
| 18 and over | 1 | 1 | 1 | 1 | 1 | 1 | 1 | 0 | 1 |
| Unknown | 8 | 4 | 5 | 12 | 14 | 15 | 18 | 18 | 2 |
| Race/ethnicity of victime | |||||||||
| White | 5 | 56 | 53 | 51 | 48 | 47 | 50 | 49 | 55 |
| African American | 25 | 27 | 27 | 25 | 25 | 24 | 22 | 22 | 25 |
| American Indian/Alaska Native | 1 | 1 | 1 | 1 | 1 | 1 | 2 | 2 | 2 |
| Asian/Pacific Islander | 1 | 1 | 1 | 1 | 1 | 1 | 1 | 1 | 1 |
| Other races | 1 | 2 | 2 | 1 | 1 | 2 | 3 | 3 | 2 |
| Hispanic origin | 10 | 10 | 10 | 9 | 9 | 9 | 9 | 9 | 12 |
| Unknown race | 9 | 5 | 6 | 13 | 15 | 16 | 14 | 25 | 14 |
a For the 50 states and the District of Columbia. The number of reporting states on which these estimates are based varies from year to year.
b More than one type of maltreatment may be substantiated per child. Therefore, the percentage total may add up to more than 100.
c Medical neglect was not reported in 1990.
d Some states have included persons ages 18 and older in their statistics on child abuse and neglect. Because these persons are considered victims of child maltreatment under the laws of their state, statistics in this table include these persons. Such individuals accounted for fewer than 1 percent of all victims.
Note: All data presented are from the National Child Abuse and Neglect Data System (NCANDS), which annually collects information from state child protective agencies. Because state agencies may modify or correct data submitted in a previous year, some findings differ from previously published data. Also, subgroup percentages may be based on data from fewer states than the number of states contributing to the total because all states do not provide demographic information. Source: U.S. Department of Health and Human Services, Children's Bureau, 2000.
32 Many studies have demonstrated a correlation between child abuse and neglect and serious adult problems, including violence, incarceration, and mental illness. However, these studies have not been able to separate the effects of child abuse and neglect from other factors that are correlated with it, including poverty, education, parenting skills, etc.
33 These percentages add up to over 100 because individual cases may include more than one type of maltreatment.
34 According to the National Incidence Study, in 1993, only 28 percent of maltreatment cases identified by the study were investigated—a significant decrease from the 44 percent investigated in 1986. The cause of this drop is not clear.
HC 2.7 Suicidal Teens: Youth Who Have Thought Seriously About or Attempted Suicide
Suicide is a major cause of death among youth (see Section HC 1.5). Attempted suicide has been related to mental health problems including depression and adjustment or stress reactions, as well as to substance abuse.35
In 1999, 19 percent of youth in grades 9 through 12 report having seriously considered suicide during the previous 12 months (see Table HC 2.7.A). During the same time period, 8 percent report having actually attempted suicide during the previous year (see Table HC 2.8.B). These rates are considerably higher than the proportion of youth who actually commit suicide (see Section HC 1.5).
Differences by Race and Hispanic Origin.36 In 1999, black youth report the lowest rates of considering suicide at 15 percent. Eighteen percent of whites report having seriously considered suicide in the previous year. Hispanic youth report the highest rates of considering suicide, at 20 percent. (See Table HC 2.7.A.) Rates of reported attempted suicide range from 7 percent for whites and blacks to 13 percent for Hispanics (see Table HC 2.7.B).
Differences by Gender. In 1999, female youth were more likely than male youth to report having thought seriously about suicide (25 percent versus 14 percent) and having attempted suicide (11 percent versus 6 percent) during the previous year (see Figure HC 2.7). However, the rate of actual suicides, particularly among teens ages 15 to 19, is considerably higher for males than for females, as discussed in Section HC 1.5.
Table HC 2.7.A Percentage of teens in the United States in grades 9 through 12 who report having seriously considered suicide in the previous 12 months, by gender, grade, and race and Hispanic origin:a Selected years, 1990-1999
| 1990 | 1991 | 1993 | 1995 | 1997 | 1999 | |
|---|---|---|---|---|---|---|
| Total | 27 | 29 | 24 | 24 | 21 | 19 |
| Male | 21 | 21 | 19 | 18 | 15 | 14 |
| Female | 34 | 37 | 30 | 30 | 27 | 25 |
| Grade | ||||||
| Ninth | 30 | 29 | 24 | 26 | 22 | 18 |
| Tenth | 26 | 29 | 25 | 25 | 22 | 22 |
| Eleventh | 29 | 32 | 25 | 26 | 21 | 18 |
| Twelfth | 23 | 26 | 23 | 20 | 18 | 18 |
| Race and Hispanic origina | ||||||
| White | 28 | 30 | 24 | 25 | 20 | 18 |
| Black | 20 | 22 | 20 | 20 | 16 | 15 |
| Hispanic | 30 | 27 | 26 | 25 | 23 | 20 |
a Estimates for whites and blacks exclude Hispanics of those races. Persons of Hispanic origin may be of any race.
Sources: Centers for Disease Control and Prevention, 1990-1991 Youth Risk Behavior Surveillance System, Table 1, p. 9; table 1, p. 66; Kann, et al., 1995: Table 10, p. 32; Kann, et al., 1996: Table 10, p. 41; Kann, et al., 1998, Table 10, p. 47.
Table HC 2.7.B Percentage of teens in the United States in grades 9 through 12 who report having attempted suicide in the previous 12 months, by gender, grade, and race and Hispanic origin:a Selected years, 1990-1999
| 1990 | 1991 | 1993 | 1995 | 1997 | 1999 | |
|---|---|---|---|---|---|---|
| Total | 8 | 7 | 9 | 9 | 8 | 8 |
| Male | 6 | 4 | 5 | 6 | 5 | 6 |
| Female | 10 | 11 | 13 | 12 | 12 | 11 |
| Grade | ||||||
| Ninth | 9 | 9 | 10 | 11 | 11 | 10 |
| Tenth | 9 | 8 | 9 | 10 | 9 | 11 |
| Eleventh | 8 | 6 | 8 | 9 | 8 | 6 |
| Twelfth | 7 | 6 | 7 | 6 | 5 | 6 |
| Race and Hispanic origina | ||||||
| White | 8 | 7 | 8 | 8 | 6 | 7 |
| Black | 7 | 7 | 8 | 10 | 7 | 7 |
| Hispanic | 12 | 8 | 14 | 13 | 11 | 13 |
a Estimates for whites and blacks exclude Hispanics of those races. Persons of Hispanic origin may be of any race.
Sources: Centers for Disease Control and Prevention, 1990-1991 Youth Risk Behavior Surveillance System, Table 1, p. 9; Table 1, p. 66; Kann, 1995, Table 10, p. 32; Kann, 1996, Table 10, p. 41; Kann, L., 1998, Table 10, p. 47.
Figure HC 2.7 Percentage of teens in the United States in grades 9 through 12 who report having seriously considered suicide or attempted suicide in the previous 12 months, by gender: 1999
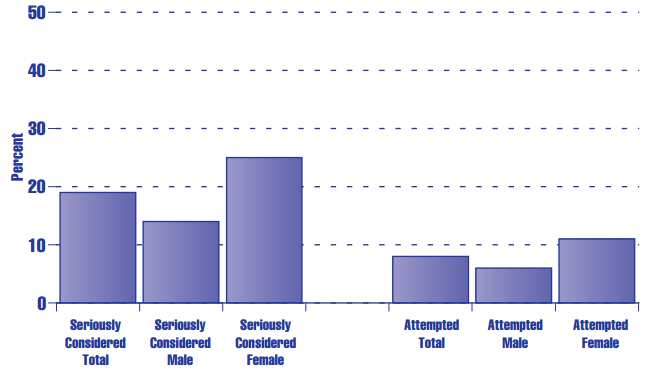
Sources: Centers for Disease Control and Prevention. Kann, 1998: Table 10, p. 47.
35 Alcohol, Drug Abuse, and Mental Health Administration. 1989. Report of the Secretary’s Task Force on Youth Suicide. Publication No. (ADM)899-1621. Washington, D.C.: U.S. Department of Health and Human Services, 1989. Cited in Healthy People 2000: National Health Promotion and Disease Prevention Objectives, Conference Edition. U.S. Department of Health and Human Services.
36 Estimates for white and black youth exclude Hispanics of those races.
HC 2.8 Activity Limitations
Activity limitations refer to long-term reductions in activities resulting from a chronic disease or impairment.37 Two types of activity limitations are examined here: limitations in major activities and limitations in any activity. A person is classified as having an activity limitation if he or she reports (1) an inability to perform the major activity for a person in his or her age group, (2) being able to perform the major activity but being limited in the kind or amount of this activity, or (3) not being limited in the major activity but being limited in the kind or amount of other activities. For children under age 5, the major activity consists of ordinary play. For children ages 5 to 17, the major activity is attending school. Children are classified as being limited in a major activity if they are unable to engage in the major activity or are limited in the kind or amount of this activity (classifications (1) and (2) above).
In 1996, 6.1 percent of all children under age 18 had a chronic condition that limited their activity (see Table HC 2.8.A), while 4.4 percent were limited in a major activity due to a chronic condition (see Table HC 2.8.B).
Differences by Age. Children ages 5 through 17 are more likely to experience an activity limitation due to a chronic condition than are younger children. In 1997, 3.4 percent of children under age 5 had an activity limitation due to a chronic condition, compared with 6.4 percent of older children. These differences by age can be seen across family income, gender, race, and Hispanic origin categories (see Table HC 2.8.A).
Differences by Gender. Males have consistently accounted for a greater percentage of children under 18 with an activity limitation due to a chronic condition. In 1997, 8.3 percent of males, compared with 4.7 percent of females, had activity limitations that were caused by a chronic condition (see Table HC 2.8.A). Looking only at limitations in major activities in 1996, 5.5 percent of males under age 18 had such limitations, compared with 3.2 percent of females (see Figure HC 2.8.B).
Differences by Race and Hispanic Origin.38 In 1996, 8.4 percent of black children under age 18 had any activity limitation, compared with 5.7 percent of white children and 6.3 percent of Hispanic children (see Table HC 2.9.A). Black children also suffered from restrictions in their major activities more frequently than white children (see Figure HC 2.8.B).
Differences by Income. Children under age 18 who were below the poverty line were much more likely to have an activity limitation than nonpoor children in 1997: 8.8 versus 6.4 percent (see Figure HC 2.8 A). Even for children under age 5, who in general have fewer limitations than older children, the disparity between the poor and nonpoor incidence of activity limitation is striking: 3.2 percent of nonpoor children and 4.5 percent of poor children were limited in some activity.
Table HC 2.8.A Percentage of children under age 18 in the United States with any activity limitationa due to a chronic condition,b by family income, age, gender, poverty status, and race and Hispanic origin:c Selected years 1984-1997
| 1984 | 1990 | 1991 | 1992 | 1993 | 1994 | 1995 | 1996 | 1997 | |
|---|---|---|---|---|---|---|---|---|---|
| Under 18 total | 5.0 | 4.9 | 5.8 | 6.1 | 6.6 | 6.7 | 6.0 | 6.1 | 6.5 |
| Gender | |||||||||
| Male | 5.9 | 5.6 | 6.8 | 7.1 | 7.8 | 7.9 | 7.4 | 7.4 | 8.3 |
| Female | 4.0 | 4.2 | 4.7 | 5.0 | 5.3 | 5.6 | 4.6 | 4.7 | 4.7 |
| Race and Hispanic originc | |||||||||
| White, non-Hispanic | 4.9 | 5.0 | 5.8 | 6.0 | 6.7 | 6.6 | 6.0 | 5.7 | 7.0 |
| Black, non-Hispanic | 5.6 | 5.5 | 6.7 | 7.5 | 7.7 | 8.9 | 7.3 | 8.4 | 7.3 |
| Hispanic | 4.7 | 4.1 | 5.5 | 5.3 | 5.6 | 5.7 | 5.8 | 6.3 | 4.8 |
| Poverty status | |||||||||
| Below poverty | 7.1 | 6.7 | 8.8 | 9.2 | 9.5 | 9.7 | 9.2 | 9.7 | 8.8 |
| At or above poverty | 4.4 | 4.6 | 5.1 | 5.3 | 5.9 | 6.0 | 5.4 | 5.3 | 6.4 |
| Under 5 total | 2.5 | 2.2 | 2.4 | 2.8 | 2.8 | 3.1 | 2.7 | 2.6 | 3.4 |
| Gender | |||||||||
| Male | 2.7 | 2.6 | 2.7 | 3.3 | 3.1 | 3.4 | 3.3 | 3.3 | 4.2 |
| Female | 2.3 | 1.7 | 2.1 | 2.2 | 2.5 | 2.7 | 2.0 | 1.7 | 2.7 |
| Race and Hispanic originc | |||||||||
| White, non-Hispanic | 2.3 | 2.1 | 2.4 | 2.5 | 2.4 | 2.7 | 2.7 | 1.8 | 3.6 |
| Black, non-Hispanic | 3.3 | 2.9 | 3.2 | 4.2 | 4.7 | 5.0 | 3.5 | 4.8 | 4.5 |
| Hispanic | 2.5 | 2.0 | 1.8 | 2.5 | 2.7 | 3.1 | 2.5 | 3.5 | 2.4 |
| Poverty status | |||||||||
| Below poverty | 4.0 | 3.0 | 4.3 | 4.5 | 4.3 | 5.2 | 3.9 | 4.9 | 4.5 |
| At or above poverty | 2.0 | 2.0 | 2.0 | 2.3 | 2.4 | 2.5 | 2.4 | 1.7 | 3.2 |
| Ages 5-17 total | 6.1 | 6.1 | 7.2 | 7.5 | 8.1 | 8.2 | 7.4 | 7.5 | 6.4 |
| Gender | |||||||||
| Male | 7.3 | 6.9 | 8.5 | 8.7 | 9.8 | 9.7 | 9.0 | 9.0 | 9.9 |
| Female | 4.8 | 5.2 | 5.9 | 6.2 | 6.4 | 6.7 | 5.6 | 5.9 | 5.5 |
| Race and Hispanic originc | |||||||||
| White, non-Hispanic | 6.0 | 6.2 | 7.1 | 7.4 | 8.4 | 8.1 | 7.2 | 7.1 | 8.2 |
| Black, non-Hispanic | 6.7 | 6.7 | 8.2 | 9.0 | 9.0 | 10.6 | 8.9 | 9.8 | 8.3 |
| Hispanic | 5.8 | 5.1 | 7.2 | 6.7 | 7.1 | 7.0 | 7.5 | 7.7 | 5.9 |
| Poverty status | |||||||||
| Below poverty | 8.7 | 8.5 | 11.0 | 11.7 | 12.2 | 11.9 | 11.8 | 12.1 | 10.7 |
| At or above poverty | 5.5 | 5.6 | 6.4 | 6.6 | 7.2 | 7.4 | 6.5 | 6.6 | 7.5 |
a Persons are classified in terms of the major activity usually associated with their particular age group. The major activities for children are ordinary play for children under 5 years of age and attending school for those 5-17 years of age. A person is classified as having an activity limitation if he or she is unable to perform the major activity, is able to perform the major activity but is limited in the kind or amount of this activity, or is not limited in the major activity but is limited in the kind or amount of other activities.
b A condition is considered chronic if the respondent indicates it was first noticed more than 3 months before the reference date of the interview, or it is a type of condition that ordinarily has a duration of more than 3 months.
c Estimates for whites and blacks exclude Hispanics of those races. Persons of Hispanic origin may be of any race.
Sources: Data from the National Health Interview Survey, National Center for Health Statistics (provided by the Centers for Disease Control and Prevention and as published in America's Children: Key National Indicators of Well-Being, 1998, Federal Interagency Forum on Child and Family Statistics, Table HEALTH2, available online at http://childstats.gov/ac1998/xhealth2.htm); Benson, & Marono, 1995. Previous issues of this report [Series 10, 181, 184, 189, and 193)].
Table HC 2.8.B Percentage of children under age 18 in the United States with any activity limitation in a major activitya due to a chronic condition,b by gender and race: Selected years, 1983-1996
| 1983 | 1985 | 1990 | 1991 | 1992 | 1993 | 1994 | 1995 | 1996 | |
|---|---|---|---|---|---|---|---|---|---|
| Total | 3.5 | 3.7 | 3.6 | 4.2 | 4.4 | 4.6 | 4.9 | 4.3 | 4.4 |
| Gender | |||||||||
| Male | 4.2 | 4.4 | 4.2 | 5.0 | 5.2 | 5.6 | 6.0 | 5.5 | 5.5 |
| Female | 2.8 | 2.9 | 3.0 | 3.3 | 3.7 | 3.5 | 3.8 | 3.1 | 3.2 |
| Race | |||||||||
| White | 3.4 | 3.5 | 3.5 | 4.1 | 4.3 | 4.5 | 4.7 | 4.2 | 4.1 |
| Black | 4.5 | 4.6 | 4.2 | 5.2 | 6.0 | 5.7 | 6.7 | 5.5 | 6.2 |
a Persons are classified in terms of the major activity usually associated with their particular age group. The major activities for children are ordinary play for children under 5 years of age and attending school for those 5-17 years of age. A person is classified as having an activity limitation in a major activity if he or she is unable to perform the major activity or is able to perform the major activity but is limited in the kind or amount of this activity.
b A condition is considered chronic if the respondent indicates it was first noticed more than 3 months before the reference date of the interview, or it is a type of condition that ordinarily has a duration of more than 3 months.
Sources: Unpublished data from the National Health Interview Survey, National Center for Health Statistics; Benson, & Marono, 1996, Table 67; Previous issues of this report. [Series 10, 154, 163, 181, 184, 189, 190, and 193 (Table 67 in each)].
Figure HC 2.8.A Percentage of children under age 18 in the United States with any activity limitationa due to a chronic condition,b by poverty status: 1984-1997
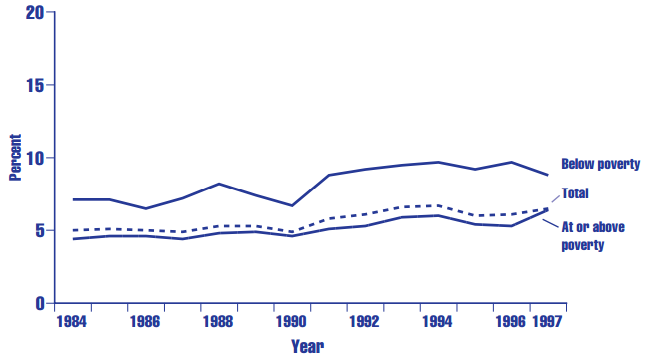
a Persons are classified in terms of the major activity usually associated with their particular age group. The major activities for children are ordinary play for children under 5 years of age and attending school for those 5-17 years of age. A person is classified as having an activity limitation if he or she is unable to perform the major activity, is able to perform the major activity but is limited in the kind or amount of this activity, or is not limited in the major activity but is limited in the kind or amount of other activities.
b A condition is considered chronic if the respondent indicates it was first noticed more than 3 months before the reference date of the interview, or it is a type of condition that ordinarily has a duration of more than 3 months.
Sources: Data from the National Health Interview Survey, National Center for Health Statistics (provided by the Centers for Disease Control and Prevention and as published in America's Children: Key National Indicators of Well-Being, 1998, Federal Interagency Forum on Child and Family Statistics, Table HEALTH2, available online at http://childstats.gov/ac1998/xhealth2.htm); Benson, & Marono, 1995. Previous issues of this report [Series 10, 181, 184, 189, and 193)].
Figure HC 2.8.B Percentage of children under age 18 in the United States with an activity limitation in a major activitya due to a chronic condition,b by gender and by race: 1996
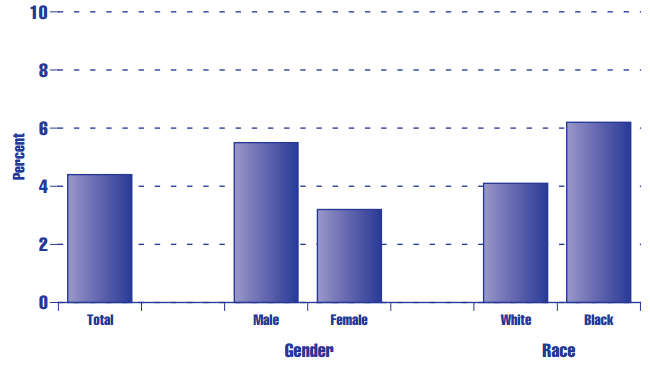
a Persons are classified in terms of the major activity usually associated with their particular age group. The major activities for children are ordinary play for children under 5 years of age and attending school for those 5-17 years of age. A person is classified as having an activity limitation in a major activity if he or she is unable to perform the major activity or is able to perform the major activity but is limited in the kind or amount of this activity.
b A condition is considered chronic if the respondent indicates it was first noticed more than 3 months before the reference date of the interview, or it is a type of condition that ordinarily has a duration of more than 3 months.
Source: Unpublished data from the National Health Interview Survey, National Center for Health Statistics.
37 A disease or impairment is classified as chronic if it has been apparent for at least 3 months or is a new condition that will ordinarily last for more than 3 months.
38 Estimates for white and black children exclude Hispanics of those races.
HC 2.9 Serious Violent Victimization of Teens
Serious violent crimes include aggravated assaults,39 rape, and robbery (stealing by force or threat of violence). In order to keep track of the incidence of these and other crimes, the Bureau of Justice Statistics has been administering the National Crime Victimization Survey on an annual basis since 1972.
Among youth ages 12 to 17, rates of victimization for violent crimes remained relatively constant from 1980 to 1994, ranging from 34.3 to 43.8 per thousand.40 Between 1994 and 1998, the rate dropped from 41.3 to 24.6 per 1,000 (see Table HC 2.9).
Differences by Gender. Male youth are considerably more likely than female youth to be victims of violent crimes. In 1998, 32.2 per 1,000 males ages 12 through 17 were victims of violent crimes, compared with 16.5 per 1,000 females (see Figure HC 2.9).
Differences by Race. The rate of violent victimization of white teens ranged from 25.5 to 40.1 per 1,000 between 1980 and 1998, in comparison to 30.4 to 77.0 per 1,000 for black youth. Black youth have consistently been more likely than white youth to be victims of violent crimes. In 1998, 31.0 black youths per 1,000 were victims of violent crime, compared with 24.2 per 1,000 among white youth ages 12 through 17 (see Table HC 2.9).
Table HC 2.9 Serious violent victimizationa of youth ages 12 through 17 in the United States (rates per 1,000), by age, race, and gender: Selected years, 1980-1998
| 1980 | 1985 | 1990 | 1991 | 1992 | 1993 | 1994 | 1995 | 1996 | 1997 | 1998 | |
|---|---|---|---|---|---|---|---|---|---|---|---|
| Age | |||||||||||
| 12-17 years | 37.6 | 34.3 | 43.2 | 40.7 | 38.8 | 43.8 | 41.3 | 28.3 | 30.3 | 27.1 | 24.6 |
| 12-14 years | 33.4 | 28.1 | 41.2 | 37.8 | 37.6 | 38.0 | 34.5 | 26.7 | 24.9 | 23.5 | 20.4 |
| 15-17 years | 41.4 | 40.3 | 45.2 | 43.6 | 40.1 | 49.9 | 48.5 | 30.0 | 35.8 | 30.7 | 28.6 |
| Race | |||||||||||
| White | 34.1 | 34.4 | 37.0 | 40.1 | 35.2 | 40.0 | 38.0 | 25.5 | 27.7 | 27.6 | 24.2 |
| Black | 60.2 | 35.2 | 77.0 | 48.0 | 54.3 | 71.5 | 63.0 | 44.5 | 43.4 | 30.4 | 31.0 |
| Other | 21.7 | 28.8 | 37.3 | 25.0 | 48.7 | 17.6 | 27.5 | 23.7 | 31.2 | 9.7 | 11.7 |
| Gender | |||||||||||
| Male | 54.8 | 49.8 | 60.5 | 60.7 | 49.8 | 53.9 | 51.5 | 39.0 | 40.4 | 33.1 | 32.2 |
| Female | 19.7 | 18.2 | 24.9 | 19.6 | 27.2 | 33.1 | 30.6 | 17.0 | 19.7 | 20.8 | 16.5 |
a Serious violent victimization is defined as being a victim of a violent crime, including aggravated assaults, rape, and robbery (stealing by force or threat of violence).
Notes: Because of changes made in the victimization survey, data prior to 1992 are adjusted to make them comparable with data collected under the redesigned methodology. Victimization rates were calculated using population estimates from the U.S. Bureau of the Census, Current Population Reports. Such population estimates normally differ somewhat from population estimates derived from survey data. The rates may therefore differ marginally from rates based upon survey-derived population estimates.
Source: U.S. Bureau of Justice Statistics, National Crime Victimization Survey, 1980-1997, Table BEH4.A.
Figure HC 2.9 Serious violent victimizationa of youth ages 12 through 17 in the United States (rates per 1,000), by gender: 1980-1998
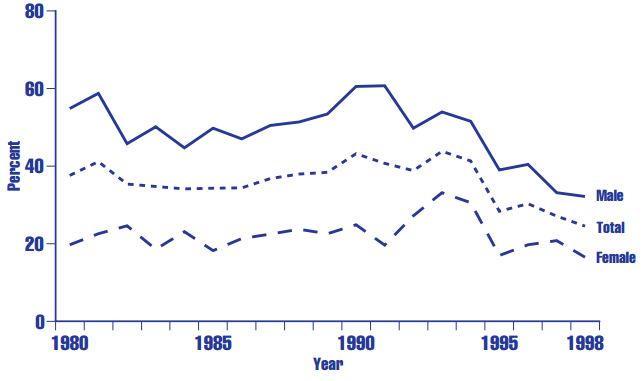
a Serious violent victimization is defined as being a victim of a violent crime, including aggravated assaults, rape, and robbery (stealing by force or threat of violence).
Notes: Because of changes made in the victimization survey, data prior to 1992 are adjusted to make them comparable with data collected under the redesigned methodology. Victimization rates were calculated using population estimates from the U.S. Bureau of the Census, Current Population Reports. Such population estimates normally differ somewhat from population estimates derived from survey data. The rates may therefore differ marginally from rates based upon surveyderived population estimates.
Source: Source: U.S. Bureau of Justice Statistics, National Crime Victimization Survey, 1980-1997, and unpublished tables.
39 Previous editions of this report have included simple assaults in the rates of violent victimization.
40 The estimate of 34.1, for 1984, is not shown in Table HC 2.10 but does appear in Figure HC 2.10.
HC 2.10 Dental Caries
“Dental caries” refers to decay in one or more teeth. Proper preventive care reduces the incidence of dental caries. The presence of dental caries may indicate a lack of access to preventive care or a lack of information about preventive techniques.41 Additionally, children who do not receive restorative treatment for existing dental caries may experience much pain and suffering and may frequently miss school, and the functioning of their teeth may be permanently harmed.42
Differences by Race/Ethnicity.43 Mexican American children ages 2 through 5 had the highest prevalence of dental caries in their primary teeth (see Figure HC 2.10). From 1988 to 1994, one-third of Mexican American children had dental caries, compared with 24.2 percent of non-Hispanic black children and 13.6 percent of non-Hispanic white children. Mexican American and non-Hispanic black children ages 6 through 14 were about twice as likely as non-Hispanic white children to have dental caries in their permanent teeth (see Figure HC 2.10).
Differences by Poverty Status. The prevalence of dental caries is disproportionately concentrated among children from low-income families. Among children ages 2 to 5, 29.7 percent of poor children had caries in their primary teeth, compared to 14.4 percent of nonpoor children. Among older children, 19.5 percent of poor children had caries in their permanent teeth, while 8.6 of non-poor children did (see Table HC 2.10). Additionally, poor children, who are less likely than other children to receive dental services, are at a higher risk of suffering from untreated dental caries.44,45
Figure HC 2.10 Percentage of children ages 2 through 14 in the United States with untreated dental caries, by age and race/ethnicity:a 1988-1994
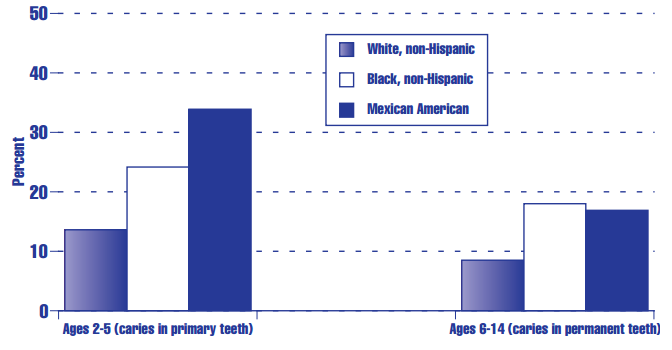
a Estimates for whites and blacks exclude Hispanics of those races.
Sources: Unpublished estimates from the Third National Health and Nutrition Survey (conducted between 1988 and 1994) calculated by the Division of Epidemiology, Office of Analysis, Epidemiology and Health Promotion, National Center for Health Statistics, Centers for Disease Control. Vargas, Crall, and Schneider, 1998, 1229-1238 (Tables 2 and 5).
Table HC 2.10 Percentage of children ages 2 through 14 in the United States with untreated dental caries, by age, race/ethnicity, and poverty status:a 1988-1994
| Total | Above poverty level | At or below poverty level | |
|---|---|---|---|
| Ages 2-5 (caries in primary teeth) | |||
| All children | 18.7 | 14.4 | 29.7 |
| White, non-Hispanic | 13.6 | 11.3 | 25.6 |
| Black, non-Hispanic | 24.2 | 21.8 | 26.4 |
| Mexican American | 33.9 | 30.2 | 37.7 |
| Ages 6-14 (caries inpermanent teeth) | |||
| All children | 11.3 | 8.6 | 19.5 |
| White, non-Hispanic | 8.5 | 7.2 | 15.8 |
| Black, non-Hispanic | 18.0 | 16.7 | 19.8 |
| Mexican American | 16.9 | 12.0 | 22.2 |
a Estimates for whites and blacks exclude Hispanics of those races.
Sources: Unpublished estimates from the Third National Health and Nutrition Survey (conducted between 1988 and 1994) calculated by the Division of Epidemiology, Office of Analysis, Epidemiology and Health Promotion, National Center for Health Statistics, Centers for Disease Control; Vargas, Crall, & Schneider, 1998.
41 Kaste, L.M., Selwitz, R.H., Oldakowski, R.J., Brunelle, J.A., Winn, D.M., & Brown, L.J. 1996. Coronal Caries in the Primary and Permanent Dentition of Children and Adolescents 1-17 Years of Age: United States 1988-1991. Journal of Dental Research 75 (Spec Iss): 631-641.
42 Lewit, E.M., & Kerrebrock, N. 1998. Child Indicators: Dental Health. The Future of Children 8 (1): 133-142.
43 Estimates for whites and blacks exclude Hispanics of those races.
44 Vargas, C.M., Crall, J.J., & Schneider, D.A. 1998. Sociodemographic Distribution of Pediatric Dental Caries: NHANES III, 1988-1994. Journal of the American Dental Association 129: 1229-1238 (Tables 2 and 5).
45 Lewit, 1998.
HC 2.11 Children and Adolescents with HIV/AIDS
Pediatric AIDS. Through December 1999, 8,718 case of AIDS among children younger than 13 years of age have been reported in the United States. Of those, 5,084 have died. Pediatric AIDS cases represent 1.2 percent of all the cumulative cases (733,374) reported to the Centers for Disease Control and Prevention (CDC). The vast majority of children with AIDS (91 percent) resulted from transmission of HIV before or during birth, or what is known as perinatal transmission.
The steep decline in perinatally acquired AIDS (Figure HC 2.11A) has been one of the dramatic changes of the 1990s. The number of perinatally acquired AIDS cases peaked in 1992 and has decreased 75 percent in recent years. Studies and surveillance data suggest that the implementation of Public Health Service guidelines for universal counseling and voluntary HIV testing of pregnant women and the use of zidovudine by pregnant women and administered to newborn infants account primarily for the decline. The rate of perinatal transmission is expected to continue to decline as a result of more aggressive courses of treatment (e.g., combination therapy) and more use of obstetric procedures, such as elective cesarean section, that reduce transmission.
Differences by Race and Hispanic Origin. Decreases in perinatally acquired AIDS have occurred in all racial and ethnic groups. However, in 1999, the highest rates of AIDS continue to be reported among children who are black, non- Hispanic, and Hispanics (Figure HC2.11B). The rate of AIDS among black children in 1999, 2.3 per 100,000 children, was 23 times higher than among white children (0.1 per 100,000) and nearly four times higher than among Hispanic children (0.6 per 100,000). Because the majority of pediatric cases of AIDS are attributed to perinatal HIV transmission, these rates also reflect the disproportionate racial/ethnic distribution of HIV and AIDS among black and Hispanic women.
Adolescent HIV/AIDS. As of the end of 1999, 3,725 adolescents (ages 13-19) have been reported with AIDS. Adolescent AIDS cases represent less than 1 percent of all cumulative cases (733,374) reported to the CDC. The number of adolescents reported with AIDS peaked in 1993 when the surveillance case definition was changed (Figure HC2.11C). In the earlier years, the vast majority of reported cases in adolescents were among males; however, the ratio of male to female cases has decreased over time. In 1999, 312 persons, 13-19 years old, were reported with AIDS; more females (180) than males (132) were reported with AIDS in this age group, in part, because the proportion of male cases who acquired HIV through receipt of blood products has diminished.
Data from HIV infection case surveillance present a more current view of the HIV/AIDS epidemic than AIDS case surveillance data alone. Currently, 31 states and the Virgin Islands conducted name-based confidential HIV infection surveillance of adults and adolescents. In 1999, these 32 areas reported 3,209 cases of HIV infection in adolescents and young adults ages 13-24, compared to 1,813 reported with AIDS. The HIV data are underestimates of the population of infected adolescents, as some states do not report HIVinfected persons to the CDC, and only persons who have been tested are reported. However, the number of adolescents reported with HIV is greater than those reported with AIDS because of the long period of time between infection and development of disease. Young adults with AIDS probably became infected as adolescents but did not develop AIDS or get reported as having AIDS until they were adults. This indicates the importance of targeting HIV prevention messages to youth even though the total numbers of AIDS cases reported in this age group is relatively small.
Black and Hispanic adolescents have been disproportionately affected by the HIV/AIDS epidemic. Although only 15 percent of the adolescent population in the United States is black, 60 percent of AIDS cases reported in 1999 among 13- to 19-year-olds were black. Hispanics compromise 14 percent of the population, 20 percent of all reported AIDS cases and 24 percent of reported adolescent AIDS cases in 1999.46 These patterns are likely to continue since HIV infection also disproportionately affects young black and Hispanic persons.
Figure HC 2.11.A Reported perinatally acquired AIDS cases among children under age 13 in the United States: 1985–1998
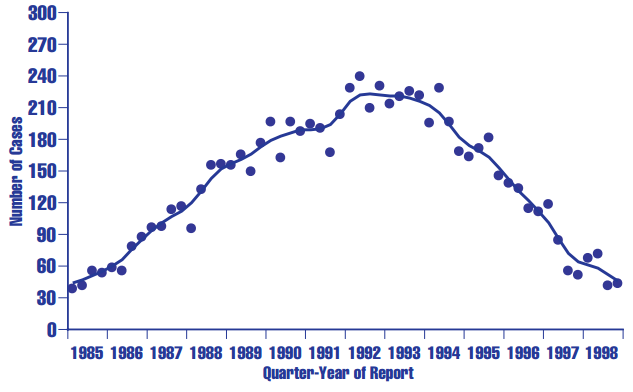
Note: Data are adjusted for reporting delays and unreported risk.
Source: Pediatric AIDS Surveillance, L262 slide series (through 1997). Division of HIV/AIDS Prevention, National Center for HIV, STD, and TB Prevention, Centers for Disease Control and Prevention. The slide series is available online at: http://www.cdc.gov/nchstp/hiv_aids/graphics/pediatri.htm.
Figure HC 2.11.B Reported AIDS rate (per 100,000) among children under age 13 in the United States, by race and Hispanic origin:a 1999
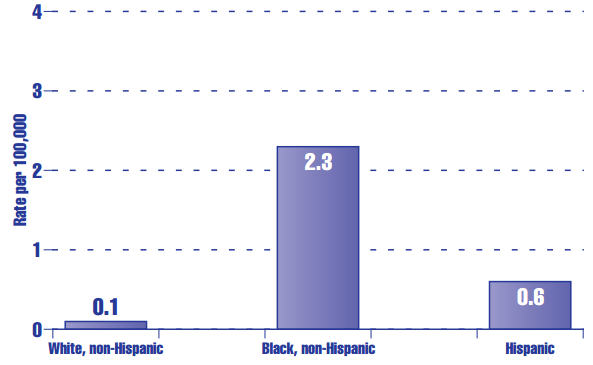
a Persons of Hispanic origin may be of any race
Source: Pediatric AIDS Surveillance, L262 slide series (through 1997). Division of HIV/AIDS Prevention, National Center for HIV, STD, and TB Prevention, Centers for Disease Control and Prevention. The slide series is available online at: http://www.cdc.gov/hiv
Figure HC 2.11.C AIDS cases in adolescents ages 13 through 19, by gender in the United States: 1985–1999
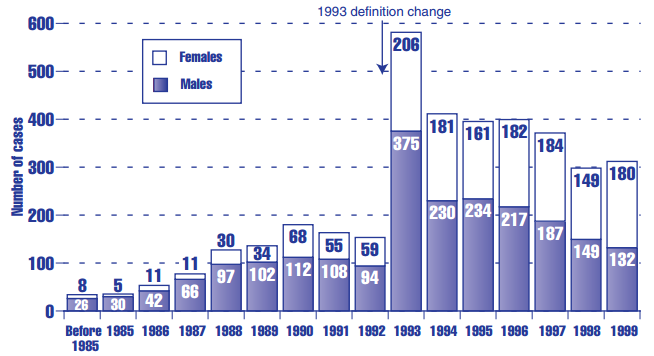
Source: Adolescent AIDS Surveillance, L265 slide series (through 1998). Division of HIV/AIDS Prevention, National Center for HIV, STD, and TB Prevention, Centers for Disease Control and Prevention. The slide series is available online at: http://www.cdc.gov/hiv
46 Pediatric AIDS Surveillance, L262 slide series (through 1997). Division of HIV/AIDS Prevention, National Center for HIV, STD, and TB Prevention, Centers for Disease Control and Prevention. The slide series is available online at: http://www.cdc.gov/nchstp/hiv_aids/graphics/pediatri.htm.b
HC 2.12 Sexually Transmitted Diseases Among Adolescents
Sexually Transmitted Diseases (STDs) have potentially severe consequences. Gonorrhea infections are a major cause of pelvic inflammatory disease, which in turn may lead to adverse reproductive consequences such as infertility, ectopic pregnancy, or the birth of children with physical and mental developmental disabilities. Syphilis facilitates the transmission of HIV and may be particularly important to contributing to HIV transmission in areas with high rates of both infections.47 The increase in sexual activity among teenagers described in Section SD 4.1 has exposed a growing number of young people to the risk of STDs. Despite this increased risk, the reported rate of incidence has declined among adolescents for both gonorrhea and syphilis.
Decline in Gonorrhea Rates. Gonorrhea rates have declined for all youth since 1975 (see Table HC 2.12.A). Among youth ages 15 through 19, rates decreased by more than half, from 1,275.1 cases of gonorrhea per 100,000 youth in 1975 to 560.6 cases per 100,000 youth in 1998. Gonorrhea rates also decreased among youth ages 10 through 14, but the decline started in more recent years and has not been as dramatic as among older youth. The rate for this age group was 46.7 per 100,000 in 1975, peaked at 68.9 cases in 1990, and, by 1998, had declined to 32.6 cases per 100,000.
Differences in Gonorrhea Rates by Gender. For youth ages 15 through 19 and ages 10 through 14, females have had consistently higher reported rates of gonorrhea than males (see Figure HC 2.12.A). In 1998, rates for females ages 15 through 19 were 779.7 per 100,000, versus 354.9 per 100,000 males of the same age.
Differences in Gonorrhea Rates by Race and Hispanic Origin.48 Blacks have consistently had the highest reported rates of gonorrhea, frequently more than 10 times the rate of any other racial or ethnic group. Rates for blacks have been falling since 1990 for both age groups (for ages 15 through 19, the rate dropped from 6,316.2 in 1990 to 2,950.8 per 100,000 in 1998). By contrast, in 1998 gonorrhea rates per 100,000 for 15- through 19-yearolds of other groups were 404.4 for American Indians/Alaska Natives, 233.2 for Hispanics, 127.3 for whites, and 71.4 for Asians (see Table HC 2.12.A).
Decline in Syphilis Rates. Table HC 2.12.B shows that reported rates for primary and secondary syphilis have decreased for youth ages 10 through 14 and 15 through 19 since their peak in 1990. The rate for teens ages 15 through 19 is substantially higher than the rate for youth ages 10 through 14. The reported rate for syphilis in 1998 for ages 15 through 19 was 3.2 cases per 100,000, compared with less than one case per 100,000 for ages 10 through 14.
Higher Syphilis Rates Among Females. Females from both age groups have reported more cases of syphilis than their male counterparts (see Figure HC 2.12.B). In 1998, females ages 15 through 19 had a rate of 4.5 cases per 100,000, more than double the male rate of 1.9 cases per 100,000.
Differences in Syphilis Rates by Race and Hispanic Origin.49 Black youth ages 15 through 19 have rates of syphilis more than 10 times higher than all other racial and ethnic groups throughout the period 1990 through 1998. Rates have been falling for all groups except American Indians/Alaska Natives, whose reported syphilis rates have fluctuated since 1990 (see Table HC 2.12.B).
Figure HC 2.12.A Reported rates of gonorrheaa for youth ages 15 through 19 in the United States, by gender (per 100,000 population ages 15 through 19): Selected years, 1975-1998
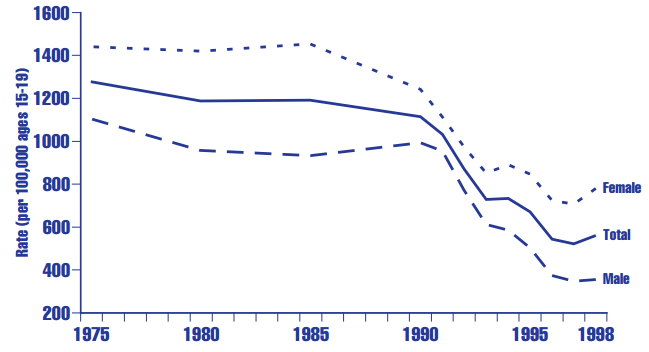
a Although most areas generally adhere to the case definitions for STDs found in Case Definitions for Public Health Surveillance (Morbidity and Mortality Weekly Report 1990; 39: 1-43), there are significant differences between individual areas in case definitions as well as in the policies and systems for collecting surveillance data. In many areas, reporting from publicly supported institutions (e.g., STD clinics) was more complete than from other sources (e.g., private practitioners).
Sources: Data for 1975 from Centers for Disease Control and Prevention, Division of STD Prevention, 1996, Table 7; data for 1980 and 1985 from Centers for Disease Control and Prevention, Division of STD Prevention, 1987, Table 3; data for 1990-1992 from Division of STD/HIV Prevention, December 1994, Table 9.B; data for 1993 from Division of STD Prevention, 1997, Table 12.B; data for 1994-1997 from Division of STD Prevention, 1999, Table 12B.
Table HC 2.12.A Reported rates of youth gonorrheaa in the United States, by age, gender, and race and Hispanic origin (per 100,000 population): Selected years, 1975–1998
| 1975 | 1980 | 1985 | 1990 | 1995 | 1996 | 1997 | 1998 | |
|---|---|---|---|---|---|---|---|---|
| Ages 10-14 | ||||||||
| Total | 46.7 | 48.7 | 47.7 | 68.9 | 41.3 | 33.2 | 30.7 | 32.6 |
| Gender | ||||||||
| Male | 20.9 | 23.6 | 23.8 | 32.1 | 12.4 | 9.1 | 8.5 | 8.5 |
| Female | 73.6 | 74.8 | 72.9 | 107.5 | 71.7 | 58.6 | 54.1 | 58.0 |
| Race and Hispanic originb,c | ||||||||
| White | — | — | — | 14.3 | 8.9 | 7.5 | 7.2 | 6.8 |
| Black | — | — | — | 386.8 | 237.0 | 179.8 | 162.2 | 175.9 |
| Hispanic | — | — | — | 15.3 | 19.3 | 15.8 | 15.0 | 14.0 |
| Asian/Pacific | — | — | — | 4.5 | 5.6 | 3.3 | 3.5 | 3.5 |
| Islander American Indian/Alaska Native | — | — | — | 22.7 | 19.0 | 21.7 | 23.7 | 25.1 |
| Ages 15-19 | ||||||||
| Total | 1,275.1 | 1,187.3 | 1,189.9 | 1,114.4 | 671.0 | 543.6 | 521.6 | 560.6 |
| Gender | ||||||||
| Male | 1,103.9 | 953.4 | 930.5 | 993.7 | 503.2 | 373.6 | 348.1 | 354.6 |
| Female | 1,446.4 | 1,424.6 | 1,455.1 | 1,241.6 | 847.8 | 724.5 | 706.2 | 779.7 |
| Race and Hispanic originb,c | ||||||||
| White | — | — | — | 230.3 | 145.1 | 125.8 | 117.4 | 127.3 |
| Black | — | — | — | 6,316.2 | 3,815.3 | 2,904.8 | 2,780.0 | 2,950.8 |
| Hispanic | — | — | — | 268.7 | 270.3 | 222.7 | 223.5 | 233.2 |
| Asian/Pacific Islander | — | — | — | 70.0 | 81.0 | 64.1 | 68.6 | 71.4 |
| American | ||||||||
| Indian/Alaska Native | — | — | — | 414.6 | 296.2 | 329.0 | 342.9 | 404.4 |
a Although most areas generally adhere to the case definitions for STDs found in "Case Definitions for Public Health Surveillance" (Morbidity and Mortality Weekly Report 1990; 39: 1-43), there are significant differences between individual areas in case definitions.
b For the following years, the states/areas listed did not report race/ethnicity for most cases: 1990 (Baltimore, New Jersey, New York City, New York State, and Kentucky); 1991 (Baltimore, New York City, New York State, and Kentucky); 1992 (New York City and New York State); 1993 (New York City, New York State, and Georgia); 1994 (New York City, New York State, and Georgia); 1995 (Georgia, New Jersey, New York City, and New York State); and 1996 (New Jersey, New York City, and New York State); 1997 (Idaho, New Jersey, New York City, and New York State), and 1998 (Idaho and New Jersey). Massachusetts did not report age for most cases in 1990. Cases and population denominators have been excluded for these states/areas for the appropriate years.
c Estimates for whites and blacks exclude Hispanics of those races. Persons of Hispanic origin may be of any race.
Sources: Data for 1975 from Centers for Disease Control and Prevention, 1996, Table 7; data for 1980 and 1985 from Centers for Disease Control and Prevention, 1987; Table 3; data for 1990-1992 from Division of STD/HIV Prevention, 1994; Table 9.B; data for 1993 from Division of STD Prevention, 1997; Table 12.B; data for 1994-1998 from Division of STD Prevention, 1999. Table 12B.
Table HC 2.12.B Reported rates of youth primary and secondary syphillisa in the United States, by age, gender, and race and Hispanic origin (per 100,000 population): Selected years, 1975-1998
| 1975 | 1980 | 1985 | 1990 | 1991b | 1992 | 1993b | 1994 | 1995 | 1996b | 1997b | 1998 | |
|---|---|---|---|---|---|---|---|---|---|---|---|---|
| Ages 10-14 | ||||||||||||
| Total | 1.1 | 0.9 | 0.9 | 1.8 | 1.4 | 1.3 | 0.9 | 0.6 | 0.6 | 0.3 | 0.2 | 0.2 |
| Gender | ||||||||||||
| Male | 0.7 | 0.5 | 0.5 | 0.5 | 0.4 | 0.3 | 0.3 | 0.1 | 0.1 | 0.1 | 0.0 | 0.1 |
| Female | 1.5 | 1.3 | 1.4 | 3.2 | 2.5 | 2.3 | 1.6 | 1.2 | 1.0 | 0.5 | 0.4 | 0.4 |
| Race and Hispanic originc | ||||||||||||
| White | — | — | — | 0.1 | 0.1 | 0.1 | 0.1 | 0.1 | 0.0 | 0.0 | 0.0 | 0.0 |
| Black | — | — | — | 10.6 | 8.6 | 8.1 | 5.9 | 3.8 | 3.5 | 1.6 | 1.3 | 1.2 |
| Hispanic | — | — | — | 1.1 | 0.4 | 0.4 | 0.1 | 0.1 | 0.1 | 0.1 | 0.1 | 0.0 |
| Asian/Pacific Islander | — | — | — | 0.2 | 0.3 | 0.0 | 0.2 | 0.0 | 0.0 | 0.0 | 0.0 | 0.0 |
| American Indian/Alaska Native | — | — | — | 0.5 | 0.0 | 0.0 | 0.0 | 0.0 | 0.0 | 0.0 | 0.0 | 0.0 |
| Ages 15-19 | ||||||||||||
| Total | 17.8 | 17.2 | 17.0 | 29.8 | 27.8 | 22.5 | 17.0 | 12.7 | 10.1 | 6.1 | 4.1 | 3.2 |
| Gender | ||||||||||||
| Male | 18.0 | 19.2 | 16.3 | 20.9 | 19.1 | 15.5 | 10.8 | 8.3 | 6.6 | 4.1 | 2.6 | 1.9 |
| Female | 17.5 | 15.1 | 17.7 | 39.2 | 37.0 | 29.9 | 23.5 | 17.3 | 13.8 | 8.2 | 5.8 | 4.5 |
| Race and Hispanic originc | ||||||||||||
| White | — | — | — | 2.9 | 2.6 | 2.0 | 1.6 | 1.4 | 1.1 | 0.9 | 0.5 | 0.4 |
| Black | — | — | — | 174.6 | 164.8 | 136.7 | 103.5 | 76.5 | 60.9 | 35.1 | 23.0 | 17.8 |
| Hispanic | — | — | — | 15.2 | 12.5 | 8.5 | 5.6 | 2.8 | 2.4 | 1.7 | 2.1 | 1.5 |
| Asian/Pacific Islander | — | — | — | 1.7 | 1.9 | 1.4 | 1.0 | 0.8 | 0.5 | 0.8 | 0.4 | 0.4 |
| American Indian/Alaska Native | — | — | — | 2.8 | 7.0 | 2.7 | 0.6 | 2.4 | 4.2 | 1.1 | 0.5 | 3.8 |
a Although most areas generally adhere to the case definitions for STDs found in Case Definitions for Public Health Surveillance (Morbidity and Mortality Weekly Report 1990; 39: 1-43), there are significant differences between individual areas in case definitions as well as in the policies and systems for collecting surveillance data. In many areas, reporting from publicly supported institutions (e.g., STD clinics) was more complete than from other sources (e.g., private practitioners).
b For the indicated states/areas, cases and population denominators have been excluded for the years indicated: 1991 (Kentucky, as race/ethnicity was not reported for most cases); 1993 (Baltimore, because age was not reported for most cases); and 1996 (Rhode Island, because race/ethnicity was not reported for most cases).
c Estimates for whites and blacks exclude Hispanics of those races. Persons of Hispanic origin may be of any race.
Sources: Data for 1975 from Centers for Disease Control and Prevention,1986, Table 8; data for 1980 and 1985 from Centers for Disease Control and Prevention, Division of STD Prevention, 1987, Table 2; data for 1990-1992 from Division of STD/HIV Prevention. December, 1994; Table 21.B; data for 1993 from Division of STD Prevention, 1997, Table 24.B; data for 1994-1998 from Division of STD Prevention, 1999, Table 24B.
Figure HC 2.12.B Reported rates of primary and secondary syphilisa for youth ages 15 through 19 in the United States, by gender (per 100,000 population ages 15 through 19): Selected years, 1975-1998
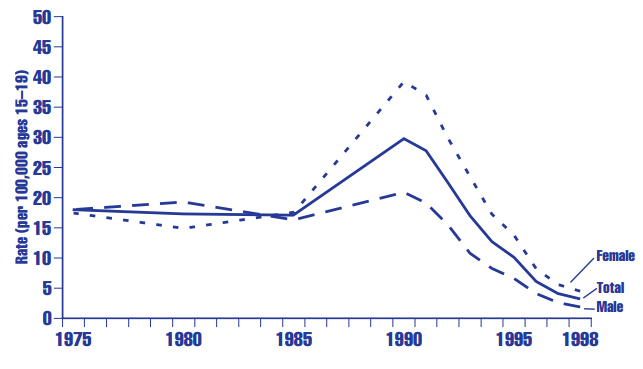
a Although most areas generally adhere to the case definitions for STDs found in Case Definitions for Public Health Surveillance (Morbidity and Mortality Weekly Report 1990; 39: 1-43), there are significant differences between individual areas in case definitions as well as in the policies and systems for collecting surveillance data. In many areas, reporting from publicly supported institutions (e.g., STD clinics) was more complete than from other sources (e.g., private practitioners).
Sources: Data for 1975 from Centers for Disease Control and Prevention, Division of STD Prevention, 1996, Table 7; data for 1980 and 1985 from Centers for Disease Control and Prevention, Division of STD Prevention, 1987, Table 3; data for 1990-1992 from Division of STD/HIV Prevention, 1994, Table 9.B; data for 1993 from Division of STD Prevention, 1997, Table 12.B; data for 1994-1998 from Division of STD Prevention, 1999, Table 12B.
47 Centers for Disease Control and Prevention, Division of STD Prevention. September 1999. Sexually Transmitted Disease Surveillance, 1998. U.S. Department of Health and Human Services, Public Health Service. Atlanta: Centers for Disease Control and Prevention, p. 21.
48 Estimates for whites and blacks exclude Hispanics of those races.
49 Estimates for whites and blacks exclude Hispanics of those races
Health Care
HC 3.1 Health Insurance Coverage
Children who are covered by health insurance are considerably more likely to have a regular source of health care. Among children covered by private health insurance, 97 percent had a regular source of medical care in 1993, and of those covered by government health insurance, 94 percent had a regular source of medical care. In contrast, 79 percent of children with no health insurance had a regular source of medical care.50 Regular care increases the continuity of care, which is important to the maintenance of good health.
Since 1987, the percentage of children who are covered by health insurance has remained stable, ranging from 85 to 87 percent (see Table HC 3.1.A). Rates of coverage vary little by age of child, though older children appear slightly less likely to be covered.
Differences by Race and Hispanic Origin.51 Hispanic children are less likely to be covered than either white or black children. In 1998, 70 percent of Hispanic children were covered by health insurance, compared with 86 percent of white, 83 percent of Asian and Pacific Islander, and 80 percent of black children (see Table HC 3.1.A).
Differences by Poverty Status. Poor children have lower rates of health insurance coverage at 75 percent compared to 85 percent for all children in 1998 (see Tables HC 3.1.A and HC 3.1.B). They are also much less likely to be covered by private health insurance at 23 percent compared to 68 percent for all children.
Differences by Type of Health Care Coverage. Government health insurance coverage for children increased from 19 percent in 1987 to a high of 27 percent in 1993, before declining to 23 percent by 1998 (see Figure HC 3.1).52 Younger children are considerably more likely to be covered by government health insurance. In 1998, 27 percent of children under age 6 were covered, compared with 19 percent of children ages 12 through 17 (see Table HC 3.1.A). Finally, a large proportion of black and Hispanic children rely on government health insurance for their medical coverage. In 1998, 42 percent of black and 31 percent of Hispanic children were covered by government health insurance, compared with 19 percent of white children. These percentages are down from highs of 50 and 41 percent, respectively, in 1993. The vast majority of children covered by government health insurance are covered by Medicaid (see Table 3.1.C).
Table HC 3.1.A Percentage of children under age 18 in the United States who are covered by health insurance, by type of insurance, age, and race and Hispanic origin:a 1987-1998
| 1987 | 1988 | 1989 | 1990 | 1991 | 1992 | 1993 | 1994 | 1995 | 1996 | 1997 | 1998 | |
|---|---|---|---|---|---|---|---|---|---|---|---|---|
| All health insurance | ||||||||||||
| All children | 87 | 87 | 87 | 87 | 87 | 87 | 86 | 86 | 86 | 85 | 85 | 85 |
| Under age 6 | 88 | 87 | 87 | 89 | 89 | 89 | 88 | 86 | 87 | 86 | 86 | 84 |
| Ages 6-11 | 87 | 87 | 87 | 87 | 88 | 88 | 87 | 87 | 87 | 85 | 86 | 85 |
| Ages 12-17 | 86 | 86 | 86 | 85 | 85 | 85 | 83 | 85 | 86 | 84 | 83 | 84 |
| Race and Hispanic origina | ||||||||||||
| White | 88 | 88 | 88 | 87 | 88 | 88 | 87 | 87 | 87 | 86 | 86 | 86 |
| Blacka | 83 | 84 | 84 | 85 | 85 | 86 | 84 | 83 | 85 | 81 | 81 | 80 |
| Hispanic | 72 | 71 | 70 | 72 | 73 | 75 | 74 | 72 | 73 | 71 | 71 | 70 |
| Asian/Pacific Islander | — | — | — | — | — | — | — | — | — | — | 85 | 83 |
| Private health insurance | ||||||||||||
| All children | 74 | 74 | 74 | 71 | 70 | 69 | 67 | 66 | 66 | 66 | 67 | 68 |
| Age | ||||||||||||
| Under age 6 | 72 | 71 | 71 | 68 | 66 | 65 | 63 | 60 | 60 | 62 | 63 | 64 |
| Ages 6-11 | 74 | 74 | 75 | 73 | 71 | 71 | 70 | 67 | 67 | 67 | 68 | 68 |
| Ages 12-17 | 75 | 76 | 76 | 73 | 72 | 71 | 69 | 70 | 71 | 70 | 70 | 70 |
| Race and Hispanic origina | ||||||||||||
| White | 79 | 79 | 78 | 76 | 75 | 74 | 72 | 71 | 71 | 71 | 71 | 72 |
| Blacka | 49 | 50 | 52 | 49 | 45 | 46 | 46 | 43 | 44 | 45 | 48 | 47 |
| Hispanic | 48 | 48 | 48 | 45 | 43 | 42 | 42 | 38 | 38 | 40 | 42 | 43 |
| Asian/Pacific Islander | — | — | — | — | — | — | — | — | — | — | 70 | 67 |
| Government health insuranceb | ||||||||||||
| All children | 19 | 19 | 19 | 22 | 24 | 25 | 27 | 26 | 26 | 25 | 23 | 23 |
| Age | ||||||||||||
| Under age 6 | 22 | 23 | 24 | 28 | 30 | 33 | 35 | 33 | 33 | 31 | 29 | 27 |
| Ages 6-11 | 19 | 18 | 18 | 20 | 22 | 23 | 25 | 25 | 26 | 25 | 23 | 23 |
| Ages 12-17 | 16 | 16 | 15 | 18 | 19 | 19 | 20 | 20 | 21 | 19 | 19 | 19 |
| Race and Hispanic origina | ||||||||||||
| White | 14 | 14 | 15 | 17 | 19 | 20 | 22 | 21 | 21 | 21 | 20 | 19 |
| Blacka | 42 | 42 | 41 | 45 | 48 | 49 | 50 | 48 | 49 | 45 | 40 | 42 |
| Hispanic | 28 | 27 | 27 | 32 | 37 | 38 | 41 | 38 | 39 | 35 | 34 | 31 |
a Estimates for blacks and whites include Hispanics of those races. Persons of Hispanic origin may be of any race.
b Government health insurance for children consists primarily of Medicaid but also includes Medicare and CHAMPUS
Sources: Housing and Household Economic Statistics Division, U.S. Census Bureau, analyses from the March Current Population Surveys. Health Insurance Coverage: 1998, Table 7, available online at http://www.census.gov/hhes/hlthins/hlthin98/hi98t7.html, 10/4/99, and unpublished Table 1: Health Insurance Coverage Status—People by Age, Gender, and Race: 1997. Estimates for 1987-1998 as published in Federal Interagency Forum on Child and Family Statistics, 2000 Table ECON5.A.
Table HC 3.1.B Percentage of poor children under age 18 in the United States who are covered by health insurance, by type of insurance, age, and race and Hispanic origin:a 1998
| All health insurance | Private health insurance | Government health insurance | |
|---|---|---|---|
| All poor children | 75 | 23 | 59 |
| Age | |||
| Under age 6 | 76 | 20 | 64 |
| Ages 6-11 | 77 | 25 | 60 |
| Ages 12-17 | 70 | 24 | 52 |
| Race and Hispanic origina | |||
| White | 72 | 25 | 55 |
| Black | 79 | 18 | 66 |
| Hispanic | 67 | 16 | 55 |
| Asian/Pacific Islander | 83 | 30 | 62 |
a Estimates for whites and blacks include Hispanics of those races. Persons of Hispanic origin may be of any race.
b Government health insurance for children consists primarily of Medicaid but also includes Medicare and CHAMPUS.
Source: Housing and Household Economic Statistics Division, U.S. Census Bureau, analyses from the March Current Population Surveys. Health Insurance Coverage: 1998, Table 7.
Figure HC 3.1 Percentage of children under age 18 in the United States who are covered by health insurance, by type of insurance:a 1987-1998
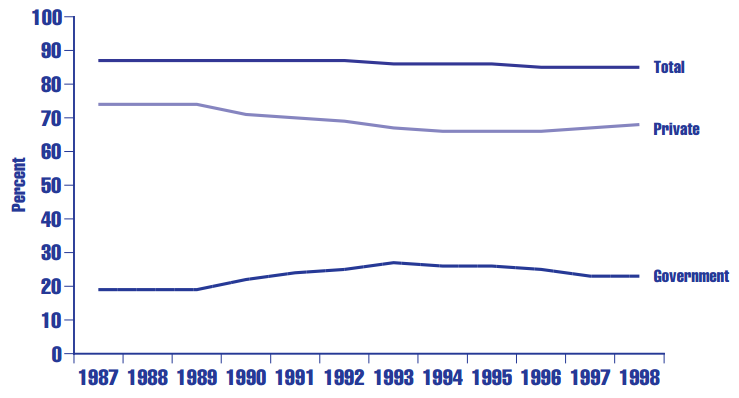
a Government health insurance for children consists primarily of Medicaid but also includes Medicare and CHAMPUS.
Sources: Housing and Household Economic Statistics Division, U.S. Bureau of the Census, analyses from the March Current Population Surveys. Health Insurance Coverage: 1998, Table 7, available online at http://www.census.gov/hhes/hlthins/hlthin98/hi98t7.html, 10/4/99. Estimates for 1987-1996 as published in America’s Children: Key National Indicators of Well-Being, 1998, Table ECON5.A.
Table HC 3.1.C Percentage of children under age 18 in the United States who are covered by Medicaid, by age and by race and Hispanic origin:a 1987-1998
| 1987 | 1988 | 1989 | 1990 | 1991 | 1992 | 1993 | 1994 | 1995 | 1996 | 1997 | 1998 | |
|---|---|---|---|---|---|---|---|---|---|---|---|---|
| Total all children | 15 | 16 | 16 | 19 | 20 | 22 | 24 | 23 | 23 | 22 | 21 | 20 |
| Age | ||||||||||||
| Under age 6 | 18 | 19 | 20 | 24 | 27 | 30 | 32 | 30 | 30 | 28 | 26 | 24 |
| Ages 6-11 | 15 | 15 | 15 | 17 | 19 | 20 | 22 | 22 | 23 | 22 | 20 | 20 |
| Ages 12-17 | 12 | 12 | 11 | 14 | 15 | 15 | 17 | 16 | 17 | 16 | 16 | 16 |
| Race and Hispanic origina | ||||||||||||
| White | 11 | 11 | 11 | 14 | 16 | 17 | 19 | 18 | 18 | 18 | 17 | 16 |
| Black | 38 | 38 | 37 | 42 | 44 | 46 | 47 | 44 | 45 | 41 | 37 | 39 |
| Hispanic | 26 | 25 | 25 | 30 | 34 | 37 | 39 | 37 | 37 | 34 | 32 | 30 |
| Asian/Pacific Islander | — | — | — | — | — | — | — | — | — | — | 18 | 19 |
| Poor children | 56 | 57 | 57 | 62 | 66 | 66 | 67 | 64 | 65 | 63 | 61 | 58 |
| Age | ||||||||||||
| Under age 6 | 61 | 63 | 63 | 71 | 75 | 74 | 76 | 72 | 73 | 71 | 67 | 63 |
| Ages 6-11 | 56 | 57 | 56 | 59 | 64 | 64 | 66 | 65 | 65 | 63 | 62 | 59 |
| Ages 12-17 | 48 | 48 | 47 | 52 | 54 | 55 | 54 | 52 | 53 | 51 | 52 | 51 |
| Race and Hispanic origina | ||||||||||||
| White | 49 | 49 | 49 | 56 | 59 | 60 | 62 | 59 | 59 | 59 | 57 | 54 |
| Black | 67 | 69 | 69 | 73 | 77 | 76 | 77 | 74 | 76 | 70 | 68 | 65 |
| Hispanic | 53 | 48 | 50 | 58 | 61 | 63 | 62 | 62 | 64 | 60 | 60 | 54 |
| Asian/Pacific Islander | — | — | — | — | — | — | — | — | — | — | 63 | 61 |
a Estimates for whites and blacks include Hispanics of those races. Persons of Hispanic origin may be of any race.
Source: Housing and Household Economic Statistics Division, U.S. Bureau of the Census, analyses from the March Current Population Surveys, Table 7.
50 Simpson G., Bloom B., Cohen R.A., & Parsons P.E. 1997. Access to Health Care. Part 1: Children. Vital and Health Statistics 10 (196). National Center for Health Statistics.
51 Estimates for whites, blacks, and Asians and Pacific Islanders include Hispanics of those races. Hispanic children may be of any race.
52 Government health insurance for children consists primarily of Medicaid but also includes Medicare and CHAMPUS.
HC 3.2 Prenatal Care
Early Prenatal Care
Early prenatal care (i.e., care in the first trimester of a pregnancy) allows women and their health care providers to identify and, when possible, treat or correct health problems and health-compromising behaviors that can be particularly damaging during the initial stages of fetal development. Increasing the percentage of women who receive prenatal care, and who do so early in their pregnancies, can improve birth outcomes and lower health care costs by reducing the likelihood of complications during pregnancy and childbirth.53
The percentage of women receiving prenatal care in the first trimester has increased from 68.0 percent in 1970 to 83.2 percent in 1999 (see Table HC 3.2.A).54 Following a decade of essentially no change, the proportion of women receiving early prenatal care has improved incrementally throughout the 1990s.
Differences by Race and Ethnicity. The percentage of women receiving prenatal care during the first 3 months of pregnancy has increased over the past two decades for women of all races and those of Hispanic origin. While the gains have been greatest for women with lower levels of timely care, white, Chinese, Japanese, and Cuban women are most likely to receive prenatal care in their first trimester (see Table HC 3.2.A).
- American Indian/Alaska Native and Mexican women have consistently had the lowest percentage of women receiving early prenatal care; however, this percentage has increased to 68.8 for American Indian women and 72.8 percent for Mexican women in 1998.
- The percentage of black women receiving prenatal care in the first trimester increased from 44.2 percent in 1970 to 62.4 percent in 1980. Rates declined slightly during the 1980s but then increased in subsequent years, reaching 74 percent by 1999.
- The percentage of all Hispanic women who receive early prenatal care has increased from 60.2 percent in 1980 to 74.3 percent by 1998. Among Hispanics, there are important subgroup disparities. In 1998, 91.8 percent of Cuban women received early prenatal care, compared with 72.8 percent of Mexican American women.
- Since 1980, early prenatal care receipt has improved among Asian/Pacific Islander women as a group—from 73.7 percent in 1980 to 83.1 percent in 1998. Chinese, Japanese, and Filipino women tend to have higher rates of prenatal care than Hawaiian and other Asian women.
- The percentage of white women receiving early prenatal care increased from 72.3 percent to 79.2 percent between 1970 and 1980, was stable through the 1980s, then increased during the 1990s to 88.4 percent by 1999.
Late or No Prenatal Care
Receiving prenatal care late in a pregnancy, or receiving no prenatal care at all, can lead to negative health outcomes for mother and child. Women who receive care late in their pregnancy, or who do not receive care at all, are at increased risk of bearing infants who are of low birthweight, who are stillborn, or who die within the first year of life.55 Between 1970 and 1999, the percentage of women receiving late or no prenatal care declined from 7.9 percent to 3.8 percent (see Table HC 3.2.B).
Differences by Race and Ethnicity. The percentage of women who receive late or no prenatal care has declined substantially for women in all racial and ethnic groups (see Table HC 3.2.B).
- American Indian/Alaska Native women and black women have seen the most dramatic improvements, with the percentages receiving late or no prenatal care dropping by more than two-thirds for American Indian women and by more than half for black women since 1970. In 1998, 8.5 percent of American Indian/Alaska Native women received late or no prenatal care, and 7.0 percent of black women received late or no prenatal care.
- The percentage of Hispanic women receiving late or no prenatal care has decreased every year during the 1990s and at 6.3 percent in 1998 was lower than the rate for black women at 7.0.
- White women and Asian women as a group have consistently been least likely to receive late or no prenatal care. In 1998, 2.4 percent of white women received late or no prenatal care, compared to 3.6 percent of Asian women.
Adequacy of Prenatal Care
Receiving early and consistent prenatal care increases the likelihood of a healthy birth outcome. Adequate prenatal care is determined by both the early receipt of prenatal care (within the first trimester) and the receipt of an appropriate number of prenatal care visits for each stage of a pregnancy. Women whose prenatal care fails to meet these standards are at a greater risk for pregnancy complications and negative birth outcomes.
There has been a sharp decline in the percentage of women receiving inadequate prenatal care from 18 percent in 1989 to 11.9 percent in 1998 (see Table HC 3.2.C). According to the Adequacy of Prenatal Care Utilization Index, the proportion of women with at least adequate care rose from 66.1 percent to 74.3 percent between 1989 and 1998. The proportion of women with intensive use of care (women for whom the number of visits exceeded the American College of Obstetricians and Gynecologists’ recommendations by a ratio of observed to expected visits of at least 110 percent) rose from 24.1 to 31 percent during the same time period.
Table HC 3.2.A Percentage of womena in the United States receiving prenatal care in the first trimester, by race/ethnicity of mother: Selected years, 1970-1999
| 1970 | 1980 | 1985 | 1990b | 1991 | 1992 | 1993 | 1994 | 1995 | 1996 | 1997 | 1998 | 1999 | |
|---|---|---|---|---|---|---|---|---|---|---|---|---|---|
| Total | 68.0 | 76.3 | 76.2 | 75.8 | 76.2 | 77.7 | 78.9 | 80.2 | 81.3 | 81.9 | 82.5 | 82.8 | 83.2 |
| Race/ethnicity | |||||||||||||
| Whiteb | 72.3 | 79.2 | 79.3 | 83.3 | 83.7 | 84.9 | 85.6 | 86.5 | 87.1 | 87.4 | 87.9 | 87.9 | 88.4 |
| Blackb | 44.2 | 62.4 | 61.5 | 60.7 | 61.9 | 64.0 | 66.1 | 68.3 | 70.4 | 71.5 | 72.3 | 73.3 | 74.0 |
| American Indian/Alaska Native | 38.2 | 55.8 | 57.5 | 57.9 | 59.9 | 62.1 | 63.4 | 65.2 | 66.7 | 67.7 | 68.1 | 68.8 | — |
| Asian/Pacific Islander | 67.3 | 73.7 | 74.1 | 75.1 | 75.3 | 76.6 | 77.6 | 79.7 | 79.9 | 81.2 | 82.1 | 83.1 | — |
| Chinese | 71.8 | 82.6 | 82.0 | 81.3 | 82.3 | 83.8 | 84.6 | 86.2 | 85.7 | 86.8 | 87.4 | 88.5 | — |
| Japanese | 78.1 | 86.1 | 84.7 | 87.0 | 87.7 | 88.2 | 87.2 | 89.2 | 89.7 | 89.3 | 89.3 | 90.2 | — |
| Filipino | 60.6 | 77.3 | 76.5 | 77.1 | 77.1 | 78.7 | 79.3 | 81.3 | 80.9 | 82.5 | 83.3 | 84.2 | — |
| Hawaiian | — | — | — | 65.8 | 68.1 | 69.9 | 70.6 | 77.0 | 75.9 | 78.5 | 78.0 | 78.8 | — |
| Other Asian or Pacific Islander | 54.9 | 67.6 | 69.7 | 71.9 | 71.9 | 72.8 | 74.4 | 76.2 | 77.0 | 78.4 | 79.7 | 80.9 | — |
| Hispanic originc,d | — | 60.2 | 61.2 | 60.2 | 61.0 | 64.2 | 66.6 | 68.9 | 70.8 | 72.2 | 73.7 | 74.3 | 74.5 |
| Mexican American | — | 59.6 | 60.0 | 57.8 | 58.7 | 62.1 | 64.8 | 67.3 | 69.1 | 70.7 | 72.1 | 72.8 | — |
| Puerto Rican | — | 55.1 | 58.3 | 63.5 | 65.0 | 67.8 | 70.0 | 71.7 | 74.0 | 75.0 | 76.5 | 76.9 | — |
| Cuban | — | 82.7 | 82.5 | 84.8 | 85.4 | 86.8 | 88.9 | 90.1 | 89.2 | 89.2 | 90.4 | 91.8 | — |
| Central and South | — | 58.8 | 60.6 | 61.5 | 63.4 | 66.8 | 68.7 | 71.2 | 73.2 | 75.0 | 76.9 | 78.0 | — |
| American Unknown Hispanic | — | 66.4 | 65.8 | 66.4 | 65.6 | 68.0 | 70.0 | 72.1 | 74.3 | 74.6 | 76.0 | 74.8 | — |
a The data refer to those women who had live births.
b Includes persons of Hispanic origin until 1990. After 1990 persons of Hispanic origin are not included.
c Persons of Hispanic origin may be of any race.
d Figures for Hispanic women are based on data from 22 states that reported Hispanic origin on the birth certificate in 1980; 23 states and the District of Columbia in 1985, 48 states and the District of Columbia in 1990, 49 states and the District of Columbia in 1992, and 50 states and the District of Columbia since 1993.
Sources: Curtin & Martin, 2000; Data computed by the Division of Health and Utilization Analysis from data compiled by the Division of Vital Statistics; National Center for Health Statistics, 1998, Table 6; Ventura, et al., 2000, Births, Tables 24, 25 and 33; Ventura, et al., 1999, Births, Tables 24, 25, and 33.
Table HC 3.2.B Percentage of womena in the United States receiving late or no prenatal care,b by race/ethnicity of mother and by age: selected years, 1970-1999
| 1970 | 1980 | 1985 | 1990 | 1991 | 1992 | 1993c | 1994 | 1995 | 1996 | 1997 | 1998 | 1999 | |
|---|---|---|---|---|---|---|---|---|---|---|---|---|---|
| Total | 7.9 | 5.1 | 5.7 | 6.1 | 5.8 | 5.2 | 4.8 | 4.4 | 4.2 | 4.0 | 3.9 | 3.9 | 3.8 |
| Race/ethnicity | |||||||||||||
| Whitec | 6.3 | 4.3 | 4.8 | 4.9 | 4.7 | 4.2 | 2.7 | 2.5 | 2.5 | 2.4 | 2.4 | 2.4 | 2.3 |
| Blackc | 16.6 | 8.9 | 10.2 | 11.3 | 10.7 | 9.9 | 9.0 | 8.2 | 7.6 | 7.3 | 7.3 | 7.0 | 6.7 |
| American Indian/Alaska Native | 28.9 | 15.2 | 12.9 | 12.9 | 12.2 | 11.0 | 10.3 | 9.8 | 9.5 | 8.6 | 8.6 | 8.5 | — |
| Asian/Pacific Islander | 6.8 | 6.5 | 6.5 | 5.8 | 5.7 | 4.9 | 4.6 | 4.1 | 4.3 | 3.9 | 3.8 | 3.6 | — |
| Chinese | 6.5 | 3.7 | 4.4 | 3.4 | 3.4 | 2.9 | 2.9 | 2.7 | 3.0 | 2.5 | 2.4 | 2.2 | — |
| Japanese | 4.1 | 2.1 | 3.1 | 2.9 | 2.5 | 2.4 | 2.8 | 1.9 | 2.3 | 2.2 | 2.7 | 2.1 | — |
| Filipino | 7.2 | 4.0 | 4.8 | 4.5 | 5.0 | 4.3 | 4.0 | 3.6 | 4.1 | 3.3 | 3.3 | 3.1 | — |
| Hawaiian | — | — | — | 8.7 | 7.5 | 7.0 | 6.7 | 4.7 | 5.1 | 5.0 | 5.4 | 4.7 | — |
| Other Asian or Pacific Islander | — | 9.0 | 8.1 | 7.1 | 6.8 | 5.9 | 5.4 | 4.8 | 5.0 | 4.6 | 4.4 | 4.2 | — |
| Hispanic originc, d | — | 12.0 | 12.4 | 12.0 | 11.0 | 9.5 | 8.8 | 7.6 | 7.4 | 6.7 | 6.2 | 6.3 | 6.3 |
| Mexican American | — | 11.8 | 12.9 | 13.2 | 12.2 | 10.5 | 9.7 | 8.3 | 8.1 | 7.2 | 6.7 | 6.8 | — |
| Puerto Rican | — | 16.2 | 15.5 | 10.6 | 9.1 | 8.0 | 7.1 | 6.5 | 5.5 | 5.7 | 5.4 | 5.1 | — |
| Cuban | — | 3.9 | 3.7 | 2.8 | 2.4 | 2.1 | 1.8 | 1.6 | 2.1 | 1.6 | 1.5 | 1.2 | — |
| Central and South American | — | 13.1 | 12.5 | 10.9 | 9.5 | 7.9 | 7.3 | 6.5 | 6.1 | 5.5 | 5.0 | 4.9 | — |
| Unknown Hispanic | — | 9.2 | 9.4 | 8.5 | 8.2 | 7.5 | 7.0 | 6.2 | 6.0 | 5.9 | 5.3 | 6.0 | — |
a The data refer to those women who had live births.
b Late prenatal care is defined as seventh month or later.
c Includes persons of Hispanic origin until 1993. After 1993, persons of Hispanic origin are not included. Persons of Hispanic origin may be of any race.
d Figures for Hispanic women are based on data from 22 states that reported Hispanic origin on the birth certificate in 1980; 23 states and the District of Columbia in 1985, 48 states and the District of Columbia in 1990, 49 states and the District of Columbia in 1992, and 50 states and the District of Columbia since 1993.
Sources: Curtin, & Mathews, 2000, Table 6; Ventura, et al.,2000, Births, Tables 24, 25, and 33.
Table HC 3.2.C Adequacy of Prenatal Care Utilization Indexa: United States, 1989, 1990, and 1995-1998
| 1989 | 1990a | 1995a | 1996 | 1997 | 1998 | |
|---|---|---|---|---|---|---|
| Intensive use | 24.1 | 24.6 | 28.8 | 29.3 | 30.7 | 31.0 |
| Adequate | 42.0 | 42.3 | 43.7 | 43.6 | 43.3 | 43.3 |
| Intermediate | 15.9 | 15.7 | 14.7 | 14.7 | 14.0 | 13.8 |
| Inadequate | 18.0 | 17.4 | 12.8 | 12.4 | 12.0 | 11.9 |
a Kotelchuck M. An evaluation of the Kessner adequacy of prenatal care index and a proposed adequacy of prenatal care utilization index. Am J Public Health 84(9):1414–20. 1994 Kogan MD, Martin JA, Alexander GR, et al. The changing pattern of prenatal care utilization in the United States, 1981–1985, using different prenatal care indices. JAMA 279(20):1623–28. 1998.
Sources: Ventura, et al., 2000, Births, Table F.
53 U.S. Public Health Service. 1989. Caring for Our Future: The Content of Prenatal Care. Washington, D.C.: U.S. Department of Health and Human Services.
54 These data include only those women who gave birth, not all women who were pregnant.
55 U.S. Public Health Service, 1989.
HC 3.3 Immunization: Percentage of Children ages 19 Months to 35 Months Who Are Fully Immunized
Childhood vaccinations can prevent diseases that killed or permanently impaired many children in past decades. The Centers for Disease Control and Prevention recommends that 80 percent of all routine childhood vaccinations be administered within the first 2 years of life. Vaccination coverage is particularly important before children enter preschool to prevent the spread of disease. Today, at least 95 percent of children are adequately vaccinated by the time they enter kindergarten.56
There were substantial increases in the proportion of children vaccinated between 1991 and 1994 for each of the recommended vaccines (data not shown).57 Coverage has continued to increase during the period from 1994 to 1998. For example, the percentage of preschool children receiving the combined series 4:3:1:3 vaccine was 69 percent in 1994 and reached 79 percent by 1998 (see Table HC 3.3).58 Even with the increases of recent years, more than 1 million preschool children remain unvaccinated for serious preventable diseases.59 In particular, there are differences in immunization rates by poverty status and race and Hispanic origin.
Differences by Race and Hispanic Origin.60 Non-Hispanic white infants ages 19 months to 35 months have higher percentages of vaccination receipt than do non-Hispanic black children or children of Hispanic origin (see Table HC 3.3). This disparity in vaccination levels has narrowed somewhat from 1994 to 1997, as the vaccination levels of black and Hispanic children have improved. By preschool, the vaccination levels of children across racial and ethnic groups are nearly the same, narrowing a gap that once was as wide as 26 percentage points for specific vaccinations.61 Differences in vaccination rates among racial and ethnic groups are partly accounted for by poverty level.62
Differences by Poverty Status. Although vaccination levels have increased substantially between 1995 and 1998 among children in households at or above the poverty level, poor children are still less likely to have received recommended vaccinations.63 In 1998, 82 percent of children in families at or above the poverty level received the combined series 4:3:1:3, compared with 74 percent of poor children (see Table HC 3.3).
Figure HC 3.3 Percentage of childrena ages 19 months to 35 months in the United States who have received vaccinations for routinely recommended vaccines:b 1997
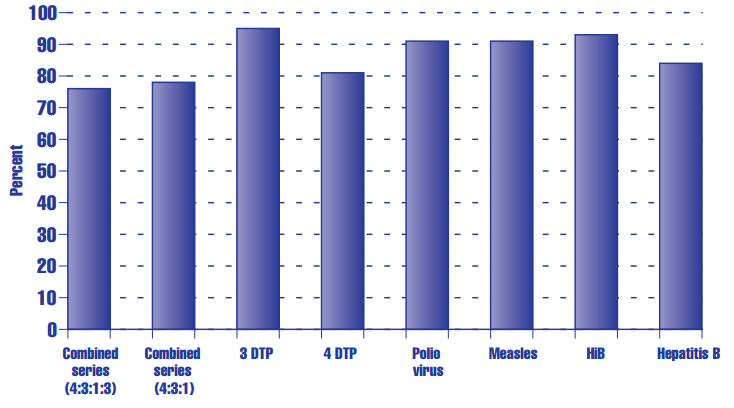
a Data are based on telephone interviews of a sample of the civilian, noninstitutionalized population, with households selected via a random digit dial (RDD) procedure. Refusals and unknowns were excluded. Exclusions included unknown vaccine type.
b The combined series 4:3:1:3 consists of four doses of diphtheria-tetanus-pertussis (DTP) vaccine, three doses of polio vaccine, one dose of a measles-containing vaccine, and three doses of Haemophilus influenzae type b (HiB) vaccine. The combined series 4:3:1 consists of four doses of DTP vaccine, three doses of polio vaccine, and one dose of a measles-containing vaccine.
Source: Centers for Disease Control and Prevention. National Center for Health Statistics and National Immunization Program, 2000, Table 73.
Table HC 3.3 Percentage of children ages 19 months to 35 months in the United States who have received routinely recommended vaccinations, by poverty statusa and race and Hispanic origin:b1994c -1998
| All races | White, non-Hispanic | Black, non-Hispanic | Hispanic | |||||||||
|---|---|---|---|---|---|---|---|---|---|---|---|---|
| Vaccination type | Total | Below poverty | At or above poverty | Total | Below poverty | At or above poverty | Total | Below poverty | At or above poverty | Total | Below poverty | At or above poverty |
| Combined series (4:3:1:3)d | ||||||||||||
| 1994 | 69 | 61 | 72 | 72 | — | — | 67 | — | — | 62 | — | — |
| 1995 | 74 | 67 | 77 | 77 | 68 | 79 | 70 | 66 | 75 | 69 | 65 | 72 |
| 1996 | 77 | 69 | 80 | 79 | 68 | 81 | 74 | 70 | 78 | 71 | 68 | 74 |
| 1997 | 76 | 71 | 79 | 79 | 72 | 80 | 73 | 71 | 77 | 72 | 70 | 76 |
| 1998 | 79 | 74 | 82 | 82 | 77 | 83 | 73 | 72 | 74 | 75 | 73 | 79 |
| Combined series (4:3:1)e | ||||||||||||
| 1994 | 75 | 66 | 78 | 78 | — | — | 69 | — | — | 68 | — | — |
| 1995 | 76 | 68 | 79 | 79 | — | — | 72 | — | — | 71 | — | — |
| 1996 | 78 | 71 | 81 | 80 | 70 | 82 | 76 | 73 | 80 | 73 | 70 | 75 |
| 1997 | 78 | 73 | 80 | 80 | 73 | 82 | 74 | 72 | 78 | 74 | 72 | 77 |
| 1998 | — | — | — | — | — | — | — | — | — | — | — | — |
| DTP (3 doses or more)f | ||||||||||||
| 1994 | 93 | 89 | 96 | 95 | — | — | 91 | — | — | 90 | — | — |
| 1995 | 95 | 91 | 96 | 96 | — | — | 92 | — | — | 93 | — | — |
| 1996 | 95 | 92 | 96 | 96 | 92 | 97 | 93 | 91 | 95 | 93 | 92 | 94 |
| 1997 | 95 | 93 | 97 | 97 | 93 | 97 | 95 | 95 | 96 | 93 | 92 | 94 |
| 1998 | — | — | — | — | — | — | — | — | — | — | — | — |
| DTP (4 doses or more)f | ||||||||||||
| 1994 | 76 | 69 | 79 | 80 | — | — | 72 | — | — | 70 | — | — |
| 1995 | 79 | 71 | 81 | 81 | — | — | 74 | — | — | 75 | — | — |
| 1996 | 81 | 73 | 84 | 83 | 72 | 85 | 79 | 75 | 82 | 77 | 73 | 79 |
| 1997 | 81 | 76 | 84 | 84 | 76 | 85 | 78 | 76 | 80 | 77 | 75 | 80 |
| 1998 | 84 | 80 | 86 | 87 | — | — | 77 | — | — | 81 | — | — |
| Polio (3 doses or more) | ||||||||||||
| 1994 | 83 | 78 | 85 | 85 | — | — | 79 | — | — | 81 | — | — |
| 1995 | 88 | 84 | 89 | 89 | — | — | 84 | — | — | 87 | — | — |
| 1996 | 91 | 88 | 92 | 92 | 88 | 93 | 90 | 88 | 92 | 89 | 88 | 90 |
| 1997 | 91 | 90 | 92 | 92 | 90 | 92 | 90 | 90 | 91 | 90 | 89 | 90 |
| 1998 | 91 | 90 | 92 | 92 | — | — | 88 | — | — | 89 | — | — |
| Measles-containingg | ||||||||||||
| 1994 | 89 | 87 | 90 | 90 | — | — | 86 | — | — | 88 | — | — |
| 1995 | 90 | 85 | 91 | 91 | — | — | 86 | — | — | 88 | — | — |
| 1996 | 91 | 87 | 92 | 92 | 86 | 93 | 89 | 88 | 91 | 88 | 88 | 89 |
| 1997 | 91 | 86 | 92 | 92 | 85 | 93 | 90 | 88 | 92 | 88 | 86 | 89 |
| 1998 | 92 | 90 | 93 | 93 | — | — | 89 | — | — | 91 | — | — |
Table HC 3.3 continued. Percentage of children ages 19 months to 35 months in the United States who have received routinely recommended vaccinations, by poverty statusa and race and Hispanic origin:b1994c -1998
| All races | White, non-Hispanic | Black, non-Hispanic | Hispanic | |||||||||
|---|---|---|---|---|---|---|---|---|---|---|---|---|
| Vaccination type | Total | Below poverty | At or above poverty | Total | Below poverty | At or above poverty | Total | Below poverty | At or above poverty | Total | Below poverty | At or above poverty |
| HiB (3 doses or more)h | ||||||||||||
| 1994 | 86 | 81 | 88 | 87 | — | — | 85 | — | — | 84 | — | — |
| 1995 | 92 | 88 | 93 | 93 | — | — | 89 | — | — | 90 | — | — |
| 1996 | 92 | 88 | 93 | 93 | 87 | 94 | 90 | 87 | 92 | 89 | 88 | 90 |
| 1997 | 93 | 90 | 94 | 94 | 90 | 95 | 92 | 92 | 94 | 90 | 89 | 92 |
| 1998 | 93 | 91 | 95 | 95 | — | — | 90 | — | — | 92 | — | |
| Hepatitis B (3 doses or more)i | ||||||||||||
| 1994 | 37 | 25 | 41 | 40 | — | — | 29 | — | — | 33 | — | — |
| 1995 | 68 | 64 | 69 | 68 | — | — | 65 | — | — | 69 | — | — |
| 1996 | 82 | 78 | 83 | 82 | 75 | 83 | 82 | 79 | 86 | 80 | 79 | 82 |
| 1997 | 84 | 80 | 85 | 85 | 80 | 85 | 83 | 82 | 84 | 81 | 79 | 84 |
| 1998 | 87 | 85 | 88 | 88 | — | — | 84 | — | — | 86 | — | — |
a Poverty status is based on family income and family size using U.S. Bureau of the Census poverty thresholds.
b Estimates for whites and blacks exclude Hispanics of those races. Persons of Hispanic origin may be of any race.
c Estimates are based on interviews conducted from April 1994 through December 1994.
d The combined series 4:3:1:3 consists of four doses of diphtheria-tetanus-pertussis (DTP) vaccine, three doses of polio vaccine, one dose of a measles-containing vaccine, and three doses of Haemophilus influenzae type b (HiB) vaccine.
e The combined series 4:3:1 consists of four doses of DTP vaccine, three doses of polio vaccine, and one dose of a measles-containing vaccine.
f Diphtheria-tetanus-pertussis vaccine.
g Any vaccination containing measles vaccine.
h Haemophilus influenzae type b vaccine.
i The percentage of children 19-35 months of age who received three or more doses of hepatitis B vaccine was artificially low in 1994 because universal infant vaccination with a three-dose series was not recommended until November 1991.
Sources: Unpublished data from the National Immunization Survey, National Center for Health Statistics and National Immunization Program, Centers for Disease Control and Prevention; Centers for Disease Control and Prevention. 1998; Table 1; Centers for Disease Control and Prevention, 1998, Table 1 and text; National Center for Health Statistics, 1997, Table 55; Centers for Disease Control and Prevention, 1997, Tables 1 and 2; National Center for Health Statistics, 1998. Table 52.
Section 4: Social Development, Behavioral Health, and Teen Fertility (SD)
Social Development
SD 1.1 Life Goals: The Percentage of High School Seniors who Rated Selected Personal and Social Goals as Extremely Important
The personal and social life goals of high school students reflect their priorities for the future and provide insights into the positive and negative influences in their lives as they make the transition to adulthood. The percentages of high school seniors who rated selected personal and social life goals as extremely important for selected years between 1976 and 1999 are presented in Tables SD 1.1.A and SD 1.1.B. Personal goals include being successful in their line of work, having a good marriage and family life, and having lots of money. Social goals include making a contribution to society, working to correct social and economic inequalities, and being a leader in their community. From 1976 through 1999, high school seniors have been fairly consistent in the relative importance they assign to various life goals. Specifically:
- Being Successful in My Line of Work and Having a Good Marriage and Family Life have been cited more often than other values by high school seniors as being extremely important. Since 1992, more than three out of four high school seniors have felt it extremely important to have a good marriage and family life, and nearly two out of three have felt it extremely important to be successful at work (see Table SD 1.1.A).
- Having Lots of Money and Making a Contribution to Society were the next most likely goals to be considered extremely important by high school seniors. Between 20 and 30 percent of seniors have found these goals extremely important in recent years (see Figures SD 1.1.A and SD 1.1.B).
- Working to Correct Social and Economic Inequalities and Being a Leader in My Community are extremely important goals in 1999 for only small percentages of high school seniors: 10 percent and 15 percent, respectively (see Figure SD 1.1.B).
Differences by Race. In 1999, black students were more likely than whites to view as extremely important goals such as being successful at work (76 percent versus 60 percent), having lots of money (47 percent versus 21 percent), and correcting social and economic inequalities (16 percent versus 8 percent). The two groups appeared equally likely to attach extreme importance to having a good marriage and family life, a rate that has hovered around 75 percent for both races over the time period examined.
Differences by Gender. Across the six goals, rates vary little between male students and female students, with several exceptions. In 1997, females were more likely to indicate that having a good marriage and family life was extremely important (83 percent versus 74 percent) and were less likely to report that having lots of money was an extremely important goal (17 percent versus 34 percent).
Table SD 1.1.A Percentage of high school seniors in the United States who rate selected personal life goals as being "extremely important," by gender and race: Selected years, 1976-1999
| 1976 | 1981 | 1986 | 1991 | 1992 | 1993 | 1994 | 1995 | 1996 | 1997 | 1998 | 1999 | |
|---|---|---|---|---|---|---|---|---|---|---|---|---|
| Being successful in my line of work | ||||||||||||
| Total | 53 | 57 | 61 | 62 | 66 | 65 | 63 | 62 | 65 | 64 | 64 | 63 |
| Gender | ||||||||||||
| Male | 53 | 58 | 62 | 60 | 63 | 63 | 61 | 62 | 62 | 65 | 61 | 63 |
| Female | 52 | 57 | 60 | 64 | 69 | 67 | 66 | 62 | 68 | 64 | 68 | 64 |
| Race | ||||||||||||
| White | 50 | 55 | 58 | 59 | 65 | 62 | 60 | 59 | 63 | 60 | 61 | 60 |
| Black | 67 | 71 | 73 | 75 | 80 | 74 | 79 | 72 | 74 | 81 | 80 | 76 |
| Having a good marriage and family life | ||||||||||||
| Total | 73 | 76 | 75 | 76 | 78 | 79 | 76 | 78 | 78 | 76 | 77 | 78 |
| Gender | ||||||||||||
| Male | 66 | 71 | 69 | 71 | 72 | 74 | 70 | 73 | 74 | 72 | 72 | 74 |
| Female | 80 | 82 | 82 | 83 | 84 | 85 | 81 | 83 | 81 | 81 | 82 | 83 |
| Race | ||||||||||||
| White | 72 | 77 | 76 | 76 | 79 | 79 | 76 | 78 | 78 | 77 | 77 | 79 |
| Black | 75 | 73 | 76 | 78 | 75 | 76 | 72 | 76 | 75 | 76 | 77 | 76 |
| Having lots of money | ||||||||||||
| Total | 15 | 18 | 27 | 28 | 29 | 26 | 26 | 25 | 25 | 28 | 29 | 26 |
| Gender | ||||||||||||
| Male | 20 | 24 | 34 | 37 | 35 | 32 | 32 | 30 | 33 | 33 | 35 | 34 |
| Female | 11 | 13 | 18 | 19 | 22 | 18 | 19 | 19 | 16 | 20 | 20 | 17 |
| Race | ||||||||||||
| White | 12 | 15 | 24 | 25 | 24 | 20 | 22 | 21 | 21 | 22 | 22 | 21 |
| Black | 33 | 32 | 38 | 39 | 46 | 45 | 47 | 41 | 43 | 45 | 46 | 47 |
Note: 1976–1988 data based on one of five forms, with a resulting sample one-fifth of the total sample size for each year.
1989–1999 data based on one of six forms, with a resulting sample one-sixth of the total sample size for each year.
Sources: Johnston, Bachman, & O’Malley, 1976, 1981, 1986, 1991, 1992, 1993, 1994, 1995, 1996–1999 unpublished tables.
Questionnaire Form 1, items A007A, A007B, and A007C.
Table SD 1.1.B Percentage of high school seniors in the United States who rate selected social life goals as being "extremely important," by gender and race: Selected years, 1976-1999
| 1976 | 1981 | 1986 | 1991 | 1992 | 1993 | 1994 | 1995 | 1996 | 1997 | 1998 | 1999 | |
|---|---|---|---|---|---|---|---|---|---|---|---|---|
| Making a contribution to society | ||||||||||||
| Total | 18 | 18 | 17 | 21 | 22 | 24 | 24 | 20 | 24 | 22 | 23 | 22 |
| Gender | ||||||||||||
| Male | 16 | 19 | 18 | 20 | 22 | 25 | 23 | 19 | 23 | 19 | 21 | 22 |
| Female | 20 | 17 | 16 | 22 | 23 | 25 | 25 | 21 | 26 | 25 | 24 | 22 |
| Race | ||||||||||||
| White | 18 | 18 | 16 | 20 | 22 | 24 | 23 | 19 | 23 | 22 | 23 | 21 |
| Black | 23 | 21 | 20 | 27 | 27 | 25 | 29 | 25 | 29 | 24 | 30 | 26 |
| Working to correct social and economic inequalities | ||||||||||||
| Total | 10 | 10 | 9 | 12 | 15 | 15 | 14 | 10 | 12 | 12 | 11 | 10 |
| Gender | ||||||||||||
| Male | 8 | 9 | 7 | 11 | 14 | 14 | 12 | 9 | 11 | 10 | 10 | 9 |
| Female | 13 | 10 | 11 | 13 | 17 | 16 | 16 | 10 | 12 | 12 | 11 | 10 |
| Race | ||||||||||||
| White | 8 | 7 | 7 | 10 | 13 | 12 | 11 | 8 | 9 | 9 | 8 | 8 |
| Black | 20 | 21 | 19 | 21 | 26 | 21 | 25 | 18 | 19 | 18 | 20 | 16 |
| Being a leader in my community | ||||||||||||
| Total | 7 | 8 | 9 | 11 | 13 | 13 | 14 | 12 | 15 | 15 | 14 | 15 |
| Gender | ||||||||||||
| Male | 8 | 8 | 11 | 12 | 14 | 17 | 14 | 14 | 16 | 16 | 14 | 17 |
| Female | 6 | 7 | 6 | 10 | 11 | 10 | 13 | 10 | 13 | 13 | 15 | 13 |
| Race | ||||||||||||
| White | 6 | 7 | 8 | 9 | 11 | 12 | 12 | 10 | 14 | 12 | 12 | 13 |
| Black | 14 | 14 | 12 | 17 | 21 | 19 | 21 | 22 | 23 | 24 | 30 | 25 |
Note: 1976–1988 data based on one of five forms, with a resulting sample one-fifth of the total sample size for each year.
1989–1999 data based on one of six forms, with a resulting sample one-sixth of the total sample size for each year.
Sources: Johnston, Bachman, & O’Malley, 1976, 1981, 1986, 1991, 1992, 1993, 1994, 1995. 1996–1999 unpublished tables.
Questionnaire Form 1, items A007G, A007H, and A007L.
Figure SD 1.1.A Percentage of high school seniors in the United States who rate selected personal life goals as being “extremely important”: 1976 and 1999
Figure SD 1.1.B Percentage of high school seniors in the United States who rate selected social life goals as being “extremely important”: 1976 and 1999
SD 1.2 Peer Approval
As children grow older, peer relationships come to play an increasingly important role in determining their own behaviors and attitudes.1 For example, teenagers reporting that a large proportion of their friends are (or would like to be) sexually active are more likely to become sexually active themselves.2
Two measures of potential peer influence are offered here: the percentage of youth reporting that getting good grades has great or very great importance to their peers, and the percentage reporting that peers would disapprove of intentionally angering a teacher in school. Between 1980 and 1999, the percentage of 12th-graders reporting that their peers value good grades stayed fairly constant, varying between 44 percent and 49 percent 3 (see Figure SD 1.2.A). During that same time period, the percentage reporting peer disapproval of angering a teacher in school decreased from 41 percent in 1980 to 34 percent in 1999 (see Table SD 1.2.B).
Differences by Age. Eighth-grade students were more likely in 1999 than either 10th- or 12th-graders to report that their peers consider good grades to be of great or very great importance (50 percent versus 42 percent and 47 percent, respectively). In that same year, on the other hand, more 12th-grade students (34 percent) than 8th- or 10th-graders (22 and 26 percent, respectively) were likely to report peer disapproval of intentionally angering a teacher in school (see Tables SD 1.2.A and SD 1.2.B).
Differences by Gender. Female students were slightly more likely than males to report that their peers value good grades and that they would disapprove of intentionally angering teachers; for example, among 12th-grade youth in 1999, 49 percent of females and 44 percent of males reported that peers hold good grades to be of great or very great importance (see Table SD 1.2.A). In that same year, 37 percent of 12th-grade females and 30 percent of 12th-grade males reported peer disapproval of intentionally angering a teacher in school (see Table SD 1.2.B).
Differences by Race. For all years for which data are presented, black students in all grades were considerably more likely than their white counterparts to report strong peer support for good grades (see Figure SD 1.2.A); for example, in 1999, 39 percent of white and 77 percent of black 12th-graders reported that their peers believed that good grades were of great or very great importance. Black students are slightly less likely to report peer disapproval of intentionally angering teachers in the 8th, 10th, and 12th grades. The difference by race is largest among high school seniors, in a trend that has been consistent since 1980 (see Figure SD 1.2.B).
1 Hayes, C.D. Risking the Future, p. 105; Newcomer, S.F., Gilbert, M., & Udry, J.R. Perceived and Actual Same-Sex Behavior as Determinants of Adolescent Sexual Behavior. Paper presented at the Annual Meeting of the American Psychological Association, Montréal, Canada, 1980. Cited in National Commission on Children. 1991. Beyond Rhetoric: A New American Agenda for Children and Families, Final Report of the National Commission on Children, p. 351. Washington, D.C.: U.S. Government Printing Office.
2 Hayes, C.D. Risking the Future, p. 105; Cvetkovitch, G., & Grote, B. Psychological Development and the Social Problem of Teenage Illegitimacy. In Adolescent Pregnancy and Childbearing: Findings from Research (C. Chilman, ed). Washington, D.C.: U.S. Department of Health and Human Services, 1980. Cited in National Commission on Children. 1991. Beyond Rhetoric: A New American Agenda for Children and Families, Final Report of the National Commission on Children, p. 351. Washington, D.C.: U.S. Government Printing Office.
3 The 53 percent estimate occurred in 1982, not shown in Table SD 1.2.A.
Table SD 1.2.A Percentage of 8th-, 10th-, and 12th-grade students in the United States reporting that good grades have great or very great importance to peers, by gender and race: Selected years, 1980-1999
| 1976 | 1981 | 1986 | 1991 | 1992 | 1993 | 1994 | 1995 | 1996 | 1997 | 1998 | 1999 | |
|---|---|---|---|---|---|---|---|---|---|---|---|---|
| 8th Grade | ||||||||||||
| Total | — | — | — | 51 | 52 | 54 | 54 | 55 | 55 | 52 | 51 | 50 |
| Gender | ||||||||||||
| Male | — | — | — | 50 | 50 | 54 | 52 | 52 | 54 | 51 | 52 | 49 |
| Female | — | — | — | 53 | 53 | 54 | 55 | 56 | 55 | 53 | 50 | 51 |
| Race | ||||||||||||
| White | — | — | — | 47 | 47 | 49 | 49 | 48 | 48 | 46 | 46 | 45 |
| Black | — | — | — | 72 | 72 | 70 | 70 | 72 | 77 | 71 | 69 | 68 |
| 10th Grade | ||||||||||||
| Total | — | — | — | 44 | 43 | 39 | 42 | 44 | 45 | 43 | 44 | 42 |
| Gender | ||||||||||||
| Male | — | — | — | 42 | 42 | 36 | 39 | 43 | 42 | 40 | 43 | 40 |
| Female | — | — | — | 46 | 44 | 42 | 45 | 45 | 47 | 45 | 46 | 44 |
| Race | ||||||||||||
| White | — | — | — | 38 | 38 | 35 | 38 | 39 | 40 | 38 | 37 | 36 |
| Black | — | — | — | 67 | 66 | 59 | 64 | 67 | 65 | 62 | 69 | 66 |
| 12th Grade | ||||||||||||
| Total | 48 | 49 | 48 | 44 | 45 | 46 | 45 | 46 | 46 | 45 | 45 | 47 |
| Gender | ||||||||||||
| Male | 48 | 50 | 46 | 41 | 42 | 43 | 44 | 41 | 44 | 41 | 42 | 44 |
| Female | 48 | 48 | 51 | 47 | 48 | 48 | 46 | 50 | 49 | 49 | 48 | 49 |
| Race | ||||||||||||
| White | 43 | 43 | 43 | 37 | 39 | 40 | 39 | 40 | 42 | 41 | 40 | 39 |
| Black | 78 | 77 | 76 | 71 | 70 | 61 | 67 | 67 | 69 | 59 | 63 | 77 |
Note: Data for 8th- and 10th-grade students are based on one of two questionnaire forms for 1991–1996, and based on two of four forms for 1997–1999, with a resulting sample size one-half of the total sample size for each grade in each year. Data for 12th-grade students are based on one of six questionnaire forms for 1989–1999 and one of five for 1980–1988, resulting in one-sixth, and one-fifth, respectively, of the total sample size for each year . Data for 8th and 10th grades have been available since 1991.
Sources: Bachman, Johnston, & O‘Malley, 1980, Questionnaire Form 5, item E06D; Bachman, Johnston, & O‘Malley, Questionnaire Form 3, item E06D; Bachman, Johnston, & O‘Malley, 1997 unpublished, Questionnaire Form 3, item E04D. Data for 8th and 10th grades are from unpublished questionnaire responses, Form 1, item E10D, for 1991-1996 and from unpublished questionnaire responses, Forms 1 & 3, item E08D, for 1997.
Table SD 1.2.B Percentage of 8th-, 10th-, and 12th-grade students in the United States reporting peer disapproval of intentionally angering a teacher in school, by gender and race: Selected years, 1980-1999
| 1976 | 1981 | 1986 | 1991 | 1992 | 1993 | 1994 | 1995 | 1996 | 1997 | 1998 | 1999 | |
|---|---|---|---|---|---|---|---|---|---|---|---|---|
| 8th Grade | ||||||||||||
| Total | — | — | — | 26 | 24 | 24 | 21 | 22 | 23 | 23 | 24 | 22 |
| Gender | ||||||||||||
| Male | — | — | — | 22 | 20 | 20 | 18 | 19 | 20 | 21 | 20 | 20 |
| Female | — | — | — | 30 | 27 | 26 | 23 | 24 | 26 | 26 | 27 | 24 |
| Race | ||||||||||||
| White | — | — | — | 26 | 24 | 24 | 22 | 22 | 23 | 24 | 24 | 23 |
| Black | — | — | — | 23 | 24 | 23 | 22 | 22 | 22 | 20 | 23 | 20 |
| 10th Grade | ||||||||||||
| Total | — | — | — | 26 | 24 | 24 | 26 | 24 | 23 | 23 | 25 | 26 |
| Gender | ||||||||||||
| Male | — | — | — | 21 | 19 | 19 | 22 | 21 | 19 | 20 | 23 | 22 |
| Female | — | — | — | 31 | 28 | 28 | 30 | 28 | 26 | 27 | 28 | 30 |
| Race | ||||||||||||
| White | — | — | — | 27 | 25 | 25 | 26 | 25 | 23 | 24 | 26 | 27 |
| Black | — | — | — | 22 | 21 | 20 | 23 | 19 | 20 | 19 | 24 | 26 |
| 12th Grade | ||||||||||||
| Total | 41 | 42 | 33 | 33 | 34 | 34 | 33 | 36 | 35 | 34 | 33 | 34 |
| Gender | ||||||||||||
| Male | 37 | 35 | 29 | 31 | 28 | 30 | 25 | 32 | 29 | 31 | 28 | 30 |
| Female | 46 | 48 | 38 | 37 | 39 | 37 | 40 | 41 | 40 | 38 | 38 | 37 |
| Race | ||||||||||||
| White | 44 | 43 | 35 | 34 | 35 | 34 | 34 | 36 | 36 | 36 | 35 | 36 |
| Black | 29 | 33 | 30 | 29 | 30 | 27 | 25 | 33 | 28 | 30 | 24 | 23 |
Note: Data for 8th- and 10th-grade students are based on one of two questionnaire forms for 1991–1996, and based on two of four forms for 1997–1999, with a resulting sample size one-half of the total sample size for each grade in each year. Data for 12th-grade students are based on one of six questionnaire forms for 1989–1999 and one of five for 1980–1988, resulting in one-sixth, and one-fifth, respectively, of the total sample size for each year. Data for 8th and 10th grades have been available since 1991.
Sources: Bachman, Johnston, & O‘Malley, Questionnaire Form 1, item D007; data for 8th and 10th grades are from unpublished questionnaire responses, Form 1, item E08, for 1991-1996 and from unpublished questionnaire responses, Forms 1 & 3, item E06.
Figure SD 1.2.A Percentage of high school seniors in the United States reporting that good grades have great or very great importance to peers, by race: 1980-1999 a
a This question was not asked in 1981.
Sources: Bachman,Johnston, & O‘Malley, 1980, Questionnaire Form 5, item E06D; Bachman, Johnston, & O‘Malley, 1982-1995, Questionnaire Form 3, item E06D; Bachman, Johnston, & O‘Malley, 1997, Questionnaire Form 3, item E04D.
Figure SD 1.2.B Percentage of high school seniors in the United States reporting peer disapproval of intentionally angering a teacher in school, by race: 1980-1999
Source: Bachman, Johnston, & O‘Malley, 1980-1997, Questionnaire Form 1, item D007.
SD 1.3 Religious Attendance and Religiosity
Research relating religion to children’s day-to-day conduct suggests that teens who are religious are more likely to avoid high-risk behaviors.4
The number of 12th-grade students who report weekly religious attendance has declined from two out of every five students (41 percent) in 1976 to one out of every three students (31-33 percent) since 1987. During that same period, the percentage of 12th-grade students who report that religion plays a very important role in their lives stayed fairly constant, varying between 25 percent and 33 percent (see Figure SD 1.3).
Differences by Age. Data for students in the 8th and 10th grades, available since 1991, indicate that younger adolescents are more likely to report weekly religious attendance but are not more likely to report that religion plays a very important role in their lives (see Tables SD 1.3.A and SD 1.3.B). In 1999, 43 percent of 8th-graders reported weekly religious attendance, versus 38 percent of 10th-grade and 33 percent of 12th-grade students. During that same year, the percentage reporting that religion played an important role in their lives was between 32 percent and 33 percent for all three grades.
Differences by Gender. Females in all grades are somewhat more likely than males to report weekly religious attendance and that religion plays a very important role in their lives (see Tables SD 1.3.A and SD 1.3.B).
Differences by Race. Black students across grades have consistently been nearly twice as likely as their white counterparts to report that religion plays a very important role in their lives; for example, in 1999, 55 percent of black 12th-graders reported that religion played such a role, compared with 29 percent of white 12th-grade students.
4 National Commission on Children. 1991. Beyond Rhetoric: A New American Agenda for Children and Families. Final Report
of the National Commission on Children, p. 352. Washington, D.C.: U.S. Government Printing Office.
Figure SD 1.3 Percentage of high school seniors in the United States reporting weekly religious attendance and reporting religion is important in their lives: 1976-1999
Sources: Johnston, Bachman, & O’Malley, 1976-1997, 12th grade 1976-1988 Questionnaire Forms 1-5; 12th grade 1989-1996 Questionnaire Forms 1-6, items C13B and C13C; 12th grade 1997 Questionnaire, Core Questions, items C13B and C13C; and 12th grade 1998 Questionnaire, Core Questions, items C12B, C13, C13B, and C13C.
Table SD 1.3.A Percentage of 8th-, 10th-, and 12th-grade students in the United States who report weekly religious attendance, by gender and race: Selected years, 1976-1999
| 1976 | 1981 | 1986 | 1991 | 1992 | 1993 | 1994 | 1995 | 1996 | 1997 | 1998a | 1999a | |
|---|---|---|---|---|---|---|---|---|---|---|---|---|
| 8th Grade | ||||||||||||
| Total | — | — | — | 46 | 43 | 42 | 42 | 42 | 43 | 44 | 45 | 43 |
| Gender | ||||||||||||
| Male | — | — | — | 44 | 41 | 39 | 40 | 40 | 40 | 42 | 42 | 41 |
| Female | — | — | — | 49 | 46 | 45 | 45 | 45 | 46 | 47 | 47 | 46 |
| Race | ||||||||||||
| White | — | — | — | 48 | 44 | 44 | 44 | 43 | 44 | 46 | 45 | 45 |
| Black | — | — | — | 47 | 46 | 42 | 42 | 46 | 45 | 46 | 49 | 46 |
| 10th Grade | ||||||||||||
| Total | — | — | — | 38 | 39 | 40 | 37 | 37 | 38 | 38 | 38 | 38 |
| Gender | ||||||||||||
| Male | — | — | — | 35 | 37 | 37 | 35 | 35 | 35 | 36 | 35 | 36 |
| Female | — | — | — | 42 | 41 | 43 | 39 | 40 | 40 | 41 | 40 | 40 |
| Race | ||||||||||||
| White | — | — | — | 39 | 39 | 41 | 37 | 37 | 38 | 39 | 37 | 37 |
| Black | — | — | — | 44 | 45 | 44 | 41 | 44 | 38 | 43 | 45 | 43 |
| 12th Grade | ||||||||||||
| Total | 41 | 40 | 34 | 31 | 32 | 32 | 32 | 32 | 33 | 31 | 32 | 33 |
| Gender | ||||||||||||
| Male | 36 | 36 | 31 | 28 | 31 | 29 | 30 | 30 | 30 | 28 | 29 | 33 |
| Female | 46 | 44 | 38 | 34 | 34 | 34 | 35 | 35 | 35 | 33 | 34 | 34 |
| Race | ||||||||||||
| White | 42 | 41 | 35 | 31 | 32 | 31 | 32 | 32 | 32 | 29 | 31 | 33 |
| Black | 37 | 40 | 36 | 38 | 35 | 35 | 39 | 40 | 38 | 40 | 41 | 40 |
a California schools omitted.
Note: Data for 8th and 10th grades available since 1991.
Sources: Johnston, Bachman, & O’Malley, 8th and 10th grade 1991-1996 Questionnaire Forms 1 and 2, item C12B, and 8th and 10th grade 1997 Questionnaire Core Questions, item C12B. 12th grade 1976-1988 Questionnaire Forms 1-5; 12th grade 1988-1996 Questionnaire Forms 1-6, item C13B; 12th grade 1997 Questionnaire Core Questions, item C13B; and 12th grade 1998 Questionnaire, Core Questions, items C12B, C13, C13B, and C13C.
Table SD 1.3.B Percentage of 8th-, 10th-, and 12th-grade students in the United States who report that religion plays a very important role in their lives, by gender and race: Selected years, 1976-1999
| 1976 | 1981 | 1986 | 1991 | 1992 | 1993 | 1994 | 1995 | 1996 | 1997 | 1998a | 1999a | |
|---|---|---|---|---|---|---|---|---|---|---|---|---|
| 8th Grade | ||||||||||||
| Total | — | — | — | 29 | 27 | 30 | 30 | 30 | 32 | 32 | 34 | 33 |
| Gender | ||||||||||||
| Male | — | — | — | 27 | 26 | 27 | 29 | 28 | 29 | 30 | 32 | 31 |
| Female | — | — | — | 31 | 28 | 32 | 32 | 32 | 34 | 34 | 36 | 36 |
| Race | ||||||||||||
| White | — | — | — | 26 | 23 | 26 | 26 | 26 | 27 | 28 | 30 | 29 |
| Black | — | — | — | 46 | 46 | 42 | 47 | 45 | 47 | 48 | 52 | 51 |
| 10th Grade | ||||||||||||
| Total | — | — | — | 29 | 28 | 29 | 28 | 29 | 29 | 30 | 31 | 32 |
| Gender | ||||||||||||
| Male | — | — | — | 26 | 26 | 26 | 24 | 26 | 26 | 28 | 29 | 28 |
| Female | — | — | — | 31 | 29 | 31 | 32 | 31 | 31 | 33 | 34 | 34 |
| Race | ||||||||||||
| White | — | — | — | 24 | 24 | 26 | 24 | 25 | 26 | 27 | 26 | 27 |
| Black | — | — | — | 52 | 50 | 50 | 48 | 49 | 47 | 48 | 52 | 55 |
| 12th Grade | ||||||||||||
| Total | 29 | 31 | 26 | 28 | 29 | 29 | 30 | 30 | 31 | 30 | 32 | 33 |
| Gender | ||||||||||||
| Male | 24 | 25 | 23 | 24 | 26 | 26 | 27 | 27 | 27 | 26 | 28 | 30 |
| Female | 34 | 36 | 30 | 31 | 33 | 33 | 32 | 33 | 35 | 34 | 36 | 35 |
| Race | ||||||||||||
| White | 26 | 27 | 23 | 24 | 25 | 24 | 26 | 26 | 27 | 24 | 27 | 29 |
| Black | 51 | 51 | 51 | 50 | 51 | 51 | 49 | 52 | 55 | 55 | 57 | 55 |
a California schools were omitted.
Note: Data for 8th and 10th grades available since 1991.
Sources: Johnston, Bachman, & O’Malley, 1976-1999, 8th and 10th grade 1991-1996 Questionnaire Forms 1 and 2, item C13 and 8th and 10th grade 1997 Questionnaire Core Questions, item C13; 12th grade 1976-1988 Questionnaire Forms 1-5; 12th grade 1989-1996 Questionnaire Forms 1-6, item C13C; 12th grade 1997 Questionnaire Core Questions, item C13C; and 12th grade 1998 Questionnaire, Core Questions, items C12B, C13, C13B, and C13C.
SD 1.4 Voting Behavior of Young Adults
Voting is a critical exercise of citizenship in a democracy. Measures of the voting behavior of young adults may be seen as indicators of the level of youth commitment to the democratic process.
Rates of reported voter registration and voting among 18- through 24-year-olds during presidential election years declined between 1972 and 1976 and have stayed rather flat through 1996 (see Table SD 1.4.A). In 1972, 59 percent of young adults ages 18 through 24 reported that they had registered to vote, and 50 percent reported that they had voted. By 1996, 46 percent reported that they had registered, and 31 percent reported that they had voted (see Figure SD 1.4.A).
Differences by Gender. Reported rates of voter registration and voting are modestly higher among women both over time and within racial and ethnic groups, particularly during presidential election years; for example, in 1996, 51 percent of females and 47 percent of males ages 18 through 24 reported that they had registered to vote (see Table SD 1.4.A).
Differences by Race and Hispanic Origin. Hispanic young adults are the least likely to report that they register and vote. In 1996, 28 percent of Hispanic young adults reported that they had registered, and 15 percent reported that they had voted. Comparable numbers for blacks are 49 percent registered and 32 percent voted. Whites were the most likely to report that they had registered (50 percent) and voted (32 percent) in 1996 (see Figure SD 1.4.B). Since 1972, the percentage of Hispanic young adults who reported that they had voted in presidential election years has declined by almost one-half, from 31 percent to 15 percent (see Table SD 1.4.A).
Differences by Electoral Cycle. The percentage of young adults who reported that they had voted in nonpresidential election years since 1974 is substantially lower than the percentage who reported that they had voted during presidential election years (see Table SD 1.4.B). Rates of reported registration and voting have been remarkably stable during such years, across nonpresidential election years, with overall rates varying by only a few percentage points across the years.
Table SD 1.4. A Percentage of persons ages 18 through 24 in the United States who reported that they had registered to vote and percentage who reported that they had voted in presidential election years, by race and Hispanic origin and by gender: Selected years, 1972-1996
| 1972 | 1976 | 1980 | 1984 | 1988 | 1992 | 1996 | ||
| Percentage who reported registering | ||||||||
| All races a | ||||||||
| Total | 59 | 51 | 49 | 51 | 48 | 53 | 49 | |
| Male | 58 | 51 | 48 | 50 | 46 | 50 | 47 | |
| Female | 59 | 52 | 50 | 53 | 51 | 54 | 51 | |
| White | ||||||||
| Total | 61 | 54 | 51 | 52 | 49 | 75 | 50 | |
| Male | 60 | 53 | 50 | 51 | 46 | 53 | 48 | |
| Female | 61 | 54 | 52 | 53 | 51 | 57 | 52 | |
| Black | ||||||||
| Total | 48 | 39 | 41 | 54 | 50 | 49 | 49 | |
| Male | 45 | 38 | 40 | 49 | 47 | 46 | 45 | |
| Female | 50 | 40 | 43 | 58 | 53 | 52 | 53 | |
| Hispanic | ||||||||
| Total | 39 | 29 | 23 | 30 | 25 | 25 | 28 | |
| Male | 38 | 30 | 20 | 27 | 21 | 20 | 25 | |
| Female | 39 | 28 | 25 | 32 | 30 | 30 | 31 | |
| Percentage who reported voting | ||||||||
| All races a | ||||||||
| Total | 50 | 42 | 40 | 41 | 36 | 43 | 32 | |
| Male | 49 | 41 | 39 | 39 | 34 | 41 | 30 | |
| Female | 50 | 43 | 41 | 43 | 38 | 45 | 35 | |
| White | ||||||||
| Total | 52 | 45 | 42 | 42 | 37 | 45 | 33 | |
| Male | 51 | 43 | 40 | 40 | 35 | 43 | 31 | |
| Female | 53 | 46 | 60 | 43 | 39 | 47 | 35 | |
| Black | ||||||||
| Total | 35 | 28 | 30 | 41 | 35 | 37 | 32 | |
| Male | 32 | 27 | 29 | 36 | 32 | 32 | 26 | |
| Female | 37 | 29 | 31 | 45 | 37 | 41 | 38 | |
| Hispanic | ||||||||
| Total | 31 | 22 | 16 | 22 | 17 | 18 | 15 | |
| Male | 30 | 22 | 13 | 20 | 14 | 14 | 12 | |
| Female | 32 | 22 | 19 | 24 | 20 | 22 | 19 | |
a Estimates for whites and blacks include Hispanics of those races. Persons of Hispanic origin may be of any race.
Note: Current Population Survey figures routinely overestimate voter registration and turnout when compared to the official rates.
Sources: U.S. Bureau of the Census, Current Population Reports, Series P-20, 466,253,322,370,405,440,504.
Figure SD 1.4.A Percentage of persons ages 18 through 24 in the United States who reported that they had registered to vote and percentage who reported that they had voted in presidential election years: Selected years, 1972-1996
Note: Current Population Survey figures routinely overestimate voter registration and turnout when compared to the official rates.
Sources: U.S. Bureau of the Census, Current Population Reports, Series P-20, 253, 293, 322, 344, 370, 405, 414, 453, 466, and PPL24-RV.
Table SD 1.4.B Percentage of persons ages 18 through 24 in the United States who reported that they had registered to vote and percentage who reported that they had voted in nonpresidential election years, by race and Hispanic origin and by gender: Selected years, 1974-1998
| 1974 | 1978 | 1982 | 1986 | 1990 | 1994 | 1998 | ||
| Percentage who reported registering | ||||||||
| All races a | ||||||||
| Total | 41 | 41 | 42 | 42 | 40 | 42 | 39 | |
| Male | 42 | 40 | 42 | 41 | 40 | 41 | 36 | |
| Female | 41 | 42 | 43 | 43 | 40 | 44 | 42 | |
| White | ||||||||
| Total | 43 | 41 | 43 | 42 | 41 | 44 | 41 | |
| Male | 44 | 41 | 44 | 42 | 40 | — | 38 | |
| Female | 42 | 42 | 43 | 43 | 41 | — | 43 | |
| Black | ||||||||
| Total | 34 | 37 | 57 | 46 | 40 | 42 | 38 | |
| Male | 31 | 35 | 38 | 43 | 41 | — | 33 | |
| Female | 36 | 40 | 45 | 49 | 40 | — | 42 | |
| Hispanic | ||||||||
| Total | 23 | 21 | 24 | 22 | 19 | 20 | 22 | |
| Male | 24 | 22 | 24 | 20 | 18 | — | 18 | |
| Female | 23 | 20 | 25 | 24 | 21 | — | 27 | |
| Percentage who reported voting | ||||||||
| All races a | ||||||||
| Total | 24 | 24 | 25 | 22 | 20 | 20 | 17 | |
| Male | 25 | 23 | 25 | 21 | 20 | 19 | 16 | |
| Female | 23 | 24 | 25 | 23 | 21 | 22 | 18 | |
| White | ||||||||
| Total | 25 | 24 | 25 | 22 | 21 | 21 | 17 | |
| Male | 29 | 24 | 26 | 21 | 20 | — | 17 | |
| Female | 24 | 25 | 24 | 22 | 22 | — | 18 | |
| Black | ||||||||
| Total | 16 | 20 | 26 | 25 | 20 | 17 | 16 | |
| Male | 16 | 19 | 24 | 24 | 20 | — | 13 | |
| Female | 17 | 21 | 27 | 26 | 21 | — | 18 | |
| Hispanic | ||||||||
| Total | 13 | 12 | 14 | 12 | 9 | 10 | 9 | |
| Male | 14 | 13 | 14 | 10 | 7 | — | 6 | |
| Female | 13 | 10 | 14 | 13 | 16 | — | 12 | |
a Estimates for whites and blacks include Hispanics of those races. Persons of Hispanic origin may be of any race.
Note: Current Population Survey figures routinely overestimate voter registration and turnout when compared to the official rates.
Sources: U.S. Bureau of the Census, Current Population Reports, Series P-20, 253, 293, 322, 344, 370, 405, 414, 453, 466, and PPL24-RV; Reported voting and registration for the United States, 1998, table 2, available online at www.census.gov/population/socdemo/voting/cps1998/tab02.txt
Figure SD 1.4.B Percentage of persons ages 18 through 24 in the United States who registered to vote and percentage who voted in nonpresidential election year 1998, by race and Hispanic origin a
a Estimates for whites and blacks include Hispanics of those races. Persons of Hispanic origin may be of any race.
Note: Current Population Survey figures routinely overestimate voter registration and turnout when compared to the official rates.
Sources: Casper, & Bass, 1998.
SD 1.5 Television Viewing Habits
Some studies indicate that excessive television watching is negatively related to the academic attainment of children and youth; for example, children and adolescents in grades 4, 8, and 11 who watch 5 or more hours of television per day have substantially lower test scores than other children on average.5 Yet, as depicted in Figure SD 1.5, substantial percentages of students report watching large amounts of television on a daily basis. The content of the television programs the students watched was not reported.
Differences by Age. The percentage of children who report watching 6 or more hours of television declines with age, as indicated in Figure SD 1.5. Among 9-year-olds, 18 percent reported watching 6 or more hours of television each day in 1996. Among 13-year-old students, 13 percent watched 6 or more hours of television. Among 17-year-olds, only 7 percent watched this amount of television each day. For all three age groups, the percentage of students spending 6 or more hours a day watching television increased between 1982 and 1986 and then declined through 1996.
Differences by Gender. Larger proportions of boys than girls at ages 9 and 13 are watching television for long periods of time (see Table SD 1.5.A). In 1996, 20 percent of 9-year-old boys watched television for 6 or more hours per day, compared with 15 percent of girls in that age group. A similar pattern is evident for 13-year-olds (see Table SD 1.5.B), while for 17-year-olds, the percentages of boys and girls watching television for long periods is the same, at 7 percent (see Table SD 1.5.C).
Differences by Race and Hispanic Origin.6 For each age group and for each time point of assessment, larger proportions of black students watch television for 6 or more hours per day than do either white or Hispanic students; for example, among 9-year-old students, 39 percent of black students, compared with 13 percent of white students and 21 percent of Hispanic students, reported watching television 6 or more hours per day in 1996 (see Table SD 1.5.A).
Differences by Type of School. In general, smaller percentages of children and adolescents who attend private school spend 6 or more hours per day watching television than do students who attend public school. The differences between public and private school pupil television viewing habits are more pronounced among 9- and 13-year-old students (see Tables SD 1.5.A, SD 1.5.B, and SD 1.5.C).
Differences by Parents’ Educational Level. Children’s television viewing habits also vary by parents’ educational level. In general, as parents’ educational levels increase, the percentages of children watching 6 or more hours of television decline. In 1996, 18 percent of 13-year-olds whose parents had less than a high school education were watching 6 or more hours of television per day, compared with 13 percent of students with parents who graduated from high school and 10 percent of students whose parents graduated from college (see Table SD 1.5.B). A similar pattern is evident for 17-year-olds (see Table SD 1.5.C).
5 U.S. Department of Education, National Center for Education Statistics. 1994. Youth Indicators 1993: Trends in the Well-Being of American Youth. Washington, D.C.: U.S. Government Printing Office.
6 Estimates for whites and blacks exclude Hispanics of those races.
Figure SD 1.5 Percentage of students in the United States who watch 6 or more hours of television per day, by age: selected years, 1982-1996
Sources: Unpublished tables, National Assessment of Educational Progress (NAEP), 1992, 1994, and 1996 Long- Term Trend Results, Math Assessment data; and unpublished Almanacs, 1978-1990.
Table SD 1.5.A Percentage of 9-year-old students in the United States who watch 6 or more hours of television per day, by gender, race and Hispanic origin, and type of school: Selected years, 1982-1996
| 1982 | 1986 | 1990 | 1992 | 1994 | 1996 | |||
|---|---|---|---|---|---|---|---|---|
| Total | 26 | 31 | 23 | 19 | 19 | 18 | ||
| Gender | ||||||||
| Male | 30 | 34 | 27 | 22 | 23 | 20 | ||
| Female | 23 | 27 | 20 | 17 | 16 | 15 | ||
| Race and Hispanic origin a | ||||||||
| White non-Hispanic | 23 | 26 | 18 | 14 | 14 | 13 | ||
| Black non-Hispanic | 43 | 53 | 47 | 41 | 40 | 39 | ||
| Hispanic | 28 | 33 | 26 | 25 | 22 | 21 | ||
| Type of school | ||||||||
| Public | 27 | 32 | 24 | 21 | 19 | 19 | ||
| Private | 21 | 24 | 18 | 5 | 11 | 7 | ||
a Estimates for whites and blacks exclude Hispanics of those races. Persons of Hispanic origin may be of any race.
Note: Parents’ education is not reported for 9-years-olds because approximately one-third of these students did not know their parents’ education level.
Sources: Unpublished tables, National Assessment of Educational Progress (NAEP), 1992, 1994, and 1996 Long-Term Trend Results, Math Assessment data; and unpublished Almanacs, 1978-1990.
Table SD 1.5.B Percentage of 13-year-old students in the United States who watch 6 or more hours of television per day, by gender, race and Hispanic origin, type of school, and parents’ highest level of education: Selected years, 1982-1996
| 1982 | 1986 | 1990 | 1992 | 1994 | 1996 | |||
|---|---|---|---|---|---|---|---|---|
| Total | 16 | 20 | 17 | 13 | 13 | 13 | ||
| Gender | ||||||||
| Male | 18 | 21 | 18 | 14 | 15 | 15 | ||
| Female | 15 | 19 | 15 | 11 | 12 | 11 | ||
| Race and Hispanic origin a | ||||||||
| White non-Hispanic | 13 | 17 | 12 | 8 | 8 | 7 | ||
| Black non-Hispanic | 32 | 40 | 35 | 31 | 35 | 35 | ||
| Hispanic | 19 | 21 | 18 | 19 | 19 | 17 | ||
| Type of school | ||||||||
| Public | 17 | 20 | 17 | 14 | 14 | 13 | ||
| Private | 13 | — | 11 | 6 | 4 | 3 | ||
| Parents’ highest level of education | ||||||||
| Less than high school | 23 | 32 | 24 | 21 | 23 | 18 | ||
| Graduated high school | 18 | 22 | 19 | 16 | 17 | 13 | ||
| More than high school | 13 | 18 | 12 | 9 | 13 | 13 | ||
| Graduated college | 12 | 15 | 13 | 9 | 9 | 10 | ||
— =Too few observations for a reliable estimate.
a Estimates for whites and blacks exclude Hispanics of those races. Persons of Hispanic origin may be of any race.
Sources: Unpublished tables, National Assessment of Educational Progress (NAEP), 1992, 1994, and 1996 Long-Term Trend Results, Math Assessment data; and unpublished Almanacs, 1978-1990.
Table SD 1.5.C Percentage of 17-year-old students in the United States who watch 6 or more hours of television per day, by gender, race and Hispanic origin, type of school, and parents’ highest level of education: Selected years, 1978-1996
| 1978 | 1982 | 1986 | 1990 | 1992 | 1994 | 1996 | |||
|---|---|---|---|---|---|---|---|---|---|
| Total | 5 | 6 | 9 | 9 | 7 | 8 | 7 | ||
| Gender | |||||||||
| Male | 5 | 7 | 10 | 9 | 7 | 10 | 7 | ||
| Female | 5 | 6 | 8 | 8 | 7 | 7 | 7 | ||
| Race and Hispanic origin a | |||||||||
| White non-Hispanic | 4 | 5 | 6 | 6 | 4 | 5 | 4 | ||
| Black non-Hispanic | 13 | 14 | 22 | 23 | 21 | 24 | 21 | ||
| Hispanic | 7 | 6 | 12 | 8 | 6 | 9 | 9 | ||
| Type of school | |||||||||
| Public | 5 | 7 | 9 | 9 | 7 | 8 | 7 | ||
| Private | 3 | 3 | — | — | 3 | 3 | 6 | ||
| Parents’ highest level of education | |||||||||
| Less than high school | 8 | 10 | 17 | 11 | 10 | 14 | 15 | ||
| Graduated high school | 5 | 8 | 10 | 11 | 10 | 12 | 9 | ||
| More than high school | 4 | 4 | 9 | 8 | 5 | 8 | 6 | ||
| Graduated college | 3 | 4 | 4 | 5 | 5 | 5 | 6 | ||
— =Too few observations for a reliable estimate.
a Estimates for whites and blacks exclude Hispanics of those races. Persons of Hispanic origin may be of any race.
Sources: Unpublished tables, National Assessment of Educational Progress (NAEP), 1992, 1994, and 1996 Long-Term Trend Results, Math Assessment data; and unpublished Almanacs, 1978-1990.
SD 1.6 Detached Youth: Percentage of 16- Through 19-Year- Olds Not in School and Not Working
“Detached youth” refers to young people ages 16 through 19 who are neither enrolled in school nor working. This detachment, particularly if it lasts for several years, increases the risk that a young person, over time, will have lower earnings and a less stable employment history than his or her peers who stayed in school and/or secured jobs.7
Since 1985, the percentage of detached youth has fluctuated between 8 and 11 percent (see Table SD 1.6). In 1999, 8 percent of all youth ages 16 through 19 were detached.
Differences by Sex. Young women are slightly more likely than young men to be detached from both school and employment. In 1999, 9 percent of young women, while 7 percent of young men experienced detachment.
Differences by Race and Hispanic Origin. Black and Hispanic youth are more likely than white youth to be detached from school and employment. In 1999, 13 percent of black youth and 14 percent of Hispanic youth experienced detachment. The corresponding rate for white youth was 6 percent.
Differences by Age. Youth ages 16 or 17 are more likely than 18- or 19-year-olds to be in school or working. In 1999, 13 percent of 18- and 19-year-olds were detached, while only 4 percent of their younger peers were detached.
7 Brown, B. 1996. Who Are America’s Disconnected Youth? Report prepared for the American Enterprise Institute.
Table SD 1.6 Percentage of 16- through 19-year-olds in the United States who are neither enrolled in school nor working,a by gender and by race and Hispanic originb and by age: Selected years, 1985-1999
| 1985 | 1990 | 1991 | 1992 | 1993 | 1994c | 1995c | 1996c | 1997c | 1998c | 1999 | |
|---|---|---|---|---|---|---|---|---|---|---|---|
| All youth | 11 | 10 | 10 | 10 | 9 | 10 | 9 | 9 | 9 | 8 | 8 |
| Gender | |||||||||||
| Male | 9 | 8 | 9 | 8 | 8 | 8 | 8 | 8 | 8 | 8 | 7 |
| Female | 13 | 12 | 13 | 12 | 11 | 11 | 11 | 11 | 10 | 9 | 9 |
| Race and Hispanic originb | |||||||||||
| White | 9 | 8 | 8 | 8 | 7 | 7 | 7 | 7 | 7 | 6 | 6 |
| Black | 18 | 15 | 17 | 17 | 15 | 14 | 14 | 15 | 13 | 13 | 13 |
| Hispanic | 17 | 17 | 16 | 17 | 16 | 16 | 16 | 14 | 14 | 14 | 14 |
| Age group | |||||||||||
| Ages 16-17 | 5 | 5 | 5 | 4 | 4 | 4 | 4 | 4 | 4 | 4 | 4 |
| Ages 18-19 | 17 | 15 | 16 | 16 | 15 | 15 | 15 | 15 | 14 | 13 | 13 |
a The figures represent a yearly average based on responses for the 9 months youth typically are in school (September through May). Youth are asked about their activities for the week prior to the survey. Results are based on uncomposited estimates and are not comparable to data from published tables.
b Persons of Hispanic origin may be of any race. Estimates for whites and blacks do not include persons of Hispanic origin.
c Data for 1994 and subsequent years are not strictly comparable with data for prior years, because of major revisions in the Current Population Survey questionnaire and data collection methodology, and because of the inclusion of the 1990 census-based population controls in the estimation process.
Source: Special tabulations of the Current Population Survey prepared by the Bureau of Labor Statistics, as published in America's Children: Key National Indicators of Well-Being, 2000. Federal Interagency Forum on Child and Family Statistics, Table ED5.
SD 1.7 Youth Violent Crime Arrest Rates (8)
The Federal Bureau of Investigation’s Violent Crime Index includes murder, forcible rape, robbery, and aggravated assault.9 The rate of youth arrests for these Index crimes increased substantially between 1980 and 1994, from 334 to 527 per 100,000 persons ages 10 through 17, and has been declining since to where it stood in 1998 at 370 per 100,000 persons ages 10 through 17 (see Table SD 1.7).
Differences by Age and Gender. Arrest rates for Violent Index crimes have consistently been much higher among males than among females over time and across all ages (see Figure SD 1.7). Rates for both males and females increased considerably between 1980 and 1994 for males and 1995 for females, with declines in the past several years for both genders. In 1998, rates for males and females age 10–17 were 597 and 130 per 100,000, respectively (see Table SD 1.7).
Youth Violent Crime Index arrest rates climb quickly and steadily with age for males, from 124 per 100,000 for 10- through 12-year-olds to 1,356 per 100,000 among 17-year-olds in 1998 (see Table SD 1.7). The rates for young women in 1998 also increase with age, with 234 arrests per 100,000, for females age 17. Girls ages 10 through 12 are the least likely to be arrested for violent crimes, with only 26 per 100,000 arrested in 1998.
8 Arrests for violent crimes were chosen in preference to other arrest measures as an indicator both because of the particular hazards that violent crime represents to our society and because arrests for violent crimes are less likely to be affected over time by changes in police practice and policy than other types of crime.
9 Violent crimes in addition to the four included in the FBI's Violent Crime Index, including kidnapping, extortion, and forcible sodomy, are not included in this indicator.
Table SD 1.7 Violent crimea arrest rates for youth ages 10 through 17b in the United States, by gender and age (per 100,000): Selected years, 1980-1998
| 1980 | 1985 | 1990 | 1991 | 1992 | 1993 | 1994 | 1995 | 1996 | 1997 | 1998 | |
|---|---|---|---|---|---|---|---|---|---|---|---|
| Total | |||||||||||
| Ages 10-17 | 334 | 303 | 428 | 461 | 482 | 504 | 527 | 518 | 460 | 443 | 370 |
| Ages 10-12 | 46 | 56 | 71 | 79 | 85 | 86 | 92 | 91 | 80 | 83 | 76 |
| Ages 13-14 | 261 | 252 | 368 | 405 | 444 | 460 | 493 | 469 | 405 | 398 | 329 |
| Age 15 | 504 | 446 | 670 | 732 | 768 | 826 | 855 | 823 | 723 | 667 | 547 |
| Age 16 | 639 | 566 | 876 | 935 | 993 | 1,026 | 1,053 | 1,031 | 896 | 869 | 696 |
| Age 17 | 740 | 651 | 983 | 1,066 | 1,056 | 1,109 | 1,111 | 1,113 | 1,013 | 944 | 814 |
| Male | |||||||||||
| Ages 10-17 | 587 | 528 | 736 | 792 | 819 | 851 | 881 | 859 | 760 | 726 | 597 |
| Ages 10-12 | 81 | 99 | 119 | 134 | 144 | 144 | 153 | 149 | 132 | 137 | 124 |
| Ages 13-14 | 445 | 425 | 601 | 664 | 720 | 739 | 787 | 744 | 640 | 622 | 507 |
| Age 15 | 876 | 769 | 1,136 | 1,241 | 1,280 | 1,373 | 1,406 | 1,337 | 1,173 | 1,072 | 865 |
| Age 16 | 1,131 | 994 | 1,521 | 1,620 | 1,711 | 1,755 | 1,785 | 1,730 | 1,500 | 1,440 | 1,135 |
| Age 17 | 1,322 | 1,159 | 1,740 | 1,888 | 1,853 | 1,930 | 1,922 | 1,914 | 1,722 | 1,600 | 1,356 |
| Female | |||||||||||
| Ages 10-17 | 70 | 67 | 105 | 112 | 127 | 140 | 153 | 158 | 144 | 144 | 130 |
| Ages 10-12 | 10 | 12 | 19 | 21 | 23 | 25 | 27 | 29 | 26 | 26 | 26 |
| Ages 13-14 | 70 | 71 | 123 | 132 | 153 | 167 | 183 | 181 | 159 | 163 | 143 |
| Age 15 | 117 | 108 | 177 | 195 | 228 | 248 | 272 | 279 | 248 | 239 | 211 |
| Age 16 | 125 | 117 | 192 | 207 | 230 | 252 | 274 | 287 | 254 | 261 | 229 |
| Age 17 | 130 | 116 | 178 | 191 | 205 | 232 | 246 | 257 | 254 | 242 | 234 |
a Violent crimes include murder, forcible rape, robbery, and aggravated assault.
b Rates were calculated assuming the age profile of the FBI's reporting sample was consistent with the profile of the U.S. resident population in that year.
Note: Estimates in this table may not be comparable to estimates provided in previous issues of Trends in the Well-Being of America’s Children and Youth due to changes in the population estimates provided by the U.S. Bureau of the Census.
Source: Snyder, 2000.
Figure SD 1.7 Violent crime a arrest rates for youth ages 10 through 17 in the United States, by gender (rate per 100,000): 1980-1998
a Violent crimes include murder, forcible rape, robbery, and aggravated assault.
Note: Estimates in this figure may not be comparable to estimates provided in previous issues of Trends in the Well-Being of America’s Children and Youth due to changes in the population estimates provided by the U.S. Bureau of the Census.
Sources: Special analysis by Howard N. Snyder, National Center for Juvenile Justice, 1999, using published and unpublished arrest data from the FBI Uniform Crime Reporting Program and population data from the U.S. Bureau of the Census. A portion of these data was originally published in Snyder, 1998.
SD 1.8 Low-Risk Teen Cumulative Risk Index (10)
Statistics often show rates of individual problem behaviors among adolescents, such as drug or alcohol use, school dropout, or early sexual activity. Yet youth engaged in one problem behavior are often engaged in others as well; their risk of immediate and long-term harm increases as the number of risky behaviors increases.11
The Low-Risk Teen Cumulative Risk Index is designed to identify the degree to which adolescents avoid a set of key problem behaviors simultaneously. This measure is created from 1995 youth-report data for five behaviors, where a youth is defined as having no risks if he or she:
- Has not been suspended or expelled from school,
- Has never had sexual intercourse,
- Has never used illegal drugs (including marijuana, cocaine, inhalants, heroin, PCP,
ecstasy, amphetamines, LSD, mushrooms, and pills), - Has never drunk alcohol unsupervised by adults, and
- Has never smoked cigarettes regularly (at least once a day for 30 days).
Differences by Age. The proportion of young people who report avoiding all of these risk behaviors decreases with age (see Figure SD 1.8). By age 15 (by the 15th birthday), slightly more than half of responding young people (53 percent) have avoided all five risk behaviors, and 32 percent have experienced two or more risks. By age 17 (by the 17th birthday), an age at which most young people are still in high school, the proportion with no risks drops to 29 percent, and nearly half (45 percent) have now experienced two or more risk behaviors. Once youth reach their 18th birthday, only 22 percent report having engaged in no risk behaviors, while 48 percent report two or more such behaviors. Table SD 1.8 presents additional data on the percentage who report only one, and two or more, risk behaviors.
No Risk Behaviors by Gender, Family Structure, and Family Income. Across the adolescent years, more girls than boys report being free of any of the five risk behaviors. Similarly, children from two-parent families are more likely than children in single-mother families to avoid risky behaviors. Family income is another mitigating factor, with children in mid- to high-income families somewhat more likely than others to report that they avoid risk behaviors (see Table SD 1.8).
10 This measure uses different source data than a similar risk index presented in previous editions of this publication and should not be compared.
11 Moore, K.A., & Glei, D.A. 1994. Taking the Plunge: An Examination of Positive Youth Development. Journal of Adolescent Research 10 (11): 15-40.
Figure SD 1.8 Percentage of youth by their 12th through 18th birthdays in the United States with no risks a on cumulative risk measure, by age b and gender: 1995
a Risks are drawn from youth reports of selected behaviors in the 1995 National Longitudinal Study of Adolescent Health. The behaviors examined for this cumulative index are suspension or expulsion from school, engaging in sexual intercourse, use of illegal drugs, unsupervised consumption of alcohol, and regular smoking of tobacco cigarettes. A status of “no risks” indicates that a youth reported involvement in none of the five tracked behaviors for each of the age periods specified.
b Age breaks for this indicator represent percentages of youth who have engaged (or not engaged) in the specified behaviors by the indicated birthdays.
Source: The National Longitudinal Study of Adolescent Health Wave 1, 1995, tabulations by Child Trends.
Table SD 1.8 Percentage of youth by their 12th through 18th birthdays in the United States who have engaged in selected riska behaviors, by age,b gender, family structure, and family income: 1995
| By age 12 | By age 13 | By age 14 | By age 15 | By age 16 | By age 17 | By age 18 | ||
|---|---|---|---|---|---|---|---|---|
| All Respondents | ||||||||
| No risks | 87 | 79 | 66 | 53 | 40 | 29 | 22 | |
| Only one risk | 3 | 5 | 10 | 15 | 21 | 26 | 30 | |
| Two or more risks | 10 | 16 | 24 | 32 | 39 | 45 | 48 | |
| Respondents with no risks | ||||||||
| Gender | ||||||||
| Male | 84 | 75 | 62 | 49 | 37 | 27 | 21 | |
| Female | 92 | 84 | 71 | 57 | 44 | 32 | 23 | |
| Family Structurec | ||||||||
| Two parents | 91 | 85 | 73 | 61 | 48 | 36 | 28 | |
| Single-mother | 84 | 73 | 58 | 43 | 32 | 23 | 16 | |
| Other | 82 | 72 | 57 | 42 | 31 | 20 | 15 | |
| Family Income | ||||||||
| $15,000 and under | 85 | 76 | 63 | 48 | 37 | 27 | 20 | |
| $15,001-$35,000 | 85 | 76 | 62 | 52 | 39 | 28 | 22 | |
| $35,001-$50,000 | 90 | 82 | 70 | 57 | 43 | 31 | 26 | |
| $50,001 and over | 92 | 85 | 72 | 58 | 45 | 33 | 23 | |
a Risks are drawn from youth reports of selected behaviors in the 1995 National Longitudinal Study of Adolescent Health. The behaviors examined for this cumulative index are suspension or expulsion from school, engaging in sexual intercourse, use of illegal drugs, unsupervised consumption of alcohol, and regular smoking of tobacco cigarettes. A status of “no risks” indicates that a youth reported involvement in none of the five tracked behaviors for each of the age periods specified.
b Age breaks for this indicator represent percentages of youth who have engaged (or not engaged) in the specified behaviors by the indicated birthdays.
c “Two parents” includes biological and adoptive parents only. The “other” category includes all family types that are not households with two biological or adoptive parents from birth, or female single-parent households. Stepfamilies, single-father families, and children living with their grandparents are included as “other” families in Table SD 1.8.
Source: The National Longitudinal Study of Adolescent Health Wave 1, 1995, tabulations by Child Trends.
SD 1.9 Closeness With Parents
The quality of relationships that youth have with parents is important for several aspects of their development; for example, a positive parent-child relationship can promote an adolescent’s ability to handle stress.12 Recent research suggests that closeness with parents serves as a protective factor against emotional distress, substance use, early sexual activity, and suicide thoughts or attempts.13
Differences by Age. More young adolescents report feeling very close to parents than do older adolescents; for example, more youth ages 12 through 14 (78 percent) report a very close relationship with their resident biological mother than do youth ages 15 through 17 (66 percent). Similar patterns are found for reports of closeness to resident and nonresident biological fathers, as well as resident nonbiological parents (see Figure SD 1.9).
Differences by Gender. Males report feeling closer to their parents than do females; for example, 74 percent of adolescent males compared with 65 percent of adolescent females report feeling very close to their resident biological mothers. Similarly, 64 percent of adolescent males report feeling very close to their resident biological fathers, compared with 51 percent of female youth.
Differences by Race and Hispanic Origin.14 More black and Hispanic youth than white youth report feeling very close to their mothers or mother figures; for example, 78 percent of black adolescents and 74 percent of Hispanic adolescents report feeling very close to their resident biological mother, while 68 percent of white adolescents report a similar relationship with their resident biological mother. Feelings of closeness with fathers followed the same pattern, with black and Hispanic youth reporting closer relationships than white youth. However, the variations by race or Hispanic origin were not as pronounced for fathers as for mothers (see Table SD 1.9).
Differences by Socioeconomic Status. Generally speaking, youth from low-income families were more likely to report being very close to their resident parents (biological and nonbiological); for example, youth whose parents earned between $5,000 and $9,999 per year were more likely to report very close relationships with their resident biological mother (78 percent) than were youth whose parents earned $25,000 to $34,999 per year (68 percent). (see Table SD 1.9).
Differences by Status of Parent. More adolescents report feelings of closeness with resident than with nonresident biological parents. Furthermore, adolescents report feeling closer to nonbiological resident parents than nonresident biological parents. For example, 70 percent of youth report feeling very close to their resident biological mother, compared with 61 percent who report feeling very close to their resident nonbiological mother and 37 percent who report feeling very close to their nonresident biological mother. Similar patterns exist for fathers and father figures.
12 Hawes, D. 1996. Who Knows Who Best: A Program to Stimulate Parent-Teen Interaction. School Counselor 44 (2): 115-121.
13 Resnick, M.D., et al. 1997. Protecting Adolescents from Harm: Findings from the National Longitudinal Study on Adolescent Health. Journal of the American Medical Association 278 (10): 823-832.
14 Estimates of whites and blacks exclude Hispanics of those races.
Table SD 1.9 Percentage of youth ages 12 through 17 in the United States who report feeling very close to their parents, by parent type and by age, gender, race and Hispanic origin, parents’ education, and socioeconomic status: 1995
| Resident Biological Mother | Resident Non-Biological Mother | Resident Biological Mother | Resident Biological Father | Resident Non-Biological Father | Resident Biological Father | |||
|---|---|---|---|---|---|---|---|---|
| Total | 70 | 61 | 37 | 58 | 34 | 21 | ||
| Age | ||||||||
| 12-14 | 78 | 71 | 38 | 68 | 44 | 29 | ||
| 15-17 | 66 | 58 | 37 | 53 | 29 | 18 | ||
| Gender | ||||||||
| Male | 74 | 64 | 41 | 64 | 40 | 25 | ||
| Female | 65 | 57 | 32 | 51 | 29 | 17 | ||
| Race and Hispanic origin a | ||||||||
| White, non-Hispanic | 68 | 58 | 31 | 58 | 34 | 20 | ||
| Black, non-Hispanic | 78 | 65 | 55 | 61 | 33 | 22 | ||
| Hispanic | 74 | 67 | 41 | 59 | 35 | 24 | ||
| Other b | 64 | 63 | 29 | 53 | 43 | 20 | ||
| Education of most educated parent | ||||||||
| Less than high school | 75 | 68 | 38 | 60 | 47 | 19 | ||
| High school graduate | 72 | 63 | 42 | 59 | 36 | 20 | ||
| Some college or postsecondary | 67 | 59 | 27 | 54 | 24 | 18 | ||
| College graduate or more | 67 | 56 | 37 | 57 | 34 | 24 | ||
| Annual household income | ||||||||
| Less than $5,000 | 78 | 74 | 48 | 77 | 72 | 31 | ||
| $5,000 - $9,999 | 78 | 57 | 36 | 66 | 54 | 23 | ||
| $10,000 - $14,999 | 75 | 71 | 44 | 56 | 36 | 15 | ||
| $15,000 - $24,999 | 73 | 72 | 38 | 60 | 43 | 20 | ||
| $25,000 - $34,999 | 68 | 49 | 42 | 59 | 32 | 17 | ||
| $35,000 - $49,999 | 72 | 51 | 33 | 62 | 34 | 24 | ||
| $50,000 - $74,999 | 67 | 53 | 47 | 57 | 28 | 23 | ||
| $75,000 - $99,999 | 65 | 61 | 36 | 56 | 33 | 20 | ||
| $100,000 + | 64 | 56 | 20 | 53 | 33 | 27 | ||
a Estimates for whites and blacks exclude Hispanics of those races. Persons of Hispanic origin may be of any race.
b “Other” race category includes respondents who chose Asian, American Indian, or other race and also did not identify themselves (in a separate question) as Hispanic.
Source: The National Longitudinal Study of Adolescent Health Wave 1, 1995, tabulations by Child Trends.
Figure SD 1.9 Percentage of youth ages 12 through 17 in the United States who report feeling very close to their parents, by age and parent type: 1995
Source: The National Longitudinal Study of Adolescent Health Wave 1, 1995, tabulations by Child Trends.
SD 1.10 Parents’ Activities With Children
Mothers and fathers are active in children’s lives in a variety of ways. In addition to providing for children’s basic care and protection, parents also serve as important teachers, mentors, role models, playmates, companions, and confidantes. The common theme of these additional roles is the direct interaction that takes place between parent and child in various contexts. Recent research indicates that positive interactions between parents and children foster positive developmental outcomes for children.15 Furthermore, there is a growing interest in identifying ways that fathers’ involvement in children’s lives uniquely contributes to child well-being.16
Data from the first and second waves of the National Survey of Families and Households (NSFH 1988 and 1995) were used to examine mothers’ and fathers’ interactions with their children (ages 5 through 17) in daily activities. Activities included eating meals together, spending time in activities away from home, working on a project together, having private talks, and helping with reading or homework.
As shown in Table SD 1.10.A, findings from the 1995 data include the following:
- Over half of mothers (55 percent) and two-fifths of fathers (42 percent) eat dinner with their child every day of the week.
- A similar percentage of mothers and fathers report going on outings with their childseveral times a week (17 percent and 18 percent for mothers and fathers, respectively) as well as almost every day (7 percent and 5 percent, respectively).
- Twenty percent of mothers and 12 percent of fathers worked on a project at home with their child almost every day. An additional 32 percent of mothers and 28 percent of fathers worked on a project with their child several times a week.
- The majority of mothers often engage their children in private conversations, with 22 percent reporting having private talks almost every day and another 31 percent reporting private talks several times a week. Among fathers, 21 percent reported having private talks with their children at least several times a week.
- Mothers are also frequently helping their children with homework and reading. Forty percent report this type of interaction on an almost daily basis, with an additional 29 percent reporting helping their child with homework several times a week. One-third (33 percent) of fathers also report helping with homework several times a week, with a smaller group (13 percent) reporting helping almost every day.
Trends in Parental Activities. There was a significant drop in high levels of parent-child activity between 1988 and 1995 in most activities (see Table SD 1.10.A); for example, 62 percent of mothers reported eating dinner with their child on a daily basis in 1988, but in 1995 only 55 percent reported doing so. Similarly, 50 percent of fathers ate a daily dinner with their child in 1988, but in 1995 this rate dropped to 42 percent. Another example involves the rate at which parents engage their children in private talks. There was a 7 percentage point drop (from 29 to 22 percent) between 1988 and 1995 in the proportion of mothers who had private talks with their children almost every day. Similarly, there was a 5 percentage point drop (from 11 to 6 percent) in the proportion of fathers who had almost daily private talks with their children. Decreases in the amount of time parents spend in activities outside the home and working on projects inside the home were also found.
Differences by Race and Hispanic Origin.17 In 1995, white (55 percent) and Hispanic mothers (65 percent) were more likely than black mothers (49 percent) to report eating dinner with their child every day (see Table SD 1.10.B). Other racial/ethnic differences were also evident; for example, Hispanic mothers (17 percent) were more likely than white mothers (6 percent) to go on outings with their children almost every day in 1995 (see Table SD 1.10.B). On the other hand, black mothers (50 percent) were more likely than white mothers (38 percent) to help their children with homework or reading almost every day (see Figure SD 1.10). In general, father involvement in 1995 did not appear to vary by race and Hispanic origin; however, black fathers (11 percent) were more likely than white fathers (4 percent) to take their children on outings almost every day (see Table SD 1.10.B).
15 Hawes, D., 1996.
16 Lamb, M.E. 1997. Fathers and Child Development: An Introductory Overview and Guide. In M.E. Lamb (Ed.), The Role of the Father in Child Development, pp. 1-18. New York: John Wiley & Sons, Inc.
17 Estimates of whites and blacks exclude Hispanics of those races.
Table SD 1.10.A Percentage of parents in the United States who engage in selected activities with their children ages 5 through 17, by parent and type of activity: 1988 and 1995
| Mothers | Fathers | |||
| 1988 | 1995 | 1988 | 1995 | |
| Days per week eat dinner with at least one child | ||||
| 0 days | 2 | 2 | 4 | 3 |
| 1-3 days | 9 | 10 | 13 | 15 |
| 4-6 days | 27 | 33 | 33 | 39 |
| Every day | 62 | 55 | 50 | 42 |
| Time spent with children in activities away from home | ||||
| Never or rarely | 6 | 5 | 6 | 5 |
| Once a month or less | 15 | 20 | 18 | 24 |
| Several times a month | 25 | 29 | 25 | 29 |
| About once a week | 23 | 22 | 26 | 20 |
| Several times a week | 18 | 17 | 15 | 18 |
| Almost every day | 13 | 7 | 9 | 5 |
| Time spent with children at home working on a project | ||||
| Never or rarely | 4 | 4 | 5 | 3 |
| Once a month or less | 9 | 9 | 10 | 13 |
| Several times a month | 14 | 17 | 17 | 27 |
| About once a week | 14 | 18 | 17 | 17 |
| Several times a week | 28 | 32 | 33 | 28 |
| Almost every day | 31 | 20 | 18 | 12 |
| Time spent with children having private talks | ||||
| Never or rarely | 2 | 2 | 8 | 7 |
| Once a month or less | 7 | 7 | 17 | 19 |
| Several times a month | 14 | 17 | 20 | 23 |
| About once a week | 18 | 22 | 22 | 24 |
| Several times a week | 29 | 31 | 21 | 21 |
| Almost every day | 29 | 22 | 11 | 6 |
| Time spent with children helping with reading or homework | ||||
| Never or rarely | 9 | 7 | 15 | 10 |
| Once a month or less | 6 | 6 | 13 | 13 |
| Several times a month | 9 | 8 | 17 | 16 |
| About once a week | 11 | 11 | 16 | 16 |
| Several times a week | 27 | 29 | 26 | 33 |
| Almost every day | 38 | 40 | 14 | 13 |
Source: The National Survey of Families and Households (NSFH), Wave 1, 1988, and Wave 2, 1995, tabulations by Dr. Randal Day, Washington State University.
Table SD 1.10.B Percentage of parents in the United States who engage in selected activities with their children ages 5 through 17, by parent, race and Hispanic origin,a and type of activity: 1995
| Mothers | Fathers | |||||
| White | Black | Hispanica | White | Black | Hispanica | |
| Days per week eat dinner with at least one child | ||||||
| 0 days | 1 | 5 | 1 | 3 | 9 | 2 |
| 1-3 days | 9 | 15 | 9 | 14 | 23 | 19 |
| 4-6 days | 34 | 32 | 24 | 40 | 35 | 37 |
| Every day | 55 | 49 | 65 | 43 | 34 | 43 |
| Time spent with children in activities away from home | ||||||
| Never or rarely | 4 | 9 | 11 | 4 | 11 | 8 |
| Once a month or less | 19 | 22 | 19 | 22 | 26 | 28 |
| Several times a month | 30 | 27 | 20 | 31 | 26 | 22 |
| About once a week | 23 | 21 | 21 | 21 | 12 | 24 |
| Several times a week | 19 | 12 | 12 | 19 | 15 | 12 |
| Almost every day | 6 | 9 | 17 | 4 | 11 | 5 |
| Time spent with children at home working on a project | ||||||
| Never or rarely | 3 | 5 | 7 | 2 | 7 | 2 |
| Once a month or less | 9 | 8 | 8 | 11 | 23 | 12 |
| Several times a month | 17 | 21 | 14 | 29 | 18 | 27 |
| About once a week | 18 | 22 | 17 | 18 | 13 | 18 |
| Several times a week | 34 | 24 | 25 | 28 | 25 | 32 |
| Almost every day | 19 | 20 | 29 | 12 | 14 | 8 |
| Time spent with children having private talks | ||||||
| Never or rarely | 2 | 2 | 5 | 6 | 10 | 7 |
| Once a month or less | 7 | 9 | 7 | 20 | 17 | 17 |
| Several times a month | 17 | 15 | 18 | 23 | 19 | 23 |
| About once a week | 22 | 22 | 18 | 24 | 26 | 23 |
| Several times a week | 31 | 30 | 29 | 21 | 22 | 23 |
| Almost every day | 21 | 22 | 23 | 6 | 7 | 7 |
| Time spent with children helping with reading or homework | ||||||
| Never or rarely | 7 | 6 | 7 | 9 | 19 | 9 |
| Once a month or less | 6 | 5 | 6 | 14 | 9 | 9 |
| Several times a month | 9 | 7 | 9 | 16 | 14 | 16 |
| About once a week | 11 | 9 | 16 | 15 | 13 | 21 |
| Several times a week | 31 | 23 | 20 | 33 | 31 | 32 |
| Almost every day | 38 | 50 | 42 | 13 | 15 | 13 |
a Estimates for whites and blacks exclude Hispanics of those races. Persons of Hispanic origin may be of any race.
Source: The National Survey of Families and Households (NSFH), Wave 2, 1995, tabulations by Dr. Randal Day,
Washington State University.
Figure SD 1.10 Percentage of parents in the United States with children ages 5 through 17 who help their child with homework almost ever y day, by gender of parent and race and Hispanic origin: a 1995
a Estimates for whites and blacks include Hispanics of those races. Persons of Hispanic origin may be of any race.
Source: The National Survey of Families and Households (NSFH), Wave 2, 1995, tabulations by Dr. Randal Day, Washington State University.
Behavioral Health: Physical Health And Safety
SD 2.1 Physical Fighting by Youth
Physical violence is a major cause of injury and homicide among adolescents.18 In 1999, almost half of all male students and one-quarter of female students in grades 9 through 12 reported having been involved in a physical fight during the previous year. However, the percentage of all students who reported involvement in a fight decreased significantly between 1991 and 1999, from 43 percent to 36 percent. For males, the percentage decreased from 50 percent in 1991 to 44 percent in 1999 (see Figure SD 2.1).
Differences by Age. For all the years included in Table SD 2.1, the percentage of students who reported being involved in fights decreased with age. In 1997, 45 percent of 9th-grade students and 29 percent of 12th-grade students reported being involved in a fight. It is unclear, however, whether this pattern reflects the effects of increasing maturity, a change in the propensity to report having been in a fight, or a tendency for violence-prone youth to drop out of school, leaving a less violent pool of students in the higher grades.
Differences by Race.19 In 1999, 33 percent of white students reported involvement in a physical fight within the past year, compared with 41 percent of black students and 40 percent of Hispanic students (see Table SD 2.1).
18 Injuries were the leading cause of death for 15- to 19-year-olds in 1995 and 1996, accounting for 80 percent of all deaths. Injury-related mortality includes death from motor vehicle crashes, fires and burns, drowning, suffocation, and accidents caused by firearms and other explosive materials, among others. The rate of death from homicide for youth ages 15 through 19 more than doubled between 1970 and 1994 but decreased 37 percent between 1994 and 1997. (See, for injury-related and homicide mortality, the report section “Health Conditions and Health Care,” indicators HC 1.2 and HC 1.4, this report). See also: University of California at Los Angeles, CDC (Centers for Disease Control and Prevention). “The Epidemiology of Homicide in Los Angeles, 1970-79.” Atlanta: U.S. Department of Health and Human Services, Public Health Service, CDC, 1985. Cited in Chronic Disease and Health Promotion, Reprints from the Morbidity and Mortality Weekly Report: 1990-1991 Youth Risk Behavior Surveillance System. Atlanta: U.S. Department of Health and Human Services, Public Health Service, CDC, 1992, p. 37.
19 Estimates for whites and blacks exclude Hispanics of those races.
Figure SD 2.1 Percentage of students in grades 9 through 12 in the United States reporting that they have been in a physical fight within the past year, by gender: 1991, 1993, 1995, 1997, and 1999
Sources: Unpublished tabulations of the Youth Risk Behavior Surveillance System (YRBSS) provided by the Division of Adolescent and School Health, National Center for Chronic Disease Prevention and Health Promotion, Centers for Disease Control, Kann et al., 1995, Table 6, p. 26; Kann et al., 1996, Table 6, p. 35; Kann et al., 1998, Table 6, p. 41.
Table SD 2.1 Percentage of students in grades 9 through 12 in the United States reporting that they have been in a physical fighta within the past year, by gender, grade, and race and Hispanic origin: 1991, 1993, 1995, 1997, and 1999
| 1991 | 1993 | 1995 | 1997 | 1999 | |||||||||||
| Total | Male | Female | Total | Male | Female | Total | Male | Female | Total | Male | Female | Total | Male | Female | |
| Total | 43 | 50 | 34 | 42 | 51 | 32 | 39 | 46 | 31 | 37 | 46 | 26 | 36 | 44 | 27 |
| Grade | |||||||||||||||
| Ninth | 51 | 58 | 43 | 50 | 59 | 41 | 47 | 55 | 37 | 45 | 56 | 32 | 41 | 50 | 33 |
| Tenth | 43 | 50 | 35 | 42 | 52 | 32 | 40 | 46 | 34 | 40 | 48 | 30 | 38 | 46 | 29 |
| Eleventh | 43 | 51 | 35 | 41 | 52 | 28 | 37 | 46 | 28 | 34 | 44 | 23 | 31 | 39 | 23 |
| Twelfth | 34 | 42 | 25 | 35 | 43 | 27 | 31 | 38 | 24 | 29 | 37 | 19 | 30 | 39 | 22 |
| Race and Hispanic originb | |||||||||||||||
| White | 41 | 49 | 32 | 40 | 50 | 30 | 36 | 44 | 27 | 34 | 43 | 21 | 33 | 43 | 22 |
| Black | 51 | 58 | 44 | 50 | 58 | 42 | 42 | 49 | 35 | 43 | 49 | 38 | 41 | 44 | 39 |
| Hispanic | 41 | 49 | 35 | 43 | 52 | 34 | 48 | 56 | 40 | 41 | 50 | 30 | 40 | 51 | 30 |
a One or more times.
b Estimates for whites and blacks exclude Hispanics of those races. Persons of Hispanic origin may be of any race.
Sources: Unpublished tabulations of the Youth Risk Behavior Surveillance System (YRBSS) provided by the Division of Adolescent and School Health, National Center for Chronic Disease Prevention and Health Promotion, Centers for Disease Control. Kann et al.; 1995, Table 6, p. 26; Kann et al.; 1996, Table 6, p. 35; Kann et al.; 1998, Table 6, p. 41.
SD 2.2 Weapon Carrying Among High School Youth
Weapon carrying is associated with the most serious injuries resulting from violence. Carrying a weapon significantly increases the risk that a violent argument will result in death, disability, or other serious injury.20
Since 1991, the percentage of students who report carrying a weapon such as a gun, knife, or club at least once in the past month has declined; for example, in 1999, 17 percent of students in grades 9 through 12 reported carrying a weapon, compared with 26 percent in 1991 (see Table SD 2.2A).
Differences by Age. In general, students in the lower grades are more likely than students in the upper grades to carry a weapon. In 1999, 18 percent of 9th graders reported having carried a weapon in the past 30 days, compared with 16 percent of 12th graders.
Differences by Gender. High school males are much more likely than females to carry a weapon. This is true across all grades and for all racial and ethnic groups (see Figure SD 2.2.A); for example, in 1999, 29 percent of males in grades 9 through 12 reported carrying a weapon, compared with 7 percent of females.
Differences by Race and Hispanic Origin.21 In 1999, 16 percent of white, 17 percent of black, and 19 percent of Hispanic students reported having carried a weapon. For white and black students, these represent reductions from 1991 rates of 25 and 33 percent, respectively.
Youth Who Report Carrying a Gun. The number of students who reported carrying a gun at some time in the past 30 days declined significantly between 1993 and 1999. In 1999, 5 percent of high school students reported having carried a gun, including 12 percent of black students, 8 percent of Hispanic students, and 4 percent of white students (see Table SD 2.2.B).
20 Public Health Service. 1993. Measuring the Health Behavior of Adolescents: The Youth Risk Behavior Surveillance System and Recent Public Health Reports on High-Risk Adolescents. Public Health Reports 108 (Supp. 1). Rockville, MD.
21 Estimates for whites and blacks exclude Hispanics of those races.
Table SD 2.2.A Percentage of students in grades 9 through 12 in the United States who reported having carried a weapona at least once within the past 30 days, by gender, grade, and race and Hispanic origin: 1991, 1993, 1995, 1997, and 1999
| 1991 | 1993 | 1995 | 1997 | 1999 | |||||||||||
| Total | Male | Female | Total | Male | Female | Total | Male | Female | Total | Male | Female | Total | Male | Female | |
| Total | 26 | 41 | 11 | 22 | 34 | 9 | 20 | 31 | 8 | 18 | 28 | 7 | 17 | 29 | 6 |
| Grade | |||||||||||||||
| Ninth | 28 | 44 | 10 | 26 | 39 | 11 | 23 | 34 | 9 | 23 | 33 | 11 | 18 | 29 | 7 |
| Tenth | 27 | 42 | 11 | 21 | 33 | 10 | 21 | 32 | 9 | 17 | 27 | 6 | 19 | 31 | 5 |
| Eleventh | 29 | 44 | 13 | 22 | 33 | 9 | 20 | 32 | 8 | 18 | 29 | 6 | 16 | 27 | 5 |
| Twelfth | 21 | 33 | 10 | 20 | 33 | 7 | 16 | 26 | 6 | 15 | 23 | 5 | 16 | 27 | 5 |
| Race and Hispanic originb | |||||||||||||||
| White | 25 | 41 | 8 | 21 | 33 | 7 | 19 | 31 | 6 | 17 | 27 | 4 | 16 | 29 | 4 |
| Black | 33 | 43 | 24 | 29 | 38 | 19 | 22 | 30 | 16 | 22 | 29 | 15 | 17 | 23 | 12 |
| Hispanic | 26 | 40 | 13 | 24 | 37 | 12 | 25 | 37 | 13 | 23 | 35 | 10 | 19 | 30 | 8 |
a Students were asked whether they carried a weapon “such as a gun, knife, or club” on at least one of the 30 days preceding the survey.
b Estimates for whites and blacks exclude Hispanics of those races. Persons of Hispanic origin may be of any race.
Sources: Centers for Disease Control and Prevention. 1990-1991 Youth Risk Behavior Surveillance System (YRBSS), Table 2, p. 68; Kann et al., 44 (SS-1), 45 (SS-4), 47 (SS-3), Table 4 in each.
Figure SD 2.2.A Percentage of students in grades 9 through 12 in the United States who reported having carried a weapon a at least once within the past 30 days, by gender and by raceb and Hispanic origin: 1999
a Students were asked whether they carried a weapon “such as a gun, knife, or club” on at least one of the 30 days preceding the survey.
b Estimates for whites and blacks exclude Hispanics of those races. Persons of Hispanic origin may be of any race.
Source: Kann, et al., 1998, Table 4, p. 38.
Table SD 2.2.B Percentage of students in grades 9 through 12 in the United States who reported having carried a gun at least once within the past 30 days, by gender, grade, and race and Hispanic origin: 1993, 1995, 1997, and 1999
| 1993 | 1995 | 1997 | 1999 | |||||||||
| Total | Male | Female | Total | Male | Female | Total | Male | Female | Total | Male | Female | |
| Total | 8 | 14 | 2 | 8 | 12 | 3 | 6 | 10 | 2 | 5 | 9 | 1 |
| Grade | ||||||||||||
| Ninth | 9 | 16 | 2 | 9 | 14 | 3 | 8 | 13 | 3 | 5 | 10 | 1 |
| Tenth | 9 | 15 | 2 | 8 | 13 | 3 | 6 | 10 | 1 | 5 | 10 | 1 |
| Eleventh | 7 | 13 | 1 | 7 | 12 | 1 | 6 | 9 | 1 | 4 | 7 | 1 |
| Twelfth | 7 | 12 | 1 | 6 | 11 | 2 | 5 | 8 | 1 | 5 | 8 | 1 |
| Race and Hispanic origina | ||||||||||||
| White | 7 | 12 | 1 | 6 | 10 | 2 | 4 | 7 | 1 | 4 | 8 | 1 |
| Black | 12 | 21 | 4 | 11 | 19 | 4 | 9 | 16 | 3 | 8 | 15 | 2 |
| Hispanic | 10 | 17 | 3 | 11 | 17 | 5 | 10 | 17 | 2 | 5 | 8 | 2 |
a Estimates for whites and blacks exclude Hispanics of those races. Persons of Hispanic origin may be of any race.
Source: Kann et al., 1995, 44 (SS-1), Table 4, p. 23; Kann et al., 1996 45 (SS-4), Table 4, p. 32; Kann et al., 1998, 47 (SS-3), Table 4, p. 38.
Figure SD 2.2.B Percentage of students in grades 9 through 12 in the United States who reported having carried a gun at least once within the past 30 days, by gender and by race and Hispanic origin a: 1999
a Estimates for whites and blacks exclude Hispanics of those races. Persons of Hispanic origin may be of any race.
Source: Kann et al., 1998, Table 4, p. 38.
SD 2.3 Seat Belt Use
Motor vehicle crashes are among the leading causes of death for children and youth.22 Consistent use of seat belts and child safety seats dramatically lessens the risk of injury or death in a motor vehicle crash. The National Highway Traffic Safety Administration estimates that in 1998, 51 percent of all children under age 5 who were killed while occupants of a motor vehicle were not protected by seat belts or child safety seats.23
Table SD 2.3 presents data from the National Occupant Protection Use Survey (NOPUS), which gathers data through observation at intersections.24 Between 1996 and 1998, seat belt use among toddlers ages 1 to 4 increased dramatically from 60 percent to 91 percent. Use among infants under 1 year old increased from 85 percent to 97 percent during the same time period. While these are promising trends, recent research indicates as many as 85 percent of parents and caregivers who do use car seats continue to install and use car seats incorrectly.25
Between 1996 and 1998 rates of seat belt use increased modestly for persons ages 5 to 15 and 16 to 24, from 65 to 69 percent and 50 to 55 percent, respectively.
Differences by Age. The use of child safety seats or seat belts is substantially higher at younger ages. In 1998, rates were 97 percent for infants, 87 percent for children ages 1 to 4, 69 percent for children ages 5 to 15, and 55 percent for ages 16 to 24 (see Figure SD 2.3).
22 Hoyert, D.L., Kochanek. K.D., & Murphy, S.L. Deaths: Final Data for 1997. National Vital Statistics Reports 47 (19), Table 8. Hyattsville, MD: National Center for Health Statistics.
23 National Highway Traffic Safety Administration. 1997. Traffic Safety Facts 1998. DOT HS 808 765. Washington, D.C.: U.S. Department of Transportation.
24 Previous editions of Trends in the Well-Being of America’s Children and Youth presented seat belt data based on parent report rather than observation. Estimates based on parent report are higher than those based on observation.
25 The study identified several frequent misuses of rear-facing, forward-facing, and booster seats for observed children, including 63 percent in seats not held tightly by safety belts, 33 percent with loose harness straps, and 20 percent with harness straps incorrectly routed through the seats. National SAFE KIDS Campaign. 1999. Child Passengers at Risk in America: A National Study of Car Seat Misuse. Washington, D.C.: National SAFE KIDS Campaign. Summary results online at: http://www.safekids.org/buckleup/study.html.
Figure SD 2.3 Percentage of children and youth in the United States who are obser ved to have worn a seat belt or been placed in a child safety seat, by age: a 1998
a Age group is based on the best judgment of the observers in the National Occupant Protection Use Survey (NOPUS) Controlled Intersection Study. Source: Transportation Secretary Slater Hails Increased Seat Belt Use, NHTSA 21-99, May 24, 1999. 1994 and 1996 estimates from National Occupant Protection Use Survey—1996: Controlled Intersection Study. Research Note. National Highway Traffic Safety Administration, U.S. Department of Transportation, August 1997.
Table SD 2.3 Percentage of children and youth in the United States who are observed to have worn a seat belt or been placed in a child safety seat, by age:a 1994, 1996, and 1998
| 1994 | 1996 | 1998 | |
| Infants (under age 1)b | 88 | 85 | 97 |
| Toddlers (1-4 years)c | 61 | 60 | 91 |
| Youths (5-15 years) | 58 | 65 | 69 |
| Young adults (16-24 years) | 53 | 50 | 55 |
a Age group is based on the best judgment of the observers in the National Occupant Protection Use Survey (NOPUS) Controlled Intersection Study.
b Use of restraints for infants refers to child safety seats.
c Use of restraints for toddlers refers to safety belts or child safety seats.
Source: 1998 Estimates from U.S. Department of Transportation, National Highway Traffic Safety Administration, 1999, Seat Belt Use; 1994 and 1996 estimates from National Occupant Protection Use Survey—1996: Controlled Intersection Study. Research Note. National Highway Traffic Safety Administration, U.S. Department of Transportation, August 1997.
SD 2.4 Regular Physical Exercise
Sixty percent of Americans do not exercise regularly, according to a 1996 report by the surgeon general, despite the many health benefits associated with physical activity.26 People of all ages, both male and female, benefit from regular physical activity. Significant health benefits can be obtained by including a moderate amount of physical activity (e.g., 30 minutes of brisk walking or raking leaves, 15 minutes of running, or 45 minutes of playing volleyball) on most, if not all, days of the week.
The percentage of 12th-grade students who report actively participating in sports or exercise “almost every day” has remained fairly stable since 1976, varying between 44 and 48 percent. Rates have also been stable for 8th- and 10th-grade students since 1991, the first year in which data were collected for those grades (see Table SD 2.4.A).
Differences by Age. The percentages of students who report that they actively participate in sports or exercise “almost every day” decreased with age. In 1999, for example, 53 percent of 8th graders, 52 percent of 10th graders, and 45 percent of 12th graders reported daily or almost daily exercise (see Figure SD 2.4). A similar pattern emerged in a survey that asked teens whether they had exercised vigorously three or more times in the past week (see Table SD 2.4.B).
Differences by Gender. Males consistently report exercising or participating in sports more often than females. In 1999, for each age group, male rates were 14 to 17 percentage points higher than female rates, a trend that exists for nearly every year that data are available (see Table SD 2.4.A).
Differences by Race. Black and white students in the 8th grade are about equally likely to exercise regularly (see Table SD 2.4.A). Among 10th- and 12th-grade students, blacks appeared to be less likely than whites to exercise regularly in 1999. Other survey data, reported in Table SD 2.4.B, show larger differences by race and Hispanic origin. In 1999, 67 percent of white teens reported exercising vigorously at least three times a week, compared with 56 percent of non-Hispanic black teens and 61 percent of Hispanic teens.
26 U.S. Department of Health and Human Services. 1996. Physical Activity and Health: A Report of the Surgeon General. Atlanta: U.S. Department of Health and Human Services, Centers for Disease Control and Prevention, National Center for Chronic Disease Prevention and Health Promotion.
Table SD 2.4.A Percentage of 8th-, 10th-, and 12th-grade students in the United States who report that they actively participate in sports or exercise "almost every day," by gender and race: Selected years, 1976-1999
| 1976 | 1981 | 1986 | 1991 | 1992 | 1993 | 1994 | 1995 | 1996 | 1997 | 1998 | 1999 | |
|---|---|---|---|---|---|---|---|---|---|---|---|---|
| 8th Grade | ||||||||||||
| Total | — | — | — | 57 | 55 | 55 | 53 | 56 | 54 | 55 | 53 | 53 |
| Gender | ||||||||||||
| Male | — | — | — | 65 | 65 | 65 | 63 | 66 | 63 | 63 | 61 | 60 |
| Female | — | — | — | 49 | 45 | 46 | 44 | 47 | 47 | 48 | 45 | 46 |
| Race | ||||||||||||
| White | — | — | — | 58 | 56 | 58 | 56 | 59 | 57 | 58 | 56 | 55 |
| Black | — | — | — | 61 | 57 | 54 | 52 | 55 | 56 | 56 | 54 | 55 |
| 10th Grade | ||||||||||||
| Total | — | — | — | 54 | 54 | 53 | 53 | 53 | 52 | 52 | 50 | 52 |
| Gender | ||||||||||||
| Male | — | — | — | 63 | 64 | 62 | 62 | 62 | 60 | 60 | 58 | 60 |
| Female | — | — | — | 45 | 45 | 45 | 44 | 45 | 44 | 45 | 42 | 44 |
| Race | ||||||||||||
| White | — | — | — | 55 | 55 | 54 | 54 | 55 | 53 | 54 | 52 | 54 |
| Black | — | — | — | 54 | 52 | 56 | 50 | 52 | 53 | 52 | 47 | 47 |
| 12th Grade | ||||||||||||
| Total | 44 | 48 | 44 | 46 | 46 | 44 | 45 | 45 | 45 | 45 | 44 | 45 |
| Gender | ||||||||||||
| Male | 52 | 56 | 54 | 55 | 59 | 55 | 56 | 55 | 58 | 56 | 53 | 54 |
| Female | 36 | 39 | 36 | 36 | 33 | 33 | 36 | 37 | 32 | 36 | 35 | 37 |
| Race | ||||||||||||
| White | 43 | 47 | 46 | 48 | 48 | 46 | 49 | 46 | 48 | 46 | 46 | 48 |
| Black | 49 | 53 | 43 | 43 | 41 | 39 | 39 | 48 | 40 | 38 | 38 | 40 |
Sources: Bachman, Johnston, & O’Malley, 1976, 1981, 1986, 1991, 1992, 1993, 1994, 1995, 1996, 1997, 1998, and 1999 (prepublication tables). 8th and 10th grade 1991 Questionnaire Forms 1 and 2, item A04E; 1992-1996 Questionnaire Forms 1 and 2, item A03E; and 1997 Questionnaire Forms 1-6, item A03E. 12th grade 1976, 1981, 1986, and 1991-1997 Questionnaire Form 2, item A02H.
Figure SD 2.4 Percentage of 8th-, 10th-, and 12th-grade students who report that they actively participate in sports or exercise “almost every day,” by gender: 1999
Source: Bachman, Johnston, & O’Malley, 1999 (prepublication tables), items A03E and A02H.
Table SD 2.4.B Percentage of students in grades 9 through 12 in the United States who report having exercised vigorously three or more times in the past 7 days, by gender, grade, and race and Hispanic origin: 1993, 1995, 1997, and 1999
| 1993 | 1995 | 1997 | 1999 | |||||||||
| Total | Male | Female | Total | Male | Female | Total | Male | Female | Total | Male | Female | |
| Total | 66 | 75 | 56 | 64 | 74 | 52 | 64 | 72 | 54 | 65 | 72 | 57 |
| Grade | ||||||||||||
| Ninth | 75 | 81 | 68 | 72 | 80 | 62 | 73 | 79 | 66 | 73 | 77 | 68 |
| Tenth | 70 | 77 | 61 | 69 | 79 | 59 | 66 | 74 | 56 | 65 | 73 | 56 |
| Eleventh | 63 | 71 | 53 | 60 | 72 | 47 | 60 | 69 | 49 | 58 | 67 | 49 |
| Twelfth | 58 | 70 | 45 | 55 | 67 | 42 | 58 | 68 | 44 | 61 | 71 | 52 |
| Race and Hispanic origina | ||||||||||||
| White | 68 | 76 | 59 | 67 | 76 | 57 | 67 | 73 | 58 | 67 | 75 | 60 |
| Black | 60 | 71 | 49 | 53 | 68 | 41 | 54 | 67 | 41 | 56 | 65 | 47 |
| Hispanic | 59 | 69 | 50 | 57 | 70 | 45 | 60 | 69 | 50 | 61 | 72 | 50 |
a Estimates for whites and blacks exclude Hispanics of those races. Persons of Hispanic origin may be of any race. Note: Vigorous physical exercise is defined as activities that cause sweating and hard breathing for at least 20 minutes.
Sources: Kann et al., 1995, Table 24, p. 53; Kann et al., 1996, Table 36, p. 78; Kann et al., 1998, Table 36, p. 84.
SD 2.5 Sufficient Hours of Sleep
Getting sufficient hours of sleep on a regular basis is important for optimum functioning throughout the day. Getting enough sleep is also linked to physical health. Individuals who are chronically sleep-deprived may be more susceptible to physical illness and more prone to accidents due to lack of concentration or inattention. Research indicates that sleep loss has a negative effect on motor performance, cognitive function, and mood.27 For adolescents, not getting enough sleep may translate into lower performance in school or may affect socialization.
The number of hours that prove to be sufficient may differ between ages and individuals. A recent survey indicates that males ages 12 through 17 average 65.8 hours of sleep per week and females of the same age average 66.8 hours per week (approximately 9.5 hours of sleep a night for both sexes).28 Analyses based on data from the 1995 National Longitudinal Study of Adolescent Health allow for an examination of youth perceptions of whether they obtain the sleep they need. In 1995, 74.1 percent of youth ages 12 through 17 reported that they got enough sleep (see Table SD 2.5).
Differences by Gender. Adolescent males are more likely to report getting enough sleep than their female peers. In 1995, 76.4 percent of males ages 12 through 17 reported getting enough sleep, compared with 71.8 percent of females.
Differences by Age and Grade. In 1995, approximately four out of every five (82.2 percent) youth ages 12 through 14 reported getting enough sleep, compared with 70.5 percent of youth ages 15 through 17. Similarly, in grades 7 and 8, 83.3 percent of students reported getting enough sleep, compared with 72.5 percent of students in grades 9 and 10 and 66.5 percent of students in grades 11 and 12.
Differences by Family Structure. Lower percentages of adolescents who live with a single father reported getting enough sleep (65.6 percent), compared with adolescents in other living arrangements (see Table SD 2.5).
27 Pilcher, J., & Huffcut, A. 1996. Effects of Sleep Deprivation on Performance: A Meta-analysis. Sleep 19 (4): 318-326.
28 Results from the Americans’ Use of Time Project, University of Maryland, as reported in Robinson, J.P., & Bianchi, S. 1997. The Children's Hours. American Demographics 12.
Table SD 2.5 Percentage of adolescents ages 12 through 17 in the United States who report that they get enough sleep, by gender, age, grade, race and Hispanic origin,a and family structure: 1995
| 1995 | |
| Total | 74.1 |
| Gender | |
| Male | 76.4 |
| Female | 71.8 |
| Age | |
| 12-14 | 82.2 |
| 15-17 | 70.5 |
| Grade | |
| 7-8 | 83.3 |
| 9-10 | 72.5 |
| 11-12 | 66.5 |
| Race and Hispanic Origina | |
| White | 75.3 |
| Black | 72.8 |
| Hispanic | 73.5 |
| Family Structure | |
| Biological/Adoptive Mother & Father | 75.6 |
| Mother & Spouse/Partner | 76.2 |
| Father & Spouse/Partner | 76.5 |
| Single Mother | 72.0 |
| Single Father | 65.6 |
a Estimates for whites and blacks exclude Hispanics of those races. Persons of Hispanic origin may be of any race.
Source: The National Longitudinal Study of Adolescent Health Wave 1, 1995, tabulations by Child Trends.
Behavioral Health: Smoking, Alcohol, And Substance Abuse
SD 3.1 Cigarette Smoking Among Youth
Cigarette smoking is the single most preventable cause of death in the United States. The Centers for Disease Control and Prevention estimates that one in five deaths is caused by tobacco use.29 Youthful smoking can have severe, lifelong consequences because a large proportion of those who initiate smoking in adolescence will continue to smoke as adults.30 In addition, youth who smoke are also more likely to use illicit drugs and to drink more heavily than their nonsmoking peers.31 Youth tobacco use varies within and among racial and ethnic minority groups, and it has been the focus of federal attention in recent years.32
There are an estimated 3 million underage smokers in the United States. In a 1990 study, it was estimated that each year underage smokers purchase 947 million packs of cigarettes and 26 million cans of smokeless tobacco, resulting in $1.26 billion in tobacco sales.33 A 1992 study by the CDC concluded that more than half of underage smokers buy their own cigarettes.34 Although studies also show that only 23 percent of smoking youth now use vending machines often or occasionally, anticipated changes in state enforcement of minors’ access laws may increase the number of underage smokers who use tobacco vending machines.
Daily smoking among 12th-grade students decreased sharply in the late 1970s, and increased throughout most of the 1990s before declining modestly in 1998. Between 1992 and 1997, the percentage of 12th graders who reported smoking daily increased from 17.2
percent to 24.6 percent. In 1999, however, the percentage of 12th graders reporting daily smoking decreased to 23.1 (see Figure SD 3.1).
Data for 8th- and 10th-grade students, available from 1991 through 1999, also show increases throughout the 1990s in the percentage of students who reported smoking daily and a decrease in the last several years of the survey. Among 8th-grade students, the rate increased from 7.2 percent to 10.4 percent between 1991 and 1996 and decreased to 8.1 percent in 1999. Among 10th-grade students, the rate increased from 12.6 percent to 18.3 between 1991 and 1996 and decreased to 15.9 percent in 1999 (see Table SD 3.1.A).
Increases in the prevalence of current smoking among youth are also reflected in the results from the Youth Risk Behavior Survey, which examines “current smoking,” or smoking on one or more of the previous 30 days (see Table SD 3.1.B).
Differences by Age. In general, as age and/or grade increases, so does the prevalence of smoking. In 1999, the percentage of students who report daily smoking was 8.1 percent among 8th graders, 15.9 percent among 10th graders, and 23.1 percent among 12th-grade students (see Figure SD 3.1).
Differences by Race and Hispanic Origin.35 White students consistently have the highest rates of smoking, while black students consistently have the lowest (see Tables SD 3.1.A and SD 3.1.B). The prevalence of current36 smoking among white students is about twice that of black students. White students are twice as likely as Hispanic students and three times as likely as black students to be frequent37 smokers (see Table SD 3.1.B).
Differences by Gender.38 There is little to no difference in the prevalence of smoking between males and females, with the exception of black youth. Among black youth in grades 9 through 12, males were more likely than females in 1995 and in 1997 to report current and frequent smoking (see Table SD 3.1.B).
Prevalence of Smoking by Frequency. Two to three times the percentage of students report current smoking (smoking on 1 or more of the previous 30 days) than report frequent smoking (smoking on 20 or more of the previous 30 days) (see Table SD 3.1.B). This is apparent across all grades and for all the racial and ethnic groups shown.
29 Centers for Disease Control and Prevention. 1993. Cigarette Smoking—Attributable Mortality and Years of Potential Life Lost-United States, 1990. Morbidity and Mortality Weekly Report 42 (33): 645-649.
30 The Monitoring the Future Study, The University of Michigan. Cigarette Smoking Rates May Have Peaked among Younger Teens. Press release of December 18, 1997.
31 Substance Abuse and Mental Health Services Administration. 1996. Preliminary Estimates from the 1995 National Household Survey on Drug Abuse. Rockville, MD: Public Health Service. 1995 results indicate that youth ages 12 through 17 who smoked were about 8 times as likely to use illicit drugs and 11 times as likely to drink heavily as nonsmoking youths.
32 Centers for Disease Control and Prevention. 1998. Tobacco Use among U.S. Racial/Ethnic Minority Groups, African Americans, American Indians and Alaska Natives, Asian Americans and Pacific Islanders, Hispanics: A Report of the Surgeon General (Executive Summary). Morbidity and Mortality Weekly Report 47 (RR-18): 4.
33 Difranza, J.R., & Tye, J.B. 1990. Who Profits from Tobacco Sales to Children? JAMA 263 (20): 2784-2787.
34 Allen, K., et al. 1993. Teenage Tobacco Use: Data Estimates from the Teenage Attitudes and Practices Survey, United States, 1989. Advance Data 224: 1-20.
35 Estimates reported from the Youth Risk Behavior System for whites and blacks exclude Hispanics of those races.
36 Current smoking is smoking on 1 or more of the previous 30 days.
37 Frequent smoking is smoking one or more cigarettes per day in the previous 30 days.
38 The 1997 National Household Survey on Drug Abuse reports similar rates of cigarette smoking for males and females ages 12 through 17. 1997 responses to questions about use of cigarettes include: 39 percent of males and 38.3 percent of females "ever used," 25.7 percent of males and 27.2 percent of females "used in the past year," and 19 percent of males and 20.7 percent of females "used in the past month." Substance Abuse and Mental Health Services Administration, Office of Applied Studies. "National Household Survey on Drug Abuse: Population Estimates 1997," August 1998, Table 14A, accessed at http://www.samhsa.gov/oas/nhsda/pe1997/popes105.htm#E10E107 on 4/29/99.
Figure SD 3.1 Percentage of 8th-, 10th-, and 12th-grade students in the United States who reported smoking cigarettes daily over the previous 30 days: Selected years, 1975-1999
Sources: Johnston, O’Malley & Bachman, 2000. 8th- and 10th-grade, Table D-48; 12th-grade Table D-49. 1998 prepublication detail tables provided by Monitoring the Future Study staff.
Table SD 3.1.A Percentage of 8th-, 10th-, and 12th-grade students who reported smoking cigarettes daily over the previous 30 days, by gender and by race and Hispanic origin: Selected years, 1975-1999
| 1975 | 1980 | 1985 | 1990 | 1991 | 1992 | 1993 | 1994 | 1995 | 1996 | 1997 | 1998 | 1999 | |
|---|---|---|---|---|---|---|---|---|---|---|---|---|---|
| 8th Grade | |||||||||||||
| Total | — | — | — | — | 7.2 | 7.0 | 8.3 | 8.8 | 9.3 | 10.4 | 9.0 | 8.8 | 8.1 |
| Gender | |||||||||||||
| Male | — | — | — | — | 8.1 | 6.9 | 8.8 | 9.5 | 9.2 | 10.5 | 9.0 | 8.1 | 7.4 |
| Female | — | — | — | — | 6.2 | 7.2 | 7.8 | 8.0 | 9.2 | 10.1 | 8.7 | 9.0 | 8.4 |
| Race and Hispanic origina, b | |||||||||||||
| White | — | — | — | — | — | 7.7 | 8.8 | 9.7 | 10.5 | 11.7 | 11.4 | 10.4 | 9.7 |
| Black | — | — | — | — | — | 1.4 | 1.8 | 2.6 | 2.8 | 3.2 | 3.7 | 3.8 | 3.8 |
| Hispanic | — | — | — | — | — | 7.3 | 7.2 | 9.0 | 9.2 | 8.0 | 8.1 | 8.4 | 8.5 |
| 10th Grade | |||||||||||||
| Total | — | — | — | — | 12.6 | 12.3 | 14.2 | 14.6 | 16.3 | 18.3 | 18.0 | 15.8 | 15.9 |
| Gender | |||||||||||||
| Male | — | — | — | — | 12.4 | 12.1 | 13.8 | 15.2 | 16.3 | 18.1 | 17.2 | 14.7 | 15.6 |
| Female | — | — | — | — | 12.5 | 12.4 | 14.3 | 13.7 | 16.1 | 18.6 | 18.5 | 16.8 | 15.9 |
| Race and Hispanic origina, b | |||||||||||||
| White | — | — | — | — | — | 14.5 | 15.3 | 16.5 | 17.6 | 20.0 | 21.4 | 20.3 | 19.1 |
| Black | — | — | — | — | — | 2.8 | 3.1 | 3.8 | 4.7 | 5.1 | 5.6 | 5.8 | 5.3 |
| Hispanic | — | — | — | — | — | 8.4 | 8.9 | 8.1 | 9.9 | 11.6 | 10.8 | 9.4 | 9.1 |
| 12th Grade | |||||||||||||
| Total | 26.9 | 21.3 | 19.5 | 19.1 | 18.5 | 17.2 | 19.0 | 19.4 | 21.6 | 22.2 | 24.6 | 22.4 | 23.1 |
| Gender | |||||||||||||
| Male | 26.9 | 18.5 | 17.8 | 18.6 | 18.8 | 17.2 | 19.4 | 20.4 | 21.7 | 22.2 | 24.8 | 22.7 | 23.6 |
| Female | 26.4 | 23.5 | 20.6 | 19.3 | 17.9 | 16.7 | 18.2 | 18.1 | 20.8 | 21.8 | 23.6 | 21.5 | 22.2 |
| Race and Hispanic origina, b | |||||||||||||
| White | — | 23.9 | 20.4 | 21.8 | 21.5 | 20.5 | 21.4 | 22.9 | 23.9 | 25.4 | 27.8 | 28.3 | 26.9 |
| Black | — | 17.4 | 9.9 | 5.8 | 5.1 | 4.2 | 4.1 | 4.9 | 6.1 | 7.0 | 7.2 | 7.4 | 7.7 |
| Hispanic | — | 12.8 | 11.8 | 10.9 | 11.5 | 12.5 | 11.8 | 10.6 | 11.6 | 12.9 | 14.0 | 13.6 | 14.0 |
a Estimates for whites and blacks include Hispanics of those races. Persons of Hispanic origin may be of any race.
b Estimates for race and Hispanic origin represent the mean of the specified year and the previous year. Data have been combined to increase subgroup sample sizes, thus providing more stable estimates. Note: Data for 8th and 10th grades available since 1991. Sources: Johnston, O’Malley, & Bachman, 2000. 8th- and 10th-grade Table D-48; 12th-grade Table D-49. 1998 prepublication detail tables provided by Monitoring the Future Study staff.
Table SD 3.1.B Percentage of students in grades 9 through 12 in the United States who reported current and frequent smoking, by gender, race and Hispanic origin, and grade: 1991, 1993, 1995, 1997, and 1999
| Current Smokinga | Frequent Smokingb | |||||||||
| 1991 | 1993 | 1995 | 1997 | 1999 | 1991 | 1993 | 1995 | 1997 | 1999 | |
| Total | 28 | 31 | 35 | 36 | 35 | 13 | 14 | 16 | 17 | 17 |
| Male | 28 | 30 | 35 | 38 | 35 | 13 | 14 | 16 | 18 | 18 |
| Female | 27 | 31 | 34 | 35 | 35 | 12 | 14 | 16 | 16 | 16 |
| Race and Hispanic origina | ||||||||||
| White | 31 | 34 | 38 | 40 | 39 | 15 | 16 | 20 | 20 | 20 |
| Male | 30 | 32 | 37 | 40 | 38 | 15 | 16 | 18 | 20 | 21 |
| Female | 32 | 35 | 40 | 40 | 39 | 16 | 16 | 21 | 20 | 19 |
| Black | 13 | 15 | 19 | 23 | 20 | 3 | 5 | 5 | 7 | 7 |
| Male | 14 | 16 | 28 | 28 | 22 | 5 | 5 | 9 | 10 | 9 |
| Female | 11 | 14 | 12 | 17 | 18 | 2 | 4 | 1 | 4 | 5 |
| Hispanic | 25 | 29 | 34 | 34 | 33 | 7 | 8 | 10 | 11 | 10 |
| Male | 28 | 30 | 35 | 36 | 34 | 8 | 9 | 11 | 13 | 13 |
| Female | 23 | 27 | 33 | 32 | 32 | 6 | 7 | 9 | 8 | 9 |
| Grade | ||||||||||
| Ninth | 23 | 28 | 31 | 33 | 28 | 8 | 9 | 10 | 13 | 11 |
| Tenth | 25 | 28 | 33 | 35 | 35 | 11 | 13 | 13 | 15 | 15 |
| Eleventh | 32 | 31 | 36 | 37 | 36 | 16 | 15 | 19 | 19 | 19 |
| Twelfth | 30 | 35 | 38 | 40 | 43 | 16 | 18 | 21 | 19 | 23 |
a Current smoking is smoking on 1 or more of the previous 30 days.
b Frequent smoking is smoking on 20 or more of the previous 30 days.
c Estimates for whites and blacks exclude Hispanics of those races. Persons of Hispanic origin may be of any race.
Sources: Centers for Disease Control and Prevention. 1990-1991 Youth Risk Behavior Surveillance System, Table 1, p. 60 (current smoking); Table 1, p. 50, and unpublished data results Q28 (frequent smoking); Kann et al., 1995, Table 12, p. 35; Kann et al., 1996, Table 12, p. 44; Kann et al., 1998, Table 12, p. 50.
SD 3.2 Smokeless Tobacco Use Among Youth
The use of smokeless tobacco— snuff and chewing tobacco—is associated with a substantially higher risk of developing oral cancer.39 Data from the Monitoring the Future Study indicate that smokeless tobacco use among youth has generally decreased in recent years. Data from the Youth Risk Behavior Survey provide additional information about smokeless tobacco use by males and females within racial and Hispanic groups.
Differences by Age.40 In general, as age and/or grade increases, so does the prevalence of smokeless tobacco use. In 1999, the percentage of students who reported using smokeless tobacco over the previous 30 days was 4.5 percent among 8th graders, 6.5 percent among 10th graders, and 8.4 percent among 12th-grade students (see Table SD 3.2.A). The rate for 12th-grade students decreased from 12.2 percent in 1995 to 8.4 percent in 1999.
Differences by Gender. While rates of youth cigarette smoking are similar among males and females (see section SD 3.1), male students in the 8th, 10th, and 12th grades are more likely to use smokeless tobacco than are female students (see Figure 3.2.A). In 1999, among 12th-grade students, 15.5 percent of males and 1.3 percent of females reported smokeless tobacco use (see Table 3.2.A).
Differences by Race and Grade.41 The use of smokeless tobacco is most prevalent among white youth. In 1999, 11 percent of white 12th graders reported having used smokeless tobacco one or more times in the 30 days preceding the survey, compared with 3.9 percent of Hispanic 12th graders and 1.5 percent of black 12th graders (see Table SD 3.2.A).
The rate of smokeless tobacco use increases for white students as grade level increases. In 1999 among white students, the prevalence of smokeless tobacco use was 5.4 percent among 8th graders, 8.7 percent among 10th graders, and 11 percent among 12th graders (see Table 3.2.A).
The Youth Risk Behavior Survey provides additional subgroup information for 9th- through 12th-grade students combined. According to this survey’s most recent administration in 1999, the use of smokeless tobacco is most prevalent among white, non-Hispanic male high school students, with 19 percent reporting having used smokeless tobacco one or more times in the 30 days preceding the survey, compared with 6 percent of Hispanic male youth and 3 percent of black male youth (see Figure SD 3.2.B).
39 U.S. Department of Health and Human Services, Centers for Disease Control. 1999. Targeting Tobacco Use: The Nation’s Leading Cause of Death: At-a-Glance. Atlanta, GA.: Centers for Disease Control. See also Tomar, S.L., & Henningfield, J.E. 1995. Additional Evidence Implicating Moist Snuff as a Potent Carcinogen. Journal of the National Cancer Institute 87 (24): 1822-1823.
40 According to Sherry Everett Jones at the Center for Disease Control, differences by grade are not statistically significant.
41 In Table SD 3.2.B and Figure SD 3.2.B, estimates for whites and blacks exclude Hispanics of those races.
Table SD 3.2.A Percentage of 8th-, 10th-, and 12th-grade students in the United States who reported using smokeless tobacco over the previous 30 days, by grade, gender, and race and Hispanic origin: Selected years, 1992-1999
| 1992 | 1993 | 1994 | 1995 | 1996 | 1997 | 1998 | 1999 | |
|---|---|---|---|---|---|---|---|---|
| 8th Grade | ||||||||
| Total | 7.0 | 6.6 | 7.7 | 7.1 | 7.1 | 5.5 | 4.8 | 4.5 |
| Gender | ||||||||
| Male | 12.5 | 10.9 | 12.8 | 11.8 | 11.4 | 9.9 | 8.1 | 6.9 |
| Female | 2.0 | 2.7 | 2.4 | 2.9 | 2.9 | 1.5 | 1.5 | 2.1 |
| Race and Hispanic origina (2-year average)b |
||||||||
| White | 8.3 | 8.0 | 8.1 | 8.9 | 8.8 | 7.6 | 6.1 | 5.4 |
| Black | 1.8 | 2.7 | 3.2 | 2.6 | 2.2 | 2.6 | 2.3 | 2.3 |
| Hispanic | 4.2 | 4.0 | 5.0 | 5.7 | 5.2 | 4.6 | 4.5 | 4.6 |
| 10th Grade | ||||||||
| Total | 9.6 | 10.4 | 10.5 | 9.7 | 8.6 | 8.9 | 7.5 | 6.5 |
| Gender | ||||||||
| Male | 18.1 | 19.3 | 19.2 | 17.2 | 15.0 | 14.9 | 13.8 | 12.2 |
| Female | 1.8 | 2.0 | 2.1 | 2.1 | 2.3 | 2.7 | 1.7 | 1.3 |
| Race and Hispanic origina (2-year average)b |
||||||||
| White | 11.4 | 12.0 | 12.5 | 12.0 | 11.0 | 10.4 | 10.0 | 8.7 |
| Black | 2.9 | 2.3 | 2.3 | 2.5 | 2.5 | 2.8 | 2.3 | 1.6 |
| Hispanic | 6.2 | 6.1 | 4.3 | 3.6 | 4.0 | 4.6 | 4.8 | 4.8 |
| 12th Grade | ||||||||
| Total | 11.4 | 10.7 | 11.1 | 12.2 | 9.8 | 9.7 | 8.8 | 8.4 |
| Gender | ||||||||
| Male | 20.8 | 19.7 | 20.3 | 23.6 | 19.5 | 18.7 | 15.6 | 15.5 |
| Female | 2.0 | 2.3 | 2.6 | 1.8 | 1.1 | 1.2 | 1.5 | 1.3 |
| Race and Hispanic origina (2-year average)b |
||||||||
| White | — | 13.8 | 13.8 | 13.8 | 13.0 | 12.2 | 11.8 | 11.0 |
| Black | — | 2.0 | 1.9 | 2.1 | 2.7 | 2.2 | 1.4 | 1.5 |
| Hispanic | — | 6.0 | 5.4 | 7.6 | 8.1 | 5.3 | 4.3 | 3.9 |
a Estimates for whites and blacks include Hispanics of those races. Persons of Hispanic origin may be of any race.
b Estimates for race and Hispanic origin represent the mean of the specified year and the previous year. Data have been combined to increase subgroup sample sizes, thus providing more stable estimates.
Note: Prevalence of smokeless tobacco was not asked of 12th graders in 1990 and 1991. Prior to 1990, the prevalence question on smokeless tobacco was located near the end of one 12th-grade questionnaire form, whereas after 1991, the question was placed in a different and earlier form in the questionnaire. This shift could explain the discontinuities between the corresponding data in later years. Data for 8th and 10th grades have been available since 1991.
Sources: Johnston, O’Malley, & Bachman, 2000, 8th and 10th grade Table D-33; 12th grade Table D-34. Data for 1999: prepublication detail tables provided by Monitoring the Future Study staff: 8th and 10th grade Table D-52; 12th grade Table D-53.
Figure SD 3.2.A Percentage of 8th-, 10th-, and 12th-grade students in the United States who reported using smokeless tobacco during the previous 30 days, by gender: 1999
Source: The Monitoring the Future Study, The University of Michigan. Prepublication detail tables provided by the Monitoring the Future Study staff: 8th and 10th grade Table D-52; 12th grade Table D-53.
Figure SD 3.2.B Percentage of youth in grades 9 through 12 in the United States who reported having used smokeless tobacco during the previous 30 days, by gender and by race and Hispanic origin:a 1999
a Estimates for whites and blacks exclude Hispanics of those races. Persons of Hispanic origin may be of any race.
Source: Kan, et al. 1998, Table 12, p. 50.
Table SD 3.2.B Percentage of youth in grades 9 through 12 in the United States who reported having used smokeless tobacco during the previous 30 days,a by gender and by race and Hispanic origin:b 1991, 1993, 1995, 1997, and 1999
| 1991 | 1993 | 1995 | 1997 | 1999 | |||||||||||
| Total | Male | Female | Total | Male | Female | Total | Male | Female | Total | Male | Female | Total | Male | Female | |
| Total | 11 | 19 | 1 | 12 | 20 | 2 | 11 | 20 | 2 | 9 | 16 | 2 | 8 | 14 | 1 |
| Race and Hispanic originb | |||||||||||||||
| White | 13 | 24 | 1 | 15 | 26 | 2 | 15 | 25 | 3 | 12 | 21 | 2 | 10 | 19 | 2 |
| Black | 2 | 4 | 1 | 3 | 5 | 1 | 2 | 4 | 1 | 2 | 3 | 1 | 1 | 3 | 0 |
| Hispanic | 6 | 11 | 1 | 5 | 8 | 2 | 4 | 6 | 3 | 5 | 8 | 1 | 4 | 6 | 2 |
a In 1991 and 1993, students were asked whether they had “used chewing tobacco or snuff during the 30 days preceding the survey;” in 1995 1997, and 1999, students were asked how many days they had “used chewing tobacco or snuff on 1 or more of the 30 days preceding the survey.”
b Estimates for whites and blacks exclude Hispanics of those races. Persons of Hispanic origin may be of any race.
Sources: Centers for Disease Control and Prevention. 1990-1991, Table 1, p. 50; Kann, et al., 1995, Table 12, p. 35; Kann, et al., 1996, Table 12, p. 44; Kann, et al., Table 12, p. 50.
SD 3.3 Alcohol Use Among Youth
Alcohol use among adolescents is linked to a host of problems, including motor vehicle crashes and deaths, difficulties in school and the workplace, fighting, and breaking the law.42 The National Institute on Alcohol Abuse and Alcoholism finds that the younger the age of drinking onset, the greater the chance that an individual at some point in life will develop a clinically defined alcohol disorder.43 In addition, binge drinking by youth at some point in the previous 2 weeks is associated with higher levels of illicit drug use.44
Among 12th-grade students, rates of binge drinking fell from a high of 41.4 percent in 1981 to 27.5 percent in 1993 (see Figure SD 3.3.A). Between 1993 and 1999, rates have edged up modestly to 30.8 percent (see Table SD 3.3.A).45 Having an alcoholic beverage on one or
more occasion in the previous 30 days was reported by 52 percent of 12th-grade students in 1998 but dropped slightly to 51 percent in 1999 (see Table SD 3.3.B).
Differences by Age. Binge drinking increases as students move into the upper grade levels (see Figure SD 3.3.A). In 1999, 15.2 percent of 8th-grade students reported binge drinking, while more than twice this percentage (30.8 percent) reported binge drinking in the 12th grade. A larger increase in binge drinking appears to occur between the 8th and 10th grades than in the period between the 10th and 12th grades (see Table SD 3.3.A).
Differences by Gender. Male students report higher rates of binge drinking than do female students. The disparity in binge drinking rates between males and females is greater in the upper grades, with 38.1 percent of males and 23.6 percent of females in the 12th grade reporting binge drinking in 1999 (see Table SD 3.3.A). Similar disparities exist for regular drinking (see Table 3.3.B).
Differences by Race and Hispanic Origin. Hispanic youth in the 8th grade are more likely than their white and black peers to engage in binge drinking. By the 12th grade, however, white students report a higher prevalence of binge drinking than do either Hispanic or black students. Black students consistently report the lowest prevalence of binge drinking for all grades and across all years (see Table SD 3.3.A).
42 Petraitis, J., & Flay, B.R. 1995. Reviewing Theories of Adolescent Substance Use: Organizing Pieces in the Puzzle. Psychological Bulletin 117 (1): 67-86; Hawkins, J.D., Catalano, R.F., & Miller, J.Y. 1992. Risk and Protective Factors for Alcohol and Other Drug Problems in Adolescence and Early Adulthood: Implications for Substance Abuse Prevention. Psychological Bulletin 112 (1): 64-105; National Institute on Drug Abuse. 1987. National Trends in Drug Use and Related Factors among American High School Students and Young Adults, 1976-1986. DHHS Pub. No. (ADM) 87-1535. Washington, D.C.: U.S. Department of Health and Human Services.
43 Grant, B.R., & Dawson, D.A. Age at Onset of Alcohol Use and Its Association with DSM-IV Alcohol Abuse and Dependence: Results from the National Longitudinal Alcohol Epidemiologic Survey. Journal of Substance Abuse 9: 103-110. Also, National Institutes of Health, National Institute on Alcohol Abuse and Alcoholism. "Age of Drinking Onset Predicts Future Alcohol Abuse and Dependence." Press release of January 14, 1998.
44 Substance Abuse and Mental Health Services Administration. 1996. Preliminary Estimates from the 1995 National Household Survey on Drug Abuse. Rockville, Md.: Public Health Service. Results from 1995 indicate that among binge drinkers, 18 percent were illicit drug users. In this survey, binge drinking is defined as having five or more drinks on the same occa-sion at least once in the past month. See also: Gruber, E., Diciemente, R.J., Anderson, M.M., & Lodico, M. 1996. Early Drinking Onset and Its Association with Alcohol Use and Problem Behavior in Late Adolescence. Preventive Medicine 25: 293-300.
45 These percentages underestimate the rate of binge drinking among all youth, because school-age youth who are not in school are somewhat more likely to binge drink than those in school. (Based on unpublished analyses of the National Health Interview Survey 1992 by Child Trends, and unpublished prevalence rates of past-month alcohol use among youth ages 12 through 17 by school status, enrolled or not enrolled, from the 1994-95 National Household Surveys on Drug Abuse.)
Figure SD 3.3.A Percentage of 8th-, 10th-, and 12th-grade students who reported binge drinking: a Selected years, 1975-1999
a Binge drinking means having five or more drinks in a row in the previous 2 weeks.
Sources: Johnston, O’Malley, & Bachman, 1998, 8th and 10th grade Table D-27; 12th grade Table D-28. Data for 1998: prepublication detail tables provided by Monitoring the Future Study staff: 8th and 10th grade Table D-31; 12th grade Table D-32.
Table SD 3.3.A Percentage of 8th-, 10th-, and 12th-grade students in the United States who reported binge drinking,a by gender and by race and Hispanic origin: Selected years, 1975-1999
| 1975 | 1980 | 1985 | 1990 | 1991 | 1992 | 1993 | 1994 | 1995 | 1996 | 1997 | 1998 | 1999 | |
|---|---|---|---|---|---|---|---|---|---|---|---|---|---|
| 8th Grade | |||||||||||||
| Total | — | — | — | — | 12.9 | 13.4 | 13.5 | 14.5 | 14.5 | 15.6 | 14.5 | 13.7 | 15.2 |
| Gender | |||||||||||||
| Male | — | — | — | — | 14.3 | 13.9 | 14.8 | 16.0 | 15.1 | 16.5 | 15.3 | 14.4 | 16.4 |
| Female | — | — | — | — | 11.4 | 12.8 | 12.3 | 13.0 | 13.9 | 14.5 | 13.5 | 12.7 | 13.9 |
| Race and Hispanic origina, b | |||||||||||||
| White | — | — | — | — | — | 12.7 | 12.6 | 12.9 | 13.9 | 15.1 | 15.1 | 14.1 | 14.3 |
| Black | — | — | — | — | — | 9.6 | 10.7 | 11.8 | 10.8 | 10.4 | 9.8 | 9.0 | 9.9 |
| Hispanic | — | — | — | — | — | 20.4 | 21.4 | 22.3 | 22.0 | 21.0 | 20.7 | 20.4 | 20.9 |
| 10th Grade | |||||||||||||
| Total | — | — | — | — | 22.9 | 21.1 | 23.0 | 23.6 | 24.0 | 24.8 | 25.1 | 24.3 | 25.6 |
| Gender | |||||||||||||
| Male | — | — | — | — | 26.4 | 23.7 | 26.5 | 28.5 | 26.3 | 27.2 | 28.6 | 26.7 | 29.7 |
| Female | — | — | — | — | 19.5 | 18.6 | 19.3 | 18.7 | 21.5 | 22.3 | 21.7 | 22.2 | 21.8 |
| Race and Hispanic origina, b | |||||||||||||
| White | — | — | — | — | — | 23.2 | 23.0 | 24.5 | 25.4 | 26.2 | 26.9 | 27.0 | 27.2 |
| Black | — | — | — | — | — | 15.0 | 14.8 | 14.0 | 13.3 | 12.2 | 12.7 | 12.8 | 12.7 |
| Hispanic | — | — | — | — | — | 22.9 | 23.8 | 24.2 | 26.8 | 29.6 | 27.5 | 26.3 | 27.5 |
| 12th Grade | |||||||||||||
| Total | 36.8 | 41.2 | 36.7 | 32.2 | 29.8 | 27.9 | 27.5 | 28.2 | 29.8 | 30.2 | 31.3 | 31.5 | 30.8 |
| Gender | |||||||||||||
| Male | 49.0 | 52.1 | 45.3 | 39.1 | 37.8 | 35.6 | 34.6 | 37.0 | 36.9 | 37.0 | 37.9 | 39.2 | 38.1 |
| Female | 26.4 | 30.5 | 28.2 | 24.4 | 21.2 | 20.3 | 20.7 | 20.2 | 23.0 | 23.5 | 24.4 | 24.0 | 23.6 |
| Race and Hispanic origina, b | |||||||||||||
| White | — | 44.3 | 41.5 | 36.6 | 34.6 | 32.1 | 31.3 | 31.5 | 32.3 | 33.4 | 35.1 | 36.4 | 35.7 |
| Black | — | 17.7 | 15.7 | 14.4 | 11.7 | 11.3 | 12.6 | 14.4 | 14.9 | 15.3 | 13.4 | 12.3 | 12.3 |
| Hispanic | — | 33.1 | 31.7 | 25.6 | 27.9 | 31.1 | 27.2 | 24.3 | 26.6 | 27.1 | 27.6 | 28.1 | 29.3 |
a Binge drinking means having five or more drinks in a row in the previous 2 weeks.
b Estimates for whites and blacks include Hispanics of those races. Persons of Hispanic origin may be of any race.
c Estimates for race and Hispanic origin represent the mean of the specified year and the previous year. Data have been combined to increase subgroup sample sizes, thus providing more stable estimates.
Note: Data for 8th and 10th grades available since 1991. Sources: Johnston, O’Malley, & Bachman, 1998, 8th and 10th grade Table D-27; 12th-grade Table D-28. Data for 1998: prepublication detail tables provided by Monitoring the Future Study staff.
Table SD 3.3.B Percentage of 8th-, 10th-, and 12th-grade students in the United States who reported drinking alcohol on one or more occasions,a by gender: Selected years, 1998-1999
| 1998 | 1999 | |
|---|---|---|
| 8th Grade | ||
| Total | 23.0 | 24.0 |
| Male | 24.0 | 24.8 |
| Female | 21.9 | 23.3 |
| 10th Grade | ||
| Total | 38.8 | 40.0 |
| Male | 40.0 | 42.3 |
| Female | 37.7 | 38.1 |
| 12th Grade | ||
| Total | 52.0 | 51.0 |
| Male | 57.3 | 55.3 |
| Female | 46.9 | 46.8 |
a Question indicated that a “drink” of alcohol is more than a few sips within the last 30 days.
Note: The form of this question changed in 1993 so the data in this report are not comparable to previous editions of this report.
Sources: Bachman, Johnston, & O’Malley, 8th and 10th grade 1991-1996 Questionnaire Forms 1 and 2, item B05C; 12th grade 1980-1988 Questionnaire Forms 1-5, item B04B, and 1989-1997 Questionnaire Forms 1-6, item B04C.
SD 3.4 Exposure to Drunk Driving
Motor vehicle crashes are a major cause of death in the United States for youth ages 15 through 19.46 Among young Americans of driving age, the issue of alcohol-impaired driving has particular significance. In all states, the purchase of alcohol by persons under age 21
is illegal; however, in 1994, 29 percent of the 2,610 traffic fatalities involving persons ages 15 through 17 were alcohol-related. For traffic deaths involving persons ages 18 through 20, the percentage of alcohol involvement was 44 percent.47
In 1999, 36 percent of adolescents in grades 9 through 12 reported that within the month prior to the survey, they had either driven after drinking alcohol or had ridden with a driver who had been drinking alcohol (see Table SD 3.4). Since 1991, about two in five high school students have reported this level of exposure to drunk driving.
Differences by Age. Rates of exposure to drunk driving differed modestly by age. In 1999, 41 percent of 12th-grade students reported taking this risk, compared with 32 percent of 9th-grade students (see Figure SD 3.4).
Differences by Gender. In 1999, 38 percent of males and 34 percent of females reported driving after drinking alcohol or riding with someone who had been drinking (see Table SD 3.4).
Differences by Race and Hispanic Origin.48 In 1999, 42 percent of Hispanic, 36 percent of white, and 36 percent of black teens reported having been exposed to drunk driving within the past month (see Table SD 3.4).
46 Injury-related mortality (including motor vehicle crashes, fires and burns, drowning, suffocation, and accidents caused by firearms and other explosive materials, among others) accounted for 80 percent of all deaths of youth ages 15 through 19 in 1995. However, the rate of motor vehicle crash deaths among youth has been relatively constant since 1992 and has declined as a fraction of all violent deaths to teens. Preliminary data for 1996 show that motor vehicle crashes claimed 28.9 lives per 100,000 youth ages 15 through 19, compared with 43.6 per 100,000 youth in 1970. Data for 1996 are preliminary based on 85 percent of all reported deaths in 1996.
47 Update: Alcohol-Related Traffic Crashes and Fatalities among Youth and Young Adults—United States, 1982-1994. Morbidity and Mortality Weekly Report 44: 869-874.
48 Estimates for whites and blacks exclude Hispanics of those races. Persons of Hispanic origin may be of any race.
Table SD 3.4 Percentage of students in grades 9 through 12 in the United States who reported driving after drinking alcohol, or riding with a driver who had been drinking alcohol,a by gender, grade, and race and Hispanic origin: 1991, 1993, 1995, 1997, and 1999
| 1991 | 1993 | 1995 | 1997 | 1999 | |
| Total | 42 | 38 | 42 | 40 | 36 |
| Gender | |||||
| Male | 44 | 40 | 43 | 42 | 38 |
| Female | 41 | 36 | 40 | 37 | 34 |
| Grade | |||||
| Ninth | 36 | 32 | 39 | 35 | 32 |
| Tenth | 39 | 37 | 40 | 36 | 36 |
| Eleventh | 45 | 39 | 41 | 42 | 35 |
| Twelfth | 49 | 44 | 46 | 45 | 41 |
| Race and Hispanic originb | |||||
| White | 43 | 37 | 41 | 40 | 36 |
| Black | 38 | 41 | 39 | 36 | 36 |
| Hispanic | 49 | 45 | 52 | 47 | 42 |
a Within the last 30 days.
b Estimates for whites and blacks exclude Hispanics of those races. Persons of Hispanic origin may be of any race.
Sources: Youth Risk Behavior Survey results, 1991, 1993, 1995, 1997, and 1999. Unpublished tabulations by Laura Kann, Centers for Disease Control and Prevention, U.S. Department of Health and Human Services.
Figure SD 3.4 Percentage of students in grades 9 through 12 in the United States who reported driving after drinking alcohol or riding with a driver who had been drinking alcohol within the past 30 days, by grade: 1999
a Within the last 30 days.
Source: Youth Risk Behavior Survey results, 1999. Unpublished tabulations by Laura Kann, Centers for Disease Control and Prevention, U.S. Department of Health and Human Services.
SD 3.5 Drug Use Among Youth: Marijuana, Inhalants, Hallucinogens, and Cocaine
Drug use by youth has serious and often long-term individual, social, and economic consequences. Drug use contributes to crime, decreases economic productivity, and requires a disproportionate share of health care services for those affected. Use of drugs is a preventable behavior that, when established during adolescence, can extend into adulthood.49
The effects of drug use on individual health and well-being have been well documented: for example, the use of cocaine has been linked with numerous health problems ranging from eating disorders to disability and even death from heart attack and stroke.50 Marijuana use holds both health and cognitive risks, particularly for damage to pulmonary functions as a result of chronic use.51 Hallucinogens can affect brain chemistry and result in problems both in learning new information and retaining knowledge.52 And chronic use of some inhalants may result in injury to the liver and kidneys as well as cause neurological damage, although it is not yet determined whether such damage is long term.53
Marijuana Use.54 From a high of 37.1 percent in 1978, large and steady declines in the percentage of 12th graders reporting marijuana use were evident through 1992. Since 1992, however, marijuana use in the past 30 days among 12th-grade students has increased from 11.9 percent to 23.1 percent in 1999 (see Figure SD 3.5.A). The rise in marijuana use is also evident among 8th-grade students, increasing from 3.2 percent in 1991 to 9.7 percent in 1999. Marijuana use by 10th graders rose from 8.7 percent in 1991 to 19.4 percent in 1999.
Tenth and 12th graders have consistently been more likely to use marijuana than inhalants, hallucinogens, or cocaine. As of 1994, marijuana use among 8th-grade students had surpassed prevalence rates of other drugs shown (see Table SD 3.5.A). This increase in the use of marijuana corresponds with a decline in its perceived harmfulness by students across all grade levels from 1991 to 1998.55
Differences by Age. As seen with cigarette and alcohol use (see Sections SD 3.1 and SD 3.3), use of both marijuana and hallucinogens increases with grade level. This increase is relatively small for hallucinogen use but is substantial for marijuana use. In 1999, 9.7 percent of 8th-grade students reported using marijuana in the past 30 days (see Table SD 3.5.A). More than twice that percentage of 12th graders (23.1 percent) reported using marijuana within the past 30 days in the same year. In contrast, inhalant use is more prevalent in the 8th grade than in either the 10th or the 12th grade. The rate of inhalant use among 8th graders was 5.0 percent, compared with 2.6 percent for 10th graders and 2.0 percent for high school seniors in 1999. The prevalence of cocaine use is lowest among 8th graders in 1999 (1.3 percent), but similarly small rates are reflected in other grades as well (1.8 percent for 10th grade and 2.6 percent for 12th grade) (see Table SD 3.5.A).
Use of Other Specified Drugs. Increases have also been shown in the use of cocaine and hallucinogens since 1991 across all grade levels. In recent years, cocaine use has been least prevalent among the four drugs types examined in this section among all grade levels, with a high of 2.6 percent of 12th-grade students reporting use within a 30-day period in 1999 (see Figure SD 3.5.B). Hallucinogens have low prevalence rates among 8th graders in 1999 (1.3 percent), although use increases with grade, eventually surpassing the use of inhalants for the upper grade levels. The use of inhalants is highest among 8th-grade students at 5.0 percent in 1999 (see Table SD 3.5.A).
One-quarter (25.9 percent) of America’s 12th graders report use of “any illicit drug” in the
past 30 days in 1999, with 22.1 percent of 10th graders and 12.2 percent of 8th graders
reporting similar recent use (see Table SD 3.5.C).
Differences by Gender. Male high school students appear somewhat more likely than females to report use of marijuana, inhalants, hallucinogens, and cocaine. The largest gender difference is seen in marijuana use and is most apparent in the upper grade levels. Among 8th-grade students, 10.5 percent of males and 8.8 percent of females reported marijuana use within the preceding 30 days of the survey in 1999. In the 10th grade in that year, males reported marijuana use at about 5 percentage points higher than that of females (21.8 versus 17 percent). This gender gap is about 7 percentage points among high school seniors in 1999 (26.3 versus 19.7) (see Table SD 3.5.A).
Differences by Race. For each category of drug use shown, as well as for use of any illicit drugs, black students consistently report the lowest rates of use across all grades (see Tables SD 3.5.B and SD 3.5.C).
49 Johnson, R.A., Hoffmann, J.P., & Gerstein, D.R. July 1996. The Relationship between Family Structure and Adolescent Substance Use. Rockville, Md.: Substance Abuse and Mental Health Services Administration, Office of Applied Studies.
50 Blanken, A.J. 1993. Measuring Use of Alcohol and Other Drugs among Adolescents. Public Health Reports (Journal of the U.S. Public Health Service) 108 (Supp. 1).
51 See, for example, Marijuana: Facts Parents Need to Know, National Institute on Drug Abuse, U.S. Department of Health and Human Services, NCADI Pub. No. PHD712, 1995; and Pope, H., & Yurgelun-Todd, D., 1996, The Residual Cognitive Effects of Heavy Marijuana Use in College Students, Journal of the American Medical Association 275 (7).
52 "Measuring the Health Behavior of Adolescents: The Youth Risk Behavior Surveillance System and Recent Reports on High-Risk Adolescents." 1993. Public Health Reports 108 (Supp. 1). Rockville, Md.: Public Health Service.
53 Public Health Service, 1993.
54 These percentages likely underestimate the rate of drug use among all youth, because school-age youth who are not in school are somewhat more likely to use drugs than those in school. (Based on unpublished prevalence rates of past-month marijuana use, past-year cocaine use, and past-year inhalant use among youth ages 12 to 17, by school status, enrolled or not enrolled, from the 1994-95 National Household Surveys on Drug Abuse.)
55 The data on perceived harmfulness of specified drugs are not shown here but can also be obtained from the Monitoring the Future Study. The percentage of students who think that smoking marijuana occasionally or regularly is physically or otherwise harmful has dropped from 1991 to 1998 across all grade levels. In 1999, 23.9 percent of 12th-grade students perceived smoking marijuana occasionally to be harmful (down from 40.6 percent in 1991), and 57.4 percent perceived smoking marijuana regularly to be harmful (down from 78.6 percent in 1991).
Figure SD 3.5.A Percentage of 8th-, 10th-, and 12th-grade students in the United States who report having used marijuana within the previous 30 days: Selected years, 1975-1999
Sources: Johnston, O’Malley, and Bachman, 2000, Table 4-7; also, prior years of this publication. Additional historical data tables provided by Monitoring the Future Study staff.
Table SD 3.5.A Percentage of 8th-, 10th-, and 12th-grade students in the United States who report having used specified drugs within the previous 30 days, by grade and gender: Selected years, 1975-1999
| 1975 | 1980 | 1985 | 1990 | 1991 | 1992 | 1993 | 1994 | 1995 | 1996 | 1997 | 1998 | 1999 | |
|---|---|---|---|---|---|---|---|---|---|---|---|---|---|
| Marijuana | |||||||||||||
| 8th grade | --- | --- | --- | --- | 3.2 | 3.7 | 5.1 | 7.8 | 9.1 | 11.3 | 10.2 | 9.7 | 9.7 |
| Male | --- | --- | --- | --- | 3.8 | 3.8 | 6.1 | 9.5 | 9.8 | 12.1 | 11.4 | 10.3 | 10.5 |
| Female | --- | --- | --- | --- | 2.6 | 3.5 | 4.1 | 6.0 | 8.2 | 10.2 | 8.9 | 8.8 | 8.8 |
| 10th grade | --- | --- | --- | --- | 8.7 | 8.1 | 10.9 | 15.8 | 17.2 | 20.4 | 20.5 | 18.7 | 19.4 |
| Male | --- | --- | --- | --- | 10.1 | 9.0 | 13.1 | 18.6 | 19.1 | 22.3 | 23.0 | 20.3 | 21.8 |
| Female | --- | --- | --- | --- | 7.3 | 7.1 | 8.6 | 12.8 | 15.0 | 18.6 | 17.9 | 17.2 | 17.0 |
| 12th grade | 27.1 | 33.7 | 25.7 | 14.0 | 13.8 | 11.9 | 15.5 | 19.0 | 21.2 | 21.9 | 23.7 | 22.8 | 23.1 |
| Male | 32.3 | 37.8 | 28.7 | 16.1 | 16.1 | 13.4 | 18.2 | 23.0 | 24.6 | 25.1 | 26.4 | 26.5 | 26.3 |
| Female | 22.5 | 29.1 | 22.4 | 11.5 | 11.2 | 10.2 | 12.5 | 15.1 | 17.2 | 18.3 | 20.3 | 18.8 | 19.7 |
| Inhalantsa | |||||||||||||
| 8th grade | --- | --- | --- | --- | 4.4 | 4.7 | 5.4 | 5.6 | 6.1 | 5.8 | 5.6 | 4.8 | 5.0 |
| Male | --- | --- | --- | --- | 4.0 | 4.4 | 4.9 | 5.4 | 5.6 | 4.8 | 5.1 | 4.8 | 4.6 |
| Female | --- | --- | --- | --- | 4.7 | 4.9 | 6.0 | 5.8 | 6.6 | 6.6 | 5.8 | 4.7 | 5.3 |
| 10th grade | --- | --- | --- | --- | 2.7 | 2.7 | 3.3 | 3.6 | 3.5 | 3.3 | 3.0 | 2.9 | 2.6 |
| Male | --- | --- | --- | --- | 2.9 | 2.9 | 3.7 | 3.9 | 3.8 | 3.4 | 3.0 | 3.2 | 2.9 |
| Female | --- | --- | --- | --- | 2.6 | 2.6 | 2.9 | 3.3 | 3.2 | 3.2 | 2.9 | 2.6 | 2.2 |
| 12th grade | --- | 1.4 | 2.2 | 2.7 | 2.4 | 2.3 | 2.5 | 2.7 | 3.2 | 2.5 | 2.5 | 2.3 | 2.0 |
| Male | --- | 1.8 | 2.8 | 3.5 | 3.3 | 3.0 | 3.2 | 3.6 | 3.9 | 3.1 | 3.3 | 2.9 | 2.5 |
| Female | --- | 1.0 | 1.7 | 2.0 | 1.6 | 1.6 | 1.7 | 1.9 | 2.5 | 2.0 | 1.8 | 1.7 | 1.5 |
| Hallucinogensb | |||||||||||||
| 8th grade | --- | --- | --- | --- | 0.8 | 1.1 | 1.2 | 1.3 | 1.7 | 1.9 | 1.8 | 1.4 | 1.3 |
| Male | --- | --- | --- | --- | 0.9 | 1.1 | 1.3 | 1.5 | 1.8 | 2.0 | 2.2 | 1.7 | 1.6 |
| Female | --- | --- | --- | --- | 0.7 | 1.0 | 1.1 | 1.0 | 1.5 | 1.6 | 1.3 | 1.1 | 1.0 |
| 10th grade | --- | --- | --- | --- | 1.6 | 1.8 | 1.9 | 2.4 | 3.3 | 2.8 | 3.3 | 3.2 | 2.9 |
| Male | --- | --- | --- | --- | 1.8 | 2.1 | 2.5 | 3.0 | 3.9 | 3.3 | 4.0 | 3.5 | 3.6 |
| Female | --- | --- | --- | --- | 1.4 | 1.4 | 1.3 | 1.7 | 2.7 | 2.3 | 2.5 | 2.9 | 2.2 |
| 12th grade | 4.7 | 3.7 | 2.5 | 2.2 | 2.2 | 2.1 | 2.7 | 3.1 | 4.4 | 3.5 | 3.9 | 3.8 | 3.5 |
| Male | 6.0 | 4.8 | 3.4 | 3.2 | 3.1 | 2.9 | 3.6 | 4.3 | 5.8 | 4.7 | 5.1 | 5.1 | 4.5 |
| Female | 3.6 | 2.5 | 1.4 | 1.0 | 1.1 | 1.4 | 1.7 | 1.7 | 2.7 | 2.3 | 2.7 | 2.3 | 2.3 |
| Cocaine | |||||||||||||
| 8th grade | --- | --- | --- | --- | 0.5 | 0.7 | 0.7 | 1.0 | 1.2 | 1.3 | 1.1 | 1.4 | 1.3 |
| Male | --- | --- | --- | --- | 0.7 | 0.6 | 0.9 | 1.2 | 1.1 | 1.2 | 1.2 | 1.5 | 1.4 |
| Female | --- | --- | --- | --- | 0.4 | 0.8 | 0.6 | 0.9 | 1.2 | 1.4 | 1.0 | 1.2 | 1.2 |
| 10th grade | --- | --- | --- | --- | 0.7 | 0.7 | 0.9 | 1.2 | 1.7 | 1.7 | 2.0 | 2.1 | 1.8 |
| Male | --- | --- | --- | --- | 0.7 | 0.8 | 1.2 | 1.4 | 1.8 | 1.8 | 1.9 | 2.4 | 2.2 |
| Female | --- | --- | --- | --- | 0.6 | 0.6 | 0.5 | 0.9 | 1.5 | 1.6 | 1.8 | 1.8 | 1.6 |
| 12th grade | 1.9 | 5.2 | 6.7 | 1.9 | 1.4 | 1.3 | 1.3 | 1.5 | 1.8 | 2.0 | 2.3 | 2.4 | 2.6 |
| Male | 2.5 | 6.0 | 7.7 | 2.3 | 1.7 | 1.5 | 1.7 | 1.9 | 2.2 | 2.6 | 2.8 | 3.0 | 3.3 |
| Female | 1.2 | 4.3 | 5.6 | 1.3 | 0.9 | 0.9 | 0.9 | 1.1 | 1.3 | 1.4 | 1.6 | 1.7 | 1.8 |
a All data are unadjusted for underreporting of nitrites. Data for 12th grade only, based on three of six questionnaire forms, with sample size one-half of total sample size.
b All data are unadjusted for underreporting of PCP. Note: Data for 8th and 10th grades available since 1991.
Sources: Johnston, O’Malley, & Bachman, 2000. Table 4-7, pre-publication Table 4-7 for 1998, and prior years of this publication. Additional historical data tables provided by Monitoring the Future Study staff.
Table SD 3.5.B Percentage of 8th-, 10th-, and 12th-grade students in the United States who report having used specified drugs within the previous 30 days, by race and Hispanic origina: 1992-1999
| 1992 | 1993 | 1994 | 1995 | 1996 | 1997 | 1998 | 1999 | |
|---|---|---|---|---|---|---|---|---|
| 8th Grade | ||||||||
| Marijuana a | ||||||||
| White | 3.3 | 4.1 | 5.6 | 7.8 | 10.0 | 10.6 | 9.5 | 8.7 |
| Black | 2.0 | 2.9 | 5.0 | 6.6 | 8.0 | 9.0 | 9.1 | 9.7 |
| Hispanic | 6.4 | 8.3 | 12.1 | 12.9 | 12.5 | 13.1 | 13.5 | 14.3 |
| Inhalants a,b | ||||||||
| White | 4.7 | 5.4 | 6.0 | 6.6 | 6.8 | 6.5 | 5.9 | 5.5 |
| Black | 2.4 | 2.7 | 2.8 | 2.5 | 2.0 | 1.9 | 2.2 | 2.2 |
| Hispanic | 5.5 | 5.6 | 6.1 | 6.5 | 6.4 | 5.5 | 5.2 | 6.0 |
| Hallucinogens a,c | ||||||||
| White | 0.8 | 1.1 | 1.3 | 1.6 | 2.0 | 2.0 | 1.5 | 1.2 |
| Black | 0.4 | 0.4 | 0.4 | 0.4 | 0.5 | 0.4 | 0.4 | 0.4 |
| Hispanic | 1.9 | 1.9 | 1.8 | 1.9 | 2.2 | 2.3 | 2.5 | 2.3 |
| Cocaine a | ||||||||
| White | 0.5 | 0.5 | 0.7 | 0.9 | 1.2 | 1.2 | 1.0 | 1.1 |
| Black | 0.4 | 0.4 | 0.3 | 0.4 | 0.4 | 0.3 | 0.4 | 0.4 |
| Hispanic | 1.7 | 1.8 | 2.2 | 2.5 | 2.3 | 2.1 | 2.5 | 3.2 |
| 10th Grade | ||||||||
| Marijuana a | ||||||||
| White | 9.0 | 9.8 | 13.4 | 16.8 | 19.3 | 21.1 | 20.3 | 19.8 |
| Black | 3.6 | 4.9 | 9.8 | 13.8 | 15.9 | 16.5 | 15.3 | 14.6 |
| Hispanic | 10.4 | 12.4 | 15.6 | 17.7 | 19.1 | 21.3 | 21.4 | 20.6 |
| Inhalants a,b | ||||||||
| White | 2.9 | 3.2 | 3.7 | 3.9 | 3.9 | 3.5 | 3.3 | 3.1 |
| Black | 2.0 | 2.0 | 1.6 | 1.3 | 1.2 | 1.2 | 1.1 | 1.0 |
| Hispanic | 3.0 | 3.0 | 3.4 | 3.4 | 2.9 | 2.9 | 2.9 | 2.6 |
| Hallucinogens a,c | ||||||||
| White | 2.0 | 2.1 | 2.3 | 3.1 | 3.5 | 3.4 | 3.5 | 3.5 |
| Black | 0.2 | 0.3 | 0.7 | 0.8 | 0.5 | 0.6 | 0.7 | 0.6 |
| Hispanic | 1.4 | 1.8 | 2.2 | 2.7 | 3.1 | 3.3 | 3.8 | 3.0 |
| Cocaine a | ||||||||
| White | 0.7 | 0.8 | 0.9 | 1.4 | 1.6 | 1.7 | 1.9 | 2.0 |
| Black | 0.1 | 0.2 | 0.6 | 0.6 | 0.4 | 0.4 | 0.6 | 0.5 |
| Hispanic | 1.1 | 1.2 | 1.8 | 2.4 | 2.9 | 3.6 | 3.9 | 3.6 |
| 12th Grade | ||||||||
| Marijuana a | ||||||||
| White | 14.1 | 14.9 | 18.4 | 20.8 | 22.0 | 23.6 | 24.4 | 23.8 |
| Black | 6.1 | 8.1 | 13.1 | 16.8 | 18.3 | 18.5 | 18.3 | 19.3 |
| Hispanic | 12.7 | 12.5 | 14.9 | 17.9 | 19.1 | 21.2 | 21.6 | 22.0 |
| Inhalants a,b | ||||||||
| White | 2.4 | 2.6 | 2.8 | 3.3 | 3.3 | 3.0 | 2.8 | 2.4 |
| Black | 1.5 | 1.4 | 1.5 | 1.4 | 1.0 | 0.9 | 0.9 | 0.8 |
| Hispanic | 2.5 | 2.1 | 2.3 | 2.3 | 2.1 | 1.7 | 1.8 | 2.3 |
| Hallucinogens a,c | ||||||||
| White | 2.5 | 2.9 | 3.3 | 4.1 | 4.4 | 4.3 | 4.5 | 4.1 |
| Black | 0.3 | 0.5 | 0.8 | 0.7 | 0.6 | 0.9 | 0.7 | 0.6 |
| Hispanic | 1.5 | 1.7 | 2.0 | 3.4 | 4.0 | 2.9 | 2.8 | 3.1 |
| Cocaine a | ||||||||
| White | 1.5 | 1.2 | 1.3 | 1.6 | 1.9 | 2.2 | 2.5 | 2.7 |
| Black | 0.7 | 0.4 | 0.5 | 0.5 | 0.4 | 0.5 | 0.6 | 0.4 |
| Hispanic | 1.9 | 2.4 | 2.3 | 2.3 | 3.2 | 3.3 | 2.7 | 2.8 |
a Estimates for whites and blacks include Hispanics of those races. Persons of Hispanic origin may be of any race.
b Inhalants include substances such as glues and aerosols. Data for 12th-grade students based on five of six forms. Data are unadjusted for known underreporting of nitrites.
c Hallucinogens include substances such as LSD. Data are unadjusted for known underreporting of PCP.Note: Estimates represent the mean of the specified year and the previous year. Data have been combined to increase subgroup sample sizes, thus providing more stable estimates.
Sources: Johnston, O’Malley, & Bachman, 1998, Table 4-9. Also, prior years of this publication (Table 10 for 1992-1995, Table 4-9 thereafter). Prepublication Table 4-9 for 1998 provided by Monitoring the Future Study staff.
Figure SD 3.5.B Percentage of 12th-grade students in the United States who report having used specified drugs within the previous 30 days: 1975-1999
a All data on inhalants are unadjusted for underreporting of nitrites.
b All data on hallucinogens are unadjusted for underreporting of PCP.
Sources: Johnston, O’Malley, & Bachman, 2000, Table 4-7. Also, prior years of this publication. Additional historical data tables provided by Monitoring the Future Study staff.
Table SD 3.5.C Percentage of 8th-, 10th-, and 12th-grade students in the United States who report having used any illicit drugsa in the previous 30 days, and 12th-grade reports of illicit drug use by gender and by race and Hispanic origin: Selected years, 1985-1999
| 1985 | 1990 | 1991 | 1992 | 1993 | 1994 | 1995 | 1996 | 1997 | 1998 | 1999 | |
|---|---|---|---|---|---|---|---|---|---|---|---|
| Grade | |||||||||||
| Eighth | — | — | 5.7 | 6.8 | 8.4 | 10.9 | 12.4 | 14.6 | 12.9 | 12.1 | 12.2 |
| Tenth | — | — | 11.6 | 11.0 | 14.0 | 18.5 | 20.2 | 23.2 | 23.0 | 21.5 | 22.1 |
| Twelfth | 29.7 | 17.2 | 16.4 | 14.4 | 18.3 | 21.9 | 23.8 | 24.6 | 26.2 | 25.6 | 25.9 |
| 12th Graders | |||||||||||
| Gender | |||||||||||
| Male | 32.1 | 18.9 | 18.4 | 15.9 | 20.4 | 25.5 | 26.8 | 27.5 | 28.7 | 29.1 | 28.6 |
| Female | 26.7 | 15.2 | 14.1 | 12.7 | 15.9 | 18.3 | 20.4 | 21.2 | 23.2 | 21.6 | 22.7 |
| Race and Hispanic origina, b | |||||||||||
| White | 30.2 | 20.5 | 18.6 | 16.8 | 17.8 | 21.4 | 23.8 | 24.8 | 26.4 | 27.5 | 27.0 |
| Black | 22.9 | 9.0 | 7.2 | 7.3 | 9.1 | 14.3 | 18.3 | 19.7 | 20.0 | 19.4 | 20.2 |
| Hispanic | 27.2 | 13.9 | 14.7 | 14.6 | 15.6 | 18.3 | 21.4 | 22.6 | 23.9 | 24.1 | 24.4 |
a For 12th graders only: Use of “any illicit drug” includes any use of marijuana, LSD, other hallucinogens, crack, other cocaine, or heroin, or any use of other opiates, stimulants, barbiturates, or tranquilizers not under a doctor’s orders. For 8th and 10th graders only: The use of other opiates and barbiturates has been excluded, because these younger respondents appear to overreport use (perhaps because they include the use of nonprescription drugs in their answers).
b Estimates for whites and blacks include Hispanics of those races. Persons of Hispanic origin may be of any race.
c Estimates for race and Hispanic origin represent the mean of the specified year and the previous year. Data have been combined to increase subgroup sample sizes, thus providing more stable estimates. Note: Data for 8th and 10th grades available since 1991.
Sources: Johnston, O’Malley, & Bachman, 2000, Table 2-1b. Some data for 1998: The Monitoring the Future Study, The University of Michigan. Drug Use among American Young People Begins to Turn Downward. Press release of December 18, 1998, Table 1b. 1119: pre-publication tables 4-7 and 4-9 provided by Monitoring the Future Study staff.
SD 3.6 Peer Attitudes Toward Alcohol, Marijuana, Cocaine, and Smoking
Drug use is correlated with attitudes and beliefs about drugs, both in terms of perceived health risks and the level of peer disapproval.56 As children reach adolescence, peer influences on personal behavior can take on increasing importance in determining the use of drugs, alcohol, and cigarettes.
The majority of high school seniors have long reported peer disapproval of drug and alcohol use and cigarette smoking, as reflected in their responses to questions of the level of disapproval they would receive from their peers for (1) taking one to two drinks nearly every day, (2) smoking marijuana even occasionally (as opposed to trying it once), (3) taking cocaine even occasionally (as opposed to trying it once), and (4) smoking one or more packs of cigarettes per day (see Table SD 3.6).57
Among 12th graders, peer disapproval of drinking (one to two drinks nearly every day) and smoking marijuana (even occasionally) reached highs of 78 and 79 percent, respectively, in 1992, before declining to 72 and 62 percent by 1999 (see Figure SD 3.6). Peer disapproval of smoking cigarettes (one or more packs per day) has declined since 1992, although disapproval levels had been relatively stable prior to that time. In 1999, 71 percent of 12th graders reported peer disapproval of smoking a pack or more of cigarettes per day. Peer disapproval of cocaine use (even occasionally) increased from 87 percent in 1986 to 95 percent in 1991 and has remained at about this level. Cocaine use commands the highest level of peer disapproval for every year shown (see Table SD 3.6 and Figure SD 3.6).
Differences by Gender. Male high school seniors have consistently reported lower levels of peer disapproval of drinking than have their female peers. In 1999, 64 percent of males reported peer disapproval of drinking, compared with 79 percent of females. Male students also report somewhat lower peer disapproval of smoking cigarettes and marijuana.
Differences by Race. For 1999, rates of disapproval for drug use were generally similar for black and white 12th graders for marijuana and for cocaine use. Group differences are apparent for disapproval of smoking (81 percent disapproval among black compared with 69 percent among white students) and disapproval of drinking (79 percent disapproval among black compared with 70 percent among white students).
56 Substance Abuse and Mental Health Services Administration. 1996. Preliminary Estimates from the 1995 National Household Survey on Drug Abuse. Rockville, Md.: Public Health Service. Also see U.S. Department of Education, Office of Educational Research and Improvement, National Center for Education, 1993, Student Reports of Availability, Peer Approval, and Use of Alcohol, Marijuana, and Other Drugs at School: Statistics in Brief, June 1997.
57 All references to drinking, marijuana and cocaine use, and smoking cigarettes throughout this text use the parameters for these activities as defined by the Monitoring the Future questionnaire.
Table SD 3.6 Percentage of 12th-grade students in the United States who report that peers would not approve of their using alcohol, marijuana, cocaine, or cigarettes: Selected years, 1980-1999
| 1980 | 1985 | 1990 | 1991 | 1992 | 1993 | 1994 | 1995 | 1996 | 1997 | 1998 | 1999 | |
|---|---|---|---|---|---|---|---|---|---|---|---|---|
| Disapprove of taking one to two drinks nearly every day | ||||||||||||
| Total | 71 | 75 | 79 | 77 | 78 | 77 | 76 | 73 | 73 | 72 | 72 | 72 |
| Gender | ||||||||||||
| Male | 61 | 69 | 71 | 68 | 69 | 68 | 67 | 65 | 63 | 63 | 63 | 64 |
| Female | 79 | 81 | 87 | 85 | 85 | 85 | 83 | 80 | 83 | 79 | 82 | 79 |
| Race | ||||||||||||
| White | 70 | 75 | 77 | 77 | 77 | 76 | 76 | 72 | 71 | 71 | 71 | 70 |
| Black | 76 | 82 | 85 | 80 | 81 | 80 | 78 | 74 | 77 | 74 | 75 | 79 |
| Disapprove of smoking marijuana even occasionally | ||||||||||||
| Total | 51 | 64 | 76 | 76 | 79 | 74 | 69 | 65 | 63 | 60 | 60 | 62 |
| Gender | ||||||||||||
| Male | 49 | 64 | 73 | 73 | 78 | 72 | 63 | 62 | 59 | 57 | 56 | 58 |
| Female | 52 | 65 | 80 | 78 | 80 | 75 | 74 | 69 | 67 | 63 | 66 | 65 |
| Race | ||||||||||||
| White | 50 | 63 | 74 | 75 | 78 | 73 | 68 | 64 | 62 | 58 | 60 | 61 |
| Black | 59 | 72 | 89 | 86 | 84 | 76 | 70 | 69 | 66 | 67 | 67 | 63 |
| Disapprove of taking cocaine even occasionallya | ||||||||||||
| Total | — | — | 94 | 95 | 94 | 94 | 94 | 94 | 93 | 91 | 92 | 92 |
| Gender | ||||||||||||
| Male | — | — | 92 | 93 | 93 | 92 | 91 | 92 | 90 | 89 | 90 | 90 |
| Female | — | — | 96 | 96 | 96 | 96 | 96 | 95 | 96 | 93 | 95 | 94 |
| Race | ||||||||||||
| White | — | — | 95 | 96 | 96 | 95 | 94 | 95 | 93 | 91 | 92 | 93 |
| Black | — | — | 92 | 97 | 91 | 89 | 94 | 92 | 93 | 95 | 94 | 91 |
| Disapprove of smoking one or more packs of cigarettes per day | ||||||||||||
| Total | 74 | 74 | 75 | 74 | 76 | 72 | 72 | 69 | 69 | 69 | 69 | 71 |
| Gender | ||||||||||||
| Male | 73 | 72 | 73 | 72 | 76 | 68 | 67 | 65 | 65 | 65 | 66 | 67 |
| Female | 76 | 76 | 77 | 77 | 77 | 75 | 77 | 74 | 73 | 71 | 73 | 76 |
| Race | ||||||||||||
| White | 75 | 73 | 73 | 72 | 75 | 71 | 69 | 67 | 66 | 64 | 65 | 69 |
| Black | 74 | 81 | 87 | 88 | 82 | 80 | 83 | 81 | 82 | 83 | 81 | 81 |
a The question regarding cocaine use was not included prior to 1986.
Sources: Johnston, Bachman, & O’Malley, 1980, 1985, 1990-1999 (prepublication tables), Questionnaire Form 4. 1980-1985: items E08A, E08C, E08G. 1986-1987: items E08A, E08C, E08H, E08I. 1988-1999: items E07A, E07C, E07H, E07I. Data based on one of six questionnaire forms, with a resulting sample size one-sixth of the total sample size for each year.
Figure SD 3.6 Percentage of 12th-grade students in the United States who report that peers would not approve of their using alcohol, marijuana, cocaine, or cigarettes: 1980-1999
Note: Figure reports students’ perceived peer nonapproval rates of use of various drugs: alcohol (taking one to two drinks nearly every day), marijuana (smoking even occasionally), cocaine (using even occasionally), and smoking (one or more packs of cigarettes every day).
Sources: Johnston, Bachman, & O’Malley, Questionnaire Form 4. 1980-1999: items E08A, E08C, E08G. 1986-1987: items E08A, E08C, E08H, E08I. 1988-1997: items E07A, E07C, E07H, E07I. Data based on one of six questionnaire forms, with a resulting sample size one-sixth of the total sample size for each year.
SD 3.7 Abuse of Alcohol or Other Controlled Substances
The use of alcohol and other illicit drugs by teens58 has been related to numerous social problems, such as delinquency, fighting, and early sexual activity59 and to a variety of short- and long-term health problems.60 For many reasons, then, it is important that youth stay free of all such substances.
In 1998, 13 percent of 12- through 17-year-olds reported binge drinking and/or any use of an illicit drug during the previous month (see Table SD 3.7).
Differences by Gender. Rates of reported use vary little by gender. In 1998, 14 percent of males and 12 percent of females ages 12 through 17 reported illicit drug use or binge drinking in the previous month.
Differences by Race and Hispanic Origin.61 Rates of reported use differed little among whites, blacks, and Hispanics, ranging from 12 percent to 14 percent in 1998.
58 A note on methodology. Throughout this report, we present data from two major federally sponsored surveys of adolescent substance use: the Monitoring the Future Study, a school-based survey, and the National Household Survey on Drug Abuse, a household survey of the population ages 12 and older. A recent report finds that rates of drug use obtained were larger in the school survey than in the household survey, possibly because of greater underreporting in the household setting than in the classroom and the different questionnaires used in the two surveys. Gfroerer, J., Wright, D., & Kopstein, A. 1997. Prevalence of Youth Substance Use: The Impact of Methodological Differences between Two National Surveys. Drug and Alcohol Dependence 47: 19-30.
59 National Institute on Drug Abuse. National Trends in Drug Use and Related Factors among American High School Students and Young Adults, 1976-1986. 1987. DHHS Pub. No. (ADM) 87-1535. Washington, D.C.: U.S. Department of Health and Human Services. See also: Grant, B.R., & Dawson, D.A. Age at Onset of Alcohol Use and Its Association with DSM-IV Alcohol Abuse and Dependence: Results from the National Longitudinal Alcohol Epidemiologic Survey. Journal of Substance Abuse 9: 103-110, which reports decreasing odds of alcohol dependence with each increasing year of age at onset of use, as well as decreasing odds of alcohol abuse.
60 Public Health Service, 1993.
61 Estimates for whites and blacks exclude Hispanics of those races. Persons of Hispanic origin may be of any race.
Table SD 3.7 Percentage of youth ages 12 through 17 in the United States reporting illicit druga use and/or binge drinkingb in the past month, by gender and by race and Hispanic origin: 1994-1998
| 1994 | 1995 | 1996 | 1997 | 1998 | |
|---|---|---|---|---|---|
| Total | 13 | 15 | 13 | 14 | 13 |
| Gender | |||||
| Male | 14 | 17 | 14 | 16 | 14 |
| Female | 12 | 13 | 11 | 13 | 12 |
| Race and Hispanic originc | |||||
| White | 15 | 16 | 13 | 15 | 14 |
| Black | 10 | 12 | 10 | 12 | 11 |
| Hispanic | 10 | 13 | 13 | 13 | 12 |
| Other | 4 | 14 | 8 | 13 | 8 |
a Illicit drugs include marijuana, cocaine (including crack), heroin, hallucinogens (including PCP), inhalants, and nonmedical use of psychotherapeutics.
b Binge drinking includes drinking five or more drinks on the same occasion on one or more days in the past 30 days.
c Estimates for whites and blacks exclude Hispanics of those races. Persons of Hispanic origin may be of any race. Source: Substance Abuse and Mental Health Services Administration (SAMHSA), Office of Applied Studies, Prevalence Branch. Unpublished analyses, National Household Survey on Drug Abuse, 1994-1998.
Behavioral Health: Sexual Activity And Fertility
SD 4.1 Sexually Experienced Teens
Sexual experience and, particularly, age at first intercourse represent critical indicators of the risk of pregnancy and sexually transmitted diseases. Youth who begin having sex at a younger age are exposed to these risks over a longer period of time. Because sexual intercourse during the teen years, especially first intercourse, is often unplanned,62 it is also often unprotected by contraception.63 In addition, research has shown that youth who have an early sexual experience are more likely at later ages to have more sexual partners and more frequent intercourse.64
Trends over the past several decades show that increasing proportions of teens are sexually experienced—defined as ever having had sexual intercourse (see Figure SD 4.1). However, recent data show a decline between 1995 and 1997 in the percentage of teens who have ever had sexual intercourse (see Table SD 4.1.B).
Differences by Age. Age is the most important correlate of teen sexual experience. For the 1985 through 1987 cohort (cohorts are defined as those individuals who turned 20 in the specific time period presented), just under 1 in 10 13-year-old males and only 1 in 50 13-year-old females were sexually experienced by age 13. The proportion of teen females who were sexually experienced by age 15 increased from 3 percent for the 1958-1960 cohort to 11 percent for the 1990 to 1994 cohort. By age 20 for that same age cohort, three in four females were sexually experienced. And, for the 1985-1987 cohort, four in five males were sexually experienced by age 20 (see Table SD 4.1.A). By the late teen years, most teens are sexually experienced; however, it is important to note that not all teens are sexually experienced. Among the 1990-1994 cohort of females, 45 percent had not had intercourse by age 18. Among the 1985-1987 cohort of adolescent males, more than one-third had not had intercourse by age 18 (see Table SD 4.1.A). In addition, data from the Youth Risk Behavior Survey, a survey of 9th- through 12th-grade students show that, for 9th-grade students in 1999, 39 percent reported having had sexual intercourse. This percentage rises with each grade, reaching 65 percent by the 12th grade (see Table SD 4.1.B).65
Differences by Gender. More teen males than females reported having had intercourse by a given age. Data from the 1985-1987 cohort suggest that the proportion of teen males at each year of age who report having sex was roughly equal to the rate of sexually experienced teen females who are one year older (see Table SD 4.1.A).
Among female adolescents of all ages, the percentage who were sexually experienced has increased over time (see Table SD 4.1.A). For example, the percentage of 18-year-old females who were sexually experienced increased from 27 percent for the 1958-1960 cohort to 35
percent for the 1970-1972 cohort and to 52 percent for the 1985-1987 cohort. The proportion continued to increase to 55 percent for the 1990-1994 cohort. The percentage of male teens who were sexually experienced increased from 55 percent for the 1970-1972 cohort to
64 percent for the 1985-1987 cohort (see Table SD 4.1.A). Caution should be exercised in interpreting these differences, however, since the data for males and females come from different surveys.
Data for students from the Youth Risk Behavior Survey indicate that in 1999, males reported having had sex by the 9th grade at a rate 12 percentage points higher than females (45 versus 33 percent). By the 12th grade, females were as likely as males to report ever having sex (see Table SD 4.1.B). Additional survey research indicates that the percentage of teen males who have ever had sex has declined since 1988, while the use of contraception among teen males increased (1995 National Survey of Adolescent Males).66 The 1995 National Survey of Family Growth found that 50 percent of women 15 through 19 years of age had ever had intercourse, the first decline ever recorded by the periodic survey.67
Differences by Race.68 Black students in grades 9 through 12 are more likely than white and Hispanic students to have had their first sexual experience while still in high school (see Table SD 4.1.B). Specifically, in 1999,
- 45 percent of both male and female white students reported having had sexual intercourse,
- 63 percent of Hispanic male students and 46 percent of Hispanic female students reported having had sexual intercourse, and
- 76 percent of black male students and 67 percent of black female students reported having had sexual intercourse.
62 Lowenstein, G., & Furstenberg, F.F. 1991. Is Teenage Sexual Behavior Rational? Journal of Applied Social Psychology 21 (12): 957-986. Abma, J., Driscoll, A., & Moore, K. 1998. Young Women's Degree of Control over First Intercourse: An Exploratory Analysis. Family Planning Perspectives 30 (1): 12-18.
63 Forrest, J.D., & Singh, S. 1990. The Sexual and Reproductive Behavior of American Women, 1982-1988. Family Planning Perspectives 22 (5): 206-214.
64 Koyle, P., Jensen, L., Olsen, J., & Cundick, B. 1989. Comparison of Sexual Behaviors among Adolescents Having an Early, Middle, and Late First Intercourse Experience. Youth and Society 20 (4): 461-475.
65 Direct comparison with other years is not possible, as grade in school does not accurately reflect age, and data from the Youth Risk Behavior Surveillance Survey include only teens in school.
66 The Urban Institute. New Data on Sexual Behaviors of Teenage Males. Fact Sheet, May 1, 1997. Washington, D.C.: The Urban Institute.
67 U.S. Department of Health and Human Services, HHS News. Teen Sex Down, New Study Shows. Secretary Shalala Announces New Teen Pregnancy Prevention Grant Programs. Press release, May 1, 1997. Washington, D.C.: HHS, National Center for Health Statistics.
68 Estimates for whites and blacks exclude Hispanics of those races.
Table SD 4.1.A Percentage of youth in the United States who have ever had intercourse by each age, by gender: Cohortsa age 20 in 1958-1960, 1970-1972,1985-1987, and 1990-1994
| Age at first intercourse |
Females who turned age 20 in:b | |||
|---|---|---|---|---|
| 1958-1960 | 1970-1972 | 1985-1987 | 1990-1994 | |
| 13 | 1 | 0 | 2 | — |
| 14 | 2 | 1 | 5 | — |
| 15 | 3 | 4 | 10 | 11 |
| 16 | 8 | 9 | 21 | — |
| 17 | 16 | 20 | 36 | — |
| 18 | 27 | 35 | 52 | 55 |
| 19 | 46 | 53 | 66 | — |
| 20 | 61 | 68 | 76 | 75 |
| Age at first intercourse |
Males who turned age 20 in:b | |||
|---|---|---|---|---|
| 1958-1960 | 1970-1972 | 1985-1987 | 1990-1994 | |
| 13 | — | 11 | 9 | — |
| 14 | — | 15 | 13 | — |
| 15 | — | 20 | 27 | — |
| 16 | — | 30 | 41 | — |
| 17 | — | 41 | 52 | — |
| 18 | — | 55 | 64 | — |
| 19 | — | 67 | 75 | — |
| 20 | — | 74 | 80 | — |
a Cohorts are defined as those individuals who turned 20 years old within the specified time period.
b Data are based on females ages 30-32 and 42-44 in the 1982 National Survey of Family Growth (NSFG), ages 21-23 and 36-38 in the 1988 NSFG, and ages 25-29 in the 1995 NSFG and males ages 21-23 and 36-38 in the 1991 Survey of Men.
Source: Alan Guttmacher Institute, 1994, Figures 11 and 12, pages 22-23; Abma, et al., 1997, Table 20.
Figure SD 4.1 Percentage of youth in the United States who have had intercourse, by age and gender: Cohort a
age 20 in 1985-1987
a Cohorts are defined as those individuals who turned 20 years old within the specified time period.
Source: Alan Guttmacher Institute, 1994.
Table SD 4.1.B Percentage of students grades 9 through 12 in the United States who reported ever having sexual intercourse, by gender, grade, and race and Hispanic origin: 1995,1997, and 1999
| 1995 | 1997 | 1999 | |||||||
|---|---|---|---|---|---|---|---|---|---|
| Total | Male | Female | Total | Male | Female | Total | Male | Female | |
| Total | 53 | 54 | 52 | 48 | 49 | 48 | 50 | 52 | 48 |
| Grade | |||||||||
| Ninth | 37 | 41 | 32 | 38 | 42 | 34 | 39 | 45 | 33 |
| Tenth | 48 | 50 | 46 | 43 | 42 | 44 | 47 | 51 | 43 |
| Eleventh | 59 | 57 | 60 | 50 | 49 | 50 | 53 | 51 | 54 |
| Twelfth | 66 | 67 | 66 | 61 | 60 | 62 | 65 | 64 | 66 |
| Race and Hispanic origina | |||||||||
| White | 49 | 49 | 49 | 44 | 43 | 44 | 45 | 45 | 45 |
| Black | 73 | 81 | 67 | 73 | 80 | 66 | 71 | 76 | 67 |
| Hispanic | 58 | 62 | 53 | 52 | 58 | 46 | 54 | 63 | 46 |
a Estimates for whites and blacks exclude Hispanics of those races. Persons of Hispanic origin may be of any race.
Sources: Kann et al., 1998, Table 26; Kann et al., 1996, Table 26.
SD 4.2 Sexually Active Teens
Having become sexually experienced does not necessarily mean teenagers will be sexually active from that point on. They may still abstain from intercourse out of concern for the risk of pregnancy or sexually transmitted diseases or a preference for abstinence, or they may experience periods in which they do not have a sexual partner; nevertheless, research indicates that once a person has had sex, he or she is likely to continue to be sexually active. Among young adults ages 18 through 22 who had ever had intercourse, over 70 percent had a second experience of intercourse within 6 months of first intercourse.69
The percentage of teens in grades 9 through 12 who are sexually active—defined as having had sexual intercourse in the previous 3 months—has remained steady, with little variation, from 1991 to 1996 (see Table SD 4.2).
Differences by Gender. There is no difference between the percentages of male and female students who are sexually active. In 1999, 36 percent of males and 36 percent of females reported being sexually active.
Differences by Race and Hispanic Origin.70 In 1999, black students were, at 53 percent, more likely than either white (33 percent) or Hispanic (36 percent) students to be sexually active (see Figure SD 4.2).
Differences by Grade. The percentage of teens who are sexually active rises as grade increases. Twelfth-grade students are nearly twice as likely to be sexually active as are 9th-grade students (see Table SD 4.2).
69 Moore, K.A., & Peterson, J.L. August 1989. The Consequences of Teenage Pregnancy. Final Report to NICHD and ASPE/HHS, Grant No. HD 21537.
70 Estimates for whites and blacks exclude Hispanics of those races.
Table SD 4.2 Percentage of students grades 9 through 12 in the United States who reported having had sexual intercourse in the previous 3 months, by gender, race and Hispanic origin, grade, and age: 1991, 1993, 1995, 1997, and 1999
| 1991 | 1993 | 1995 | 1997 | 1999 | |
|---|---|---|---|---|---|
| Total | 38 | 38 | 38 | 35 | 36 |
| Gender | |||||
| Male | 37 | 38 | 36 | 33 | 36 |
| Female | 38 | 38 | 40 | 37 | 36 |
| Race and Hispanic origina | |||||
| White | 34 | 34 | 35 | 32 | 33 |
| Black | 59 | 59 | 54 | 54 | 53 |
| Hispanic | 37 | 39 | 39 | 35 | 36 |
| Grade | |||||
| Ninth | 22 | 25 | 24 | 24 | 27 |
| Tenth | 33 | 30 | 34 | 29 | 33 |
| Eleventh | 43 | 40 | 42 | 38 | 38 |
| Twelfth | 51 | 53 | 50 | 46 | 51 |
| Age | |||||
| 15 | 24 | 25 | 28 | 26 | 27 |
| 16 | 38 | 35 | 37 | 32 | 35 |
| 15 or 16 | 31 | 31 | 32 | 29 | 32 |
a Estimates for whites and blacks exclude Hispanics of those races. Persons of Hispanic origin may be of any race.
Sources: Data for 1991: Centers for Disease Control and Prevention. 1990-1991 Youth Risk Behavior Surveillance System, Table 1, p. 78; data for 1993: Kann, et al., 1995. Morbidity and Mortality Weekly Report 44 (SS-1): Table 20; data for 1995: Kann, et al., 1996, Table 26; data for 1997: Kann, et al., 1998, Table 26; and unpublished data from the Centers for Disease Control.
Figure SD 4.2 Percentage of youth in grades 9 through 12 in the United States who reported having had sexual intercourse in the previous 3 months, by race and Hispanic origin: a 1999
a Estimates for whites and blacks exclude Hispanics of those races. Persons of Hispanic origin may be of any race.
Source: Kann, et al., 1998, Table 26.
SD 4.3 Contraceptive Use by Teens
Sexual intercourse without contraception puts a teen at risk of unintended pregnancy and of contracting sexually transmitted diseases such as HIV/AIDS. The vast majority of teens do not want to become pregnant. Data from a national survey show that among teens who
had first intercourse at age 17 or younger, fewer than 1 in 100 wanted a pregnancy to occur at that time. This was true for both males and females and for both blacks and whites.71 Even among adolescents who give birth as a teenager, only 34 percent of the births are
intended.72
Condoms and birth control pills are the most common forms of contraception used by sexually active teenagers.73 In 1999, over half (58 percent) of sexually experienced students in grades 9 through 12 reported use of a condom during their last sexual intercourse, while only 16 percent reported use of the birth control pill (see Tables SD 4.3.A and SD 4.3.B).
Condom use among sexually experienced students increased between 1991 and 1999 from 46 percent to 58 percent (see Table SD 4.3.A). Use of birth control pills has remained relatively steady from 1993 to 1999 at 16 to 18 percent, with some subgroup differences that are discussed below (see Table SD 4.3.B).
Differences by Gender. Female students are less likely than male students to report having used a condom during their last intercourse (51 percent of females versus 66 percent of males in 1999).
Differences by Grade. Condom use among 12th-grade students is lower than among students in the earlier grades. The decrease is largest among young women, dropping from 50 percent to 41 percent between the 11th and 12th grades for 1999. In contrast, in 1999, only 12 percent of sexually experienced 9th graders reported use of the pill, while 25 percent of 12th graders reported its use (see Figure SD 4.3).
Differences by Race.74 Black students report the highest use of condoms, while white students report the highest use of the pill. In 1999, white students were more likely to have used the pill during their last sexual intercourse (21 percent) than were either black students (8 percent) or Hispanic students (8 percent) (see Tables SD 4.3.A and SD 4.3.B). It is important to note that the data presented here include only those teens who are in school. Teens out of school are likely to have lower rates of contraceptive use because their access to education regarding the risks associated with unprotected sex, as well as guidance on how to obtain protection, is more limited.
71 Moore & Peterson, August 1989. See also preliminary results of research from the 1995 National Survey of Adolescent Males and the 1995 National Survey of Family Growth, The Urban Institute Fact Sheet (May 1, 1997), New Data on Sexual Behaviors of Teenage Males.
72 In the 1995 National Survey of Family Growth, the percentage of births intended at the time of conception to women ages 15 through 44 that occurred 5 years prior to the survey interview were as follows: 69 percent to all mothers, 34 percent to mothers under 20, 61 percent to mothers ages 20 through 24, 78 percent to mothers ages 25 through 29, and 80 percent to mothers ages 30 through 44. Abma, J.C., Chandra, A., Mosher, W.D., Peterson, L., & Piccinino, L. 1997. Fertility, Family Planning, and Women's Health: New Data from the 1995 National Survey of Family Growth. National Center for Health Statistics, Vital Health Statistics 23 (19), Table 14.
73 Peterson, L.S., 1995, Contraceptive Use in the United States: 1982-90. Advance Data, No. 260, Division of Vital Statistics, National Center for Health Statistics, Centers for Disease Control and Prevention. Data from the National Survey of Family Growth.
74 Estimates for whites and blacks exclude Hispanics of those races.
Table SD 4.3.A Percentage of currently sexually activea high school students in the United States who reported using a condom during last sexual intercourse, by gender, grade, and race and Hispanic origin: 1991, 1993, 1995, 1997, and 1999
| 1991 | 1993 | 1995 | 1997 | 1999 | |||||||||||
|---|---|---|---|---|---|---|---|---|---|---|---|---|---|---|---|
| Total | Male | Female | Total | Male | Female | Total | Male | Female | Total | Male | Female | Total | Male | Female | |
| Total | 46 | 55 | 38 | 53 | 59 | 46 | 54 | 61 | 49 | 57 | 63 | 51 | 58 | 66 | 51 |
| Grade | |||||||||||||||
| Ninth | 53 | 56 | 50 | 62 | 63 | 59 | 63 | 66 | 59 | 59 | 59 | 58 | 67 | 70 | 63 |
| Tenth | 46 | 57 | 36 | 55 | 63 | 46 | 60 | 68 | 52 | 59 | 65 | 53 | 63 | 70 | 55 |
| Eleventh | 49 | 57 | 41 | 55 | 65 | 46 | 52 | 57 | 49 | 60 | 65 | 55 | 59 | 69 | 50 |
| Twelfth | 41 | 51 | 33 | 47 | 52 | 41 | 50 | 57 | 43 | 52 | 61 | 43 | 48 | 56 | 41 |
| Race and Hispanic originb | |||||||||||||||
| White | 47 | 55 | 38 | 52 | 59 | 46 | 53 | 58 | 48 | 56 | 62 | 49 | 55 | 63 | 48 |
| Black | 48 | 57 | 39 | 57 | 64 | 48 | 66 | 72 | 61 | 64 | 68 | 59 | 70 | 75 | 65 |
| Hispanic | 37 | 47 | 27 | 46 | 55 | 37 | 44 | 56 | 33 | 48 | 55 | 40 | 55 | 66 | 43 |
a “Currently sexually active” is defined as having had sexual intercourse during the 3 months preceding the survey.
b Estimates for whites and blacks exclude Hispanics of those races. Persons of Hispanic origin may be of any race.
Sources: Data for 1990: Centers for Disease Control and Prevention, 1990-1991 Youth Risk Behavior Surveillance System, Table 2, p. 47; data for 1993: Kann, et al., 1995, Table 20; data for 1995: Kann, et al., 1996, Table 28; also, unpublished tabulations from L. Kann, Centers for Disease Control and Prevention; data for 1997: Kann, 1998, Table 28.
Table SD 4.3.B Percentage of currently sexually activea high school students in the United States who reported birth control pill use during last sexual intercourse, by gender, grade, and race and Hispanic origin: 1993, 1995, 1997, and 1999
| 1993 | 1995 | 1997 | 1999 | |||||||||
|---|---|---|---|---|---|---|---|---|---|---|---|---|
| Total | Male | Female | Total | Male | Female | Total | Male | Female | Total | Male | Female | |
| Total | 18 | 15 | 22 | 17 | 14 | 20 | 17 | 13 | 21 | 16 | 12 | 20 |
| Grade | ||||||||||||
| Ninth | 9 | 8 | 11 | 11 | 10 | 13 | 8 | 8 | 8 | 12 | 11 | 13 |
| Tenth | 14 | 10 | 17 | 12 | 9 | 16 | 12 | 8 | 17 | 9 | 6 | 13 |
| Eleventh | 17 | 12 | 22 | 15 | 13 | 17 | 16 | 12 | 19 | 15 | 12 | 18 |
| Twelfth | 26 | 23 | 29 | 25 | 21 | 29 | 24 | 19 | 30 | 25 | 17 | 31 |
| Race and Hispanic originb | ||||||||||||
| White | 20 | 17 | 24 | 21 | 17 | 25 | 21 | 17 | 25 | 21 | 16 | 26 |
| Black | 15 | 11 | 21 | 10 | 8 | 12 | 12 | 9 | 15 | 8 | 3 | 12 |
| Hispanic | 12 | 10 | 15 | 11 | 14 | 9 | 10 | 7 | 13 | 8 | 5 | 11 |
a “Currently sexually active” is defined as having had sexual intercourse during the 3 months preceding the survey.
b Estimates for whites and blacks exclude Hispanics of those races. Persons of Hispanic origin may be of any race.
Sources: Data for 1993: Kann, et al., 1995, Table 20; data for 1995: Kann, et al., 1996, Table 28; data for 1997: Kann, et al., 1998, Table 28.
Figure SD 4.3 Percentage of currently sexually active a high school students in the United States who reported using a contraceptive during their last sexual intercourse, by grade and method: 1999
a “Currently sexually active” is defined as having had sexual intercourse during the 3 months preceding the survey.
Source: Kann et al., 1998, Table 28.
SD 4.4 Number of Sexual Partners
The greater the number of sexual partners a person has, the greater the risk of contracting sexually transmitted diseases such as HIV/AIDS. While trend data on the sexual behavior of teens are limited, one study indicates that the proportion of sexually active females living in metropolitan areas who have had six or more sexual partners doubled from 1971 to 1988.75
Differences by Gender. Male youth generally report a higher number of sexual partners than do female youth. In 1995, 6 percent of sexually active males and 3 percent of sexually active females ages 15 through 19 reported having five or more sexual partners in a year. The number of sexual partners per year among sexually active females is concentrated at the lower end of the scale, with either zero or one partners most likely to be reported (see Table SD 4.4.A). Among high school students surveyed in 1999, 19 percent of males reported having had four or more sexual partners in their lifetime, compared with 13 percent of female students (see Table SD 4.4.B).
Differences by Race.76 Black high school students are more likely to report having had four or more sexual partners in their lifetime than their white or Hispanic peers: 34 percent versus 12 and 16 percent, respectively, in 1999 (see Table SD 4.4.B).
Differences by Age at First Intercourse. Age at first intercourse has a strong association with the number of sexual partners a person has over a lifetime (see Table SD 4.4.C). Among teens who were age 20 in 1992, 74 percent of males who had sexual intercourse at age 14 or younger had six or more partners during their lifetime, compared with 48 percent of those who initiated sex at age 15 or 16, and 10 percent of those who did not have intercourse until age 17 or older. A similar pattern exists for females (see Figure SD 4.4).
75 Kost, K., Forrest, J.D. 1992. American Women's Sexual Behavior and Exposure to Risk of Sexually Transmitted Disease. Family Planning Perspectives 24 (6): 244-254. Based on data from the National Surveys of Young Women (1971, 1976, and 1979) and the 1988 National Survey of Family Growth.
76 Estimates for whites and blacks exclude Hispanics of those races.
Table SD 4.4.A Percentage distribution of number of sexual partners in a year among sexually active teens ages 15 through 19 in the United States, by gender: 1995
| 0 Partners | 1 Partner | 2 Partners | 3-4 Partners | 5 or more Partners | |
|---|---|---|---|---|---|
| Males | 10 | 44 | 26 | 14 | 6 |
| Females | 8 | 62 | 17 | 10 | 3 |
Source: Analyses of the 1995 National Survey of Family Growth, Cycle 5, by Child Trends; also Sonenstein, et al., 1997, pp. 16 and 17.
Table SD 4.4.B Percentage of students in grades 9 through 12 in the United States who reported having four or more sex partners during lifetime, by gender, grade, and race and Hispanic origin: 1993, 1995, 1997, and 1999
| 1993 | 1995 | 1997 | 1999 | |||||||||
|---|---|---|---|---|---|---|---|---|---|---|---|---|
| Total | Male | Female | Total | Male | Female | Total | Male | Female | Total | Male | Female | |
| Total | 19 | 22 | 15 | 18 | 21 | 14 | 16 | 18 | 14 | 16 | 19 | 13 |
| Grade | ||||||||||||
| Ninth | 11 | 15 | 6 | 13 | 18 | 7 | 12 | 16 | 8 | 12 | 16 | 8 |
| Tenth | 16 | 19 | 13 | 16 | 20 | 11 | 14 | 16 | 12 | 16 | 21 | 10 |
| Eleventh | 20 | 23 | 16 | 19 | 21 | 17 | 17 | 17 | 16 | 17 | 19 | 15 |
| Twelfth | 27 | 31 | 23 | 23 | 25 | 21 | 21 | 21 | 21 | 21 | 21 | 21 |
| Race and Hispanic originb | ||||||||||||
| White | 14 | 15 | 13 | 14 | 15 | 13 | 12 | 11 | 12 | 12 | 12 | 13 |
| Black | 43 | 59 | 27 | 36 | 52 | 22 | 39 | 53 | 25 | 34 | 48 | 21 |
| Hispanic | 19 | 26 | 11 | 18 | 24 | 12 | 16 | 20 | 10 | 17 | 23 | 11 |
a Estimates for whites and blacks exclude Hispanics of those races. Persons of Hispanic origin may be of any race.
Sources: Data for 1993: Kann, et al., 1995, Table 20; data for 1995: Kann, et al., 1996, Table 26; data for 1997: Kann, et al., 1998, Table 26.
Table SD 4.4.C Percentage distribution of number of lifetime sexual partners among sexually active 20-year-olds by age at first intercourse and by gender: 1992
| First intercourse at age 14 or Younger |
First intercourse at age 15 or 16 |
First intercourse at age 17 or older |
|
|---|---|---|---|
| Males | |||
| 1 partner | 2 | 9 | 42 |
| 2 or 3 partners | 10 | 27 | 30 |
| 4 or 5 partners | 15 | 16 | 19 |
| 6 or more partners | 74 | 48 | 10 |
| Females | |||
| 1 partner | 2 | 10 | 45 |
| 2 or 3 partners | 26 | 28 | 33 |
| 4 or 5 partners | 16 | 28 | 13 |
| 6 or more partners | 57 | 34 | 10 |
Note: Percents may not sum to 100 due to rounding.
Source: National Center for Health Statistics, Centers for Disease Control and Prevention. 1992 National Health Interview Survey—Youth Risk Behavior Supplement. Tabulations by Child Trends.
Figure SD 4.4 Percentage of sexually active 20-year-olds in the United States with six or more lifetime sexual partners, by age at first intercourse: 1992
Source: National Center for Health Statistics, Centers for Disease Control and Prevention. 1992 National Health Interview Survey—Youth Risk Behavior Supplement. Tabulations by Child Trends.
SD 4.5 Teen Pregnancy and Abortion
The United States has the highest teen pregnancy, birth, and legal abortion rates among western nations. The teen pregnancy rate in the United States is twice as high as that in England, Wales, and Canada; three times as high as that in Sweden; and seven times as high as that in the Netherlands.77 The Society for Adolescent Medicine cites a multitude of factors, including the lack of sex education, inadequate access to reliable contraception, poverty, and substance abuse, as some of the reasons for the U.S.’s high teen pregnancy, birth, and abortion rates.
Pregnancy
Teenage pregnancy rates78 have declined considerably in the 1990s. The overall pregnancy rate was 98.7 per 1,000 women ages 15-19 years in 1996, down 15 percent from its high point of 116.5 in 1991 (See Table SD 4.5). Among the factors accounting for the overall decrease in teenage pregnancy rates are 1) a decrease in sexual activity, 2) increased condom use, and 3) the adoption of Depo-Provera and Norplant contraception methods.79 Furthermore, societal influences may have also combined to reduce the pregnancy rate among teens. One is changing attitudes towards premarital sex. Many public and private initiatives have focused attention on the importance of pregnancy prevention through abstinence. Furthermore, the long economic expansion of the 1990s has increased the economic opportunities for teenagers. The sexual activity of teens is closely associated with simple measures of economic prosperity. As a result of the economic boom, teenagers’ educational and occupational goals may have changed during the 1990s, with more value placed on school completion and entering the work force.80
Differences by Age. Pregnancy is more prevalent among older teens. For teenagers ages 15 to 17 years, the pregnancy rate was 67.8 in 1996, while the pregnancy rate for older teens (18 or 19 years) was more than twice that, at 146.4 (See Table SD 4.5.A). This gap has been apparent throughout the 1990s. This trend reflects the fact that older teens are more sexually active than younger ones. In 1995, over two-thirds of teens ages 18 to 19 years had been sexually active in the last 12 months, compared to approximately one-third of all teenagers ages 15 to 17.81
Differences by Race and Hispanic Origin. The pregnancy rates for non-Hispanic black and Hispanic teenagers are about twice as high as the rate for non-Hispanic white teenagers. The lower rate for non-Hispanic white teenagers is due to both the smaller proportion of sexually active teens and lower pregnancy rates for those who are sexually active. In 1996 non-Hispanic black and Hispanic teens ages 15-19 were more than twice as likely as non-Hispanic whites to become pregnant (rates of 177.8 and 157.1, respectively versus 68.1). (See Table SD 4.5.A).
Abortion
The proportion of females ages 15 through 19 who obtained an abortion during the previous year increased from 2.3 percent to 4.4 percent between 1973 and 1985, presumably influenced both by the legalization of abortion and increasing levels of sexual activity and
pregnancy (see Section SD 4.2 and Table SD 4.5.B). By 1992, the proportion obtaining abortions had dropped to 3.6 percent, and it continued to decline, reaching 2.9 percent in 1996 (the most recent year for which data are available). Similar patterns occurred among both younger teens (ages 15 through 17) and older teens (ages 18 or 19).
There has not been a steady trend in the propensity of pregnant teens to give birth versus obtain an abortion over the past 20 years (see Figure SD 4.5.C). In 1972, the proportion of pregnancies (excluding miscarriages) to females ages 15 through 19 that ended in birth was
76 percent. During the rest of the 1970s, this proportion declined as abortion increased. Throughout most of the 1980s, however, the proportion of teen pregnancies ending in birth remained fairly stable at around 48 percent. By 1995, there was an increase to 55 percent in the proportion of teen pregnancies ending in birth, indicating a trend toward fewer abortions among pregnant teens.
Differences by Age. Older teens ages 18 or 19 have higher abortion rates than younger teens ages 15 through 17. In 1996, 1.9 percent of younger teens and 4.5 percent of older teens obtained an abortion (see Table SD 4.5.B).
Differences by Race and Hispanic Origin.82 Non-Hispanic black teens are more likely to have had an abortion than are their non-Hispanic white and Hispanic peers. Among non-Hispanic black females ages 15 through 19, 6.6 percent obtained an abortion in 1995, compared with 1.9 percent of non-Hispanic white and 3.9 percent of Hispanic females (see Table SD 4.5.C).
Sexually Experienced Teens. The percentage of teens who are sexually experienced has increased during the past several decades; therefore, it is reasonable to consider abortion in light of this trend. When abortion rates are calculated among females ages 15 through 19 who have ever had intercourse, the data indicate that the proportion obtaining abortions increased from 5.9 percent in 1973 to 9.1 percent in 1980, then declined to 6.8 percent in 1991 (see Table SD 4.5.B). Although a larger proportion of teen females were sexually experienced in 1990 than in 1980 (see Section SD 4.2), a smaller proportion of these sexually experienced teens obtained abortions.
77 Singh & Darroch. 2000. Adolescent Pregnancy and Childbearing: Levels and Trends in Developed Countries. Family Planning Perspectives 32 (1): 14-23. Society for Adolescent Medicine. Position Paper on Reproductive Health Care for Adolescents. Journal of Adolescent Health: 1991 12:649-661.
78 Pregnancy rates are based on the sum of live births, induced abortions, and fetal losses.
79 Ventura, Mosher, Curtin, Abma, & Henshaw. 2000. Trends in Pregnancies and Pregnancy Rates by Outcome: Estimates for the United States, 1976-96. Vital and Health Statistics 21(56) Hyattsville MD.
80 Ibid.
81 Ibid.
82 Estimates for whites and blacks exclude Hispanics of those races.
Table SD 4.5.A Rate of females ages 15 through 19 experiencing pregnancy by age and by race and Hispanic origin: 1990-1996
| 1990 | 1991 | 1992 | 1993 | 1994 | 1995 | 1996 | |
|---|---|---|---|---|---|---|---|
| Females 15-19 years | |||||||
| Total | 116.3 | 116.5 | 112.8 | 110.4 | 107.6 | 102.7 | 98.7 |
| Race and Hispanic origina | |||||||
| White | 87.4 | 84.7 | 79.3 | 76.9 | 74.5 | 71.6 | 68.1 |
| Black | 221.3 | 221.7 | 217.3 | 211.7 | 201.2 | 184.4 | 177.8 |
| Hispanic | 155.8 | 164.6 | 167.8 | 166.1 | 167.2 | 162.8 | 157.1 |
| Females 15-17 years | |||||||
| Total | 80.3 | 79.8 | 77.3 | 76.8 | 75.5 | 71.7 | 67.8 |
| Race and Hispanic origina | |||||||
| White | 56.3 | 54.1 | 50.4 | 49.9 | 48.7 | 46.7 | 43.9 |
| Black | 165.0 | 164.6 | 160.4 | 158.0 | 149.8 | 137.0 | 128.1 |
| Hispanic | 101.0 | 107.0 | 110.9 | 110.2 | 113.9 | 110.0 | 105.0 |
| Females 18 or 19 years | |||||||
| Total | 162.4 | 167.2 | 165.1 | 160.6 | 156.7 | 150.8 | 146.4 |
| Race and Hispanic origina | |||||||
| White | 126.4 | 126.9 | 121.8 | 117.3 | 114.0 | 110.2 | 105.6 |
| Black | 295.3 | 299.8 | 300.5 | 292.4 | 280.9 | 258.3 | 254.4 |
| Hispanic | 231.4 | 247.6 | 251.6 | 249.3 | 246.5 | 242.7 | 235.4 |
a Estimates for whites and blacks exclude Hispanics of those races. Persons of Hispanic origin may be of any race.
Sources: Ventura, et al., 2000, Vital and Health Statistics Series 21, Tables 3-5.
Figure SD 4.5.A Pregnancy, birth, and abortion rates for teenagers 15-17 years: 1976-1996
Source: Ventura, et al., 1999, National Vital Statistics Reports 47, Table 2.
Figure SD 4.5.B Pregnancy, birth, and abortion rates for teenagers 18-19 years: 1976-1996
Source: Ventura, et al., 1999, National Vital Statistics Reports 47, Table 2.
Table SD 4.5.B Percentage of females ages 15 through 19 in the United States obtaining an abortion during the year, by age and by race and Hispanic origin: 1990-1996
| 1990 | 1991 | 1992 | 1993 | 1994 | 1995 | 1996 | |
|---|---|---|---|---|---|---|---|
| Females ages 15-17 | |||||||
| Total | 2.7 | 2.4 | 2.3 | 2.3 | 2.1 | 2.0 | 1.9 |
| Race and Hispanic origina | |||||||
| White | 2.1 | 1.8 | 1.6 | 1.5 | 1.4 | 1.3 | 1.3 |
| Black | 5.8 | 5.5 | 5.4 | 5.4 | 5.0 | 4.6 | 4.4 |
| Hispanic | 2.4 | 2.5 | 2.8 | 2.7 | 2.8 | 2.5 | 2.5 |
| Females ages 18 or 19 | |||||||
| Total | 5.8 | 5.6 | 5.4 | 5.2 | 4.9 | 4.6 | 4.5 |
| Race and Hispanic origina | |||||||
| White | 4.7 | 4.3 | 3.9 | 3.7 | 3.3 | 3.1 | 2.9 |
| Black | 11.7 | 11.6 | 11.7 | 11.5 | 10.8 | 9.8 | 10.0 |
| Hispanic | 6.0 | 6.3 | 6.6 | 6.4 | 6.3 | 5.9 | 6.0 |
| Females ages 15-19 | |||||||
| Total | 4.0 | 3.8 | 3.6 | 3.4 | 3.2 | 3.0 | 2.9 |
| Race and Hispanic origina | |||||||
| White | 3.2 | 2.8 | 2.5 | 2.4 | 2.2 | 2.0 | 1.9 |
| Black | 8.4 | 8.1 | 8.0 | 7.8 | 7.3 | 6.6 | 6.6 |
| Hispanic | 3.9 | 4.0 | 4.3 | 4.2 | 4.2 | 3.9 | 3.9 |
a Estimates for whites and blacks exclude Hispanics of those races. Persons of Hispanic origin may be of any race.
Sources: Ventura, et al., 2000.
Table SD 4.5.C Percentage of females under age 20 in the United States obtaining an abortion, by all females and sexually experienced females: Selected years, 1973-1996
| 1973 | 1975 | 1980 | 1985 | 1990 | 1991 | 1992 | 1993 | 1994 | 1995 | 1996 | |
|---|---|---|---|---|---|---|---|---|---|---|---|
| All females ages 14 or youngera | 0.6 | 0.7 | 0.8 | 0.9 | 0.8 | 0.7 | 0.8 | — | — | — | — |
| All females ages 15-17 | 1.9 | 2.4 | 3.0 | 3.1 | 2.7 | 2.4 | 2.3 | 2.3 | 2.1 | 2.0 | 1.9 |
| All females ages 18 or 19 | 2.9 | 4.2 | 6.1 | 6.2 | 5.8 | 5.6 | 5.4 | 5.2 | 4.9 | 4.6 | 4.5 |
| All females ages 15-19 | 2.3 | 3.1 | 4.3 | 4.4 | 4.0 | 3.8 | 3.6 | 3.4 | 3.2 | 3.0 | 2.9 |
| Sexually experienced females ages 15-19b | 5.9 | 7.5 | 9.1 | 8.5 | 7.3 | 6.8 | — | — | — | — | — |
a Denominator is 14-year-old females.
b Data for sexually experienced females for 1985 were interpolated from 1980 and 1988 data. Data for sexually experienced females are not available for 1992-1995. Data for females ages 14 or younger are not available for 1993-1995.
Sources: Henshaw, 1998; Alan Guttmacher Institute, Table 2; Alan Guttmacher Institute. 1994, Figure 36. Both are based on data from abortion providers and sexual experience data from the National Survey of Family Growth; also, unpublished data from Ventura, Mosher, and Henshaw, National Center for Health Statistics and published and unpublished data from the Alan Guttmacher Institute.
SD 4.6 Teen Births
Research indicates that giving birth as a teen can have negative consequences on both mothers and their children. Giving birth at an early age can limit a young woman’s options regarding education and employment opportunities, increases the likelihood that she will need public assistance, and can have negative effects on the development of her children.83
Between 1960 and 1985, birth rates for teens ages 15 through 19 dropped from 89.1 to 51.0 per 1,000 teen women. This trend reversed between 1986 and 1991, and the teen birth rate increased to 62.1 per 1,000 teen women. Since 1991, the teen birth rate has again turned
downward, declining to 49.6 births per 1,000 teen women by 1999, a record low for the U.S. (see Figure SD 4.6).
Differences by Race and Hispanic Origin.84 The trends described in the previous paragraph are evident for white, black, and American Indian/Alaska Native 85 women ages 15 through 19.
The birth rate for black teens has remained about twice that of white teens since 1960. In 1999, the birth rate for white teens was 34.1 per 1,000 teen women, and for black teens it was 81.1 per 1,000 teen women. Black teens had the highest birth rate until 1994, when the rate for Hispanic teens surpassed that of blacks; the Hispanic rate has remained at a higher level through 1999. Black teens experienced a 30 percent drop in birth rates between 1991 and 1999, from 115.5 to 81.1 per 1,000 women ages 15 through 19. The birth rate for black teens is now at its lowest point in the more than 30 years for which detailed statistics for black teens have been available (see Table SD 4.6).
Differences by Age. Teen birth rates increase with age. In 1999, the birth rate for all teens ages 15 through 17 was 28.7 per 1,000 teen women; for those ages 18 or 19, it was 80.2 per 1,000. Rates for teen females ages 10 through 14 were considerably lower at 0.9 per 1,000. For black and Hispanic teens, the birth rate among 18- and 19-year-olds was more than twice that of the 15- through 17-year-old teen females. The birth rate of white, American Indian/Alaska Native, and Asian/Pacific Islander teen females ages 18 or 19 are over two and a half times that of younger teens ages 15 through 17.
83 Moore, K.A. 1993. Teenage Childbearing: A Pragmatic Perspective. Washington, D.C.: Child Trends, Inc.; Maynard, R.A. (ed.). 1996. Kids Having Kids: A Robin Hood Foundation Special Report on the Costs of Adolescent Childbearing. New York: The Robin Hood Foundation.
84 Estimates for white and black teens do not include those of Hispanic origin in the text. Teens of Hispanic origin may be of any race.
85 Data for American Indians/Alaska Natives available since 1980.
Table SD 4.6 Teen birth rates in the United States by age of mother and by race and Hispanic origin (births per 1,000 females in each age group) Selected years: 1960-1999
| 1960 | 1965 | 1970 | 1975 | 1980a | 1985 | 1990 | 1995 | 1996 | 1997 | 1998 | 1999 | |
|---|---|---|---|---|---|---|---|---|---|---|---|---|
| All races | ||||||||||||
| Ages 10-14 | — | — | 1.2 | 1.3 | 1.1 | 1.2 | 1.4 | 1.3 | 1.2 | 1.1 | 1.0 | 0.9 |
| Ages 15-17 | 43.9 | 36.6 | 38.8 | 36.1 | 32.5 | 31.0 | 37.5 | 36.0 | 33.8 | 32.1 | 30.4 | 28.7 |
| Ages 18 or 19 | 166.7 | 124.5 | 114.7 | 85.0 | 82.1 | 79.6 | 88.6 | 89.1 | 86.0 | 83.6 | 82.0 | 80.2 |
| Ages 15-19 | 89.1 | 70.5 | 68.3 | 55.6 | 53.0 | 51.0 | 59.9 | 56.8 | 54.4 | 52.3 | 51.1 | 49.6 |
| White b | ||||||||||||
| Ages 10-14 | — | — | 0.5 | 0.6 | 0.6 | 0.6 | 0.7 | 0.8 | 0.8 | 0.7 | 0.6 | 0.6 |
| Ages 15-17 | 35.5 | 27.8 | 29.2 | 28.0 | 25.5 | 24.4 | 29.5 | 30.0 | 28.4 | 27.1 | 25.9 | 24.8 |
| Ages 18 or 19 | 154.6 | 111.9 | 101.5 | 74.0 | 73.2 | 70.4 | 78.0 | 81.2 | 78.4 | 75.9 | 74.6 | 73.4 |
| Ages 15-19 | 79.4 | 60.6 | 57.4 | 46.4 | 45.4 | 43.3 | 50.8 | 50.1 | 48.1 | 46.3 | 45.4 | 44.5 |
| White, non-Hispanic | ||||||||||||
| Ages 10-14 | — | — | — | — | 0.4 | — | 0.5 | 0.4 | 0.4 | 0.4 | 0.3 | 0.3 |
| Ages 15-17 | — | — | — | — | 22.4 | — | 23.2 | 22.0 | 20.6 | 19.4 | 18.4 | 17.1 |
| Ages 18 or 19 | — | — | — | — | 67.7 | — | 66.6 | 66.1 | 63.7 | 61.9 | 60.6 | 59.0 |
| Ages 15-19 | — | — | — | — | 41.2 | — | 42.5 | 39.3 | 37.6 | 36.0 | 35.2 | 34.1 |
| Black b | ||||||||||||
| Ages 10-14 | — | — | 5.2 | 5.1 | 4.3 | 4.5 | 4.9 | 4.2 | 3.6 | 3.3 | 2.9 | 2.6 |
| Ages 15-17 | — | 99.3 | 101.4 | 85.6 | 72.5 | 69.3 | 82.3 | 69.7 | 64.7 | 60.8 | 56.8 | 52.1 |
| Ages 18 or 19 | — | 227.6 | 204.9 | 152.4 | 135.1 | 132.4 | 152.9 | 137.1 | 132.5 | 130.1 | 126.9 | 122.9 |
| Ages 15-19 | 156.1 | 144.6 | 140.7 | 111.8 | 97.8 | 95.4 | 112.8 | 96.1 | 91.4 | 88.2 | 85.4 | 81.1 |
| Hispanicc,d | ||||||||||||
| Ages 10-14 | — | — | — | — | 1.7 | — | 2.4 | 2.7 | 2.6 | 2.3 | 2.1 | 2.0 |
| Ages 15-17 | — | — | — | — | 52.1 | — | 65.9 | 72.9 | 69.0 | 66.3 | 62.3 | 61.2 |
| Ages 18 or 19 | — | — | — | — | 126.9 | — | 147.7 | 157.9 | 151.1 | 144.3 | 140.1 | 139.0 |
| Ages 15-19 | — | — | — | — | 82.2 | — | 100.3 | 106.7 | 101.8 | 97.4 | 93.6 | 93.1 |
| American Indian/Alaska Nativeb | ||||||||||||
| Ages 10-14 | — | — | — | — | 1.9 | 1.7 | 1.6 | 1.8 | 1.7 | 1.7 | 1.6 | 1.7 |
| Ages 15-17 | — | — | — | — | 51.5 | 47.7 | 48.5 | 47.8 | 46.4 | 45.3 | 44.4 | 41.3 |
| Ages 18 or 19 | — | — | — | — | 129.5 | 124.1 | 129.3 | 130.7 | 122.3 | 117.6 | 118.4 | 110.4 |
| Ages 15-19 | — | — | — | — | 82.2 | 79.2 | 81.1 | 78.0 | 73.9 | 71.8 | 72.1 | 67.7 |
| Asian/Pacific Islanderb | ||||||||||||
| Ages 10-14 | — | — | — | — | 0.3 | 0.4 | 0.7 | 0.7 | 0.6 | 0.5 | 0.4 | 0.4 |
| Ages 15-17 | — | — | — | — | 12.0 | 12.5 | 16.0 | 15.4 | 14.9 | 14.3 | 13.8 | 12.6 |
| Ages 18 or 19 | — | — | — | — | 46.2 | 40.8 | 40.2 | 43.4 | 40.4 | 39.3 | 38.3 | 38.8 |
| Ages 15-19 | — | — | — | — | 26.2 | 23.8 | 26.4 | 26.1 | 24.6 | 23.7 | 23.1 | 22.8 |
a Beginning in 1980, births have been tabulated by race and ethnicity of the mother. Prior to 1980, births were tabulated by race of child, assigning a child to the race of the nonwhite parent, if any, or to the race of the father, if both are nonwhite.
b Includes persons of Hispanic origin.
c Persons of Hispanic origin may be of any race.
d Data for Hispanics have been available only since 1980, with 22 states reporting in 1980, representing 90 percent of the Hispanic population. Hispanic birth data were reported by 23 states and the District of Columbia in 1985; 48 states and the District of Columbia in 1990; 49 states and the District of Columbia in 1991 and 1992; and all 50 states and the District of Columbia since 1993. Rates in 1985 were not calculated for Hispanics because estimates for populations were not available.
Sources: Curtin & Martin. 2000. Births. Ventura, et al., 1999, Births, Tables 4 and 9; Ventura, Mathews, & Curtin, 1998, Births, Tables 1 and 2; Ventura, et al., 1998, Table 4; Centers for Disease Control, National Center for Health Statistics. Vital Statistics of the United States, Volume 1, Natality. Annual Issues, Table: Birth Rates by Age of Mother and Race and Hispanic Origin: United States, 1940-97; and Mathews, et al., 1998, Table 1.
SD 4.7 Second- and Higher-Order Births to Teens
Bearing a child during adolescence is associated with poor outcomes for young women and their children.86 Giving birth to a second child while still a teen further increases these risks.87 Yet, analyses of nationally representative data indicate that in the 2 years following the first birth, teen mothers have a second birth at about the same rate as older mothers.88
In 1999, more than one in every five births to teen mothers was a birth of second order or higher. The proportion of teen births that were second or higher order increased from 22 percent in 1980 to peak at 25 percent in 1991 but has since declined to 22 percent in 1999. This pattern is evident across racial, ethnic, and marital status groups (see Table SD 4.9). The rate of second births to teens who have had a first birth fell 21 percent between 1991 and 1996 and has changed little since (data not shown).89
The increased use of contraceptives by teenage mothers may account for this drop in second births. Teenage mothers are increasingly using Depo-Provera and Norplant implants as their primary method of birth control. These contraceptives last longer and are more reliable than birth control pills or condoms, whose effectiveness is contingent upon proper and consistent use. In fact, one in four teenagers who already have a child used one of these two longer-lasting methods, compared to 5 percent of teenage females without children.90
Differences by Race and Hispanic Origin. Births to black and Hispanic teens are more likely to be subsequent births than births to white teens. In 1999, 26 percent of births to black teens, 23 percent of births to Hispanic teens, and 18 percent of births to non-Hispanic white teens were second- or higher-order births.
Differences by Marital Status. A higher proportion of births among married teens are second or higher order than births to unmarried teens. In 1998, 29 percent of births to married teens were second or higher order, compared with 20 percent among unmarried teens.
86 Moore, K.A., Myers, D.E., Morrison, D.R., Nord, C.W., Brown, B.V., & Edmonston, B. 1993. Age at First Childbirth and Later Poverty. Journal of Research on Adolescence 3 (4): 393-422; Maynard, 1996.
87 Kalmuss, D., & Namerow, P.B. 1992. The Mediators of Educational Attainment among Early Childbearers. Unpublished manuscript. Columbia University, Center for Population and Family Health.
88 Moore, K.A., Morrison, D.R., Nord, C.W., & Blumenthal, C. 1993. The Consequences of Early Childbearing in the 1980s. Unpublished tables. Washington, D.C.: Child Trends.
89 Ventura, S.J., Martin, J.A., Curtin, S.C., Park, M.M., & Mathews, T.J. “Births: Final Data for 1998” National Vital Statistics Report 48 (3). Hyattsville, MD: National Center for Health Statistics.
90 Ventura, Mosher, Curtin, Abma, & Henshaw. 2000. “Trends in Pregnancies and Pregnancy Rates by Outcome: Estimates for the United States 1976–1996”. Vital and Health Statistics Series 21 (56). Hyattsville, MD: National Center for Health Statistics.
Table SD 4.7 Percentage of all births to women under age 20 in the United States that are second or higher order, by marital status and by race and Hispanic origin of mother: Selected years, 1980-1999
| 1980 | 1985 | 1991a | 1994 | 1995 | 1996 | 1997 | 1998 | 1999 | |
|---|---|---|---|---|---|---|---|---|---|
| All births | 22 | 23 | 25 | 22 | 21 | 21 | 22 | 22 | 22 |
| Race and Hispanic origin | |||||||||
| Whitea | 19 | 20 | 19 | 17 | 17 | 17 | 18 | 18 | 18 |
| Blacka | 27 | 28 | 33 | 28 | 27 | 27 | 27 | 27 | 26 |
| Hispanicb | 20 | 25 | 25 | 23 | 23 | 24 | 24 | 24 | 23 |
| Marital Status | |||||||||
| Married | 24 | 26 | 28 | 26 | 26 | 27 | 28 | 29 | — |
| Single | 19 | 20 | 23 | 20 | 19 | 20 | 20 | 20 | — |
a Includes persons of Hispanic origin before 1990. Beginning 1990 persons of Hispanic origin are not included; figures for black women for 1999 include Hispanic women.
b Persons of Hispanic origin may be of any race.
Sources: Ventura, et al., 2000. Births: Final Data for 1998. Curtin & Martin. 2000. Births: Preliminary Data for 1999. Ventura, et al., 1999, Births Tables 2 and 7; Ventura, et al., 1998, Natality 1996, Tables 2 and 7; also previous issues of this annual report (vol. 45, no. 11, supp., tables 2 and 6; vol. 44, no. 11, supp., tables 2 and 6; vol. 42, no. 3, supp.; vol. 36, no. 4, supp.; vol. 31, no. 8, supp., table 2 in each); also unpublished tabulations, Division of Vital Statistics, National Center for Health Statistics.
Figure SD 4.7 Rate of second births to teenagers who have had a first birth, 1985-1998
Sources: Ventura, et al., 2000; Vital and Health Statistics 21, Table A.
Section 5: Education and Achievement (EA)
Enrollment/Attendance
EA 1.1 Early Childhood Program Enrollment
Enrollment in an early childhood program is one indicator of readiness to learn in elementary school that may be especially relevant for children from disadvantaged backgrounds. One of the National Education Goals for the year 2000, adopted by Congress, is that “all children will have access to high-quality and developmentally appropriate preschool programs that help prepare children for school.”1
In 1998, 48 percent of children ages 3 to 4 who had not yet entered kindergarten attended a nursery school program (see Figure EA 1.1.A). This represents a substantial increase from the 30 percent who attended nursery school in 1980.
When a broader set of center-based programs is considered, the increase in early childhood program enrollment is even more substantial. Table EA 1.1 presents the percentage of children, ages 3 and 4, enrolled in day care centers, Head Start programs, preschools, prekindergartens, and other early childhood programs.2 In 1999, 57 percent of all 3- to 4-year-old children were enrolled in a center-based program. This reflects a modest increase from 51 percent in 1991 and 1993 (see Table EA 1.1).
Differences by Race and Hispanic Origin.3 There are notable differences in center-based early childhood program enrollment rates among racial and ethnic groups; for example, in 1999, only 43 percent of Hispanic children were enrolled in a center-based program, compared with 57 percent of whites and 70 percent of blacks. Throughout the 1990s, black 3- to 4-year-olds have had the highest enrollments in center-based programs, followed closely by whites, with much lower enrollments among Hispanics (see Figure EA 1.1.B).
Differences by Socioeconomic Status. There are substantial differences in center-based enrollment rates by socioeconomic status, including poverty status and maternal education (see Table EA 1.1).
- In 1999, enrollment rates were much higher among families that were at or above the poverty threshold (60 percent) than those who were below the poverty threshold (50 percent).
- Enrollment rates also differ by maternal education, with the highest enrollment (72 percent) among children whose mothers were college graduates and the lowest (38 percent) among children whose mothers lacked a high school diploma. These differences by socioeconomic status were apparent for all years reported (see Table EA 1.1).
Differences by Mother’s Employment Status. There are also differences in enrollment rates by maternal employment status (see Figure EA 1.1.C); for example, in 1999, children whose mothers were working either full-time (35 hours or more per week) or part-time (less than 35 hours per week) had substantially higher enrollment rates than children whose mothers were not in the labor force.
1 National Education Goals Panel. 1999. The National Education Goals Report: Building a Nation of Learners, 1999 (Goal 1, p. xiv). Washington, D.C.: U.S. Government Printing Office.
2 Estimates are based on children who have yet to enter kindergarten.
3 Estimates for whites and blacks exclude Hispanics of those races.
Figure EA 1.1.A Percentage of 3- and 4-year-olds a in the United States enrolled in nurser y school: 1980-1998
a Estimates are based on children who have not yet entered kindergarten.
Note: Data for 1990 and 1994-96 may not be comparable with other years because of changes in survey procedures.
Source: U.S. Bureau of the Census, October Current Population Surveys. Tabulated by the National Center for Education
Statistics. As published in Federal Interagency Forum on Child and Family Statistics, 2000, Table ED2.A.
Table EA 1.1 Percentage of 3- and 4-year-oldsa in the United States enrolled in center-based programs,b by child and family characteristics: 1991, 1993, 1995, 1996, and 1999
| 1991 | 1993 | 1995 | 1996 | 1999 | |||||
|---|---|---|---|---|---|---|---|---|---|
| Total | 51 | 51 | 53 | 53 | 57 | ||||
| Gender | |||||||||
| Male | 51 | 50 | 52 | 52 | 58 | ||||
| Female | 52 | 52 | 53 | 53 | 56 | ||||
| Race and Hispanic originc | |||||||||
| White, non-Hispanic | 53 | 52 | 55 | 54 | 57 | ||||
| Black, non-Hispanic | 56 | 56 | 57 | 63 | 70 | ||||
| Hispanic | 38 | 42 | 34 | 37 | 43 | ||||
| Poverty Status | |||||||||
| At or above poverty | 54 | 55 | 58 | 58 | 60 | ||||
| Below poverty | 42 | 42 | 41 | 41 | 50 | ||||
| Family structured | |||||||||
| Two parents | 52 | 51 | 53 | 51 | 56 | ||||
| One or no parent | 47 | 52 | 53 | 56 | 60 | ||||
| Mother’s educatione | |||||||||
| Less than high school | 30 | 31 | 31 | 37 | 38 | ||||
| High school/GED | 44 | 41 | 45 | 46 | 49 | ||||
| Vocational/technical or some college | 59 | 58 | 55 | 55 | 61 | ||||
| College graduate | 72 | 72 | 73 | 71 | 72 | ||||
| Mother’s employment statuse | |||||||||
| 35 hours or more per week | 58 | 59 | 58 | 62 | 63 | ||||
| Less than 35 hours per week | 57 | 55 | 60 | 62 | 60 | ||||
| Not in labor force | 43 | 43 | 43 | 41 | 50 | ||||
a Estimates are based on children who have not yet entered kindergarten.
b Center-based programs include day care centers, Head Start programs, preschools, prekindergartens, and other early childhood programs.
c Persons of Hispanic origin may be of any race.
d Parents include any combination of a biological, adoptive, step-, and foster mother and/or father. No parents in the household indicates that the child is living with non-parent guardians (e.g., grandparents).
e Children without mothers in the home are not included in estimates dealing with mother’s education or mother’s employment status. A mother is defined as a biological mother, adoptive mother, stepmother, foster mother, or female guardian (e.g., grandmother) who resides in the home with the child.
Source: U.S. Department of Education, National Center for Education Statistics, 1991, 1993, 1995, 1996, and 1999 National Household Education Survey. As published in Federal Interagency Forum on Child and Family Statistics, 2000, Table ED2.B.
Figure EA 1.1.B Percentage of 3- and 4-year-oldsa in the United States enrolled in center-based programs,b by race and Hispanic origin:c 1980-1999
a Estimates are based on children who have not yet entered kindergarten.
b Center-based programs include day care centers, Head Start programs, preschools, nursery schools, prekindergartens, and other early childhood programs.
c Persons of Hispanic origin may be of any race.
Source: U.S. Department of Education, National Center for Education Statistics, 1991, 1993, 1995, and 1996 National
Household Education Survey.
Figure EA 1.1.C Percentage of 3- and 4-year-oldsa in the United States enrolled in center-based programs,b by poverty status, mother’s education,c and mother’s employment status:c 1999
a Estimates are based on children who have not yet entered kindergarten.
b Center-based programs include day care centers, Head Start programs, preschools, nursery schools, prekindergartens, and other early childhood programs.
c Children without mothers in the home are not included in estimates dealing with mother’s education or mother’s employment status.
Source: U.S. Department of Education, National Center for Education Statistics, 1991, 1993, 1995, and 1996 National Household Education Survey.
EA 1.2 Grade Retention: Percentage of Current 2nd Graders Who Were Retained in Kindergarten and/or 1st Grade
Children’s early primary school experiences are associated with their adjustment to school and their later school success. Grade retention (repeating a grade) at an early age may indicate that a child has started school without adequate preparation and may continue to experience school problems in subsequent years. It may also measure the degree to which schools are able to respond to children from a variety of backgrounds.4
Table EA 1.2 presents data on the percentage of 2nd grade students who were retained in kindergarten and/or 1st grade as reported by their parents. Estimates are presented for 1991, 1993, 1995, 1996, and 1999.5
Trends in Grade Retention. Data in Table EA 1.2 indicate a decline in the proportion of 2nd graders retained in kindergarten and/or 1st grade, from 11 percent in 1991 to 8 percent in 1999 (see Figure EA 1.2).
Differences by Gender. A higher percentage of boys repeat kindergarten and/or 1st grade in 1991 and 1999 compared to girls (see Table EA 1.2). For example, in 1999, 10 percent of boys were retained, compared with 6 percent of girls.
Differences by Socioeconomic Status. Grade repetition differs by family poverty status and maternal education levels. In 1999, 16 percent of 2nd graders in poor families had repeated a grade, in comparison with 5 percent of 2nd graders living in nonpoor families (see Table EA 1.2). Grade repetition varies by maternal education, with the highest percentage of grade repetition in 1999 among children whose mothers did not complete high school (16 percent) and the lowest reported percentage among children whose mothers had attended some college or a vocational/technical school (6 percent) (see Table EA 1.2).
4 Alexander, K.L., Entwisle, D.R., & Dauber, S.L. 1994. On the Success of Failure: A Reassessment of the Effects of Retention in the Primary Grades. New York: Cambridge University Press.
5 Estimates are not presented when based on less than 30 cases in a subgroup.
Table EA 1.2 Percentage of 2nd graders in the United States who were retained in kindergarten and/or 1st grade, by child and family characteristics: 1991, 1993, 1995, 1996, and 1999
| 1991 | 1993 | 1995 | 1996 | 1999 | |||||
|---|---|---|---|---|---|---|---|---|---|
| Total | 11 | 8 | 8 | 7 | 8 | ||||
| Gender | |||||||||
| Male | 13 | 10 | 11 | 8 | 10 | ||||
| Female | 9 | — | 5 | — | 6 | ||||
| Race and Hispanic origina | |||||||||
| White, non-Hispanic | 9 | 7 | 7 | 6 | 8 | ||||
| Black, non-Hispanic | 15 | — | — | — | 8 | ||||
| Hispanic | 18 | — | — | — | 8 | ||||
| Poverty Statusb | |||||||||
| At or above poverty | 9 | 8 | 7 | 5 | 5 | ||||
| Below poverty | 18 | — | 10 | — | 16 | ||||
| Family structurec | |||||||||
| Two parents | 10 | 7 | 8 | 5 | 7 | ||||
| One or no parent | 14 | 11 | 9 | — | 10 | ||||
| Mother’s educationd | |||||||||
| Less than high school | 21 | — | — | — | 16 | ||||
| High school/GED | 12 | 9 | 9 | — | 8 | ||||
| Vocational/technical or some college | 9 | — | 7 | — | 6 | ||||
| College graduate | — | — | — | — | 6 | ||||
| Mother’s employment statusd | |||||||||
| 35 hours or more per week | 12 | 8 | 9 | — | 8 | ||||
| Less than 35 hours per week | 8 | — | — | — | 8 | ||||
| Not in labor force | 11 | — | 8 | — | 7 | ||||
— = sample size is insufficient to permit a reliable estimate.
a Persons of Hispanic origin may be of any race.
b The poverty threshold for 1995 and 1996 data was calculated using the total number of household members and estimates of household income to the nearest $1,000 either alone or in combination with exact income information. The 1995 and 1996 poverty calculations differ from calculations in other years (1991 and 1993), which were based on total number of household members and estimates of household income (in increments of $5,000 or $1,000) only. Calculations for all years do not account for the number of children in the household.
c Parents include any combination of a biological, adoptive, step-, and foster mothers and/or fathers. No parents in the household indicates that the child is living with non-parent guardians (e.g., grandparents).
d Children without mothers in the home are not included in estimates dealing with mother’s education or mother’s employment status. A mother is defined as a biological mother, adoptive mother, stepmother, foster mother, or female guardian (e.g., grandmother) who resides in the home with the child.
Source: U.S. Department of Education, National Center for Education Statistics, 1991, 1993, 1995, and 1996 National Household Education Surveys. Tabulations of data performed by U.S. Department of Education, National Center for Education Statistics (unpublished).
Figure EA 1.2 Percentage of 2nd graders in the United States who were retained in kindergarten and/or 1st grade: Selected years, 1991-1999
Source: U.S. Department of Education, National Center for Education Statistics, 1991, 1993, 1995, 1996, and 1999 National Household Education Surveys. Tabulations performed by National Center for Education Statistics.
EA 1.3 School Absenteeism
Student absenteeism is associated with poor achievement in school, among other outcomes; for example, absenteeism is one of five personal and family background factors that accounted for 91 percent of the variation in states’ mathematics scores in a recent national report.6
Differences across Grade Levels. The percentage of 8th-grade students who were absent from school 3 or more days in the preceding month has remained relatively constant between 21 and 23 percent from 1990 to 1998 (see Table EA 1.3). During the same time period, a slightly larger percentage of 12th-grade students were absent from school for that length of time, with percentages ranging between 26 and 31 percent.
Differences by Race and Hispanic Origin.7 Among 8th graders in 1998, American Indian/Alaska Native and Hispanic students, at 34 percent and 25 percent respectively, were the most likely to have been absent 3 or more days in the preceding month. White and Asian students had the lowest absentee rates at 21 and 17 percent, respectively, followed by black students at 23 percent. The patterns are similar for 12th-grade students, though the differences range from lows of 26 to 28 percent for white, Asian, and black students, to a high of 41 percent for American Indian/Alaska Native Students.
Differences by Parents’ Education Level.8 Absences from school were highest for students whose better-educated parent had less than a high school education (see Figure EA 1.3). In 1998, for example, 33 percent of 8th graders whose better-educated parent lacked a high school diploma were absent from school 3 or more days in the preceding month, compared with 17 percent of their peers who had at least one parent with a college degree. Similar differences were reported for 12th-grade students.
Differences by Type of School. Students who attended private or Catholic schools experienced fewer school absences than did students from public schools, across all grades and years (see Table EA 1.3).
6 National Education Goals Panel. 1994.
7 Estimates for whites and blacks exclude Hispanics of those races.
8 Parents’ education level refers to the highest level of education completed by either parent.
Table EA 1.3 Percentage of 8th- and 12th-grade students in the United States who were absent from school 3 or more days in the preceding month, by gender, race and Hispanic origin,a parents’ education level,b and type of school: 1990, 1992, 1994, 1996, and 1998
| 8th Grade | 12th Grade | |||||||||
|---|---|---|---|---|---|---|---|---|---|---|
| 1990 | 1992 | 1994 | 1996 | 1998 | 1985 | 1990 | 1995 | 1996 | 1997 | |
| Total | 23 | 22 | 22 | 23 | 21 | 31 | 26 | 28 | 26 | 26 |
| Gender | ||||||||||
| Male | 21 | 21 | 22 | 22 | 21 | 29 | 24 | 27 | 25 | 26 |
| Female | 24 | 24 | 22 | 23 | 22 | 32 | 27 | 28 | 28 | 28 |
| Race and Hispanic origina | ||||||||||
| White, non-Hispanic | 22 | 21 | 20 | 21 | 21 | 31 | 24 | 26 | 26 | 26 |
| Black, non-Hispanic | 23 | 22 | 27 | 25 | 23 | 30 | 29 | 32 | 28 | 28 |
| Hispanic | 26 | 31 | 28 | 29 | 25 | 34 | 32 | 32 | 29 | 32 |
| Asian/Pacific Islander | 9 | 12 | 21 | 18 | 17 | 32 | 19 | 28 | 26 | 26 |
| American Indian/Alaska Native | 37 | 38 | 39 | 29 | 34 | — | — | 53 | 30 | 41 |
| Parents’ education levelb | ||||||||||
| Less than high school | 38 | 31 | 33 | 32 | 33 | 41 | 30 | 36 | 35 | 32 |
| Graduated high school | 27 | 23 | 26 | 26 | 25 | 34 | 28 | 30 | 30 | 30 |
| Some education after high school | 22 | 21 | 22 | 23 | 23 | 31 | 26 | 27 | 30 | 27 |
| Graduated college | 15 | 19 | 18 | 18 | 17 | 27 | 23 | 25 | 21 | 24 |
| Type of school | ||||||||||
| Public | 23 | 23 | 23 | 23 | 22 | 31 | 27 | 28 | 28 | 28 |
| Nonpublic | 13 | 14 | 15 | 16 | 15 | 24 | 17 | 21 | 18 | 19 |
— = sample size is insufficient to permit a reliable estimate.
a Persons of Hispanic origin may be of any race.
b Parents’ education level refers to the highest level of education completed by either parent.
Note: The sample for this table is based on the 1990, 1992, 1996, and 1998 National Mathematics Assessments and the 1994 National Reading Assessment.
Sources: U.S. Department of Education, National Center for Education Statistics, National Assessment of Educational Progress (NAEP), 1990, 1992, 1994, and 1996 Data Almanacs. National Mathematics Assessment data may be found at http://nces.ed.gov/naep/tables96/index.html (Question #15, S004001). National Reading Assessment data (1994) are from unpublished data almanacs.
Figure EA 1.3 Percentage of 8th- and 12th-grade students in the United States who were absent from school 3 or more days in the preceding month, by parents’ education level: a 1998
a Parents’ education level refers to the highest level of education completed by either parent.
Sources: U.S. Department of Education, National Center for Education Statistics, National Assessment of Educational Progress (NAEP), 1990, 1992, 1994, and 1996 Data Almanacs. National Mathematics Assessment data may be found at http://nces.ed.gov/naep/tables96/index.html (Question #15, S004001). National Reading Assessment data (1994) are from unpublished data almanacs.
EA 1.4 High School Dropouts: Event Dropout Rate 9 for Grades 10 Through 12
High school dropouts have lower earnings, experience more unemployment, and are more likely to end up on welfare than their peers who complete high school or college.10 Women who drop out of high school are more likely to become pregnant and give birth at a young age and are more likely to become single parents.11
Table EA 1.4 shows the event dropout rate (percentage) for students in grades 10 through 12, ages 15 through 24. Event dropout rates are measured by the proportion of students enrolled in grades 10 through 12 1 year earlier who were not enrolled and who had not completed high school in the year the data are reported. From 1975 to 1998, dropout rates fluctuated between 4 percent and 7 percent.12
Differences by Race and Hispanic Origin.13 In 1998, Hispanics had a higher dropout rate (9 percent) than whites (4 percent) or blacks (5 percent) (see Figure EA 1.4).14
9 Event dropout rates describe the proportion of students who leave school each year without completing a high school program. This is in contrast to status dropout rates, which provide cumulative data on dropouts among all young adults within a specified age range, and cohort dropout rates, which follow a particular cohort of students over time (McMillen and Kaufman, 1997).
10 U.S. Department of Education, National Center for Education Statistics. 1998. The Condition of Education: 1998. NCES 98- 013. Indicators 31, 32, and 34. Washington, D.C.: U.S. Government Printing Office.
11 Marin, M.M., Chan, N., & Raymond, J. 1987. Consequences of the Process of Transition to Adulthood for Adult Economic Well Being. In R.G. Corin (ed.) Research in the Sociology of Education and Socialization. Greenwich, CT: JAI; Manlove, J. 1998. "The Influence of High School Dropout and School Disengagement on the Risk of School-Age Pregnancy." Journal of Research on Adolescence 8: 187-220.
12 The event dropout rate reached 7 percent in the years 1974, 1977, 1978, and 1979. Data for these years are not shown in Table EA 1.4.
13 Estimates for whites and blacks exclude Hispanics of those races.
14 The finding that Hispanics are more at risk of dropping out of school than either blacks or whites has been confirmed in other national data sets, such as High School and Beyond and the National Education Longitudinal Study (Ekstron, R., Goertz, M., Pollack, J., & Rock, D. 1987. Who Drops out of High School and Why? Findings from a National Study. In G. Natriello (ed.), School Dropouts: Patterns and Policies (pp. 52-69). New York: Teachers College Press; McMillen, M., & Kaufman, P. 1994. Dropout Rates in the United States: 1994. NCES 96-863. Washington, D.C.: U.S. Department of Education, National Center for Education Statistics).
Table EA 1.4 Event dropout ratea (percentage) for youth in the United States in grades 10 through 12 (ages 15 through 24), by gender and by race and Hispanic origin:b Selected years, 1975-1998
| 1975 | 1980 | 1985 | 1990d | 1991d | 1992d,e | 1993d,e | 1994d,e,f | 1995d,e,f | 1996d,e,f | 1997d,e,f | 1998d,e,f | |
|---|---|---|---|---|---|---|---|---|---|---|---|---|
| Total | 6 | 6 | 5 | 4 | 4 | 4 | 5 | 5 | 6 | 5 | 5 | 5 |
| Male | 5 | 7 | 5 | 4 | 4 | 4 | 5 | 5 | 6 | 5 | 5 | 5 |
| Female | 6 | 6 | 5 | 4 | 4 | 5 | 4 | 5 | 5 | 5 | 4 | 5 |
| White b | ||||||||||||
| Total | 5 | 5 | 4 | 3 | 3 | 4 | 4 | 4 | 5 | 4 | 4 | 4 |
| Male | 5 | 6 | 5 | 4 | 3 | 4 | 4 | 4 | 5 | 4 | — | — |
| Female | 5 | 5 | 4 | 3 | 4 | 4 | 4 | 4 | 4 | 4 | — | — |
| Black b | ||||||||||||
| Total | 9 | 8 | 8 | 5 | 6 | 5 | 6 | 7 | 6 | 7 | 5 | 5 |
| Male | 8 | 8 | 8 | 4 | 5 | 3 | 6 | 7 | 8 | 5 | — | — |
| Female | 9 | 9 | 7 | 6 | 7 | 7 | 5 | 6 | 5 | 9 | — | — |
| Hispanic c | ||||||||||||
| Total | 11 | 12 | 10 | 8 | 7 | 8 | 7 | 10 | 12 | 9 | 10 | 9 |
| Male | 10 | 18 | 9 | 9 | 10 | 8 | 5 | 9 | 12 | 10 | — | — |
| Female | 12 | 7 | 10 | 7 | 5 | 9 | 8 | 11 | 13 | 8 | — | — |
a The event dropout rate is the proportion of students enrolled in grades 10 through 12 1 year earlier who were not enrolled and not graduated in the year for which the data are presented. It is calculated using the Current Population Survey data from October of a given year.
b Non-Hispanic.
c Persons of Hispanic origin may be of any race.
d Numbers for these years reflect new editing procedures instituted by the Bureau of the Census for cases with missing data on school enrollment items.
e Numbers for these years reflect new wording of the educational attainment item in the Current Population Survey.
f Numbers in this year may reflect changes in Current Population Survey due to newly instituted computer-assisted interviewing and/or due to the change in the population controls to the 1990 Census-based estimates, with adjustments for
undercount.
Sources: U.S. Department of Commerce, Bureau of the Census, Current Population Survey, unpublished tabulations; U.S. Department of Education, National Center for Education Statistics, Dropout Rates in the United States: 1996, Table A19, and Dropout Rates in the United States: 1997, Table B3; Dropout Rates in the United States: 1998, Table 1.
Figure EA 1.4 Event dropout rate a for youth in the United States in grades 10 through 12 (ages 15 through 24), by race and Hispanic origin: b Selected years, 1972-1998
a The event dropout rate is the proportion of students enrolled in grades 10 through 12 1 year earlier who were not enrolled and not graduated in the year for which the data are presented. It is calculated using the Current Population Survey data from October of a given year.
b Persons of Hispanic origin may be of any race.
Sources: U.S. Department of Commerce, Bureau of the Census, Current Population Survey, October (various years), unpublished tabulations; U.S. Department of Education, National Center for Education Statistics, Dropout Rates in the United States: 1997, Table B3; Dropout Rates in the United States: 1998, Table 1.
EA 1.5 High School Completion Rates for 18- Through 24-Year-Olds
High school graduates earn substantially more than persons who leave high school without graduating.15 Table EA 1.5 presents the high school completion rates for 18- through 24-year-olds who were not still enrolled in a high school program—i.e., the percentage in this age group who have received a high school diploma or its equivalent, such as passing the General Educational Development (GED) exam. In 1998, the high school completion rate was 85 percent. As can be seen in Table EA 1.5, most students receive a high school diploma rather than an equivalent credential (75 percent versus 10 percent, respectively), though the equivalency credential has become more common in recent years. Between 1972 and 1998, the completion rate has remained fairly stable at between 83 percent and 86 percent (see Table EA 1.5).
Differences by Race and Hispanic Origin.16 As Figure EA 1.5 shows, completion rates vary dramatically by race and Hispanic origin. Hispanics have had much lower high school completion rates than blacks and whites since the early 1970s. The high school completion rate for Hispanics in 1998 was only 63 percent, compared with 81 percent for blacks and 90 percent for whites. This suggests that many Hispanic youth and young adults will be less prepared than other 18- through 24-year-olds to enter or progress in the labor force.
The completion rate for blacks rose from 72 percent in 1972 to 81 percent in 1985, and it has remained at about that level through 1998 (see Table EA 1.5). The completion rate for Hispanics rose from 56 percent in 1972 to 67 percent in 1985 and stands at 63 percent in 1998, as well. The completion rate has also increased among whites, but to a lesser extent (see Figure EA 1.5).
15 U.S. Bureau of the Census. 1997. Current Population Reports, P60-197. Money Income in the United States: 1996, With Separate Data on Valuation of Noncash Benefits, Table 7. Washington, D.C.: U.S. Government Printing Office; U.S. Department of Education, National Center for Education Statistics. 1996. Condition of Education 1996 (Indicators 32 and 34). Washington, D.C.: U.S. Government Printing Office.
16 Estimates for whites and blacks exclude Hispanics of those races.
Table EA 1.5 High school completion rates (percentage) and method of completion for 18- through 24-year-oldsa in the United States, by race and Hispanic origin:b Selected years, 1972-1998
| 1972 | 1975 | 1980 | 1985 | 1990 | 1991 | 1992d | 1993d | 1994d,e | 1995d,e | 1996d,e | 1997d,e | 1998 | |
|---|---|---|---|---|---|---|---|---|---|---|---|---|---|
| Total | |||||||||||||
| Completed | 83 | 84 | 84 | 85 | 86 | 85 | 86 | 86 | 86 | 85 | 86 | 86 | 85 |
| Diploma | — | — | — | — | 81 | 81 | 81 | 81 | 79 | 78 | 76 | 77 | 75 |
| Equivalent f | — | — | — | — | 5 | 4 | 5 | 5 | 7 | 8 | 10 | 9 | 10 |
| White b | |||||||||||||
| Completed | 86 | 87 | 88 | 88 | 90 | 89 | 91 | 90 | 91 | 90 | 92 | 91 | 90 |
| Diploma | — | — | — | — | 85 | 85 | 86 | 86 | 84 | 83 | 81 | 81 | 80 |
| Equivalent f | — | — | — | — | 5 | 4 | 5 | 5 | 6 | 7 | 11 | 9 | 10 |
| Black b | |||||||||||||
| Completed | 72 | 70 | 75 | 81 | 83 | 83 | 82 | 82 | 83 | 85 | 83 | 82 | 81 |
| Diploma | — | — | — | — | 78 | 77 | 76 | 76 | 75 | 75 | 73 | 72 | 72 |
| Equivalent f | — | — | — | — | 5 | 5 | 6 | 6 | 8 | 9 | 10 | 10 | 10 |
| Hispanic c | |||||||||||||
| Completed | 56 | 62 | 57 | 67 | 59 | 57 | 62 | 64 | 62 | 63 | 62 | 67 | 63 |
| Diploma | — | — | — | — | 55 | 53 | 57 | 58 | 54 | 54 | 55 | 59 | 52 |
| Equivalent f | — | — | — | — | 4 | 3 | 6 | 6 | 8 | 9 | 7 | 8 | 11 |
a Refers to persons not currently enrolled in high school or below. It is calculated using the Current Population Survey data from October of a given year.
b Non-Hispanic .
c Persons of Hispanic origin may be of any race.
d Numbers for these years reflect new wording of the educational attainment item in the Current Population Survey.
e Numbers for these years may reflect changes in Current Population Survey due to newly instituted computer-assisted interviewing and/or due to the change in the population controls used this year to the 1990 Census-based estimates, with adjustments for undercount.
f Diploma equivalents include passing the General Educational Development (GED) exam. Source: U.S. Department of Education, National Center for Education Statistics, Dropout Rates in the United States: 1996, Tables 13 and A25, and Dropout Rates in the United States: 1997 and 1998, Table 4.
Figure EA 1.5 High school completion rates for 18- through 24-year-oldsa in the United States, by race and
Hispanic origin:b Selected years, 1980-1998
a Refers to persons not currently enrolled in high school or below. It is calculated using the Current Population Survey data from October of a given year.
b Persons of Hispanic origin may be of any race.
Sources: U.S. Department of Education, National Center for Education Statistics. 1996. Table A25, 1997, Table 4.
EA 1.6 College Attendance and Attainment
College attendance and receipt of a bachelor’s degree increase employment opportunities and income potential. One of the National Education Goals for the year 2000, adopted by Congress, is for adult literacy and lifelong learning, with an objective of increasing the proportion of qualified students, especially minorities, who enter college, who complete at least 2 years, and who complete their degree programs.17
Table EA 1.6 presents the percentage of 25- through 29-year-old high school graduates who had completed at least some college and the percentage who had received a bachelor’s degree or higher:18
- In 1999, 66 percent of high school graduates in this age group had completed at least some college, 10 percent had received an associate’s degree, and 32 percent had received at least a bachelor’s degree.19
- College attendance has increased since the early 1970s, with the most rapid increases occurring during the 1990s. The percentage of high school graduates completing at least some college rose from 44 percent in 1971 to 52 percent in 1990—and then to 66 percent in 1999 (see Figure EA 1.6.A).
- College completion, defined here as receipt of a bachelor’s degree, increased more modestly, from 22 percent of 25- to 29-year-old high school graduates in 1971 to 32 percent of this group in 1999 (see Figure EA 1.6.B).
Differences by Race and Hispanic Origin.20 In 1997, white high school graduates were far more likely (35 percent) than their black (16 percent) or Hispanic peers (18 percent) to have received a bachelor’s degree or higher. Whites were also more likely to have attended college (68 percent) than blacks or Hispanics (54 percent each) in 1997. Whites have had far higher rates of attendance and completion than blacks or Hispanics since the early 1970s, and the gap between whites and the other two racial/ethnic groups in college attendance and completion has not decreased over time (see Figures EA 1.6.A and EA 1.6.B).
17 National Education Goals Panel. 1997. The National Education Goals Report: Building a Nation of Learners, 1997 (Goal 6, p. xvi). Washington, D.C.: U.S. Government Printing Office.
18 Note that the measure of college attendance changed from “one or more years of college” in 1971-1991 to “some college or more” in 1992-1997. Similarly, the measure of college completion changed from “four or more years of college” in 1971-1991 to “bachelor’s degree or higher” in 1992-1997.
19 Based on analyses of the 1993 Baccalaureate and Beyond Longitudinal study, it is estimated that about 10 percent of all persons with a bachelor's degree also hold an associate’s degree. National Center for Education Statistics.
20 Estimates for whites and blacks exclude Hispanics of those races.
Table EA 1.6 Percentage of 25- through 29-year-old high school graduatesa in the United States who have attended some college or who have received a bachelor’s degree or higher, by race and Hispanic origin:c Selected years, 1971-1999
| 1971 | 1975 | 1980 | 1985 | 1990 | 1991 | 1992 | 1993 | 1994 | 1995 | 1996 | 1997 | 1998 | 1999 | |
|---|---|---|---|---|---|---|---|---|---|---|---|---|---|---|
| Some college or more d | 44 | 50 | 52 | 51 | 52 | 53 | 57 | 59 | 61 | 62 | 65 | 65 | 66 | 66 |
| Whiteb | 45 | 51 | 54 | 52 | 54 | 55 | 59 | 61 | 63 | 65 | 67 | 68 | 69 | 69 |
| Blackb | 31 | 39 | 42 | 43 | 44 | 43 | 45 | 48 | 50 | 52 | 56 | 54 | 57 | 58 |
| Hispanicc | 31 | 41 | 40 | 44 | 40 | 42 | 47 | 49 | 52 | 50 | 51 | 54 | 52 | 51 |
| Bachelor’s degree or higher b | 22 | 26 | 26 | 26 | 27 | 27 | 27 | 27 | 27 | 28 | 31 | 32 | 31 | 32 |
| Whiteb | 23 | 28 | 28 | 27 | 30 | 30 | 30 | 30 | 30 | 31 | 34 | 35 | 35 | 36 |
| Blackb | 12 | 15 | 15 | 14 | 16 | 13 | 14 | 16 | 16 | 18 | 17 | 16 | 18 | 17 |
| Hispanicc | 11 | 17 | 13 | 18 | 14 | 16 | 16 | 14 | 13 | 16 | 16 | 18 | 17 | 14 |
| Associate's degree | — | — | — | — | — | — | 8 | 9 | 10 | 10 | 10 | 9 | 10 | 10 |
| Whiteb | — | — | — | — | — | — | 8 | 9 | 10 | 10 | 10 | 9 | 10 | 10 |
| Blackb | — | — | — | — | — | — | 8 | 6 | 8 | 8 | 8 | 7 | 8 | 10 |
| Hispanicc | — | — | — | — | — | — | 7 | 8 | 9 | 7 | 8 | 9 | 9 | 9 |
a High school completion or high school graduate is defined as 12 years of school completed for 1971-1991 and high school diploma or equivalency certificate for 1992-1997. Beginning in 1992, the Current Population Survey changed the questions used to obtain educational attainment of respondents.
b Non-Hispanic .
c Persons of Hispanic origin may be of any race.
d This was measured as “one or more years of college” for 1971-1991 and as “some college or more” for 1992-1997.
e This was measured as “four or more years of college” for 1971-1991 and as “bachelor’s degree or higher” for 1992-1997.
Sources: U.S. Department of Education, National Center for Education Statistics. 1998. The Condition of Education 1997, Tables 22-2 and 22-3; Associate degree data published in Federal Interagency Forum on Child and Family Statistics, 1998, Table ED6.
Figure EA 1.6.A Percentage of 25- through 29-year-old high school graduates a in the United States who have attended some college, by race and Hispanic origin: b Selected years, 1971-1999
a High school completion or high school graduate is defined as 12 years of school completed for 1971-1991 and high school diploma or equivalency certificate for 1992-1997. Beginning in 1992, the Current Population Survey changed the questions used to obtain the educational attainment of respondents.
b Persons of Hispanic origin may be of any race.
Source: U.S. Department of Education, National Center for Education Statistics, 2000.
Figure EA 1.6.B Percentage of 25- through 29-year-old high school graduates a in the United States who have received a bachelor’s degree, b by race and Hispanic origin: c Selected years, 1971-1999
a High school completion or high school graduate is defined as 12 years of school completed for 1971-1991 and high school diploma or equivalency certificate for 1992-1997. Beginning in 1992, the Current Population Survey changed the questions used to obtain the educational attainment of respondents.
b This was measured as “four or more years of college” for 1971-1991 and as “bachelor’s degree or higher” for 1992-1997.
c Persons of Hispanic origin may be of any race.
Source: U.S. Department of Education, National Center for Education Statistics, 2000.
Achievement/Proficiency
EA 2.1 Reading Proficiency for Children Ages 9, 13, and 17
Literacy proficiency and reading achievement are vital to educational reform efforts in the United States.21 One of the National Education Goals for the year 2000, adopted by Congress, is for adult literacy and lifelong learning, with objectives of having all students demonstrate competency in English and having all adults be literate.22 Levels of reading achievement will help measure the extent to which these goals are being met.
In order to monitor progress in the reading achievement of students in the United States, the National Assessment of Educational Progress (NAEP) has conducted national assessments of the reading performance of 9-, 13-, and 17-year-olds. There are five levels of reading proficiency reported by NAEP, ranging from Level 150 (completing simple, discrete reading tasks) to Level 350 (learning from specialized reading materials).23 The following tables report the average reading proficiency scores of students in the three age groups between 1971 and 1996.
Trends in Reading Proficiency Scores. Among 9-year-olds, average reading proficiency scores improved between 1971 and 1980, declined between 1980 and 1984, and remained steady until 1996, so that the average score in 1996 (212) was similar to the score in 1975 (210) (see Table EA 2.1.A). Among 13-year-olds, average reading proficiency scores varied from year to year and were similar in 1996 (259) and 1971 (255) (see Table EA 2.1.B). Among 17-year-olds, average scores increased between 1971 and 1988, remained stable between 1988 and 1992, and then showed a slight decline through 1996, so that the average score in 1996 (287) was similar to the score in 1975 (286) (see Table EA 2.1.C).
Differences by Gender. Females have scored consistently higher than males over time and for all ages. For example, among 13-year-olds in 1996, females had an average score of 265, compared with an average score of 253 for males (see Table EA 2.1.B).
Differences by Race and Hispanic Origin.24 There are large and consistent differences in reading proficiency by race and Hispanic origin among all age groups; for example, among 17-year-olds in 1996, whites had higher average reading proficiency scores (294) than either blacks (265) or Hispanics (265) (see Table EA 2.1.C). However, black 17-year-olds had especially high gains in achievement relative to whites in the 1980s; thus, the gaps in reading proficiency scores between whites and blacks have narrowed since the mid-1970s among 17-year-olds (see Figure EA 2.1). The gap has also narrowed between white and Hispanic 17-year-olds (see Figure EA 2.1).
Differences by Parents’ Education Level.25 Average reading proficiency levels vary dramatically by parents’ education level;26 for example, among 13-year-olds and 17-year-olds in 1996, the lowest average reading proficiency scores were among teens whose better-educated parent did not have a high school education, while the highest scores were among teens who had a parent with post-high school education. In fact, the average reading proficiency score among 13-year-old children of parents with post-high school education levels (270) was similar to the average score among 17-year-old children of parents without a high school degree (267) (see Tables EA 2.1.B and EA 2.1.C).
Differences by Type of School. Average reading proficiency scores have been consistently higher among students attending nonpublic schools than among students attending public schools. This is true for every age group and every year reported (see Tables EA 2.1.A, EA 2.1.B, and EA 2.1.C).
21 Campbell, J.R., Voelkl, K.E., & Donahue, P.L. 1997. NAEP 1996 Trends in Academic Progress. NCES 97-985. Washington, D.C.: National Center for Education Statistics.
22 National Education Goals Panel. 1999. The National Education Goals Report: Building a Nation of Learners, 1999 (Goal 6). Washington, D.C.: U.S. Government Printing Office.
23 NAEP has regularly been conducting assessments of students in public and private schools in the United States in order to monitor trends in academic achievement in core curriculum areas since the 1970s. NAEP uses proficiency scales that range from 0 to 500. To give meaning to the results, students’ performance is characterized at five levels along the proficiency scales (150, 200, 250, 300, 350).
24 Estimates for whites and blacks exclude Hispanics of those races.
25 Parents’ education level refers to the highest level of education completed by either parent.
26 Parents’ education level is not reported at age 9 because approximately one-third of these students did not know their parents’ education level.
Table EA 2.1.A Average reading proficiency for children age 9 in the United States, by gender, race and Hispanic origin,a and type of school: Selected years, 1971-1996
| 1971 | 1975 | 1980 | 1984 | 1988 | 1990 | 1992 | 1994 | 1996 | |
|---|---|---|---|---|---|---|---|---|---|
| Total | 208 | 210 | 215 | 211 | 212 | 209 | 211 | 211 | 212 |
| Gender | |||||||||
| Male | 201 | 204 | 210 | 208 | 208 | 204 | 206 | 207 | 207 |
| Female | 214 | 216 | 220 | 214 | 216 | 215 | 215 | 215 | 218 |
| Race and Hispanic origin a | |||||||||
| White, non-Hispanic | 214 | 217 | 221 | 218 | 218 | 217 | 218 | 218 | 220 |
| Black, non-Hispanic | 170 | 181 | 189 | 186 | 189 | 182 | 185 | 185 | 190 |
| Hispanic | — | 183 | 190 | 187 | 194 | 189 | 192 | 186 | 194 |
| Type of school | |||||||||
| Public | — | — | 214 | 209 | 210 | 208 | 209 | 209 | 210 |
| Nonpublic | — | — | 227 | 223 | 223 | 228 | 225 | 225 | 227 |
a Persons of Hispanic origin may be of any race.
Note: The reading proficiency scale ranges from 0 to 500:
Level 150: Simple, discrete reading tasks
Level 200: Partial skills and understanding
Level 250: Interrelates ideas and makes generalizations
Level 300: Understands complicated information
Level 350: Learns from specialized reading materials
Source: Campbell, Voelkl, & Donahue, 1997, Table C.16.
Table EA 2.1.B Average reading proficiency for children age 13 in the United States, by gender, race and Hispanic origin,a parents’ education level,b and type of school: Selected years, 1971-1996
| 1971 | 1975 | 1980 | 1984 | 1988 | 1990 | 1992 | 1994 | 1996 | |
|---|---|---|---|---|---|---|---|---|---|
| Total | 255 | 256 | 259 | 257 | 258 | 257 | 260 | 258 | 259 |
| Gender | |||||||||
| Male | 250 | 250 | 254 | 253 | 252 | 251 | 254 | 251 | 253 |
| Female | 261 | 262 | 263 | 262 | 263 | 263 | 265 | 266 | 265 |
| Race and Hispanic origin a | |||||||||
| White, non-Hispanic | 261 | 262 | 264 | 263 | 261 | 262 | 266 | 265 | 267 |
| Black, non-Hispanic | 222 | 226 | 233 | 236 | 243 | 242 | 238 | 234 | 236 |
| Hispanic | — | 232 | 237 | 240 | 240 | 238 | 239 | 235 | 240 |
| Parents’ education level b | |||||||||
| Less than high school | 238 | 239 | 239 | 240 | 247 | 241 | 239 | 237 | 241 |
| Graduated high school | 256 | 255 | 254 | 253 | 253 | 251 | 252 | 251 | 252 |
| Some education after high school | 270 | 270 | 271 | 268 | 265 | 267 | 270 | 269 | 270 |
| Type of school | |||||||||
| Public | — | — | 257 | 255 | 256 | 255 | 257 | 256 | 257 |
| Nonpublic | — | — | 271 | 271 | 268 | 270 | 276 | 276 | 274 |
a Persons of Hispanic origin may be of any race.
b Parents’ education level refers to the highest level of education completed by either parent.
Note: The reading proficiency scale ranges from 0 to 500:
Level 150: Simple, discrete reading tasks
Level 200: Partial skills and understanding
Level 250: Interrelates ideas and makes generalizations
Level 300: Understands complicated information
Level 350: Learns from specialized reading materials
Source: Campbell, Voelkl, & Donahue, 1997, Table C.17.
Table EA 2.1.C Average reading proficiency for children age 17 in the United States, by gender, race and Hispanic origin,a parents’ education level,b and type of school: Selected years, 1971-1996
| 1971 | 1975 | 1980 | 1984 | 1988 | 1990 | 1992 | 1994 | 1996 | |
|---|---|---|---|---|---|---|---|---|---|
| Total | 285 | 286 | 286 | 289 | 290 | 290 | 290 | 288 | 287 |
| Gender | |||||||||
| Male | 279 | 280 | 282 | 284 | 286 | 284 | 284 | 282 | 280 |
| Female | 291 | 291 | 289 | 294 | 294 | 297 | 296 | 295 | 294 |
| Race and Hispanic origin a | |||||||||
| White, non-Hispanic | 291 | 293 | 293 | 295 | 295 | 297 | 297 | 296 | 294 |
| Black, non-Hispanic | 239 | 241 | 243 | 264 | 274 | 267 | 261 | 266 | 265 |
| Hispanic | — | 252 | 261 | 268 | 271 | 275 | 271 | 263 | 265 |
| Parents’ education level b | |||||||||
| Less than high school | 261 | 263 | 262 | 269 | 267 | 270 | 271 | 268 | 267 |
| Graduated high school | 283 | 281 | 278 | 281 | 282 | 283 | 281 | 276 | 273 |
| Some education after high school | 302 | 301 | 299 | 301 | 300 | 300 | 299 | 299 | 297 |
| Type of school | |||||||||
| Public | — | — | 284 | 287 | 289 | 289 | 288 | 286 | 286 |
| Nonpublic | — | — | 298 | 303 | 300 | 311 | 310 | 306 | 294 |
a Persons of Hispanic origin may be of any race.
b Parents’ education level refers to the highest level of education completed by either parent.
Note: The reading proficiency scale ranges from 0 to 500:
Level 150: Simple, discrete reading tasks
Level 200: Partial skills and understanding
Level 250: Interrelates ideas and makes generalizations
Level 300: Understands complicated information
Level 350: Learns from specialized reading materials
Source: Campbell, Voelkl, & Donahue, 1997, Table C.18.
Figure EA 2.1 Average reading proficiency for children age 17 in the United States, by race and Hispanic origin: a Selected years, 1971-1996
a Persons of Hispanic origin may be of any race.
Note: The reading proficiency scale ranges from 0 to 500.
Level 150: Simple, discrete reading tasks
Level 200: Partial skills and understanding
Level 250: Interrelates ideas and makes generalizations
Level 300: Understands complicated information
Level 350: Learns from specialized reading materials
Source: Campbell, JVoelkl, & Donahue, 1997, Table C.18.
EA 2.2 Mathematics Proficiency for Children Ages 9, 13, and 17
One of the National Education Goals for the year 2000, adopted by Congress, is to improve the relative standing of students in the United States in mathematics achievement.27 In a1995 comparison of 8th graders in the United States with their peers in 40 other countries, the Third International Math and Science Study showed that students in the United States had significantly lower overall mathematics proficiency scores than students in 20 countries, had similar scores to students in 13 countries, and had higher scores than students in 7 countries.28
In order to monitor progress in the mathematics achievement of students in the United States, the National Assessment of Educational Progress (NAEP) has conducted national assessments of the mathematics performance of 9-, 13-, and 17-year-olds. There are five levels of mathematics proficiency reported by NAEP, ranging from Level 150 (understanding simple arithmetic facts) to Level 350 (multi-step problem solving and algebra).29 The following tables report the average mathematics proficiency scores of students in the three age groups between 1973 and 1996.
Trends in Mathematics Proficiency Scores. Among 9-year-olds, average mathematics proficiency scores remained the same between 1973 and 1982 and then increased substantially to 231 in 1994; scores remained stable from 1994 to 1996 (see Table EA 2.2.A). Among 13-year-olds, mathematics proficiency scores increased between 1978 (264) and 1994 (274); again, scores remained stable from 1994 to 1996 (see Table EA 2.2.B). Among 17-year-olds, average proficiency scores declined between 1973 and 1982, after which they increased and stabilized at a level slightly higher than that obtained in 1973 (see Table EA 2.2.C).
Differences by Gender. In 1996, mathematics proficiency scores were higher for males than for females across all age groups; however, differences are small and in many years were virtually nonexistent for 9- and 13-year-olds. Proficiency scores in 1996 were higher for males by an average of 4 points for 9-year-olds and 13-year-olds and 5 points for 17-year-olds.
Differences by Race and Hispanic Origin.30 There are consistently large differences in mathematics proficiency by race and Hispanic origin. For example, among 17-year-olds in 1996, blacks and Hispanics had lower proficiency scores (286 and 292, respectively) than whites (313) (see Table EA 2.2.C); however, black and Hispanic 17-year-olds had substantial gains in achievement between 1973 and 1996 (see Figure EA 2.2).
Differences by Parents’ Education Level.31 There are large variations in average mathematics proficiency levels by level of parental education for 13- and 17-year-olds (see Tables EA 2.2.B and EA 2.2.C).32 For example, in 1996, 13-year-olds whose better-educated parent did not have a high school education had the lowest average proficiency scores (254), while those whose parent(s) had graduated from college had the highest scores (283) (see Table EA 2.2.B).
Differences by Type of School. Average mathematics proficiency scores among students in public schools have been consistently lower than average scores among students in non-public schools. This is true for every age group and every year reported (see Tables EA 2.2.A, EA 2.2.B, and EA 2.2.C).
27 National Education Goals Panel. 1997.
28 U.S. Department of Education, National Center for Education Statistics. 1997. Pursuing Excellence: A Study of U.S. Eighth-Grade Mathematics and Science Teaching, Learning, Curriculum, and Achievement in International Context. No. 97-198. Washington, D.C.: U.S. Government Printing Office.
29 NAEP has regularly been conducting assessments of students in public and private schools in the United States in order to monitor trends in academic achievement in core curriculum areas since the 1970s. NAEP uses proficiency scales that range from 0 to 350. To give meaning to the results, students’ performance is characterized at five levels along the proficiency scales (150, 200, 250, 300, 350).
30 Estimates for whites and blacks exclude Hispanics of those races.
31 Parents’ education level refers to the highest level of education completed by either parent.
32 Parents’ education level is not reported at age 9 because approximately one-third of these students did not know their parent's education level.
Table EA 2.2.A Average mathematics proficiency for children age 9 in the United States, by gender, race and Hispanic origin,a and type of school: Selected years, 1973-1996
| 1973 | 1978 | 1982 | 1986 | 1990 | 1992 | 1994 | 1996 | |
|---|---|---|---|---|---|---|---|---|
| Total | 219 | 219 | 219 | 222 | 230 | 230 | 231 | 231 |
| Gender | ||||||||
| Male | 218 | 217 | 217 | 222 | 229 | 231 | 232 | 233 |
| Female | 220 | 220 | 221 | 222 | 230 | 228 | 230 | 229 |
| Race and Hispanic origin | ||||||||
| White a | 225 | 224 | 224 | 227 | 235 | 235 | 237 | 237 |
| Black a | 190 | 192 | 195 | 202 | 208 | 208 | 212 | 212 |
| Hispanic b | 202 | 203 | 204 | 205 | 214 | 212 | 210 | 215 |
| Type of school | ||||||||
| Public | — | 217 | 217 | 220 | 229 | 228 | 229 | 230 |
| Nonpublic | — | 231 | 232 | 230 | 238 | 242 | 245 | 239 |
a Non-Hispanic.
b Persons of Hispanic origin may be of any race.
Note: The mathematics proficiency scale ranges from 0 to 350
Level 150: Simple arithmetic facts
Level 200: Beginning skills and understanding
Level 250: Numerical operations and beginning problem solving
Level 300: Moderately complex procedures and reasoning
Level 350: Multi-step problem solving and algebra
Sources: Campbell, Voelkl, & Donahue, 1997, Table B.16.
Table EA 2.2.B Average mathematics proficiency for children age 13 in the United States, by gender, race and Hispanic origin,a parents’ education level,b and type of school: Selected years, 1973-1996
| 1973 | 1978 | 1982 | 1986 | 1990 | 1992 | 1994 | 1996 | |
|---|---|---|---|---|---|---|---|---|
| Total | 266 | 264 | 269 | 269 | 270 | 273 | 274 | 274 |
| Gender | ||||||||
| Male | 265 | 264 | 269 | 270 | 271 | 274 | 276 | 276 |
| Female | 267 | 265 | 268 | 268 | 270 | 272 | 273 | 272 |
| Race and Hispanic origin a | ||||||||
| White, non-Hispanic | 274 | 272 | 274 | 274 | 276 | 279 | 281 | 281 |
| Black, non-Hispanic | 228 | 230 | 240 | 249 | 249 | 250 | 252 | 252 |
| Hispanic | 239 | 238 | 252 | 254 | 255 | 259 | 256 | 256 |
| Parents’ education level b | ||||||||
| Less than high school | — | 245 | 251 | 252 | 253 | 256 | 255 | 254 |
| Graduated high school | — | 263 | 263 | 263 | 263 | 263 | 266 | 267 |
| Some education after high school | — | 273 | 275 | 274 | 277 | 278 | 277 | 278 |
| Graduated college | — | 284 | 282 | 280 | 280 | 283 | 285 | 283 |
| Type of school | ||||||||
| Public | — | 263 | 267 | 269 | 269 | 272 | 273 | 273 |
| Nonpublic | — | 279 | 281 | 276 | 280 | 283 | 285 | 286 |
a Persons of Hispanic origin may be of any race.
b Parents’ education level refers to the highest level of education completed by either parent.
Note: The mathematics proficiency scale ranges from 0 to 350:
Level 150: Simple arithmetic facts
Level 200: Beginning skills and understanding
Level 250: Numerical operations and beginning problem solving
Level 300: Moderately complex procedures and reasoning
Level 350: Multi-step problem solving and algebra
Sources: Campbell, Voelkl, & Donahue, 1997, Table B.17.
Table EA 2.2.C Average mathematics proficiency for children age 17 in the United States, by gender, race and Hispanic origin,a parents’ education level,b and type of school: Selected years, 1973-1996
| 1973 | 1978 | 1982 | 1986 | 1990 | 1992 | 1994 | 1996 | |
|---|---|---|---|---|---|---|---|---|
| Total | 304 | 300 | 299 | 302 | 305 | 307 | 306 | 307 |
| Gender | ||||||||
| Male | 309 | 304 | 302 | 305 | 306 | 309 | 309 | 310 |
| Female | 301 | 297 | 296 | 299 | 303 | 305 | 304 | 305 |
| Race and Hispanic origin a | ||||||||
| White, non-Hispanic | 310 | 306 | 304 | 308 | 310 | 312 | 312 | 313 |
| Black, non-Hispanic | 270 | 268 | 272 | 279 | 289 | 286 | 286 | 286 |
| Hispanic | 270 | 268 | 272 | 279 | 289 | 286 | 286 | 286 |
| Parents’ education level b | ||||||||
| Less than high school | — | 280 | 279 | 279 | 285 | 286 | 284 | 281 |
| Graduated high school | — | 294 | 293 | 293 | 294 | 298 | 295 | 297 |
| Some education after high school | — | 305 | 304 | 305 | 308 | 308 | 305 | 307 |
| Graduated college | — | 317 | 312 | 314 | 316 | 316 | 318 | 317 |
| Type of school | ||||||||
| Public | — | 300 | 297 | 301 | 304 | 305 | 304 | 306 |
| Nonpublic | — | 314 | 311 | 320 | 318 | 320 | 319 | 316 |
a Persons of Hispanic origin may be of any race.
b Parents’ education level refers to the highest level of education completed by either parent.
Note: The mathematics proficiency scale ranges from 0 to 350:
Level 150: Simple arithmetic facts
Level 200: Beginning skills and understanding
Level 250: Numerical operations and beginning problem solving
Level 300: Moderately complex procedures and reasoning
Level 350: Multi-step problem solving and algebra
Sources: Campbell, Voelkl, & Donahue, 1997, Data for 1973 appear in NAEP 1992 Trends in Academic Progress. Report No. 23-TR01, Table B.18.
Figure EA 2.2 Average mathematics proficiency for children age 17 in the United States, by race and Hispanic
aorigin: Selected years, 1973-1996
a Persons of Hispanic origin may be of any race.
Note: The mathematics proficiency scale ranges from 0 to 350.
Level 150: Simple arithmetic facts
Level 200: Beginning skills and understanding
Level 250: Numerical operations and beginning problem solving
Level 300: Moderately complex procedures and reasoning
Level 350: Multi-step problem solving and algebra
Sources: Campbell, Voelkl, & Donahue, 1997. Data for 1973 appear in NAEP 1992 Trends in Academic Progress. Report No. 23-TR01, Table B.18.
EA 2.3 Science Proficiency for Children Ages 9, 13, and 17
One of the National Education Goals for the year 2000, adopted by Congress, is to improve the relative standing of students in the United States in science achievement.33 In a 1995 comparison of 8th graders in the United States with 8th-graders in 40 other countries, the
Third International Math and Science Study showed that students in the United States had significantly lower overall science proficiency scores than students in 9 countries, had similar scores to students in 16 countries, and had higher scores than students in 15 countries.34
In order to present time trends in science proficiency levels, the National Assessment of Educational Progress (NAEP) reports five different proficiency levels, ranging from Level 150 (knows everyday science facts) to Level 350 (integrates specialized scientific information).35 The following tables report the average science proficiency scores of students in the three age groups between 1977 and 1996.
Trends in Science Proficiency Scores. Average science proficiency scores have increased among all age groups since 1977. Among 9-year-olds, average science proficiency scores increased between 1977 (220) and 1994 (231) and remained stable through 1996 (230) (see Table EA 2.3.A). Similarly, among 13-year-olds, average scores increased between 1977 (247) and 1994 (257) and remained constant through 1996 (256) (see Table EA 2.3.B). Among 17-year-olds, average science proficiency scores declined between 1977 (290) and 1982 (283), after which they increased to 296 in 1996 (see Table EA 2.3.C). Thus, gains in science proficiency levels among 17-year-olds from 1977 to 1996 were not as great as gains for the other two age groups.
Differences by Gender. Average science proficiency scores have been consistently higher for males than females over time and for all age groups, though differences are smaller among 9-year-olds. Among 13-year-olds in 1996, boys scored on average 9 points higher than girls; among 17-year-olds, the average difference was 8 points; and among 9-year-olds, males scored on average 4 points higher than females.
Differences by Race and Hispanic Origin.36 There are large differences in science proficiency scores by race and Hispanic origin among all age groups. For example, among 17-year-olds in 1996, whites had higher average science proficiency scores (307) than blacks (260) or Hispanics (269) (see Table EA 2.3.C); however, black 17-year-olds had especially high gains in achievement since 1977 (see Figure EA 2.3). Black 9-year-olds and 13-year-olds also showed high gains in science achievement over time.
Differences by Parents’ Education Level.37 Average science proficiency levels vary dramatically by level of parents’ education.38 For example, among 13-year-olds and 17-year-olds in 1996, the lowest average science proficiency scores were among teens whose better-educated parent did not have a high school education, while the highest scores were among teens who had a parent who had graduated from college. In 1996, the average science proficiency score among 13-year-old children of parents with a college education (266) was similar to the average score among 17-year-old children of parents without a high school diploma (261) (see Tables EA 2.3.B and EA 2.3.C).
Differences by Type of School. Average science proficiency scores have been consistently higher among students attending nonpublic schools than among students attending public schools. This is true for every age group and every year reported (see Tables EA 2.3.A, EA 2.3.B, and EA 2.3.C).
33 National Education Goals Panel. 1997.
34 U.S. Department of Education, National Center for Education Statistics. 1997.
35 NAEP has regularly been conducting assessments of students in public and private schools in the United States in order to monitor trends in academic achievement in core curriculum areas since the 1970s. NAEP uses proficiency scales that range from 0 to 350. To give meaning to the results, students’ performance is characterized at five levels along the proficiency scales (150, 200, 250, 300, 350).
36 Estimates for whites and blacks exclude Hispanics of those races.
37 Parents’ education level refers to the highest level of education completed by either parent.
38 Parents’ education is not reported at age 9 because approximately one-third of these students did not know their parents’ education level.
Table EA 2.3.A Average science proficiency for children age 9 in the United States, by gender, race and Hispanic origin,a and type of school: Selected years, 1977-1996
| 1977 | 1982 | 1986 | 1990 | 1992 | 1994 | 1996 | |
|---|---|---|---|---|---|---|---|
| Total | 220 | 221 | 224 | 229 | 231 | 231 | 230 |
| Gender | |||||||
| Male | 222 | 221 | 227 | 230 | 235 | 232 | 232 |
| Female | 218 | 221 | 221 | 227 | 227 | 230 | 228 |
| Race and Hispanic origin | |||||||
| White a | 230 | 229 | 232 | 238 | 239 | 240 | 239 |
| Black a | 175 | 187 | 196 | 196 | 200 | 201 | 202 |
| Hispanic b | 192 | 189 | 199 | 206 | 205 | 201 | 207 |
| Type of school | |||||||
| Public | 218 | 220 | 223 | 228 | 229 | 230 | 229 |
| Nonpublic | 235 | 232 | 233 | 237 | 240 | 242 | 238 |
a Non-Hispanic.
b Persons of Hispanic origin may be of any race.
Note: The science proficiency scale ranges from 0 to 350:
Level 150: Knows everyday science facts
Level 200: Understands simple scientific principles
Level 250: Applies general scientific information
Level 300: Analyzes scientific procedures and data
Level 350: Integrates specialized scientific information
Source: Campbell, Voelkl, & Donahue, 1997, Table A.16.
Table EA 2.3.B Average science proficiency for children age 13 in the United States, by gender, race and Hispanic origin,a parents’ education level,b and type of school: Selected years, 1977-1996
| 1977 | 1982 | 1986 | 1990 | 1992 | 1994 | 1996 | |
|---|---|---|---|---|---|---|---|
| Total | 247 | 250 | 251 | 255 | 258 | 257 | 256 |
| Gender | |||||||
| Male | 251 | 256 | 256 | 259 | 260 | 259 | 261 |
| Female | 244 | 245 | 247 | 252 | 256 | 254 | 252 |
| Race and Hispanic origin | |||||||
| White a | 256 | 257 | 259 | 264 | 267 | 267 | 266 |
| Black a | 208 | 217 | 222 | 226 | 224 | 224 | 226 |
| Hispanic b | 213 | 226 | 226 | 232 | 238 | 232 | 232 |
| Parents’ education level c | |||||||
| Less than high school | 224 | 225 | 229 | 233 | 234 | 234 | 232 |
| Graduated high school | 245 | 243 | 245 | 247 | 246 | 247 | 248 |
| Some education after high school | 260 | 259 | 258 | 263 | 266 | 260 | 260 |
| Graduated college | 266 | 264 | 264 | 268 | 269 | 269 | 266 |
| Type of school | |||||||
| Public | 245 | 249 | 251 | 254 | 257 | 255 | 255 |
| Nonpublic | 268 | 264 | 263 | 269 | 265 | 268 | 268 |
a Non-Hispanic.
b Persons of Hispanic origin may be of any race.
c Parents’ education level refers to the highest level of education completed by either parent.
Note: The science proficiency scale ranges from 0 to 350:
Level 150: Knows everyday science facts
Level 200: Understands simple scientific principles
Level 250: Applies general scientific information
Level 300: Analyzes scientific procedures and data
Level 350: Integrates specialized scientific information
Source: Campbell, Voelkl, & Donahue. 1997. Table A.17.
Table EA 2.3.C Average science proficiency for children age 17 in the United States, by gender, race and Hispanic origina, parents’ education levelb, and type of school: Selected years, 1977-1996
| 1977 | 1982 | 1986 | 1990 | 1992 | 1994 | 1996 | |
|---|---|---|---|---|---|---|---|
| Total | 290 | 283 | 289 | 290 | 294 | 294 | 296 |
| Gender | |||||||
| Male | 297 | 292 | 295 | 296 | 299 | 300 | 300 |
| Female | 282 | 275 | 282 | 285 | 289 | 289 | 292 |
| Race and Hispanic origin | |||||||
| White a | 298 | 293 | 298 | 301 | 304 | 306 | 307 |
| Black a | 240 | 235 | 253 | 253 | 256 | 257 | 260 |
| Hispanic b | 262 | 249 | 259 | 262 | 270 | 261 | 269 |
| Parents’ education level c | |||||||
| Less than high school | 265 | 259 | 258 | 261 | 262 | 256 | 261 |
| Graduated high school | 284 | 275 | 277 | 276 | 280 | 279 | 282 |
| Some education after high school | 296 | 290 | 295 | 297 | 296 | 295 | 297 |
| Graduated college | 309 | 300 | 304 | 306 | 308 | 311 | 308 |
| Type of school | |||||||
| Public | 288 | 282 | 287 | 289 | 292 | 292 | 295 |
| Nonpublic | 308 | 292 | 321 | 308 | 312 | 310 | 303 |
a Non-Hispanic.
b Persons of Hispanic origin may be of any race.
c Parents’ education level refers to the highest level of education completed by either parent.
Note: The science proficiency scale ranges from 0 to 350:
Level 150: Knows everyday science facts
Level 200: Understands simple scientific principles
Level 250: Applies general scientific information
Level 300: Analyzes scientific procedures and data
Level 350: Integrates specialized scientific information
Source: Campbell, Voelkl, & Donahue. 1997. Table A.18.
Figure EA 2.3 Average science proficiency for children age 17 in the United States, by race and Hispanic origin: a Selected years, 1977-1996
a Persons of Hispanic origin may be of any race.
Note: The science proficiency scale ranges from 0 to 350.
Level 150: Knows everyday science facts
Level 200: Understands simple scientific principles
Level 250: Applies general scientific information
Level 300: Analyzes scientific procedures and data
Level 350: Integrates specialized scientific information
Source: Campbell, Voelkl, & Donahue. 1997. Table A.18.
EA 2.4 Arts Proficiency for Children in Grade 8
Artistic expression is one of the key vehicles for individual creativity and for the reflection and transmission of cultural messages. An understanding and appreciation of the arts therefore helps to nurture human creativity and fosters the celebration of a diverse cultural heritage. Recent research suggests that arts education can improve student performance in other intellectual and academic areas, including math and science.39 College Board data show that children who have participated in sequential arts programs outperform their peers who have not had arts training on both the verbal and math components of the SAT.40
The National Assessment of Educational Progress (NAEP) completed assessments of 8th graders’ music, visual arts, and theater skills in 1997.41 For the music and visual arts assessments, data were collected on students’ ability to respond to, analyze, or evaluate musical pieces or works of art.42 Average scores were coded on a scale of 0 to 300. Because ability scores had different ranges across music and the visual arts, comparisons should not be made between student results across disciplines. In other words, a score of 100 in the visual arts is not necessarily “better” than a score of 90 in music.
Differences by Gender. Girls outperformed boys in responding to and analyzing musical pieces (see Figure EA 2.4.A). For example, 8th-grade girls had an average music score of 160, whereas boys had an average score of 140. For evaluating visual artwork, girls’ scores were 8 points higher than boys’ scores (154 versus 146) (see Table EA 2.4).
Differences by Race and Hispanic Origin.43 There are significant differences in students’ artistic evaluation skills by racial/ethnic group (see Table EA 2.4). White and Asian students had higher average music scores (158 and 152, respectively) than did black (130) and Hispanic students (127). A similar pattern is seen for the visual arts (see Table EA 2.4). White and Asian students had higher average scores (159 and 153, respectively) than did black or Hispanic students (124 and 128, respectively).
Differences by Parents’ Education Level.44 Consistent with other NAEP assessments, higher levels of parental education were associated with higher levels of student performance in both music and the visual arts. For example, 8th graders whose better-educated parent had graduated from college had higher music scores (159) than students whose parent(s) had some education past high school (150) or whose parent(s) graduated high school (139). Students whose better-educated parent did not finish high school had the lowest scores (129) (see Figure EA 2.4.B). The same pattern is evident for the visual arts scores.
Differences by Type of School. Students from nonpublic schools had higher scores for the visual arts (167) than did students from public schools (148). The same pattern held true for music scores (see Table EA 2.4).
39 Kane, E., & Frankonis, E. May. 1998. Arts Education in the New Millennium. Education New York 2 (5): 3.
40 Childress, J. May. 1998. Art Education Pays Off. Education New York, 2 (5): 5.
41 Unlike other NAEP assessments that are typically conducted on nationally representative samples of students in grades 4, 8, and 12, the 1997 arts assessments were conducted on grade 8 students only. This was due to budgetary constraints.
Because the theater assessment was conducted on a "targeted" sample rather than a nationally representative sample, results are not presented here. Finally, although NAEP conducted an arts assessment in music and visual arts in 1974 and 1978, considerable changes were made to the 1997 assessment such that comparable data for trends analyses are not possible. Therefore, only results from the 1997 NAEP music and visual arts assessments are presented here.
42 Students were also scored on their ability to create and perform works of art; however, only students’ ability to respond to art will be discussed here.
43 Estimates for whites and blacks exclude Hispanics of those races.
44 Parents’ education level refers to the highest level of education completed by either parent.
Table EA 2.4 Average music and visual arts proficiencya for children in grade 8 in the United States, by gender, race and Hispanic origin,b parents’ education level,c and type of school: 1997
| Music | Visual Arts | |
|---|---|---|
| Total | 150 | 150 |
| Gender | ||
| Male | 140 | 146 |
| Female | 160 | 154 |
| Race and Hispanic origin | ||
| White d | 158 | 159 |
| Black d | 130 | 124 |
| Hispanic d | 127 | 128 |
| Asian | 152 | 153 |
| Parents’ education level b | ||
| Less than high school | 129 | 125 |
| Graduated high school | 139 | 138 |
| Some education after high school | 150 | 153 |
| Graduated college | 159 | 158 |
| Type of school | ||
| Public | 149 | 148 |
| Nonpublic | 158 | 167 |
a The music and visual arts scale scores range from 0 to 300.
b Persons of Hispanic origin may be of any race.
c Parents’ education level refers to the highest level of education completed by either parent.
d Non-Hispanic.
Source: National Center for Education Statistics, National Assessment of Educational Progress (NAEP), 1997 Arts
Assessment. As published in Persky, Sandene, & Askew, 1999, Tables 6.4, 6.5, 6.7, 6.8, 6.10, 6.11, 6.13, and 6.14.
Figure EA 2.4.A Average music and visual arts proficiency scoresa for children in grade 8 in the United States, by gender: 1997
a The music and visual arts scale scores range from 0 to 300.
Source: National Center for Education Statistics, National Assessment of Educational Progress (NAEP), Tables 6.4 and 6.5.
Figure EA 2.4.B Average music and visual arts proficiency scoresa for children in grade 8 in the United States, by parents’ education level:b 1997
a The music and visual arts scale scores range from 0 to 300.
b Parents’ education level refers to the highest level of education completed by either parent.
Source: National Center for Education Statistics, National Assessment of Educational Progress , Tables 6.13 and 6.14.
Related Behaviors And Characteristics
EA 3.1 Family-Child Engagement in Literacy Activities
Numerous studies have documented the importance of parental involvement in literacy activities with their children. One of the National Education Goals stresses the importance of family/child engagement in literacy activities, especially among children who are “at risk” of school failure, in order for all children in the United States to be able to start school ready to learn.45
Table EA 3.1 presents three types of literacy activities that parents may engage in with their children. In 1999, a majority of 3- to 5-year-old children (53 percent) were read to by a parent or other family member every day. Fifty percent of children were regularly told stories in 1999 (three or more times a week), a substantial increase from 1991 levels (39 percent).
Differences by Race and Hispanic Origin.46 There are substantial differences in all literacy activities by race and Hispanic origin; for example, in 1999, white children were more likely to be read to every day (61 percent) than black children (41 percent) or Hispanic children (33 percent). Similarly, white children (53 percent) were more likely to be told a story frequently than either black or Hispanic children (45 and 40 percent respectively) (see Table EA 3.1). Also, more white children visited a library at least once in the past month in 1999 (39 percent) than either black children (35 percent) or Hispanic children (25 percent). These differences have been fairly stable over time.
Differences by Socioeconomic Status. Children in families living at or above the poverty threshold are much more likely to be engaged in literacy activities on a regular basis than are children who live in poverty; for example, in 1999, 58 percent of children in nonpoor families were read to every day by a parent or other family member, compared with 38 percent of children in poor families (see Figure EA 3.1). There are also substantial differences in literacy activities by mother’s education level. For example, about one-fifth (18 percent) of children whose mothers did not have a high school diploma visited a library once or more in the past month, compared with 30 percent of children whose mothers had graduated high school and 50 percent whose mothers were college graduates (see Table EA 3.1).
Differences by Family Structure. Children in two-parent families were more likely to participate in all three types of literacy activities than children who lived with one or no parent.
Differences by Mother’s Employment Status. Children whose mothers were employed 35 hours or more per week were slightly less likely to engage in any of the three literacy activities than children whose mothers were either working part-time or not working.
45 National Education Goals Panel. 1997. (Goal 1, p. xiv).
46 Estimates of whites and blacks exclude Hispanics of those races.
Table EA 3.1 Percentage of 3- through 5-year-oldsa in the United States who have participated in literacy activities with a family member, by child and family characteristics: 1991, 1993, 1995, 1996, and 1999
| Read to every day |
Told a story at least three times a week |
Visited a library at least once in the past month |
|||||||||||||
|---|---|---|---|---|---|---|---|---|---|---|---|---|---|---|---|
| 1991 | 1993 | 1995 | 1996 | 1999 | 1991 | 1993 | 1995 | 1996 | 1999 | 1991 | 1993 | 1995 | 1996 | 1999 | |
| Total | — | 53 | 58 | 57 | 53 | 39 | 43 | 50 | 55 | 50 | 35 | 38 | 39 | 37 | 36 |
| Gender | |||||||||||||||
| Male | — | 51 | 57 | 56 | 51 | 37 | 43 | 49 | 55 | 49 | 34 | 38 | 37 | 37 | 35 |
| Female | — | 54 | 59 | 57 | 54 | 41 | 43 | 51 | 56 | 50 | 36 | 38 | 41 | 36 | 38 |
| Race and Hispanic originb | |||||||||||||||
| White | — | 59 | 65 | 64 | 61 | 40 | 44 | 53 | 59 | 53 | 39 | 42 | 43 | 41 | 39 |
| Black | — | 39 | 43 | 44 | 41 | 34 | 39 | 42 | 47 | 45 | 25 | 29 | 32 | 31 | 35 |
| Hispanic | — | 37 | 38 | 39 | 33 | 38 | 38 | 42 | 47 | 40 | 23 | 26 | 27 | 27 | 25 |
| Poverty status | |||||||||||||||
| At or above poverty | — | 56 | 62 | 61 | 58 | 39 | 44 | 53 | 58 | 52 | 38 | 42 | 43 | 41 | 40 |
| Below poverty | — | 44 | 48 | 46 | 38 | 38 | 39 | 44 | 49 | 42 | 26 | 29 | 30 | 28 | 24 |
| Family structurec | |||||||||||||||
| Two parents | — | 55 | 61 | 61 | 57 | 39 | 44 | 52 | 59 | 52 | 38 | 41 | 43 | 40 | 40 |
| One or no parent | — | 46 | 49 | 46 | 42 | 37 | 41 | 46 | 47 | 44 | 23 | 30 | 30 | 29 | 29 |
| Mother’s education leveld | |||||||||||||||
| Less than high school | — | 37 | 40 | 37 | 38 | 34 | 37 | 39 | 47 | 36 | 16 | 22 | 20 | 19 | 18 |
| High school/GED | — | 48 | 48 | 49 | 44 | 38 | 41 | 48 | 54 | 48 | 29 | 31 | 33 | 31 | 30 |
| Vocational/technical or some college | — | 57 | 64 | 62 | 53 | 41 | 45 | 53 | 55 | 52 | 40 | 44 | 42 | 41 | 40 |
| Graduated college | — | 71 | 76 | 77 | 70 | 42 | 48 | 55 | 64 | 55 | 55 | 55 | 57 | 56 | 50 |
| Mother’s employment statusd | |||||||||||||||
| 35 hours or more per week | — | 52 | 55 | 54 | 48 | 37 | 43 | 49 | 53 | 48 | 30 | 34 | 35 | 32 | — |
| Less than 35 hours per week | — | 56 | 63 | 59 | 55 | 40 | 45 | 53 | 56 | 55 | 41 | 47 | 46 | 39 | — |
| Not in labor force | — | 55 | 60 | 59 | 60 | 42 | 43 | 50 | 56 | 60 | 38 | 37 | 42 | 40 | 40 |
a Estimates are based on children who have yet to enter kindergarten.
b Persons of Hispanic origin may be of any race. Estimates for whites and blacks exclude persons of Hispanic origin.
c Parents include any combination of a biological, adoptive, step-, and foster mother and/or father. No parents in the household indicates that the child is living with nonparent guardians (e.g., grandparents).
d Children without mothers in the home are not included in estimates dealing with mother’s education or mother’s employment status. A mother is defined as a biological mother, adoptive mother, stepmother, foster mother, or female guardian (e.g., grandmother) who resides in the home with the child.
Sources: U.S. Department of Education, National Center for Education Statistics, 1991, 1993, 1995, 1996, and 1999 National Household Education Survey (unpublished data); Tabulated by U.S. Department of Education, National Center for Education Statistics; Estimates of “read to every day” as published in Federal Interagency Forum on Child and Family Statistics, 1998, Table ED1.
Figure EA 3.1 Percentage of 3- through 5-year-olds in the United States who have participated in literacy activities with a family member, by poverty status: 1999
Sources: U.S. Department of Education, National Center for Education Statistics, 1999 National Household Education Survey (unpublished data); Tabulated by U.S. Department of Education, National Center for Education Statistics; Estimates of “read to every day” as published in Federal Interagency Forum on Child and Family Statistics, 1998, Table ED1.
EA 3.2 Reading Habits of Children and Youth
Independent reading is one necessary aspect of literacy development. The National Assessment of Educational Progress (NAEP) has documented the association between students who read for fun in their free time and reading achievement. Students ages 9, 13, and 17 who read more frequently for fun had consistently higher average reading proficiency scores than those students who read less often.47 Table EA 3.2 presents the percentage of students who read for fun on a daily basis for three age groups (9-, 13-, and 17-year-olds).
Differences by Age. In 1996, over half of 9-year-olds (54 percent) reported reading for fun on a daily basis, compared with about one-third of 13-year-olds (32 percent) and about one-quarter of 17-year-olds (23 percent) (see Table EA 3.2).
Differences by Gender. Among children ages 9 and 13, larger proportions of girls than boys reported frequent reading in their spare time. For example, more than half (57 percent) of 9-year-old girls read for fun on a daily basis, compared with 51 percent of 9-year-old boys, in 1996. Among 17-year-olds, however, similar proportions of boys (22 percent) and girls (24 percent) reported reading on a daily basis in 1996 (see Figure EA 3.2).
Differences by Race and Hispanic Origin.48 In 1996, the percentage of 9-, 13-, and 17-year-olds who reported reading for fun on a daily basis was similar for all racial/ethnic groups (see Table EA 3.2).
Differences by Parents’ Education Level.49 In 1996, 13-year-olds whose better-educated parent had some education after high school were more likely to read for fun than students whose parent(s) had no education beyond high school (see Table EA 3.2). A similar pattern is found among 17-year-olds; for example, in 1996, 28 percent of 17-year-olds whose better-educated parent had graduated from college read for fun on a daily basis. In contrast, 18 percent of 17-year-olds whose parent(s) had graduated from high school (but had no education beyond that) and 14 percent whose parent(s) had not finished high school reported reading for fun on a daily basis (see Table EA 3.2).
Differences by Type of School. Larger percentages of 13- and 17-year-olds who attended nonpublic schools read for fun on a daily basis than did their counterparts in public schools (see Table EA 3.2). Among 9-year-olds, a larger percentage of public school students reported reading for fun in 1992 and 1994, but this pattern reversed in 1996 (see Table EA 3.2).
47 Campbell, Voelkl, & Donahue. 1997, p. 141.
48 Estimates for whites and blacks exclude Hispanics of those races.
49 Parents’ education level refers to the highest level of education completed by either parent.
Table EA 3.2 Percentage of students ages 9, 13, and 17 in the United States who read for fun on a daily basis, by gender, race and Hispanic origin,a parents’ education level,b and type of school: 1992, 1994, and 1996
| Age 9 | Age 13 | Age 17 | |||||||
|---|---|---|---|---|---|---|---|---|---|
| 1992 | 1994 | 1996 | 1992 | 1994 | 1996 | 1992 | 1994 | 1996 | |
| Total | 56 | 58 | 54 | 37 | 32 | 32 | 27 | 30 | 23 |
| Gender | |||||||||
| Male | 48 | 49 | 51 | 30 | 25 | 27 | 23 | 29 | 22 |
| Female | 64 | 66 | 57 | 44 | 39 | 38 | 30 | 30 | 24 |
| Race and Hispanic origina | |||||||||
| White, non-Hispanic | 57 | 58 | 54 | 37 | 38 | 33 | 29 | 34 | 24 |
| Black, non-Hispanic | 54 | 58 | 51 | 35 | 18 | 29 | 14 | 16 | 21 |
| Hispanic | 54 | 58 | 56 | 44 | 15 | 28 | 25 | 17 | 21 |
| Parents’ education levelb | |||||||||
| Less than high school | — | — | — | 16 | 24 | 29 | 23 | 15 | 14 |
| Graduated high school | — | — | — | 33 | 28 | 28 | 16 | 25 | 18 |
| Some education after high school | — | — | — | 37 | 40 | 41 | 28 | 30 | 22 |
| Graduated college | — | — | — | 44 | 37 | 34 | 35 | 36 | 28 |
| Type of school | |||||||||
| Public | 57 | 57 | 54 | 36 | 31 | 33 | 26 | 29 | 21 |
| Nonpublic | 52 | 54 | 61 | 49 | 40 | 36 | 44 | 46 | 28 |
a Persons of Hispanic origin may be of any race.
b Parents’ education level refers to the highest level of education completed by either parent.
Source: U.S. Department of Education, National Center for Education Statistics, National Assessment of Educational Progress (NAEP), 1992, 1994, and 1996 Long-Term Trends, Reading Assessment, unpublished data. Tabulated by U.S. Department of Education, National Center for Education Statistics.
Figure EA 3.2 Percentage of students ages 9, 13, and 17 in the United States who read for fun on a daily basis, by gender: 1996
Source: U.S. Department of Education, National Center for Education Statistics, National Assessment of Educational Progress (NAEP), 1992, 1994, and 1996 Long-Term Trends, Reading Assessment, unpublished data. Tabulated by U.S. Department of Education, National Center for Education Statistics.
EA 3.3 Parental Involvement in Child’s School
Many educators consider parental involvement in school activities to have a beneficial effect on children’s school performance. They associate higher levels of parental involvement with greater monitoring of school and classroom activities, a closer coordination of teacher and parent efforts, greater teacher attention to the child, and earlier identification of problems that might inhibit learning.50 Indeed, in two-parent families, parental involvement of both mothers and fathers in their child’s school is significantly associated with an increased likelihood of 1st- through 12th-grade children earning mostly A’s and with a reduced likelihood that these children will ever repeat a grade.51
Differences by Children’s Grade Level. Figure EA 3.3 presents national estimates for 1999 on the degree of parental school participation among parents of children in grades 3 through 5, 6 through 8, and 9 through 12. Possible activities include (1) attending general school meetings (e.g., a PTA meeting or back-to-school night), (2) going to a regularly scheduled parent/teacher conference, (3) attending a school or class event such as a play or sports event, and (4) volunteering at the school or serving on a school committee.52 As the figure indicates, the level of parental involvement in school activities decreases substantially as children get older.
- Sixty-eight percent of children in grades 3 through 5 had parents who were classified as highly involved in their children’s schools, meaning that they had been involved in three or more types of activities described above during the school year.
- Children in grades 6 through 8 and 9 through 12 had parents with substantially lower involvement levels, with 54 and 40 percent, respectively, classified as highly involved.
- Just over one-third (35 percent) of children in grades 9 through 12 had parents who were classified as having a low level of involvement, defined as having participated in one or no school activities.
Differences by Race and Hispanic Origin.53 Parents of white children were more likely than parents of black or Hispanic children to be highly involved in their children’s schools at each grade level (see Table EA 3.3).
Differences by Socioeconomic Status. Children living in nonpoor households were much more likely to have highly involved parents than children living in poor households, for all grade levels. Children whose mothers had higher levels of education had more highly involved parents than children whose mothers had lower education levels, at all grades (see Table EA 3.3).
Differences by Family Structure. Children in two-parent families were more likely than children in single-parent families to have parents who were highly involved in school activities. For example, among students in grades 3 through 5, 73 percent of children with two parents had parents who were highly involved in their schools, compared with 59 percent of children with one or no parent (see Table EA 3.3).
Among children in two-parent families, mothers were more likely to be highly involved than fathers. For example, in 1999, about half of students in grades 6 through 8 had highly involved mothers, but only one-quarter had highly involved fathers (see Table EA 3.3).
Children in single-mother families were somewhat less likely to have highly involved mothers (44 percent for grades 6 through 8) than comparable children in two-parent families (52 percent). However, children in single-father families were more likely to have a highly involved father (50 percent for grades 6 through 8) than comparable children in two-parent families (29 percent).
Differences by Mother’s Employment Status. Children in grades 3 through 8 and whose mothers worked part-time (less than 35 hours per week) had more highly involved parents than 3rd through 8th graders whose mothers either worked full-time (35 hours or more per week) or who were not in the labor force. For instance, 76 percent of children in grades 3 through 5 whose mothers worked part-time had parents who were classified as highly involved, compared with 66 percent of children whose mothers worked full-time and 69 percent of children whose mothers were not in the labor force (see Table EA 3.3). Among children in grades 9 through 12, those whose mothers were in the labor force had more involved parents than children whose mothers were not in the labor force (see Table EA 3.3).
50 Zill, N., & Nord, C.W. 1994. Running in Place: How American Families Are Faring in a Changing Economy and Individualistic Society. Washington, D.C.: Child Trends.
51 Nord, C.W., Brimhall, D., & West, J. 1997. Fathers’ Involvement in Their Children's Schools. NCES 98-091. Washington, D.C.: National Center for Education Statistics.
52 The level of involvement depends on the number of different activities reported by the parents, ranging from 0 or 1 (low involvement) to 2 (moderate involvement) to 3 or more activities (high involvement). Note that the number of times that the parent has been involved in each activity was not measured.
53 Estimates for whites and blacks exclude Hispanics of those races.
Table EA 3.3 Percentage of children in the United States whose parents are involved in their schools, by level of involvement,a grade, and child and family characteristics: 1999
|
Low Involvement |
Moderate Involvement | High Involvement | |||||||
|---|---|---|---|---|---|---|---|---|---|
| Grades 3-5 |
Grades 6-8 |
Grades 9-12 |
Grades 3-5 |
Grades 6-8 |
Grades 9-12 |
Grades 3-5 |
Grades 6-8 |
Grades 9-12 |
|
| Total | 13 | 21 | 35 | 19 | 26 | 26 | 68 | 54 | 40 |
| Gender | |||||||||
| Male | 14 | 21 | 36 | 19 | 26 | 25 | 67 | 54 | 39 |
| Female | 11 | 20 | 34 | 19 | 25 | 26 | 70 | 55 | 40 |
| Race and Hispanic origin | |||||||||
| Whiteb | 10 | 17 | 31 | 16 | 25 | 26 | 74 | 58 | 43 |
| Blackb | 19 | 27 | 40 | 24 | 28 | 26 | 58 | 45 | 34 |
| Hispanicc | 20 | 31 | 49 | 23 | 26 | 24 | 57 | 43 | 27 |
| Poverty status | |||||||||
| At or above poverty | 10 | 17 | 32 | 17 | 25 | 26 | 73 | 59 | 43 |
| Below poverty | 21 | 35 | 48 | 27 | 29 | 25 | 53 | 36 | 26 |
| Family structured | |||||||||
| Two parents | 10 | 17 | 31 | 17 | 24 | 25 | 73 | 59 | 45 |
| Mother | 14 | 21 | 36 | 18 | 27 | 24 | 68 | 52 | 41 |
| Father | 40 | 47 | 55 | 26 | 25 | 21 | 34 | 29 | 24 |
| One or no parente | 18 | 28 | 43 | 24 | 28 | 27 | 59 | 44 | 30 |
| Mother-only | 17 | 29 | 42 | 22 | 28 | 28 | 61 | 44 | 30 |
| Father-only | 18 | 22 | 38 | 25 | 28 | 25 | 57 | 50 | 37 |
| Nonparent guardian(s) | 24 | 26 | 51 | 32 | 31 | 28 | 44 | 44 | 21 |
| Mother's education levelf | |||||||||
| Less than high school | 27 | 38 | 58 | 30 | 28 | 26 | 44 | 34 | 16 |
| High school/GED | 17 | 24 | 41 | 21 | 28 | 25 | 62 | 48 | 35 |
| Vocational/technical or some college | 9 | 19 | 34 | 17 | 28 | 25 | 74 | 54 | 41 |
| College graduate | 6 | 11 | 20 | 13 | 18 | 27 | 81 | 71 | 53 |
| Mother's employment statusf | |||||||||
| 35 hours or more per week | 12 | 19 | 34 | 22 | 26 | 27 | 66 | 55 | 39 |
| Less than 35 hours per week | 8 | 18 | 30 | 16 | 24 | 24 | 76 | 59 | 46 |
| Not in labor force | 16 | 26 | 40 | 15 | 25 | 23 | 69 | 49 | 36 |
a Low involvement = involvement in 0 or 1 activity. Moderate involvement = involvement in 2 activities. High involvement = involvement in 3 or more activities . Possible activities include (1) attending general school meetings, (2) going to a regularly scheduled parent-teacher conference, (3) attending a school or class event, and (4) volunteering at the school or serving on a school committee.
b Non-Hispanic.
c Persons of Hispanic origin may be of any race.
d Parents include any combination of a biological, adoptive, step-, and foster mother and/or father. No parents in the household indicates that the child is living with nonparent guardians (e.g., grandparents).
e Estimates for single parent households may include involvement of other adults living in the household.
f Children without mothers in the home are not included in estimates of mother’s education or mother’s employment status. A mother is defined as a biological mother, adoptive mother, stepmother, foster mother, or female guardian (e.g., grandmother) who resides in the home with the child.
Note: Because of rounding, percents may not add to 100.
Source: U.S. Department of Education, National Center for Education Statistics, 1996 National Household Education Survey. Tabulated by U.S. Department of Education, National Center for Education Statistics (unpublished).
Figure EA 3.3 Percentage of parental involvementa in child’s school activities by grade level, in the United States: 1999
a Low involvement = involvement in 0 or 1 activity. Moderate involvement = involvement in 2 activities. High involvement = involvement in 3 or more activities. Possible activities include (1) attending general school meetings, (2) going to a regularly scheduled parent-teacher conference, (3) attending a school or class event, and (4) volunteering at the school or serving on a school committee.
Source: U.S. Department of Education, National Center for Education Statistics, 1996 National Household Education Survey. Tabulated by U.S. Department of Education, National Center for Education Statistics (unpublished).
EA 3.4 Difficulty Speaking English
Difficulty speaking English may limit children’s educational progress and their future employment prospects. Children may also need special instruction in school to improve their English. Difficulty speaking English is most common among immigrant children and U.S.-born children of immigrants. In the past three decades, the great majority of immigrants to the United States have come from Asia, Latin America, and the Caribbean.
In 1995, of the 6.7 million children ages 5 through 17 in the United States who spoke a language other than English at home, 2.4 million (36.5 percent) had difficulty speaking English. This represents a 3.8 percentage point increase from the proportion of similar children who had difficulty speaking English in 1979 (see Table EA 3.4). While the proportion of all children experiencing difficulty speaking English nearly doubled between 1979 and 1995, this group constituted only 5.1 percent of the total population of children ages 5 through 17 in 1995 (see Table EA 3.4).
Differences by Race and Hispanic Origin. Children of Hispanic or “other” ethnic origin are more likely than black or white children to have difficulty speaking English. For example, in 1995, 31.0 percent of all Hispanic children and 14.1 percent of children of “other” races (including Asians) had difficulty speaking English, compared with about 1 percent each of black and white children. These differences are due in part to the fact that Hispanic and Asian children are more likely than whites or blacks to speak another language in the home (see Table EA 3.4). Nearly one-third (31.8 percent) of non-Hispanic black children from homes where a language other than English was spoken had difficulty speaking English in 1995 (see Figure EA 3.4), an increase from 25.6 percent in 1979. Among Hispanic children from such homes, 41.9 percent had difficulty speaking English. Nineteen percent of non-Hispanic white children from homes where a language other than English was spoken had difficulty speaking English in 1995. The proportion was similarly low in 1979, 1989, and 1992 for these children.
Differences by Region. The percentage of children who speak another language at home varies substantially by geographic region, ranging from 5.9 percent in the Midwest to 26.4 percent in the West in 1995. Further, in the West more than 1 in 10 children have difficulty speaking English, compared to 2.3 percent in the Midwest.
Table EA 3.4 Difficulty speaking English: children ages 5 to 17 who speak a language other than English at home and who are reported to have difficulty speaking English,a by race and Hispanic origin and by region: Selected years, 1979-1995
| 1979 | 1989 | 1992 | 1995b | |||||
|---|---|---|---|---|---|---|---|---|
| Children who speak another language at home | ||||||||
| Number (in thousands) | 3,825 | 5,293 | 6,375 | 6,656 | ||||
| Percentage of children ages 5-17 | 8.5 | 12.6 | 14.2 | 14.1 | ||||
| Race and Hispanic origin | ||||||||
| White, non-Hispanic | 3.2 | 3.5 | 3.7 | 3.6 | ||||
| Black, non-Hispanic | 1.3 | 2.4 | 4.2 | 3.0 | ||||
| Hispanicc | 75.1 | 71.2 | 76.6 | 73.9 | ||||
| Other, non-Hispanic | 44.1 | 53.4 | 58.3 | 45.5 | ||||
| Regiond | ||||||||
| Northeast | 10.5 | 13.5 | 16.2 | 15.1 | ||||
| Midwest | 3.7 | 4.9 | 5.6 | 5.9 | ||||
| South | 6.8 | 10.7 | 11.1 | 11.7 | ||||
| West | 17.0 | 24.2 | 27.2 | 26.4 | ||||
| Children who have difficulty speaking English | ||||||||
| Number (in thousands) | 1,250 | 1,850 | 2,178 | 2,431 | ||||
| Percentage of children ages 5-17 | 2.8 | 4.4 | 4.9 | 5.1 | ||||
| Race and Hispanic origin | ||||||||
| White, non-Hispanic | 0.5 | 0.8 | 0.6 | 0.7 | ||||
| Black, non-Hispanic | 0.3 | 0.5 | 1.3 | 0.9 | ||||
| Hispanicc | 28.7 | 27.4 | 29.9 | 31.0 | ||||
| Other, non-Hispanic | 19.8 | 20.4 | 21.0 | 14.1 | ||||
| Regiond | ||||||||
| Northeast | 2.9 | 4.8 | 5.3 | 5.0 | ||||
| Midwest | 1.1 | 1.3 | 1.6 | 2.3 | ||||
| South | 2.2 | 3.8 | 3.5 | 3.4 | ||||
| West | 6.5 | 8.8 | 10.4 | 11.4 | ||||
| Percentage of those speaking another lanugage at home who have difficulty speaking English |
32.7 | 34.9 | 34.2 | 36.5 | ||||
| Race and Hispanic origin | ||||||||
| White, non-Hispanic | 17.3 | 22.6 | 17.2 | 19.0 | ||||
| Black, non-Hispanic | 25.6 | 22.5 | 31.0 | 31.8 | ||||
| Hispanicc | 38.2 | 38.5 | 39.0 | 41.9 | ||||
| Other, non-Hispanic | 44.9 | 38.1 | 36.1 | 31.1 | ||||
a Respondents were asked if the children in the household spoke a language other than English at home and how well they could speak English. Categories used for reporting were “Very well,” “Well,” “Not well,” and “Not at all.” All those reported to speak English less than “Very well” were considered to have difficulty speaking English.
b Numbers in this year may reflect changes in the Current Population Survey because of newly instituted computer-assisted interviewing techniques and/or because of the change in the population controls to the 1990 Census-based estimates, with adjustments.
c Persons of Hispanic origin may be of any race.
d Regions: Northeast includes CT, ME, MA, NH, NJ, NY, PA, RI, and VT. Midwest includes IL, IN, IA, KS, MI, MN, MO, NE, ND, OH, SD, and WI. South includes AL, AR, DE, DC FL, GA, KY, LA, MD, MS, NC, OK, SC, TN, TX, VA, and WV. West includes AK, AZ, CA, CO, HI, ID, MT, NV, NM, OR, UT, WA, and WY.
Source: National Center for Education Statistics. Tabulations based on October 1992 and 1995 and November 1979 and 1989
Current Population Surveys, U.S. Bureau of the Census. As published in Federal Interagency Forum on Child and Family Statistics, 1998, Table POP4.
Figure EA 3.4 Percentage of children ages 5 through 17 in the United States who speak a language other than English at home and who are reported to have difficulty speaking English,a by race and Hispanic origin:b 1995
a Parents were asked if their child spoke a language other than English at home and how well the child could speak English. Categories used for reporting were “Very well,” “Well,” “Not well,” and “Not at all.” All children who were reported to speak below the level of “Very well” were considered to have difficulty speaking English.
b Persons of Hispanic origin may be of any race.
c Non-Hispanic.
Source: National Center for Education Statistics. Tabulations based on October 1992 and 1995 and November 1979 and 1989 Current Population Surveys, U.S. Bureau of the Census. As published in Federal Interagency Forum on Child and Family Statistics, 1998, Table POP4.
EA 3.5 Student Computer Use
Computer literacy has become increasingly important for success in the workplace. Computers have become an essential tool for retrieving and manipulating information, for producing reports, and for communicating with colleagues. The extent to which children have access to computers, and the uses children make of computers, may be an indicator of how well prepared students will be to enter an increasingly technological workplace.
Tables EA 3.5.A and EA 3.5.B present data on the frequency of computer use by children at school and at home. A review of these tables reveals the following general trends:
- The percentage of 4th, 8th, and 12th graders who reported using a computer for schoolwork 1-2 times a week increased substantially between 1992 and 1998 (see Table EA 3.5.A). For example, 14 percent of 12th graders reported using a computer at school 1-2 times a week in 1992, compared with 28 percent in 1998.
Differences by Grade. Computer usage for schoolwork appears to increase as students enter the higher grades. For example, in 1998, 8 percent of 4th graders reported using a computer every day for schoolwork, while 21 percent of 12th graders reported the same.
Differences by Family Income.54 Data from the Current Population Survey indicate that students from high-income families were more likely than students from middle- and low-income families to report using a computer at home or at school (see Table EA 3.5.B).
However, family income appears to have a stronger impact on children’s exposure to computers at home than at school. For example, in 1997, the rate of computer usage at home was 15 percent for students in grades 7-12 from low-income families, compared with 79 percent for students from high-income families in the same grades. The corresponding computer usage rates at school were 68 percent and 75 percent for students in grades 7-12 from low-income and high-income families, respectively (see Table EA 3.5.B).
54 Low income is the bottom 20 percent of all family incomes; high income is the top 20 percent of all family incomes; and middle income is the 60 percent in between.
Table EA 3.5.A Percentage of students who reported using a computer for schoolwork, by grade and frequency of use: Selected years, 1992-1998
| Grade 4 | Grade 8 | Grade 12 | |||||||
|---|---|---|---|---|---|---|---|---|---|
| 1992 | 1994 | 1996 | 1992 | 1994 | 1996 | 1992 | 1994 | 1996 | |
| Frequency of use | |||||||||
| Never | 67 | 60 | 54 | 58 | 51 | 32 | 45 | 37 | 22 |
| Ever | 33 | 40 | 46 | 42 | 49 | 68 | 55 | 63 | 78 |
| 1–2 times a week | 17 | 21 | 20 | 14 | 16 | 25 | 14 | 18 | 28 |
| 1–2 times a month | 10 | 11 | 18 | 20 | 23 | 29 | 22 | 26 | 30 |
| Every day | 6 | 9 | 8 | 8 | 10 | 15 | 18 | 18 | 21 |
Source: U.S. Department of Education, National Center for Education Statistics, National Assessment of Educational Progress. 1988. Almanac: Writing, 1984 to 1996. As published in The Condition of Education 1998, p. 38. Some tabulations performed by Child Trends.
Table EA 3.5.B Percentage of students who reported using a computer at school or at home, by grade level and family income: October 1984, 1989, 1993,a and 1997
| Total | Low | Middle | High | |||||||||||||
| Location of Computer | 1984 | 1989 | 1993 | 1997 | 1984 | 1989 | 1993 | 1997 | 1984 | 1989 | 1993 | 1997 | 1984 | 1989 | 1993 | 1997 |
| Grades 1-6 | ||||||||||||||||
| At home | 11.8 | 16.1 | 23.0 | 41.3 | 2.5 | 3.2 | 3.9 | 12.4 | 9.7 | 13.1 | 18.0 | 36.4 | 24.4 | 33.6 | 48.5 | 74.6 |
| At school | 30.5 | 52.4 | 66.6 | 79.1 | 18.5 | 39.4 | 57.4 | 70.9 | 29.5 | 52.3 | 66.2 | 78.6 | 42.2 | 62.5 | 74.0 | 86.5 |
| At school or home | 36.2 | 56.9 | 70.7 | 83.8 | 20.0 | 40.5 | 58.1 | 71.9 | 34.5 | 56.3 | 69.5 | 82.8 | 53.0 | 70.9 | 82.4 | 95.0 |
| Grades 7-12 | ||||||||||||||||
| At home | 13.4 | 21.1 | 27.7 | 49.2 | 3.3 | 5.7 | 5.6 | 14.9 | 10.1 | 17.0 | 22.2 | 44.2 | 24.8 | 38.3 | 51.2 | 78.6 |
| At school | 28.9 | 43.0 | 57.0 | 73.5 | 20.0 | 36.7 | 49.0 | 67.6 | 28.4 | 42.6 | 57.3 | 74.1 | 34.1 | 47.2 | 60.7 | 75.4 |
| At school or home | 36.2 | 52.1 | 65.6 | 84.3 | 22.2 | 39.0 | 50.4 | 70.7 | 33.6 | 49.9 | 64.1 | 83.5 | 48.1 | 63.9 | 77.0 | 93.3 |
a Data for 1984, 1989, and 1993 are revised from previously published figures.
Note: Low income is the bottom 20 percent of all family incomes; high income is the top 20 percent of all family incomes; and middle income is the 60 percent in between.
Source: U.S. Department of Education, National Center for Education Statistics, National Assessment of Educational Progress. 1998. Almanac: Writing, 1984 to 1996. As published in The Condition of Education 1998, p. 38.
Figure EA 3.5.A Percentage of students who reported using a computer for schoolwork 1-2 times a week, by grade level: Selected years, 1992-1998
Source: U.S. Department of Education, National Center for Education Statistics, National Assessment of Educational
Progress. Almanac: Writing, 1998. As published in The Condition of Education 1998, p. 38. Some tabulations performed by
Child Trends.
Figure EA 3.5.B Percentage of students in grades 7-12 who reported using a computer at home, by family income: a 1984, 1989, 1993, and 1997
a Low income is the bottom 20 percent of all family incomes; high income is the top 20 percent of all family incomes; and middle income is the 60 percent in between.
Source: U.S. Department of Commerce, Bureau of the Census, October Current Population Surveys (CPS). As published in The Condition of Education 1998, Table 3-1.
Glossary
ABORTION. The Centers for Disease Control and Prevention’s (CDC) surveillance program counts legal abortions only. For surveillance purposes, legal abortion is defined as a procedure performed by a licensed physician or someone acting under the supervision of a licensed physician to induce the termination of a pregnancy.
ACTIVITY LIMITATION. Long-term reductions in activities resulting from a chronic disease or impairment. A person is classified as having an activity limitation if he or she reports (1) an inability to perform the major activity for a person in his or her age group, (2) being able to perform the major activity but being limited in the kind or amount of this activity, or (3) not being limited in the major activity but being limited in the kind or amount of other activities. For children under age 5, the major activity consists of ordinary play. For children ages 5 to 17, the major activity is attending school. Children are classified as being limited in a major activity if they are unable to engage in the major activity or are limited in the kind or amount of this activity (classifications (1) and (2) above).
AIDS CUMULATIVE TOTAL. The number of cases of AIDS in the United States reported through December 1998.
APGAR SCORE. A numerical expression of the physical condition of an infant shortly after delivery.
BINGE DRINKING. Five or more drinks in a row in the previous 2 weeks.
BIRTHWEIGHT . The first weight of the newborn obtained after birth. Low birthweight is defined as less than 2,500 grams or 5 pounds 8 ounces. Very low birthweight is defined as less than 1,500 grams or 3 pounds 4 ounces. Before 1979 low birthweight was defined as 2,500 grams or less and very low birthweight as 1,500 grams or less.
BODY MASS INDEX (BMI). A measure that adjusts body weight for height. It is calculated as weight in kilograms divided by height in meters squared. Sex- and age-specific cut points of BMI are used in this book in the definition of overweight.
CENTER-BASED PROGRAMS. Includes day care centers, Head Start programs, preschools, prekindergartens, and other early childhood programs.
CHRONIC DISEASE OR IMPAIRMENT. Has been apparent for at least 3 months or is a new condition that will ordinarily last for more than 3 months.
CHRONIC HEALTH CONDITIONS. Conditions that (a) were first noticed 3 months or more before the reference date of the interview; or (b) belong to a group of conditions (including heart diseases, diabetes, and others) that are considered chronic regardless of when they began.
CURRENT SMOKING. Smoking on 1 or more of the previous 30 days.
FAMILY. Refers to a group of two or more people related by birth, marriage, or adoption who reside together; the Census Bureau considers all such people as members of one family. Two or more people living in the same household who are related to one another, but are not related to the householder, form an “unrelated subfamily.” Beginning with the 1980 Current Population Survey, the Census Bureau excluded unrelated subfamilies from the count of families and unrelated subfamily members from the count of family members.
FERTILITY RATE. Computed by relating total births, regardless of age of mother, to women ages 15-44.
FOOD STAMPS. The Food Stamp act of 1977 was enacted for the purpose of increasing the food purchasing power of eligible households through the use of coupons to purchase food. The Food and Nutrition Service of the U.S. Department of Agriculture (USDA) administers the Food Stamp Program through state and local welfare offices. The Food Stamp Program is the major national income support program which provides benefits to all low-income and low-resource households regardless of household characteristics (e.g., sex, age, disability, etc.). The questions on participation in the Food Stamp Program in the March Current Population Survey were designed to identify households in which one or more of the current members received food stamps during the previous calendar year. Once a food stamp household was identified, a question was asked to determine the number of current household members covered by food stamps during the previous calendar year. Questions were also asked about the number of months food stamps were received during the previous calendar year and the total face value of all food stamps received during that period.
FOREIGN BORN. Includes both immigrants and illegal aliens.
FOSTER CARE. A living arrangement where a child resides outside his or her own home, under the case management and planning responsibility of a state child welfare agency. These living arrangements include relative and nonrelative foster homes, group homes, child-care facilities, emergency shelter care, supervised independent living, and nonfinalized adoptive homes.
FREQUENT SMOKING. Smoking on 20 or more of the previous 30 days.
FULL EMPLOYMENT. Having worked at least 50 weeks during the preceding year, working at least 35 hours per week for the majority of those weeks.
GESTATION. The interval between the first day of the mother’s last normal menstrual period and the date of birth.
HALLUCINOGENS. Substances such as LSD or other psychedelic drugs such as mescaline, peyote, psilocybin, or PCP.
HEALTHY BIRTH. 5-minute Apgar Score of 9 or above, birthweight of at least 2500 grams, gestational age of 37 weeks or more, and prenatal care in the first trimester.
HIGH SCHOOL GRADUATES. 12 years of school completed for 1971-1991 and high school diploma or equivalency certificate for 1992-1998.
HISPANIC ORIGIN. Persons of Hispanic origin may be of any race.
HOMICIDES. Includes death by legal intervention.
HOMICIDES DUE TO FIREARMS. Includes assault by handguns and all other and unspecified firearms.
HOUSEHOLDS. Consist of all people who occupy a housing unit. The Census Bureau regards a house, an apartment or other group of rooms, or a single room as a housing unit when it is occupied or intended for occupancy as separate living quarters: the occupants do not live and eat with any other people in the structure and there is direct access from the outside OR through a common hall. A household includes the related family members and all the unrelated people, if any, such as lodgers, foster children, wards, or employees who share the housing unit. The Census Bureau also counts a person living alone in a housing unit or a group of unrelated people sharing a housing unit as partners as a household. The count of households excludes group quarters.
HOUSING PROBLEMS. Includes physical problems, excessive cost burden, and over crowding.
ILLICIT DRUGS. Includes marijuana, cocaine (including crack), heroin, hallucinogens (including PCP), inhalants, and non-medical use psychotherapeutics.
INCOME. For each person in the sample 15 years old and over, the Current Population Survey asks questions on the amount of money income received in the preceding calendar year from each of the following sources: 1. Earnings. 2. Unemployment compensation. 3. Workers’ compensation. 4. Social Security. 5. Supplemental Security Income. 6. Public assistance. 7. Veterans’ payments. 8. Survivor benefits. 9. Disability benefits. 10. Pension or retirement income. 11. Interest. 12. Dividends. 13. Rents, royalties, and estates and trusts. 14. Educational assistance. 15. Alimony. 16. Child support. 17. Financial assistance from outside of the household. 18. Other income.
INDICATED. Sufficient reason for state to suspect that a child may have been maltreat-
ed or is at risk of maltreatment, but the allegation cannot be substantiated to
the level of evidence required by state law.
INFANT. Child under 1 year old.
INFANT DEATH. The death of a live-born child before his or her first birthday. Deaths in the first year of life may be further classified according to age as neonatal and postneonatal. Neonatal deaths are those that occur before the 28th day of life; postneonatal deaths are those that occur between 28 and 365 days of age.
INHALANTS. Substances such as glues and aerosols.
INJURY-RELATED DEATHS. Includes death from motor vehicle crashes, fires, burns, drowning, suffocation, and accidents caused by firearms and other explosive materials, as well as homicides, suicides, and other external causes of death.
KESSNER INDEX. A measure for the adequacy of prenatal care by assessing the timeli- ness and frequency with which prenatal care is received according to the gestational age of the baby.
LABOR FORCE. Persons are classified as in the labor force if they are employed, unemployed, or in the Armed Forces during the survey week. The “civilian labor force” includes all civilians classified as employed or unemployed. The file includes labor force data for civilians age 15 and over. However, the official definition of the civilian labor force is age 16 and over.
1. Employed. Employed persons comprise (1) all civilians who, during the survey week did any work at all as paid employees or in their own business or profession, or on their own farm, or who work 15 hours or more as unpaid workers on a farm or a business operated by a member of the family; and (2) all those who have jobs but who are not working because of illness, bad weather, vacation, or labor-management dispute, or because they are taking time off for personal reasons, whether or not they are seeking other jobs. These persons would have a Labor Force Status Recode (LFSR) of 1 or 2 respectively in character 145 of the person record which designates “at work” and “with a job, but not at work.” Each employed person is counted only once. Those persons who held more than one job are counted in the job at which they worked the greatest number of hours during the survey week. If they worked an equal number of hours at more than one job, they are counted at the job they held the longest.
2. Unemployed. Unemployed persons are those civilians who, during the survey week, have no employment but are available for work, and (1) have engaged in any specific job-seeking activity within the past 4 weeks such as registering at a public or private employment office, meeting with prospective employers, checking with friends or relatives, placing or answering advertisements, writing letters of application, or being on a union or professional register; (2) are waiting to be called back to a job from which they had been laid off; or (3) are waiting to report to a new wage or salary job with 30 days.
LATE PRENATAL CARE. Medical care provided after the 7th month of pregnancy to pregnant women.
LIMITATION OF ACTIVITY . In the National Health Interview Survey limitation of
activity refers to a long-term reduction in a person’s capacity to perform the
usual kind or amount of activities associated with his or her age group. Each
person is classified according to the extent to which his or her activities are lim-
ited, as follows:
- Persons unable to carry on major activity;
- Persons limited in the amount or kind of major activity performed;
- Persons not limited in major activity but otherwise limited; and
- Persons not limited in activity.
LIVE BIRTH. In the World Health Organization’s definition, also adopted by the United Nations and the National Center for Health Statistics, a live birth is the complete expulsion or extraction from its mother of a product of conception, irrespective of the duration of the pregnancy, which, after such separation, breathes or shows any other evidence of life such as heartbeat, umbilical cord pulsation, or definite movement of voluntary muscles, whether the umbilical cord has been cut or the placenta is attached. Each product of such a birth is considered live born.
LOW BIRTHWEIGHT. See BIRTHWEIGHT .
LOW INCOME. Total family income for the year of the interview below 130 percent of the federal poverty threshold, middle is between 130 and 350 percent, and high is over 350 percent.
MARITAL STATUS. Classified through self-reporting into the categories married and unmarried. The term married encompasses all married people including those separated from their spouses. Unmarried includes those who are single (never married), divorced, or widowed. The Abortion Surveillance Reports of the Centers for Disease Control and Prevention classified separated people as unmarried before 1978.
National estimates of births to unmarried women are based on two methods of determining marital status. For 1994 through 1996, birth certificates in 45 states and the District of Columbia included a question about the mother’s marital status. Beginning in 1997, California added a direct question to their birth certificate; thus in 1997, all but four states (Connecticut, Michigan, Nevada, and New York) included a direct question on their birth certificates. Nevada asks for the mother’s marital status through the electronic birth registration process, but this item is not included on certified or paper copies of the birth certificate.
In the three states that used inferential procedures to compile birth statistics by marital status in 1997, a birth is inferred as nonmarital if any of these factors, listed in priority-of-use order, is present: a paternity acknowledgment was received, the father’s name is missing, or the father’s and mother’s current surnames are different.
The marital status classification identifies four major categories in the Current Population Survey data: single (never married), married, widowed, and divorced. These terms refer to the marital status at the time of enumeration.
The category “married” is further divided into “married, civilian spouse present,” “married, Armed Forces spouse present,” “married, spouse absent,” “married, Armed Forces spouses absent,” and “separated.” A person is classified as “married, spouse present” if the husband or wife is reported as a member of the household even though he or she may be temporarily absent on business or on vacation, visiting, in a hospital, etc., at the time of the enumeration. Persons reported as “separated” included those with legal separations, those living apart with intentions of obtaining a divorce, and other persons permanently or temporarily estranged from their spouses because of marital discord.
For the purpose of this file, the group “other marital status” includes “widowed and divorced,” “separated,” and “other married, spouse absent.”
NEONATAL. Child under 28 days old.
OVERWEIGHT . Body mass index (BMI) at or above the sex- and age-specific 95th percentile. BMI cutoff points calculated at 6-month age intervals for children ages 6 through 11, and for adolescents ages 12 through 17.
PARENTAL INVOLVEMENT . Low parental involvement consists of 0-1 activity; moderate parental involvement consists of 2 activities; high parental involvement consists of 3 or more activities.
PARENTS’ EDUCATION LEVEL. Refers to the highest level of education completed by either parent.
PHYSICAL PROBLEMS. Include plumbing, heating, electricity, upkeep, and/or condition of apartment hallways.
POSITIVE BEHAVIOR. Good grades, always employed, sports, school clubs, and religious involvement.
POSTNEONATAL. Child who is 28 days to 1 year old.
POVERTY LEVEL. Poverty statistics are based on definitions originally developed by the Social Security Administration. These include a set of money income thresholds that vary by family size and composition. Families or individuals with income below their appropriate thresholds are classified as below the poverty level. These thresholds are updated annually by the U.S. Bureau of the Census to reflect changes in the Consumer Price Index for all urban consumers (CPI-U). For example, the average poverty threshold for a family of four was $15,569 in 1995 and $13,359 in 1990.
PREVALENCE. Prevalence is the number of cases of a disease, infected persons, or per-
sons with some other attribute present during a particular interval of time. It is
often expressed as a rate (for example, the prevalence of diabetes per 1,000 per-
sons during a year). See related Incidence.
RACE. Beginning in 1976, the federal government’s data systems classified individuals into the following racial groups: American Indian or Alaska Native, Asian or Pacific Islander, black, and white. Depending on the data source, the classification by race may be based on self-classification or on observation by an interviewer or other persons filling out the questionnaire. Starting in 1989, data from the National Vital Statistics System for newborn infants and fetal deaths are tabulated according to race of mother, and trend data by race shown in this report have been retabulated by race of mother for all years, beginning with 1980. Before 1980, data were tabulated by race of newborn and fetus according to race of both parents. If the parents were of different races and one parent was white, the child was classified according to the race of the other parent.
When neither parent was white, the child was classified according to father’s race, with one exception: if either parent was Hawaiian, the child was classified Hawaiian. Before 1964, the National Vital Statistics System classified all births for which race was unknown as white. Beginning in 1964 these births were classified according to information on the previous record.
In the National Health Interview Survey, children whose parents are of different races are classified according to the race of the mother. Vital event rates for the American Indian or Alaska Native population shown in this book are based on the total U.S. resident population of American Indians and Alaska Natives as enumerated by the U.S. Bureau of Census. In contrast, the Indian Health Service calculates vital event rates for this population based on U.S. Bureau of Census county data for American Indians and Alaska Natives who reside on or near reservations.
REGULAR DRINKING. Having an alcoholic beverage on more than two occasions in the previous 30 days.
RELATED CHILDREN. Related children in a family include own children and all other children in the household who are related to the householder by birth, marriage, or adoption. For each type of family unit identified in the Current Population Survey, the count of own children under 18 years old is limited to single (never married) children; however, “own children under 25” and “own children of any age,” include all children regardless of marital status. The totals include never-married children living away from home in college dormitories.
RISK BEHAVIORS. Regular alcohol abuse, regular binge drinking, regular tobacco use, marijuana use, cocaine use, sexual intercourse, physical fighting, weapon carrying, suicidal thoughts, and suicide attempt.
SERIOUS VIOLENT VICTIMIZATION. Being a victim of violent crime. (See VIOLENT CRIMES)
SINGLE STATUS. A man or woman who has never been married, or is divorced or widowed.
TWO PARENTS. Biological and adoptive parents only.
VERY LOW INCOME. Incomes at or below one-half the median income in a geographic area
VIOLENT CRIMES. Includes aggravated assaults, rape, and robbery.
WEAPON. Includes guns, knives, and clubs.
Bibliography
Abma, J.C., Chandra, A., Mosher, W.D., Peterson, L., Piccinino, L. 1997. Fertility, Family Planning and Women’s Health: New Data from the 1995 National Survey of Family Growth. Vital Health Statistics, 23(19).
Abma, J.C., Driscoll, A., and Moore, K. 1998. Young Women’s Control over First Intercourse: An Exploratory Analysis. Family Planning Perspectives, 30(1), 12-18.
Alan Guttmacher Institute. 1994. Sex and America’s Teenagers. New York: Alan Guttmacher Institute.
Alcohol, Drug Abuse, and Mental Health Administration. 1989. Report of the Secretary’s Task Force on Youth Suicide. Publication No. (ADM)899-1621. Washington, DC: U.S. Department of Health and Human Services. In Healthy People 2000: National Health Promotion and Disease Prevention Objectives, Conference Edition. U.S. Department of Health and Human Services.
Alexander, K.L., Entwisle, D.R., and Dauber, S.L. 1994. On the Success of Failure: A Reassessment of the Effects of Retention in the Primary Grades. New York: Cambridge University Press.
Allen, K., et al. 1993. Teenage Tobacco Use: Data Estimates from the Teenage Attitudes and Practices Survey, United States, 1989. Advance Data, 224, 1-20.
An, C., Haveman, R., and Wolfe, B. 1993. Teen Out-of-Wedlock Births and Welfare Receipt: The Role of Childhood Events and Economic Circumstances. Review of Economics and Statistics, 75.
Anderson, R.N., Kochanek, K.D., and Murphy, S.L. 1997. Report of Final Mortality Statistics, 1995. Monthly Vital Statistics Report, 45(11, Supp.2). Hyattsville, MD: National Center for Health Statistics.
Apgar, V., Holiday, D.A., James, L.S., Wiesbrot, I.N., and Berrien, C. 1953. Evaluation of the Newborn Infant-Second Report. Current Researchers in Anesthesia and Analgesia, 32, 260-267.
Bachman, J.G., Johnston, L.D., and O’Malley, P.M. 1980. Monitoring the Future: Questionnaire Results from the Nation’s High School Seniors. Ann Arbor, MI: Institute for Social Research, The University of Michigan.
Monitoring the Future: Questionnaire Results from the Nation’s High School Seniors, 1980-1997. Ann Arbor, MI: Institute for Social Research, The University of Michigan.
Monitoring the Future: Questionnaire Results from the Nation’s High School Seniors, 1982-1996. Ann Arbor, MI: Institute for Social Research, The University of Michigan.
Monitoring the Future: Questionnaire Responses from the Nation’s High School Seniors, Descriptive Results. Ann Arbor, MI: Institute for Social Research, The University of Michigan.
Monitoring the Future: Questionnaire Responses from the Nation’s High School Seniors, 1997.
Benson, V., and Marono, M.A. 1996. Current Estimates from the National Health Interview Survey, 1995. Vital Health Statistics, 10(199). Hyattsville, MD: National Center for Health Statistics.
Bianchi, S.M. 1995. Changing Economic Roles of Women and Men. In State of the Union: America in the 1990s, Volume 1 (Reynolds Farley, ed.). New York: Russell Sage Foundation.
Blackman, T., Evason, E., Melaugh, M., and Woods, R. 1989. Housing and Health: A Case Study of Two Areas in West Belfast. Journal of Social Policy, 18 (1).
Blau, F., and Grossberg, A. 1992. Maternal Labor Supply and Children’s Cognitive Development. Review of Economics and Statistics, 74.
Blanken, A.J. 1993. Measuring Use of Alcohol and Other Drugs among Adolescents. Public Health Reports, Journal of the U.S. Public Health Service, 108.
Brooks-Gunn, J., Duncan, G., Klebanov, P., and Sealand, N. 1994. Do Neighbors Influence Child and Adolescent Behavior? American Journal of Sociology, 99(2), 353-395. Brown, B. 1996. Who Are America’s Disconnected Youth? Report prepared for the American Enterprise Institute.
Campbell, J.R., Voelkl, K.E., and Donahue, P.L. 1997. NAEP 1996 Trends in Academic Progress. NCES 97-985. Washington, DC: National Center for Education Statistics. 1993. NAEP 1992 Trends in Academic Progress. Report No. 23-TR01. Washington, DC: National Center for Education Statistics.
Case Definitions for Public Health Surveillance. 1990. Morbidity and Mortality Weekly Report, 39, 1-43.
Casper, L.M. 1997. Who’s Minding Our Preschoolers?. Current Population Reports, 1994 (Fall, Update), Supplementary Tables, PPL-81. Washington, DC: U.S. Bureau of the Census.
Casper, L.M., and Bass, L.E.. 1998. Voting and Registration in the Election of November, 1996. Current Population Reports, P20-504 and PPL-89. Washington, DC: U.S. Bureau of the Census.
Centers for Disease Control and Prevention. National Center for Health Statistics. 1974. Summary Report of Final Natality Statistics, 1970. Monthly Vital Statistics Report, 22 (12. Supp.). Rockville, MD.
Division of STD Prevention. 1987. STD Statistics, 136. Washington, DC: Public Health Service.
National Center for Health Statistics. 1987. Advance Report of Final Natality Statistics. Monthly Vital Statistics Report, 31(8. Supp.).
National Center for Health Statistics. 1988. Advance Report of Final Natality Statistics,. 1985. Monthly Vital Statistics Report, 36(4. Supp.). Hyattsville, MD.
1990-1991 Youth Risk Behavior Surveillance System. In Chronic Disease and Health, Promotion Reporting Morbidity and Mortality Weekly Report.
1993. 1992 National Health Interview Survey—Youth Risk Behavior Supplement.
Division of STD/HIV Prevention. 1993 (December). Sexually Transmitted Disease Surveillance, 1993. U.S. Department of Health and Human Services, Public Health Service. Atlanta: Centers for Disease Control and Prevention.
1993. Cigarette Smoking—Attributable Mortality and Years of Potential Life Lost- United States, 1990. Morbidity and Mortality Weekly Report, 42(33), 645-649.
National Center for Health Statistics. 1994. Health, United States, 1993. Hyattsville, MD.
National Center for Health Statistics. 1994. Vital Statistics of the United States,1990,1985,1980,1970.Vol.1, Natality. Washington DC: Public Health Service.
National Center for Health Statistics. 1996. Vital Statistics of the United States, 1991. Vol. II, Mortality, Part A. Washington, DC: Public Health Service.
Division of STD Prevention. 1996. STD Statistics, 135. Washington, DC: Public Health Service.
1997. Office of Communication, Division of Media Relations. Facts about Childhood Immunization Initiative.
Division of STD Prevention. 1997. Sexually Transmitted Disease Surveillance, 1996. U.S. Department of Health and Human Services, Public Health Service. Atlanta: Centers for Disease Control.
1998 (November). Vaccination Coverage by Race/Ethnicity and Pvoerty Level among Children Aged 19-35 Months—United States, 1997. Morbidity and Mortality Weekly Report, 47(44).
National Center for Health Statistics. 1998. Health, United States, 1998. Hyattsville, MD.
National Center for Health Statistics. 1998. Health, United States, 1998, With Socioeconomic Status and Health Chartbook. Hyattsville, MD.
1998. Tobacco Use among Racial/Ethnic Minority Groups, African Americans, American Indians, and Alaska Natives, Asian Americans and Pacific Islanders, Hispanics: A Report to the Surgeon General. Morbidity and Mortality Weekly Report, 47(RR-18).
1998. Suicide among Black Youths—United States, 1980-1995. Morbidity and Mortality Weekly Report, 47(10).
Division of STD Prevention. 1999. Sexually transmitted Disease Surveillance, 1998. US Department of Health and Human Services, Public Health Service. Atlanta: Centers for Disease Control and Prevention.
1999. Targeting Tobacco Use: The Nation’s Leading Cause of Death, At A Glance. Atlanta, GA: Centers for Disease Control.
National Center for Health Statistics and National Immunization Program. 2000. Health, United States, 2000.
National Center for Health Statistics. Division of Vital Statistics. 2000. National Vital Statistics Reports, 48(11).
Childress, J. 1998. Art Education Pays Off. Education New York, 2 (5).
Council of Economic Advisors, 1997. Economic Report of the President, 1997.
Curtin, S.C., and Martin, J.A. 2000. Births: Preliminary Data for 1999. National Vital Statistics Report, 48(14). Hyattsville, MD: National Center for Health Statistics.
Cvetkovitch, G., and Grote, B. 1980. Psychological Development and the Social Problem of Teenage Illegitimacy. In C. Chilman (Ed.), Adolescent Pregnancy and Childbearing: Findings from Research. Washington, DC: U.S. Department of Health and Human Services.
Difranza, J.R. and Tye, J.B. 1990. Who Profits from Tobacco Sales to Children? Journal of the American Medical Association, 263(20), 2784-2787.
Duncan, G., and Brooks-Gunn, J. 1997. Income Effects across the Life Span: Integration and Interpretation. In The Consequences of Growing Up Poor (G. Duncan and J. Brooks-Gunn, eds.). New York: Russell Sage Press
Duncan, G.H., and Yeung, W.J. 1995. Extent and Consequences of Welfare Dependence Among America's Children, Children and Youth Services Review, 17, No. 1/2.
Ekstron, R., Goertz, M., Pollack, J., and Rock, D. 1987. Who Drops out of High School and Why? Findings from a National Study. In G. Natriello (ed.), School Dropouts: Patterns and Policies. New York: Teachers College Press.
Federal Interagency Forum on Child and Family Statistics. 1998. America’s Children: Key National Indicators of Well-Being, 1998. Washington, DC: U.S. Government Printing Office.
1999. America’s Children: Key National Indicators of Well-Being, 1999. Washington, DC: U.S. Government Printing Office.
2000. America’s Children: Key National Indicators of Well-Being, 2000. Washington, DC: U.S. Government Printing Office.
Fingerhut, L.A., Annest J.L., Baker, S.P., Kochanek, K.D., and McLoughlin, E. 1996. Injury Mortality among Children and Teenagers in the United States, 1993. Injury Prevention, 2.
Forrest, J.D., and Singh, S. 1990. The Sexual and Reproductive Behavior of American Women, 1982-1988. Family Planning Perspectives, 22(5),206-214.
Gaudiosi, J. 1999. Estimates of Children in Foster Care for 1997 and 1998. Department of Health and Human Services, Administration for Children and Families, Children's Bureau.
Gfoerer, J., Wright, D., and Kopstein, A. 1997. Prevalence of Youth Substance Use: The Impact of Methodological Differences between Two National Surveys. Drug and Alcohol Dependence, 47, 19-30.
Gottschalk, P. 1992. The Intergenerational Transmission of Welfare Participation: Facts and Possible Causes, Journal of Policy Analysis and Management, Spring.
1996. Is the Correlation in Welfare Participation across Generations Spurious? Journal of Public Economics, 63.
Grant, B.R., and Dawson, D.A. Age at Onset of Alcohol Use and Its Association with DSM-IV Alcohol Abuse and Dependence: Results from the National Longitudinal Alcohol Epidemiological Survey. Journal of Substance Abuse, 9, 103-110.
Hawes, D. 1996. Who Knows Best: A Program to Stimulate Parent –Teen Interaction. School Counselor, 44(2), 115-121.
Hayes, C.D., Palmer, J.L., and Zaslow, M.J. (eds.). 1990. Who Cares for America’s Children? Child Care Policy for the 1990s. Washington, DC: National Academy Press.
Hawkins, J.D., Catalano, R.F., and Miller, J.Y. 1992. Risk and Protective Factors for Alcohol and Other Drug Problems in Adolescence and Early Adulthood: Implications for Substance Abuse Prevention. Psychological Bulletin, 112(1), 64-105.
Henshaw, S.K. 1998. U.S. Teenage Pregnancy Statistics. New York: Alan Guttmacher Institute.
Hoyert, D.L., Kochanek, K.D. and Murphy, S.L. 1998. Deaths: Final Data for 1997. National Vital Statistics Reports, 47(19). Hyattsville, MD: National Center for Health Statistics.
Ikeda, R.M., Gorwitz, R., James, S.P., Powell, K.E., and Mercy, J.A. 1997. Fatal Firearm Injuries in the United States, 1962-1994. Violence Surveillance Summary Series, (3). Atlanta: Centers for Disease Control and Prevention, National Center for Injury Prevention and Control.
Johnson, R.A., Hoffmann, J.P., and Gerstein, D.R. 1996. The Relationship Between Family Structure and Adolescent Substance Abuse Use. Rockville, MD: Substance Abuse and Mental Health Services Administration, Office of Applied Studies.
Johnston, L.D., Bachman, J.G., and O’Malley, P.M. Monitoring the Future: Questionnaire Responses from the Nation’s High School Seniors, 1976-1997. Ann Arbor, MI: Institute for Social Research, the University of Michigan.
Monitoring the Future: Questionnaire Responses from the Nation’s High School Seniors, 1980-1997 (1997 prepublication tables). Ann Arbor, MI: Institute for Social Research, the University of Michigan.
2000. Monitoring the Future Study: Questionnaire Responses from the Naiton’s High School Seniors. Ann Arbor, MI: Institute for Social Research, the University of Michigan.
Johnston, L.D., O’Malley, P.M., and Bachman, J.G. 1998. National Survey Results on Drug Abuse from the Monitoring the Future Study, 1975-1997. Rockville, MD: National Institutes of Health. National Institute on Drug Abuse, NIH Pub. No. 98-4345, Institute for Social Research, The University of Michigan.
Kalmuss, D., and Namerow, P.B. 1992. The Mediators of Educational Attainment among Early
Childbearers. Unpublished manuscript. Columbia University, Center for Population
and Family Health.
Kane, E., and Frankonis, E. 1998 (May). Arts Education in the New Millennium. Education New York, 2(5).
Kann, L., Kinchen, S.A., Williams, B.I., Ross, J.G., Lowry, R., Hill, C.V., Grunbaum, J.A., Blumson, P.S., Collins, J.L., Kolbe, L.J., and State and Local YRBSS Coordinators. Youth Risk Behavior Surveillance—United States, 1997. In CDC Surveillance Summaries, 1998 (August), Morbidity and Mortality Weekly Report, 47(SS-3).
Kann, L., Warren, C.W., Harris, W.A., Collins, J.L., Williams, B.I., Ross, J.G., Kolbe, L.J. Youth Risk Behavior Surveillance—United States, 1995. IN CDC Surveillance Summaries, 1996 (September). Morbidity and Mortality Weekly Report, 45(SS-4).
Kaster, L.M., Selwitz, R.H., Oldakowski, R.J., Brunelle, J.A., Winn, D.M., and Brown, L.J. 1996. Coronal Caries in the Primary and Permanent Dentition of Children and Adolescents 1-17 Years of Age: United States 1988-1991. Journal of Dental Research, 75(Special Issues), 631-641.
Kost, K., Forrest, J.D. 1992. American Women’s Sexual Behavior and Exposure to Risk of Sexually Transmitted Disease. Family Planning Perspectives, 24(6).
Koyle, P., Jensen., Olsen, J., and Cundick, B. 1989. Comparison of Sexual Behaviors among Adolescents Having an Early, Middle and Late First Intercourse Experience. Youth and Society, 20(4), 461-475.
Kramorow, E., Lemtner, H., Rooks, R., Weeks, J., and Saydah, S. 1999. Health and Aging Chartbook, Health, United States, 1999. Hyattsville, MD: National Center for Health Statistics.
Lamb, M.E. 1997. Fathers and Child Development: An Introductory Overview and Guide. In M.E. Lamb (Ed.), The Role of the Father in Child Development (pp. 1-18). New York: John Wiley and Sons, Inc.
Lewit, E.M. and Kerrebrock, N. 1998. Child Indicators: Dental Health. The Future of Children, 8(1), 133-142.
Life Sciences Research Office and American Institute of Nutrition. 1990. Core Indicators of Nutritional State for Difficult to Sample Populations. Bethesda, MD: Life Sciences Research Office and American Institute of Nutrition.
Lowenstein, G., and Furstenberg, F.F. 1991. Is Teenage Sexual Behavior Rational? Journal ofApplied Social Psychology, 21(12), 957-986.
MacDorman, M.F. and Atkinson, J.A. 1997. Infant Mortality Statistics from the Linked Birth/Infant Death Data Sets: 1995 Period Data. Monthly Vital Statistics Report, 46(6, Supp. 2). Hyattsville, MD: National Center for Health Statistics.
1998. Infant Mortality Statistics from the 1996 Period Linked Birth/Infant Death Data Set. Monthly Vital Statistics Report, 46 (12, Supp.). Hyattsville, MD: National Center for Health Statistics.
1999. Infant Mortality Statistics from the 1997 Period Linked Birth/Infant Death Data Set. Monthly Vital Statistics Report, 47(23). Hyattsville, MD: National Center for Health Statistics.
Manlove, J. 1998. The Influence of High School Dropout and School Disengagement on the Risk of School-Age Pregnancy. Journal of Research on Adolescence, 8.
Mannino, D.M., Homa, D.M., Pertowski, C.A., Ashizawa, A., Nixon, L.L., Johnson, C.A., Ball, L.B., Jack, E., and Kang, D.S. 1998. Surveillance for Asthma: United States, 1960-1995. Morbidity and Mortality Weekly Report, 47 (SS-1).
Marin, M.M., Chan, N., and Raymond, J. 1987. Consequences of the Process of Transition to Adulthood for Adult Economic Well Being. In R.G. Corin (ed.) Research in the Sociology of Education and Socialization. Greenwich, CT: JAI.
Martin, J.A. and Park, M.M. Trends in twin and triplet births: 1980-1997. National Vital Statistics Reports, 47(24). Hyattsville, MD: National Center for Health Statistics.
Mathews, T.J., Curtin, S.C., and MacDorman, M.F. 2000. Infant Mortality Statistics from the 1998 Period Linked Birth/Infant Death Data Set. National Vital Statistics Report, 48(12). Hyattsville, MD: National Center for Health Statistics.
Mathews, T.J., Ventura, S.J., Curtin, S.C., and Martin, J.A. 1998. Births of Hispanic Origin, 1989-1995. Monthly Vital Statistics Report, 46(6).
Maynard, R.A.(ed). 1996. Kids Having Kids: A Robin Hood Foundation Special Report on the Costs of Adolescent Childbearing. New York: The Robin Hood Foundation.
McMillen, M., and Kaufman, P. 1994. Dropout Rates in the United States: 1994. NCES 96-863. Washington, DC: U.S. Department of Education, National Center for Education Statistics.
Measuring the Health Behavior of Adolescents: The Youth Risk Behavior Surveillance System and Recent Reports on High-Risk Adolescents. 1993. Public Health Reports, 108.
Monitoring the Future: Questionnaire Responses from the Nation’s High School Seniors. Ann Arbor, MI: Institute for Social Research, The University of Michigan.
Monitoring the Future Study. (1997, December). Cigarette Smoking May Have Peaked among Younger Teens. (Press Release). Monitoring the Future Study, The University of Michigan.
Moore, K.A. 1993. Teenage Childbearing: A Pragmatic Perspective. Washington, DC: Child Trends, Inc.
Moore, K.A., and Glei, D.A. 1994. Taking the Plunge: An Examination of Positive Youth Development. Journal of Adolescent Research, 10(11).
Moore, K.A. Myers, D.E., Morrison, D.R., Nord, C.W., Brown, B.V., and Edmonston, B. 1993. Age of First Childbirth and Later Poverty. Journal of Research on Adolescence, 3(4).
Moore, K.A., Morrison, D.R., Nord, C.W., and Blumenthal,C. 1993. The Consequences of Early Childbearing in the 1980s. Unpublished tables. Washington, DC: Child Trends.
Moore, K.A., and Peterson, J.L. 1989. The Consequences of Teenage Pregnancy. Final Report to NICHD and ASPE/HHS, Grant No. HD 21537.
Moore, K., Zaslow, M.J., Coiro, M., Miller, S.M., and Magenheim, E. 1996. The Jobs Evaluation: How Are They Faring? AFDC Families with Preschool-Aged Children in Atlanta at the Outset of the JOBS Evaluation. Washington, DC: U.S. Department of Health and Human Services, Office of the Assistant Secretary for Planning and Evaluation.
Morrison, D.R. 1994. Healthy Birth Index. Final Report. Submitted to the Annie E. Casey Foundation, Kids Court Indicator Development Project. Washington, DC: Child Trends.
Murphy, S.L. 1999. Deaths: Final Data for 1998. National Vital Statistics Report, 48(11). Hyattsville, MD: National Center for Health Statistics.
National Center for Education Statistics, National Assessment of Educational Progress (NAEP), 1997 Arts Assessment. As published in Persky, H.R., Sandene, B.A. and Askew, J.M. 1999. The NAEP 1997 Arts Report Card: Eighth-Grade Findings from the National Assessment of Educational Progress. NCES 1999-486. Washington, DC: National Center for Education Statistics.
National Commission on Children. 1991. Beyond Rhetoric: A New American Agenda for Children and Families. Final Report on the National Commission on Children. Washington, DC: U.S. Government Printing Office.
National Education Goals Panel. 1994. The National Education Goals Report: Building a Nation of Learners, 1994. Washington, DC: U.S. Government Printing Office.
1997. The National Education Goals Report: Building a Nation of Learners, 1997. Washington, DC: U.S. Government Printing Office.
National Institute on Drug Abuse. National Trends in Drug Use and Related Factors among American High School Students and Young Adults, 1976-1986. DHHS Pub. No. (ADM) 87-1535. Washington, DC: U.S. Department of Health and Human Services.
Newcomer, S.F., Gilbert, M. and Udry, J.R. 1980. Perceived and Actual Same-Sex Behavior as Determinants of Adolescent Sexual Behavior. Paper Presented at the Annual Meeting of the American Psychological Association, Montreal, Canada. As cited in National Commission on Children, 1991.
Nord, C. W. 1996. What is Causing School Enrollment to Increase? A Demographic Explanation. Rockville, MD.
Nord, C.W., Brimhall, D., and West, J. 1997. Fathers’ Involvement in Their Children's Schools. NCES 98-091. Washington, DC: National Center for Education Statistics.
Nord, C.W., & Griffin, J.A. 1999. Education Profile of 3- to 8- Year-Old Children of Immigrants. National Research Council and Institute of Medicine, Children of Immigrants: Health, Adjustment, and Public Assistance. Washington, DC: Committee of the Health and Adjustment of Immigrant Children and Families.
Parker, S., Greer, S., and Zuckerman, B. 1988. Double Jeopardy: The Impact of Poverty on Early Childhood Development. Pediatric Clinics of North America, 35.
Persky, H.R., Sandene, B.A. and Askew, J.M. 1999. National Center for Education Statistics, National Assessment of Educational Progress (NAEP), 1997 Arts Assessment. The NAEP 1997 Arts Report Card: Eighth-Grade Findings from the National Assessment of Educational Progress. NCES 1999-486. Washington, DC: National Center for Education Statistics.
Peters, K.D., Kochanek, K.D., and Murphy, S.L. 1998. 1996 United States Deaths and Rates per 100,000: All Injury. National Vital Statistics Report, 47(9). National Center for Injury Control and Prevention, Centers for Disease Control.
Peters, K.D., Kochanek, K.D., and Murphy, S.L. 1998. Deaths: Final Data for 1996. Monthly Vital Statistics Report, 49(9). Hyattsville, MD: National Center for Health Statistics.
Petraitis, J., and Flay, B.R. 1995. Reviewing Theories of Adolescent Substance Use: Organizing
Pieces in the Puzzle. Psychological Bulletin, 117(1), 67-86.
Pilcher, J., and Huffcut, A. 1996. Effects of Sleep Deprivation on Performance: A Meta-analysis. Sleep, 19(4), 318-326.
Public Health Service. 1993. Measuring the Health Behavior of Adolescents: The Youth Risk Behavior Surveillance System and Recent Public Health Reports on High Risk Adolescents. Public Health Reports 108(Supp. 1). Rockville, MD.
Resnick, M.D., et al. 1997. Protecting Adolescents from Harm: Findings from the National Longitudinal Study on Adolescent Health. Journal of the American Medical Association, 278(10), 823-832.
Peterson, L.S. 1995. Contraceptive Use in the United States: 1982-1990. Advance Data, No. 260. Division of Vital Statistics, National Center for Health Statistics, Centers for Disease Control and Prevention. Data from the National Survey of Family Growth.
Robinson, J.P., and Bianchi, S. 1997. The Children’s Hours. American Demographics, 12.
Scoon-Rogers, L. 1999. Child Support for Custodial Mothers and Fathers, 1995. Current Population Reports, P-60, (196), at: http://www.census.gov/hhes/www/childsupport/cs95.html.
Simpson, G., Bloom, B., Cohen, R.A., and Parsons, P.E. 1997. Access to Health Care, Part 1: Children. Vital and Health Statistics, 10(196). National Center for Health Statistics.
Singh, G.K., Kochanek, K.D., and MacDorman, M.F. 1994. Advance Report of Final Mortality Statistics, 1994. Monthly Vital Statistics Report, 45 (3 Supp.). Hyattsville, MD: National Center for Health Statistics.
Singh, S. and Darroch, J.E. 2000. Adolescent Pregnancy and Childbearing: Levels and Trends in Developed Countries. Family Planning Perspectives, 32(1), 14-23.
Snyder. H. 2000. Juvenile Violent Crime Index Arrest Rates by Gender and Age Group: 1980-1998. Pittsburg, PA: National Center for Juvenile Justice.
Society for Adolescent Medicine. 1991. Position Paper on Reproductive Health Care for Adolescents. Journal for Adolescent Health, 12, 649-661.
Sonenstein, F.L., Stewart, K., Lindberg, L.D., Pernas M., and Williams, S. 1997. Involving Males in Preventing Teen Pregnancy: A Guide for Program Planners. Washington, DC: The Urban Institute.
Substance Abuse and Mental Health Services Administration. 1996. Preliminary Estimates from the 1995 National Household Survey on Drug Abuse. Rockville, MD: Public Health Service.
Tatara, T. 1995. Estimates of Children in Foster Care for Years 1982-1996. VCIS Research Notes, 11.
1997. Estimates of Children in Foster Care for Years 1982-1996. VCIS Research Notes, 13.
Troiano, R.P., Flegal, K.M., Kuczmarski, R.J., Campbell, S.M., and Johnson, C.L. 1995. Overweight Prevalence and Trends for Children and Adolescents: The National Health and Nutrition Examination Surveys, 1963-1991. Archives of Pediatrics and Adolescent Medicine, 149 (October).
United Nations: Demographic Yearbook 1996. New York.
Update: Alcohol Related Traffic Crashes and Fatalities among Youth and Young Adults—United States, 1982-1994. Morbidity and Mortality Weekly Report, 44, 869-874.
Johnston, L.D., Bachman, J.G., and O’Malley, P.M. Monitoring the Future: Questionnaire Responses from the Nation’s High School Seniors. 1980-1997 (1997 prepublication tables). Ann Arbor, MI: Institute for Social Research, the University of Michigan.
U.S. Bureau of the Census, Current Population Report, Series P-20, Nos. 253, 293, 322, 344, 370, 405, 410, 414, 440, 453, 461, 466, 468, 478, 484, 486, 491, 504, 506u, 514u.
Current Population Reports, Series P-23, 117
Current Population Reports, Series P-25, No. 311, No. 519, No. 917, No. 1095, No. 1130.
Current Population Reports, Series P-60.
Current Population Reports, Series P-70, Nos. 9, 20, 30, 36, and 53.
Current Population Reports, Series PPL24-RV.
Current Population Reports, The Asian and Pacific Islander Population in the United States (Update), Series PPL.
Child Support and Alimony, Series P-23.
National Origin and Language, PC(2-1A), 1970. Washington, DC U.S. Government Printing Office.
1980 Census of the Population, Detailed Population Characteristics, PC-80-1-D1-A, United States Summary.
1990 Census of the Population, Social and Economic Characteristics, CP-2-1, United States Summary.
The Foreign-Born Population in the U.S., 1990, CP-3-1, and 1990 STF-3A census files.
1996. Population estimates for 1982-1990. Statistical Abstract of the United States. Washington DC: U.S. Government Printing Office.
1997. Current Population Reports, P60-197. Money Income in the United States: 1996, With Separate Data on Valuation of Noncash Benefits, Table 7. Washington, DC: U.S. Government Printing Office
Current Population Survey. April, 1995, September, 1996, and April, 1997. Food Security Supplement. As published in America’s Children: Key National Indicators of Well-Being, 1999. Federal Interagency Forum on Child and Family Statistics. Washington, DC: U.S. Government Printing Office.
Paper Listing, Series PPL-58, Series PPL-92, The Foreign-Born Population, 1995, 1996, 1997.
Current Population Survey, Annual Demographic Survey: March Supplement. Council of Economic Advisors, 1997. Economic Report of the President, 1997.
Annual Demographic Survey: March Supplement, Council of Economic Advisors, 1997.
Households and Family Characteristics: 1998, Current Population Reports, Series P-20,. Nos. 366, 447, 458, 467, 477, 483, 488, 495, 509, and 515. Washington DC: Government Printing Office.
Housing and Household Economics Statistics Division. Analyses from the March, Current Population Surveys, Health Insurance Coverage: 1998.
1998. Current Population Reports, Money Income in the United States. 1997. P60-200. Washington DC: U.S. Government Printing Office.
Population Estimates for the U.S., Regions, and States by Selected Age Groups and Sex: Annual Time Series, July 1, 1990 to July1, 1999. Population Estimates Program, Population Division. Washington DC.
1999. Current Population Survey, Annual Demographic Survey: March Supplement.
1999. Geographic Mobility: March 1996 to March 1999 (Update). Current Population Reports, Series P-20, no.531.
U.S. Bureau of Justice Statistics, National Crime Victimization Survey, 1980-1997. As published in Federal Interagency Forum on Child and Family Statistics.
U.S. Congress, House Ways and Means Committee, 1994 and 1996, Green Book.
U.S. Department of Education, National Center for Education Statistics, National Assessment of Educational Progress (NAEP), 1990, 1992, 1994, and 1996 Data Almanacs.
National Center for Education Statistics, 1991, 1993, 1995, and 1996 NationalHousehold Education Surveys. Washington, DC: U.S. Government Printing Office.
National Center for Education Statistics. 1994. Youth Indicators 1993: Trends in the Well-Being of American Youth. Washington, DC: U.S. Government Printing Office.
National Center for Education Statistics. 1996. The Condition of Education 1996. Washington, DC: U.S. Government Printing Office.
National Center for Education Statistics, Dropout Rates in the United States: 1996.
National Center for Education Statistics, Dropout Rates in the United States: 1997.
National Center for Education Statistics. 1997. Pursuing Excellence: A Study of U.S. Eighth-Grade Mathematics and Science Teaching, Learning, Curriculum, and Achievement in International Context. No. 97-198. Washington, DC: U.S. Government Printing Office.
National Center for Education Statistics, National Assessment of Educational Progress. 1998. Almanac: Writing 1984-1996. Washington, DC: U.S. Government Printing Office.
National Center for Education Statistics, Dropout Rates in the United States: 1998.
National Center for Education Statistics. 1998. The Condition of Education 1997. Washington, DC: U.S. Government Printing Office.
National Center for Education Statistics. 1999. The Condition of Education: 1998. NCES 98-013. Washington, DC: U.S. Government Printing Office.
U.S. Department of Health and Human Services. 1996. Physical Activity and Health: A Report of the Surgeon General. Atlanta: U.S. Department of Health and Human Service, Centers for Disease Control and Prevention, National Center for Chronic Disease Prevention and Health Promotion.
(1997, October). Vaccination Levels for Minority Children in the U.S. at All-Time High.
(Press Release).
HHS News. (1997, May). Teen Sex Down, New Study Shows. Secretary Shalala Announces New Teen Pregnancy Prevention Grant Programs. (Press Release). Washington, DC: HHS, National Center for Health Statistics.
1998. Administration on Children and Families. Child Support Collections Reach New Records. (Press Release). Washington, DC: HHS, National Center for Health Statistics.
Press Office. 1998 (May). HHS Targets Efforts on Asthma. Fact Sheet. Healthy People 2000: National Health Promotion and Disease Prevention Objectives, Conference Edition.
Children’s Bureau. 2000. Child Maltreatment, 1998: Reports from the States to the National Child Abuse and Neglect Data System. Washington, DC: U.S. Government Printing Office.
U.S. Department of Housing and Urban Development, 1997, Current Housing Reports H150/95RV, American Housing Survey for the United States in 1995, Washington, DC
U.S. Department of Transportation, National Highway Traffic Safety Administration. 1998. Traffic Safety Facts 1997: A Compilation of Motor Vehicle Crash Data from the Fatality Analysis Reporting System and the General Estimates System. Washington, DC: National Center for Statistics and Analysis.
National Highway Traffic Safety Administration. 1999. Traffic Safety Facts 1998. Washington, DC: U.S. Department of Transportation.
National Highway Traffic Safety Administration. 1999 (May). Transportation Secretary Slater Hails Increased Seat Belt Use. NHTSA 21-99.
U.S. Public Health Service. 1989. Caring for our Future: The Content of Prenatal Care. Washington, DC: U.S. Department of Health and Human Services.
The Urban Institute. New Data on Sexual Behaviors of Teenage Males. Fact Sheet, May 1, 1997. Washington, DC: The Urban Institute.
Vargas, C.M., Crall, J.J., and Schneider, D.A. 1998. Sociodemographic Distribution of Pediatric Dental Caries: NHANES III, 1988-1994. Journal of the American Dental Association, 129, 1229-1238.
Ventura, S.J., 1983. Births of Hispanic Parentage, 1980. Monthly Vital Statistics Report, 32(6, Supp.). Hyattsville, MD: National Center for Health Statistics.
Ventura, S.J. Births of Hispanic Parentage, 1985. Monthly Vital Statistics Report, 36(11, Supp.). Hyattsville, MD.
Ventura, S.J. 1995. Births to Unmarried Mothers: United States, 1980-1992. Vital and Health Statistics, 21(53).
Ventura, S.J., Anderson, R.N., Martin, J.A., and Smith, B.L. 1998. Births and Deaths: Preliminary Data for 1997. National Vital Statistics Report, 47 (4). Hyattsville, MD: National Center for Health Statistics.
Ventura, S.J., and Curtin, S.C. 1999. Recent Trends in Teen Births in the United States. Statistical Bulletin, 80(1). Hyattsville, MD: National Center for Health Statistics.
Ventura, S.J. Martin, J.A., Curtin, S.C., and Mathews, T.J. 1997. Report of Final Natality Statistics, 1996. Monthly Vital Statistics Report, 46(11, Supp.). Hyattsville, MD.
1997. Report of Final Natality Statistics. 1995. Monthly Vital Statistics Report, 45(11, Supp.2); Hyattsville, MD: National Center for Health Statistics.
1998. Report of Final Natality Statistics, 1996. Monthly Vital Statistics Report, 46(11, Supp.). Hyattsville, MD: National Center for Health Statistics.
1999. Births: Final Data for 1997. National Vital Statistics Reports, 47(18.) Hyattsville, MD: National Center for Health Statistics.
Ventura, S.J., Martin, J.A., Mathews, T.J., and Clarke, S.C. 1996. Advanced Report of Final Natality Statistics, 1994. Monthly Vital Statistics Report, 44(11, Supp.). Hyattsville, MD: National Center for Health Statistics.
Ventura S.J., Martin, J.A., Curtin, S.C., Mathews T.J., and Park, M.M. 2000. Births: Final data for 1998. National Vital Statistics Reports, 48(3) Hyattsville, MD:
Ventura, S.J., Mathews, T.J., and Clarke, S.C. 1998. Declines in Teenage Birth Rates., 1991-1997: National and State Patterns. National Vital Statistics Reports, 47(12). Hyattsville, MD.
Ventura, S.J., Mosher, W.D., Curtin, S.C., Abma, J.C., and Henshaw, S. 1999. Highlights of Trends in Pregnancies and Pregnancy Rates by Outcome. Estimates for the United States, 1976-1996. National Vital Statistics Reports, 47(29). Hyattsville, MD: National Center for Health Statistics.
2000. Trends in Pregnancies and Pregnancy Rates by Outcome: Estimates for the United States 1976-1996. Vital and Health Statistics, 21(56). Hyattsville, MD: National Center for Health Statistics.
2000. Report of Final Natality Statistics, 1998. National Vital Statistics Reports. Hyattsville, MD: National Center for Health Statistics.
Whitebook, M., Phillips, D., and Howes, C. 1989. National Child Care Staffing Study. Oakland, Calif.: Child Care Employees Project. World Health Organization: World Health Statistics Annuals Vols. 1990-1996. Geneva.
Zill, N., and Nord, C.W. 1994. Running in Place: How American Families Are Faring in a Changing Economy and Individualistic Society. Washington, DC: Child Trends.