
Publication Date
Office of the Assistant Secretary for Planning and Evaluation
Office of Health Policy
Department of Health and Human Services
By Gene Moyer 703-941-3578
Introduction
- The March 1998 Current Population Survey is one of our major sources of data on persons without Health Insurance in 1997
- One Caveat is in order. The survey does not ask persons if they were without health insurance. Rather an "uninsured" person is one who did not say that he had one of the five forms of health insurance: Employer-Sponsored insurance; Medicare; Medicaid; VA, Champus or other military medicine; or other private coverage.
- This means that if someone fails to indicate that he has one of the five coverage types when he does, he will erroneously be counted as uninsured as well as not counted as insured.
Charts on the Uninsured by Characteristics of Persons
- In the bar charts, the height of the bar represents the probability that someone with the characteristic was uninsured in 1997.
- In the pie charts, the distribution of uninsured persons by a particular population characteristic is shown. In all cases, the percentages sum to 100% except for rounding error.
Summary
- The uninsured represent on average 16% of the population of the United States.
- In the following charts, one theme is dominant. Those persons who are otherwise in need tend also to be without health insurance.
- About a third of Hispanics were without health insurance in 1997.
- 44% of non-Citizens were uninsured.
- Almost a third of persons in poverty and a quarter of persons near poverty were uninsured.
- 44% of adults aged 18-64 who had completed less than the ninth grade, a third of those who had completed grades nine to 11, and a fifth of those with only a high school diploma were uninsured.
- Living in a nuclear family seems to be associated with being uninsured. Widowed, divorced, separated, and never married adults aged 18-64 had relatively high probabilities of being uninsured.
- Persons living in the South and West have somewhat higher probabilities of being uninsured than those in the rest of the Nation.
- Even those clearly not in need, however, included uninsured persons.
- 7% of Persons with family incomes of five times poverty or higher were uninsured.
- 10% of college graduates and 7% of persons with graduate training were uninsured. These percentages are for persons 18-64 only.
- Similarly, some 9% of the uninsured were college graduates or have some graduate training.
- 7% of the uninsured in 1997 had incomes of five times poverty or higher.
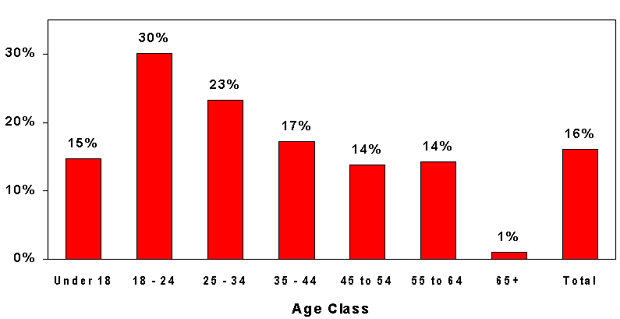
Age
- Young adults between 18 and 24 years old were most likely to be without health insurance in 1997.
- Slightly older persons aged 25 to 34 were next most likely to be without health insurance.
- The consequences of being uninsured are somewhat less serious for young adults, since they tend to be healthier than persons in other age groups.
- Almost all aged persons are covered by Medicare. About 1% did not get the Medicare automatically and did not purchase the coverage.
Percent Uninsured in 1997 by Age Class
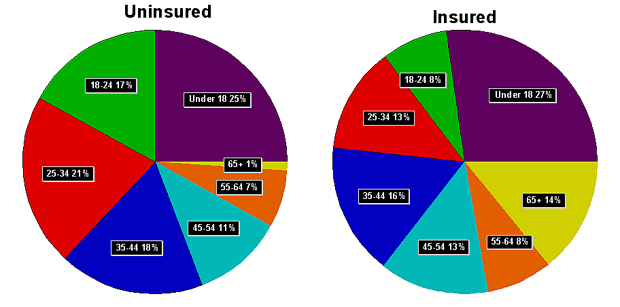
The Distribution of the Uninsured and the Insured by Age Class
- Overall, nearly 2/3 of the uninsured were 34 years old or younger.
The Uninsured and the Insured by Age Class
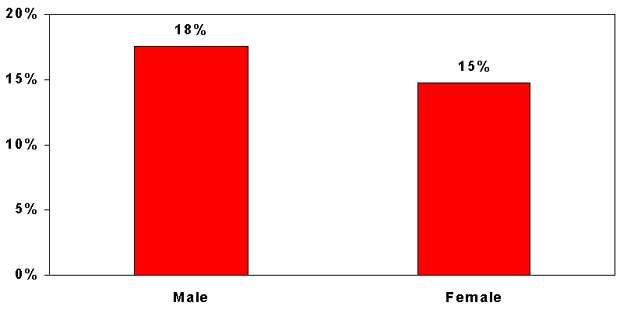
Gender
- Men were somewhat less likely to be insured than women in 1997.
- The availability of Medicaid for mothers of young children probably accounts for much of the higher insurance rate for women.
Percent Uninsured in 1997 by Gender
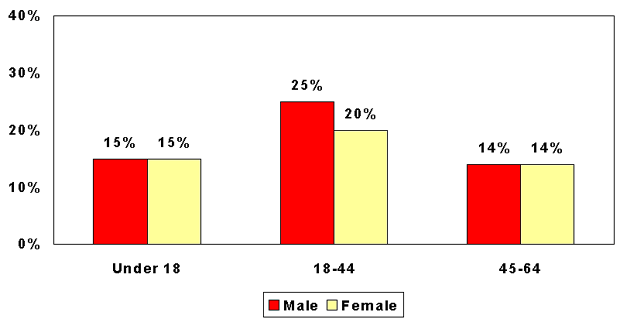
Gender and Age
- As the second chart shows, females in the prime reproductive ages (18-44) are less likely to be uninsured than males in the same age group.
- In the other age groups, females are about as likely to be uninsured as males.
The Probability of Being Uninsured by Gender and Age
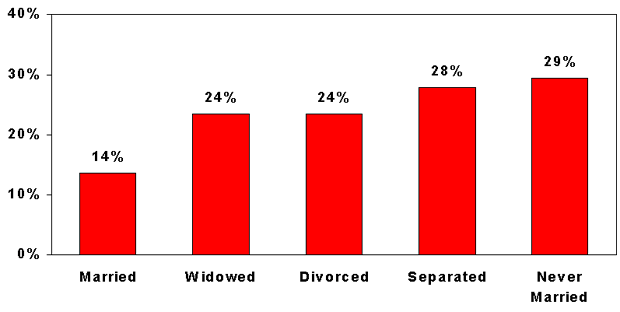
Marital Status
(Persons Aged 18 - 64)
- In 1997, unmarried non-aged adults had the highest probability of being uninsured.
- Separated and never married persons had approximately equally high probabilities of being uninsured. Divorced and widowed persons were also more likely to be uninsured than married persons.
Percent Uninsured in 1997 by Marital Status
Persons aged 18-64
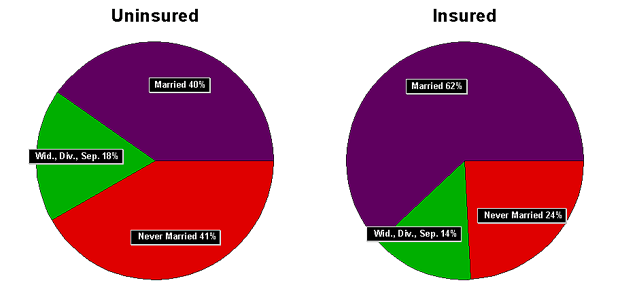
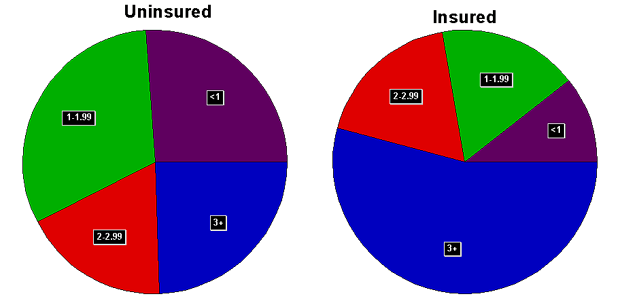
The Distribution of the Uninsured and the Insured by Marital Status
- About 60% of the uninsured are unmarried.
- Only 40% of the insured are unmarried.
The Uninsured and Insured by Marital Status
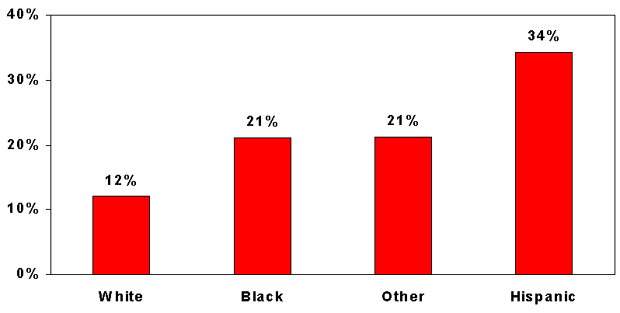
Race/Ethnicity
- Non-Hispanic white persons had the lowest probability of being uninsured in 1997 (12%).
- Most other groups had a probability of being uninsured somewhat above the average.
- Hispanics were especially likely to be uninsured. Many of them are not citizens and are in poverty as well
Percent Uninsured in 1997 by Race/Ethnicity
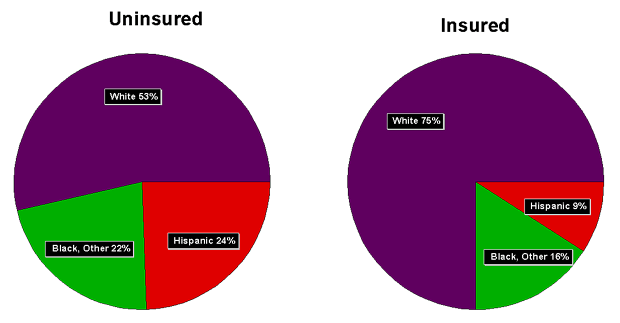
Hispanics of any race are counted as Hispanic.
The Distribution of the Uninsured and Insured by Race/Ethnicity
- Hispanics of any Race are counted as Hispanic
- Although Whites were least likely to be uninsured, a majority of the uninsured were White non-Hispanics in 1997.
The Uninsured and Insured by Race/Ethnicity
Hispanics of any race are counted as Hispanic.
Citizenship
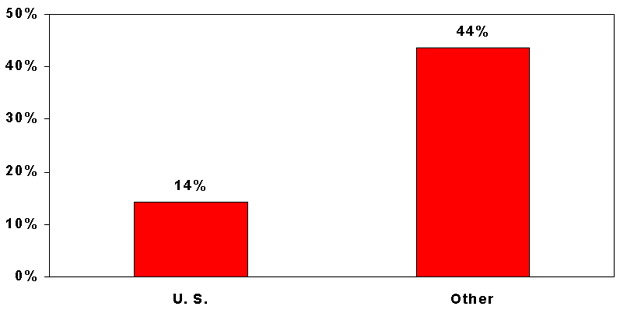
- Citizens, about 96% of the population, were about as likely to be uninsured in 1997 as the entire population.
- Clearly, citizenship is important in helping persons get jobs which include health insurance as part of the wage and in causing people to be eligible for public health insurance programs as well.
- Still, 14% of citizens as well as 44% of non-citizens did not have health insurance in 1997.
Percent Uninsured in 1997 by Citizenship
Relationship to Family Head
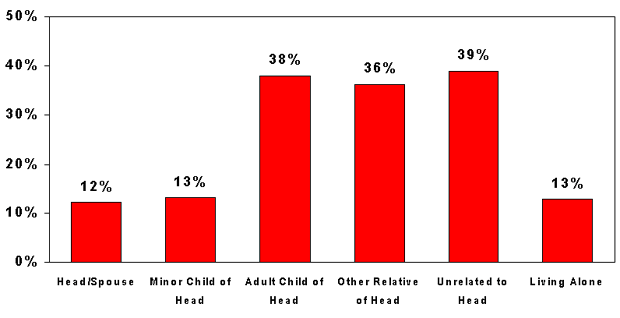
- Persons who either live alone or are part of a traditional family--a married couple or a single person with children--were relatively likely to have health insurance in 1997. Only 12-13% of them were uninsured.
- Children too old to be insured as a dependent; persons related to, but not the child of the head; and persons not related to anyone else in the household were more likely than average to have been uninsured in 1997.
Percent Uninsured in 1997 by Relationship to Family Head
Income and Poverty
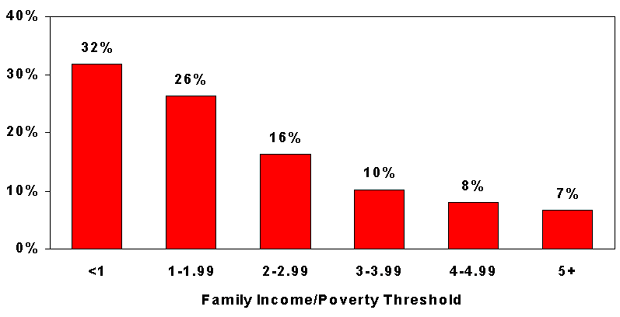
- Persons with low family incomes were also likely to lack health insurance in 1997. The probability of being uninsured fell as income rose. Still, 68% of persons in poverty had some insurance.
- Seven percent of persons with incomes over five times the poverty line were uninsured.
Percent Uninsured in 1997 by Income Class
The Distribution of the Uninsured and Insured by Family Income Class
- Over half of all uninsured persons in 1997 had family income below twice the poverty line.
- Under 30% of insured persons had income this low.
The Uninsured and the Insured by Family Income Class
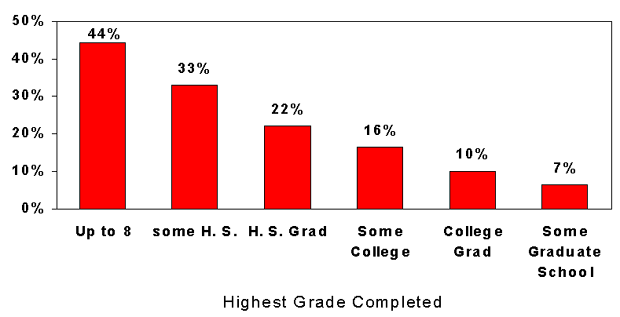
Education
(Persons 18-64 Years Old)
- Non-aged adults with the highest probabilities of being uninsured in 1997 were those who stopped school at or before eighth grade.
- College graduates were unlikely to be uninsured because they are more likely to have jobs in which health insurance premiums are part of the wage.
- Still, even among those with a degree or with graduate training, 7%-10% were uninsured in 1997.
Percent Uninsured in 1997 by Education
Persons Aged 18-64
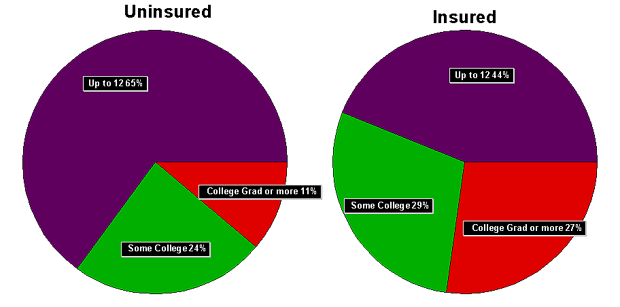
The Distribution of the Uninsured and Insured by Education Level
- In 1997, almost 2/3 of the uninsured aged 19-64 had no education beyond high school.
- Less than half of the insured had this little education.
The Uninsured and Insured by Education Level
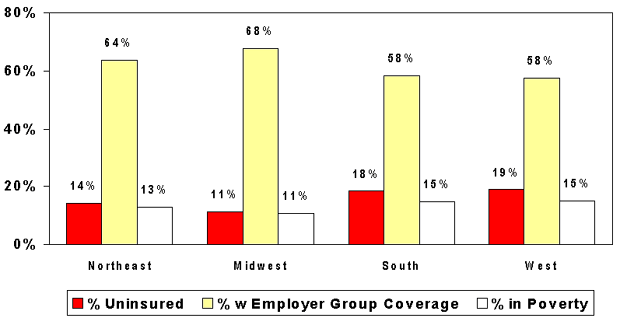
Geographic Region
- The percent uninsured in 1997 was low in the Midwest region, somewhat higher in the Northeast, and even higher the South and the West.
- Persons residing in the South and West Regions were more likely to be uninsured than persons in the other two regions. The race-ethnicity results, the higher incidence of poverty, and the lower incidence of employer-sponsored insurance probably explain most of these geographic results.
Percent Uninsured, with Employer Group Coverage, and in Poverty in 1997 by Geographic Region
Populations
Uninsured & Underinsured